the Creative Commons Attribution 4.0 License.
the Creative Commons Attribution 4.0 License.
 | 12 Sep 2022
Contrasting drought legacy effects on gross primary productivity in a mixed versus pure beech forest
René Orth
Markus Reichstein
Michael Bahn
Anne Klosterhalfen
Alexander Knohl
Franziska Koebsch
Mirco Migliavacca
Martina Mund
Jacob A. Nelson
Benjamin D. Stocker
Sophia Walther
Ana Bastos
Droughts affect terrestrial ecosystems directly and concurrently and can additionally induce lagged effects in subsequent seasons and years. Such legacy effects of drought on vegetation growth and state have been widely studied in tree ring records and satellite-based vegetation greenness, while legacies on ecosystem carbon fluxes are still poorly quantified and understood. Here, we focus on two ecosystem monitoring sites in central Germany with a similar climate but characterised by different species and age structures. Using eddy covariance measurements, we detect legacies on gross primary productivity (GPP) by calculating the difference between random forest model estimates of potential GPP and observed GPP. Our results showed that, at both sites, droughts caused significant legacy effects on GPP at seasonal and annual timescales, which were partly explained by reduced leaf development. The GPP reduction due to drought legacy effects is of comparable magnitude to the concurrent drought effects but differed between two neighbouring forests with divergent species and age structures. The methodology proposed here allows the quantification of the temporal dynamics of legacy effects at the sub-seasonal scale and the separation of legacy effects from model uncertainties. The application of the methodology at a larger range of sites will help us to quantify whether the identified lag effects are general and on which factors they may depend.
- Article
(1146 KB) - Full-text XML
-
Supplement
(1646 KB) - BibTeX
- EndNote


The frequency, intensity, duration, and spatial extent of drought are expected to increase in the next few decades due to anthropogenic global warming in many regions (IPCC, 2022). A great number of studies, considering both long-term observations (Schwalm et al., 2010; Zscheischler et al., 2014) and model simulations (Reichstein et al., 2007; Sun et al., 2015) across various spatial scales, have shown that droughts concurrently impact the structure and function of terrestrial ecosystems (Assal et al., 2016; Frank et al., 2015; Lewis et al., 2011; Ma et al., 2015; Orth et al., 2020), potentially turning ecosystems from sinks to temporary sources of carbon (Ciais et al., 2005; Reichstein et al., 2013). Therefore, understanding the impact of droughts on terrestrial ecosystems is a key research question in Earth sciences (Piao et al., 2019).
Drought impacts on terrestrial ecosystems are not limited to concurrent effects but also include legacy effects during the following seasons and years (Anderegg et al., 2015; Frank et al., 2015; Kannenberg et al., 2020; Müller and Bahn, 2022). Legacy effects at tree and/or stand scale can be caused by the higher vulnerability to drought due to previous water depletion of the soil (Krishnan et al., 2006, Galvagno et al., 2013), reduced or delayed leaf development (Migliavacca et al., 2009; Rocha and Goulden, 2010; Kannenberg et al., 2019), drought-induced hydraulic damage of the xylem (Anderegg et al., 2013), adjustments in carbon allocation within the trees (Huang et al., 2021), depletion of non-structural carbohydrates (Peltier et al., 2022) due to reduced carbon availability and adjustments in carbon allocation (Hartman and Trumbore, 2016), and tree mortality (Allen et al., 2015), as well as reduced resistance to disturbances (e.g. insect outbreaks) due to depleted non-structural carbohydrates (Erbilgin et al., 2021). However, at the ecosystem level, the impact of species and age structures on legacy effects are still poorly understood (Haberstroh and Werner, 2022; Wang et al., 2022).
Tree ring records cover periods from decades to centuries and can cover multiple drought events and are therefore widely used to analyse the interannual legacy effects of drought on tree growth (Anderegg et al., 2015; Huang et al., 2018; Kannenberg et al., 2019). Beyond the level of individual trees, satellite-based observations and model outputs, as expressed through vegetation greenness (Wolf et al., 2016; Wu et al., 2018), canopy backscatter (Saatchi et al., 2013), aboveground carbon stocks (Wigneron et al., 2020), and gross primary productivity (Schwalm et al., 2017; Bastos et al., 2020), have also been used to study the seasonal and interannual legacy effects of drought. However, studies focusing on carbon fluxes, especially based on eddy covariance measurements, are still rare (Kannenberg et al., 2020). Eddy covariance data with hydrometeorological variables measured in parallel have the potential to quantify the timing and magnitude of legacy effects at the sub-seasonal and annual scales and might provide insights into the mechanisms of legacy effects that might not be fully reflected in vegetation indices and tree rings.
Assessments of drought impacts on the ecosystem carbon fluxes usually focus on direct and concurrent effects (Ciais et al., 2005; Reichstein et al., 2007) without considering legacy effects. This is probably due to the challenge to attribute signals in the observations to a previous drought and hence identify them as legacy effects on ecosystem carbon fluxes (Kannenberg et al., 2020) and the inability of models to reproduce these legacy effects (Bastos et al., 2021). A number of studies consider ecosystems to have “recovered” when the target variable such as gross primary productivity (GPP) and tree ring width returns to the baseline, which is usually based on pre-drought values of the target variable (Bose et al., 2020; González de Andrés et al., 2021; Zhang et al., 2021). However, this might complicate the detection of legacies, since GPP recovery dynamics are affected by hydrometeorological conditions in legacy years, which can either stimulate or slow down recovery. Here, by estimating potential GPP, given hydrometeorological conditions in legacy years, we consider that “recovery” happens when the actual GPP reaches the potential GPP under the given hydrometeorological conditions rather than the absolute flux.
Therefore, we aimed to develop a novel approach to quantify drought legacy effects on GPP at sub-seasonal and annual scales. To do this, we followed a residual approach (Beringer et al., 2007) to identify legacy effects as the residuals between actual and potential GPP, which is estimated by a machine learning algorithm (specifically, random forest regression). Furthermore, it is crucial to understand if the residuals are caused by model uncertainties or can be interpreted as legacy effects. By overlooking model uncertainties, one could misinterpret small residuals as legacy effects. Here we quantified model uncertainties to provide more robust estimates of drought legacies and avoid misinterpretation of results. To test our approach, we used eddy covariance measurements at two neighbouring sites that experienced similar climate but are characterised by different species and age structures in central Germany. We asked the following questions: (1) can we detect drought legacy effects on GPP? (2) Is the GPP reduction due to drought legacy effects significant compared to the magnitude of drought concurrent effects? (3) How do drought legacy effects on GPP differ at two neighbouring forests with different species and age structures?
2.1 Study sites
The two neighbouring temperate forest sites studied here, Hainich (DE-Hai; 51∘04′46′′ N, 10∘27′07′′ E) and Leinefelde (DE-Lnf; 51∘19′42′′ N, 10∘22′04′′ E), are located in central Germany, approximately 30 km from each other. These two sites share similar climate conditions, with a long-term annual mean of 8 ∘C for 2 m air temperature and 750 mm of total annual precipitation (Tamrakar et al., 2018). Both sites were affected by the two extreme central European droughts in 2003 and 2018, which reduced gross primary productivity (Fu et al., 2020; Herbst et al., 2015).
The forest at Hainich is an old-growth, unevenly aged (1–250 years), mixed forest dominated by beech (Fagus sylvatica, representing approximately 64 % of the tree carbon stocks). Ash (Fraxinus excelsior, 28 %) and sycamore (Acer pseudoplatanus, 7 %) are co-dominant tree species, and additionally, there are few trees of European hornbeam (Carpinus betulus), Norway maple (Acer platanoides), and other deciduous species (Knohl et al., 2003). The forest at Leinefelde can be characterised as a managed, evenly aged (ca. 130 years), pure beech forest (Anthoni et al., 2004).
2.2 Eddy covariance and meteorological measurements
Identical eddy covariance instrumental set-ups and data acquisition techniques were carried out at the two sites. The methodology of data collection and quality control followed those of Aubinet et al. (2000). The standard processing methods (Pastorello et al., 2020) adopted by the Integrated Carbon Observation System (ICOS) were used to carry out the gap filling and the partitioning (Warm Winter 2020 Team and ICOS Ecosystem Thematic Centre, 2022). The GPP estimated from the nighttime partitioning algorithm (Reichstein et al., 2005) was used for the analysis (GPP_NT_VUT_REF). A detailed description of the meteorological data and instrumentation can be found in previous studies (Anthoni et al., 2004; Knohl et al., 2003). We used daily meteorological data alongside carbon and water fluxes, namely GPP, latent heat flux after the energy balance correction (LE_CORR), which was converted to evapotranspiration (ET) using the heat of vaporisation, incoming shortwave radiation (SW_IN), air temperature (TA), vapour pressure deficit (VPD), soil water content at the first layer (SWC_1, 8 cm), the second layer (SWC_2, 16 cm), the third layer (SWC_3, 32 cm), and potential incoming shortwave radiation (SW_IN_POT) for the years 2000–2020 at DE-Hai and 2002–2012, with a gap during 2007–2009, at DE-Lnf.
Additionally, we used daily enhanced vegetation index (EVI) data from the FluxnetEO v1.0 dataset (Walther et al., 2022) for the same years as the eddy covariance data. EVI was derived from the MCD43A4 product of MODIS, with a 500 m spatial resolution, and we used an average over 2×2 pixels surrounding the tower. We further estimated daily transpiration based on the Transpiration Estimation Algorithm (Nelson et al., 2018).
2.3 Radial increment and net primary productivity of fruits and leaves
The annual radial increment (RI) was calculated from permanent band dendrometers which measure changes in stem girth (or circumference) over bark. The effect, due to the inclusion of the shrinkage and swelling of the bark, is a negligible uncertainty for four reasons: (1) we used only the annual increment, (2) the dominant species is beech, which has only a thin bark, (3) we recorded the final stem diameter of each year in winter when the water status of the xylem and the bark is relatively constant and when the stem wood or the bark are not affected by frost or late/early growth or water uptake, and (4) in this study, we were interested only in the interannual variability in stem growth, which is less affected by shrinkage and swelling at the described temporal scale than absolute growth rates. The dendrometer trees represented the main species and their respective size classes of the main footprint at DE-Hai for the years 2003 to 2020. Because of technical constraints, damages, and a natural dieback of single trees, the number of measurement trees per year varied between 54 and 95. Net primary productivity (NPP) of fruits for the years 2003 to 2020 and NPP of leaves for the years 2003 to 2016 resulted from litter samplings (25–29 traps) within the main footprint area of the flux tower. The high fluctuation of annual fruit NPP is caused by the periodically high fruit production (masting) of beech (Fagus sylvatica). In mast years, the proportion of beech fruits (nuts and shells) amounted to almost 92 % of total fruit mass. At DE-Lnf, these data are not available. A detailed description of the measurement and processing methods can be found in a previous study (Mund et al., 2020).
3.1 Data processing
As the first step, we filtered and processed the eddy covariance and meteorological data in the following way:
-
To ensure reliable data for our analysis, we used gap-filled daily data for days for which more than 70 % of measured and good quality gap-fill data (Reichstein et al., 2005) were available.
-
We only used data during the growing season, which was defined as the period when GPP was greater than 10 % of the maximum of GPP as inferred from a smoothed (centred 7 d moving averages) daily average GPP across all years.
-
We calculated anomalies of all variables by subtracting the mean seasonal cycle and any significant long-term linear trend detected by the Mann–Kendall test (Kendall, 1948), as these can obscure drought-related signals. We took the mean of each day across all considered years and then used centred 7 d moving averages to calculate the mean seasonal cycle.
-
Furthermore, a 7 d moving average smoothing was applied to the anomaly time series to filter out noise at daily timescales. We expect this to increase the accuracy of our model while preserving drought legacy patterns which rather/better emerge at longer timescales.
As for RI data, we removed, for each individual tree, any significant long-term linear trend detected using the Mann–Kendall test (Kendall, 1948).
3.2 Water availability index estimation
Soil moisture at the two study sites was measured only at the upper 30 cm and thus does not account for water availability in deeper layers (see Sect. 5.4). Therefore, we used a bucket model approach, based on observed evapotranspiration and precipitation, to estimate a vegetation water availability index, WAI (Tramontana et al., 2016), calculated as follows:
where WAI0 was the initial value of the water availability index (WAI), and WAIwarm-up was the end value of WAI from the warm-up of the bucket model (Eq. 1). To warm up the bucket model, we ran it five times through the first year before starting the actual computation across all considered years. WAIt−1 (mm) and WAIt (mm) were WAI at time steps t−1 and t, respectively, and Pt (mm) and ETt (mm) were precipitation and evapotranspiration at time step t (Eq. 2). We set the bucket size (i.e. WAImax) as the maximum cumulative water deficit (CWD) at each site. The estimated bucket sizes were 205 and 191 mm at DE-Hai and DE-Lnf, respectively.
Additionally, we calculated the CWD, which was estimated from cumulative differences between observed evapotranspiration and precipitation over periods where cumulative net water loss from the soil (Σ(ET − P)) is positive.
3.3 Drought and legacy years selection
Since legacy effects should result from significant impacts of droughts on ecosystems, we adopted a combined driver and impact-based approach to define droughts. Drought years were defined as those years when both low water availability and a concurrent biospheric response were found and were evaluated as follows:
-
First, we selected the minimum of negative GPP anomalies relative to the mean seasonal cycle during the growing season (minimum GPPanom) as a proxy to reflect the severity of drought impact on GPP in each year.
-
Then, we calculated the mean WAI anomalies relative to the mean seasonal cycle for days when minimum GPPanom occurred and the previous 14 d (mean WAIanom_15) to reflect the water availability during the development of the GPP anomaly. To identify drought-related GPP reductions, we considered only years in which negative GPP anomalies were associated with dry conditions.
-
Finally, we selected the years with both the lowest minimum GPPanom and mean WAIanom_15 (Fig. S1 in the Supplement). These were 2003 and 2018 at DE-Hai and 2003 at DE-Lnf (2018 data are not available here).
In our data, we define non-legacy years as normal and drought years, while legacy years correspond to the 2 calendar years following a drought year. Including too few legacy years could lead to an underestimation of legacy effects, and too many legacy years would result in the lack of training data (see Sect. 3.4). As a trade-off, we selected a legacy period of 2 years, and this choice was justified by the fact that GPP anomalies residuals returned to the range of model uncertainties (i.e. 25th–75th percentiles of model residuals), which is considered as the point when GPP recovers. This happened in 2005 (see Sect. 4.3), following the 2003 drought at both sites. For the 2018 drought at DE-Hai, data were only available up to 2020.
3.4 Quantification of legacy effects on GPP and transpiration
Here, we followed a residual approach (Beringer et al., 2007) to detect drought legacy effects on GPP. To do this, we fitted a random forest regression model (RF; Breiman 2001) for daily GPP anomalies using the anomalies of hydrometeorological variables in non-legacy years as predictors. We chose RF because it has the ability to effectively learn (1) the relationship between independent and dependent variables regardless of linear or non-linear relationships and (2) the interactions between independent variables (Ryo and Rillig, 2017). The model was then used to predict GPP anomalies in the legacy years, thereby reflecting the potential GPP anomalies given the climate conditions in that year. Specifically, the approach included the following steps (Fig. 1).
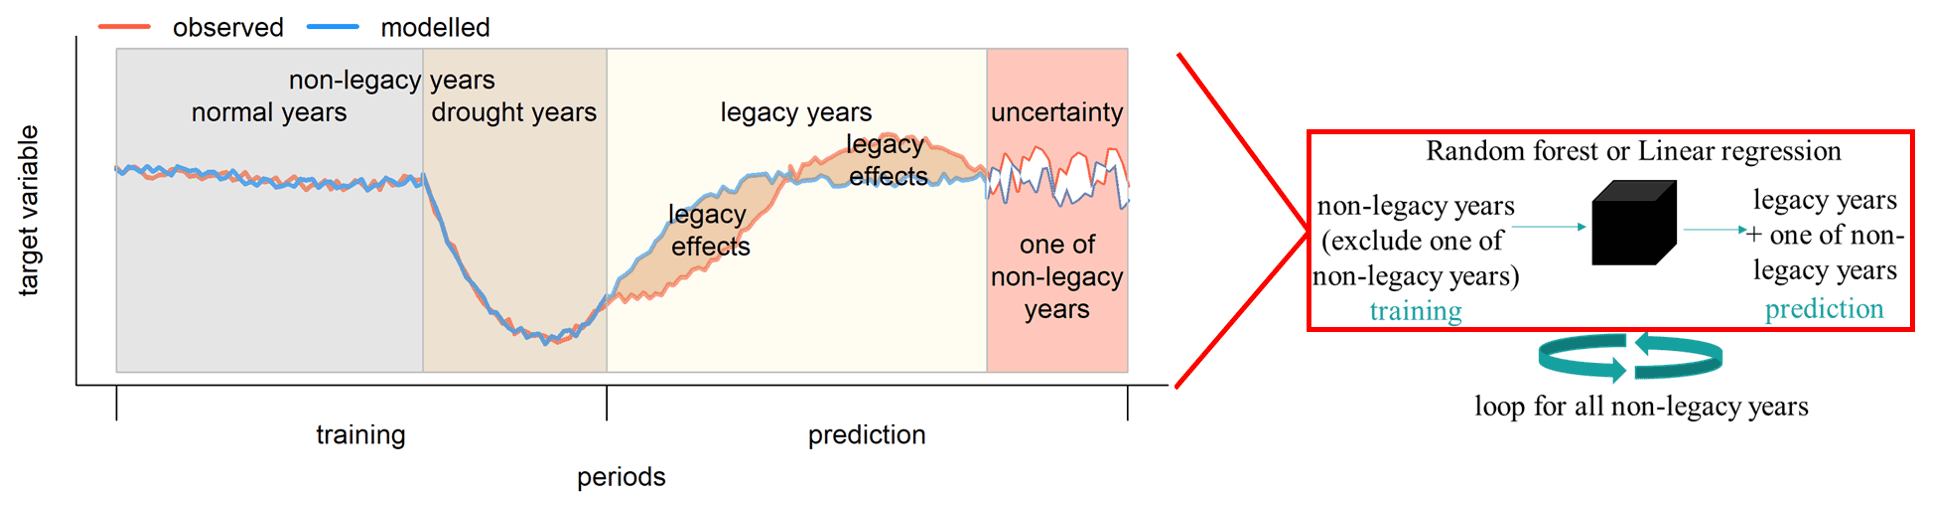
Figure 1Conceptual diagram of quantification of legacy effects. A random forest (RF) model (or linear regression, represented by the black cube on the right) was used to determine the relationship between the target variable (GPPanom or RI) and hydrometeorological conditions using a training dataset that excludes data in all legacy years and one of the non-legacy years for each loop. The legacy effects could be quantified as the residuals between observed (red line) and modelled (blue line) target variable (i.e. GPPanom, RI, …) in legacy years. And the residuals between observed and modelled target variable (i.e. GPPanom, RI, …) in all non-legacy years from all loops indicated RF model uncertainties using a leave-one-out approach (see the text).
First, all daily data in non-legacy years were used as input for the RF model to determine the relationships between the anomalies of GPP (GPPanom) and anomalies of hydrometeorological variables (SW_INanom, TAanom, VPDanom, and WAIanom), along with absolute values of SW_IN_POT to capture seasonal variations in the response of ecosystems to hydrometeorological conditions. These relationships represented long-term controls of climate on GPP, including drought events and near-average or wet conditions. The out-of-bag (OOB) scores indicating the prediction ability of RF models were ∼0.7 and ∼0.8 (where 0 indicates no skill and 1 denotes perfect performance) at DE-Hai and DE-Lnf, respectively (Fig. S2). WAIanom is the most important explanatory factor at both sites, followed by SW_INanom at DE-Hai and the phenological stage (given by SW_IN_POT) at DE-Lnf (Fig. S3). The randomForest package in R 4.0.3 was used, and the number of trees, the number of variables randomly sampled as candidates at each split, and the node size of RF were set to 400, 5, and 5, respectively. Tuning those hyperparameters did not significantly change our results.
Based on these relationships and the meteorological anomalies in legacy years, we used the trained RF model to predict the potential GPPanom in the absence of legacy effects and calculated the model's residuals (GPPanom residuals; i.e. observed minus predicted values), which should reflect legacies from the past drought, where negative residuals corresponded to more negative or less positive GPPanom than would be expected given the meteorological conditions in that year, indicating negative legacies of drought, while positive residuals corresponded to less negative or more positive GPPanom, indicating beneficial legacies of drought. In order to reduce the noise at the daily scale, daily results were aggregated to the weekly scale.
To account for model uncertainties and evaluate the significance of legacy effects, we used a leave-one-out approach to quantify model uncertainties. In the training phase, one of the non-legacy years was excluded from the training dataset, and the trained RF model was then used to predict the GPPanom in that year. This was done for all non-legacy years, and the GPPanom residuals in non-legacy years for each leave-one-out iteration were then considered as model uncertainties. In order to reduce the noise at the daily scale, all the daily results were aggregated to the weekly scale.
In order to infer possible legacy effects due to plant hydraulic damage, the same method was used to quantify legacy effects on transpiration (Tr) as estimated by the TEA (Transpiration Estimation Algorithm) approach (Nelson et al., 2018). The TEA approach first isolates the periods when evapotranspiration is most likely dominated by transpiration. Then, a quantile random forest model (Breiman, 2001; Meinshausen and Ridgeway, 2006) is trained during the separated periods, and transpiration can be estimated at every time step. More detail can be found in Nelson et al. (2018). We use Tr, rather than evapotranspiration (ET), because decreases in Tr due to hydraulic damage could be offset by increased soil evaporation, making the aggregated ET signal difficult to interpret.
3.5 Quantification of legacy effects on tree growth
To detect legacy effects on tree growth, we used a multivariate linear regression instead of RF to develop the relationship between tree growth (detrended radial increment – RI) due to the fewer data points available. We used the following explanatory variables: detrended growing season mean WAI, detrended growing season mean VPD, detrended growing season mean SW_IN, and detrended growing season mean TA for each species. We detrended the time series of all variables by removing any significant long-term linear trend detected using the Mann–Kendall test (Kendall, 1948). In particular, the annual net primary productivity of fruits (fruits-NPP) was added as an additional predictor to only the model for beech since the high fluctuation of annual fruit NPP could be caused by the periodically high fruit production (masting) of beech. We considered fruits-NPP as a predictor to account for the trade-off between tree growth and reproduction in mast years, which could also cause the change in tree growth, in addition to legacy effects, from previous droughts (Hacket-Pain et al., 2015).
The strategy to quantify legacy effects and model uncertainties was the same as in the case of GPP. We trained the model in non-legacy years, except for one of them, iteratively and predicted potential RI in legacy years and the year additionally excluded. The residuals between observed and potential RI in non-legacy years and legacy years were then considered as model uncertainties and legacy effects, respectively.
3.6 Separation of legacy effects on GPP due to structural and physiological effects
Drought legacy effects on GPP might result from changes in canopy structure (structural effects) and photosynthesis capacity (physiological effects) (Kannenberg et al., 2019). Combining GPP and satellite-based EVI allows the separation of these structural and physiological effects. To do this separation, we used the following two model settings: (1) RF, which was the original setting described in Sect. 3.4 and included both structural and physiological effects, and (2) RFEVI, which added EVI anomalies as an additional predictor to the original model and only included physiological effects because structural effects were already included in the predictor EVI anomalies, and GPPanom residuals from this model were expected to be caused by physiological effects. Therefore, physiological legacy effects on GPP were quantified as GPPanom residuals from RFEVI, while structural legacies were quantified as the difference between GPPanom residuals from RF and RFEVI (i.e. RF–RFEVI). The same method was used to separate structural and physiological effects of legacy effects on Tr.
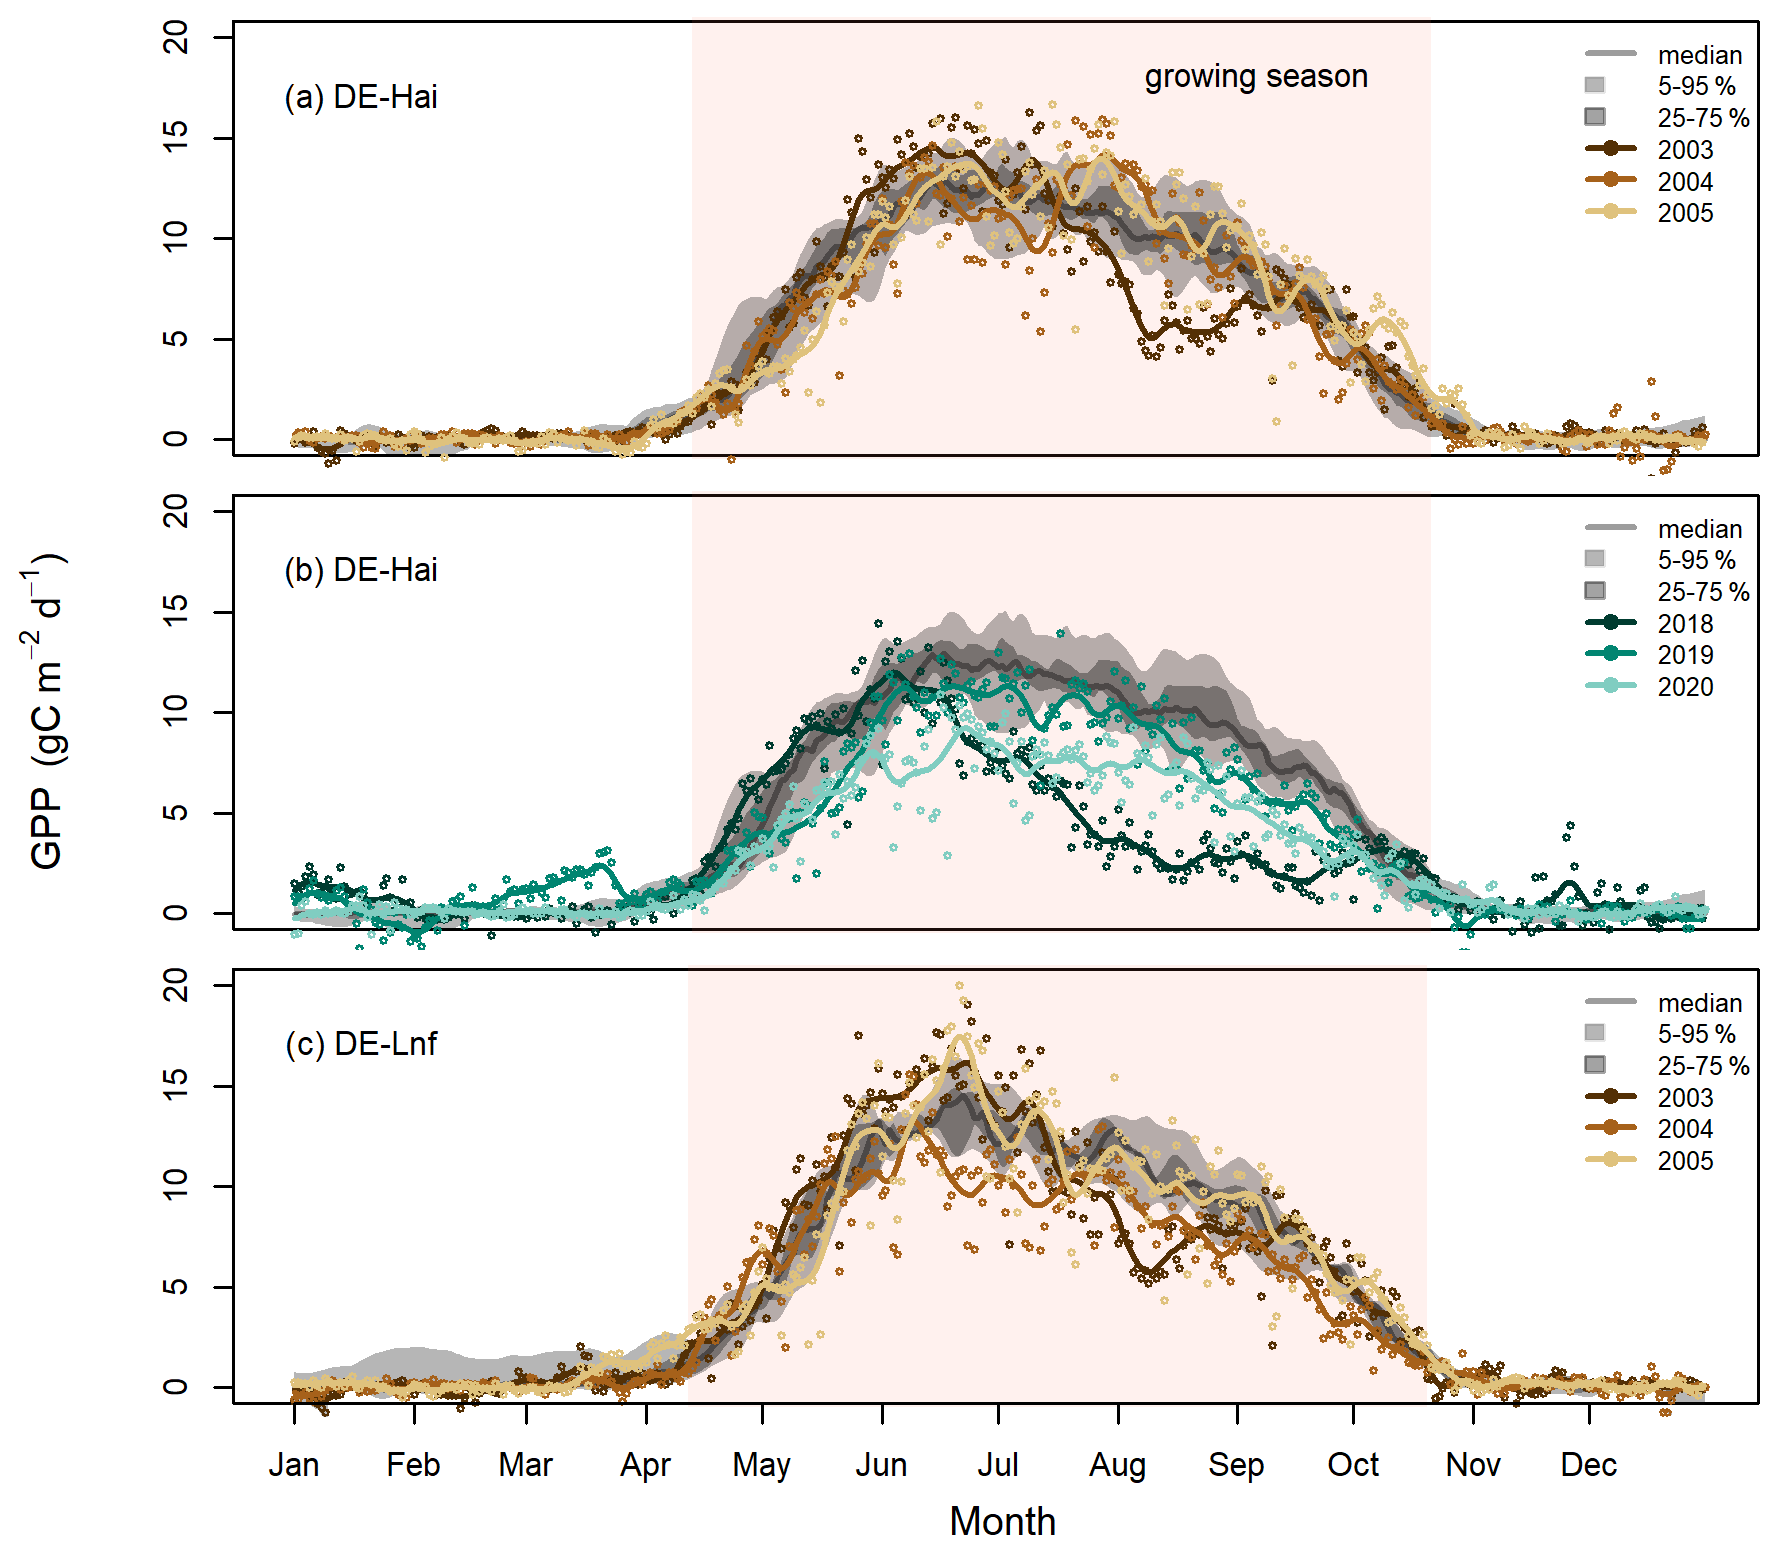
Figure 2Daily GPP in the selected drought and legacy years at (a) DE-Hai 2003, (b) DE-Hai 2018, and (c) DE-Lnf 2003, showing the droughts and following legacy years, respectively. Coloured points and lines show the original and smoothed (7 d average) GPP, respectively, in drought and legacy years. The grey lines and shaded areas show the median, 25th–75th (dark grey), and 5th–95th (light grey) percentiles of GPP, respectively, over non-drought and non-legacy years. The shaded coral areas indicate the average growing seasons of DE-Hai and DE-Lnf.
3.7 Quantifying concurrent and lagged reduction in GPP from drought
Additionally, we compared the estimated legacy effects on GPP to the concurrent drought-induced GPP anomalies. To compute the concurrent reduction in GPP, we summed up all GPP anomalies over each identified drought period. Here, drought periods were defined as the periods in which WAIanom was lower than −1 of the standard deviation (WAISD). WAISD was calculated for each day of the year by using a centred 7 d moving window instead of a single value over the whole time series because WAISD showed a seasonality. This definition only relied on the water availability, without considering biospheric responses, because WAI directly indicated the water supply for vegetation, while GPP could include other factors in addition to drought in short periods. We quantified the lagged reduction in GPP at the annual scale as the difference between GPPanom residuals in legacy years and the median of the model uncertainties. To compare the reduction in GPP across sites, both concurrent and lagged values were normalised relative to the averaged total GPP over the growing season.
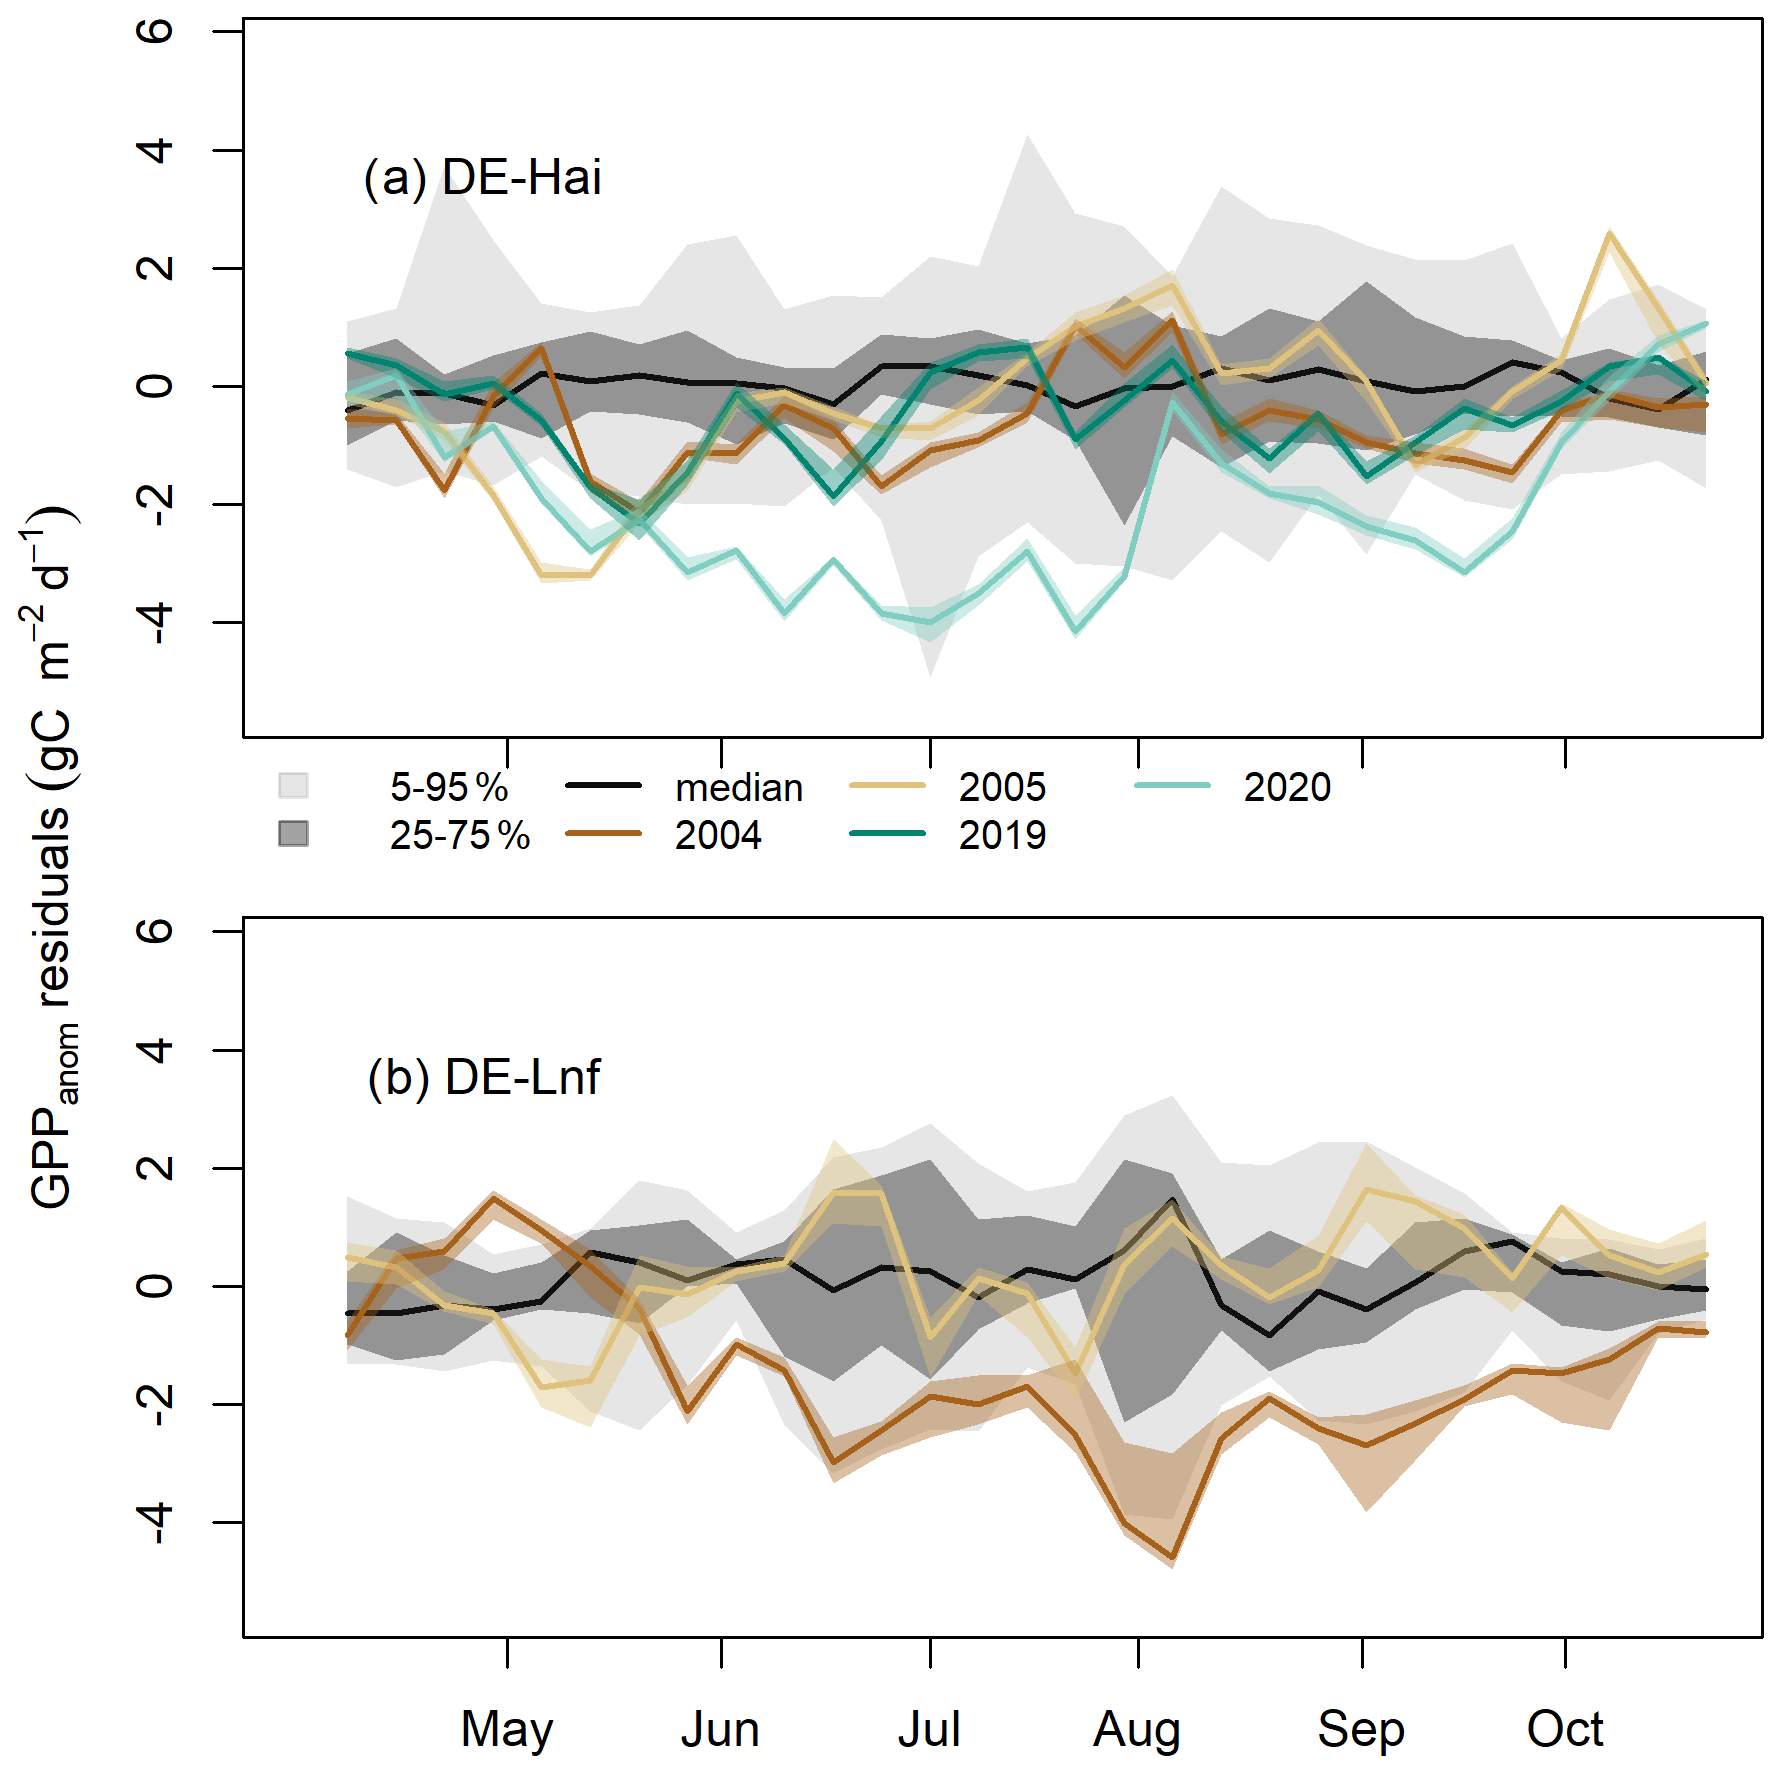
Figure 3Residuals of GPP anomalies at the seasonal scale in legacy years at (a) DE-Hai and (b) DE-Lnf. Residuals of GPP anomalies were characterised by observed minus predicted GPP anomalies (GPPanom residuals). The coloured lines and bands show the median and 5th–95th percentile GPPanom residuals of ensemble model runs (see Sect. 3.4), respectively. Negative residuals corresponded to more negative or less positive GPPanom than would be expected given the climate in that year, indicating negative legacies of drought, while positive residuals corresponded to less negative or more positive GPPanom, indicating beneficial legacies of drought. The model uncertainties (dark and light grey shaded areas, respectively) are characterised by the 25th–75th and 5th–95th quantile ranges of GPPanom residuals in non-legacy years. The black line represents the median of GPPanom residuals in non-legacy years. The ticks denote the start of each month.
4.1 GPP time series in drought and legacy years
In Fig. 2, we show the measured absolute GPP time series in the selected drought (2003 and 2018) and legacy years (2004, 2005, 2019, and 2020), together with the long-term median, 25th–75th, and 5th–95th percentiles GPP at DE-Hai and DE-Lnf. In the drought year 2003, GPP was significantly lower than the baseline, defined as the 25th percentile GPP, during July–September at DE-Hai and July–August at DE-Lnf, respectively. In the post-drought years 2004 and 2005, there was no systematic decrease in GPP at DE-Hai, while GPP at DE-Lnf was slightly lower than the baseline during June–August 2004. During the 2018 drought, GPP significantly differed from the baseline during June–September at DE-Hai. After the 2018 drought, we could not find any systematic decrease in GPP in 2019, while GPP was consistently lower than the baseline from mid-May to September 2020 at DE-Hai.
4.2 Drought legacy effects on GPP: seasonal patterns
At the seasonal scale, residuals of GPP anomalies (GPPanom residuals) showed significant departures from model uncertainties at both sites (Fig. 3). After the 2003 drought at DE-Hai, we found negative residuals below the 25th percentile of model residuals in non-legacy years (model uncertainties) during the early and late growing season of 2004 (April–July and September) and May–June 2005 and below the 5th percentile for short periods in April and May 2004 and May 2005. After June 2005, residuals were mostly within 5 %–95 % of the model residuals. After the 2018 drought at DE-Hai, we found negative residuals (below the 25th percentile of model residuals) during May, June, August, and September 2019. In 2020, residuals showed a persistent decrease from May to July and generally stayed well below the 5th and 25th percentile of model residuals from mid-May until July and September, respectively.
After the 2003 drought at DE-Lnf, we found that persistent negative residuals were below the 25th percentile of model residuals over almost the complete growing season (from May to October) in 2004 and below the 5th percentile of model residuals for periods in June–September. In 2005, residuals remained mostly within 25th–75th percentiles of model residuals.
4.3 Drought legacy effects on GPP: annual patterns
There were systematic departures of integrated residuals of GPP anomalies in legacy years from model uncertainties at the annual scale (Fig. 4), although the seasonal patterns varied (Fig. 3). After the 2003 drought at DE-Hai, integrated residuals in 2004 were significantly below the 25th percentile of model residuals, while integrated residuals were within the 25th–75th percentiles of model residuals in 2005. After the 2018 drought, integrated residuals in 2019 were near the 25th percentiles of model residuals, while in 2020, integrated residuals were far below the 25th percentile of model residuals.
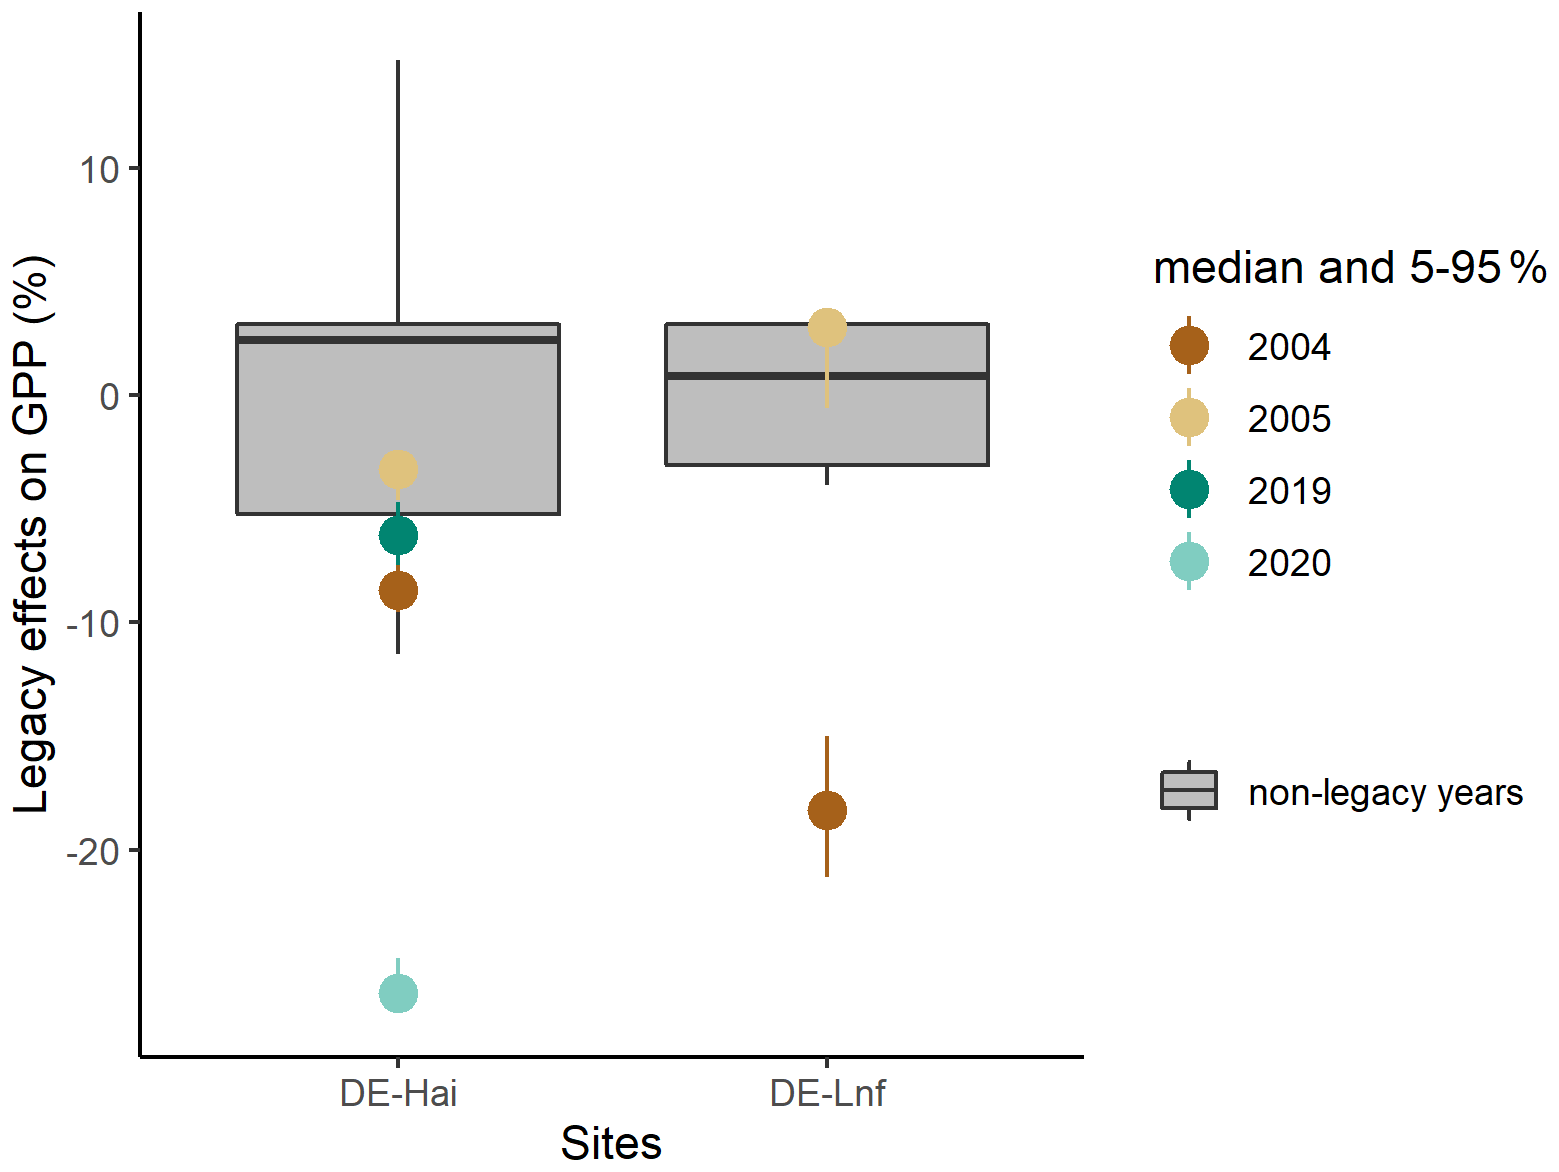
Figure 4Integrated residuals of GPP anomalies at the annual scale in legacy years at DE-Hai and DE-Lnf. The coloured points and line ranges show the median and 5 %–95 % percentile integrated GPPanom residuals of the ensemble model runs (see Sect. 3.4), respectively. The model uncertainties (the box plot) are characterised as the 25th–75th quantile range of integrated GPPanom residuals in non-legacy years.
At DE-Lnf, after the 2003 drought, integrated residuals in 2004 were below the 25th percentile of residuals in non-legacy years, while integrated residuals almost remained within the 25th–75th percentiles of the model residuals in 2005.
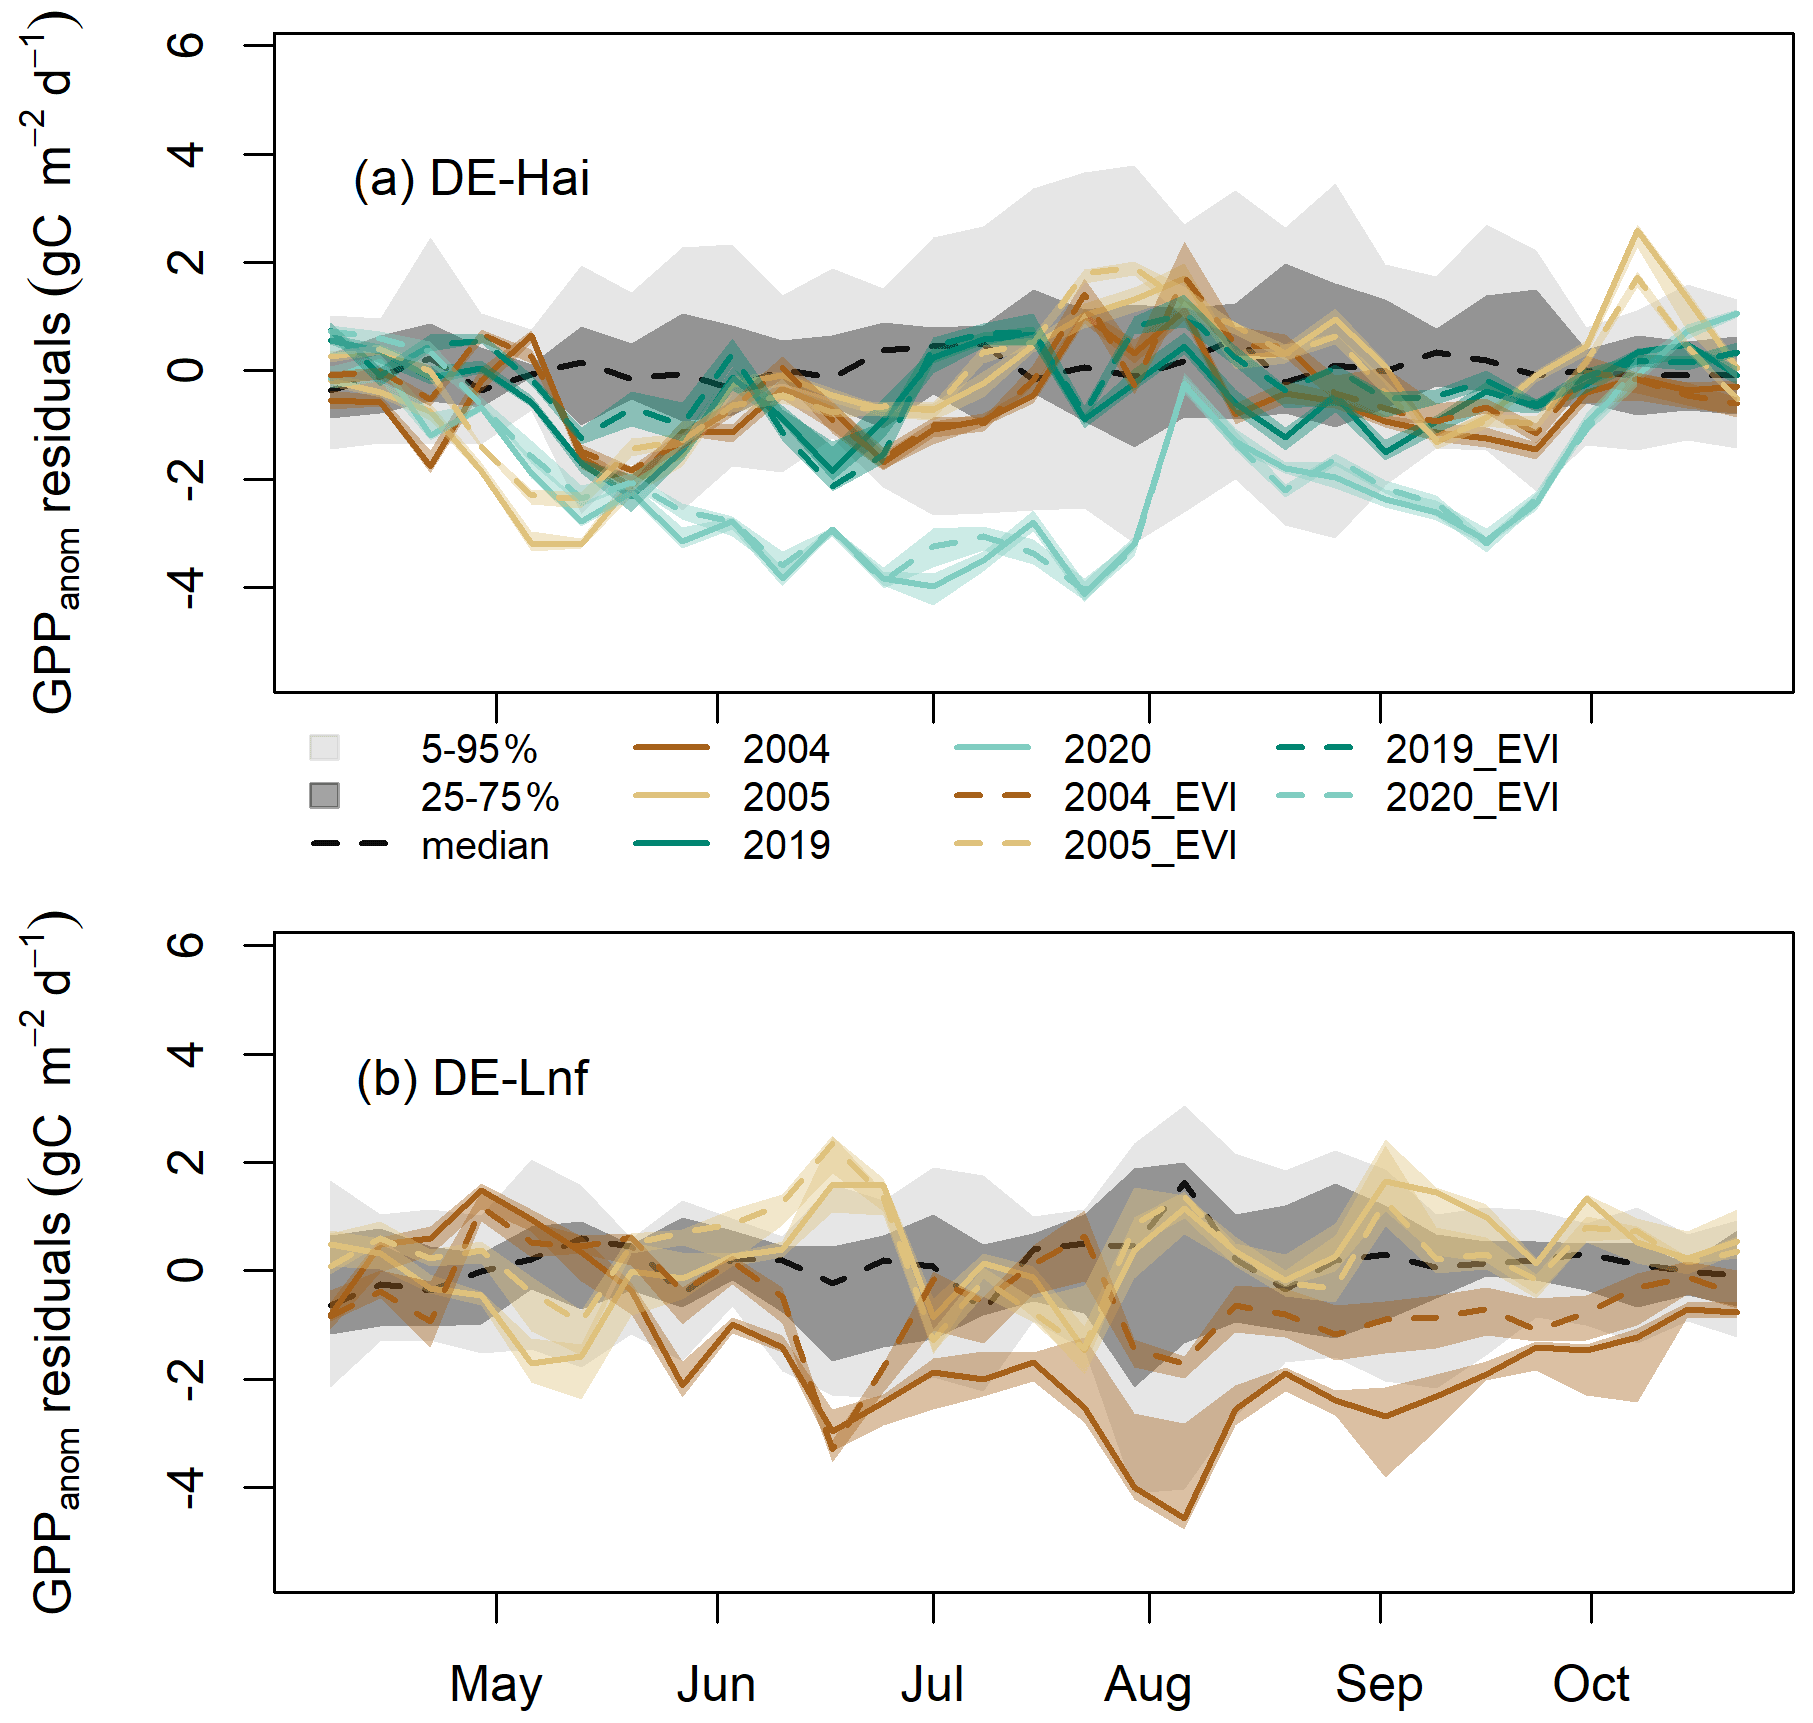
Figure 5Residuals of GPP anomalies from RF and RFEVI (see Sect. 3.6) in legacy years at (a) DE-Hai and (b) DE-Lnf. Residuals of GPP anomalies are characterised by observed minus predicted GPP anomalies (GPPanom residuals). The coloured lines and bands show the median and 5th–95th percentile GPPanom residuals of ensemble model runs (see Sect. 3.4), respectively. The solid and dashed lines show the residuals based on RF and RFEVI, respectively. The model uncertainties from RFEVI (dark and light grey shaded areas, respectively) are characterised by the 25th–75th and 5th–95th quantile ranges of GPPanom residuals in non-legacy years. The black dashed line was the median of GPPanom residuals from RFEVI in non-legacy years. The ticks denote the start of each month. Figure S4 shows the results for April–June and August–October at DE-Hai in more detail.
4.4 Drought legacy effects on GPP due to structural and physiological effects
At the seasonal scale, residuals of GPP anomalies from RFEVI (ResEVI) showed significant departures from GPPanom residuals from RF (Res) over some periods at both sites (Fig. 5). At DE-Hai, we found ResEVI was above Res in the early growing season (April–May) of 2004, 2005, 2019, and 2020 and also in the late growing season of 2004 (August–October) and 2019 (August–September). After the 2003 drought, we found negative ResEVI below the 25th percentile of the model residuals from RFEVI in non-legacy years (model uncertainties) during the early and late growing season of 2004 (May–July and September) and May of 2005 and below the 5th percentile for short periods in May of 2005. After the 2018 drought, we found negative ResEVI (below 25th percentile of model residuals) during June 2019. In 2020, ResEVI showed a persistent decrease from May to July and generally stayed well below the 5th and 25th percentile of model residuals from mid-May until July and September, respectively.
At DE-Lnf, ResEVI was below Res from April to mid-May and significantly above Res almost over the growing season of 2004 (from mid-May to September). We found negative ResEVI below the 25th percentile of model residuals from RFEVI in non-legacy years (model uncertainties) during June, August, and September 2004 and below the 5th percentile for short periods in June and September 2004.
4.5 Drought legacy effects on radial increment
To complement the analysis of the legacy effects on GPP at the seasonal and annual scales, we also evaluated legacy effects on tree growth at the annual scale (Fig. 6). RI of Fagus sylvatica was below the 25th percentile of model residuals in the post-drought year 2004 and returned to the 25th–75th percentiles of model residuals in 2005. For species of Acer pseudoplatanus, Fraxinus excelsior, and others, residuals of RI were almost within 25th–75th percentiles of model residuals in 2004 and 2005. After the 2018 drought, RI of all species for 2019 and 2020 was almost within or close to 25th–75th percentiles of model residuals.
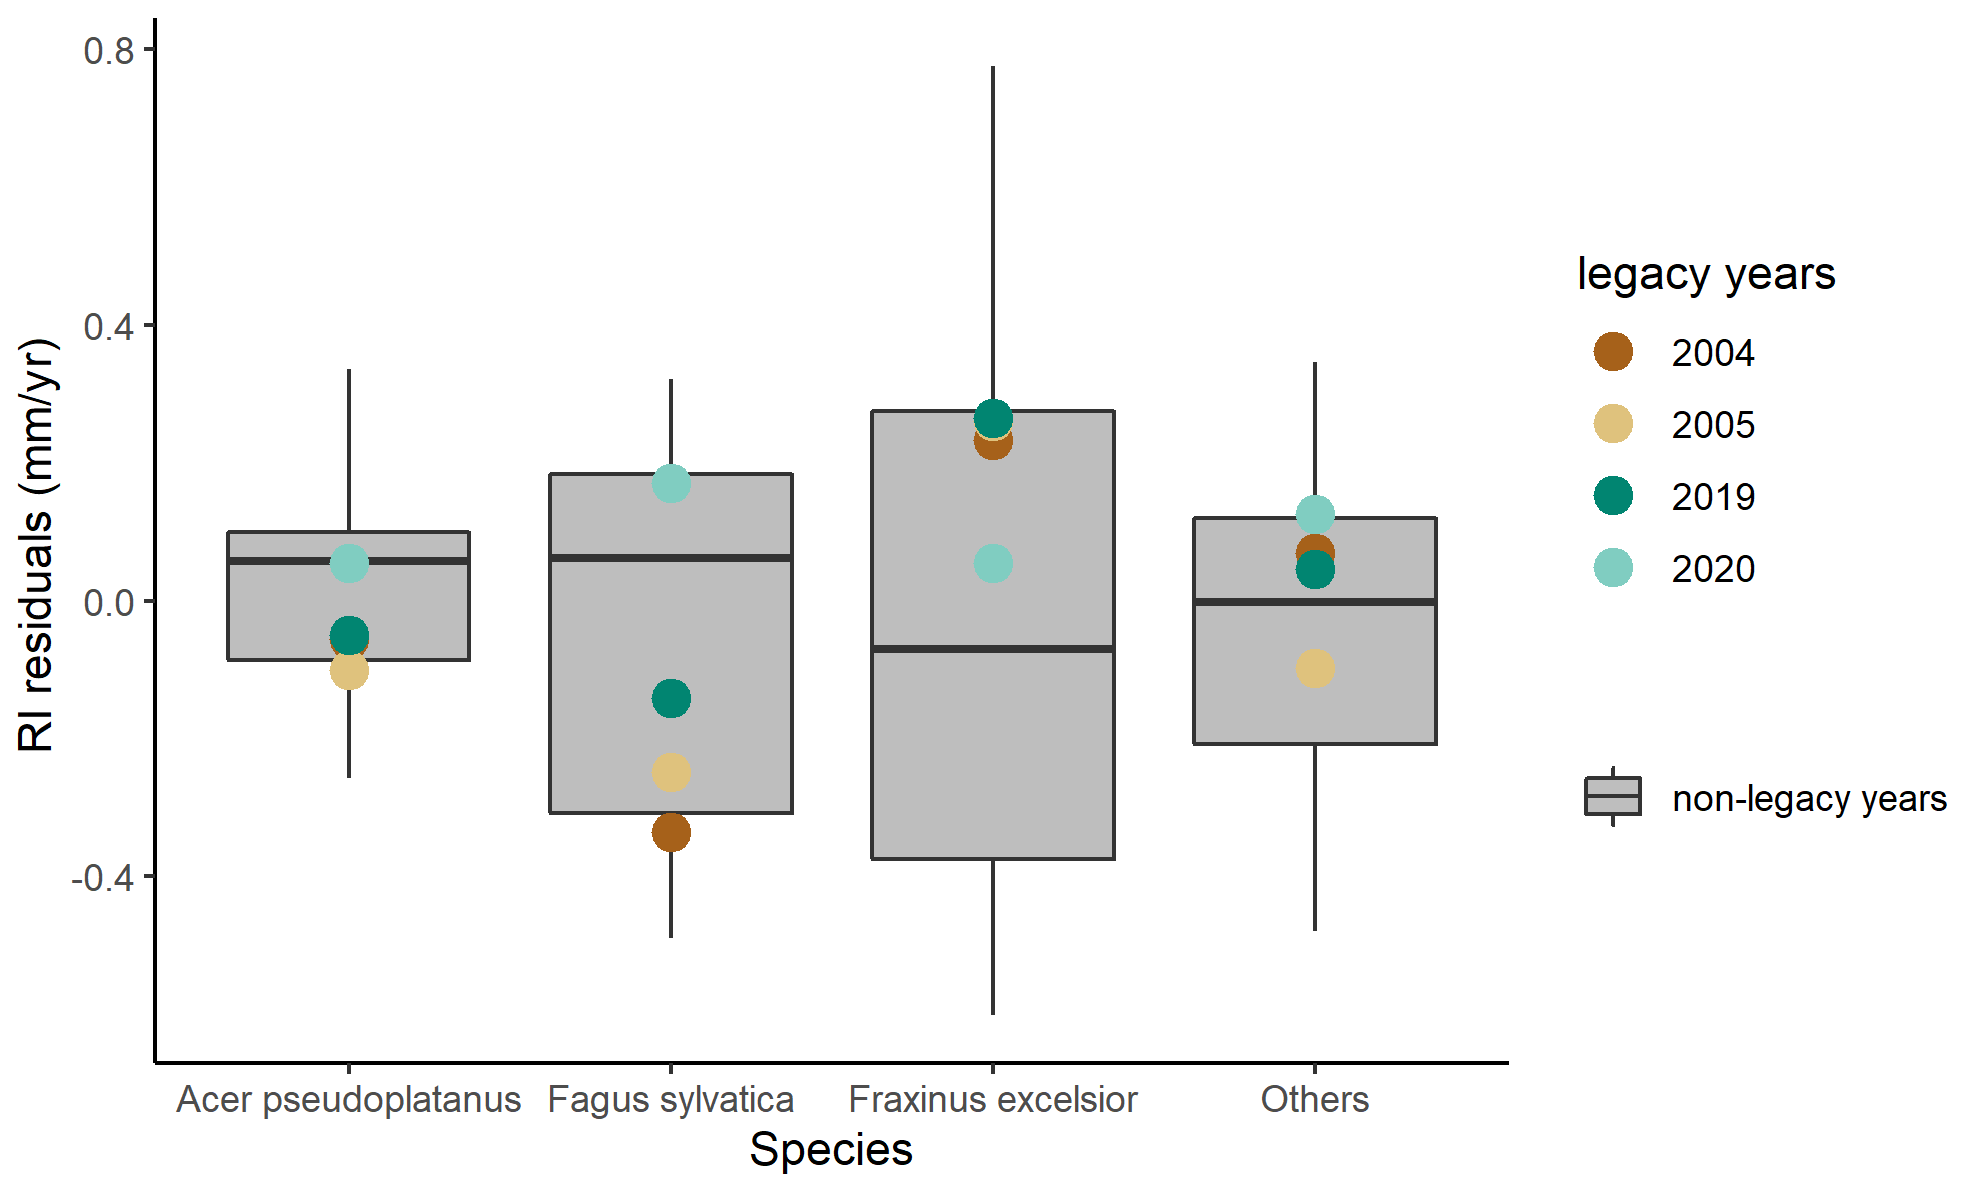
Figure 6Residuals of RI in legacy years at DE-Hai across species. Residuals of RI are characterised as observed minus predicted RI anomalies (RI residuals). The model uncertainties (the grey area) are characterised as the 25th–75th quantile range of RI residuals in non-legacy years.
4.6 Concurrent and lagged reduction in GPP
Finally, we compared the concurrent impacts on GPP with the lagged impacts due to drought (Fig. 7). We found that, at DE-Hai, the concurrent reduction in GPP was 9.4 % relative to averaged total GPP over the growing season (hereinafter) in 2003, while 6.1 %–12.3 % indirectly reduced in 2004. And in 2018, the concurrent reduction in GPP was 21.0 %, while 3.5 %–10.0 % and 23.5 %–29.6 % indirectly reduced in 2019 and 2020, respectively. At DE-Lnf, the concurrent reduction in GPP was negligible in 2003 (2.2 %), while we estimated a 14.4 %–24.8 % GPP reduction in 2004, which was higher than the corresponding values at DE-Hai in the same year.
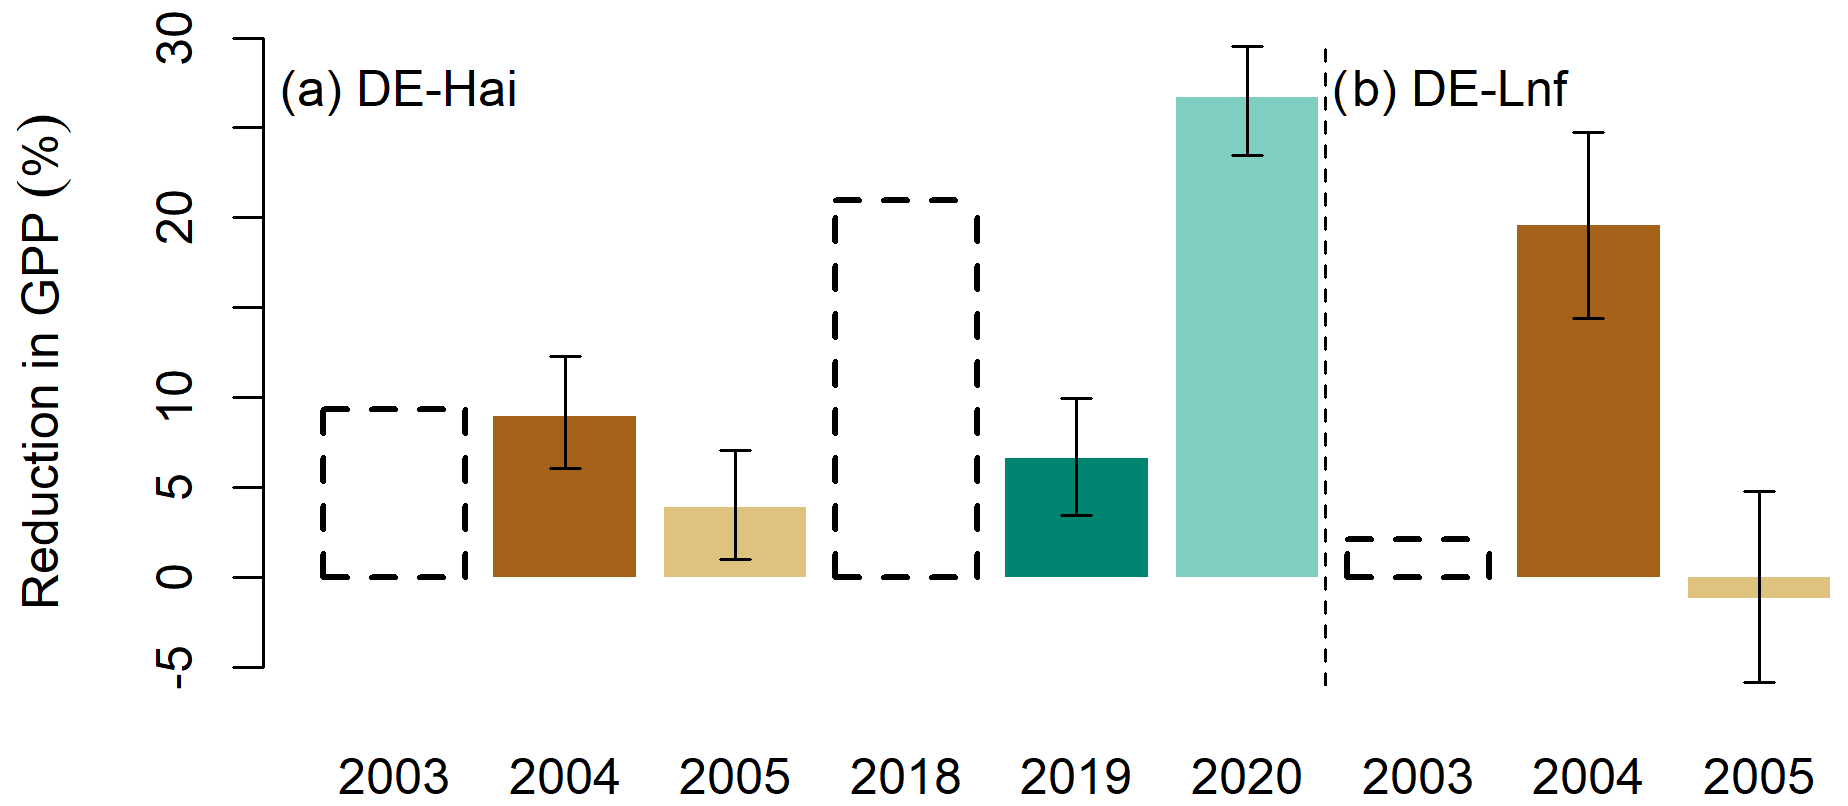
Figure 7Concurrent (dashed black bars) and lagged (coloured bars) reduction in GPP from the 2003 and 2018 droughts at (a) DE-Hai and (b) DE-Lnf. Concurrent impacts in GPP were quantified as the sum of GPP anomalies over drought periods in drought years relative to averaged total GPP over the growing season (see Sect. 3). Lagged impacts in GPP are characterised as the difference between GPPanom residuals in legacy years and median of the model uncertainties relative to averaged total GPP over the growing season. Coloured bars and error bars show the median and 5 %–95 %, respectively, of lagged reduction in GPP from ensemble model runs.
5.1 A novel methodology to detect drought legacy effects on GPP
There is limited research on discovering the legacy effects of drought on the ecosystem carbon cycle using eddy covariance observations (Kannenberg et al., 2019). Here, we propose a residual-based methodology using a random forest regression model to detect legacy effects on GPP and found significant legacy effects on GPP using eddy covariance data at two forests in central Germany with the similar climate but with different age and species composition. There are three advantages to our methodology: (1) capturing the temporal dynamics of legacy effects at the seasonal scales, (2) separating the influence of meteorological conditions during the post-drought period on recovery rates, and (3) estimating model uncertainties to avoid misinterpreting small residuals as “legacy effects”.
First, because we used measurements with a high temporal resolution (daily), legacy effects could be determined across different timescales. Previous studies based on tree ring or satellite greenness data have mainly focused on legacy effects at the annual scale (Anderegg et al., 2015; Wu et al., 2018) or monthly scale (Bastos et al., 2021), but the legacies can be more ephemeral, for example, if they appear only in critical periods of the growing season, as we have found here. Such temporally confined effects may not necessarily manifest themselves at the annual scale. For example, after the 2003 drought, the annual GPP at DE-Hai in 2005 was close to normal, which was the 25th percentile of model residuals here, but we found short legacies at the seasonal scale (Fig. 3).
Second, recovery is usually considered when the target variable (i.e. GPP, tree ring width, etc.) returns to the baseline, which is usually based on pre-drought values of the target variable (Bose et al., 2020; González de Andrés et al., 2021; Zhang et al., 2021). However, meteorological conditions during the recovery period will modulate recovery rates so that recovery can be delayed, for example, if a drought is followed by other unfavourable climatic conditions. Hence, the evaluation of possible legacy effects should be based on the functional relations between the target variable and meteorological conditions. Our model takes this into account by considering that ecosystems recovered when observed GPP reaches the potential GPP when given the meteorological conditions rather than the absolute flux.
Finally, our approach allows the determination of the uncertainties in estimated legacy effects. Previous studies (Anderegg et al., 2015; Huang et al., 2018) quantified legacy effects as the residuals between observed and predicted target variables (i.e. tree ring width, vegetation indices, etc.) in legacy years but were not able to consider uncertainties of their trained models. Yet, it is crucial to understand if the residuals are caused by model uncertainties or can be interpreted as legacy effects. In this study, legacy effects are identified only when the model residuals are outside the range of the model uncertainties so that we are confident that the legacies reported here are significant and avoid interpreting residuals caused by model error as legacy effects. A limitation of our approach is that we have to assume that there are no legacy effects in the climate system because this would potentially bias the interpretation of the residuals.
The methodology we proposed is able to detect the legacy effects of drought on GPP and can be easily applied to other eddy covariance sites and variables (i.e. evapotranspiration, transpiration, etc.) in order to improve our understanding of drought legacy effects on the ecosystem carbon cycle at different timescales.
5.2 Seasonal and annual legacy drought impacts on GPP
We found that residuals of GPP anomalies (GPPanom residuals) in legacy years were significantly larger than model uncertainties at both seasonal and annual scales at both sites, which indicated the strong legacy effects of drought on GPP at least in the 2 years following the drought events.
We found negative legacies on GPP (reduced uptake) in the early growing season of all legacy years (2004, 2005, 2019, and 2020) at DE-Hai. Reduced and delayed leaf development due to the physiological effects of the 2003 and 2018 droughts (e.g. metabolic damage and non-structural carbohydrates depletion) could result in reduced ecosystem-level photosynthesis (Migliavacca et al., 2009; Rocha and Goulden, 2010; Kannenberg et al., 2019) and could potentially explain negative legacies on GPP at the start of the growing season. In line with this hypothesis, we found that the enhanced vegetation index (EVI, a proxy of leaf area index; Figs. S5 and S6) at the sites showed lower values than other years in the early growing seasons of 2004, 2005, and 2019, and this delayed the spring phenology that propagated over the years of 2004 and 2019 with a shift of seasonality. We found consistently lower values of NPP allocated to foliage growth in 2004 than other years (Fig. S7). Furthermore, the detected negative legacies in the early growing season became smaller when adding EVI anomalies as an additional predictor in the random forest model (Fig. 5), indicating that the reduced and delayed leaf development partly explained the estimated legacy effects by the RF model trained with climate predictors only.
Another possible mechanism explaining legacy effects could be hydraulic damage induced by drought (Anderegg et al., 2013) and, therefore, insufficient ability of water transport limiting sink strength (Körner, 2015) and photosynthetic capacity (Chen et al., 2010), at least until the damage is repaired. If this was the case, then the transpiration fluxes should be reduced. However, we did not find similar negative legacy patterns on transpiration in the early growing season (Fig. S8a). Therefore, hydraulic damage did not seem a likely cause of drought legacies on GPP for these events. Overall, we cannot pinpoint the physiological causes of the detected legacy effects due to the limited availability of measurements. This calls for establishing more plant physiological measurements complementing eddy covariance and RI measurements to capture sufficient information about plant water relations, such as sap flow (Poyatos et al., 2021), tree water deficit (Nehemy et al., 2021), and carbon allocation (Hartmann et al., 2020), to provide a more detailed process understanding of the mechanisms underlying drought legacy effects.
Negative legacies on GPP in terms of lagged reduction in GPP in 2004 at DE-Lnf (14.4 %–24.8 %) were stronger than those at DE-Hai (6.1 %–12.3 %) in the seasonal and annual scales. The persistence of negative legacies throughout the full growing season in 2004 indicates that the 2003 drought likely caused stronger damage, especially reduced leaf development, which was supported by largely reduced negative legacies of RFEVI with EVI comparing to RF without EVI (Fig. 5), on the ecosystem at DE-Lnf than that at DE-Hai. From the community-level perspective, the stronger legacy effects found at DE-Lnf compared to DE-Hai may have been partly related to differences in forest composition between the two sites (Tamrakar et al., 2018; Pardos et al., 2021). Measurements of GPP at tree species level were not available; therefore, we relied on the legacies found for RI (reflecting growth) that were available for individual trees at DE-Hai. It should be noted, though, that the relationship between GPP and growth is complex (Fatichi et al., 2014). Negative legacy effects on RI of Fagus sylvatica, dominating at DE-Hai, in 2004, were found, whereas other co-dominating species (Acer pseudoplatanus and Fraxinus excelsior) did not show negative legacies. Therefore, the lower resilience of Fagus sylvatica compared to other species may have partly resulted in stronger negative legacies at the pure European beech forest at DE-Lnf than at DE-Hai. In addition, contrasting legacy effects of these two sites could also be associated with different age classes and the absolute stand age since the effects of stand age modulating the heat and drought impact on carbon exchange (Arain et al., 2022) and ecosystem-level photosynthetic capacity (Musavi et al., 2017) have been recognised. However, the evidence of species diversity and age structure effects on legacy effects needs to be further explored using more sites in future.
Stronger negative legacy effects on GPP in 2020 than those in other legacy years were found at DE-Hai in the seasonal and annual scales. This might be associated with significant tree mortality in the whole forest, including the main footprint in the period 2018–2020 (about 6 % yr−1 between 2017 and 2020 compared to less than 1 % yr−1 between 2005 and 2017) mainly caused by Storm David in January 2018 and the heat and/or drought in summer 2018 and 2019 (unpublished data). RI of Fagus sylvatica in 2020 showed slightly positive legacy effects in growth, since only living trees were sampled. This might be explained by the favourable weather conditions in winter/spring 2019/2020 associated with high mineralisation rates and reduced competition for nutrients, light, and water of the surviving trees (Grossiord, 2020). The RI data reflected mean growth signals from individual surviving trees, while the GPP data reflected mean carbon assimilation at stand level, including positive, negative, or absent legacy effects at individual tree level and the reduction in assimilating individuals due to higher tree mortality.
Overall, we found that the lagged impacts of drought on GPP are significant compared with concurrent drought impacts at the two sites studied here. The lagged reduction in GPP resulting from drought is usually not quantified (Ciais et al., 2005; Reichstein et al., 2007), perhaps because separating legacy effects on ecosystem carbon fluxes from observations is challenging (Kannenberg et al., 2019), and process-based models have been shown to miss such legacy effects (Bastos et al., 2021). This implies that the impact of droughts on ecosystem carbon cycling in most studies might be underestimated.
5.3 Importance of deep root zone soil moisture data
Deep root zone soil moisture has been recognised as being an important water source for vegetation, especially during droughts (Miguez-Macho and Fan, 2021; Werner et al., 2021). Although soil moisture measurements across three soil layers are available at both sites, the deepest depth (ca. 30 cm) cannot capture the entire soil water reservoir available for European beech, which has been observed to have non-negligible amounts of fine roots below 30 cm across different sites (Leuschner et al., 2004; Gessler et al., 2022).
We tested an initial model using anomalies of soil moisture at three layers as predictors (RFSM) and found strong positive legacy effects in the late growing season in 2019 at DE-Hai (Fig. S9), which, however, could not be reproduced by any of the models using soil moisture information from deeper layers (Fig. S9), including the local water balance (WAI, CWD) and the reanalysis data (ERA5). Comparing the predicted time series of GPPanom of the RFSM model with observations, we found the predicted GPPanom became much more negative in the late growing season, while observed GPPanom were close to zero (Fig. S10). Therefore, although soil moisture anomalies in the third layer (30 cm) were largely negative when the positive residuals appeared (Fig. S11), soil moisture from layers deeper than 30 cm may maintain the water supply for photosynthesis. Also, we found the evapotranspiration from the shallow layers (0–30 cm) estimated by the soil moisture decrease was less than the observed evapotranspiration during dry-down periods (Fig. S12), which indicated plant water uptake from layers deeper than 30 cm during dry-down periods, in line with our hypothesis. In summary, these positive patterns are likely due to model errors from incomplete information on the soil moisture profile rather than actual positive legacy effects.
These results highlight the importance of soil moisture measurements that capture the entire root zone for more reliable understanding of ecosystem functioning, particularly in the case of drought legacy effects.
The frequency, intensity, duration, and spatial extent of droughts are expected to increase in the next few decades due to anthropogenically caused global warming in many regions (IPCC, 2022). Drought not only impacts ecosystems concurrently but also can have legacy effects on ecosystem carbon fluxes. We developed a residual-based approach using a random forest regression model to detect drought legacies on gross primary productivity (GPP) using eddy covariance data. The methodology proposed here allows the quantification of significant drought legacy effects on GPP at the sub-seasonal and annual scales. The GPP reduction due to drought legacy effects is of comparable magnitude to the concurrent drought effects at the studied sites, which confirms the importance of legacy effects. We found contrasting legacy effects at two neighbouring forests with different species and age structures, yet the importance of these factors could not be evaluated. Future studies across a larger range of sites will be needed to understand whether the crucial role of legacy effects is general and on which mediating factors they depend.
The eddy covariance data for DE-Hai are available from https://meta.icos-cp.eu/objects/WiZ3ePi2Bvxugr_HNZoONQtR (Warm Winter 2020 Team, & ICOS Ecosystem Thematic Centre, last access: 28 December 2021, Knohl et al., 2021). The eddy covariance data for DE-Lnf are available from https://fluxnet.org/doi/FLUXNET2015/DE-Lnf (Lawrence Berkeley National Laboratory, last access: 16 October 2020, Knohl et al., 2002–2012). The enhanced vegetation index data are available from https://meta.icos-cp.eu/collections/TVBRaxjolfakaoov-JTup4pe (last access: 12 May 2021, Walther et al., 2021).
The supplement related to this article is available online at: https://doi.org/10.5194/bg-19-4315-2022-supplement.
The study was conceived by XY, AB, RO, MR, and MB. XY implemented the method and performed the data analyses. AKn, AKl, and FK provided the eddy covariance data. MMu provided the data of the radial increment and net primary productivity of fruits and leaves. JAN helped XY to process the transpiration estimation. SW provided and processed the Enhanced Vegetation Index data. BDS suggested quantitatively separating the structural and physiological effects. MMi helped to interpret the results. XY, AB, RO, MR, and MB prepared the first draft, and all authors contributed to discussion of results and the revisions of the paper.
At least one of the (co-)authors is a member of the editorial board of Biogeosciences. The peer-review process was guided by an independent editor, and the authors also have no other competing interests to declare.
Publisher's note: Copernicus Publications remains neutral with regard to jurisdictional claims in published maps and institutional affiliations.
Xin Yu and Markus Reichstein acknowledge funding from the European Research Council (ERC) Synergy Grant “Understanding and Modelling the Earth System with Machine Learning (USMILE)” under the Horizon 2020 research and innovation programme (grant no. 855187). Xin Yu acknowledges support from the International Max Planck Research School for Global Biogeochemical Cycles. René Orth acknowledges support by the German Research Foundation (Emmy Noether, grant no. 391059971). Franziska Koebsch and Alexander Knohl acknowledge support by Niedersächsisches Vorab (grant no. ZN 3679), Ministry of Lower Saxony for Science and Culture (MWK), and the German Federal Ministry of Education and Research (BMBF; research infrastructure ICOS). Martina Mund acknowledges support by the Integrated project CarboEurope-IP (European Commission, Directorate-General Research, Sixth Framework Programme, Priority 1.1.6.3: Global Change and Ecosystem; contract no. GOCECT-2003-505572), the Max Planck Institute for Biogeochemistry, Germany, the German Research Foundation (DFG; grant no. INST 186/1118-1 FUGG), and the Georg August University of Göttingen, Germany. Sophia Walther acknowledges funding within the ESA Living Planet Fellowship (project no. Vad3e mecum). Benjamin D. Stocker was funded by the Swiss National Science Foundation (grant no. PCEFP2_181115). We thank the Warm Winter 2020 initiative of the Integrated Carbon Observation System (ICOS), specifically Nicola Arriga and Dario Papale, and the administration of the Hainich National Park, for the opportunity for research within the National Park.
This research has been supported by the European Research Council, H2020 European Research Council (USMILE; grant no. 855187), the Deutsche Forschungsgemeinschaft (grant no. 391059971), the Schweizerischer Nationalfonds zur Förderung der Wissenschaftlichen Forschung (grant no. PCEFP2_181115), and the Ministry of Lower Saxony for Science and Culture (grant no. ZN 3679).
The article processing charges for this open-access publication were covered by the Max Planck Society.
This paper was edited by Nicolas Brüggemann and reviewed by two anonymous referees.
Allen, C. D., Breshears, D. D., and McDowell, N. G.: On underestimation of global vulnerability to tree mortality and forest die-off from hotter drought in the Anthropocene, Ecosphere, 6, 129, https://doi.org/10.1890/ES15-00203.1, 2015.
Anderegg, W. R. L., Plavcová, L., Anderegg, L. D. L., Hacke, U. G., Berry, J. A., and Field, C. B.: Drought's legacy: multiyear hydraulic deterioration underlies widespread aspen forest die-off and portends increased future risk, Glob. Change Biol., 19, 1188–1196, https://doi.org/10.1111/gcb.12100, 2013.
Anderegg, W. R. L., Schwalm, C., Biondi, F., Camarero, J. J., Koch, G., Litvak, M., Ogle, K., Shaw, J. D., Shevliakova, E., Williams, A. P., Wolf, A., Ziaco, E., and Pacala, S.: Pervasive drought legacies in forest ecosystems and their implications for carbon cycle models, Science, 349, 528–532, https://doi.org/10.1126/science.aab1833, 2015.
Anthoni, P. M., Knohl, A., Rebmann, C., Freibauer, A., Mund, M., Ziegler, W., Kolle, O., and Schulze, E.-D.: Forest and agricultural land-use-dependent CO2 exchange in Thuringia, Germany, Glob. Change Biol., 10, 2005–2019, https://doi.org/10.1111/j.1365-2486.2004.00863.x, 2004.
Arain, M. A., Xu, B., Brodeur, J. J., Khomik, M., Peichl, M., Beamesderfer, E., Restrepo-Couple, N., and Thorne, R.: Heat and drought impact on carbon exchange in an age-sequence of temperate pine forests, Ecol. Process., 11, 7, https://doi.org/10.1186/s13717-021-00349-7, 2022.
Assal, T. J., Anderson, P. J., and Sibold, J.: Spatial and temporal trends of drought effects in a heterogeneous semi-arid forest ecosystem, Forest Ecol. Manage., 365, 137–151, https://doi.org/10.1016/j.foreco.2016.01.017, 2016.
Aubinet, M., Grelle, A., Ibrom, A., Rannik, U., Moncrieff, J., Foken, T., Kowalski, A. S., Martin, P. H., Berbigier, P., Grunwald, T., Morgenstern, K., Pilegaard, K., Rebmann, C., Bernhofer, C., Clement, R., Elbers, J., Granier, A., Snijders, W., Valentini, R., and Vesala, T.: Estimates of the Annual Net Carbon and Water Exchange, Adv. Ecol. Res., 30, 113–174, 2000.
Bastos, A., Ciais, P., Friedlingstein, P., Sitch, S., Pongratz, J., Fan, L., Wigneron, J. P., Weber, U., Reichstein, M., Fu, Z., Anthoni, P., Arneth, A., Haverd, V., Jain, A. K., Joetzjer, E., Knauer, J., Lienert, S., Loughran, T., McGuire, P. C., Tian, H., Viovy, N., and Zaehle, S.: Direct and seasonal legacy effects of the 2018 heat wave and drought on European ecosystem productivity, Sci. Adv., 6, eaba2724, https://doi.org/10.1126/sciadv.aba2724, 2020.
Bastos, A., Orth, R., Reichstein, M., Ciais, P., Viovy, N., Zaehle, S., Anthoni, P., Arneth, A., Gentine, P., Joetzjer, E., Lienert, S., Loughran, T., McGuire, P. C., O, S., Pongratz, J., and Sitch, S.: Vulnerability of European ecosystems to two compound dry and hot summers in 2018 and 2019, Earth Syst. Dynam., 12, 1015–1035, https://doi.org/10.5194/esd-12-1015-2021, 2021.
Beringer, J., Hutley, L. B., Tapper, N. J., and Cernusak, L. A.: Savanna fires and their impact on net ecosystem productivity in North Australia, Global Change Biol., 13, 990–1004, https://doi.org/10.1111/j.1365-2486.2007.01334.x, 2007.
Bose, A. K., Gessler, A., Bolte, A., Bottero, A., Buras, A., Cailleret, M., Camarero, J. J., Haeni, M., Hereş, A.-M., Hevia, A., Lévesque, M., Linares, J. C., Martinez-Vilalta, J., Matías, L., Menzel, A., Sánchez-Salguero, R., Saurer, M., Vennetier, M., Ziche, D., and Rigling, A.: Growth and resilience responses of Scots pine to extreme droughts across Europe depend on predrought growth conditions, Glob. Change Biol., 26, 4521–4537, https://doi.org/10.1111/gcb.15153, 2020.
Breiman, L.: Random Forests, Mach. Learn., 45, 5–32, https://doi.org/10.1023/A:1010933404324, 2001.
Chen, J.-W., Zhang, Q., Li, X.-S., and Cao, K.-F.: Gas exchange and hydraulics in seedlings of Hevea brasiliensis during water stress and recovery, Tree Physiol., 30, 876–885, https://doi.org/10.1093/treephys/tpq043, 2010.
Ciais, P., Reichstein, M., Viovy, N., Granier, A., Ogée, J., Allard, V., Aubinet, M., Buchmann, N., Bernhofer, C., Carrara, A., Chevallier, F., De Noblet, N., Friend, A. D., Friedlingstein, P., Grünwald, T., Heinesch, B., Keronen, P., Knohl, A., Krinner, G., Loustau, D., Manca, G., Matteucci, G., Miglietta, F., Ourcival, J. M., Papale, D., Pilegaard, K., Rambal, S., Seufert, G., Soussana, J. F., Sanz, M. J., Schulze, E. D., Vesala, T., and Valentini, R.: Europe-wide reduction in primary productivity caused by the heat and drought in 2003, Nature, 437, 529–533, https://doi.org/10.1038/nature03972, 2005.
Erbilgin, N., Zanganeh, L., Klutsch, J. G., Chen, S., Zhao, S., Ishangulyyeva, G., Burr, S. J., Gaylord, M., Hofstetter, R., Keefover-Ring, K., Raffa, K. F., and Kolb, T.: Combined drought and bark beetle attacks deplete non-structural carbohydrates and promote death of mature pine trees, Plant Cell Environ., 44, 3866–3881, https://doi.org/10.1111/pce.14197, 2021.
Fatichi, S., Leuzinger, S., and Körner, C.: Moving beyond photosynthesis: from carbon source to sink-driven vegetation modeling, New Phytol., 201, 1086–1095, https://doi.org/10.1111/nph.12614, 2014.
Frank, D., Reichstein, M., Bahn, M., Thonicke, K., Frank, D., Mahecha, M. D., Smith, P., Velde, M. van der, Vicca, S., Babst, F., Beer, C., Buchmann, N., Canadell, J. G., Ciais, P., Cramer, W., Ibrom, A., Miglietta, F., Poulter, B., Rammig, A., Seneviratne, S. I., Walz, A., Wattenbach, M., Zavala, M. A., and Zscheischler, J.: Effects of climate extremes on the terrestrial carbon cycle: concepts, processes and potential future impacts, Glob. Change Biol., 21, 2861–2880, https://doi.org/10.1111/gcb.12916, 2015.
Fu, Z., Ciais, P., Bastos, A., Stoy, P. C., Yang, H., Green, J. K., Wang, B., Yu, K., Huang, Y., Knohl, A., Šigut, L., Gharun, M., Cuntz, M., Arriga, N., Roland, M., Peichl, M., Migliavacca, M., Cremonese, E., Varlagin, A., Brümmer, C., Gourlez de la Motte, L., Fares, S., Buchmann, N., El-Madany, T. S., Pitacco, A., Vendrame, N., Li, Z., Vincke, C., Magliulo, E., and Koebsch, F.: Sensitivity of gross primary productivity to climatic drivers during the summer drought of 2018 in Europe, Philos. T. R. Soc. B, 375, 20190747, https://doi.org/10.1098/rstb.2019.0747, 2020.
Galvagno, M., Wohlfahrt, G., Cremonese, E., Rossini, M., Colombo, R., Filippa, G., Julitta, T., Manca, G., Siniscalco, C., di Cella, U. M., and Migliavacca, M.: Phenology and carbon dioxide source/sink strength of a subalpine grassland in response to an exceptionally short snow season, Environ. Res. Lett., 8, 025008, https://doi.org/10.1088/1748-9326/8/2/025008, 2013.
Gessler, A., Bächli, L., Rouholahnejad Freund, E., Treydte, K., Schaub, M., Haeni, M., Weiler, M., Seeger, S., Marshall, J., and Hug, C.: Drought reduces water uptake in beech from the drying topsoil, but no compensatory uptake occurs from deeper soil layers, New Phytol., 233, 194206, https://doi.org/10.1111/nph.17767, 2022.
González de Andrés, E., Rosas, T., Camarero, J. J., and Martínez-Vilalta, J.: The intraspecific variation of functional traits modulates drought resilience of European beech and pubescent oak, J. Ecol., 109, 3652–3669, https://doi.org/10.1111/1365-2745.13743, 2021.
Grossiord, C.: Having the right neighbors: how tree species diversity modulates drought impacts on forests, New Phytol., 228, 42–49, https://doi.org/10.1111/nph.15667, 2020.
Haberstroh, S. and Werner, C.: The role of species interactions for forest resilience to drought, Plant Biol., https://doi.org/10.1111/plb.13415, in press, 2022.
Hacket-Pain, A. J., Friend, A. D., Lageard, J. G. A., and Thomas, P. A.: The influence of masting phenomenon on growth–climate relationships in trees: explaining the influence of previous summers' climate on ring width, Tree Physiol., 35, 319–330, https://doi.org/10.1093/treephys/tpv007, 2015.
Hartmann, H. and Trumbore, S.: Understanding the roles of nonstructural carbohydrates in forest trees – from what we can measure to what we want to know, New Phytol., 211, 386–403, https://doi.org/10.1111/nph.13955, 2016.
Hartmann, H., Bahn, M., Carbone, M., and Richardson, A. D.: Plant carbon allocation in a changing world – challenges and progress: introduction to a Virtual Issue on carbon allocation, New Phytol., 227, 981–988, https://doi.org/10.1111/nph.16757, 2020.
Herbst, M., Mund, M., Tamrakar, R., and Knohl, A.: Differences in carbon uptake and water use between a managed and an unmanaged beech forest in central Germany, Forest Ecol. Manage., 355, 101–108, https://doi.org/10.1016/j.foreco.2015.05.034, 2015.
Huang, J., Hammerbacher, A., Gershenzon, J., van Dam, N. M., Sala, A., McDowell, N. G., Chowdhury, S., Gleixner, G., Trumbore, S., and Hartmann, H.: Storage of carbon reserves in spruce trees is prioritized over growth in the face of carbon limitation, P. Natl. Acad. Sci. USA, 118, e2023297118, https://doi.org/10.1073/pnas.2023297118, 2021.
Huang, M., Wang, X., Keenan, T. F., and Piao, S.: Drought timing influences the legacy of tree growth recovery, Glob. Change Biol., 24, 3546–3559, https://doi.org/10.1111/gcb.14294, 2018.
IPCC: Climate Change 2022: Impacts, Adaptation, and Vulnerability, in: Contribution of Working Group II to the Sixth Assessment Report of the Intergovernmental Panel on Climate Change, edited by: Pörtner, H.-O., Roberts, D. C., Tignor, M., Poloczanska, E. S., Mintenbeck, K., Alegría, A., Craig, M., Langsdorf, S., Löschke, S., Möller, V., Okem, A., and Rama, B., Cambridge University Press, in press, 2022.
Kannenberg, S. A., Novick, K. A., Alexander, M. R., Maxwell, J. T., Moore, D. J. P., Phillips, R. P., and Anderegg, W. R. L.: Linking drought legacy effects across scales: From leaves to tree rings to ecosystems, Glob. Change Biol., 25, 2978–2992, https://doi.org/10.1111/gcb.14710, 2019.
Kannenberg, S. A., Schwalm, C. R., and Anderegg, W. R. L.: Ghosts of the past: how drought legacy effects shape forest functioning and carbon cycling, Ecol. Lett., 23, 891–901, https://doi.org/10.1111/ele.13485, 2020.
Kendall, M. G.: Rank correlation methods, Griffin, 1948.
Knohl, A., Schulze, E.-D., Kolle, O., and Buchmann, N.: Large carbon uptake by an unmanaged 250-year-old deciduous forest in Central Germany, Agr. Forest Meteorol., 118, 151–167, https://doi.org/10.1016/S0168-1923(03)00115-1, 2003.
Knohl, A., Kolle, O., Siebicke, L., Tiedemann, F., and Miscellaneous: Fluxnet Product, Hainich, https://hdl.handle.net/11676/WiZ3ePi2Bvxugr_HNZoONQtR, 2021 (data available at https://meta.icos-cp.eu/objects/WiZ3ePi2Bvxugr_HNZoONQtR, last access: 28 December 2021).
Knohl, A., Tiedemann, F., Kolle, O., Schulze, E.-D., Anthoni, P., Kutsch, W., Herbst, M., and Siebicke, L.: FLUXNET2015 DE-Lnf Leinefelde [data set], https://doi.org/10.18140/FLX/1440150, 2002–2012 (data available at https://fluxnet.org/doi/FLUXNET2015/DE-Lnf, last access: 16 October 2020).
Körner, C.: Paradigm shift in plant growth control, Curr. Opin. Plant Biol., 25, 107–114, https://doi.org/10.1016/j.pbi.2015.05.003, 2015.
Krishnan, P., Black, T. A., Grant, N. J., Barr, A. G., Hogg, E. (Ted) H., Jassal, R. S., and Morgenstern, K.: Impact of changing soil moisture distribution on net ecosystem productivity of a boreal aspen forest during and following drought, Agr. Forest Meteorol., 139, 208–223, https://doi.org/10.1016/j.agrformet.2006.07.002, 2006.
Leuschner, C., Hertel, D., Schmid, I., Koch, O., Muhs, A., and Hölscher, D.: Stand fine root biomass and fine root morphology in old-growth beech forests as a function of precipitation and soil fertility, Plant Soil, 258, 43–56, https://doi.org/10.1023/B:PLSO.0000016508.20173.80, 2004.
Lewis, S. L., Brando, P. M., Phillips, O. L., van der Heijden, G. M. F., and Nepstad, D.: The 2010 Amazon Drought, Plant Soil, 331, 554–554, https://doi.org/10.1126/science.1200807, 2011.
Ma, X., Huete, A., Moran, S., Ponce-Campos, G., and Eamus, D.: Abrupt shifts in phenology and vegetation productivity under climate extremes, J. Geophys. Res.-Biogeo., 120, 2036–2052, https://doi.org/10.1002/2015JG003144, 2015.
Meinshausen, N. and Ridgeway, G.: Quantile regression forests, J. Mach. Learn. Res., 7, 983–999, 2006.
Migliavacca, M., Meroni, M., Manca, G., Matteucci, G., Montagnani, L., Grassi, G., Zenone, T., Teobaldelli, M., Goded, I., Colombo, R., and Seufert, G.: Seasonal and interannual patterns of carbon and water fluxes of a poplar plantation under peculiar eco-climatic conditions, Agr. Forest Meteorol., 149, 1460–1476, https://doi.org/10.1016/j.agrformet.2009.04.003, 2009.
Miguez-Macho, G. and Fan, Y.: Spatiotemporal origin of soil water taken up by vegetation, Nature, 598, 624–628, https://doi.org/10.1038/s41586-021-03958-6, 2021.
Müller, L. M. and Bahn, M.: Drought legacies and ecosystem responses to subsequent drought, Global Change Biol., 28, 5086–5103, https://doi.org/10.1111/gcb.16270, 2022.
Mund, M., Herbst, M., Knohl, A., Matthäus, B., Schumacher, J., Schall, P., Siebicke, L., Tamrakar, R., and Ammer, C.: It is not just a `trade-off': indications for sink- and source-limitation to vegetative and regenerative growth in an old-growth beech forest, New Phytol., 226, 111–125, https://doi.org/10.1111/nph.16408, 2020.
Musavi, T., Migliavacca, M., Reichstein, M., Kattge, J., Wirth, C., Black, T. A., Janssens, I., Knohl, A., Loustau, D., Roupsard, O., Varlagin, A., Rambal, S., Cescatti, A., Gianelle, D., Kondo, H., Tamrakar, R., and Mahecha, M. D.: Stand age and species richness dampen interannual variation of ecosystem-level photosynthetic capacity, Nat. Ecol. Evol., 1, 1–7, https://doi.org/10.1038/s41559-016-0048, 2017.
Nehemy, M. F., Benettin, P., Asadollahi, M., Pratt, D., Rinaldo, A., and McDonnell, J. J.: Tree water deficit and dynamic source water partitioning, Hydrol. Process., 35, e14004, https://doi.org/10.1002/hyp.14004, 2021.
Nelson, J. A., Carvalhais, N., Cuntz, M., Delpierre, N., Knauer, J., Ogée, J., Migliavacca, M., Reichstein, M., and Jung, M.: Coupling Water and Carbon Fluxes to Constrain Estimates of Transpiration: The TEA Algorithm, J. Geophys. Res.-Biogeo., 123, 3617–3632, https://doi.org/10.1029/2018JG004727, 2018.
Orth, R., Destouni, G., Jung, M., and Reichstein, M.: Large-scale biospheric drought response intensifies linearly with drought duration in arid regions, Biogeosciences, 17, 2647–2656, https://doi.org/10.5194/bg-17-2647-2020, 2020.
Pardos, M., del Río, M., Pretzsch, H., Jactel, H., Bielak, K., Bravo, F., Brazaitis, G., Defossez, E., Engel, M., Godvod, K., Jacobs, K., Jansone, L., Jansons, A., Morin, X., Nothdurft, A., Oreti, L., Ponette, Q., Pach, M., Riofrío, J., Ruíz-Peinado, R., Tomao, A., Uhl, E., and Calama, R.: The greater resilience of mixed forests to drought mainly depends on their composition: Analysis along a climate gradient across Europe, Forest Ecol. Manage., 481, 118687, https://doi.org/10.1016/j.foreco.2020.118687, 2021.
Pastorello, G., Trotta, C., Canfora, E., et al.: The FLUXNET2015 dataset and the ONEFlux processing pipeline for eddy covariance data, Sci. Data, 7, 225, https://doi.org/10.1038/s41597-020-0534-3, 2020.
Peltier, D. M. P., Guo, J., Nguyen, P., Bangs, M., Wilson, M., Samuels-Crow, K., Yocom, L. L., Liu, Y., Fell, M. K., Shaw, J. D., Auty, D., Schwalm, C., Anderegg, W. R. L., Koch, G. W., Litvak, M. E., and Ogle, K.: Temperature memory and non-structural carbohydrates mediate legacies of a hot drought in trees across the southwestern US, Tree Physiol., 42, 7185, https://doi.org/10.1093/treephys/tpab091, 2022.
Piao, S., Zhang, X., Chen, A., Liu, Q., Lian, X., Wang, X., Peng, S., and Wu, X.: The impacts of climate extremes on the terrestrial carbon cycle: A review, Sci. China Earth Sci., 62, 1551–1563, https://doi.org/10.1007/s11430-018-9363-5, 2019.
Poyatos, R., Granda, V., Flo, V., Adams, M. A., Adorján, B., Aguadé, D., Aidar, M. P. M., Allen, S., Alvarado-Barrientos, M. S., Anderson-Teixeira, K. J., Aparecido, L. M., Arain, M. A., Aranda, I., Asbjornsen, H., Baxter, R., Beamesderfer, E., Berry, Z. C., Berveiller, D., Blakely, B., Boggs, J., Bohrer, G., Bolstad, P. V., Bonal, D., Bracho, R., Brito, P., Brodeur, J., Casanoves, F., Chave, J., Chen, H., Cisneros, C., Clark, K., Cremonese, E., Dang, H., David, J. S., David, T. S., Delpierre, N., Desai, A. R., Do, F. C., Dohnal, M., Domec, J.-C., Dzikiti, S., Edgar, C., Eichstaedt, R., El-Madany, T. S., Elbers, J., Eller, C. B., Euskirchen, E. S., Ewers, B., Fonti, P., Forner, A., Forrester, D. I., Freitas, H. C., Galvagno, M., Garcia-Tejera, O., Ghimire, C. P., Gimeno, T. E., Grace, J., Granier, A., Griebel, A., Guangyu, Y., Gush, M. B., Hanson, P. J., Hasselquist, N. J., Heinrich, I., Hernandez-Santana, V., Herrmann, V., Hölttä, T., Holwerda, F., Irvine, J., Isarangkool Na Ayutthaya, S., Jarvis, P. G., Jochheim, H., Joly, C. A., Kaplick, J., Kim, H. S., Klemedtsson, L., Kropp, H., Lagergren, F., Lane, P., Lang, P., Lapenas, A., Lechuga, V., Lee, M., Leuschner, C., Limousin, J.-M., Linares, J. C., Linderson, M.-L., Lindroth, A., Llorens, P., López-Bernal, Á., Loranty, M. M., Lüttschwager, D., Macinnis-Ng, C., Maréchaux, I., Martin, T. A., Matheny, A., McDowell, N., McMahon, S., Meir, P., Mészáros, I., Migliavacca, M., Mitchell, P., Mölder, M., Montagnani, L., Moore, G. W., Nakada, R., Niu, F., Nolan, R. H., Norby, R., Novick, K., Oberhuber, W., Obojes, N., Oishi, A. C., Oliveira, R. S., Oren, R., Ourcival, J.-M., Paljakka, T., Perez-Priego, O., Peri, P. L., Peters, R. L., Pfautsch, S., Pockman, W. T., Preisler, Y., Rascher, K., Robinson, G., Rocha, H., Rocheteau, A., Röll, A., Rosado, B. H. P., Rowland, L., Rubtsov, A. V., Sabaté, S., Salmon, Y., Salomón, R. L., Sánchez-Costa, E., Schäfer, K. V. R., Schuldt, B., Shashkin, A., Stahl, C., Stojanović, M., Suárez, J. C., Sun, G., Szatniewska, J., Tatarinov, F., Tesař, M., Thomas, F. M., Tor-ngern, P., Urban, J., Valladares, F., van der Tol, C., van Meerveld, I., Varlagin, A., Voigt, H., Warren, J., Werner, C., Werner, W., Wieser, G., Wingate, L., Wullschleger, S., Yi, K., Zweifel, R., Steppe, K., Mencuccini, M., and Martínez-Vilalta, J.: Global transpiration data from sap flow measurements: the SAPFLUXNET database, Earth Syst. Sci. Data, 13, 2607–2649, https://doi.org/10.5194/essd-13-2607-2021, 2021.
Reichstein, M., Falge, E., Baldocchi, D., Papale, D., Aubinet, M., Berbigier, P., Bernhofer, C., Buchmann, N., Gilmanov, T., Granier, A., Grünwald, T., Havránková, K., Ilvesniemi, H., Janous, D., Knohl, A., Laurila, T., Lohila, A., Loustau, D., Matteucci, G., Meyers, T., Miglietta, F., Ourcival, J.-M., Pumpanen, J., Rambal, S., Rotenberg, E., Sanz, M., Tenhunen, J., Seufert, G., Vaccari, F., Vesala, T., Yakir, D., and Valentini, R.: On the separation of net ecosystem exchange into assimilation and ecosystem respiration: review and improved algorithm, Glob. Change Biol., 11, 1424–1439, https://doi.org/10.1111/j.1365-2486.2005.001002.x, 2005.
Reichstein, M., Ciais, P., Papale, D., Valentini, R., Running, S., Viovy, N., Cramer, W., Granier, A., Ogée, J., Allard, V., Aubinet, M., Bernhofer, C., Buchmann, N., Carrara, A., Grünwald, T., Heimann, M., Heinesch, B., Knohl, A., Kutsch, W., Loustau, D., Manca, G., Matteucci, G., Miglietta, F., Ourcival, J. M., Pilegaard, K., Pumpanen, J., Rambal, S., Schaphoff, S., Seufert, G., Soussana, J.-F., Sanz, M.-J., Vesala, T., and Zhao, M.: Reduction of ecosystem productivity and respiration during the European summer 2003 climate anomaly: a joint flux tower, remote sensing and modelling analysis, Glob. Change Biol., 13, 634–651, https://doi.org/10.1111/j.1365-2486.2006.01224.x, 2007.
Reichstein, M., Bahn, M., Ciais, P., Frank, D., Mahecha, M. D., Seneviratne, S. I., Zscheischler, J., Beer, C., Buchmann, N., Frank, D. C., Papale, D., Rammig, A., Smith, P., Thonicke, K., van der Velde, M., Vicca, S., Walz, A., and Wattenbach, M.: Climate extremes and the carbon cycle, Nature, 500, 287–295, https://doi.org/10.1038/nature12350, 2013.
Rocha, A. V. and Goulden, M. L.: Drought legacies influence the long-term carbon balance of a freshwater marsh, J. Geophys. Res.-Biogeo., 115, G00H02, https://doi.org/10.1029/2009JG001215, 2010.
Ryo, M. and Rillig, M. C.: Statistically reinforced machine learning for nonlinear patterns and variable interactions, Ecosphere, 8, e01976, https://doi.org/10.1002/ecs2.1976, 2017.
Saatchi, S., Asefi-Najafabady, S., Malhi, Y., Aragão, L. E. O. C., Anderson, L. O., Myneni, R. B., and Nemani, R.: Persistent effects of a severe drought on Amazonian forest canopy, P. Natl. Acad. Sci. USA, 110, 565570, https://doi.org/10.1073/pnas.1204651110, 2013.
Schwalm, C. R., Williams, C. A., Schaefer, K., Arneth, A., Bonal, D., Buchmann, N., Chen, J., Law, B. E., Lindroth, A., Luyssaert, S., Reichstein, M., and Richardson, A. D.: Assimilation exceeds respiration sensitivity to drought: A FLUXNET synthesis, Glob. Change Biol., 16, 657–670, https://doi.org/10.1111/j.1365-2486.2009.01991.x, 2010.
Schwalm, C. R., Anderegg, W. R. L., Michalak, A. M., Fisher, J. B., Biondi, F., Koch, G., Litvak, M., Ogle, K., Shaw, J. D., Wolf, A., Huntzinger, D. N., Schaefer, K., Cook, R., Wei, Y., Fang, Y., Hayes, D., Huang, M., Jain, A., and Tian, H.: Global patterns of drought recovery, Nature, 548, 202205, https://doi.org/10.1038/nature23021, 2017.
Sun, S., Sun, G., Caldwell, P., McNulty, S., Cohen, E., Xiao, J., and Zhang, Y.: Drought impacts on ecosystem functions of the U.S. National Forests and Grasslands: Part II assessment results and management implications, Forest Ecol. Manage., 353, 269–279, https://doi.org/10.1016/j.foreco.2015.04.002, 2015.
Tamrakar, R., Rayment, M. B., Moyano, F., Mund, M., and Knohl, A.: Implications of structural diversity for seasonal and annual carbon dioxide fluxes in two temperate deciduous forests, Agr. Forest Meteorol., 263, 465–476, https://doi.org/10.1016/j.agrformet.2018.08.027, 2018.
Tramontana, G., Jung, M., Schwalm, C. R., Ichii, K., Camps-Valls, G., Ráduly, B., Reichstein, M., Arain, M. A., Cescatti, A., Kiely, G., Merbold, L., Serrano-Ortiz, P., Sickert, S., Wolf, S., and Papale, D.: Predicting carbon dioxide and energy fluxes across global FLUXNET sites with regression algorithms, Biogeosciences, 13, 4291–4313, https://doi.org/10.5194/bg-13-4291-2016, 2016.
Walther, S., Besnard, S., Nelson, J. A., and Weber, U.: Supplementary data to Walther et al. (2021), A view from space on global flux towers by MODIS and Landsat: The FluxnetEO dataset (Landsat) (Version 1.0). ICOS ERIC – Carbon Portal, https://doi.org/10.18160/0Z7J-J3TR, 2021 (data available at https://meta.icos-cp.eu/collections/TVBRaxjolfakaoov-JTup4pe, last access: 12 May 2021).
Walther, S., Besnard, S., Nelson, J. A., El-Madany, T. S., Migliavacca, M., Weber, U., Carvalhais, N., Ermida, S. L., Brümmer, C., Schrader, F., Prokushkin, A. S., Panov, A. V., and Jung, M.: Technical note: A view from space on global flux towers by MODIS and Landsat: the FluxnetEO data set, Biogeosciences, 19, 2805–2840, https://doi.org/10.5194/bg-19-2805-2022, 2022.
Wang, B., Chen, T., Li, C., Xu, G., Wu, G., and Liu, G.: Discrepancy in growth resilience to drought among different stand-aged forests declines going from a semi-humid region to an arid region, Forest Ecol. Manage., 511, 120135, https://doi.org/10.1016/j.foreco.2022.120135, 2022.
Warm Winter 2020 Team and ICOS Ecosystem Thematic Centre: Warm Winter 2020 ecosystem eddy covariance flux product for 73 stations in FLUXNET-Archive format – release 2022-1 (Version 1.0), ICOS Carbon Portal [data set], https://doi.org/10.18160/2G60-ZHAK, 2022.
Werner, C., Meredith, L. K., Ladd, S. N., Ingrisch, J., Kübert, A., van Haren, J., Bahn, M., Bailey, K., Bamberger, I., Beyer, M., Blomdahl, D., Byron, J., Daber, E., Deleeuw, J., Dippold, M. A., Fudyma, J., Gil-Loaiza, J., Honeker, L. K., Hu, J., Huang, J., Klüpfel, T., Krechmer, J., Kreuzwieser, J., Kühnhammer, K., Lehmann, M. M., Meeran, K., Misztal, P. K., Ng, W.-R., Pfannerstill, E., Pugliese, G., Purser, G., Roscioli, J., Shi, L., Tfaily, M., and Williams, J.: Ecosystem fluxes during drought and recovery in an experimental forest, Science, 374, 1514–1518, https://doi.org/10.1126/science.abj6789, 2021.
Wigneron, J.-P., Fan, L., Ciais, P., Bastos, A., Brandt, M., Chave, J., Saatchi, S., Baccini, A., and Fensholt, R.: Tropical forests did not recover from the strong 20152016 El Niño event, Sci. Adv., 6, eaay4603, https://doi.org/10.1126/sciadv.aay4603, 2020.
Wolf, S., Keenan, T. F., Fisher, J. B., Baldocchi, D. D., Desai, A. R., Richardson, A. D., Scott, R. L., Law, B. E., Litvak, M. E., Brunsell, N. A., Peters, W., and van der Laan-Luijkx, I. T.: Warm spring reduced carbon cycle impact of the 2012 US summer drought, P. Natl. Acad. Sci. USA, 113, 58805885, https://doi.org/10.1073/pnas.1519620113, 2016.
Wu, X., Liu, H., Li, X., Ciais, P., Babst, F., Guo, W., Zhang, C., Magliulo, V., Pavelka, M., Liu, S., Huang, Y., Wang, P., Shi, C., and Ma, Y.: Differentiating drought legacy effects on vegetation growth over the temperate Northern Hemisphere, Glob. Change Biol., 24, 504–516, https://doi.org/10.1111/gcb.13920, 2018.
Zhang, S., Yang, Y., Wu, X., Li, X., and Shi, F.: Postdrought Recovery Time Across Global Terrestrial Ecosystems, J. Geophys. Res.-Biogeo., 126, e2020JG005699, https://doi.org/10.1029/2020JG005699, 2021.
Zscheischler, J., Mahecha, M. D., Buttlar, J. von, Harmeling, S., Jung, M., Rammig, A., Randerson, J. T., Schölkopf, B., Seneviratne, S. I., Tomelleri, E., Zaehle, S., and Reichstein, M.: A few extreme events dominate global interannual variability in gross primary production, Environ. Res. Lett., 9, 035001, https://doi.org/10.1088/1748-9326/9/3/035001, 2014.