the Creative Commons Attribution 4.0 License.
the Creative Commons Attribution 4.0 License.
 | 18 Nov 2022
Spatio-temporal distribution, photoreactivity and environmental control of dissolved organic matter in the sea-surface microlayer of the eastern marginal seas of China
Lin Yang
Jing Zhang
Anja Engel
As the boundary interface between the atmosphere and ocean, the sea-surface microlayer (SML) plays a significant role in the biogeochemical cycles of dissolved organic matter (DOM) and macronutrients in marine environments. In our study, the optical properties of DOM were compared between the sub-surface water (SSW) and the SML during spring, summer and winter in the East China Sea (ECS) and the Yellow Sea (YS). In addition, photoexposure experiments were designed to compare photochemical degradation processes of DOM between the SML and the SSW. Chromophoric DOM (CDOM), fluorescent DOM, dissolved organic carbon, chlorophyll a (Chl a), picoplankton, nutrients and bacteria were frequently enriched in the SML. The enrichment factors (EFs) of tryptophan-like component 4 were significantly higher than other fluorescence components; the longer wavelength absorption values of CDOM showed higher EFs in the SML, and a more significant relationship between CDOM and Chl a in the SML, indicating that autochthonous DOM was more strongly enriched in the SML than the terrestrial DOM. Higher EFs were generally observed in the SML in the off-shore regions than in the coastal regions, and CDOM in the SML was photobleached more after relatively strong irradiation, as also indicated by the lower percentages of humic-like DOM and lower specific UV absorbance values (SUVA254) in the SML than the SSW. Compared to the SSW, the elevated nutrients may stimulate phytoplankton growth, biological activity and then production of abundant fresh autochthonous DOM in the SML. Our results revealed a new enrichment model for exploring the air–sea interface environment, which can explain the more autochthonous properties of DOM in the SML than the SSW.
- Article
(1789 KB) - Full-text XML
-
Supplement
(7918 KB) - BibTeX
- EndNote


The sea-surface microlayer (SML) is the boundary interface between the atmosphere and the ocean, which covers about 70 % of the Earth's surface. SML is physicochemically distinct from sub-surface water (SSW; depth 3–5 m) and is characteristically enriched with phytoneuston, chlorophyll, particulate carbon, dissolved organic matter (Hardy, 1982; Hardy and Apts, 1989) and biogenic organic compounds, such as lipids, proteins and polysaccharides (Liss and Duce, 1997; Liss and Duce, 2005). With a total thickness ranging between 1 and 1000 µm, the SML remains present in wind speeds of up to 13 m s−1 (Sabbaghzadeh et al., 2017). A variety of processes contribute to the formation of the SML in aquatic systems; these include but are not limited to scavenging by rising bubbles, atmospheric deposition, dissolved organic matter (DOM) photochemical degradation and transformation, secretion, and biodegradation by organisms living within the microlayer (neuston), and migration of motile organisms into the SML (Aller et al., 2005; Wotton and Preston, 2005). The SML is a very dynamic interface (Cunliffe et al., 2013); moreover, the impact of changes in UV radiation on air–sea fluxes in the SML of important trace gases needs to be assessed. In addition, another uncertainty is whether photochemical reactions on the SML affect the flux of volatile species at the air–sea interface (Blough, 1997). Therefore, the role of the microlayer in oceanic emissions is not well understood, and fundamental advances in understanding its properties are needed.
The processes leading to the enrichment of DOM in the SML are not solely controlled by changes in the DOM concentration at the sea-surface microlayer but are more complex (Mustaffa et al., 2018). Because of its unique position at the air–sea interface, the biological and photochemical reactions of DOM in the SML could strongly impact the biogeochemical cycling of biologically important elements, for example, via the conversion of DOM into volatile species such as carbonyl sulfide (OCS), which influence the atmospheric chemistry and climate (Mopper and Kieber, 2002). Air–sea gas exchanges of trace gases (e.g. CO, OCS, dimethylsulfide (DMS) and alkyl nitrate gases) can also be greatly influenced by biological and photochemical reactions at the sea surface (Blough, 1997).
Optical measurements of absorbance and fluorescence have been applied to track DOM variability in aquatic ecosystems (McKnight et al., 2001; Zepp et al., 2004; Coble, 2007). The fraction of DOM that absorbs light in the ultraviolet and visible ranges of the electromagnetic spectrum and the fraction that exhibits a blue fluorescence are known as chromophoric DOM (CDOM) and fluorescence DOM (FDOM), respectively, and their relative compositions can provide information differentiating between autochthonous and allochthonous sources (Coble, 1996; McKnight et al., 2001; Stedmon et al., 2007). Photolysis of DOM promotes the formation of low-molecular-weight compounds, increasing the bioavailability of biologically refractory materials and facilitating carbon uptake by microbes (Kieber et al., 1989). Indices based on optical measurements of absorbance and fluorescence are commonly used to track DOM composition and infer DOM processing due to their low analytical cost and high throughput relative to molecular level analyses (Coble, 2007; Fellman et al., 2010; Gabor et al., 2014). Recent studies have mainly focused on using the characteristics of CDOM as indicators of the sources and degradation states of DOM (Massicotte et al., 2017) in the SSW, as well as its vertical distribution in estuaries and open oceans (Yamashita et al., 2017; Margolin et al., 2018). In addition, Mustaffa et al. (2018, 2017) observed that FDOM enrichment in the SML in the coastal regions and open Atlantic Ocean, and FDOM is frequently enriched during upwelling events in the Baltic Sea.
Even though there are many studies that have documented the enrichment in DOM (e.g. amino acids, carbohydrates) and inorganic nutrients in the SML relative to the SSW (Orellana et al., 2011; Chen et al., 2016), the differences in organic matter composition between the SML and SSW, the different enrichment factors of DOM in the SML between the coastal regions and the off-shore regions, and how photochemical degradation activities regulate DOM concentration in the SML need more thorough discussion. Here, we investigated the concentration and composition of DOM in the SML relative to the SSW and the responses of DOM to photoexposure. We hypothesised that the photochemical reactions and enrichment processes could influence the composition difference of DOM between the SML and the SSW, and greater solar exposure in the SML than in the SSW would enhance the mineralisation of DOM. To test these hypotheses, our study was designed to answer the following questions. (1) What is the differences in optical characterisation of DOM between the SML and the SSW? (2) Are the enrichment factors (EFs) of DOM the same between the coastal regions and off-shore regions? (3) How will photochemical degradation processes affect DOM composition in the SML and the SSW? We, therefore, compared the optical properties of DOM between the SSW and the SML, as well as EFs of CDOM, FDOM components, dissolved organic carbon (DOC), chlorophyll a (Chl a), nutrients and bacterial abundance from the coastal waters to open ocean in the eastern marginal seas of China (including the East China Sea (ECS) and the Yellow Sea (YS)) during spring of 2017 and 2019, summer of 2018, and winter of 2019; discuss how the composition of accumulated DOM was affected by environmental conditions (wind speed and salinity) within the SML; and conducted photoexposure experiments to compare photochemical degradation processes of DOM between the SML and the SSW.
2.1 Study area
Four cruises were conducted during the four seasons, specifically, from 27 March to 15 April 2017 (R/V Dong Fang Hong 2), 26 June to 19 July 2018 (R/V Dong Fang Hong 2), March 2019 (R/V Zheyu No. 2) and 28 December 2019 to 16 January 2020 (R/V Dong Fang Hong 3). The station locations are shown in Fig. 1. In spring, summer and winter, SML samples were collected in the YS and the ECS, which are shallow seas located almost entirely on the continental shelf in the western Pacific Ocean where there is strong interaction between land and sea.
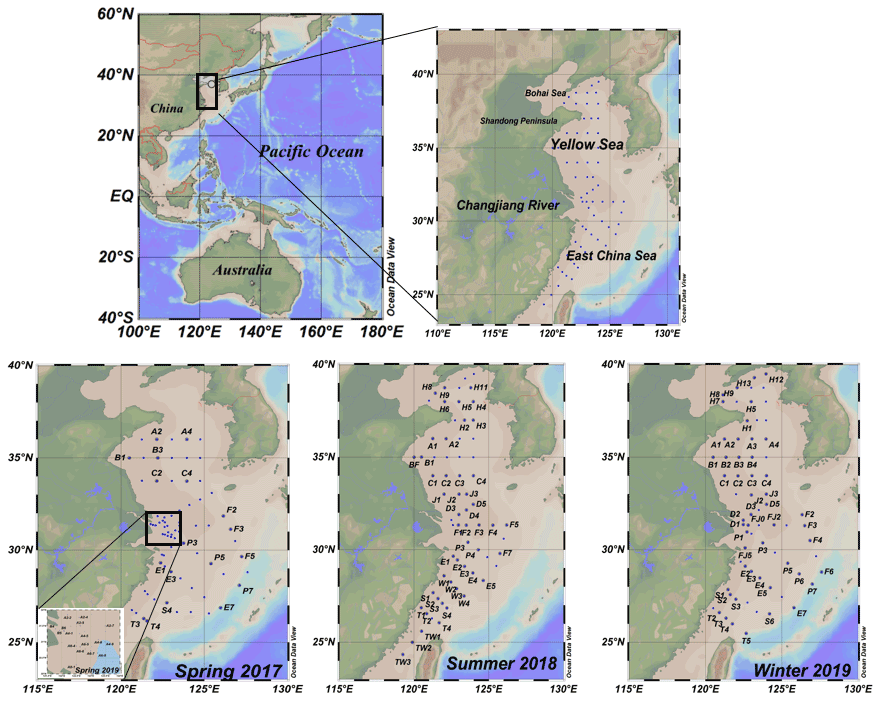
Figure 1Map of sampling stations.
2.2 Sampling
We collected 220 paired SML and SSW water samples. SSW samples were collected at 2–5 m depth using 24 × 10 L Niskin bottles mounted on a rosette equipped with a conductivity–temperature–depth (CTD) profiler. The SML samples were collected using the screen sampling technique (Chen et al., 2016; Garrett, 1965) and were taken directly from the ship's bow when conditions were calm. A screen sampler with a 1.6 mm mesh of stainless steel wire on a 40 cm × 40 cm stainless steel frame was used. The SML samples were collected in 500 mL brown sample bottles. The screen was held level and dipped into the sea surface, moved laterally in order to sample from an undisturbed film, and then withdrawn slowly from the surface. Repeated dipping (11 times, 600 mL) was conducted until the desired volume was collected (the depth of the SML sample is nearly 300–1000 µm). The screen method is often applied during field studies because of its relatively short sampling time and large sample volume compared to other techniques (Momzikoff et al., 2004; Chen et al., 2016). Immediately after collection, samples were filtered using 0.7 µm glass fibre filters (GF/F, Whatmann) and the filtrates were transferred to 60 and 40 mL brown glass bottles (pre-cleaned and pre-combusted) for later CDOM and DOC analyses. All samples were frozen (−20 ∘C) and protected from light, and upon arriving at the land laboratory, they were analysed as soon as possible. Sea-surface temperature and salinity were obtained from a Seabird 911 CTD rosette. Meteorological data (e.g. wind speed and air temperature) were recorded simultaneously by a ship-borne weather instrument (Li et al., 2019).
2.3 Photoexposure experiment
SSW and SML water samples were collected in July 2018 at stations A3, BF and H10, as well as D2 and F6, located in the YS and the ECS, respectively. Samples (SSW: 2 L; SML: 500 mL) were immediately passed through 0.22 µm PES filters (Pall Corp. Port Washington, NY, USA) to remove the majority of bacteria, placed in acid-washed and pre-combusted brown glass bottles, and stored at 4 ∘C. Similarly, filtered samples from each site were placed in five 80 mL optically transparent quartz tubes (acid-washed and pre-combusted) and sealed without headspace or air bubbles to measure the effect of light exposure. The quartz tubes were positioned on their sides under the irradiation source to maximise the exposure of the sample; the water depth in each tube was 5 cm (i.e. the diameter of the tube). Both sets (SML and SSW) were irradiated for 6, 12, 24, 50 and 88 h (25 ∘C) in a GLZ-C quantum sensor (Top Cloud-Agri Instrument, Zhejiang, China) solar simulator. All samples for DOC concentration measurements were acidified to approximately pH 2.0 with high-purity HCl and analysed within 7 d, and absorbance spectra and fluorescence excitation emission matrices (EEMs) were run on non-acidified samples within 3 d of sampling (4 ∘C and dark).
2.4 Analytical measurements
Determination of the CDOM absorption coefficient
Absorption spectra were determined using a UV–visible spectrophotometer (UV-2550 bi-channel; Shimadzu, Tokyo, Japan) equipped with two 10 cm path-length quartz cuvettes. Sample absorbance was automatically corrected for the absorbance of Milli-Q water. Absorbance scans ranged from 200 to 800 nm, with a spectral resolution of nanometres. The absorption coefficient of CDOM was calculated according to Eq. (1):
where A(λ) is the absorbance at wavelength λ, and r is the path length of the quartz cuvette in metres.
The spectral slope of the CDOM absorption curve (S) was calculated according to a non-linear regression over the 275–295 and 350–400 nm wavelength range, according to
where α(λ) is the absorption coefficient at wavelength λ, α(λ0) is the absorption at the reference wavelength λ0 of 440 nm, S is the spectral slope, and K is a background parameter that accounts for baseline shifts or attenuation due to factors other than CDOM. S was measured in the wavelength ranges of 275–295 nm (S275−295, nm−1) and 350–400 nm (S350−400, nm−1). S275−295 is used to characterise DOM, with high values generally indicative of low-molecular-weight DOM that are linked to photochemical modification (Helms et al., 2008; Ortega-Retuerta et al., 2009). The spectral slope ratio (SR) was defined as the ratio of the two spectral slopes, S275−295 to S350−400. SR is also a sensitive indicator of photochemically induced changes in the molecular weight within the CDOM pool, with increases in SR suggesting stronger photochemical degradation (Helms et al., 2008; Ortega-Retuerta et al., 2009). We used the absorption coefficient at 254 nm (a(254)) to determine the concentration and distribution of CDOM in the SML from the eastern marginal seas of China. The specific UV absorbance (SUVA254) can be used to measure aromaticity (Weishaar et al., 2003) and molecular weight (Chowdhury, 2013) of DOM, with higher values generally indicative of higher aromaticity. SUVA254 is calculated by dividing the absorbance at 254 nm by DOC.
EEMs and determination of the CDOM fluorescence index
EEMs were obtained using a F-4500 fluorescence spectrophotometer with a 1 cm quartz cuvette (Shimadzu) (Hoge et al., 1993). The emission spectra were scanned every 5 nm from 250 to 550 nm and at the excitation wavelengths between 200–400 nm at 5 nm intervals, with 5 nm slit widths for the excitation and emission modes. The FL Toolbox, which was developed by Wade Sheldon (University of Georgia) for MATLAB, was used to remove the Rayleigh and Raman scattering peaks using the Delaunay triangulation method (Zepp et al., 2004). The fluorescence intensities of the samples were corrected with Milli-Q water blank EEMs and then normalised to the water Raman integrated area maximum fluorescence intensities (Ex and Em = 350 nm and 365–430 nm, 5 nm bandpass) (Coble et al., 1998; Singh et al., 2010). Raman units (RU) (Stedmon et al., 2007; Singh et al., 2010) were used as the units for the Raman peak areas of water when the excitation wavelength of 350 nm was used for correction. EEMs were modelled using PARAFAC in MATLAB 7.5 with the DOMFluor toolbox (Stedmon and Bro, 2008).
where Xijk is the fluorescence intensity of the ith sample at the kth excitation and jth emission wavelengths, ain is directly proportional to the concentration (scores) of the nth fluorophore in the ith sample, bjh and ckn are the estimates of the emission and excitation spectra (loadings) of the nth fluorophore at wavelengths j and k, respectively, F is the number of components (fluorophores), and εijk represents the unexplained variability of the model (Singh et al., 2010). Split-half analysis validation was used to determine the number of fluorescent components. The fluorescence intensity of each fluorescent component was evaluated (Fig. S2, Supplement Table S1).
Determination of DOC, chlorophyll a, heterotrophic bacterial abundance, dissolved oxygen and other parameters
Concentrations of DOC were determined using the Shimadzu TOC-V CPH total organic carbon analyser with an injection volume of 80 µL. The accuracy of the test was ensured by measuring a deep seawater reference (Hansell Laboratory, University of Miami) every 10 samples. Two forms of reference water have been developed for DOC analysis. Deep-ocean water, collected at 2600 m in the Sargasso Sea and containing biologically refractory DOC, and low-carbon water for testing instrument blanks are available to the U.S. and international communities of aquatic chemists (Hansell, 2013; measurement and analytical errors <19 %). The Chl a concentration was determined by a fluorescence spectrophotometer (7200-000, Turner Designs, CA) after extraction in 90 % acetone based on the procedure of Parsons et al. (1984). Dissolved oxygen (DO) was determined by iodination using the Winkler titration method (Carpenter, 1964), the endpoint was determined using starch as a visual indicator. Salinity and temperature data were collected in situ by a conductivity–temperature–depth sensor. All phytoplankton samples were enumerated in triplicate according to the Specification for Oceanographic Survey (State Bureau of Technical Supervision Bureau, 1992). Nutrient species concentrations were determined using an automatic analyser (QuAAtro, Seal Analytical, Germany) (Grasshoff et al., 2007). All phytoplankton samples were enumerated in triplicate according to the Specification for Oceanographic Survey (State Bureau of Technical Supervision Bureau, 1992). Heterotrophic bacterial abundance was measured by flow cytometry (Beckman Coulter FC500-MPL) as described by Marie et al. (1997).
Enrichment factors
The enrichment factor (EF) in the SML is defined as follows:
where CM is the concentration of any substance in the SML, and CS is its concentration in the SSW. If the EF of a substance is greater than 1.0, that substance is considered enriched, and if it is less than 1.0, it is considered depleted (Chen et al., 2016).
2.5 Statistical analyses
The correlation coefficient (R) and probability (P) values were used to evaluate the goodness-of-fit. The correlation matrix, analysis of variance and principal components analysis were conducted with SPSS version 18.0 (SPSS Inc., Chicago, IL, USA) to determine the possible relationships between the DOM parameters and environmental factors. A P value ≤ 0.05 was considered significant. Regression analyses between the optical parameters of DOM and several biogeochemical parameters in the SSW and the SML samples were performed in Table S1 and Table S2, respectively.
3.1 Distribution and chemical characterisation of DOM in the SSW of the eastern marginal seas of China
The surface distributions of salinity, temperature, CDOM, DOC, Chl a and several optical parameters in the study area during spring, summer and winter are shown in Figs. S3 (SSW) to S4 (SML) (Supplement). There was a strong south-to-north temperature gradient, with warmer waters in the ECS and cooler waters in the YS. Lower salinities were observed in the Changjiang Estuary and coastal waters. The lowest mean wind speed was observed in the summer of 2018 (Table 2). In spring and summer, the bacterial abundances were lower in the YS (spring mean concentration: 2.26 × 10⁸ cells L−1; summer mean concentration: 3.79 × 10⁸ cells L−1) than in the ECS (spring mean: 2.98 × 10⁸ cells L−1; summer mean: 7.64 × 10⁸ cells L−1), indicating that the warmer southern ECS had stronger biological activity in the SSW.
The a(254) value ranged from 1.08 to 19.28 m−1 in the SML and from 0.82 to 14.23 m−1 in the SSW during these three seasons. a(254) values in the Changjiang Estuary (spring: station D1 (4.13 m−1); summer: station D2 (3.98 m−1); winter: station D1 (3.14 m−1)) and the northern YS (spring: station A2 (4.26 m−1); summer: station H11 (5.37 m−1); winter: station H12 (5.95 m−1)) were generally higher than other stations. CDOM absorption values and DOC concentrations were decreased from the inshore to the off-shore stations (Fig. S3c–d). There were significantly negative linear correlations between salinity and a(254) in all cruises in the SSW (p<0.01, Fig. 3), especially in the ECS, implying that freshwater run-off and seawater mixing played a more important role in determining CDOM distributions in the SSW. The strongest negative linear relationship observed between salinity and a(254) was observed in winter when the influence of terrestrial input in this study region was maximal. In addition, SUVA254 ranged from 0.51 to 8.39 L mg C−1 m−1 in the SML. In comparison with the SML, the SSW exhibited lower variability in SUVA254 values from 0.63 to 5.39 L mg C−1 m−1, with higher values at the northern YS stations and Changjiang Estuary coastal stations (Fig. S3k). According to the SUVA254 trends observed by Massicotte et al. (2017), the DOM compositions we observed in the SSW of the Changjiang Estuary ecosystem were more similar to the DOM measured in freshwater ecosystems than in the ocean. SUVA254 underwent a sharp decrease from the Changjiang Estuary ecosystem to the southeastern ECS, suggesting that aromatic and/or highly conjugated DOM moieties were degraded along the aquatic continuum from the Changjiang Estuary to the open ocean. Higher S275−295 values were also observed in some off-shore stations (Fig. S4i). These comparisons showed that the DOM pools of the Changjiang Estuary contained molecules that were more high molecular weight (HMW) DOM and contained more aromatic compounds, and CDOM in the SSW of the southeastern ECS, which was derived predominantly from an autochthonous origin (phytoplankton production and bacterial activity), clearly showed the presence of organic matter freshly released into the sea (Yang et al., 2020). The details of mixing behaviour and biological and photolytic degradation of dissolved organic matter in the East China Sea and the Yellow Sea were discussed in our previous paper (Yang et al., 2020).
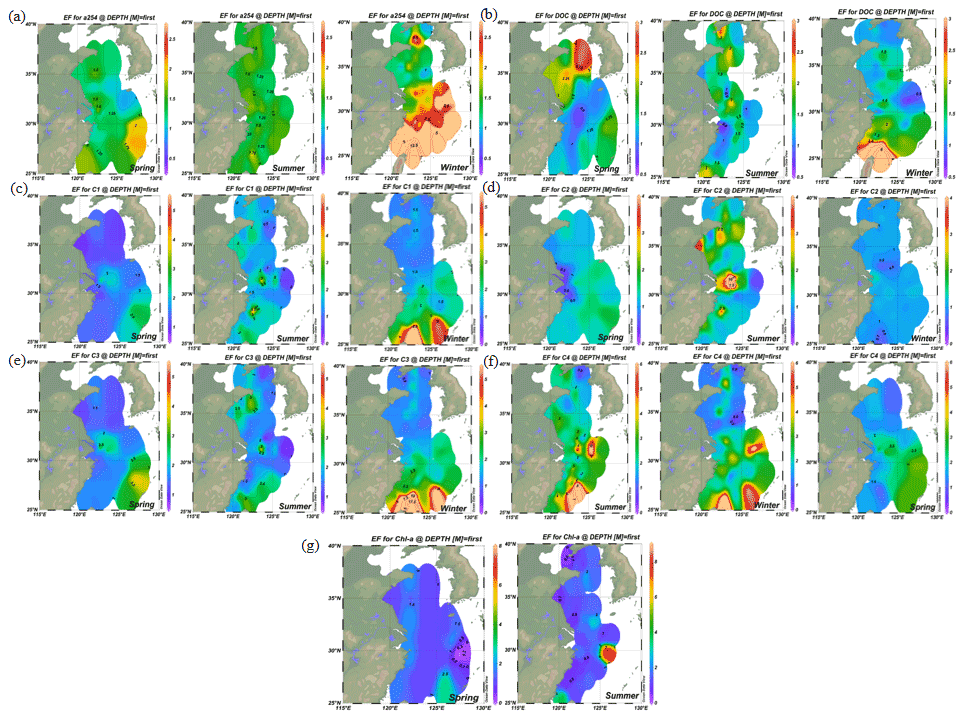
Figure 2Distributions of enrichment factors of CDOM, DOC, Chl a and four fluorescence components in the surface microlayer water during spring, summer and winter. Increasing DOM yields were significant in coastal regions in all seasons, but the higher enrichment factors (EFs) were more pronounced in off-shore regions.
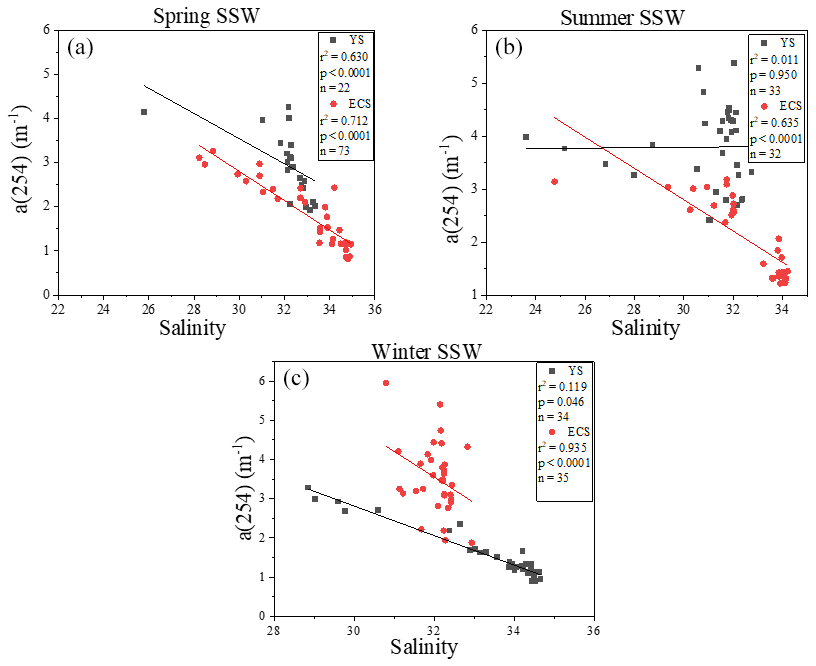
Figure 3Relationships between a(254) and salinity in the sub-surface water (SSW) in the East China Sea (ECS) and the Yellow Sea (YS) during spring, summer and winter.
3.2 Fluorescence signature and factors controlling the composition of FDOM components in the SSW and the SML
FDOM properties can be used as the sensitive indicator of DOM processing and water mass. Four fluorescent components were identified by PARAFAC analysis with the DOM Fluor toolbox in MATLAB 7.5 (Stedmon and Bro, 2008), hereafter named C1, C2, C3 and C4 (Fig. S2). The humic-like C1 and C3 were categorised as two traditional types of humic-like fluorescent components (Coble, 1996). C1 had primary fluorescence excitation and emission peaks at 345 and 455 nm, respectively, which are similar to terrestrial humic-like fluorophores in the visible region (peak C) (Osburn et al., 2012). Relative to C1, the fluorescence of C3 was blue-shifted and had fluorescence peaks at 385 nm emission and 315 nm excitation. The microbial humic-like component had a relatively shorter emission peak wavelength compared to the terrestrial humic-like PARAFAC components previously identified in the open ocean (Catala et al., 2015). C2 exhibited maxima at 255 nm/310 (375) nm, which could be considered tyrosine-like fluorescence (Stedmon et al., 2003) and attributed to autochthonous and/or microbial FDOM. C4 had an excitation range of 280 nm with an emission peak at 335 nm, which corresponded to peak T of the amino-acid-like fluorescence of tryptophan, likely derived from in situ primary autochthonous substances and other fresh biological sources (Coble, 1996). The tryptophan-like C4 and the humic-like C1 and C3 in the SSW were all negatively correlated with salinity (P<0.01, Table S1) but increased with the increasing DO level. These suggested that water mixing and microbial activity were important factors in determining geographical distributions of FDOM in the SSW (Breitburg et al., 2018; Yamashita et al., 2017; Galgani and Engel, 2016). Moreover, the geographical distribution of humic-like C1 and protein-like components was more similar to that of the Chl a concentration in the SML (Fig. 4a, b, d). Such relationships suggested that the production of protein-like and humic-like FDOM is associated with phytoplankton production and decay in the SML.
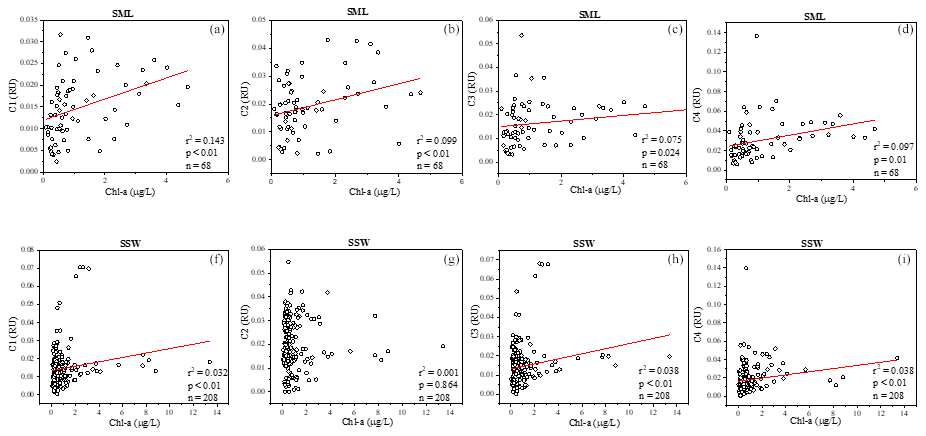
Figure 4Relationships between a(254), four fluorescence components and Chl a in the sea-surface microlayer (SML) (a–d) and in the SSW (f–i).
FDOM enrichment in the SML of all stations ranged between 0.5 and 11 (n=225), and FDOM was more frequently enriched (C1: 89.6 %; C2: 73.2 %; C3: 91.8 %; C4: 93.4 % of all samples) than CDOM. The fluorescence intensity of the components in the SML samples decreased in the following order: tryptophan-like > tyrosine-like > terrestrial humic-like > marine humic-like; whereas those in the SSW samples decreased in the following order: tyrosine-like > tryptophan-like > marine humic-like > terrestrial humic-like. The tryptophan-like component (C4) was mostly enriched in the SML samples with a median EF = 2.2 and a range from 0.2 and 8.0. The EF of C4 was clearly higher than other components in all seasons (Fig. 6b), especially in summer, and the FDOM composition in the SML revealed a relatively higher proportion of autochthonous tryptophan-like FDOM than the SSW. It has also been broadly recognised that tryptophan-like C4 in the particulate fraction is related to recent primary production (Brym et al., 2014; Yamashita, 2014) and that phytoplankton excrete tryptophan-like fluorophores (Romera-Castillo et al., 2010). Together, as already emphasised previously, the variation observed for FDOM can be more related to that of Chl a in the SML, and these observations suggested that the DOM enriched in the SML was made up of a relatively higher proportion of marine autochthonous DOM than the SSW.
3.3 DOM and biogenic molecules accumulation in the SML
Up to 88 % of our CDOM samples were enriched in the SML, with the median EF for a(254) of 1.3, ranging between 0.4 and 6.7 (Fig. 2). Concentrations of CDOM, FDOM, nutrients, bacterial abundance and Chl a in the SML were correlated with their respective SSW concentrations (Fig. 5), demonstrating that transport from the SSW to the SML is an important pathway. Furthermore, the relatively higher CDOM absorption enrichment values in the SML were found at longer wavelengths (Fig. 6a): EF of a(355) > EF of a(254). Marine DOM usually has a higher absorption slope than terrestrial DOM, and the higher-slope (no matter if it is S320−412 or S275−295) marine production of DOM had the largest influence on the CDOM absorption properties in the longer wavelength range (Danhiez et al., 2017).
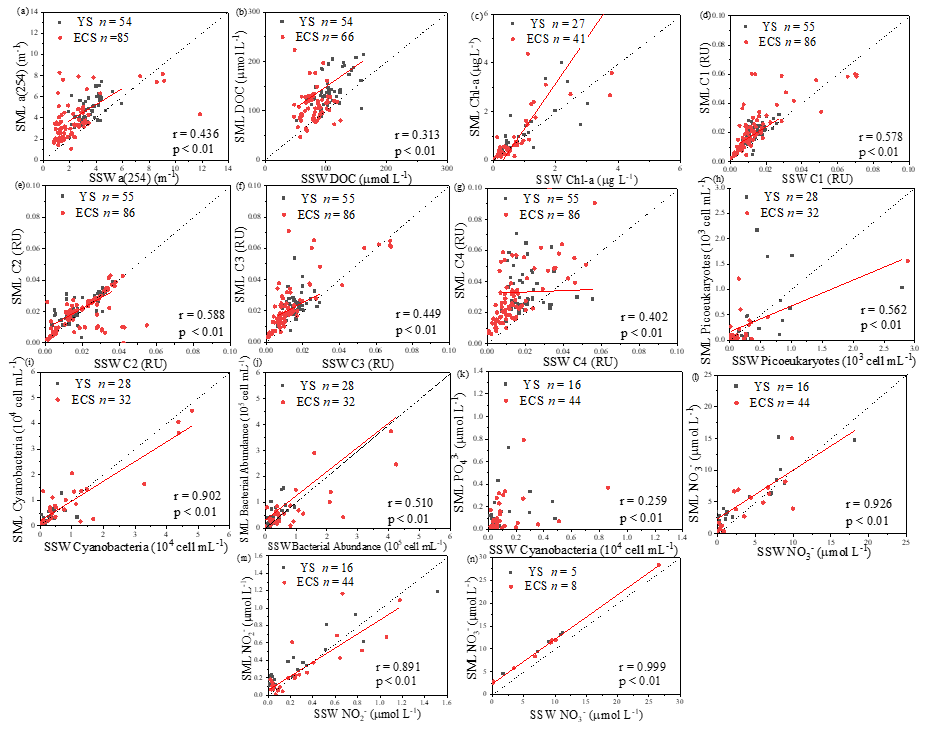
Figure 5Correlations between the microlayer CDOM, DOC, Chl a, four fluorescence components concentrations, cyanobacteria, phytoplankton biomass, nutrients and bacterial abundance, as well as their sub-surface water concentrations. The dashed lines correspond to the 1:1 lines, and the full lines are the regression models. (All DOM spectroscopic parameter samples were analysed in spring, summer and winter; Chl a was determined in spring, summer and winter; cyanobacteria, phytoplankton biomass, nutrients and bacterial abundance were determined in spring and summer.).
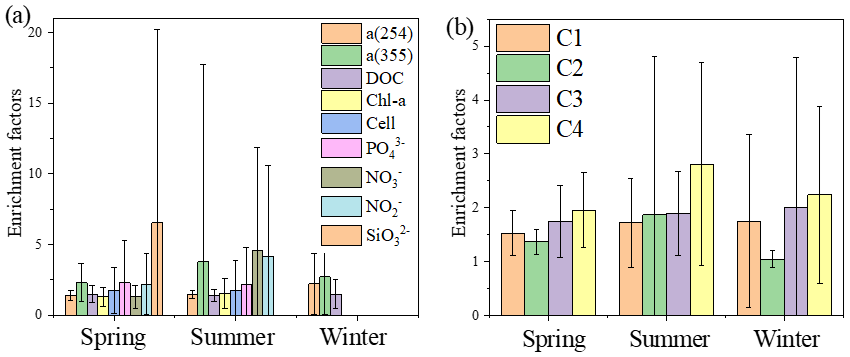
Figure 6Mean enrichment factors of aCDOM (254 and 355 nm), DOC, Chl a, nutrients (PO, NO, NO, SiO) and four fluorescence components during spring, summer and winter.
Galgani and Engel (2016) also observed that amino-acid-like fluorophores were highly enriched in the SML, not only due to their amphiphilic properties but also due to their local production in the SML. Therefore, the marine local production might significantly affect the composition of DOM in the SML. Additionally, the nutrients showed significantly higher EFs (NO: 3.41 ± 6.08, n=41; NO: 3.57 ± 5.54, n=52; PO: 2.13 ± 2.74, n=68; and SiO: 6.53 ± 13.67, n=13) than biological and DOM parameters in the SML. The strong correlation between the SML and SSW concentrations of NO, NO and SiO (Fig. 5) showed that the similar fundamental drivers are probably at work in both compartments for these nutrients. For example, dissolved substances, particles and microorganisms were brought to the interface by simple diffusion, rising bubbles (Jarvis, 1967), convection, and upwelling from sediments and sub-surface water, and at the same time, the microlayer is also a sink for fallout from the atmosphere (Duce et al., 1976). In addition, we also observed the significant positive relationship between a(254) and Chl a (R=0.662, P<0.01) in the SML during spring, as well as the positive relationship between the EF of PO and the EF of Chl a (R=0.319, P=0.01, Table 3). These observations indicated that the spatial variation in CDOM concentrations were related to Chl a in the SML. The enrichment of inorganic nutrients would be an important factor influencing the production and composition of phytoplankton-produced DOM (Carlson and Hansell, 2003) in the SML. Therefore, phytoplankton growth, primary productivity rate, biological activity and marine autochthonous DOM production would all be enhanced by the enriched nutrients in the SML.
3.4 Wind speed influencing the enrichment of DOM optical properties
The wind speeds during our observations ranged from 0.2 to 14.9 m s−1. We divided them into three different wind regimes: low (0.0–2.0 m s−1), moderate (2.0–10.0 m s−1) and high (10.0–14.9 m s−1). Although the EFs of DOC and Chl a were negatively correlated with wind speed (DOC: P=0.002; Chl a: P=0.042), the EFs of CDOM and FDOM were not. During the low-wind regime, no significant relationships were apparent between wind speed and EFs of either CDOM or FDOM, and CDOM and FDOM were consistently enriched, with EFs ranging from 1.0 to 2.2 and a mean a(254) EF value of 1.3 (n=20). However, the EFs during moderate winds had larger variability and ranged from 0.9 to 14.5, with a mean EF value of 1.6 (n=143), and during high winds they ranged from 0.6 to 1.8, with a lower mean EF value of 1.1 (n=18). In addition, depleted levels of CDOM (EF < 1) occurred at frequencies of 5.6 %, 9.1 % and 20.0 % during low-, moderate- and high-wind regimes, respectively. Therefore, although lower wind speeds and ascending bubbles might further promote the transportation of organic materials from the underlying waters, DOM enrichments were still observed at wind speeds up to > 10 m s−1. Reinthaler et al. (2008) also reported that higher enrichment was found at higher wind speeds. During moderate- to high-wind regimes, breaking waves not only can disrupt the surface film and physically drive DOM back into the bulk water but also facilitate the formation of the SML as rising bubble plumes transported DOM to the surface, resulting in wider ranges of EFs (Frew et al., 2004). Higher wind speed does enhance mixing (Reinthaler et al., 2008), which can arguably favour transport of nutrients and DOM from the SSW equally (Wurl et al., 2011). Although wind speed appears to play an important role in the enrichment of surface-active DOM, the chemical composition of the SML influences its stability. For example, enrichments of sulfate half-ester groups in the SML (Wurl and Holmes, 2008) could increase stability because these groups can influence the intrinsic viscosity of marine polymers (Nichols et al., 2005), and sulfur-containing algal carbohydrates are less soluble and hydrolysable (Kok et al., 2000). Sampling needs to be performed on the leeward side of the boat with the boat moving into the wind to avoid contamination. However, some disturbance of SML integrity was produced by the ship's movement and potential contamination at high wind speeds and tidal mixing. It has long been known that the SML reforms rapidly following physical disruption (Dragcevic and Pravdic, 1981). Rapid SML recovery occurs because SML organics dispersed by breaking waves readily reabsorb to the surfaces of rising bubbles generated by the same breaking waves (Woolf, 2005). Enrichment processes and biochemical processes of organic substances in the marine environment are all likely to be the more important contributors of DOM to the SML in our study regions.
Table 1Spectral characteristics of the four fluorescent components identified by the PARAFAC modal in this study compared with those preciously identified.

Table 2Average temperature, salinity, wind speed, CDOM a(254), DOC, chlorophyll a (Chl a), dissolved oxygen (DO), S275−295, SR and SUVA254 of the SSW and SML in the YS and ECS during spring, summer and winter.

Table 3Correlation coefficients between EFs of DOM optical properties, Chl a, DOC, PO, NO, NO, SiO, cyanobacteria, picophytoplankton and bacterial abundance.

a Correlation is significant at the 0.01 level (two-tailed). b Correlation is significant at the 0.05 level (two-tailed).
3.5 Photochemical degradation of DOM in the SSW and the SML
Photobleaching is one of the major mechanisms determining the geographical distributions of chromophoric and fluorescent DOM in the ocean (Helms et al., 2008; Brinkmann et al., 2003; Siegel et al., 2005). The average SUVA254 values in SSW were generally higher than those in the SML in our study regions (SSW: 2.45 ± 0.91 L mg C−1 m−1 vs. SML: 2.39 ± 1.34 L mg C−1 m−1), and the most obvious distinction happened in summer (Table 2). These indicated that although CDOM concentration in the SSW was lower than that in the SML, CDOM in the SSW had a higher degree of aromaticity compared to the SML. Thus we performed photochemical incubation experiments to confirm whether photochemical reactions influenced the differentiated aromaticity and photoreactive features of DOM between the SML and the SSW.
After 88 h of exposure, the a(254) values were only 49.6 %, 45.5 %, 42.1 %, 41.8 % and 37.0 % of the initial values at stations A3, BF, D2, F6 and H10 in the SSW and 72.5 %, 42.4 %, 42.6 %, 49.0 % and 44.0 % of the initial values at stations A3, BF, D2, F6 and H10 in the SML, respectively. Overall, a(254) and SUVA254 decreased by 49.9 ± 12.8 % and 43.0 ± 15.5 %, respectively, in the SML and by 56.8 ± 4.7 % and 56.0 ± 10.2 %, respectively, in the SSW. Therefore, stimulated solar UV exposure caused a larger decrease in DOM absorbance in the SSW than the SML (Fig. 7). The relatively rapid decrease in SUVA254 in the SSW indicated a more rapid conversion of DOM to less humic-type materials than in the SML. Although photodegradation causes CDOM absorption to decrease, DOC is not sensitive to photodegradation in our photodegradation experiments (Fig. 7), implying that the light exposure preferentially removed the coloured DOM rather than the non-coloured DOM (Bittar et al., 2015). Approximately 65 % of FDOM was lost during the irradiation experiment, except in the case of the tyrosine-like C2 from the SML at station H10, which increased slightly. Photoproduction of tyrosine-like components has been previously reported by Zhu et al. (2017), who suggested that the photochemical degradation of CDOM contributed to the release of small amounts of tyrosine-like fluorophores. The tryptophan-like C4 and humic-like C1 and C3 were more photodegradated in the SSW than in the SML (Fig. 7c, e, f). For example, C1, C3 and C4 show a marked decrease in the SSW at the off-shore station F6. Because of the origin of CDOM at station F6 being remote from the direct terrestrial influence, the majority of CDOM at station F6 was thought to be a by-product of net primary production. The present results showed that a large fraction of the total CDOM in the SSW at the off-shore station F6 is still potentially sensitive to photo-oxidation. As already referred to previously, CDOM in the SSW showed higher SUVA254 values and higher percentages of humic-like DOM than in the SML. Therefore, the photochemically mediated shifts in DOM in the SSW were more pronounced than those in the SML in our incubation experiments in terms of both absorption and fluorescence values.
This heterogeneity in the EFs and photochemical reactivities of FDOM components can be related to the chemical and structural nature, such as molecular weight, aromaticity or humification of FDOM enrichment processes. Hydrophilic, carboxylic acid-bearing DOM moieties are preferentially degraded by simulated sunlight (Brinkmann et al., 2003). The largest fractions of photolabile DOM are made up of aromatic carbon rings or high double-bond-equivalent molecules (Kujawinski et al., 2004; Gonsior et al., 2009). The humic-like C1 and C3, both of which exhibited significantly positive relationships with SUVA254 (<0.001, Table 1) and showed higher aromaticity, were more prone to photochemical degradation (Fig. 7c, e and f). The tyrosine-like C2, as compared to other protein-like compounds, is generally considered more labile and susceptible to bacterial cycling and rapid consumption by microbiota (Medeiros et al., 2015). The SML experiences the most intense solar radiation, especially ultraviolet (UV) light (Obernosterer et al., 2005). Photochemical degradation may, therefore, be a sink for aromaticity fluorescent components in the SML and be a source for the tyrosine-like C2. In addition, Blough (1997) discovered that photochemical production rates in the SML should lead to the more rapid oxidative turnover of materials at the interface and potentially to reactions and processes not observed in bulk waters. Therefore, differences in SUVA254 values and photoreaction behaviour between the SSW and the SML may also reflect that DOM in the SML was already photobleached, which resulted in the decrease of DOM aromaticity, and CDOM in the SSW appeared to be more susceptible to photochemical degradation than CDOM in the SML. Together, photo-irradiation has a significant influence on the accumulation of protein-like DOM and depletion of aromatic organic compounds in the SML, and organic carbon might have undergone a more rapid cycling in the SML than the SSW.
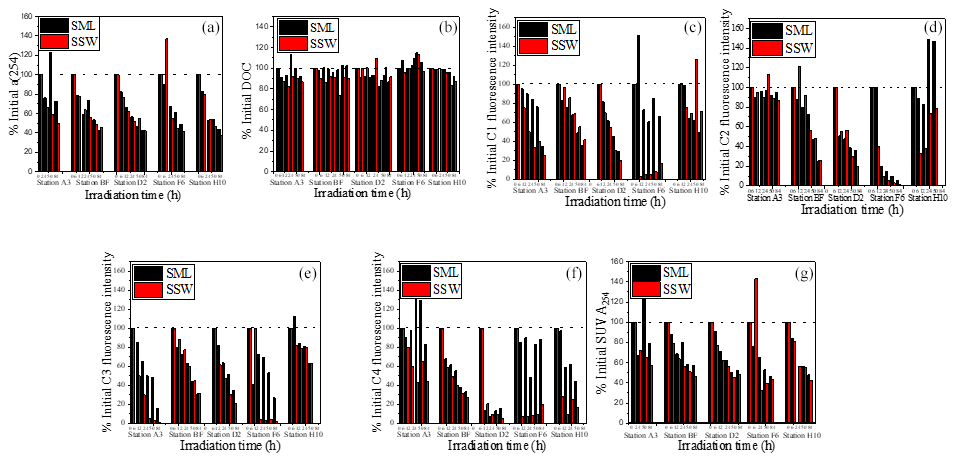
Figure 7Changes in ratios of a(254), DOC, SUVA254 and four fluorescence component intensities to initial values for both SML and SSW samples.
3.6 Variations in the enrichment factors of CDOM, DOC and FDOM along the coastal regions to ocean
The concentrations of a(254) and DOC decreased from the coastal regions to the open ocean and decreased from the northern part of the sampling area (the YS) to the southern part of the sampling area (the ECS) in both the SSW and the SML (Figs. S3c–d and S4a–b). However, CDOM and FDOM were more frequently enriched in the ECS (CDOM: 93 % of all samples; FDOM: 72 %–94 % of all samples) than those in the YS (CDOM: 86 % of all samples; FDOM: 70 %–92 % of all samples). The higher EF values for CDOM, FDOM, DOC, Chl a, nutrients and cell were generally observed in the ECS (Fig. 2). Lower EFs and EFs <1, which indicate a depletion of CDOM in the SML, were usually observed at short distances from the coast (Fig. 2) with lower salinity. The salinity during our observations ranged from 23.6 to 35.1. Although CDOM and FDOM concentration negatively correlated with salinity, the EFs of CDOM and FDOM were weakly positively related to salinity (Fig. 8). The EFs of Chl a and nutrients were also higher in the southeastern ECS (Figs. 2 and S5), where sufficient light and higher temperatures combined to facilitate primary production and higher contributions of autochthonous materials to DOM. DOM in the SSW of the southern ECS was more dominated by marine autochthonous materials in our previous discussion (Yang et al., 2020). The Changjiang River discharges enormous amounts of N and P into the ECS (Liu et al., 2018), but phosphorus is generally the major limiting element for phytoplankton growth in the ECS (Liu et al., 2016). Thus the difference in EFs of CDOM and Chl a between YS and the ECS and between the coast and off-shore regions is likely due to the significant nutrient enrichment in the SML in the off-shore regions. In winter, we observed especially higher EF values for CDOM and FDOM in the southern ECS (Fig. 2a–f). With wind from the northwest (Weng et al., 2011), biologically essential trace elements and anthropogenic emissions are carried from the land and can enter the ocean via the SML by wet or dry deposition. The EFs of humic-like C1 and C3 were relatively high in winter (Fig. 6b) probably due to the input from atmospheric deposition during winter and the relatively low CDOM concentrations in bulk water. Atmospheric deposition of organic carbon and nutrients was found to peak in winter over the coastal ECS (Wang et al., 2019). We suggested that the EFs of CDOM and FDOM increased from the coastal regions to the open ocean and increased from the YS to the ECS, which was likely due to the enrichment of enough nutrients in the SML in the open ocean promoting phytoplankton biomass and DOM production.
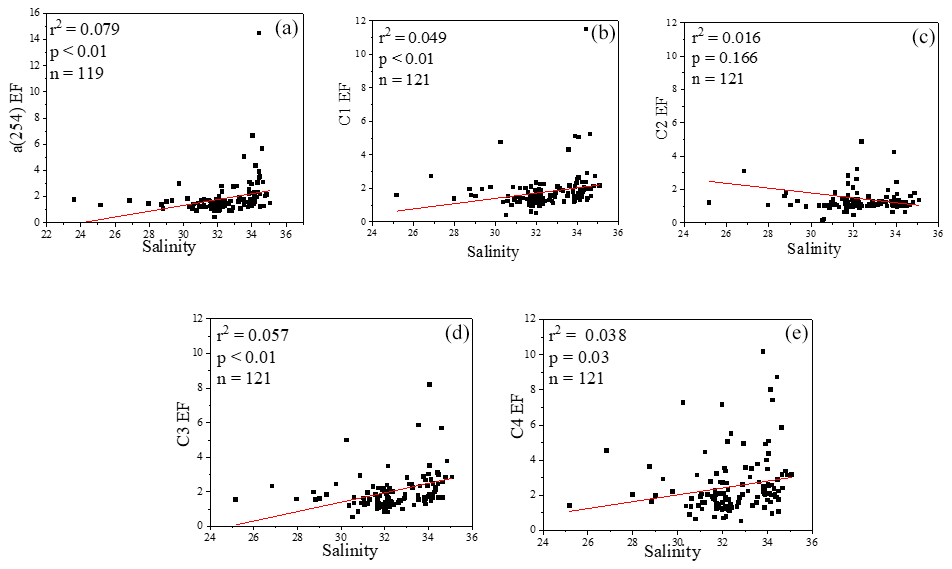
Figure 8Relationships between salinity and EFs of a(254), Chl a, DOC and four fluorescence components.
The SML is an aggregate-enriched biofilm environment with distinct microbial communities, where the diversity of microorganisms can differ significantly from those of underlying waters (Liss and Duce, 2005; Cunliffe et al., 2013), and the heterotrophic bacterial abundance in the SML was ∼ 7.5 fold greater than those in the SSW in the ECS during our spring cruise (Sun et al., 2020). Here, EFs showed a greater presence of bacteria and marine protein-like DOM in the SML than that in the SSW, while the protein-like DOM was linked to microbial utilisation and degraded faster than the humic-like substances (Yang et al., 2017; Jørgensen et al., 2011). Therefore, compared to coastal waters that have larger terrestrial DOM and nutrients inputs, CDOM showed higher EFs in off-shore regions where DOM in the SSW is mostly of marine autochthonous origin with higher temperatures and stronger biological activity. The significantly higher abundance of cells, phytoplankton, nutrients and protein-like DOM in the SML supported microbial activities and further contributed to the local release of marine extracellular DOM directly from microbes in the SML in the off-shore regions. Exposure to higher light intensities (summer) obviously enhances mineralisation of DOM in the SML, and relatively less photochemical degradation in SSW could result in lower percentages of aromatic DOM in the SML than the SSW. We concluded that SML CDOM dynamics can be expressed as a complex balance among enrichment process, primary production and photochemical destruction. Thus, higher EFs of DOM in the SML in off-shore regions are likely supported by a favourable combination of (1) deposition and accumulation of amphiphilic compounds, (2) importance of bubbles for upward transport of DOM and enrichment in SML, and (3) new production of DOM within the SML as a consequence of higher nutrient enrichment and the primary production.
This study has provided the first data set that considers the distributions of CDOM, FDOM, DOC, Chl a, nutrients and bacterial abundances in the SML and SSW of the ECS and the YS during spring, summer and winter. We have observed the CDOM distribution-related variability in primary production in the SML. Furthermore, we have demonstrated that localised and stronger photochemical oxidation may be responsible for the decrease in the aromaticity of the DOM in the SML due to enhanced transformation or removal of terrestrial DOM, compared with the SSW. We also demonstrated that in off-shore seawaters away from terrigenous influence, the EFs of CDOM, DOC, FDOM and Chl a in SML tend to be higher in off-shore regions than those in coastal regions because of the relatively higher enrichment of nutrients which could enhance phytoplankton growth and promote plant production and DOM production in the SML. Multiple observations of spatial distributions, seasonal variations, chemical compositions and photochemical reactions of CDOM in the SML have supported the hypothesis that stronger enrichment and photochemical processes occur in the SML in the ocean, resulting in the relatively accelerated enrichment of more marine local production DOM in the SML than the SSW.
The source code used to generate figures and corresponding tables is available for download from our public repository: https://doi.org/10.6084/m9.figshare.19971278.v1 (Yang, 2022). More detailed information can be accessed by email request to the corresponding authors.
Most data used in this study are shown in the figures, tables and references. The distribution data from this study are publicly available at https://doi.org/10.6084/m9.figshare.19971278.v1 (Yang, 2022). More detailed data can be accessed by email request to the corresponding authors.
The supplement related to this article is available online at: https://doi.org/10.5194/bg-19-5251-2022-supplement.
LY participated in all cruises to collect and analyse samples, designed the incubation experiments and carried them out, and wrote the original draft. JZ helped design the experiments. GPY and AE reviewed and edited the draft. LY and JZ designed the experiments and revised the draft. GPY and AE gave suggestions for revisions.
The contact author has declared that none of the authors has any competing interests.
Publisher's note: Copernicus Publications remains neutral with regard to jurisdictional claims in published maps and institutional affiliations.
We thank the captains and crews of the R/V Dong Fang Hong 2, the R/V Dong Fang Hong 3 and the R/V Zheyu 2 for their assistance and cooperation during the investigation. We gratefully acknowledge Ya-Hui Gao (Xiamen University), Yu Xin (Ocean University of China) and Xiao-Hua Zhang (Ocean University of China) for providing the Chl a, nutrient, and bacterial abundance and picoplankton data, respectively.
This research has been supported by the National Key Research and Development Program (grant no. 2016YFA0601304), and the National Natural Science Foundation of China (grant nos. 41806093 and 491830534).
This paper was edited by Ji-Hyung Park and reviewed by Liyang Yang and one anonymous referee.
Aller, J. Y., Kuznetsova, M., Jahns, C. J., and Kemp, P. F.: The sea surface microlayer as a source of viral and bacterial enrichment in marine aerosols, J. Aerosol Sci., 36, 801–812, https://doi.org/10.1016/j.jaerosci.2004.10.012, 2005.
Bittar, T. B., Vieira, A. A. H., Stubbins, A., and Mopper, K.: Competition between photochemical and biological degradation of dissolved organic matter from the cyanobacteria Microcystis aeruginosa, Limnol. Oceanogr., 60, 1172–1194, https://doi.org/10.1002/lno.10090, 2015.
Blough, N. V.: Photochemistry in the sea-surface microlayer, in: The Sea Surface and Global Change, edited by: Liss, P. S. and Duce, R. A., Cambridge University Press, Oxford, UK, 383–424, https://doi.org/10.1017/CBO9780511525025.014, 1997.
Breitburg, D., Levin, L. A., Oschlies, A., Grégoire, M., Chavez, F. P., Conley, D. J., Garçon, V., Gilbert, D., Gutiérrez, D., Isensee, K., Jacinto, G. S., Limburg, K. E., Montes, I., Naqvi, S. W. A., Pitcher, G. C., Rabalais, N. N., Roman, M. R., Rose, K. A., Seibel, B. A., Telszewski, M., Yasuhara, M., and Zhang, J.: Declining oxygen in the global ocean and coastal waters, Science, 5, 359, eaam7240, https://doi.org/10.1126/science.aam7240, 2018,
Brinkmann, T., Sartorius, D., and Frimmel, F. H.: Photobleaching of humic rich dissolved organic matter, Aquat. Sci., 65, 415–424, https://doi.org/10.1007/s00027-003-0670-9, 2003.
Brym, A., Paerl, H. W., Montgomery, M. T., Handsel, L. T., Ziervogel, K., and Osburn, C. L.: Optical and chemical characterization of base-extracted particulate organic matter in coastal marine environments, Mar. Chem., 162, 96–113, https://doi.org/10.1007/s00027-003-0670-9, 2014.
Carlson, C. A., and Hansell, D. A.: The contribution of dissolved organic carbon and nitrogen to biogeochemistry of the Ross Sea, in: Biogeochemical Cycles in the Ross Sea, edited by: DiTullio, G. and Dunbar, R., AGU Press, Washington DC, 123–142, https://doi.org/10.1029/078ARS08, 2003.
Carpenter, J. H.: The Chesapeake Bay Institute technique for the Winkler dissolved oxygen method, Limnol. Oceanogr., 10, 141–143, https://doi.org/10.4319/lo.1965.10.1.0141, 1964.
Catala, T. S., Reche, I., Fuenteslema, A., Romeracastillo, C., Nietocid, M., Ortegaretuerta, E., and Alvarezsalgado, X. A.: Turnover time of fluorescent dissolved organic matter in the dark global ocean, Nat. Com., 6, 5986–5993, https://doi.org/10.1038/ncomms6986, 2015.
Chen, Y., Yang, G., Xia, Q., and Wu, G.: Enrichment and characterization of dissolved organic matter in the surface microlayer and subsurface water of the South Yellow Sea, Mar. Chem., 182, 1–13, https://doi.org/10.1016/j.marchem.2016.04.001, 2016.
Chowdhury, S.: Trihalomethanes in drinking water: Effect of natural organic matter distribution, Water SA, 39, 1–7, https://doi.org/10.4314/wsa.v39i1.1, 2013.
Coble, P. G.: Characterization of marine and terrestrial DOM in seawater using excitation-emission matrix spectroscopy, Mar. Chem., 51, 325–346, https://doi.org/10.1016/0304-4203(95)00062-3, 1996.
Coble, P. G.: Marine optical biogeochemistry: the chemistry of ocean color, Chem. Rev., 107, 402–418, https://doi.org/10.1002/chin.200720265, 2007.
Cunliffe, M., Engel, A., Frka, S., Gasparovic, B., Guitart, C., Murrell, J. C., and Wurl, O.: Sea surface microlayers: A unified physicochemical and biological perspective of the air–ocean interface, Prog. Oceanogr., 109, 104–116, https://doi.org/10.1016/j.pocean.2012.08.004, 2013.
Danhiez, F. P., Vantrepotte, V., Cauvin, A., Lebourg, E., and Loisel, H.: Optical properties of chromophoric dissolved organic matter during a phytoplankton bloom, Implication for DOC estimates from CDOM absorption, Limnol. Oceanogr., 62, 1409–1425, https://doi.org/10.1002/lno.10507, 2017.
Dragcevic, D. and Pravdic, V.: Properties of the seawater-air interface. 2. Rates of surface film formation under steady state conditions, Limnol. Oceanogr., 26, 492–499, https://doi.org/10.1016/0198-0254(81)91185-7, 1981.
Duce, R. A., Hoffman, G. L., Ray, B. J., Fletcher, I. S., Wallace, G. T., Fasching, J. L., Piotrowicz, S. R., Walsh, P. R., Hoffman, E. J., Miller, J. M., and Heffter, J. L.: Trace metals in the marine atmosphere: Sources and fluxes, in: Marine Pollutant Transfer, edited by: Windom, H. L. and Duce, R. A., 77–119, Lexington Books, Lexington, 1976.
Fellman, J. B., Hood, E., and Spencer, R. G. M.: Fluorescence spectroscopy opens new windows into dissolved organic matter dynamics in freshwater ecosystems: a review, Limnol. Oceanogr., 55, 2452–2462, https://doi.org/10.4319/LO.2010.55.6.2452, 2010.
Frew, N. M., Bock, E. J., Schimpf, U., Hara, T., Hausecker, H., Edson, J. B., and Jahne, B.: Air-sea gas transfer: Its dependence on wind stress, small-scale roughness, and surface films, J. Geophys. Res.-Ocean., 109, S17, https://doi.org/10.1029/2003JC002131, 2004.
Gabor, R., Baker, A., McKnight, D., Miller, M.: Fluorescence Indices and their Interpretation, in: Aquatic Organic Matter Fluorescence, edited by: Coble, P. G., Lead, J., Baker, A., Reynolds, D. M., and Spencer, R. G. M., Cambridge University Pres, 303–339, ISBN: 9781139897907, 2014.
Galgani, L. and Engel, A.: Changes in optical characteristics of surface microlayers hint to photochemically and microbially mediated DOM turnover in the upwelling region off the coast of Peru, Biogeosciences, 13, 2453–2473, https://doi.org/10.5194/bg-13-2453-2016, 2016.
Garrett, W. D.: Collection of slick-forming materials from the sea surface, Limnol. Oceanogr., 10, 602–605, 1965.
Gonsior, M., Peake, B. M., Cooper, W. T., Podgorski, D., D'Andrilli, J., and Cooper, W. J.: Photochemically induced changes in dissolved organic matter identified by ultrahigh resolution fourier transform ion cyclotron resonance mass spectrometry, Environ. Sci. Technol., 43, 698–703, https://doi.org/10.1021/es8022804, 2009.
Grasshoff, K., Kremling, K., and Ehrhardt, M.: Methods of Seawater Analysis, 3rd. Edn., 407–420, ISBN: 9783527613984, 2007.
Hansell, D. A.: Dissolved organic carbon reference material program, Eos Trans. Am. Geophys. Union, 86, 308–318, https://doi.org/10.1029/2005EO350003, 2013.
Hardy, J. T.: The sea surface microlayer: Biology, chemistry and anthropogenic enrichment, Prog. Oceanogr., 11, 307–328, https://doi.org/10.1016/0079-6611(82)90001-5, 1982.
Hardy, J. T. and Apts, C. W.: Photosynthetic carbon reduction: high rates in the sea-surface microlayer, Mar. Biol., 101, 411–417, https://doi.org/10.1007/BF00428138, 1989.
Helms, J. R., Stubbins, A., Ritchie, J. D., Minor, E. C., Kieber, D. J., and Mopper, K.: Absorption spectral slopes and slope ratios as indicators of molecular weight, source, and photobleaching of chromophoric dissolved organic matter, Limnol. Oceanogr., 53, 955–969, https://doi.org/10.4319/lo.2008.53.3.0955, 2008.
Hoge, F. E., Vodacek, A., and Blough, N. V.: Inherent optical properties of the ocean: retrieval of the absorption coefficient of chromophoric dissolved organic matter from fluorescence measurements, Limnol. Oceanogr., 38, 1394–1402, https://doi.org/10.4319/lo.1993.38.7.1394, 1993.
Jarvis, N. L.: Adsorption of surf ace-active material at the sea-air interface, Limnol. Oceanogr., 12, 213–221, https://doi.org/10.4319/lo.1967.12.2.0213, 1967.
Jørgensen, L., Stedmon, C. A., Kragh, T., Markager, S., Middelboe, M., and Søndergaard, M.: Global trends in the fluorescence characteristics and distribution of marine dissolved organic matter, Mar. Chem., 126, 139–148, https://doi.org/10.1016/j.marchem.2011.05.002, 2011.
Kieber, D. J., Mcdaniel, J., and Mopper, K.: Photochemical source of biological substrates in sea water: implications for carbon cycling, Nature, 341, 637–639, https://doi.org/10.1038/341637a0, 1989.
Kok, M., Schouten, S., and Sinninghe Damsté, J. S.: Formation of insoluble, nonhydrolyzable, sulfur-rich macromolecules via incorporation of inorganic sulfur species into algal carbohydrates, Geochim. Cosmochim. Ac., 64, 2689–2699, https://doi.org/10.1016/S0016-7037(00)00382-3, 2000.
Kujawinski, E. B., Del Vecchio, R., Blough, N.V., Klein, G. C., and Marshall, A. G.: Probing molecular-level transformations of dissolved organic matter: insights on photochemical degradation and protozoan modification of DOM from electrospray ionization Fourier transform-ion cyclotron resonance mass spectrometry, Limnol. Oceanogr., 92, 23–37, https://doi.org/10.1016/j.marchem.2004.06.038, 2004.
Li, Y., He, Z., Yang, G., Wang, H., and Zhuang, G.: Volatile halocarbons in the marine atmosphere and surface seawater: Diurnal and spatial variations and influences of environmental factors, Atmos. Environ., 214, 116820, https://doi.org/10.1016/j.atmosenv.2019.116820, 2019.
Liss, P. S. and Duce, R. A.: The Sea Surface and Global Change, Cambridge University Press, 519, Journal of the Marine Biological Association of the United Kingdom, 77, 918–918, https://doi.org/10.1017/S0025315400036407, 1997.
Liss, P. S. and Duce, R. A.: The Sea Surface and Global Change, Cambridge University Press, UK, ISBN-13: 978-0511525025, 2005.
Liu, S. M., Qi, X. H., Li, X. N., Ye, H. R., Wu, Y., Ren, J. L., Zhang, J., and Xu, W. Y.: Nutrient dynamics from the Changjiang (Yangtze River) estuary to the East China Sea, J. Mar. Syst., 154, 15–27, https://doi.org/10.1016/j.jmarsys.2015.05.010, 2016.
Liu, X., Beusen, A. H. W., Van Beek, L. P. H., Mogollón, J. M., Ran, X., and Bouwman, A. F.: Exploring spatiotemporal changes of the Yangtze River (Changjiang) nitrogen and phosphorus sources, retention and export to the East China Sea and Yellow Sea, Water Res., 142, 246–255, https://doi.org/10.1016/j.watres.2018.06.006, 2018.
Margolin, A. R., Gonnelli, M., Hansell, D. A., and Santinelli, C.: Black sea dissolved organic matter dynamics: insights from optical analyses, Limnol. Oceanogr., 63, 1425–1443, https://doi.org/10.1002/lno.10791, 2018.
Marie, D., Partensky, F., Jacquet, S., and Vaulot, D.: Enumeration and cell cycle analysis of natural populations of marine picoplankton by flow cytometry using the nucleic acid stain SYBR Green I, Appl. Environ. Microbiol., 63, 186–193, https://doi.org/10.1109/50.337494, 1997.
Massicotte, P., Asmala, E., Stedmon, C., and Markager, S.: Global distribution of dissolved organic matter along the aquatic continuum: Across rivers, lakes and oceans, Sci. Total Environ., 609, 180–191, https://doi.org/10.1016/j.scitotenv.2017.07.076, 2017.
Mcknight, D. M., Boyer, E. W., Westerhoff, P., Doran, P. T., Kulbe, T., and Andersen, D. T.: Spectrofluorometric characterization of dissolved organic matter for indication of precursor organic material and aromaticity, Limnol. Oceanogr., 46, 38–48, https://doi.org/10.4319/lo.2001.46.1.0038, 2001.
Medeiros, P. M., Seidel, M., Ward, N. D., Carpenter, E. J., Gomes, H. R., Niggemann, J., and Dittmar, T.: Fate of the Amazon River dissolved organic matter in the tropical Atlantic Ocean, Global Biogeochem. Cycl., 29, 677–690, https://doi.org/10.1002/2015GB005115, 2015.
Momzikoff, A., Brinis, A., Dallot, S., Gondry, G., Saliot, A., and Lebaron, P.: Field study ofthe chemical characterization of the upper ocean surface using various samplers, Limnol. Oceanogr. Method., 2, 374–384, https://doi.org/10.4319/lom.2004.2.374, 2004.
Mopper, K. and Kieber, D. J.: Photochemistry and the cycling of carbon, sulfur, nitrogen and phosphorus, in: Biogeochemistry of dissolved organic matter, edited by: Hansell, D. A. and Carlson, C. A ., Academic Press, San Diego, 455–507, https://doi.org/10.1016/b978-012323841-2/50011-7, 2002.
Mustaffa, N. H., Mariana, R. R., and Wurl, O.: High-resolution variability of the enrichment of fluorescence dissolved organic matter in the sea surface microlayer of an upwelling region, Elem. Sci. Anth., 5, 52, https://doi.org/10.1525/elementa.242, 2017.
Mustaffa, N., Badewien, T. H., Ribas-Ribas, M., and Wurl, O.: High-resolution observations on enrichment processes in the sea-surface microlayer, Sci. Rep., 8, 13122, https://doi.org/10.1038/s41598-018-31465-8, 2018.
Nichols, C. M., Lardière, S. G., Bowman, J. P., Nichols, P. D., Gibson, J. A. E., and Guézennec, J.: Chemical Characterization of Exopolysaccharides from Antarctic Marine Bacteria, Microb. Ecol., 49, 578–589, https://doi.org/10.1007/s00248-004-0093-8, 2005.
Obernosterer, I., Catala, P., Reinthaler, T., Herndl, G. J., and Lebaron, P.: Enhanced heterotrophic activity in the surface microlayer of the Mediterranean Sea, Aquat. Microb. Ecol., 39, 293–302, https://doi.org/10.3354/ame039293, 2005.
Ogawa, H., Amagai, Y., Koike, I., Kaiser, K., and Benner, R.: Production of refractory dissolved organic matter by bacteria, Science, 292, 917–920, https://doi.org/10.1126/science.1057627, 2001.
Orellana, M. V., Matrai, P. A., Leck, C., Rauschenberg, C. D., Lee, A. M., and Coz, E.: Marine microgels as a source of cloud condensation nuclei in the high Arctic, P. Natl. Acad. Sci. USA, 108, 13612–13617, https://doi.org/10.1073/pnas.1102457108, 2011.
Ortega-Retuerta, E., Passow, U., Duarte, C. M., and Reche, I.: Effects of ultraviolet B radiation on (not so) transparent exopolymer particles, Biogeosciences, 6, 3071–3080, https://doi.org/10.5194/bg-6-3071-2009, 2009.
Osburn, C. L., Handsel, L. T., Mikan, M. P., Paerl, H. W., and Montgomery, M. T.: Fluorescence tracking of dissolved and particulate organic matter quality in a river-dominated estuary, Environ. Sci. Technol., 46, 8628–8636, https://doi.org/10.1021/es3007723, 2012.
Parsons, T. R., Matia, Y., and Lalli, C. M.: A Manual of Chemical and Biological Methods for Seawater Analysis, Pergamon Press, Oxford, https://doi.org/10.1016/B978-0-08-030287-4.50034-7, 1984.
Reinthaler, T., Sintes, E., and Herndl, G. J.: Dissolved organic matter and bacterial production and respiration in the sea-surface microlayer of the open Atlantic and the western Mediterranean sea, Limnol. Oceanogr., 53, 122–136, https://doi.org/10.4319/lo.2008.53.1.0122, 2008.
Romera-Castillo, C., Sarmento, H., Alvarezsalgado, X. A., Gasol, J. M., and Marrase, C.: Production of chromophoric dissolved organic matter by marine phytoplankton, Limnol. Oceanogr., 55, 446–454, https://doi.org/10.4319/lo.2010.55.1.0446, 2010.
Sabbaghzadeh, B., Upstill-Goddard, R. C., Beale, R., Pereira, R., and Nightingale, P. D.: The Atlantic Ocean surface microlayer from 50∘ N to 50∘ S is ubiquitously enriched in surfactants at wind speeds up to 13 m s−1, Geophys. Res. Lett., 44, 2852–2858, https://doi.org/10.1002/2017GL072988, 2017.
Siegel, D. A.: Colored dissolved organic matter and its influence on the satellite-based characterization of the ocean biosphere, Geophys. Res. Lett., 32, 469–496, https://doi.org/10.1029/2005GL024310, 2005.
Singh, S., D'Sa, E., and Swenson, E.: Seasonal variability in CDOM absorption and fluorescence properties in the Barataria Basin, Louisiana, USA, J. Environ. Sci., 22, 1481–1490, https://doi.org/10.1016/S1001-0742(09)60279-5, 2010.
State Bureau of Technical Supervision Bureau: Specifications for Oceanographic Survey-Survey of Biology in Sea Water, Standard Press of China, Beijing, 17–20, ISBN: 7506608030, 1992.
Stedmon, C. A. and Bro, R.: Characterizing dissolved organic matter fluorescence with parallel factor analysis: a tutorial, Limnol. Oceanogr.-Method., 6, 572–579, https://doi.org/10.4319/lom.2008.6.572b, 2008.
Stedmon, C. A., Markager, S., and Bro, R.: Tracing dissolved organic matter in aquatic environments using a new approach to fluorescence spectroscopy, Mar. Chem., 82, 239–254, https://doi.org/10.1016/s0304-4203(03)00072-0, 2003.
Stedmon, C. A., Markager, S., Tranvik, L., Kronberg, L., Slätis, T., and Martinsen, W.: Photochemical production of ammonium and transformation of dissolved organic matter in the Baltic Sea, Mar. Chem., 104, 227–240, https://doi.org/10.1016/j.marchem.2006.11.005, 2007.
Sun, H., Zhang, Y. H., Tan, S., Zheng, Y.F., Zhou, S., Ma, Q. Y., Yang, G. P., Todd, J., and Zhang, X. H.: DMSP-Producing Bacteria Are More Abundant in the Surface Microlayer than Subsurface Seawater of the East China Sea, Microb. Ecol., 80, 350–365, https://doi.org/10.1007/s00248-020-01507-8, 2020.
Wang, F., Feng, T., Guo, Z., Li, Y., Lin, T., and Rose, N. L.: Sources and dry deposition of carbonaceous aerosols over the coastal East China Sea: Implications for anthropogenic pollutant pathways and deposition, Environ. Pollut., 245, 771–779, https://doi.org/10.1016/j.envpol.2018.11.059, 2019.
Weishaar, J. L., Aiken, G. R., Bergamaschi, B. A., Fram, M. S., Fujii, R., and Mopper, K.: Evaluation of specific ultraviolet absorbance as an indicator of the chemical composition and reactivity of dissolved organic carbon, Environ. Sci. Technol., 37, 4702–4708, https://doi.org/10.1021/es030360x, 2003.
Weng, H., Tian, R., Ji, Z., and Yu, X.: Potential relationships between atmospheric particulate matter transported by winter monsoons and red tides in the East China Sea, Sci. Bull., 56, 297–305, https://doi.org/10.1007/s11434-010-4209-x, 2011.
Woolf, D. K.: Bubbles and their role gas exchange, in: The Sea Surface and Global Change, edited by: Liss, P. S. and Duce, R. A., 173–205, Cambridge Univ. Press, UK, ISBN (Electronic): 97805115250254, 2005.
Wotton, R. S. and Preston, T. M.: Surface Films: Areas of Water Bodies That Are Often Overlooked, Bioscience, 55, 137–145, 2005.
Wurl, O. and Holmes, M.: The gelatinous nature of the sea-surface microlayer, Mar. Chem., 110, 89–97, https://doi.org/10.1016/j.marchem.2008.02.009, 2008.
Wurl, O., Wurl, E., Miller, L. A., Johnson, K., and Vagle, S.: Formation and global distribution of sea-surface microlayers, Biogeosciences, 8, 121–135, https://doi.org/10.5194/bg-8-121-2011, 2011.
Yamashita, Y.: In situ production of chromophoric dissolved organic matter in coastal environments, Geophys. Res. Lett., 31, 189–207, https://doi.org/10.1029/2004GL019734, 2004.
Yamashita, Y., Hashihama, F., Saito, H., Fukuda, H., and Ogawa, H.: Factors controlling the geographical distribution of fluorescent dissolved organic matter in the surface waters of the Pacific Ocean, Limnol. Oceanogr., 62, 2360–2374, https://doi.org/10.1002/lno.10570, 2017.
Yang, L.: SML and SSW DATA.xlsx, figshare [data set and code], https://doi.org/10.6084/m9.figshare.19971278.v1, 2022.
Yang, L., Zhuang, W., Chen, C. A., Wang, B., and Kuo, F.: Unveiling the transformation and bioavailability of dissolved organic matter in contrasting hydrothermal vents using fluorescence EEM-PARAFAC, Water Res., 111, 195–203, https://doi.org/10.1016/j.watres.2017.01.001, 2017.
Yang, L., Zhang, J., and Yang, G. P.: Mixing behavior, biological and photolytic degradation of dissolved organic matter in the East China Sea and the Yellow Sea, Sci. Total Environ., 762, 143164, https://doi.org/10.1016/j.scitotenv.2020.143164, 2020.
Zepp, R. G., Sheldon, W. M., and Moran, M. A.: Dissolved organic fluorophores in southeastern US coastal waters: correction method for eliminating Rayleigh and Raman scattering peaks in excitation–emission matrices, Mar. Chem., 89, 15–36, https://doi.org/10.1016/j.marchem.2004.02.006, 2004.
Zhu, W. Z., Yang, G., and Zhang, H.: Photochemical behavior of dissolved and colloidal organic matter in estuarine and oceanic waters, Sci. Total Environ., 607–608, 214–224, https://doi.org/10.1016/j.scitotenv.2017.06.163, 2017.