the Creative Commons Attribution 4.0 License.
the Creative Commons Attribution 4.0 License.
 | 22 Nov 2022
Forest–atmosphere exchange of reactive nitrogen in a remote region – Part II: Modeling annual budgets
Pascal Wintjen
Frederik Schrader
Martijn Schaap
Burkhard Beudert
Richard Kranenburg
Christian Brümmer
To monitor the effect of current nitrogen emissions and mitigation strategies, total (wet + dry) atmospheric nitrogen deposition to forests is commonly estimated using chemical transport models or canopy budget models in combination with throughfall measurements. Since flux measurements of reactive nitrogen (Nr) compounds are scarce, dry deposition process descriptions as well as the calculated flux estimates and annual budgets are subject to considerable uncertainties. In this study, we compared four different approaches to quantify annual dry deposition budgets of total reactive nitrogen (ΣNr) at a mixed forest site situated in the Bavarian Forest National Park, Germany. Dry deposition budgets were quantified based on (I) 2.5 years of eddy covariance flux measurements with the Total Reactive Atmospheric Nitrogen Converter (TRANC); (II) an in situ application of the bidirectional inferential flux model DEPAC (Deposition of Acidifying Compounds), here called DEPAC-1D; (III) a simulation with the chemical transport model LOTOS-EUROS (Long-Term Ozone Simulation – European Operational Smog) v2.0, using DEPAC as dry deposition module; and (IV) a canopy budget technique (CBT).
Averaged annual ΣNr dry deposition estimates determined from TRANC measurements were 4.7 ± 0.2 and 4.3 ± 0.4 kg N ha−1 a−1, depending on the gap-filling approach. DEPAC-1D-modeled dry deposition, using concentrations and meteorological drivers measured at the site, was 5.8 ± 0.1 kg N ha−1 a−1. In comparison to TRANC fluxes, DEPAC-1D estimates were systematically higher during summer and in close agreement in winter. Modeled ΣNr deposition velocities (vd) of DEPAC-1D were found to increase with lower temperatures and higher relative humidity and in the presence of wet leaf surfaces, particularly from May to September. This observation was contrary to TRANC-observed fluxes. LOTOS-EUROS-modeled annual dry deposition was 6.5 ± 0.3 kg N ha−1 a−1 for the site-specific weighting of land-use classes within the site's grid cell. LOTOS-EUROS showed substantial discrepancies to measured ΣNr deposition during spring and autumn, which was related to an overestimation of ammonia (NH3) concentrations by a factor of 2 to 3 compared to measured values as a consequence of a mismatch between gridded input NH3 emissions and the site's actual (rather low) pollution climate. According to LOTOS-EUROS predictions, ammonia contributed most to modeled input ΣNr concentrations, whereas measurements showed NOx as the prevailing compound in ΣNr concentrations. Annual deposition estimates from measurements and modeling were in the range of minimum and maximum estimates determined from CBT being at 3.8 ± 0.5 and 6.7 ± 0.3 kg N ha−1 a−1, respectively. By adding locally measured wet-only deposition, we estimated an annual total nitrogen deposition input between 11.5 and 14.8 kg N ha−1 a−1, which is within the critical load ranges proposed for deciduous and coniferous forests.
- Article
(3288 KB) - Full-text XML
- Companion paper
-
Supplement
(1456 KB) - BibTeX
- EndNote


In the last century, global nitrogen emissions have increased significantly due to anthropogenic activities (Fowler et al., 2013). Reactive nitrogen compounds, such as ammonia (NH3) and nitrogen oxides (NOx), contribute most to the emissions. Ammonia emissions originate mostly from animal husbandry and fertilizer application (Sutton et al., 2011, 2013), whereas NOx emissions are mainly related to combustion processes in, e.g., transport and industry (Erisman et al., 2011, 2013). Although fertilizer use and the internal combustion engine are vital for the world's food security and the economy, the release of these compounds into the atmosphere has a wide range of negative effects (Krupa, 2003; Galloway et al., 2003; Erisman et al., 2013). Deposition of reactive nitrogen into ecosystems has been identified as a reduction factor for biodiversity (Bobbink et al., 1998; Krupa, 2003; Galloway et al., 2003; Sutton et al., 2011). In particular, ecosystems with nutrient-poor soils are highly sensitive to additional nitrogen inputs, resulting in a change in plant species (Damgaard et al., 2011; Paulissen et al., 2016) and species composition in forests (Dirnböck et al., 2014, 2018; Roth et al., 2022). Critical loads are used to show at which level long-term nitrogen deposition may lead to adverse impacts (Hettelingh et al., 1995). Investigations by Hettelingh et al. (2013) have shown that half of the European ecosystems receive nitrogen above the critical level. In Germany, the fraction of ecosystems with a critical load exceedance is estimated to be about 70 % (Schaap et al., 2018).
Quantitative estimation of the total nitrogen deposition is needed to assess exceedances of critical loads and to develop successful mitigation strategies. Although wet deposition is relatively straightforward to measure, the accurate quantification of dry N deposition remains a challenge. Recent progress in fast and robust measurement techniques allows for the investigation of the temporal dynamics in concentrations and dry deposition fluxes (using the eddy covariance (EC) approach) for total reactive nitrogen (ΣNr) (Marx et al., 2012; Ammann et al., 2012; Brümmer et al., 2013, 2022a; Zöll et al., 2019; Ammann et al., 2019; Wintjen et al., 2020, 2022) and its individual compounds, e.g., for NH3 (Whitehead et al., 2008; Ferrara et al., 2012, 2021; Zöll et al., 2016; Moravek et al., 2020). For ΣNr, the Total Reactive Atmospheric Nitrogen Converter (TRANC) (Marx et al., 2012) coupled to a chemiluminescence detector (CLD) has shown its suitability for flux measurements in various field applications (see references for ΣNr above). Despite the recent progress, the number and temporal coverage of available datasets remains small. As these in situ measurements are only valid for the ecosystem where the specific observations took place, a large-scale assessment based on observations alone is not feasible without a dense observation network.
Chemical transport models (CTMs) are used to assess nitrogen deposition over large regions. For Germany, the CTM LOTOS-EUROS (Wichink Kruit et al., 2012; Manders et al., 2017; van der Graaf et al., 2020) is applied for the mapping of nitrogen deposition fluxes across the country. LOTOS-EUROS predicts the dry deposition of various Nr compounds – namely, nitrogen dioxide (NO2), nitric oxide (NO), nitric acid (HNO3), ammonia (NH3), particulate ammonium (NH), and nitrate (NO) – in each grid cell by utilizing meteorological data from the European Centre for Medium Range Weather Forecasts (ECMWF), modeled concentrations of the mentioned compounds based on their emission sources and chemical processing, and information about the land-use distribution within each grid cell. The deposition module DEPAC (Deposition of Acidifying Compounds) is applied for calculating the dry deposition velocities of those compounds (Erisman et al., 1994). DEPAC is a dry deposition inferential scheme featuring bidirectional NH3 exchange (van Zanten et al., 2010; Wichink Kruit et al., 2012), which is also implemented in the Operational Priority Substance (OPS) model (van Jaarsveld, 2004; Sauter et al., 2020). DEPAC can be used as a stand-alone model for estimating the dry deposition of Nr compounds. For site-based modeling with DEPAC, decoupled from a CTM and henceforth called DEPAC-1D, only measurements of common micrometeorological variables and concentrations of the individual Nr compounds are needed. In the past, deposition estimates have often been obtained through such an inferential modeling approach (Flechard et al., 2011, 2020; Li et al., 2016; Schwede et al., 2011).
To evaluate modeled annual total dry deposition and seasonal patterns in modeled fluxes and deposition velocities, a careful comparative analysis to flux measurements may provide feedback on the representativeness of the input data and the bidirectional parameterizations (Wichink Kruit et al., 2010, 2017). Wintjen et al. (2022) presented and analyzed novel flux measurements of ΣNr and several subcomponents, focusing on temporal dynamics above a remote, mixed forest site spanning a 2.5-year period. This dataset provides a unique opportunity for the evaluation of different approaches to quantify dry deposition fluxes. Such comparisons with novel measurement techniques are sparse and only available from a few field campaigns (Ammann et al., 2012; Brümmer et al., 2013, 2022a; Zöll et al., 2019). Since the adoption of the Geneva Convention on Long-Range Transboundary Air Pollution (CLRTAP) in 1979, throughfall measurements have been carried out at many sites of the International Co-operative Programmes on Assessment and Monitoring of Air Pollution Effects on Forests (ICP Forests, http://www.icp-forests.net, last access: 14 March 2022) and forested catchments (ICP Integrated Monitoring, http://www.syke.fi/nature/icpim, last access: 14 March 2022) according to standardized protocols. Using the so-called canopy budget technique (CBT), throughfall measurements also allow one to give an estimate of the annual nitrogen dry deposition (Draaijers and Erisman, 1995; de Vries et al., 2003).
In this study, we provide a comparison of four independent methods for estimating nitrogen dry deposition for a remote mixed forest site in the Bavarian Forest National Park. The comparison is made for a 2.5 year period for which novel flux measurements were available (see companion paper Wintjen et al., 2022). The aim of this measurement campaign, covering the timeframe January 2016–June 2018, was to quantify background concentrations and deposition levels as well as their temporal dynamics to further improve the modeling of nitrogen deposition, which may be used for further defining environmental protection guidelines. Therefore, in this paper, we (1) present modeled concentrations, deposition velocities, and fluxes of ΣNr and compare them to measurements of the same compounds, (2) discuss the influence of micrometeorological parameters on modeled deposition velocities and the impact of measured and modeled input parameters on modeled fluxes, (3) compare annual Nr budgets of LOTOS-EUROS with DEPAC-1D, flux measurements, and nitrogen deposition estimates based on CBT and review them in the context of critical loads, and (4) finally discuss uncertainties affecting modeled dry deposition estimates.
2.1 Dataset description
For the comparison to modeled ΣNr deposition fluxes, TRANC EC flux measurements, described in detail in Wintjen et al. (2022), were used. These flux measurements were available at a half-hourly resolution, were carried out 30 m above the forest floor, and had a data coverage of 41.0 %, considering the entire campaign period. Data gaps were related to violations of the EC theory and performance issues of the instruments.
For the application of DEPAC-1D, time series of micrometeorological parameters (i.e., temperature, atmospheric pressure, relative humidity, global radiation, Obukhov length (L), friction velocity (u∗)) and air pollutant concentrations (NO, NO2, HNO3, NH3, pNO, pNH, and sulfur dioxide (SO2)) are required for flux calculations. NH3 concentrations obtained from quantum cascade laser measurements taken at 30 m above ground, NO2 and NO obtained from chemiluminescence measurements taken at 50 m above ground, and micrometeorological parameters were aggregated at a half-hourly resolution, whereas the remaining Nr species and an additional NH3 determination were obtained on a monthly basis from DELTA (DEnuder for Long-Term Atmospheric sampling, e.g., Sutton et al., 2001; Tang et al., 2009) and passive-sampler (NH3 only) measurements of the IVL type (Ferm, 1991). DELTA measurements were made at 30 m and passive-sampler measurements at 10, 20, 30, 40, and 50 m above ground. Temperature and relative humidity were collected in a profile at 10, 20, 40, and 50 m above ground. Pressure and global radiation measurements were taken at 50 m. Indicators of stability and turbulence, such as L and u∗, were obtained from momentum flux measurements of the sonic anemometer.
Gaps in DEPAC-1D were related to gaps in micrometeorological input data and issues in the measurements of Nr compounds. Respective half-hourly values in the flux time series of each gas (approx. 3.4 % for NH3, HNO3, pNH, and pNO and 9.3 % for NO and NO2) were filled with results from LOTOS-EUROS. A detailed description of the site and the instrumentation is given in Wintjen et al. (2022). For LOTOS-EUROS flux modeling, modeled input data of the European Centre for Medium-Range Weather Forecasts (ECMWF) and the national emission inventory of Germany (Schneider et al., 2016) were used to predict deposition fluxes for NO, NO2, HNO3, NH3, pNO, and pNH. LOTOS-EUROS fluxes were resampled to half-hourly timestamps from the original hourly resolution, and missing fluxes were linearly interpolated. For the canopy budget technique, throughfall measurements under spruce and beech trees in close proximity to the station (Beudert et al., 2014) and bulk deposition measurements at an open site (Wintjen et al., 2022) were taken at weekly intervals and were used for the determination of total nitrogen dry deposition on an annual basis (Sect. 2.3). An overview of all the methods is given in Table 1.
Table 1Overview of methods used for estimating ΣNr dry deposition.

To compare dry deposition estimates from modeling to TRANC measurements, we filled gaps in the TRANC flux data with results from DEPAC-1D and, henceforth, called this dataset TRANC(DEPAC-1D). In a second approach, we applied the mean diurnal variation (MDV) method (Falge et al., 2001) to short-term gaps, analogous to Wintjen et al. (2022), and replaced remaining gaps with results from DEPAC-1D. This approach was called TRANC(MDV + DEPAC-1D). Both approaches, DEPAC-1D alone and the combination of DEPAC-1D and MDV, were able to fill all gaps in the TRANC flux time series. Uncertainties of the gap-filled fluxes determined by MDV were calculated as the standard error of the mean. Cumulative uncertainties of TRANC fluxes were solely based on the uncertainty of the gap filling and were calculated according to Eq. (3) of Wintjen et al. (2022). The error calculation scheme proposed by Brümmer et al. (2022a, Eq. 1) was applied to fluxes filled with DEPAC-1D. Flux uncertainty of those half-hourly values was given as
where represents the median of the ratio of the uncertainty of the measured fluxes (Func,meas) to their corresponding flux values (Fmeas). The uncertainty of the measured fluxes was estimated after Finkelstein and Sims (2001). Systematic uncertainties were not accounted for in the error calculation. A discussion on systematic uncertainties is given in Wintjen et al. (2022).
2.2 Modeling reactive nitrogen fluxes
2.2.1 Bidirectional flux model DEPAC
In surface–atmosphere flux exchange models, fluxes are calculated by using resistance schemes. In the case of gases exhibiting bidirectional exchange behavior, the flux F is defined as follows:
The flux is a product of the deposition velocity (vd) with the concentration difference between the atmospheric concentration, χa, and the compensation point, χtot, of the trace gas. In DEPAC, a compensation point is only implemented for NH3. Both the dry deposition or exchange velocity and the atmospheric concentration are height dependent and are given for an aerodynamic reference height (z−d), where z is the geometric height and d the zero-plane displacement height. The following convention is used for the fluxes: negative values represent deposition, and positive values represent emission. Following the conductivity–resistance analogy, vd is the inverse of the sum of the aerodynamic resistance (Ra), the quasi-laminar layer resistance (Rb), and the canopy resistance (Rc).
DEPAC (van Zanten, et al., 2010) can be used to calculate the dry deposition of reactive nitrogen gases. Ra and Rb are required by DEPAC as input variables. Hence, the module is oriented toward determining Rc for NO, NO2, HNO3, and NH3. Rc is treated differently for each Nr compound but basically as the sum of parallel resistances, which model the exchange behavior of the atmosphere and vegetation:
The stomatal resistance (Rstom) is calculated following Emberson et al. (2000a, b). In this scheme, stomatal conductance is determined by vegetation type, dependent on maximum conductance lowered by factors controlling stomatal opening – i.e., light intensity, ambient temperature, vapor pressure deficit, and soil water content – using well-known Jarvis functions (Jarvis, 1976). For NH3, a stomatal compensation point (χstom) is calculated following Wichink Kruit et al. (2010, 2017). The cuticular resistance (Rw) is described by Sutton and Fowler (1993) for NH3, and the corresponding cuticular compensation point is based on the works of Wichink Kruit et al. (2010, 2017). For NO and NO2, Rw is set considerably high to 10 000 and 2000 s m−1, respectively, allowing hardly any deposition on external surfaces. The in-canopy resistance (Rinc) is given by van Pul and Jacobs (1994), and the soil resistance (Rsoil) is described following Erisman et al. (1994). In the current version of DEPAC, the soil compensation point is set to zero for all surface types. In the case of HNO3, a fast uptake to any surface is assumed through a low, constant Rc of 10 s m−1. The total compensation point (χtot) is determined as written in van Zanten et al. (2010).
For further details regarding the documentation of DEPAC, we refer to the publication of van Zanten et al. (2010). Following implementation in LOTOS-EUROS, the version of DEPAC used in this study differs from the one documented in van Zanten et al. (2010) in two main ways: firstly, the implementation of a function considering co-deposition of SO2 and NH3 (Wichink Kruit et al., 2017) in the non-stomatal pathway, and secondly, the usage of a monthly moving NH3 average concentration for determining the stomatal compensation point (Wichink Kruit et al., 2017).
2.2.2 Modeling of ΣNr deposition (LOTOS-EUROS)
LOTOS-EUROS (Manders et al., 2017) simulations were performed for the entire measurement period. For this purpose, a large-scale simulation was set up for Europe, in which a second domain covering northwestern Europe at 7 × 7 km2 was nested. The simulations were forced with weather data from the ECMWF and the CORINE-2012 land-use classification. For the European background simulation, the CAMS-REG European emission inventory (Kuenen et al., 2021) was used. For the inner domain, the emission data for Germany were replaced by the national emission inventory. For Germany, the gridded emissions were obtained from the GRETA system (GRETA – Gridding Emission Tool for ArcGIS v1.1; Schneider et al., 2016). On an hourly basis, the land-use-specific total dry deposition was calculated in LOTOS-EUROS by applying DEPAC for NH3, NO, NO2, and HNO3. Dry deposition of pNO and pNH was calculated according to Zhang et al. (2001) (see Manders-Groot et al., 2016, Sect. 5.2). In the model, the dry deposition velocity and flux are calculated for the mid-layer height of the first model layer, which has a depth of ca. 20 m. By assuming a constant flux and using the stability parameters, the concentrations can be estimated for the canopy top and the typical observation height (2.5 m above roughness length (z0)) in air quality networks. The Corine Land Cover 2012 classification of the grid cell, in which the measurement site was located, was divided into 46.0 % seminatural vegetation, 37.2 % coniferous forest, 15.9 % deciduous forest, 0.7 % water bodies, and 0.2 % grassland. However, the actual structure of the forest stand showed 81.1 % coniferous forest and 18.9 % deciduous forest within the footprint of the flux measurements during the measurement campaign. Due to differences in the distribution of vegetation types in the footprint, results from LOTOS-EUROS were calculated with the site-specific weighting of land-use classes of the flux tower's footprint. The low contribution of coniferous forest and deciduous forest within the grid cell may be related to the evaluation of older aerial photographs showing larger areas of deadwood. Finally, the dry deposition of ΣNr was calculated as the sum of the individual Nr fluxes. A detailed documentation of LOTOS-EUROS is given in Manders-Groot et al. (2016) and Manders et al. (2017).
2.2.3 Site-based modeling of ΣNr deposition (DEPAC-1D)
DEPAC-1D is a stand-alone version of LOTOS-EUROS's dry deposition module DEPAC, using a FORTRAN90 wrapper program to accept arbitrary input datasets. DEPAC-1D used micrometeorological variables and parameters measured at the site to estimate Rc and the compensation point of NH3. The atmospheric resistances – Ra and Rb – and the fluxes of NH3, NO, NO2, HNO3, pNO, and pNH were calculated outside DEPAC following Garland (1977) and Jensen and Hummelshøj (1995, 1997), with stability corrections after Webb (1970) and Paulson (1970). The deposition of particles was calculated following Zhang et al. (2001) (see also Manders-Groot et al., 2016, Sect. 5.2) and was therewith equal to LOTOS-EUROS. For the fine fraction of pNO and pNH, a mass median diameter of 0.7 µm was used. For the coarse fraction of pNO, 8 µm was taken (Manders-Groot et al., 2016, Sect. 5.2). Note that particle deposition is, strictly speaking, not part of the DEPAC module and was modeled with a separate program, implementing the particle deposition scheme used within LOTOS-EUROS.
Half-hourly gaps in the NH3 QCL concentration time series were filled with their monthly integrated concentration value obtained from DELTA samplers. If these measurements were not available, missing values were replaced by monthly integrated results from passive-sampler measurements of NH3. During winter, the uncertainty introduced by this gap-filling approach seems to be low, as suggested by Schrader et al. (2018). We did not superimpose gap-filled concentration values with a diurnal pattern or use monthly averages of half-hours to fill gaps in the concentration time series, since abrupt changes in the NH3 concentration pattern – i.e., periods of low autocorrelation – could not be reproduced by a synthetic diurnal cycle or by monthly averages of half-hourly values. Fluxes of HNO3, pNO, and pNH were based solely on monthly DELTA measurements. Gaps in the time series of these compounds and SO2 were replaced by monthly averages from adjacent years. NO and NO2 fluxes were based on half-hourly concentration measurements. The difference in measuring height was considered in the calculation of Ra. SO2 and NH3 concentrations from gap-filled DELTA time series were used to determine compensation points and additional deposition corrections.
Since measurements of temperature and relative humidity data were not available at the measurement height of the EC system, we took the average of measurements from 20 and 40 m height above ground. These profile measurements started in April 2016 (Wintjen et al., 2022); thus, measurements at 50 m were used until end of March 2016. For modeling Ra, the solar zenith angle (which is calculated by using celestial mechanic equations), z0, and d are needed. We set z0 to 2.0 m and d to 12.933 m for the coniferous forest and to 11.60 m for the deciduous forest, corresponding to LOTOS-EUROS defaults for these land-use classes. Leaf area index (LAI) was modeled as described by van Zanten et al. (2010). The LAI determined from the site-specific land-use class weighting ranged between 4.1 and 4.8 due to leaf growth and shedding.
The calculation of the dry deposition was made with the mentioned input data on a half-hourly basis for NH3, NO, NO2, HNO3, pNO, and pNH. Results from DEPAC-1D were weighted with the site-specific land-use distribution within the flux measurement's footprint (81.1 % coniferous forest and 18.9 % deciduous forest).
2.3 Measuring nitrogen outflow from the canopy using the canopy budget technique (CBT)
The canopy budget technique (CBT) is the most common method for estimating total (wet + dry) atmospheric deposition of dissolved inorganic nitrogen (DINt) based on wet inorganic nitrogen fluxes of NO and NH ions estimated from open-site precipitation (bulk deposition) and throughfall of NO and NH ions measurements (see Staelens et al., 2008, Table 1). DINt was estimated on a monthly basis after the CBT approach of Draaijers and Erisman (1995) and de Vries et al. (2003). The results from the two methods differed only marginally and were therefore averaged. The biological conversion of deposited inorganic nitrogen into dissolved organic nitrogen (DON) in the phyllosphere (bacteria, yeasts, and fungi) or the dry deposition of atmospheric DON onto the canopy or the exudation of DON from plant tissues is not addressed in CBT. Here, it was estimated by the difference of DON fluxes between throughfall and bulk deposition and is henceforth called ΔDON. Adding ΔDON to throughfall DIN or to DINt reveals a frame of lower and upper estimates of total (wet + dry) nitrogen deposition (Nt) and, by subtracting DIN deposition at an open land site from these Nt, of lower and upper estimates of dry deposition (Beudert and Breit, 2014).
3.1 Comparison of modeled and measured concentrations
3.1.1 High resolution concentration measurements of NH3, NOx, and ΣNr
Figure 1 shows the comparison of measured half-hourly NH3, NOx, and ΣNr concentrations (see Wintjen et al., 2022) to their modeled concentrations of LOTOS-EUROS, represented as monthly box-whisker plots. From high-resolution concentration measurements, we found average concentrations and standard deviations of 1.0 ± 0.6, 1.4 ± 1.2, and 3.1 ± 1.7 µg N m−3 for NH3, NOx, and ΣNr for the entire campaign, respectively. Corresponding averages of LOTOS-EUROS of NH3 and ΣNr were higher by 0.8 and 1.9 µg N m−3, whereas NOx was slightly underestimated. Substantial mismatches in standard deviations of NH3 and ΣNr indicate that the variability in concentrations of NH3 and ΣNr was overestimated by LOTOS-EUROS. In the case of NH3, the largest discrepancies were observed for spring and partially for autumn. NOx concentrations were systematically underestimated by LOTOS-EUROS in summer. During winter, the difference between measured and modeled NOx concentrations was lower than during the summertime. Except for the summer, modeled half-hourly concentrations of ΣNr were 2 to 3 times higher than the measured values. The slight seasonal differences in measured ΣNr concentrations could not be reproduced by LOTOS-EUROS. The largest discrepancy during spring clearly correlates with the modeled NH3 concentrations.
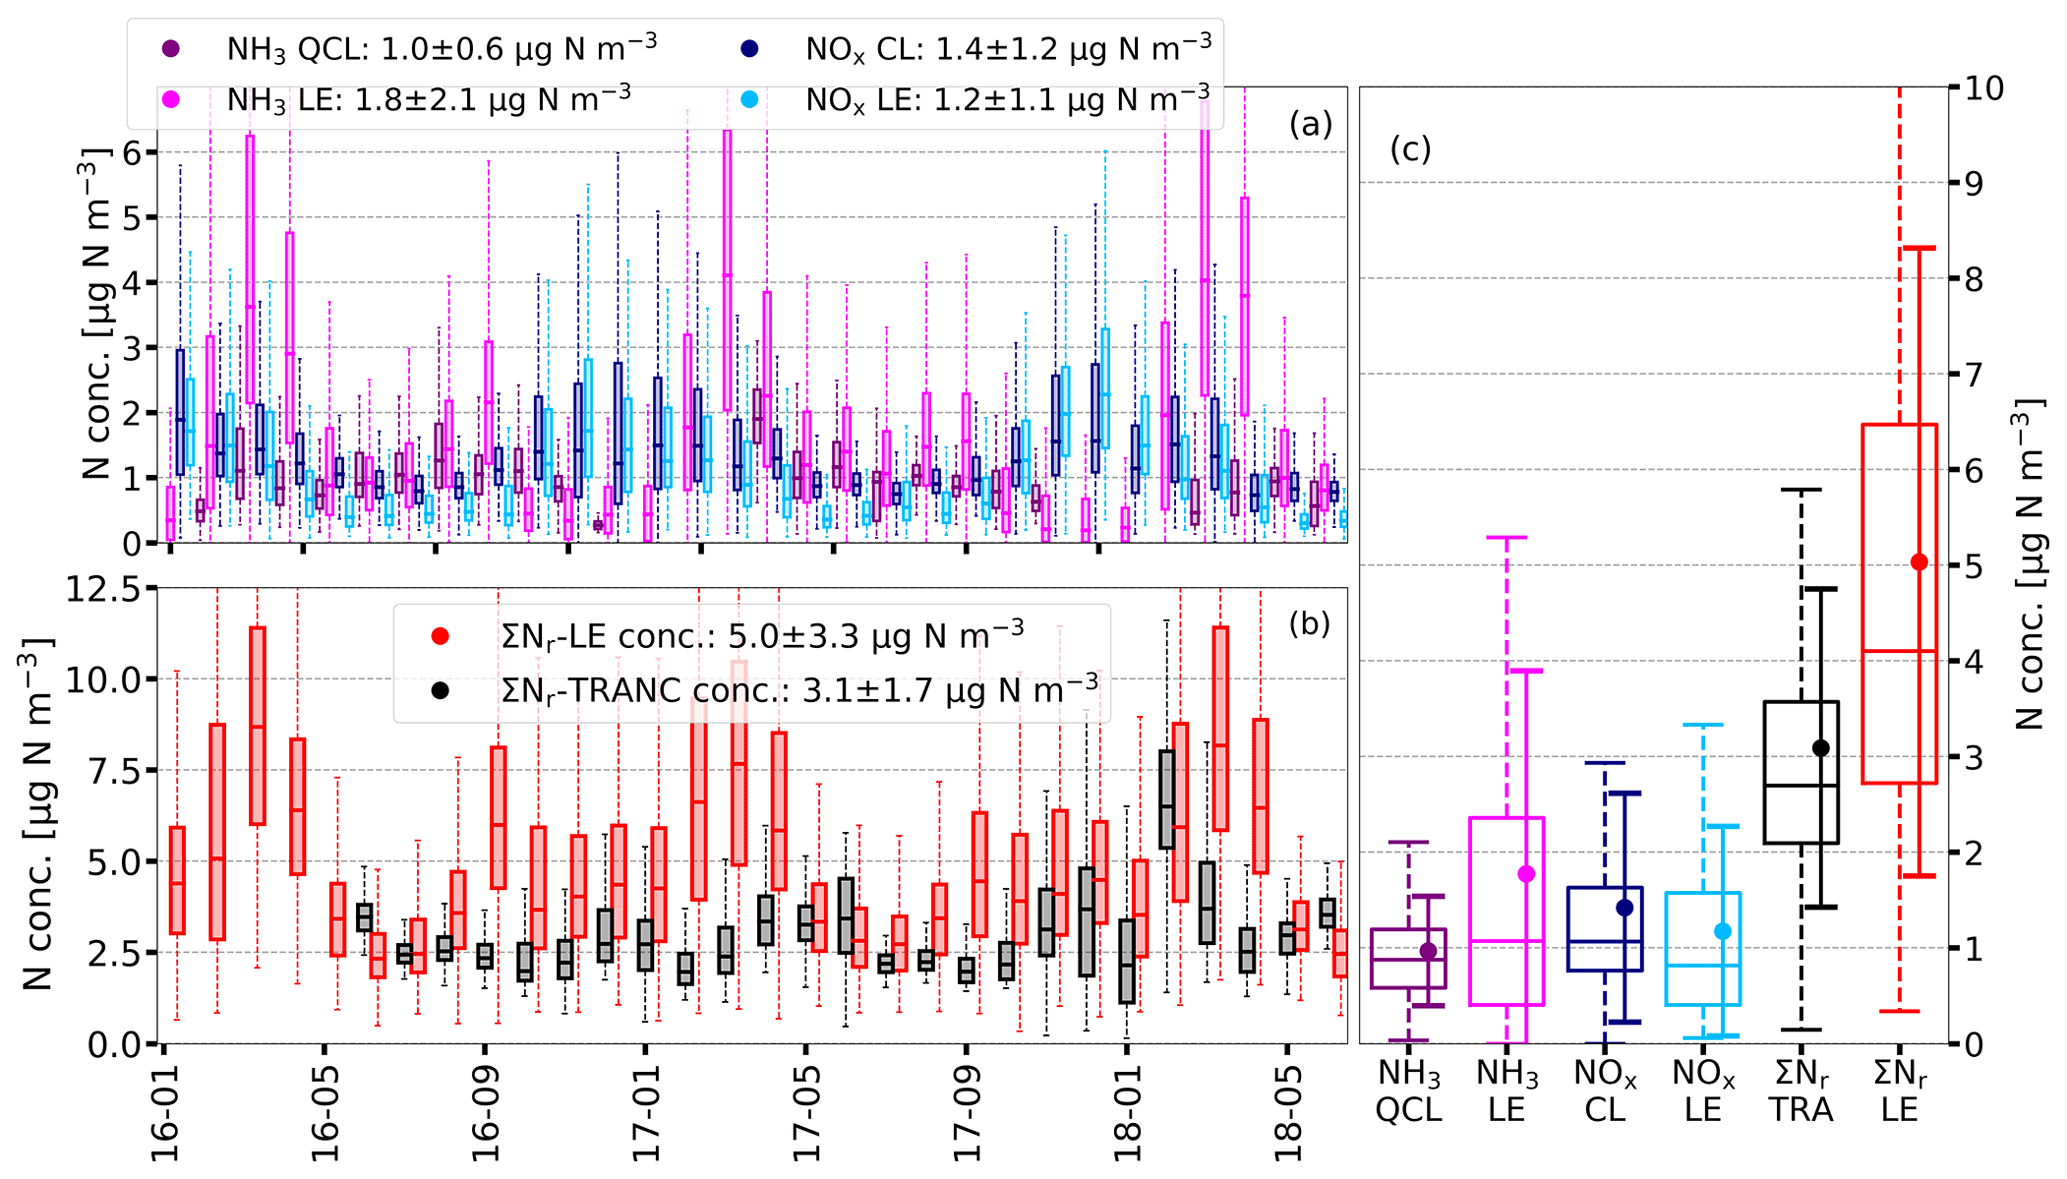
Figure 1Half-hourly concentrations of NH3, NOx, and ΣNr obtained from quantum cascade laser (QCL), chemiluminescence (CL), and TRANC (TRA) measurements compared to LOTOS-EUROS (LE) results displayed as box-whisker plots (box frame = 25 % to 75 % interquartile range (IQR), bold line = median, whisker = 1.5 ⋅ IQR) on a monthly basis (a, b) and for the entire duration of the campaign (January 2016 to end of June 2018) (c) in µg N m−3. Darker colors represent the results from measurements, brighter colors from LOTOS-EUROS. In the legends, averages and standard deviations referring to the entire campaign for NH3, NOx, and ΣNr are shown.
3.1.2 Passive samplers and DELTA measurements
The large modeled NH3 concentrations by LOTOS-EUROS could also not be verified by the observed levels of the passive samplers and the DELTA system. Figure S1 shows a comparison of the applied NH3 measurement techniques with NH3 concentrations predicted by LOTOS-EUROS. Figures and Tables denoted with an S can be found in the Supplement. A two- to threefold overestimation of NH3 concentrations by LOTOS-EUROS is visible. In addition, the modeled seasonal pattern was also not in agreement with the results from wet chemical samplers.
A comparison of the individual Nr compounds measured by DELTA to those measured by LOTOS-EUROS is displayed in Fig. 2. Considering the entire campaign, we measured average concentrations of 0.55, 0.17, 0.42, and 0.19 µg, N m−3 for NH3, HNO3, pNH, and pNO, respectively. For the same exposure periods, the concentration averages of LOTOS-EUROS for NH3, HNO3, pNH, and pNO were 1.8, 0.1, 1.2, and 0.8 µg N m−3, respectively. Differences considering the entire campaign duration are shown in Fig. S2. Like NH3, particulate nitrogen compound concentrations were also higher in the LOTOS-EUROS simulations. Predicted seasonality for pNH and pNO could only partially be verified by DELTA measurements. For HNO3, concentrations were in close agreement. In total, ΣNr values of DELTA and TRANC showed a reasonable agreement, and ΣNr concentrations showed only small seasonal differences, whereas LOTOS-EUROS overestimated ΣNr of the TRANC by ca. 2 µg N m−3 (Fig. S2).
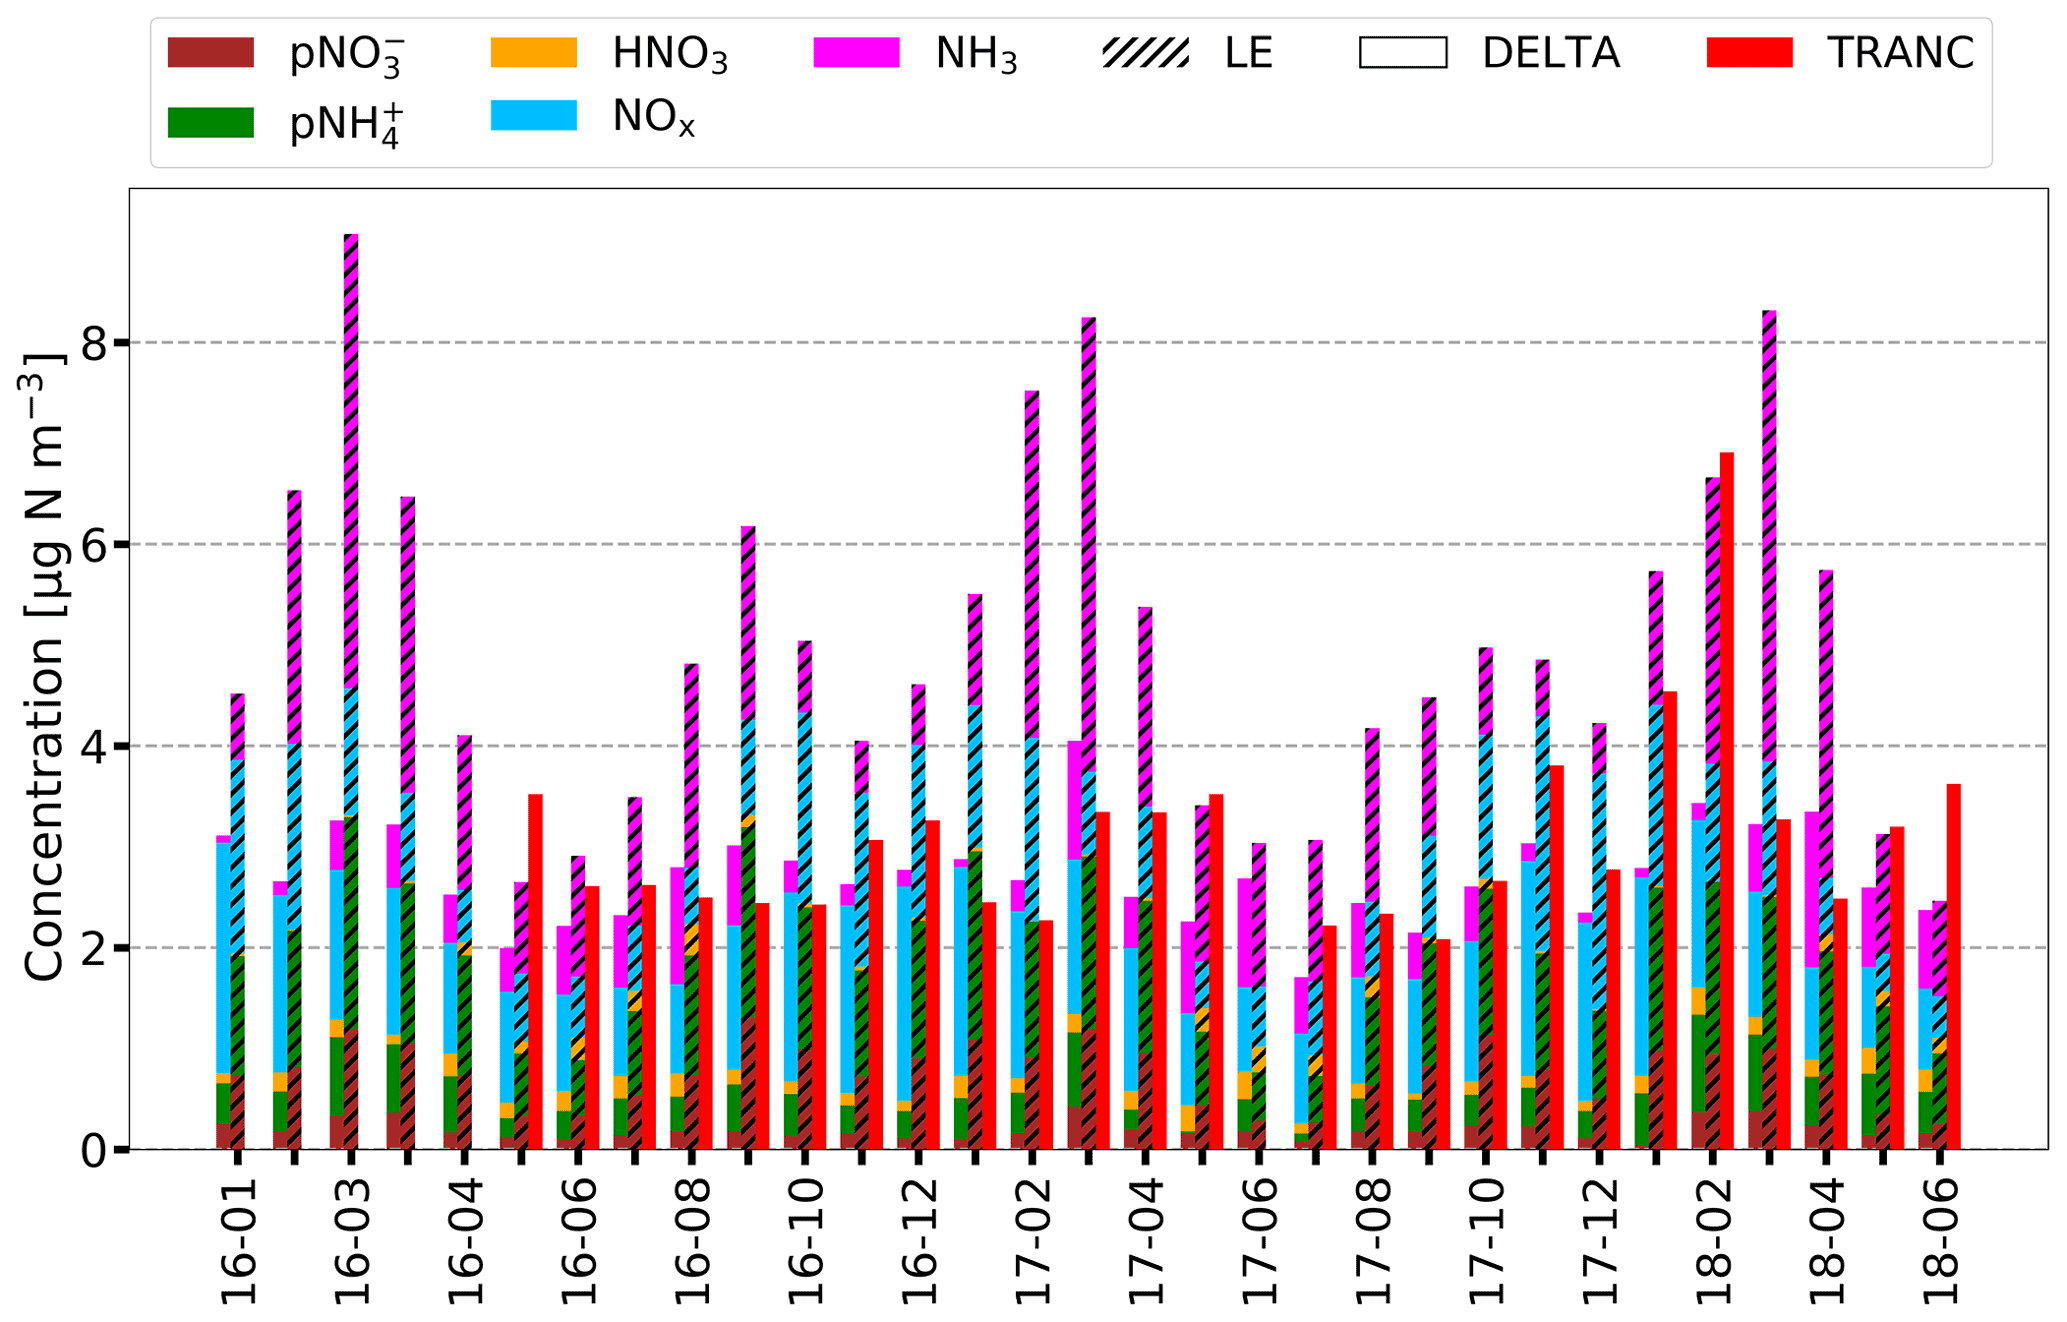
Figure 2Monthly stacked concentration of LOTOS-EUROS (LE) (hatched), TRANC (red), DELTA, and NOx in µg N m−3 for the entire measurement campaign. Gaps in the NH3 time series caused by a low pump flow of the denuder pump were filled with passive sampler values from 30 m. This procedure was done for December 2016 and 2017, March 2018, and April 2018. Remaining gaps in the time series of HNO3, pNH, and pNO were replaced by monthly averages estimated from other years, if available. In the case of NH3, the procedure was applied to January 2017. For the other compounds, the gap filling was done for December 2017, March 2018, and April 2018. Results from LOTOS-EUROS, TRANC, and NOx measurements were averaged to the exposure periods of the DELTA samplers.
According to Wintjen et al. (2022), NOx was the predominant compound in the ΣNr concentrations. For the entire campaign, NOx contributed 51.4 % and NH3 20.0 % to measured ΣNr, whereas LOTOS-EUROS predicted NH3 as the most important compound (∼ 35.7 %) contributing to ΣNr, followed by pNH (∼ 24.3 %), NOx (∼ 22.8 %), pNO (∼ 15.2 %), and HNO3 (∼ 1.9 %), as shown by Fig. S3. Furthermore, LOTOS-EUROS showed deviations from measurements in seasonal contributions. During winter, the contribution of NH3 to ΣNr was surprisingly high (28.6 %) compared to the observations (4.9 %). HNO3 contributions were comparable and on a low level between LOTOS-EUROS and DELTA. On average, particle contribution was higher in the model. Contributions of pNO and pNH were highest during spring, according to measurements, but lowest in LOTOS-EUROS in that season. Apart from springtime, seasonal contributions of pNO and pNH were higher by 6.6 %–14.4 % in LOTOS-EUROS.
3.2 Comparison of modeled and measured deposition velocities
3.2.1 Comparison of modeled and measured deposition velocities for each Nr compound
NH3 deposition velocities of LOTOS-EUROS and DEPAC-1D exhibited similar values in winter, but disagreements were found in summer and autumn. In summer, DEPAC-1D determined systematically larger median deposition velocities, whereas LOTOS-EUROS predicted a large variability in NH3 deposition velocities during autumn, which was not supported by DEPAC-1D. For NO2, deposition velocities of LOTOS-EUROS and DEPAC-1D agreed well in their temporal pattern and the median deposition velocities, but the variability in DEPAC-1D deposition velocities was slightly higher during summer. In both model applications, NO deposition velocities were practically zero (medians always <0.06 cm s−1). For pNH, deposition velocities of DEPAC-1D and LOTOS-EUROS agreed well, with median deposition velocities close to zero, but a large disagreement was found during winter. Deposition velocities of pNO were close to zero during the entire campaign in DEPAC-1D, but LOTOS-EUROS showed a large scattering of vd in the winter months. For HNO3, a discrepancy in vd was also found during winter, and, similar to NH3, deposition velocities of DEPAC-1D were generally larger from May to September. The comparison of the deposition velocities for each Nr compound modeled by DEPAC-1D and LOTOS-EUROS is shown in Fig. S4.
3.2.2 Comparison of modeled and measured ΣNr deposition velocities
A comparison of the modeled and measured vd for the ΣNr flux is provided in Fig. 3. The modeled total nitrogen dry deposition velocities were obtained by dividing the modeled dry deposition flux for all compounds by the modeled total nitrogen concentrations in ambient air. When subtracting the median vd of TRANC from LOTOS-EUROS results, differences typically ranged between −0.3 and 1.0 cm s−1. Particularly during the summer months, an overestimation of vd by DEPAC-1D was observed with respect to TRANC measurements. During those months, the median vd of DEPAC-1D was ca. 2 to 3 times higher than their measured entities. LOTOS-EUROS vd of the ΣNr flux were generally lower than DEPAC-1D but still larger than those found in the measurements within that period. During the winter months, DEPAC-1D ΣNr showed the lowest median values and variability, whereas deposition velocities of TRANC and LOTOS-EUROS were comparable, caused by the influence of pNO and pNH on LOTOS-EUROS vd predictions. Modeled and measured medians vd and their lower and upper quartiles are given in Table S1.
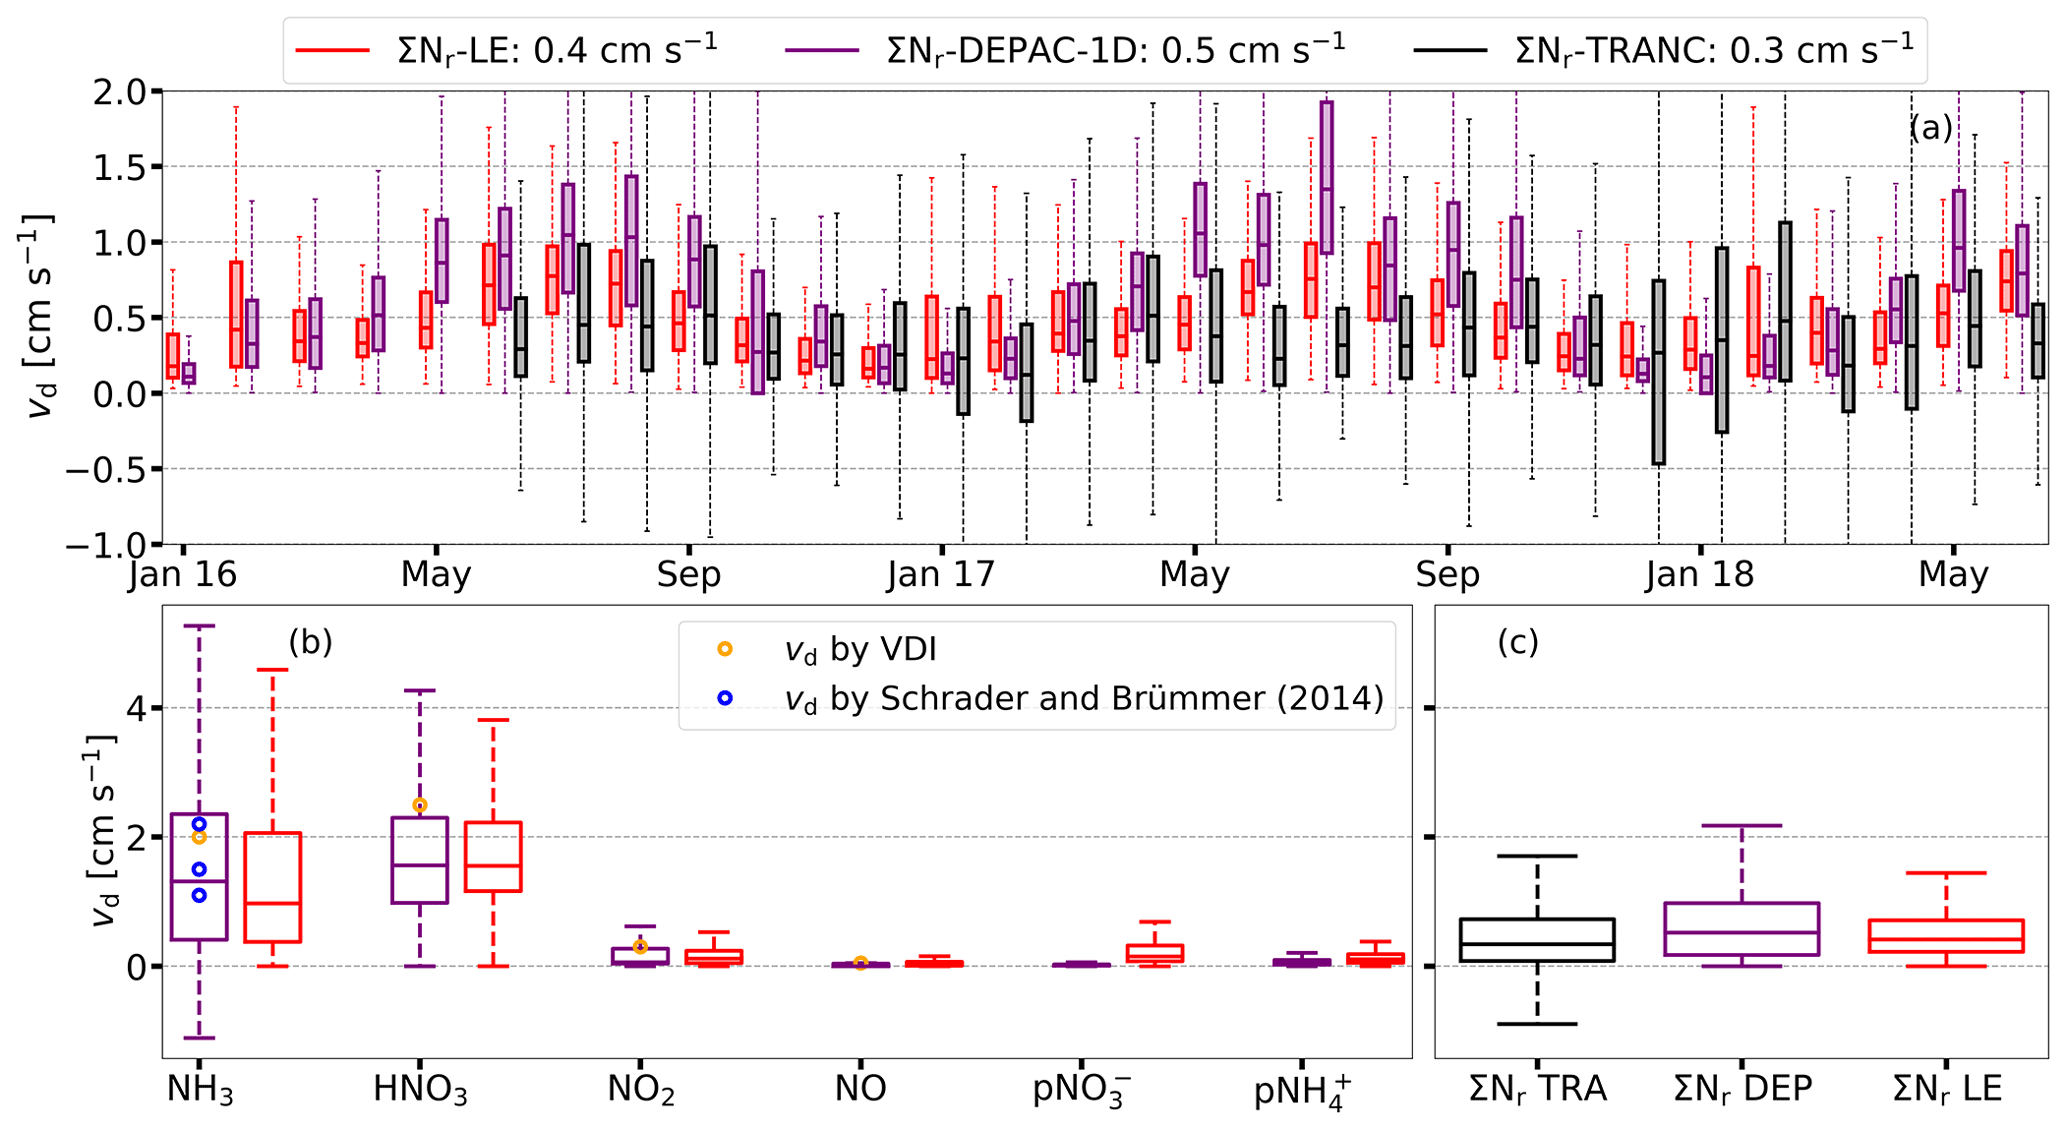
Figure 3Monthly vd of ΣNr determined from TRANC (black) measurements, DEPAC-1D (purple), and LOTOS-EUROS (red), with the corrected land-use weighting in cm s−1 represented as box-and-whisker plots in the upper panel (a). In the corresponding legend, the median vd related to the entire campaign are given. In the lower panels (b, c), box-and-whisker plots of vd for each Nr compound and ΣNr based on the entire campaign (TRA = TRANC, DEP = DEPAC-1D, LE = LOTOS-EUROS) are shown. Blue circles refer to NH3 deposition velocities reported by Schrader and Brümmer (2014) for deciduous forests, mixed forests, and spruce forests (from low to high); orange circles show deposition velocities proposed by VDI (2006).
Inspection of the diurnal cycles of ΣNr deposition velocities for May to September in the year 2017 (Fig. S7) shows that both the DEPAC-1D and measured data exhibit a clear diurnal pattern, with the lowest deposition during the night and the highest values around noon. However, in those periods where the measured data are close to zero during the night, the modeled fluxes show considerable nighttime exchange, with deposition velocities between 0.5 and 1 cm s−1.
To further examine the reasons behind these discrepancies, we show the diurnal cycles of vd after classifying the ΣNr deposition velocities for half-hours without precipitation during May–September into two groups, being below or above the median temperature (Tair = 14.6 ∘C), relative humidity (RH = 74.0 %), and total ΣNr concentration (c(ΣNr) =2.7 µg N m−3). Leaf surface wetness was measured at the site by means of sensors attached to a spruce and a beech tree. In order to classify the sensor as dry or wet, the half-hourly leaf wetness value was compared to a threshold value based on the calculation scheme given by Wintjen et al. (2022).
The diurnal cycles illustrate the same diurnal biases as discussed above. Figure 4 shows that DEPAC-1D results indicate that lower temperatures, higher relative humidity, and wet leaf surfaces enhance the ΣNr dry deposition velocity. This behavior was expected based on the models' parameterizations, but it is contradictory to the TRANC measurements. In particular, the differences for the relative humidity regimes are remarkable. Smaller differences are observed for the dependency on temperature and the ΣNr concentration, although both have a stronger influence in the model than on their measured counterpart.
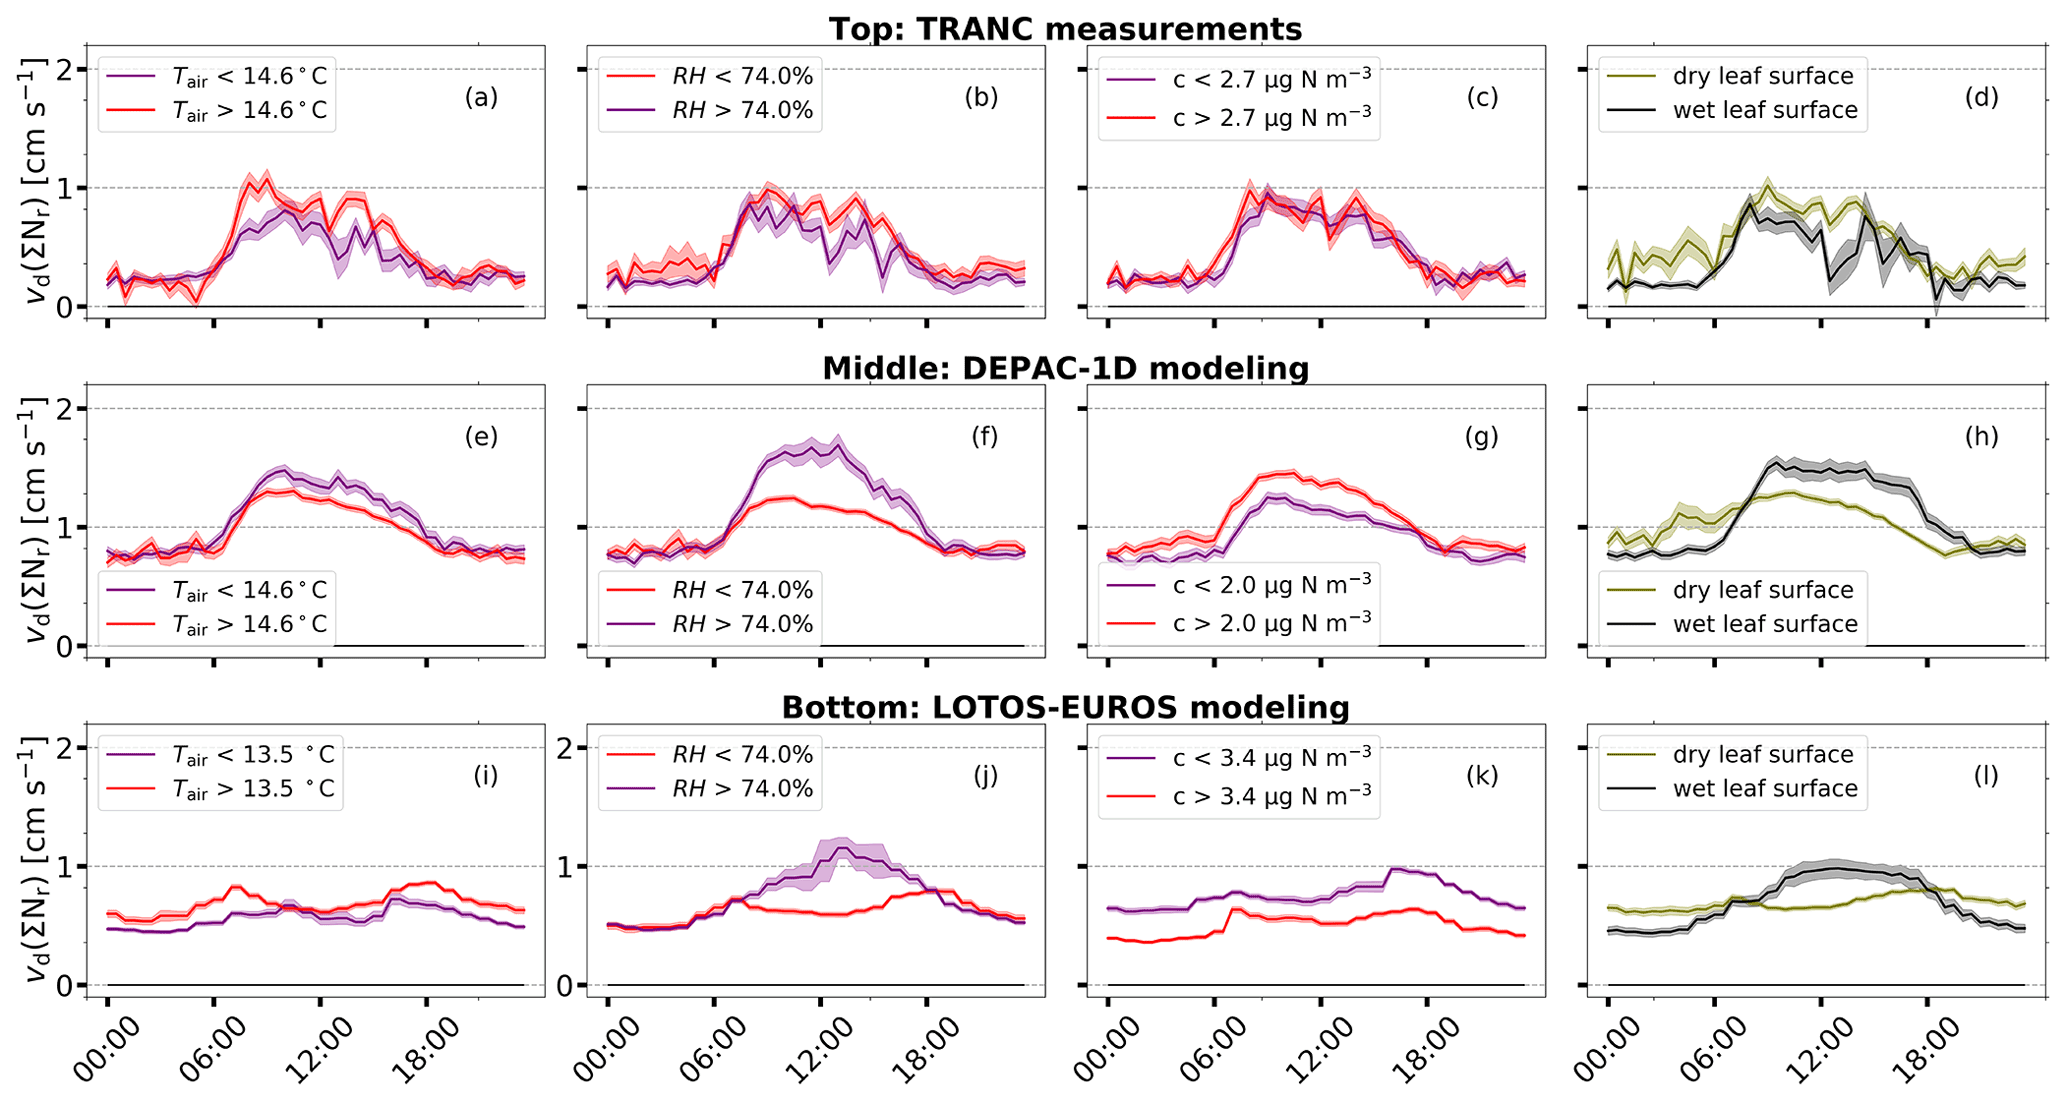
Figure 4Averaged diurnal cycles of ΣNr vd for low and high temperature, relative humidity, and concentration during the timeframe May–September. The top row refers to TRANC measurements (a–d), the middle row refers to DEPAC-1D modeling (e–h), and the bottom row refers to LOTOS-EUROS simulations (i–l). Data were stratified after their median was calculated for the entire period. Dry and wet leaf surfaces (d, h, l) were identified following the calculation scheme of Wintjen et al. (2022). Shaded areas represent the standard error of the mean.
In the case of LOTOS-EUROS, separating diurnal cycles of vd led to similar observations being made for DEPAC-1D regarding relative humidity and leaf surfaces. In addition, lower temperatures and concentration tend to increase vd, which contradicts the results of DEPAC-1D. Generally, values of vd are closer to TRANC deposition velocities, but the diurnal pattern differs from those of TRANC and DEPAC-1D, showing maxima in the morning (∼ 06:00 LT) and evening (∼ 18:00 LT) and low values around noon, except in the case of high relative humidity and wet leaf surfaces.
3.3 Comparison of modeled and measured fluxes
3.3.1 Influence of input concentrations and meteorology on modeled fluxes
The statements made for vd can be transferred to the flux predictions. Differences to the observations made for vd (Fig. S4) are related to the concentration input data. For example, due to overestimations of modeled NH3 concentrations in spring and autumn, differences in the fluxes were higher during the same time. Modeled NO2 and HNO3 concentrations of LOTOS-EUROS were lower than their measured values, resulting in flux underestimations by LOTOS-EUROS for NO2 and HNO3 during summer. High modeled input concentrations of particulate nitrogen led to substantial deposition fluxes in the LOTOS-EUROS simulations. Following the model predictions, NH3 fluxes had the largest contribution to the modeled ΣNr flux, with an average flux of −12.5 and −13.0 ng N m−2 s−1 in the DEPAC-1D and LOTOS-EUROS applications, respectively, considering the entire campaign. Averaged fluxes of NO2 and HNO3 showed – although on a low level in absolute terms – higher deposition fluxes for DEPAC-1D, namely 2.0 and 1.3 ng N m−2 s−1, respectively, compared to 1.2 and 0.3 ng N m−2 s−1 in the case of LOTOS-EUROS. Substantial flux differences were found for particulate nitrogen. DEPAC-1D averaged fluxes were close to zero (0.9 and 0.1 ng N m−2 s−1 for pNH and pNO, respectively), whereas LOTOS-EUROS showed substantially higher aerosol deposition, with averaged fluxes of 3.7 and 2.2 ng N m−2 s−1 for pNH and pNO, respectively. The comparison of fluxes for each Nr compound of LOTOS-EUROS and DEPAC-1D is shown in Fig. S5.
Apart from concentrations being responsible for the differences in modeled flux estimates, other parameters may have also contributed to the deviations. To further investigate the impacts of the input data used in the LOTOS-EUROS simulations, we made a comparison of the measured and modeled input parameters used for the dry deposition modeling of NH3 in LOTOS-EUROS (Fig. S6). The agreement of temperature and global radiation in terms of their coefficient of determination R2 was good. We found differences of approximately 1.5 ∘C and −6.1 W m−2 of modeled to measured values on average. High R2 values were determined for the entire campaign duration using half-hourly values – namely, 0.97 for temperature and 0.78 for global radiation. A slight difference was found for relative humidity during the first half of 2016. However, modeled values were higher by only 2.4 % on average, and the R2 was still 0.67. In the case of u∗, we found a systematic difference, and the seasonal pattern did not agree well, resulting in a lower R2 of 0.43 compared to the other micrometeorological parameters. In particular, from November 2017 to February 2018, the difference between modeled and measured u∗ values was considerably large.
The largest discrepancy was found for NH3 concentrations, as illustrated in detail by Figs. 2 and S1. All of the investigated input parameters play an important role in the modeling of NH3 exchange. In order to determine the impact of these parameters on modeled NH3 fluxes, we calculated NH3 fluxes for the land-use class spruce forest with DEPAC-1D by replacing a specific input parameter with its measured entity, while all other input data were from LOTOS-EUROS. Figure 5 illustrates the results of this comparison. Since modeled and measured values of global radiation agreed well, deposition of NH3 was only marginally reduced if measured values were used. Using measured values of temperature as input parameters led to an increase (by 0.82 kg N ha−1) in modeled NH3 deposition, whereas measured relative humidity led to a decrease (by 0.80 kg N ha−1) in modeled NH3 deposition. We found significant differences in u∗, but considering measured values in the flux calculation leads only to a reduction of 1.3 kg N ha−1. As expected from the analysis of Fig. S6, the NH3 concentration had the largest impact on deposition. Using measured NH3 concentrations reduced the deposition substantially, by 5.3 kg N ha−1, compared to using modeled concentrations. All reported differences refer to the entire campaign duration.
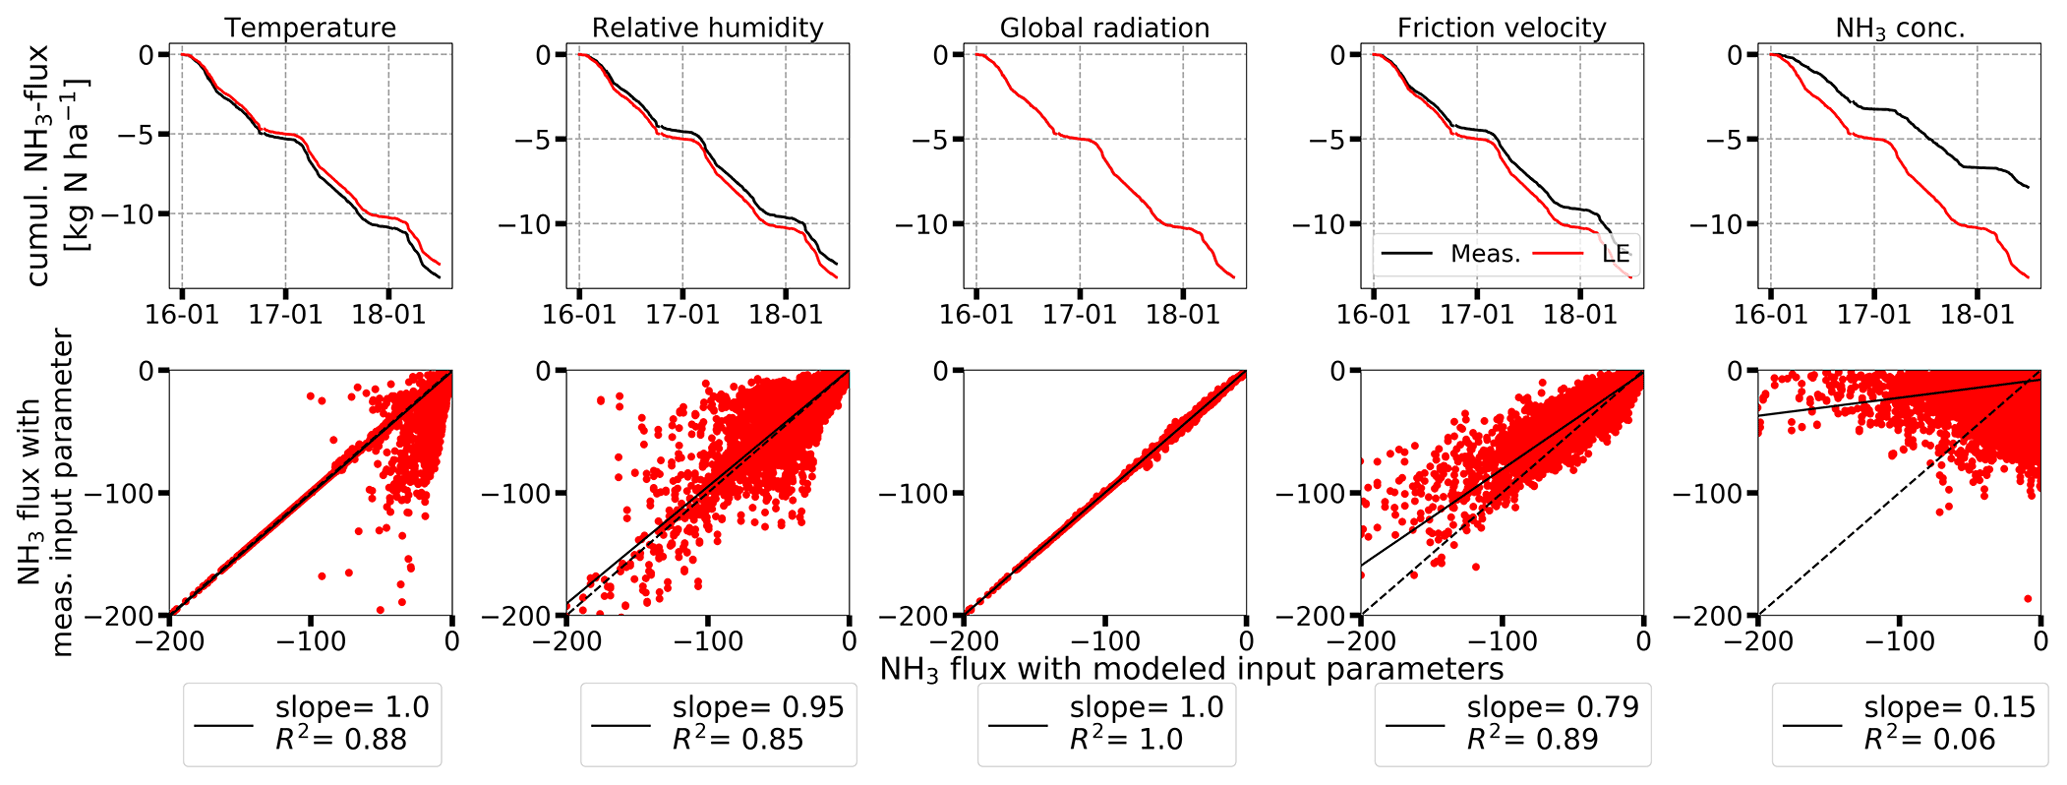
Figure 5Comparison of NH3 fluxes calculated with DEPAC-1D for the land-use class spruce forest based on measured (black) and modeled input data (red). The comparison was made for temperature, relative humidity, global radiation, friction velocity, and NH3 concentrations. In the first row, NH3 fluxes are shown as cumulative sums in kg N ha−1. In the second row, scatter plots of NH3 fluxes in ng N m−2 s−1 are given. Linear regressions are shown as black, solid lines; black, dashed lines represent 1:1 lines.
3.3.2 Comparison of modeled and measured ΣNr deposition fluxes
The comparison of modeled ΣNr fluxes with TRANC fluxes is presented in Fig. 6. Only periods during which high quality flux measurements were available were considered for the analysis. Models were basically able to capture the seasonal pattern of the ΣNr fluxes well but generally overestimated the measured flux amplitude. The ΣNr exchange of DEPAC-1D is near zero during the entire winter, and thus, the difference compared to measured deposition was nearly zero. During summer, a systematic overestimation of DEPAC-1D compared to measured fluxes was observed. Modeled deposition of LOTOS-EUROS was slightly lower than DEPAC-1D during summer and was consequentially closer to measured fluxes. However, during autumn and spring, the predicted deposition of LOTOS-EUROS was significantly higher than the deposition determined by DEPAC-1D and TRANC measurements due to the overestimated input NH3 concentrations. Deposition was considerably high in LOTOS-EUROS during winter, whereas the median ΣNr deposition of DEPAC-1D and TRANC was close to zero. Note that, during February 2018, high aerosol concentrations were both modeled and observed. The TRANC flux data also show the impact of the aerosol deposition, though to a larger extend than LOTOS-EUROS. Median fluxes for each season and the entire campaign are given in Table S2.
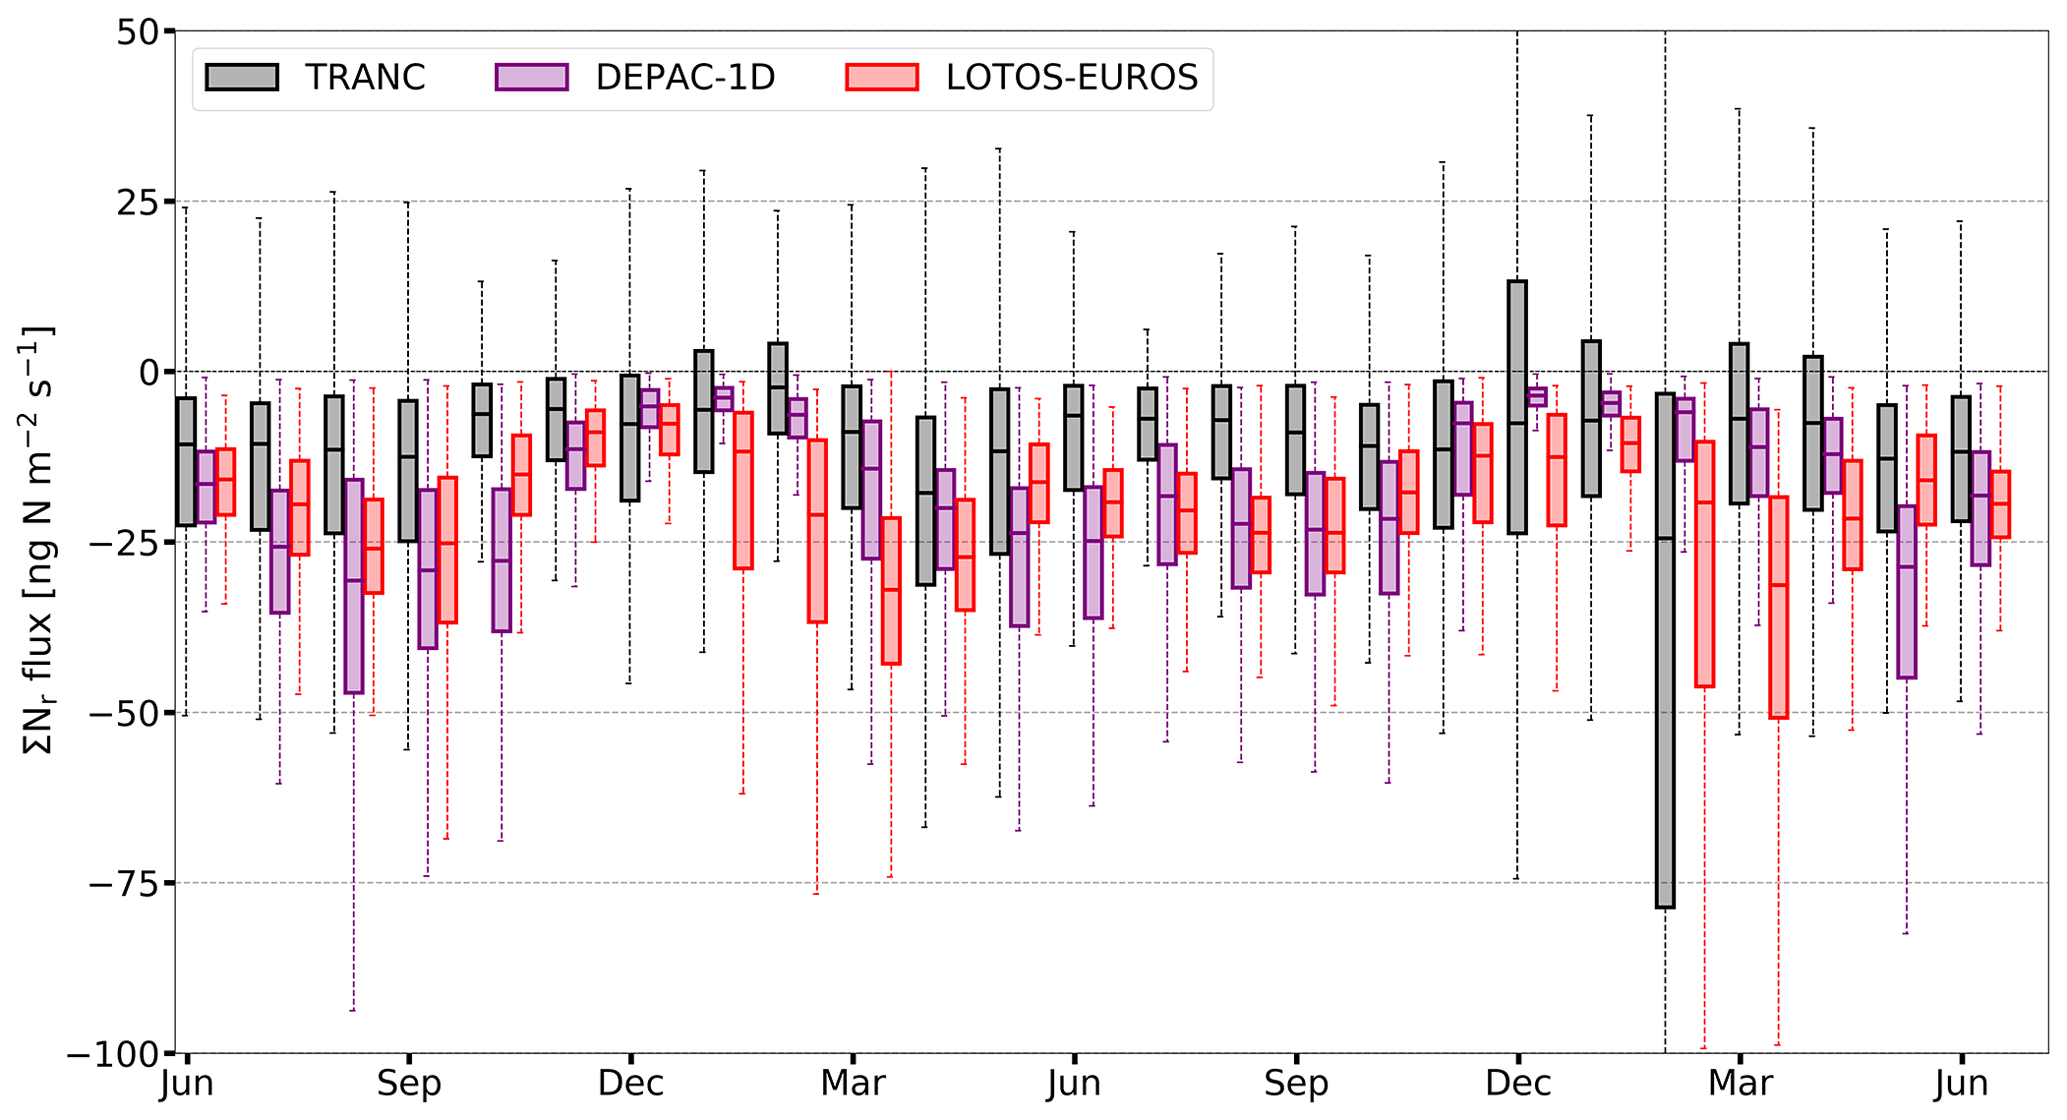
Figure 6Fluxes of DEPAC-1D (purple), LOTOS-EUROS (red), and TRANC (black) from June 2016 to June 2018, shown as box-and-whisker plots. Whiskers of TRANC fluxes cover the range from −191 to 105 ng N m−2 s−1 in February 2018; the upper whisker of December 2017 reached 69 ng N m−2 s−1.
Figure S8 shows exemplary monthly diurnal cycles of ΣNr based on TRANC, DEPAC-1D, and LOTOS-EUROS. As previously written, during winter, LOTOS-EUROS overestimated deposition, whereas measurements showed near-zero exchange, with occasional emission phases. From May to September and October, DEPAC-1D exhibited a clear diurnal pattern, with the lowest deposition during the night and the highest values around noon, which was in line with results from TRANC measurements. However, fluxes were systematically overestimated, as indicated by Figs. 6 and S8, during those months. During the same period, ΣNr deposition of LOTOS-EUROS was lower but still higher than TRANC fluxes, except in September. During that month, LOTOS-EUROS was similar to DEPAC-1D. Generally, the diurnal deposition pattern of LOTOS-EUROS was considerably dampened, thereby not agreeing well with DEPAC-1D and TRANC.
3.4 Cumulative N exchange and method comparison
To derive annual deposition numbers, the gap-filling procedures were applied to the time series of TRANC and DEPAC-1D (see Sect. 2.1). Figure 7 shows the cumulative ΣNr dry deposition of each method from January 2016 to the end of June 2018. The contributions of the individual components to the dry ΣNr deposition of DEPAC-1D were 67.9 % NH3, 15.3 % HNO3, 10.4 % NO2, 5.2 % NH, 1.0 % NO, and 0.1 % NO, showing that modeled deposition was clearly driven by NH3. Since emission processes could only be treated for NH3, the observed emission of ΣNr – for example, in December 2017 (Wintjen et al., 2022) – could not be sufficiently modeled. Due to issues in the parameterization of stability in LOTOS-EUROS (see Sect. 4.2.2), particle deposition was enhanced in the LOTOS-EUROS results compared to those of DEPAC-1D (Fig. 7). The deposition of gases only was higher in DEPAC-1D compared to LOTOS-EUROS due to the higher deposition velocities for NH3, NO2, and HNO3 during summer (Sect. 3.2.1). We used a combination of MDV and DEPAC-1D for gap filling measured TRANC fluxes called TRANC(MDV + DEPAC-1D). Comparing these with LOTOS-EUROS and DEPAC-1D, we found differences in total dry deposition estimates of 5.4 and 2.8 kg N ha−1 after 2.5 years, respectively.
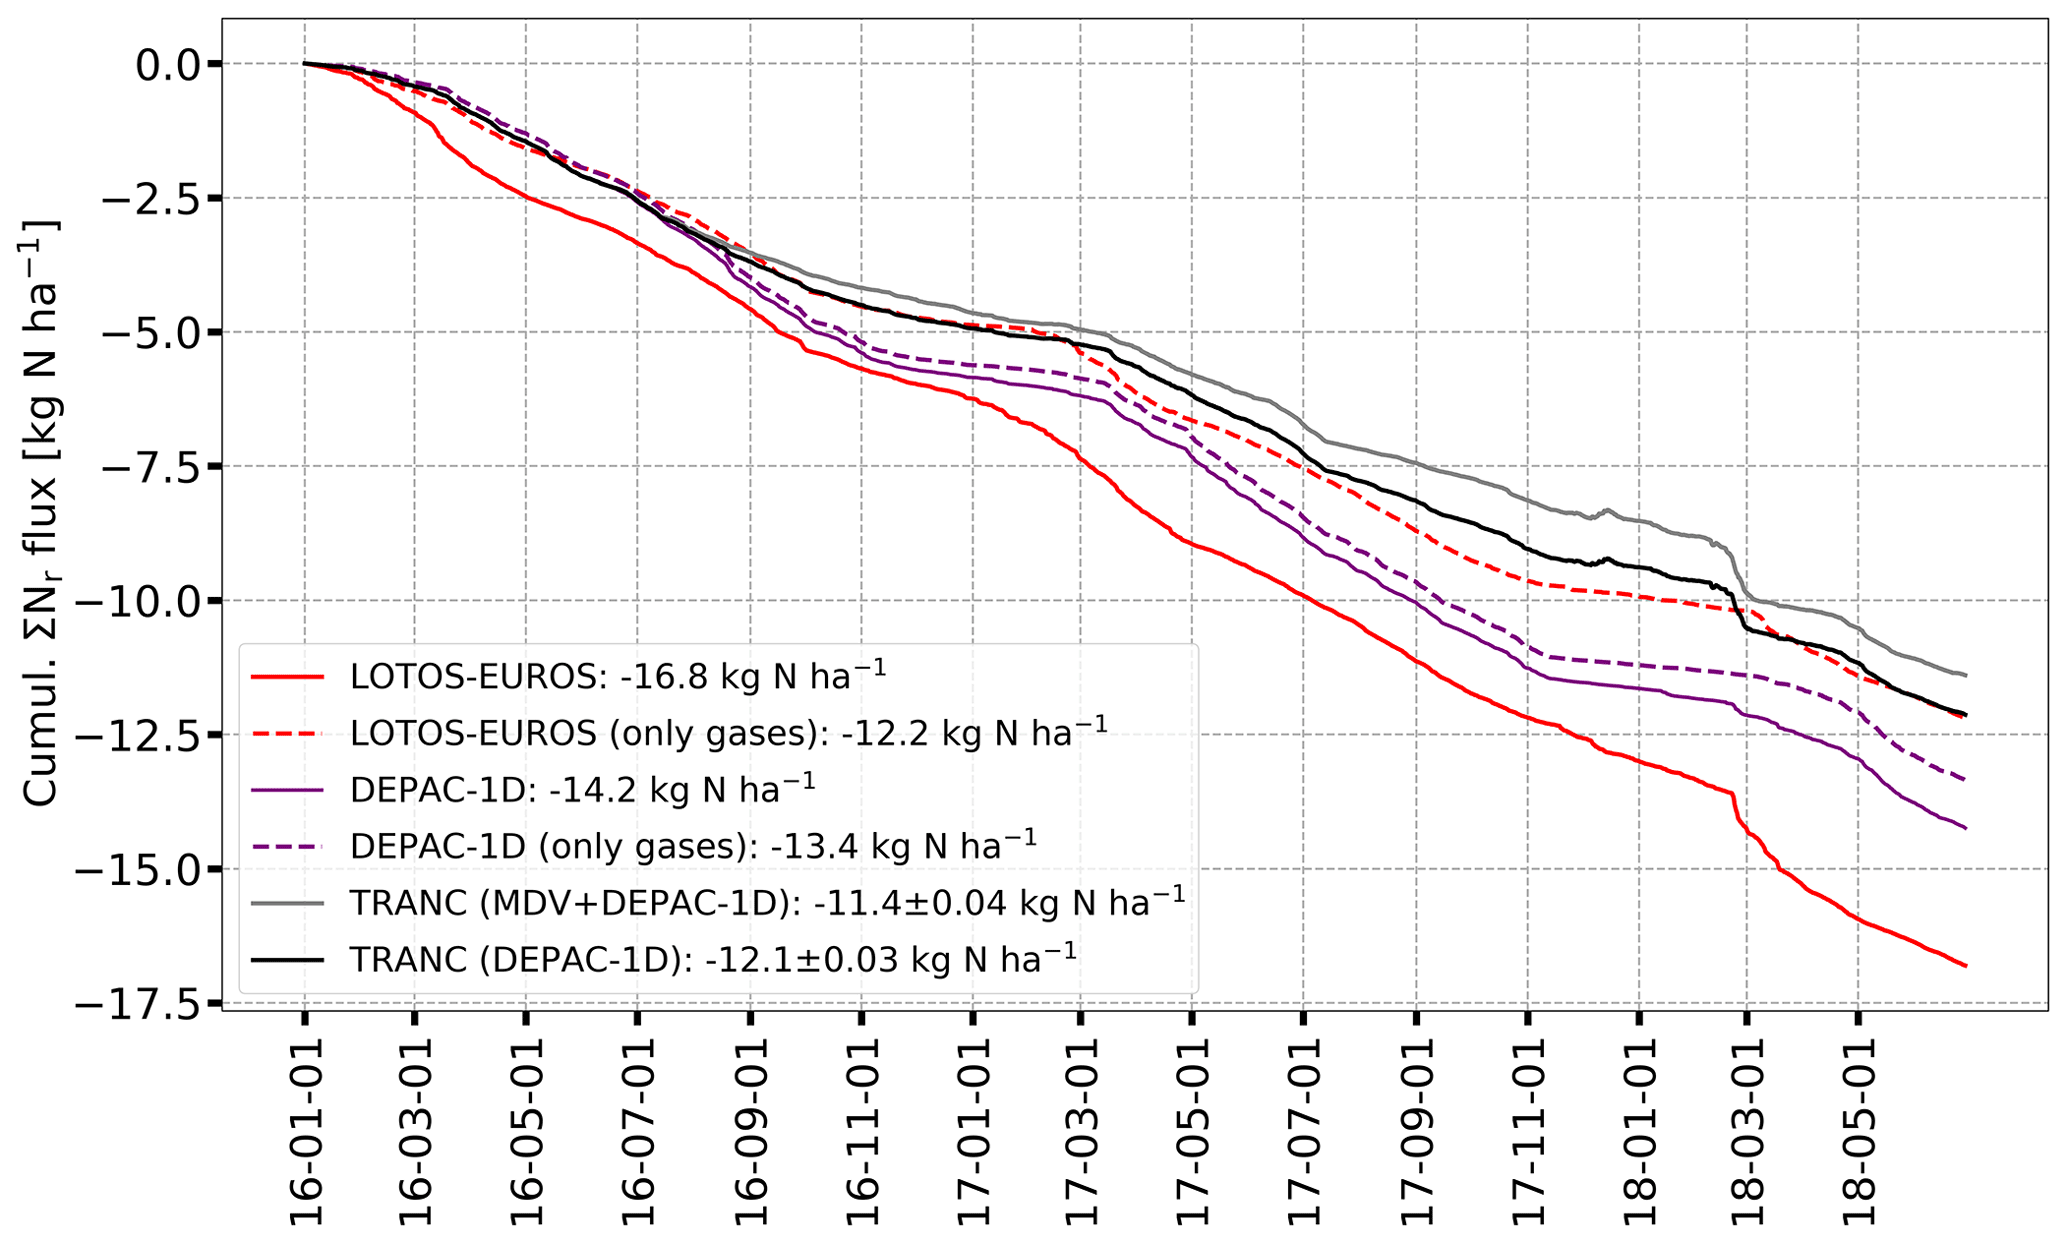
Figure 7Comparison of measured and modeled cumulative ΣNr dry deposition after gap filling for the entire measurement campaign. Colors indicate different methods: TRANC+DEPAC-1D (black), TRANC + MDV + DEPAC-1D (gray), DEPAC-1D (purple), and LOTOS-EUROS (red). Dashed lines refer to cumulative dry deposition considering only gases. Number shown in the legend represent dry deposition and uncertainties after 2.5 years.
Since all cumulative curves generally exhibit the same shape, we conclude that the variability in fluxes is reproduced by DEPAC-1D and LOTOS-EUROS well, although the amplitude and duration of certain deposition events are different. Furthermore, both gap-filling strategies resulted in similar deposition estimates, showing that the application of MDV as a gap-filling tool is reasonable. Uncertainties related to the gap-filled TRANC time series through MDV and DEPAC-1D (Eq. 1) were negligible. In Fig. 8, a comparison of the ΣNr dry deposition separated by methods and measurement years is shown. Corresponding values of the dry deposition estimates are given in Table 2.
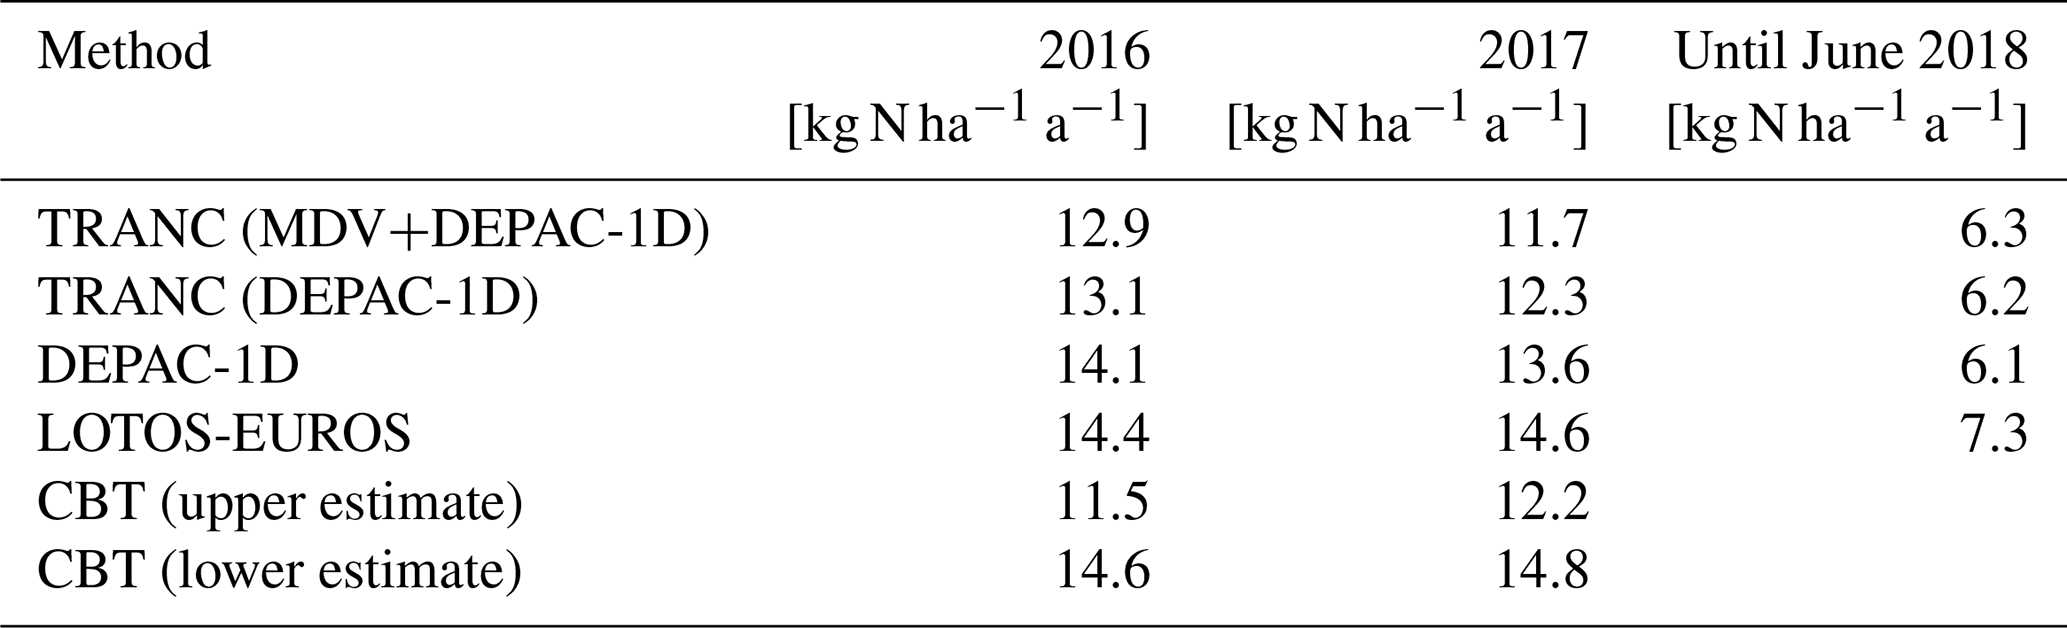
Table 2ΣNr dry deposition of TRANC, DEPAC-1D, LOTOS-EUROS, and CBT for the entire measurement campaign, i.e., January 2016 to June 2018. Results from CBT were weighted according to the measured land-use weighting. For a visualization of the annual dry deposition, see Fig. 8.
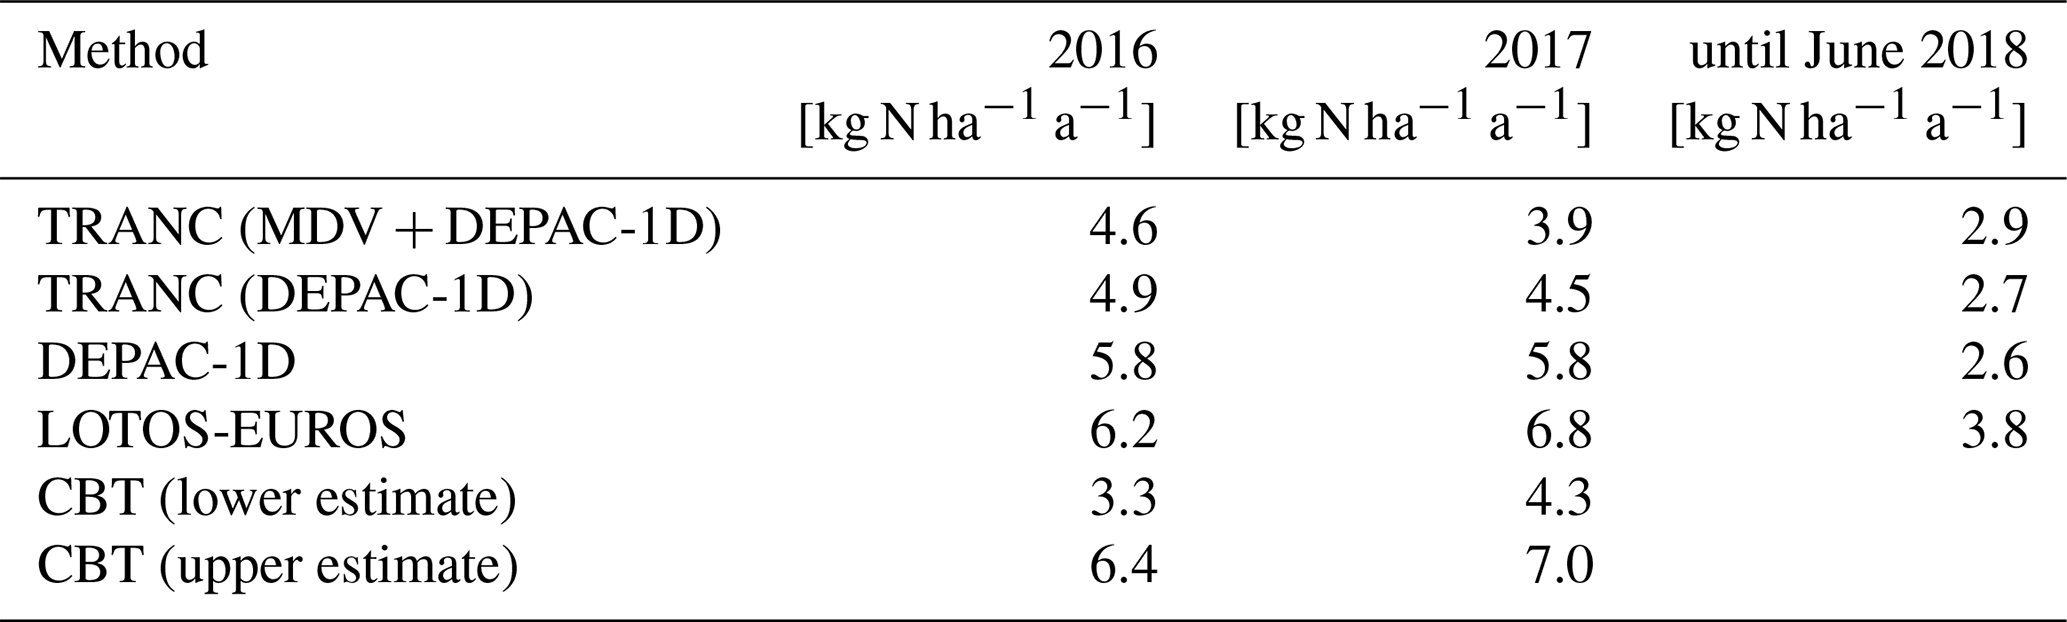
In 2016, annual TRANC deposition was higher than in 2017. Using only DEPAC-1D as a gap-filling technique resulted in slightly higher dry deposition estimates. In 2018, the difference to TRANC estimates until June was caused by the deposition fluxes in February 2018, which had an influence on the MDV method, leading to significantly larger gap-filled fluxes. Hence, the DEPAC-1D estimate was lowest among all the methods for the first half of 2018. In 2016 and 2017, deposition estimates of DEPAC-1D were nearly identical due to similarities in micrometeorological and concentration input values. As expected from Fig. 7, annual LOTOS-EUROS estimates were highest in comparison to DEPAC-1D and TRANC. All deposition estimates were within the range of long-term lower and upper estimates of the CBT approach, as estimated from 2010 to 2018, with TRANC measurements being close to the lower average and LOTOS-EUROS predictions being close to the higher average.
Averaging of the annual sums of each method for 2016 and 2017 resulted in a TRANC dry deposition of 4.3 ± 0.4 and 4.7 ± 0.2 kg N ha−1 a−1, depending on the gap-filling approach. DEPAC-1D showed 5.8 ± 0.1 kg N ha−1 a−1, and LOTOS-EUROS predicted 6.5 ± 0.3 kg N ha−1 a−1. We determined 6.7 ± 0.3 kg N ha−1 a−1 with CBT as the averaged upper estimate and 3.8 ± 0.5 kg N ha−1 a−1 as the averaged lower estimate.
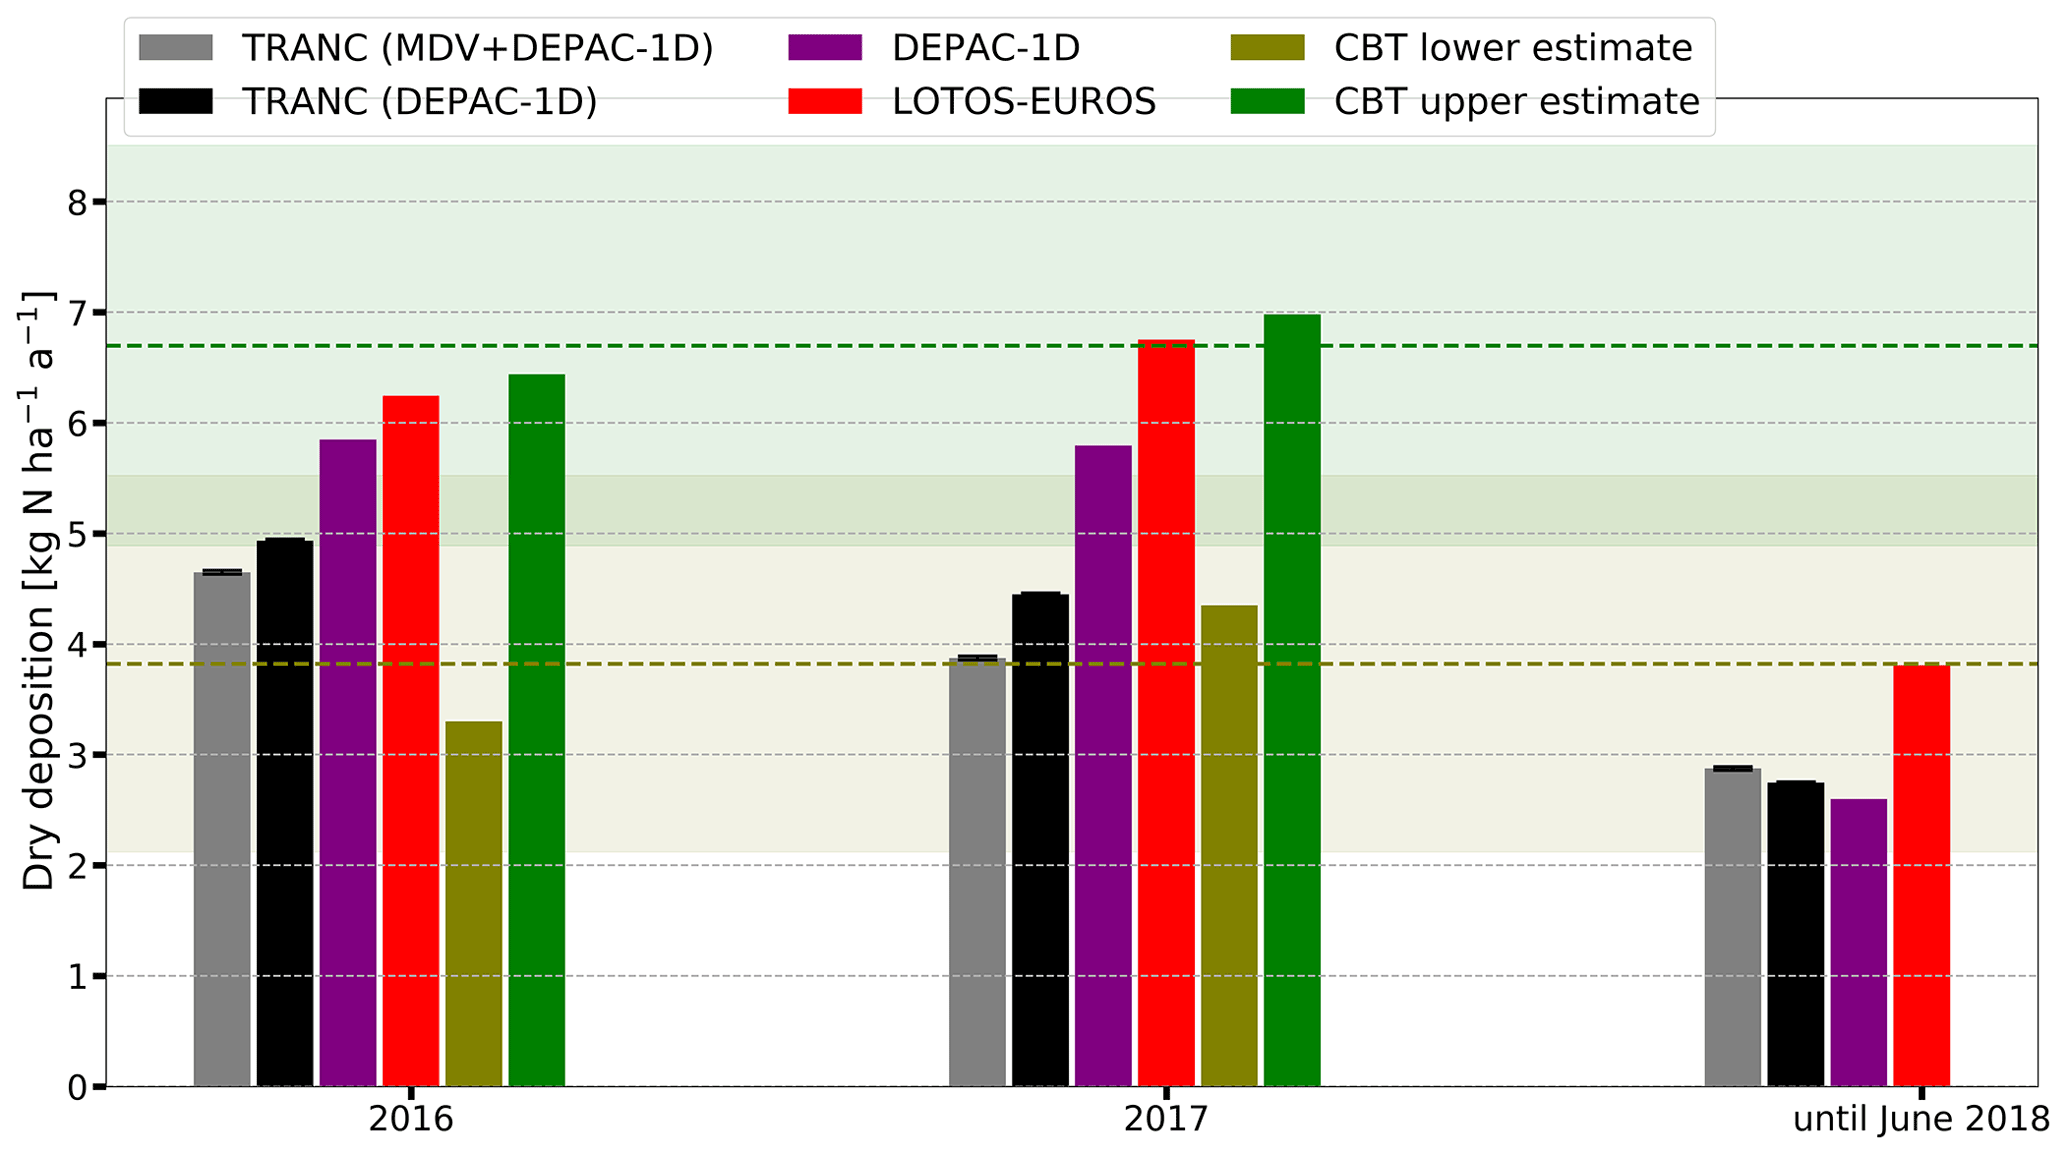
Figure 8ΣNr dry deposition for the years 2016 and 2017 and from January to June 2018 shown as a bar chart. Colors indicate different methods: TRANC(DEPAC-1D) (black), TRANC(MDV + DEPAC-1D) (gray), DEPAC-1D (purple), LOTOS-EUROS (red), and canopy budget technique (olive and green). Data from TRANC, DEPAC-1D, and LOTOS-EUROS range from January 2016 to June 2018. CBT's lower and upper estimates weighted according to the measured land use. The colored dashed lines indicate that the averaged dry deposition of the lower and upper estimates (dashed, brown line and dashed, olive line, respectively) were from 2010 to 2018; the shaded areas represent their standard deviation.
4.1 Comparison of concentrations, fluxes, and annual budgets
Differences in the concentration contribution of Nr species to ΣNr
According to the LOTOS-EUROS simulations, NH3 had a predominant role in the ΣNr concentration pattern. This result was in contrast to concentration measurements of individual Nr species at the site highlighting NOx as the prevailing compound in the concentration pattern of ΣNr (Wintjen et al., 2022). The predominant role of NH3 in the modeled concentrations is caused by the emission inventory used in this study. The emission inventory spatially allocates NH3 manure-derived emissions through a procedure in which the animal numbers per region and the agricultural land within a region are the two proxies used. Emissions from fertilizer application are allocated solely on land use. Hence, within a region, all agricultural land is assumed to emit the same amount of NH3, although the intensity of the agricultural practice and the distribution of housing may vary substantially within such a region. Only south of the site, agricultural lands are located within a 7×7 km2 model resolution representing the site. This means that, in the grid cell of the model in which the station is located, there is an emission source that contributes an increased NH3 concentration, even when the wind directions do not transport air from this agricultural region towards the station.
In LOTOS-EUROS, particulate nitrogen also demonstrated a significant contribution to modeled ΣNr, which could not be confirmed by measurements. However, the comparison of particulate nitrogen concentrations is difficult because of the aerosol cut-off size in DELTA measurements being at 4.5 µm (Tang et al., 2015). Aerosols available in fine mode, like ammonium sulfate ((NH4)2SO4) and ammonium nitrate (NH4NO3), are associated with an aerodynamic diameter of less than 2.5 µm (Kundu et al., 2010; Putaud et al., 2010; Schwarz et al., 2016) and could be sufficiently sampled. Concentrations of coarse-mode aerosols with larger diameters than the cut-off size were partly underestimated. However, concentrations of sodium, magnesium, and calcium ions were negligible at the site (Wintjen et al., 2022), indicating that coarse-mode nitrate aerosols had no significant contribution to the ΣNr concentration. In addition, carbonate-coated denuders used for collecting HNO3 overestimate concentrations by approximately 45 %, since nitrous acid also sticks to those prepared surfaces (Tang et al., 2021). Thus, disagreements could be related to the emission inventories of PM2.5 and PM10, the chemical process modeling, or the DELTA measurements.
NOx concentrations agreed in their seasonal dynamics; thus, processes responsible for modeling the temporal dynamics of NOx emissions are implemented reasonably in LOTOS-EUROS. However, the systematic underestimation of NOx concentration by LOTOS-EUROS shows that NOx sources within this grid cell, most likely emissions from road transport and private households due to the absence of large industrial areas or power plants in the surroundings of the station, are presumably not tracked sufficiently by the emission inventory.
Generally, the low measured concentrations of Nr compounds show that the site was mostly outside the transport range of nitrogen-enriched air masses. Improvements in the close-range transport in LOTOS-EUROS with regard to the atmospheric lifetime of Nr species or in the definition of atmospheric layers are likely needed. A reduction in grid cell size could lead to a more accurate localization of potential nitrogen emission sources and a better description of close-range transport and dilution effects. The impact of an increase in model resolution is elaborated on in Sect. 4.2.2.
Differences in measured and modeled ΣNr fluxes
Overall, measured and modeled ΣNr deposition were comparable in terms of order of magnitude and partly agreed in temporal dynamics but still exhibited disagreements in flux amplitude, which were related to differences in concentration, micrometeorology, and the integration of exchange pathways in DEPAC. Currently, a compensation point is only implemented for NH3, and thus, only deposition fluxes could be modeled for other compounds. Since the total compensation point of NH3 was negligible in DEPAC, emission fluxes of NH3 observed for a deciduous forest by Hansen et al. (2015), probably due to a decay of fallen leaves (Hansen et al., 2013), could not be reproduced. The soil compensation point, which is integrated in the calculation of the NH3 compensation point but is currently set to zero, may reduce the observed differences to TRANC fluxes. The observed temporal pattern in vd of NO2 is related to the stomatal uptake, which is close to zero in winter and is highest in summer. The slight difference in the deposition velocities of NO2 were caused by higher measured concentrations of NOx (see Fig. S2). In addition, no compensation point is implemented for NO2, and deposition on leaves is hardly allowed. Both assumptions are in disagreement with findings by Horii et al. (2004), who identified non-stomatal deposition as being the strongest contributor to the flux, and by Thoene et al. (1996), who proposed the existence of a compensation point for NO2. However, nitrogen concentrations in leaf samples taken from surroundings of the site showed no unusually high enrichment of nitrogen in leaves and needles (Beudert and Breit, 2014). Thus, neglecting the emission pathway of oxidized nitrogen compounds like NO2 seems reasonable for the measurement site.
To reduce the difference between measured and modeled fluxes, considering nitrogen emissions from soil may lead to a closer agreement with flux measurements. As written above, soil compensation point has no influence on the deposition of Nr species in DEPAC yet, and soil resistance implementation is kept simple: a constant value is assumed, depending on the soil wetness (dry, wet, or frozen). Improvements in the description of the exchange with the soil surface may allow one to describe the observed TRANC emission fluxes in December 2017, as reported by Wintjen et al. (2022). Changes made to the soil exchange path may lower the flux contribution of NH3, as outlined before, but may also increase the contribution of NO, since the latter is generally observed as an emission from soil if it is produced through (de)nitrification processes (Butterbach-Bahl et al., 1997; Rosenkranz et al., 2006). At the reference height, the contribution of NO may still be low due to fast conversion processes to NO2 in the presence of ozone (O3) within the forest canopy, especially close to the ground (Rummel et al., 2002; Geddes and Murphy, 2014). Increased NO2 concentrations within the forest canopy may alter concentrations of various Nr species, e.g., resulting in the formation of HNO3, which may contribute substantially to the deposition flux (Munger et al., 1996; Horii et al., 2006). Consequently, a soil compensation point may be also relevant for the exchange of other Nr species next to NH3.
The observed large deposition fluxes in February 2018 were reproduced in the model simulations, although the modeled flux amplitude was smaller. During that time, modeled concentrations and fluxes of particulate Nr were the largest contributor to total ΣNr, leading to the assumption of particle-driven ΣNr deposition. DELTA measurements suggested that particulate NH was most likely responsible for the measured ΣNr deposition (Wintjen et al., 2022, Fig. 10). Modeled and measured NH concentrations differed by only 0.75 µg N m−3, whereas a significant disagreement was found between NH3 measurements and LOTOS-EUROS (approx. 2.7 µg N m−3). According to DELTA measurements, the NH3 concentration was approximately 0.17 µg N m−3. The averaged SO2 concentrations obtained from LOTOS-EUROS and DELTA were comparable during the exposure period of the samplers (1.5 and 2.0 µg m−3, respectively). According to the LOTOS-EUROS simulations, an excess of pNH over pNO was modeled, suggesting that particle deposition was most likely caused by pNH, which is in agreement with DELTA measurements. In conclusion, the high deposition fluxes seem to be driven by particulate NH compounds, ammonium sulfate, and ammonium nitrate. During February 2018, DELTA measurements revealed a slightly lower concentration of the SO than the NO aerosol – 1.28 and 1.63 µg m−3, respectively – suggesting that NH4NO3 was most responsible for the observed ΣNr deposition fluxes. Still, the dominant aerosol is not fully known due to missing high-resolution measurements of nitrogen aerosols. Apart from February 2018, winter fluxes of LOTOS-EUROS were large compared to DEPAC-1D, although the same size-resolved model for determining aerosol deposition velocities was used. By comparing dry deposition of DEPAC-1D and LOTOS-EUROS caused by gases + particles and gases only (Fig. 7), a substantial disagreement in aerosol deposition was found. The large particulate nitrogen fluxes of LOTOS-EUROS are caused by uncertainties in the stability parameterization (Sect. 4.2.2). Issues in the description of turbulence-controlled deposition also had an effect on HNO3, since its Rc is set to a relatively low constant value. Thus, LOTOS-EUROS deposition fluxes of HNO3 were substantially higher in winter than deposition fluxes of DEPAC-1D. During summer, differences in the deposition velocities were related to higher measured concentrations of HNO3 (see Fig. S2).
Analysis of ΣNr deposition estimates
The ΣNr dry deposition estimates of TRANC, DEPAC-1D, and LOTOS-EUROS were in the same range after 2.5 years, but differences in seasonal flux patterns were found. In addition, both gap-filling methods applied to flux measurements led to similar dry deposition estimates, indicating that the MDV approach is suitable for gap-filling of short-term gaps in TRANC flux time series. During summer, we found differences in the gap-filled fluxes due to systematic overestimation of DEPAC-1D, which was related to the different response of DEPAC-1D to micrometeorological conditions compared to TRANC (Fig. 4). It should be kept in mind that monthly integrated pNO, pNH, and HNO3 concentration estimates may not be able to fully capture local events. Moreover, the aerosol cut-off size of DELTA was probably lower than that of the TRANC measurements, as supposed by Wintjen et al. (2022). Saylor et al. (2019) also noted that the vd of particles for forests are highly uncertain. Thus, differences in the measurements and predictions of LOTOS-EUROS in particle deposition could be expected. Besides missing emission fluxes in DEPAC-1D, the agreement of the dry deposition estimates was reasonable, indicating that an inferential model like DEPAC-1D can be a valuable alternative to purely statistical gap-filling tools at sites or seasons with predominant N deposition.
Annual dry deposition estimates from TRANC, LOTOS-EUROS, and DEPAC-1D were found to be within the range of the lower and upper estimates of the CBT approach. Adding the wet-only deposition results reported in Wintjen et al. (2022) to the determined dry depositions, we calculated annual total depositions ranging between 11.5 and 14.8 kg N ha−1 a−1, as noted in Table 3 for each year.
Table 3Annual ΣNr deposition of TRANC, DEPAC-1D, LOTOS-EUROS, and CBT for 2016, 2017, and from January to June 2018 in kg N ha−1 a−1. Wet-only depositions of NO, NH, and DON were adapted from Wintjen et al. (2022).
Comparing the results obtained from the measurement site to results obtained for other forest ecosystems using a similar validation procedure is rather difficult due to the large temporal and spatial variability in Nr compounds contributing to ΣNr. Additionally, micrometeorological measurements, as carried out in this study, require substantial effort in the maintenance and processing of the acquired data. Thus, most currently available EC measurements are limited to time periods covering a few weeks or months and are only available for certain locations.
Recently, Ahrends et al. (2020) compared deposition estimates of a CBT approach, an inferential method, and LOTOS-EUROS for several forest ecosystems. However, their CBT was based on the variant suggested by Ulrich (1994), which is different to the version used in this study, and their inferential method (IFM) was only applied to NO2 and NH3 due to the limited availability of ambient concentration measurements for other Nr compounds. In addition, deposition velocities for NO2 and NH3 were calculated based on literature research for different forest types and were accompanied by various correction factors. They reported similar annual dry deposition estimates for CBT and IFM, which were found to be 12.6 and 12.9 kg N ha−1 a−1, respectively. Minimum dry deposition was 3.8 kg N ha−1 a−1 for CBT and 1.0 kg N ha−1 a−1 for IFM. The lowest average dry deposition was 9.3 kg N ha−1 a−1, given by LOTOS-EUROS, but its minimum dry deposition was highest (approx. 6.3 kg N ha−1 a−1). Since we measured N deposition in a low-polluted environment, the agreement to the minimum dry deposition estimates of Ahrends et al. (2020) seems reasonable.
In the consideration of critical loads, total nitrogen deposition is within the proposed limits. Critical loads ranging from 10 to 15 kg N ha−1 a−1 and 10 to 20 kg N ha−1 a−1 were defined by Bobbink and Hettelingh (2011) for Picea abies and Fagus sylvatica, respectively. Since Picea abies was the prevailing tree species in the flux footprint (approx. 80 %), the critical load of the investigated forest ecosystem is probably closer to the limits of Picea abies. The state of tree physiological parameters suggested that the critical load concept, which indicated that the exposure of the forest to N deposition is still below critical limits, is a valuable tool to evaluate the functionality of an ecosystem. Long-term observations of nitrogen input to this ecosystem showed nitrogen concentrations in trees and water reservoirs, but ecosystem functionality was not impaired. According to leaf examinations done by Beudert and Breit (2014) at the site, balanced ratios of nitrogen to other nutrient concentrations in tree foliage were found, and usual tree growths were reported. Jung et al. (2021) found low nitrate concentrations in soil water, aquifers, and streams at the site, showing an intact nitrogen retention and storage system. Moreover, green algae coatings on spruce needles, usually indicating higher NHx dry deposition (Grandin, 2011), were not found at the site.
4.2 Modeling uncertainties
Influence of micrometeorological parameters
In both DEPAC-1D and LOTOS-EUROS, wet leaf surfaces and high relative humidity were identified as conditions enhancing ΣNr deposition from May to September. In the case of temperature, dry leaf surfaces, and low relative humidity, diurnal cycles of vd showed a different behavior: for DEPAC-1D, lower temperatures were found to increase vd, whereas the opposite observation was made for LOTOS-EUROS, and their shapes were different. These disagreements were probably related to the stomatal uptake of NH3 prevailing in the ΣNr deposition flux of LOTOS-EUROS. Only for wet leaf surfaces and high relative humidity, which generally play an important role in the deposition of NH3 (Wentworth et al., 2016), were diurnal shapes of DEPAC-1D and LOTOS-EUROS similar, suggesting that the cuticular deposition of NH3 seemed to be most responsible for the modeled ΣNr dry deposition at the measurement site. Similar observations were made by Wyers and Erisman (1998), who identified the cuticular pathway as a larger sink for NH3 than the stomatal pathway.
However, the results from TRANC measurements highlighted higher temperatures, lower relative humidity, and dry leaf surfaces as important factors enhancing ΣNr deposition, and diurnal cycles of the TRANC were different in shape from those of LOTOS-EUROS. The differences in night-time deposition are probably related to low aerodynamic resistances in the model applications indicating high u∗ values, which could not be verified by EC measurements. However, measuring night-time exchange with the EC method and micrometeorological methods in general is challenging. Common detection algorithms for a u∗ threshold (Reichstein et al., 2005; Barr et al., 2013) are not applicable to Nr species yet, since they are optimized for CO2. The contradiction in wet and dry conditions lead to the assumption that the current implementation of the NH3 exchange pathways in DEPAC was not fully suited for predicting NH3 deposition correctly and needs further investigation. It should be kept in mind that we measured ΣNr exchange at a low-polluted, mixed forest site. Sites with different micrometeorology, vegetation, and pollution climate may exhibit other parameters – like surface wetness, canopy temperature, and ambient concentration – that are responsible for the ΣNr exchange, as found by Milford et al. (2001). Further comparisons to flux measurements of ΣNr and NH3 are needed to investigate the role of stomatal and cuticular deposition.
Influence of soil resistance and soil compensation point
In DEPAC, soil resistance is set to a constant value, depending on soil status: frozen (Rsoil=1000 s m−1), dry (Rsoil=100 s m−1), or wet (Rsoil=10 s m−1). In addition, the in-canopy resistance (as part of the effective soil resistance) is dependent on the inverse of u∗, surface area index (LAI + area index of stems and branches, van Zanten et al., 2010), and may lower the exchange with the soil. A soil compensation point is currently set to zero for NH3 and is not implemented for other Nr species, since an appropriate parameterization or value is not known, so far as is argued by van Zanten et al. (2010). Consequently, deposition through the soil pathway is close to zero for most half-hourly records according to the current parameterization. Including a soil compensation point in DEPAC and improvements in the soil resistance parameterization may lead to a better agreement with flux measurements. However, modifications related to soil exchange are probably challenging, since they may affect the contribution of various Nr species to the ΣNr flux; additionally, a parameterization of soil resistance, e.g., depending on soil moisture and temperature, is probably required instead of assuming a constant value.
At the site, no measurements of soil conductance, soil moisture, and soil temperature were made. Thus, we cannot evaluate the representativeness of the current soil parameterization. Moreover, those measurements would have been challenging at the site due to the large spatial variability in the wide flux footprint area. For further measurement campaigns of a similar nature, measurements of soil-specific parameters are highly recommended.
Cuticular compensation point of NH3
Schrader et al. (2016) discovered problems in the calculation of the cuticular NH3 compensation point under high ambient NH3 concentrations and high temperatures – for instance, during summer. The current implementation of Wichink Kruit et al. (2010) in DEPAC likely underestimates the cuticular compensation point at high temperatures. This issue is not solved yet and could not be verified for our measurement site due to generally low NH3 concentrations and, to some extent, the implementation of monthly averaged NH3 concentrations instead of half-hourly values in the concentration time series of NH3. Moreover, the cuticular emission potential was estimated from monthly averaged concentrations in LOTOS-EUROS and DEPAC-1D instead of from instantaneous values, as in the original parameterization of Wichink Kruit et al. (2010), which likely somewhat alleviates the issue discussed in Schrader et al. (2016). Thus, this issue could not be the main reason for the difference to flux measurements at our site.
Influence of emission fluxes on ΣNr
With the TRANC system, the contribution of ΣNr emission fluxes above the limit of detection was estimated to be 16 % (Wintjen et al., 2022). Unfortunately, robust QCL-based NH3 flux measurements using the EC method were not possible at the measurement site (Wintjen et al., 2022). Thus, the contribution of individual Nr species – at least the NH3 and, hence, the reduced N contribution – to the measured ΣNr flux is not known. However, the presence of emission fluxes shows that the implementation of a compensation point for soil and/or mechanisms describing emissions of oxidized Nr species like NO2 and HNO3 should be considered. As described above, fully integrating the soil compensation point in the exchange of NH3 may explain emissions fluxes of ΣNr. For HNO3, emission fluxes were reported in recent publications (Tarnay et al., 2002; Farmer and Cohen, 2006, 2008). The latter conducted flux measurements of HNO3 above a pine forest and found a significant contribution by emission fluxes during summer. Those emissions could also be induced by the evaporation of NH4NO3 from leaf surfaces, occurring at higher temperatures (Wyers and Duyzer, 1997; Van Oss et al., 1998), or by particles deposited or formed on leaf surfaces, as discussed by Nemitz et al. (2004). Emission fluxes of NO and NO2 were reported in several publications – e.g., Farmer and Cohen (2006), Horii et al. (2004), and Min et al. (2014) – leading to the assumption of the existence of a compensation point (Thoene et al., 1996), whereas other authors still critically discuss such a compensation point for NO and NO2 (Chaparro-Suarez et al., 2011; Breuninger, et al., 2013; Delaria, et al., 2018, 2020). Since no significant N concentrations in leaves were found at the site (Beudert and Breit, 2014), the integration of a compensation point for NO2 is probably less useful for the measurement site. Still, further flux comparisons of oxidized nitrogen compounds to their modeled entities are needed – this would possibly lead to improvements in the representation and accurate apportionment of exchange pathways in (bi)directional resistance models.
4.2.1 Uncertainties in DEPAC-1D
Leaf area index and displacement height
Besides the current implementation of the exchange pathways in DEPAC, deposition estimates would be more accurate if concentration measurements at a higher time resolutions and measurements of the LAI were to be available. We did not take measurements of the LAI or other vegetation properties at the measurement site. Still, the interpretation of differences to flux measurements would be challenging, since the vegetation inside the flux footprint was not uniform. Inside the footprint, we identified dead wood in a southern direction and a mix of rather young and matured trees in an easterly direction. Differences in tree age were related to a dieback by bark beetle in the mid-1990s and 2000s (Beudert and Breit, 2014), from which the forest stand is still recovering. Shifting z0 or d by ± 50 % caused a change of +5.0 % to −3.2 % and +5.6 % to −9.1 %, respectively, in the nitrogen dry deposition after 2.5 years. An incorrect assessment of the modeled LAI by ± 50 % had a significant influence on the dry deposition. It led to a change of +18.9 % to −27.2 %. It shows that, in further field applications of DEPAC-1D measurements, the LAI should be considered, but an incorrect assessment of the LAI alone would not explain the overestimation of DEPAC-1D to TRANC measurements.
Using long-term concentration averages
The main uncertainty of DEPAC-1D fluxes was most likely the usage of monthly integrated DELTA concentrations for the Nr compounds. Thus, the large variability in the time series of these compounds – happening on timescales of a few seconds – was not accounted for in deposition modeling. Even with high-resolution measurements of the QCL, the short-term variability in NH3 concentrations was not detectable (Wintjen et al., 2022). As stated in Sect. 2.2.3, we did not superimpose monthly concentration values with synthetic diurnal patterns. Concentrations of Nr compounds are highly variable during the day and depend on various parameters, such as turbulence, temperature, relative humidity, precipitation, and emission sources. Thus, it is not possible to capture the short-term variability of Nr species, which is induced by those parameters, with long-term averages. We found that the NH3 concentration was generally low during winter and demonstrated a low variability, as found by the measurements. During those times, using monthly integrated averages is reasonable (Schrader et al., 2018). However, we probably overestimated modeled fluxes due to the use of monthly averaged concentrations. In order to get at least an impression of which Nr compounds' fluxes may be biased by this approach, we compared monthly averaged fluxes of LOTOS-EUROS (A1) with fluxes calculated by multiplying monthly averaged vd with their monthly concentration averages (A2) and subsequently corrected them by applying Eqs. (9) and (10) of Schrader et al. (2018). Generally, we found that all Nr compounds' fluxes were overestimated by A2, whereas the difference to A1 depends on the investigated Nr compound and season. All Nr compounds had it in common that the difference between both approaches was negligible during seasons with small deposition fluxes – for example, in winter. Within seasons of large deposition fluxes, significant discrepancies were found, particularly for NH3. Overall, mean absolute deviations to A1 were 35.0, 0.27, 0.18, 0.92, 2.5, and 2.4 ng N m−2 s−1 for NH3, NO2, NO, HNO3, NH, and NO, respectively.
It should be considered that we used LOTOS-EUROS data for this comparison. Particularly for NH3, NH, and NO, their modeled seasonality and concentrations exhibited significant disagreements with DELTA measurements. Thus, the flux overestimations should be seen as a highest guess. Measured high resolution concentrations would have led to lower values. Still, the comparison highlights the necessity for high-resolution measurements of Nr compounds. Those measurements should be made for Nr compounds, which probably maintain the exchange dynamics of ΣNr at a certain site and thereby at least cover time periods with large temporal variations in their concentrations. This procedure was performed for NH3 and NO2 at the measurement site and should be considered for further measurement campaigns.
4.2.2 Uncertainties in LOTOS-EUROS
The larger nitrogen deposition values for the measurement site as modeled by LOTOS-EUROS are mostly related to the overestimation of modeled input NH3 concentrations. As visualized by Fig. S1, LOTOS-EUROS clearly exceeds observed NH3 concentrations in spring and autumn. Such an overestimation of NH3 and NH in precipitation at forest monitoring sites was identified before for stations in Baden-Württemberg and Bavaria (Schaap et al., 2017). A similar systematic overestimation by the model in southern Germany in comparison to novel NH3 satellite data has also been identified (Ge et al., 2020). This leads us to believe that the overestimation is largely due to shortcomings in the emission information (Sect. 4.1), potentially in combination with the model resolution.
A reduction in grid cell size could lead to a more precise localization of potential nitrogen emission sources and a better description of close-range transport and dilution effects. For a simulation covering 2015, we were able to calculate concentrations and fluxes at a higher grid cell resolution (2×2 km2) and compared the results to the standard spatial resolution (7×7 km2). In the case of the high grid cell resolution, concentrations were lower – but only by 2 % to 10 %, depending on the compound – compared to the standard spatial resolution. For the higher grid cell resolution, the annual N budget was higher than the budget of the standard spatial resolution case study, but only by 4.3 %, probably due to differences in the relative fractions of land-use classes. The contribution of forest land-use classes was likely higher in the case of the high spatial resolution. The higher grid cell resolution probably led to improvements in modeling atmospheric turbulence, resulting in higher deposition velocities. This example shows that the grid cell resolution of 7×7 km2 is not primarily responsible for the overestimation of concentrations and fluxes by LOTOS-EUROS.
Nevertheless, the seasonal cycle also indicates that the information, which LOTOS-EUROS extracts from the emission inventory, does not agree well with agricultural management practiced in the surroundings of the Bavarian Forest. The agricultural fields close to the Bavarian Forest are predominantly extensively managed grasslands. Manure application to grasslands is known to occur much more evenly in terms of distribution across the year in comparison to manure application for crop production, which mainly occurs before or during the growing season. Hence, in reality, the emission variability may be more evident under summer conditions. Currently, the detailing of crop-dependent emissions made within LOTOS-EUROS – i.e., the use of variable emission fractions within German regions in combination with the recent timing module of Ge et al. (2020) – is under investigation to elucidate if these factors contribute to the measurement–model mismatches observed for the measurement site.
Additional features may also contribute to the observed differences. Within LOTOS-EUROS, modeled concentrations were written out for a reference height of 2.5 m above z0, which was lower than the measurement height of the flux tower. Slight differences between measured and modeled micrometeorological input data were found – for example, the difference in relative humidity in the first half of 2016. Differences for that time period were related to the usage of local meteorological data taken at 50 m, which was higher than the model layer height associated with air temperature and relative humidity. The deviations in u∗, as illustrated in Figs. S6 and 5, were related to differences in measurement heights at which wind speeds and roughness lengths were calculated. The model grid cell consists of various vegetation types, each with a unique surface roughness length. We showed that the weighting of the land-use classes within the grid cell was not in agreement with the vegetation of the flux footprint affecting micrometeorological variables, e.g., , and thereby the calculation of Ra and Rb.
The large contribution of aerosols to the total deposition (Fig. 7) modeled by LOTOS-EUROS was accompanied by unusually high deposition velocities of pNH, pNO, and HNO3 from November 2017 to February 2018. LOTOS-EUROS did an integration over a fixed (i.e., neglecting influence of humidity) size distribution using a lognormal size distribution which needs a mass mean diameter, a geometric standard deviation, and a size-cut range to calculate vd for particles. Deposition of HNO3 and particulate nitrogen is mostly driven by the aerodynamic resistance and quasi-laminar resistance, Ra, and Rb. Since the vd of those compounds was relatively high compared to measurements during that time, Ra and Rb were probably low or even close to zero. Ra and Rb depend on various parameters like u∗, the integrated stability corrections functions after Webb (1970) and Paulson (1970), surface roughness, and leaf area index. L determines the integrated stability functions and depends on wind speed close to the surface, cloud cover, and solar zenith angle (Manders-Groot et al., 2016). Snow cover is not considered in the parameterization of L yet. Including snow cover in the parameterization affects the albedo of the surface and thus the prevailing stratification of the boundary layer, which probably leads to more occurrences of stable stratification. An implementation of snow cover in the parameterization of L may reduce the deviations of simulated vs. measured stability and u∗.
An incorrect setting of the LAI and z0 can have a significant influence on modeled ΣNr deposition, as shown in Sect. 4.2.1. The relative changes in modeled ΣNr deposition caused by LAI and z0 were comparable to values recently presented by van der Graaf et al. (2020), who used satellite-derived LAI and z0 data from the Moderate Resolution Imaging Spectroradiometer (MODIS) to calculate ΣNr deposition with LOTOS-EUROS for a grid cell size of 7×7 km2. Overall, they observed changes in ΣNr dry deposition ranging from −20 % to +30 %. However, if LAI and z0 from MODIS were used, there was almost no change observable in ΣNr dry deposition and in NH3 concentration for the Bavarian Forest measurement site. The attempts of van der Graaf et al. (2020) and Ge et al. (2020) did not provide a solution for the general overestimation of the NH3 deposition above southern Germany. We assume that the spatially and temporally imprecise allocation of emission data is most responsible for the disagreement to flux measurements. Further investigations on these issues are needed.
The annual total reactive nitrogen (ΣNr) dry deposition estimates of all methods were in the same range, considering uncertainties of measured fluxes and model applications. Annual estimates from the Total Reactive Atmospheric Nitrogen Converter (TRANC) were lower than the results from an in situ inferential modeling approach using the bidirectional flux model DEPAC (Deposition of Acidifying Compounds) (here called DEPAC-1D) and the chemical transport model LOTOS-EUROS (Long-Term Ozone Simulation – European Operational Smog) v2.0. Annual dry deposition estimates of TRANC, DEPAC-1D, and LOTOS-EUROS were within the minimum and maximum dry deposition estimates of the canopy budget technique (CBT), showing ecological and micrometeorological measurements that provide reasonable estimates. According to the critical load concept, annual nitrogen deposition was below critical values. Findings were supported by local vegetation samplings showing no indications of nitrogen exceedances, leading to the conclusion that the critical load concept is a useful tool to describe the health status of an ecosystem.
Differences between DEPAC-1D and TRANC measurements could be related to uncertainties in parameterizing the exchange pathways of reactive gases, the usage of low-resolution input data, or the missing exchange pathway with soil. Modeled ΣNr deposition velocities of DEPAC-1D were enhanced with regard to wet conditions, which was in contrast to TRANC measurements, leading to systematically larger deposition fluxes. To a smaller extent, the same observation was made for LOTOS-EUROS; additionally, deposition velocities of DEPAC-1D and LOTOS-EUROS did not agree well in their diurnal pattern. Thus, a further investigation of stomatal vs. non-stomatal deposition pathways needs to be conducted, as these are likely the main factors for discrepancies in modeled vs. measured results. Besides possible uncertainty sources in DEPAC-1D, measured dry deposition estimates using DEPAC-1D for gap-filling were similar, showing that DEPAC-1D (and by extension, inferential modeling in general) is a valuable gap-filling tool at sites with prevailing N deposition. The difference to dry deposition estimates of LOTOS-EUROS was mainly related to an overestimation of NH3 concentrations by a factor of 2 to 3 compared to measured concentrations. Consequently, NH3 contributed most to the ΣNr concentration pattern in LOTOS-EUROS, whereas NOx was identified as a predominant compound by measurements. The imprecise allocation of emission data may be responsible for the discrepancies to measured NH3 concentrations, since the general overestimation of NH3 concentrations by LOTOS-EUROS has still not been solved by the attempts of model developers (van der Graaf et al., 2020; Ge et al., 2020).
Further comparisons of flux measurements and model applications are needed to investigate the exchange characteristics of ΣNr and its individual compounds simultaneously and at different ecosystems, if possible. Measuring several Nr compounds and ΣNr at a high time resolution is probably not affordable due to operating and maintenance costs, high technical requirements, and time-consuming processing of the acquired data. A solution could be continuous monitoring of Nr compounds by low-cost samplers complemented by high-frequency measurements of ΣNr and selected compounds like NH3 for a limited time, which will result in a better understanding of exchange processes and, thus, an improvement of deposition models (see Schrader et al., 2020).
All data are available upon request from the first author of this study (pascal.wintjen@thuenen.de). Concentration, flux, and micrometeorological data from measurements and ecological information about the site are included in the following repository: https://zenodo.org/record/5841074 (Brümmer et al., 2022b). Also, Python 3.7 code for flux data analysis can be requested from the first author.
The supplement related to this article is available online at: https://doi.org/10.5194/bg-19-5287-2022-supplement.
PW, FS, MS, and CB conceived the study. PW wrote the manuscript, conducted the measurements at the forest site and the comparison of the measured and modeled flux data, and carried out interpretation. FS evaluated the meteorological measurements and set up DEPAC-1D. MS and RK provided insights in interpreting LOTOS-EUROS results. BB conducted canopy throughfall and wet deposition measurements. CB installed the instruments at the site. The results were thoroughly discussed with all authors, and FS, MS, BB, RK, and CB contributed to the manuscript.
The contact author has declared that none of the authors has any competing interests.
Publisher's note: Copernicus Publications remains neutral with regard to jurisdictional claims in published maps and institutional affiliations.
We thank Undine Zöll for the scientific and logistical help with regard to the measurements; Jeremy Rüffer and Jean-Pierre Delorme for the excellent technical support; Ute Tambor, Andrea Niemeyer, and Daniel Ziehe for conducting laboratory analyses of denuder and filter samples; and the Bavarian Forest National Park (NPBW) administration, namely Wilhelm Breit and Ludwig Höcker, for the technical and logistical support at the measurement site. We further thank the anonymous reviewers and the editor for their valuable comments that helped improve the quality of the manuscript significantly.
This research has been supported by the Umweltbundesamt (project FORESTFLUX (grant no. FKZ 3715512110)) and the Bundesministerium für Bildung und Forschung (BMBF) (within the framework Junior Research Group NITROSPHERE (grant no. FKZ 01LN1308A)).
This paper was edited by Ivonne Trebs and reviewed by three anonymous referees.
Ahrends, B., Schmitz, A., Prescher, A.-K., Wehberg, J., Geupel, M., Henning, A., and Meesenburg, H.: Comparison of Methods for the Estimation of Total Inorganic Nitrogen Deposition to Forests in Germany, Front. Forest. Glob. Change, 3, 1–22, https://doi.org/10.3389/ffgc.2020.00103, 2020.
Ammann, C., Wolff, V., Marx, O., Brümmer, C., and Neftel, A.: Measuring the biosphere-atmosphere exchange of total reactive nitrogen by eddy covariance, Biogeosciences, 9, 4247–4261, https://doi.org/10.5194/bg-9-4247-2012, 2012.
Ammann, C., Jocher M., and Voglmeier, K.: Eddy Covariance Flux Measurements of NH3 and NOy with a Dual-Channel Thermal Converter, IEEE International Workshop on Metrology for Agriculture and Forestry (MetroAgriFor), IEEE, 46–51, https://doi.org/10.1109/MetroAgriFor.2019.8909278, 2019.
Barr, A., Richardson, A., Hollinger, D., Papale, D., Arain, M., Black, T., Bohrer, G., Dragoni, D., Fischer, M., Gu, L., Law, B., Margolis, H., McCaughey, J., Munger, J., Oechel, W., and Schaeffer, K.: Use of change-point detection for friction–velocity threshold evaluation in eddy covariance studies, Agr. Forest Meteorol., 171/172, 31–45, https://doi.org/10.1016/j.agrformet.2012.11.023, 2013.
Beudert, B. and Breit, W.: Kronenraumbilanzen zur Abschätzung der Stickstoffgesamtdeposition in Waldökosysteme des Nationalparks Bayerischer Wald, techreport, Umweltbundesamt, Dessau-Roßlau, Germany, https://www.umweltbundesamt.de/sites/default/files/medien/370/dokumente/kronenraumbilanzen_stickstoffgesamtdeposition_nationalpark_bayerisches_wald_-_berichtsjahr_2013_im_forellenbach.pdf (last access: 14 March 2022), 2014.
Bobbink, R. and Hettelingh, J.-P.: Review and revision of empirical critical loads and dose-response relationships, National Institute for Public Health and the Environment (RIVM), RIVM Report, https://www.rivm.nl/bibliotheek/rapporten/680359002.pdf (last access: 14 March 2022), 2011.
Bobbink, R., Hornung, M., and Roelofs, J. G. M.: The effects of air-borne nitrogen pollutants on species diversity in natural and semi-natural European vegetation, J. Ecol., 86, 717–738, https://doi.org/10.1046/j.1365-2745.1998.8650717.x, 1998.
Breuninger, C., Meixner, F. X., and Kesselmeier, J.: Field investigations of nitrogen dioxide (NO2) exchange between plants and the atmosphere, Atmos. Chem. Phys., 13, 773–790, https://doi.org/10.5194/acp-13-773-2013, 2013.
Brümmer, C., Marx, O., Kutsch, W., Ammann, C., Wolff, V., Flechard, C. R., and Freibauer, A.: Fluxes of total reactive atmospheric nitrogen (ΣNr) using eddy covariance above arable land, Tellus B, 65, 19770, https://doi.org/10.3402/tellusb.v65i0.19770, 2013.
Brümmer, C., Rüffer, J. J., Delorme, J.-P., Wintjen, P., Schrader, F., Beudert, B., Schaap, M., and Ammann, C.: Reactive nitrogen fluxes over peatland and forest ecosystems using micrometeorological measurement techniques, Earth Syst. Sci. Data, 14, 743–761, https://doi.org/10.5194/essd-14-743-2022, 2022a.
Brümmer, C., Rüffer, J. J., Delorme, J.-P., Wintjen, P., Schrader, F., Beudert, B., Schaap, M., and Ammann, C.: Reactive nitrogen fluxes over peatland (Bourtanger Moor) and forest (Bavarian Forest National Park) using micrometeorological measurement techniques (1.1), Zenodo [data set], https://doi.org/10.5281/zenodo.5841074, 2022b.
Butterbach-Bahl, K., Gasche, R., Breuer, L., and Papen, H.: Fluxes of NO and N2O from temperate forest soils: impact of forest type, N deposition and of liming on the NO and N2O emissions, Nutr. Cycl. Agroecosys., 48, 79–90, https://doi.org/10.1023/a:1009785521107, 1997.
Chaparro-Suarez, I., Meixner, F., and Kesselmeier, J.: Nitrogen dioxide (NO2) uptake by vegetation controlled by atmospheric concentrations and plant stomatal aperture, Atmos. Environ., 45, 5742–5750, https://doi.org/10.1016/j.atmosenv.2011.07.021, 2011
Damgaard, C., Jensen, L., Frohn, L. M., Borchsenius, F., Nielsen, K. E., Ejrnæs, R., and Stevens, C. J.: The effect of nitrogen deposition on the species richness of acid grasslands in Denmark: A comparison with a study performed on a European scale, Environ. Pollut., 159, 1778–1782, https://doi.org/10.1016/j.envpol.2011.04.003, 2011.
Delaria, E. R., Vieira, M., Cremieux, J., and Cohen, R. C.: Measurements of NO and NO2 exchange between the atmosphere and Quercus agrifolia, Atmos. Chem. Phys., 18, 14161–14173, https://doi.org/10.5194/acp-18-14161-2018, 2018.
Delaria, E. R., Place, B. K., Liu, A. X., and Cohen, R. C.: Laboratory measurements of stomatal NO2 deposition to native California trees and the role of forests in the NOx cycle, Atmos. Chem. Phys., 20, 14023–14041, https://doi.org/10.5194/acp-20-14023-2020, 2020.
de Vries, W., Reinds, G. J., and Vel, E.: Intensive monitoring of forest ecosystems in Europe: 2: Atmospheric deposition and its impacts on soil solution chemistry, Forest Ecol. Manag., 174, 97–115, https://doi.org/10.1016/S0378-1127(02)00030-0, 2003.
Dirnböck, T., Grandin, U., Bernhardt-Römermann, M., Beudert, B., Canullo, R., Forsius, M., Grabner, M.-T., Holmberg, M., Kleemola, S., Lundin, L., Mirtl, M. Neumann, M., Pompei, E., Salemaa, M., Starlinger, F., Staszewski, T., and Uziębło, A. K.: Forest floor vegetation response to nitrogen deposition in Europe, Glob. Change Biol., 20, 429–440, https://doi.org/10.1111/gcb.12440 , 2014.
Dirnböck, T., Pröll, G., Austnes, K., Beloica, J., Beudert, B., Canullo, R., De Marco, A., Fornasier, M. F., Futter, M., Goergen, K., Grandin, U., Holmberg, M., Lindroos, A.-J., Mirtl, M., Neirynck, J., Pecka, T., Nieminen, T. M., Nordbakken, J.-F., Posch, M., Reinds, G.-J., Rowe, E. C., Salemaa, M., Scheuschner, T., Starlinger, F., Uziębło, A. K., Valinia, S., Weldon, J., Wamelink, W. G. W., and Forsius, M.: Currently legislated decreases in nitrogen deposition will yield only limited plant species recovery in European forests, Environ. Res. Lett., 13, 125010, https://doi.org/10.1088/1748-9326/aaf26b, 2018.
Draaijers, G. P. J. and Erisman, J. W.: A canopy budget model to assess atmospheric deposition from throughfall measurements, Water Air Soil Pollut., 85, 2253–2258, https://doi.org/10.1007/BF01186169, 1995.
Emberson, L. D., Ashmore, M. R., Simpson, D., Tuovinen, J.-P., and Cambridge, H. M.: Towards a model of ozone deposition and stomatal uptake over Europe, EMEP/MSC-W 6/2000, Norwegian Meteorological Institute, Oslo, ISSN 0332-9879, http://emep.int/publ/reports/2000/note_6_2000_A4.ps (last access: 11 November 2022), 2000a.
Emberson, L. D., Ashmore, M. R., Cambridge, H. M., Simpson, D., and Tuovinen, J. P.: Modelling stomatal ozone flux across Europe, Environ. Pollut., 109, 403–13, https://doi.org/10.1016/S0269-7491(00)00043-9, 2000b.
Erisman, J. W., Van Pul, A., and Wyers, P.: Parametrization of surface resistance for the quantification of atmospheric deposition of acidifying pollutants and ozone, Atmos. Environ., 28, 2595–2607, https://doi.org/10.1016/1352-2310(94)90433-2, 1994.
Erisman, J. W., Galloway, J., Seitzinger, S., Bleeker, A., and Butterbach-Bahl, K.: Reactive nitrogen in the environment and its effect on climate change, Curr. Opin. Env. Sust., 3, 281–290, https://doi.org/10.1016/j.cosust.2011.08.012, 2011.
Erisman, J. W., Galloway, J. N., Seitzinger, S., Bleeker, A., Dise, N. B., Petrescu, A. M., Leach, A. M., and de Vries, W.: Consequences of human modification of the global nitrogen cycle, Philos. T. R. Soc. Lond. B, 368, 201301116, https://doi.org/10.1098/rstb.2013.0116, 2013.
Falge, E., Baldocchi, D., Olson, R., Anthoni, P., Aubinet, M., Bernhofer, C., Burba, G., Ceulemans, R., Clement, R., Dolman, H., Granier, A., Gross, P., Grünwald, T., Hollinger, D., Jensen, N.-O., Katul, G., Keronen, P., Kowalski, A., Lai, C. T., Law, B. E., Meyers, T., Moncrieff, J., Moors, E., Munger, J., Pilegaard, K., Üllar Rannik, Rebmann, C., Suyker, A., Tenhunen, J., Tu, K., Verma, S., Vesala, T., Wilson, K., and Wofsy, S.: Gap filling strategies for defensible annual sums of net ecosystem exchange, Agr. Forest Meteorol/, 107, 43–69, https://doi.org/10.1016/S0168-1923(00)00225-2, 2001.
Farmer, D. K. and Cohen, R. C.: Observations of HNO3, ΣAN, ΣPN and NO2 fluxes: evidence for rapid HOx chemistry within a pine forest canopy, Atmos. Chem. Phys., 8, 3899–3917, https://doi.org/10.5194/acp-8-3899-2008, 2008.
Farmer, D. K., Wooldridge, P. J., and Cohen, R. C.: Application of thermal-dissociation laser induced fluorescence (TD-LIF) to measurement of HNO3, Σalkyl nitrates, Σperoxy nitrates, and NO2 fluxes using eddy covariance, Atmos. Chem. Phys., 6, 3471–3486, https://doi.org/10.5194/acp-6-3471-2006, 2006.
Ferm, M.: A Sensitive Diffusional Sampler, Report L91-172, Swedish Environmental Research Institute, Gothenburg, 1991.
Ferrara, R. M., Loubet, B., Di Tommassi, P., Bertolini, T., Magliulo, V., Cellier, P., Eugster, W., and Rana, G.: Eddy covarinance measurement of ammonia fluxes: Comparison of high frequency correction methodologies, Agr. Forest Meteorol., 158/159, 30–42, https://doi.org/10.1016/j.agrformet.2012.02.001, 2012.
Ferrara, R. M., Di Tommassi, P., Farmulari, D., and Rana G.: Limitations of an Eddy-Covariance System in Measuring Low Ammonia Fluxes, Bound.-Lay. Meteorol., 180, 173–186, https://doi.org/10.1007/s10546-021-00612-6, 2021.
Finkelstein, P. L. and Sims, P. F.: Sampling error in eddy correlation flux measurements, J. Geophys. Res.-Atmos., 106, 3503–3509, https://doi.org/10.1029/2000JD900731, 2001.
Flechard, C. R., Nemitz, E., Smith, R. I., Fowler, D., Vermeulen, A. T., Bleeker, A., Erisman, J. W., Simpson, D., Zhang, L., Tang, Y. S., and Sutton, M. A.: Dry deposition of reactive nitrogen to European ecosystems: a comparison of inferential models across the NitroEurope network, Atmos. Chem. Phys., 11, 2703–2728, https://doi.org/10.5194/acp-11-2703-2011, 2011.
Flechard, C. R., Ibrom, A., Skiba, U. M., de Vries, W., van Oijen, M., Cameron, D. R., Dise, N. B., Korhonen, J. F. J., Buchmann, N., Legout, A., Simpson, D., Sanz, M. J., Aubinet, M., Loustau, D., Montagnani, L., Neirynck, J., Janssens, I. A., Pihlatie, M., Kiese, R., Siemens, J., Francez, A.-J., Augustin, J., Varlagin, A., Olejnik, J., Juszczak, R., Aurela, M., Berveiller, D., Chojnicki, B. H., Dammgen, U., Delpierre, N., Djuricic, V., Drewer, J., Dufrene, E., Eugster, W., Fauvel, Y., Fowler, D., Frumau, A., Granier, A., Gross, P., Hamon, Y., Helfter, C., Hensen, A., Horvath, L., Kitzler, B., Kruijt, B., Kutsch, W. L., Lobo-do Vale, R., Lohila, A., Longdoz, B., Marek, M. V., Matteucci, G., Mitosinkova, M., Moreaux, V., Neftel, A., Ourcival, J.-M., Pilegaard, K., Pita, G., Sanz, F., Schjoerring, J. K., Sebastia, M.-T., Tang, Y. S., Uggerud, H., Urbaniak, M., van Dijk, N., Vesala, T., Vidic, S., Vincke, C., Weidinger, T., Zechmeister-Boltenstern, S., Butterbach-Bahl, K., Nemitz, E., and Sutton, M. A.: Carbon–nitrogen interactions in European forests and semi-natural vegetation – Part 1: Fluxes and budgets of carbon, nitrogen and greenhouse gases from ecosystem monitoring and modelling, Biogeosciences, 17, 1583–1620, https://doi.org/10.5194/bg-17-1583-2020, 2020.
Fowler, D., Coyle, M., Skiba, U., Sutton, M. A., Cape, J. N., Reis, S., Sheppard, L. J., Jenkins, A., Grizzetti, B., Galloway, J. N., Vitousek, P., Leach, A., Bouwman, A. F., Butterbach-Bahl, K., Dentener, F., Stevenson, D., Amann, M., and Voss, M.: The global nitrogen cycle in the twenty-first century, Philos. T. R. Soc. B, 368, 20130164, https://doi.org/10.1098/rstb.2013.0164, 2013.
Galloway, J. N., Aber, J. D., Erisman, J. W., Seitzinger, S. P., Howarth, R. W., Cowling, E. B., and Cosby, B. J.: The Nitrogen Cascade, BioScience, 53, 341–356, https://doi.org/10.1641/0006-3568(2003)053[0341:TNC]2.0.CO;2, 2003.
Garland, J. A.: The Dry Deposition of Sulphur Dioxide to Land and Water Surfaces, Proc. Roy. Soc. A, 354, 245–268, https://doi.org/10.1098/rspa.1977.0066, 1977.
Ge, X., Schaap, M., Kranenburg, R., Segers, A., Reinds, G. J., Kros, H., and de Vries, W.: Modeling atmospheric ammonia using agricultural emissions with improved spatial variability and temporal dynamics, Atmos. Chem. Phys., 20, 16055–16087, https://doi.org/10.5194/acp-20-16055-2020, 2020.
Geddes, J. A. and Murphy, J. G.: Observations of reactive nitrogen oxide fluxes by eddy covariance above two midlatitude North American mixed hardwood forests, Atmos. Chem. Phys., 14, 2939–2957, https://doi.org/10.5194/acp-14-2939-2014, 2014.
Grandin, U.: Epiphytic algae and lichen cover in boreal forests – a long-term study along a N and S deposition gradient in Sweden, Ambio, 40, 857–866, https://doi.org/10.1007/s13280-011-0205-x, 2011.
Hansen, K., Sørensen, L. L., Hertel, O., Geels, C., Skjøth, C. A., Jensen, B., and Boegh, E.: Ammonia emissions from deciduous forest after leaf fall, Biogeosciences, 10, 4577–4589, https://doi.org/10.5194/bg-10-4577-2013, 2013.
Hansen, K., Pryor, S. C., Boegh, E., Hornsby, K. E., Jensen, B., and Sørensen, L. L.: Background concentrations and fluxes of atmospheric ammonia over a deciduous forest, Agr. Forest Meteorol., 214/215, 380–392, https://doi.org/10.1016/j.agrformet.2015.09.004, 2015.
Hettelingh, J.-P., Posch, M., De Smet, P. A. M., and Downing, R. J.: The use of critical loads in emission reduction agreements in Europe, Water Air Soil Pollut., 85, 2381–2385, https://doi.org/10.1007/BF01186190, 1995.
Hettelingh, J.-P., Posch, M., Velders, G. J. M., Ruyssenaars, P., Adams, M., de Leeuw, F., Lükewille, A., Maas, R., Sliggers, J., and Slootweg, J.: Assessing interim objectives for acidification, eutrophication and ground-level ozone of the EU National Emission Ceilings Directive with 2001 and 2012 knowledge, Atmos. Environ., 75, 129–140, https://doi.org/10.1016/j.atmosenv.2013.03.060, 2013.
Horii, C. V., Munger, J. W., Wofsy, S. C., Zahniser, M., Nelson, D., and McManus, J. B.: Fluxes of nitrogen oxides over a temperate deciduous forest, J. Geophys. Res.-Atmos., 109, D08305, https://doi.org/10.1029/2003JD004326, 2004.
Horii, C. V., Munger, J. W., Wofsy, S. C., Zahniser, M., Nelson, D., and McManus, J. B.: Atmospheric reactive nitrogen concentration and flux budgets at a Northeastern US forest site, Agr. Forest Meteorol., 136, 159–174, https://doi.org/10.1016/j.agrformet.2006.03.005, 2006.
Jarvis, P. G.: The Interpretation of the Variations in Leaf Water Potential and Stomatal Conductance Found in Canopies in the Field, Philos. T. R. Soc. B, 273, 593–610, https://doi.org/10.1098/rstb.1976.0035, 1976.
Jensen, N. and Hummelshøj, P.: Derivation of canopy resistance for water vapor fluxes over a spruce forest, using a new technique for the viscous sublayer resistance (correction to Vol. 73, p. 339, 1995), Agr. Forest Meteorol., 85, 289, https://doi.org/10.1016/S0168-1923(97)00024-5, 1997.
Jensen, N. O. and Hummelshøj, P.: Derivation of canopy resistance for water-vapor fluxes over a spruce forest, using a new technique for the viscous sublayer resistance, Agr. Forest Meteorol., 73, 339–352, https://doi.org/10.1016/0168-1923(94)05083-I, 1995.
Jung, H., Senf, C., Beudert, B., and Krueger, T.: Bayesian hierarchical modeling of nitrate concentration in a forest stream affected by large-scale forest dieback, Water Resour. Res., 57, e2020WR027264, https://doi.org/10.1029/2020WR027264 2021.
Krupa, S. V.: Effects of atmospheric ammonia (NH3) on terrestrial vegetation: a review, Environ. Pollut., 124, 179–211, https://doi.org/10.1016/S0269-7491(02)00434-7, 2003.
Kuenen, J., Dellaert, S., Visschedijk, A., Jalkanen, J.-P., Super, I., and Denier van der Gon, H.: CAMS-REG-v4: a state-of-the-art high-resolution European emission inventory for air quality modelling, Earth Syst. Sci. Data, 14, 491–515, https://doi.org/10.5194/essd-14-491-2022, 2022.
Kundu, S., Kawamura, K., and Lee, M.: Seasonal variation of the concentrations of nitrogenous species and their nitrogen isotopic ratios in aerosols at Gosan, Jeju Island: Implications for atmospheric processing and source changes of aerosols, J. Geophys. Res.-Atmos., 115, D20305, https://doi.org/10.1029/2009JD013323, 2010.
Li, Y., Schichtel, B. A., Walker, J. T., Schwede, D. B., Chen, X., Lehman, C. M. B., Puchalski, M. A., Gay, D. A., and Collett, J. L.: Increasing importance of deposition of reduced nitrogen in the United States, P. Natl. Acad. Sci., 113, 5874–5879, https://doi.org/10.1073/pnas.1525736113, 2016.
Marx, O., Brümmer, C., Ammann, C., Wolff, V., and Freibauer, A.: TRANC – a novel fast-response converter to measure total reactive atmospheric nitrogen, Atmos. Meas. Tech., 5, 1045–1057, https://doi.org/10.5194/amt-5-1045-2012, 2012.
Manders, A. M. M., Builtjes, P. J. H., Curier, L., Denier van der Gon, H. A. C., Hendriks, C., Jonkers, S., Kranenburg, R., Kuenen, J. J. P.,Segers, A. J., Timmermans, R. M. A., Visschedijk, A. J. H., Wichink Kruit, R. J., van Pul, W. A. J., Sauter, F. J., van der Swaluw, E., Swart, D. P. J., Douros, J., Eskes, H., van Meijgaard, E., van Ulft, B., van Velthoven, P., Banzhaf, S., Mues, A. C., Stern, R., Fu, G., Lu,S., Heemink, A., van Velzen, N., and Schaap, M.: Curriculum vitae of the LOTOS–EUROS (v2.0) chemistry transport model, Geosci. Model Dev., 10, 4145–4173, https://doi.org/10.5194/gmd-10-4145-2017, 2017.
Manders-Groot, A. M. M., Segers, A. J., and Jonkers, S.: LOTOS-EUROS v2.0 Reference Guide, TNO report TNO2016 R10898, TNO, Utrecht, The Netherlands, https://lotos-euros.tno.nl/media/10360/reference_guide_v2-0_r10898.pdf (last access: 14 March 2022), 2016.
Milford, C., Hargreaves, K. J., Sutton, M. A., Loubet, B., and Cellier, P.: Fluxes of NH3 and CO2 over upland moorland in the vicinity of agricultural land, J. Geophys. Res.-Atmos., 106, 24169–24181, https://doi.org/10.1029/2001jd900082, 2001.
Min, K.-E., Pusede, S. E., Browne, E. C., LaFranchi, B. W., Wooldridge, P. J., and Cohen, R. C.: Eddy covariance fluxes and vertical concentration gradient measurements of NO and NO2 over a ponderosa pine ecosystem: observational evidence for within canopy chemical removal of NOx, Atmos. Chem. Phys., 14, 5495–5512, https://doi.org/10.5194/acp-14-5495-2014, 2014.
Moravek, A., Singh, S., Pattey, E., Pelletier, L., and Murphy, J. G.: Measurements and quality control of ammonia eddy covariance fluxes: A new strategy for high frequency attenuation correction, Atmos. Meas. Tech., 12, 6059–6078, https://doi.org/10.5194/amt-12-6059-2019, 2019.
Munger, J. W., Wofsy, S. C., Bakwin, P. S., Fan, S. M., Goulden, M. L., Daube, B. C., Goldstein, A. H., Moore, K. E., and Fitzjarrald, D. R.: Atmospheric deposition of reactive nitrogen oxides and ozone in a temperate deciduous forest and a subarctic woodland: 1. Measurements and mechanisms, J. Geophys. Res.-Atmos., 101, 12639–12657, https://doi.org/10.1029/96JD00230, 1996.
Nemitz, E., Sutton, M. A., Wyers, G. P., and Jongejan, P. A. C.: Gas-particle interactions above a Dutch heathland: I. Surface exchange fluxes of NH3, SO2, HNO3 and HCl, Atmos. Chem. Phys., 4, 989–1005, https://doi.org/10.5194/acp-4-989-2004, 2004.
Paulissen, M. P. C. P., Bobbink, R., Robat, S. A., and Verhoeven, J. T. A.: Effects of Reduced and Oxidised Nitrogen on Rich-Fen Mosses: a 4-Year Field Experiment, Water Air Soil Pollu., 227, 1–14, https://doi.org/10.1007/s11270-015-2713-y, 2016.
Paulson, C. A.: The Mathematical Representation of Wind Speed and Temperature Profiles in the Unstable Atmospheric Surface Layer, J. Appl. Meteorol., 9, 857–861, https://doi.org/10.1175/1520-0450(1970)009<0857:Tmrows>2.0.Co;2, 1970.
Putaud, J.-P., Van Dingenen, R., Alastuey, A., Bauer, H., Birmili, W., Cyrys, J., Flentje, H., Fuzzi, S., Gehrig, R., Hansson, H., Harrison, R., Herrmann, H., Hitzenberger, R., Hüglin, C., Jones, A., Kasper-Giebl, A., Kiss, G., Kousa, A., Kuhlbusch, T., Löschau, G., Maenhaut, W., Molnar, A., Moreno, T., Pekkanen, J., Perrino, C., Pitz, M., Puxbaum, H., Querol, X., Rodriguez, S., Salma, I., Schwarz, J., Smolik, J., Schneider, J., Spindler, G., ten Brink, H., Tursic, J., Viana, M., Wiedensohler, A., and Raes, F.: A European aerosol phenomenology – 3: Physical and chemical characteristics of particulate matter from 60 rural, urban, and kerbside sites across Europe, Atmos. Environ., 44, 1308–1320, https://doi.org/10.1016/j.atmosenv.2009.12.011, 2010.
Reichstein, M., Falge, E., Baldocchi, D., Papale, D., Aubinet, M., Berbigier, P., Bernhofer, C., Buchmann, N., Gilmanov, T., Granier, A., Grünwald, T., Havránková, K., Ilvesniemi, H., Janous, D., Knohl, A., Laurila, T., Lohila, A., Loustau, D., Matteucci, G., Meyers, T., Miglietta, F., Ourcival, J.-M., Pumpanen, J., Rambal, S., Rotenberg, E., Sanz, M., Tenhunen, J., Seufert, G., Vaccari, F., Vesala, T., Yakir, D., and Valentini, R.: On the separation of net ecosystem exchange into assimilation and ecosystem respiration: review and improved algorithm, Glob. Change Biol., 11, 1424–1439, https://doi.org/10.1111/j.1365-2486.2005.001002.x, 2005.
Rosenkranz, P., Brüggemann, N., Papen, H., Xu, Z., Seufert, G., and Butterbach-Bahl, K.: N2O, NO and CH4 exchange, and microbial N turnover over a Mediterranean pine forest soil, Biogeosciences, 3, 121–133, https://doi.org/10.5194/bg-3-121-2006, 2006.
Roth, M., Müller-Meißner, A., Michiels, H.-G., and Hauck, M.: Vegetation changes in the understory of nitrogen-sensitive temperate forests over the past 70 years, Forest Ecol. Manag., 503, 119754, https://doi.org/10.1016/j.foreco.2021.119754 2022.
Rummel, U., Ammann, C., Gut, A., Meixner, F. X., and Andreae, M. O.: Eddy covariance measurements of nitric oxide flux within an Amazonian rain forest, J. Geophys. Res.-Atmos., 107, LBA 17-1–LBA 17-9, https://doi.org/10.1029/2001JD000520, 2002.
Sauter, F., Sterk, M., van der Swaluw, E., Wichink Kruit, R., de Vries, W., and van Pul, A.: The OPS-model: Description of OPS 5.0.0.0, RIVM, Bilthoven, https://www.rivm.nl/media/ops/OPS-model.pdf (last access: 14 March 2022), 2020.
Saylor, R. D., Baker, B. D., Lee, P., Tong, D., Pan, L., and Hicks, B. B.: The particle dry deposition component of total deposition from air quality models: right, wrong or uncertain?, Tellus B, 71, 1550324, https://doi.org/10.1080/16000889.2018.1550324, 2019.
Schaap, M., Wichink Kruit, R., Hendriks, C., Kranenburg, R., Segers, A., Builtjes, P., and Banzhaf, S.: Modelling and assessment of acidifying and eutrophying atmospheric deposition to terrestrial ecosystems (PINETI-2): Part I: Atmospheric deposition to German natural and semi-natural ecosystems during 2009, 2010 and 2011, techinal report, Umweltbundesamt, Dessau-Roßlau, Germany, https://www.umweltbundesamt.de/sites/default/files/medien/1410/publikationen/2017-08-15_texte_62-2017_pineti2-teil1.pdf (last access: 14 March 2022), 2017.
Schaap, M., Hendriks, C., Kranenburg, R., Kuenen, J., Segers, A., Schlutow, A., Nagel, H.-D., Ritter, A., and Banzhaf, S.: PINETI-3: Modellierung atmosphärischer Stoffeinträge von 2000 bis 2015 zur Bewertung der ökosystem-spezifischen Gefährdung von Biodiversität durch Luftschadstoffe in Deutschland, technical report, Umweltbundesamt, Dessau-Roßlau, Germany, https://www.umweltbundesamt.de/sites/default/files/medien/1410/publikationen/2018-10-17_texte_79-2018_pineti3.pdf (last access: 14 March 2022), 2018.
Schneider, C., Pelzer, M., Toenges-Schuller, N., Nacken, M., and Niederau, A.: ArcGIS basierte Lösung zur detaillierten, deutschlandweiten Verteilung (Gridding) nationaler Emissionsjahreswerte auf Basis des Inventars zur Emissionsberichterstattung – Kurzfassung; UBA TEXTE 71/2016, Für Mensch and Umwelt, https://www.umweltbundesamt.de/publikationen/arcgis-basierte-loesung-zur-detaillierten (last access: 9 June 2022), 2016.
Schrader, F. and Brümmer, C.: Land Use Specific Ammonia Deposition Velocities: a Review of Recent Studies (2004–2013), Water Air Soil Pollut., 225, 2114, https://doi.org/10.1007/s11270-014-2114-7, 2014.
Schrader, F., Brümmer, C., Flechard, C. R., Wichink Kruit, R. J., van Zanten, M. C., Zöll, U., Hensen, A., and Erisman, J. W.: Non-stomatal exchange in ammonia dry deposition models: comparison of two state-of-the-art approaches, Atmos. Chem. Phys., 16, 13417–13430, https://doi.org/10.5194/acp-16-13417-2016, 2016.
Schrader, F., Schaap, M., Zöll, U., Kranenburg, R., and Brümmer, C.: The hidden cost of using low-resolution concentration data in the estimation of NH3 dry deposition fluxes, Sci. Rep., 8, 969, https://doi.org/10.1038/s41598-017-18021-6, 2018.
Schrader, F., Erisman, J. W., and Brümmer, C: Towards a coupled paradigm of NH3-CO2 biosphere–atmosphere exchange modelling, Glob. Change Biol., 26, 4654–4663, https://doi.org/10.1111/gcb.15184, 2020.
Schwarz, J., Cusack, M., Karban, J., Chalupníčková, E., Havránek, V., Smolík, J., and Ždímal, V.: PM2.5 chemical composition at a rural background site in Central Europe, including correlation and air mass back trajectory analysis, Atmos. Res., 176/177, 108–120, https://doi.org/10.1016/j.atmosres.2016.02.017, 2016.
Schwede, D., Zhang, L., Vet, R., and Lear, G.: An intercomparison of the deposition models used in the CASTNET and CAPMoN networks, Atmos. Environ., 45, 1337–1346, https://doi.org/10.1016/j.atmosenv.2010.11.050, 2011.
Staelens, J., Houle, D., De Schrijver, A., Neirynck, J., and Verheyen, K.: Calculating Dry Deposition and Canopy Exchange with the Canopy Budget Model: Review of Assumptions and Application to Two Deciduous Forests, Water Air Soil Pollut., 191, 149–169, https://doi.org/10.1007/s11270-008-9614-2, 2008.
Sutton, M. A. and Fowler, D.: A Model for Inferring Bi-directional Fluxes of Ammonia Over Plant Canopies, in: Proceedings of the WMO conference on the measurement and modelling of atmospheric composition changes including pollutant transport, 179–182, WMO/GAW (World Meterological Organization Global Atmosphere Watch), Geneva, Switzerland, https://library.wmo.int/doc_num.php?explnum_id=9600 (last access: 11 November 2022), 1993.
Sutton, M. A., Tang, Y. S., Miners, B., and Fowler, D.: A New Diffusion Denuder System for Long-Term, Regional Monitoring of Atmospheric Ammonia and Ammonium, Water Air Soil Pollut., 1, 145–156, https://doi.org/10.1023/a:1013138601753, 2001.
Sutton, M. A., Howard, C. M., Erisman, J. W., Billen, G., Bleeker, A., Grennfelt, P., van Grinsven, H., and Grizzetti, B.: The European Nitrogen Assessment: sources, effects and policy perspectives, Cambridge University Press, Cambridge, UK, ISBN 9780511976988, https://doi.org/10.1017/CBO9780511976988, 2011.
Sutton, M. A., Reis, S., Riddick, S. N., Dragosits, U., Nemitz, E., Theobald, M. R., Tang, Y. S., Braban, C. F. , Vieno, M., Dore, A. J., Mitchell, R. F., Wanless, S., Daunt, F., Fowler, D., Blackall, T. D., Milford, C., Flechard, C. R., Loubet, B., Massad, R., Cellier, P., Personne, E., Coheur, P. F., Clarisse, L. Van Damme, M., Ngadi, Y., Clerbaux, C., Skjoth, C. A., Geels, C., Hertel, O., Wichink Kruit, R. J., Pinder, R. W., Bash, J. O., Walker, J. T., Simpson, D., Horvath, L., Misselbrook, T. H., Bleeker, A., Dentener, F., and de Vries, W.: Towards a climate-dependent paradigm of ammonia emission and deposition, Philos. T. R. Soc. Lond. Ser. B., 368, 20130166, https://doi.org/10.1098/rstb.2013.0166, 2013.
Tang, Y. S., Simmons, I., van Dijk, N., Di Marco, C., Nemitz, E., Dämmgen, U., Gilke, K., Djuricic, V., Vidic, S., Gliha, Z., Borovecki, D., Mitosinkova, M., Hanssen, J. E., Uggerud, T. H., Sanz,M. J., Sanz, P., Chorda, J. V., Flechard, C. R., Fauvel, Y., Ferm, M., Perrino, C., and Sutton, M. A.: European scale application of atmospheric reactive nitrogen measurements in a low-cost approach to infer dry deposition fluxes, Agriculture, Ecosyst. Environ., 133, 183–195, https://doi.org/10.1016/j.agee.2009.04.027, 2009.
Tang, Y. S., Cape, J. N., Braban, C. F., Twigg, M. M., Poskitt, J., Jones, M. R., Rowland, P., Bentley, P., Hockenhull, K., Woods, C., Leaver, D., Simmons, I., van Dijk, N., Nemitz, E., and Sutton, M. A.: Development of a new model DELTA sampler and assessment of potential sampling artefacts in the UKEAP AGANet DELTA system: summary and technical report, Tech. Rep., London, https://uk-air.defra.gov.uk/library/reports?report_id=861 (last access: 22 July 2022), 2015.
Tang, Y. S., Flechard, C. R., Dämmgen, U., Vidic, S., Djuricic, V., Mitosinkova, M., Uggerud, H. T., Sanz, M. J., Simmons, I., Dragosits, U., Nemitz, E., Twigg, M., van Dijk, N., Fauvel, Y., Sanz, F., Ferm, M., Perrino, C., Catrambone, M., Leaver, D., Braban, C. F., Cape, J. N., Heal, M. R., and Sutton, M. A.: Pan-European rural monitoring network shows dominance of NH3 gas and NH4NO3 aerosol in inorganic atmospheric pollution load, Atmos. Chem. Phys., 1, 875–914, https://doi.org/10.5194/acp-21-875-2021, 2021.
Tarnay, L. W., Gertler, A., and Taylor, G. E.: The use of inferential models for estimating nitric acid vapor deposition to semi-arid conifer-ous forests, Atmo. Environ., 36, 3277–3287, https://doi.org/10.1016/S1352-2310(02)00303-5, 2002.
Thoene, B., Rennenberg, H., and Weber, P.: Absorption of atmospheric NO2 by spruce (Picea abies) trees, New Phytol., 134, 257–266, https://doi.org/10.1111/j.1469-8137.1996.tb04630.x, 1996.
Ulrich, B.: Nutrient and acid-base budget of central european forest ecosystems, in: Effects of Acid Rain on Forest Processes, edited by: Godbold, D. and Hüttermann, A., John Wiley & Sons, New York, USA, 1–50, 1994.
van der Graaf, S. C., Kranenburg, R., Segers, A. J., Schaap, M., and Erisman, J. W.: Satellite-derived leaf area index and roughness length information for surface–atmosphere exchange modelling: a case study for reactive nitrogen deposition in north-western Europe using LOTOS-EUROS v2.0, Geosci. Model Dev., 13, 2451–2474, https://doi.org/10.5194/gmd-13-2451-2020, 2020.
van Jaarsveld, J. A.: The Operational Priority Substances model. Description and validation of OPS-Pro 4.1., RIVM, Bilthoven, report 500045001, https://www.pbl.nl/sites/default/files/downloads/500045001.pdf (last access: 14 March 2022), 2004.
van Oss, R., Duyzer, J., and Wyers, P.: The influence of gas-to-particle conversion on measurements of ammonia exchange over forest, Atmos. Environ., 32, 465–471, https://doi.org/10.1016/S1352-2310(97)00280-X, 1998.
van Pul, W. A. J. and Jacobs, A. F. G.: The conductance of a maize crop and the underlying soil to ozone under various environmental conditions, Bound.-Lay. Meteorol., 69, 83–99, https://doi.org/10.1007/BF00713296, 1994.
van Zanten, M. C., Sauter, F. J., Wichink Kruit, R. J., van Jaarsveld, J. A., and van Pul, W. A. J.: Description of the DEPAC module, Dry deposition modeling with DEPAC_GCN2010, Tech. Rep., RIVM, Bilthoven, NL, https://www.rivm.nl/bibliotheek/rapporten/680180001.pdf (last access: 11 November 2022), 2010.
VDI: VDI-Guideline 3782 Part 5: Environmental meteorology – Atmospheric dispersion models – Deposition parameters, Tech. rep., Verein Deutscher Ingenieure, Düsseldorf, DE, 2006.
Webb, E. K.: Profile relationships: The log-linear range, and extension to strong stability, Q. J. Roy. Meteorol. Soc., 96, 67–90, https://doi.org/10.1002/qj.49709640708, 1970.
Wentworth, G. R., Murphy, J. G., Benedict, K. B., Bangs, E. J., and Collett Jr., J. L.: The role of dew as a night-time reservoir and morning source for atmospheric ammonia, Atmos. Chem. Phys., 16, 7435–7449, https://doi.org/10.5194/acp-16-7435-2016, 2016.
Whitehead, J. D., Twigg, M., Famulari, D., Nemitz, E., Sutton, M. A., Gallagher, M. W., and Fowler, D.: Evaluation of laser absorption spectroscopic techniques for eddy covariance flux measurements of ammonia, Environ. Sci. Technol., 42, 2041, https://doi.org/10.1021/es071596u, 2008.
Wichink Kruit, R. J., van Pul, W. A. J., Sauter, F. J., van den Broek, M., Nemitz, E., Sutton, M. A., Krol, M., and Holtslag, A. A. M.: Modeling the surface–atmosphere exchange of ammonia, Atmos. Environ., 44, 945–957, https://doi.org/10.1016/j.atmosenv.2009.11.049, 2010.
Wichink Kruit, R. J., Schaap, M., Sauter, F. J., van Zanten, M. C., and van Pul, W. A. J.: Modeling the distribution of ammonia across Europe including bi-directional surface–atmosphere exchange, Biogeosciences, 9, 5261–5277, https://doi.org/10.5194/bg-9-5261-2012, 2012.
Wichink Kruit, R. J., Aben, J., de Vries, W., Sauter, 1180 F., van der Swaluw, E., van Zanten, M. C., and van Pul, W. A. J.: Modelling trends in ammonia in the Netherlands over the period 1990–2014, Atmos. Environ., 154, 20–30, https://doi.org/10.1016/j.atmosenv.2017.01.031, 2017.
Wintjen, P., Ammann, C., Schrader, F., and Brümmer, C.: Correcting high-frequency losses of reactive nitrogen flux measurements, Atmos. Meas. Tech., 13, 2923–2948, https://doi.org/10.5194/amt-13-2923-2020, 2020.
Wintjen, P., Schrader, F., Schaap, M., Beudert, B., and Brümmer, C.: Forest–atmosphere exchange of reactive nitrogen in a remote region – Part I: Measuring temporal dynamics, Biogeosciences, 19, 389–413, https://doi.org/10.5194/bg-19-389-2022, 2022.
Wyers, G. and Duyzer, J.: Micrometeorological measurement of the dry deposition flux of sulphate and nitrate aerosols to coniferous forest, Atmos. Environ., 31, 333–343, https://doi.org/10.1016/S1352-2310(96)00188-4, 1997.
Wyers, G. P. and Erisman, J. W.: Ammonia exchange over coniferous forest, Atmos. Environ., 32, 441–451, https://doi.org/10.1016/S1352-2310(97)00275-6, 1998.
Zhang, L., Gong, S., Padro, J., and Barrie, L.: A size-segregated particle dry deposition scheme for an atmospheric aerosol module, Atmos. Environ., 35, 549–560, https://doi.org/10.1016/S1352-2310(00)00326-5, 2001.
Zöll, U., Brümmer, C., Schrader, F., Ammann, C., Ibrom, A., Flechard, C. R., Nelson, D. D., Zahniser, M., and Kutsch, W. L.: Surface–atmosphere exchange of ammonia over peatland using QCL-based eddy-covariance measurements and inferential modeling, Atmos. Chem. Phys., 16, 11283–11299, https://doi.org/10.5194/acp-16-11283-2016, 2016.
Zöll, U., Lucas-Moffat, A. M., Wintjen, P., Schrader, F., Beudert, B., and Brümmer, C.: Is the biosphere-atmosphere exchange of total reactive nitrogen above forest driven by the same factors as carbon dioxide? An analysis using artificial neural networks, Atmos. Environ., 206, 108–118, https://doi.org/10.1016/j.atmosenv.2019.02.042, 2019.