the Creative Commons Attribution 4.0 License.
the Creative Commons Attribution 4.0 License.
 | 28 Jan 2022
Resolving temperature limitation on spring productivity in an evergreen conifer forest using a model–data fusion framework
Nicholas C. Parazoo
A. Anthony Bloom
Peter D. Blanken
David R. Bowling
Sean P. Burns
Cédric Bacour
Fabienne Maignan
Brett Raczka
Alexander J. Norton
Ian Baker
Mathew Williams
Mingjie Shi
Yongguang Zhang
Bo Qiu
The flow of carbon through terrestrial ecosystems and the response to climate are critical but highly uncertain processes in the global carbon cycle. However, with a rapidly expanding array of in situ and satellite data, there is an opportunity to improve our mechanistic understanding of the carbon (C) cycle's response to land use and climate change. Uncertainty in temperature limitation on productivity poses a significant challenge to predicting the response of ecosystem carbon fluxes to a changing climate. Here we diagnose and quantitatively resolve environmental limitations on the growing-season onset of gross primary production (GPP) using nearly 2 decades of meteorological and C flux data (2000–2018) at a subalpine evergreen forest in Colorado, USA. We implement the CARbon DAta-MOdel fraMework (CARDAMOM) model–data fusion network to resolve the temperature sensitivity of spring GPP. To capture a GPP temperature limitation – a critical component of the integrated sensitivity of GPP to temperature – we introduced a cold-temperature scaling function in CARDAMOM to regulate photosynthetic productivity. We found that GPP was gradually inhibited at temperatures below 6.0 ∘C (±2.6 ∘C) and completely inhibited below −7.1 ∘C (±1.1 ∘C). The addition of this scaling factor improved the model's ability to replicate spring GPP at interannual and decadal timescales (r=0.88), relative to the nominal CARDAMOM configuration (r=0.47), and improved spring GPP model predictability outside of the data assimilation training period (r=0.88). While cold-temperature limitation has an important influence on spring GPP, it does not have a significant impact on integrated growing-season GPP, revealing that other environmental controls, such as precipitation, play a more important role in annual productivity. This study highlights growing-season onset temperature as a key limiting factor for spring growth in winter-dormant evergreen forests, which is critical in understanding future responses to climate change.
- Article
(2420 KB) - Full-text XML
-
Supplement
(1293 KB) - BibTeX
- EndNote


Northern Hemisphere evergreen forests contribute significantly to terrestrial carbon (C) storage and exchange (Beer et al., 2010; Thurner et al., 2014). High-latitude and high-elevation evergreen forests show increasing gross primary productivity (GPP) with increasing temperature driven in large part by earlier growing seasons (Myneni et al., 1997; Randerson et al., 1999; Forkel et al., 2016; Winchell et al., 2016; Lin et al., 2017). However, the response of gross and net C fluxes to warming remains uncertain, especially in subalpine temperate forests, which can experience freezing temperatures while still absorbing large amounts of sunlight; both these factors ultimately influence the timing and magnitude of GPP (Bowling et al., 2018). In particular, warmer springs can also lead to earlier snowmelt, which can reduce spring C uptake through increased surface exposure to colder ablation-period air temperatures (Winchell et al., 2016) and can reduce summer C uptake via drought (Hu et al., 2010). Many subalpine forests in western North America are also highly water limited, with warming and earlier snowmelt creating accumulated water deficits, increased drought stress and growing-season C uptake losses (Wolf et al., 2016; Sippel et al., 2017; Buermann et al., 2018; Goulden and Bales, 2019); these factors ultimately make subalpine forest ecosystems sensitive to the direct and indirect effects of climate change and other disturbances, including the effects of droughts, fires and insect infestations (Keenan et al., 2014; Frank et al., 2014; Knowles et al., 2015). The uncertainty in the temperature sensitivity of springtime GPP, increasing vulnerability to disturbance and GPP modeling challenges (Anav et al., 2015) create urgency to improve our ability to observe and model these ecosystems to understand how C exchange will be altered in a warming climate.
Fortunately, availability of long-term ecosystem observations is improving. The expansion of international flux tower networks over the last 3 decades (e.g., AmeriFlux, FLUXNET, ChinaFLUX, ICOS) has greatly improved C flux sampling across global ecosystems at a 1 km scale (Baldocchi, 2008; Baldocchi et al., 2018), and the number of spaceborne sensors continues to grow, allowing global estimation of gross primary production (GPP) and net ecosystem C exchange (NEE) over the last decade (e.g., Stavros et al., 2017; Sun et al., 2017; Schimel et al., 2019). While uncertainties in estimating C fluxes from in situ and satellite data remain a challenge, the expanding observational record offers a great opportunity to study the temperature sensitivity of subalpine forests at multiple temporal scales.
The range of modeling tools available to quantify and study major C pools under ever-growing observational constraints is also increasing. Process-based models, in general terms, use explicit mathematical relationships to mechanistically describe biophysical processes (Korzukhin et al., 2011; Huxman et al., 2003; Keenan et al., 2012). In contrast, model–data fusion (MDF) is a relatively new tool that alters model parameters to statistically reduce mismatches between observations and model predictions (Raupach et al., 2005; Wang et al., 2009; Keenan et al., 2012). MDF methods can be used to statistically represent the terrestrial C balance by generating optimized state and process variable parameterizations, with uncertainties, which best match the signal and noise in observations (Bloom et al., 2020).
Models of varying complexity and assimilation capabilities have been used to study how C exchange varies with temperature in subalpine evergreen ecosystems (e.g., Moore et al., 2008; Scott-Denton et al., 2013; Knowles et al., 2018). Moore et al. (2008) used a simplified ecosystem function model and assimilated C flux data from the Niwot Ridge (US-NR1) subalpine evergreen forest AmeriFlux tower in Colorado to show the importance of accurate meteorological forcing for parameter optimization and the usefulness of assimilating C flux data for determining connections between the C and water cycles. Scott-Denton et al. (2013) integrated meteorological and flux data from 1999–2008 from the same site with an ensemble of more sophisticated Earth system models (ESMs) and showed higher rates of C uptake by the end of the 21st century, associated with warming and lengthening growing seasons, and driven by greater increases in spring GPP relative to late-season respiration.
Interestingly, model and empirical studies of the C flux response to climate at US-NR1 focus on the 2000–2011 period, which saw increasing summer drought coupled with sustained declines in spring temperature and GPP. US-NR1 has since experienced a gradual recovery of spring GPP with increased spring warming throughout 2011–2018 (Fig. 1), which begs the following questions: what is the temperature sensitivity of spring GPP over multiple decades of spring cooling and warming at US-NR1, and how well can data-constrained models reproduce long-term variability? To answer these questions, we combine a mechanistic ecosystem C model (Data Assimilation Linked Ecosystem Carbon, or DALEC2; Williams et al., 2005; Bloom et al., 2016) with the CARbon DAta-MOdel fraMework (CARDAMOM; Bloom and Williams, 2015; Bloom et al., 2020) driven by observed meteorological forcing and constrained against eddy covariance fluxes at US-NR1 to investigate the temperature sensitivity of this subalpine evergreen forest at seasonal and interannual timescales. We introduce a new cold-temperature limitation function, trained on observed temperature, for more realistic simulation of spring GPP onset. The use of high-quality and long-term (2000–2018) meteorology and partitioned GPP data at US-NR1 to drive and constrain the model enables robust statistical analysis of interannual variability (IAV) and assessment of “model predictability” through training and validation against subsets of data. We also leverage a recent model intercomparison study (Parazoo et al., 2020), driven by site level meteorological data at US-NR1, to provide a model benchmark assessment and extract any common environmental controls on modeled GPP. Finally, we examine whether using a decade of flux-tower-derived GPP observations to train the model is sufficient to match and predict seasonal to annual patterns in GPP. Given the complexity of carbon–water cycle interactions during the growing (summer) season in this highly water limited ecosystem, as well as the relatively weak correlation between tower-derived spring and summer GPP (; p=0.20), we focus on spring GPP–temperature interactions, with the aim to resolve just one piece of the larger, complex problem of understanding changes in C uptake in a subalpine evergreen ecosystem.
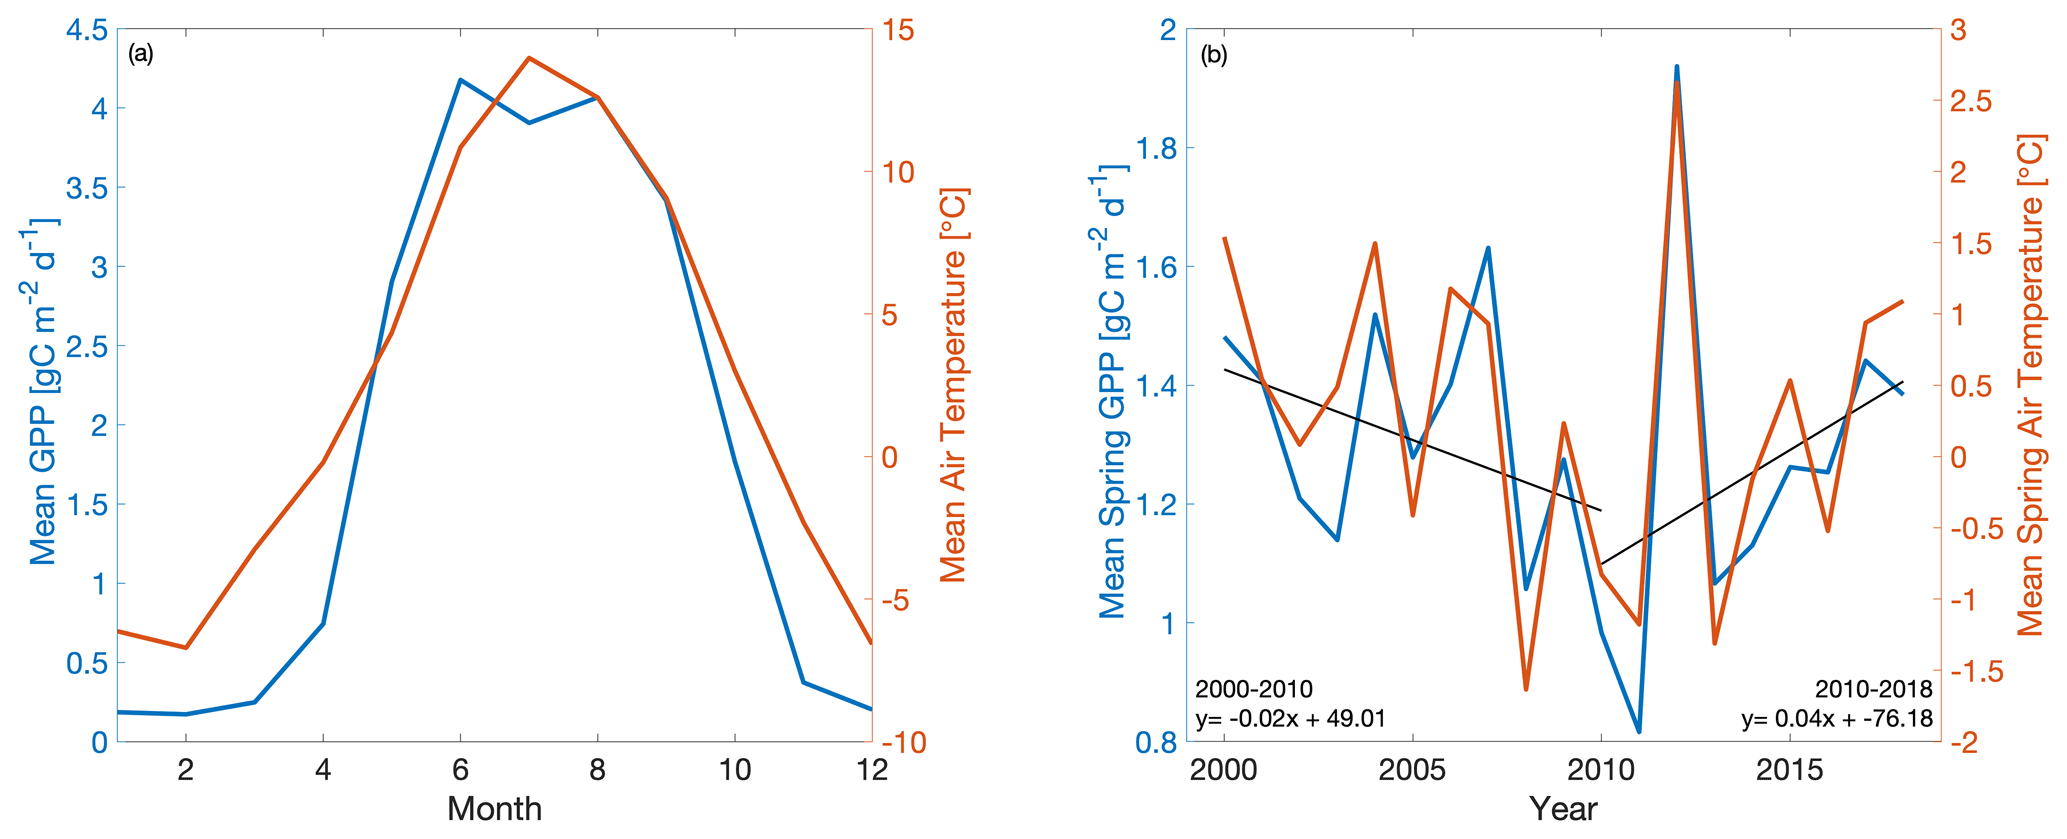
Figure 1Time series of (a) mean monthly GPP (blue) and air temperature (orange) and (b) mean spring (March–May) GPP and air temperature at Niwot Ridge (US-NR1) from 2000–2018. GPP data are derived using a nighttime partitioning technique based on tower observations of NEE and air temperature.
2.1 Study site – Niwot Ridge, CO, USA
Our study focuses on an AmeriFlux (https://ameriflux.lbl.gov/, last access: September 2020) core site in Niwot Ridge, Colorado, USA (US-NR1; 40∘1′58′′ N, 105∘32′47′′ W), where a tower-based eddy covariance system has been used to continuously monitor the net ecosystem exchange (NEE) of carbon dioxide over a subalpine forest since November 1998. The 26 m tall tower is located in a high-elevation (3050 m) subalpine site in the Rocky Mountains of Colorado (Monson et al., 2002). Located in an evergreen needleleaf (ENF) ecosystem, the dominant tree species include lodgepole pine (Pinus contorta), subalpine fir (Abies lasiocarpa) and Engelmann spruce (Picea engelmannii) (Turnipseed et al., 2002, 2004). Average annual precipitation is 800 mm, with a majority of precipitation falling in the winter as snow (Greenland, 1989; Knowles et al., 2015), which creates a persistent winter snowpack from November through early June (Bowling et al., 2018).
2.2 Observations
NEE measurements are screened for calm conditions using the standard ustar filtering, gap-filled, and partitioned into GPP and ecosystem respiration based on the relationship between nighttime NEE (photosynthetically active radiation, PAR, < 50 ) and air temperature (Reichstein et al., 2005; Wutzler et al., 2018). Monthly averages of GPP based on nighttime partitioning show similar seasonal structures to results found using an alternative daytime partitioning algorithm (Lasslop et al., 2009), so only nighttime partitioned GPP data are reported here. All GPP estimates are processed as half-hourly means and then averaged monthly. Details on the flux measurements, data processing and quality control are provided in Burns et al. (2015).
2.3 The CARDAMOM model–data fusion system
The CARbon DAta-MOdel fraMework (CARDAMOM; e.g., Bloom et al., 2016; Yin et al., 2020; Exbrayat et al., 2018; Smallman et al., 2017; Quetin et al., 2020; López-Blanco et al., 2019; Famiglietti et al., 2021; Bloom et al., 2020; Yang et al., 2021a) uses carbon cycle and meteorological observations to constrain carbon fluxes, states and process controls represented in the DALEC2 model of terrestrial C cycling (Williams et al., 2005; Bloom and Williams, 2015). Specifically, CARDAMOM uses a Bayesian model–data fusion approach to optimize DALEC2 time-invariant parameters (such as leaf traits, allocation and turnover times) and the “initial” C and H2O conditions (namely biomass, soil and water states at the start of the model simulation period).
The DALEC model (e.g., Williams et al., 2005; Rowland et al., 2014; Fox et al., 2009; Richardson et al., 2010; Famiglietti et al., 2021; Bloom and Williams, 2015) is a box model of C pools connected via fluxes that has been used to evaluate terrestrial carbon cycle dynamics across a range of ecosystems and spatial scales. In all site, regional, and global applications, DALEC parameters are subject to very broad, but physically realistic, prior distributions and are independently estimated and constrained by available observations at each grid point. Here we use DALEC version 2 (DALEC2; Yin et al., 2020; Quetin et al., 2020; Bloom et al., 2020); gross and net carbon fluxes are determined as a function of 33 parameters, including 26 time-invariant parameters relating to allocation, turnover times, plant traits, respiration climate sensitivities, water-use efficiency and GPP sensitivity to soil moisture, and 7 parameters describing the initial conditions of live biomass pools (live biomass C, dead organic C and plant-available H2O). Within DALEC2, GPP estimates are generated in the aggregated canopy model (ACM; Williams et al., 1997); the ACM is derived from simple functional relationships with environmental and plant structural and biochemical information (Williams et al., 1997) that are produced from a sensitivity analysis of GPP estimates from a more comprehensive SPA (soil–plant–atmosphere) land surface model scheme (Williams et al., 1996, 2001). ACM GPP estimates are contingent on plant structural and biochemical variables (including LAI, foliar nitrogen and nitrogen-use efficiency) and meteorological forcing (total daily irradiance, maximum and minimum daily air temperature, day length, atmospheric CO2 concentration). In DALEC2, water limitation on the ACM is prescribed as a linear response to the soil water deficit (Bloom et al., 2020). For more details on the model–data fusion methodology and CARDAMOM ensembles, we refer the reader to Appendix A. For a comprehensive overview of the DALEC2 model, we refer the reader to Bloom et al. (2020) and references therein.
2.4 Experiment design
In order to develop model experiments that can reliably evaluate temperature–GPP interactions, we first examine the observed environmental controls on tower-derived GPP. We focus on GPP during spring, defined here as the period from March–May, which encompasses the climatological onset of GPP and transition from dormant winter conditions to peak summer conditions (Fig. 1a). Mean spring GPP exhibits large interannual variability (IAV) with both a small decreasing trend from 2000–2010 (−0.02 g C m−2 d−1 yr−1) and an increasing trend from 2010–2018 (0.04 g C m−2 d−1 yr−1) (Fig. 1b). Comparison to tower-observed temperature data (Figs. 1b and 2) shows that spring GPP is positively correlated to mean spring air temperature (Pearson's linear r=0.89; p=0.000004) and summer (June–September) air temperature (r=0.10; p=0.70; Fig. S1a in the Supplement). Mean winter (December–February) precipitation also has a positive correlation with spring GPP (r=0.07; p=0.77; Fig. S1b), but it is much smaller than spring temperature. At interannual timescales, mean annual GPP shows a small increasing trend (0.0072 g C m−2 d−1 yr−1) over the time period (Fig. S2) and the largest correlation with winter (December–February) precipitation (Pearson's linear r=0.63; p=0.003; Fig. S3d) and shortwave irradiance (; p=0.22; Fig. S3f). In contrast, spring temperature shows little correlation with mean annual GPP (; p=0.92; Fig. S3c). It appears that winter precipitation and total irradiance are the dominant drivers in annual productivity, both of which are correlated, while spring temperature shows a first-order effect in driving spring GPP.
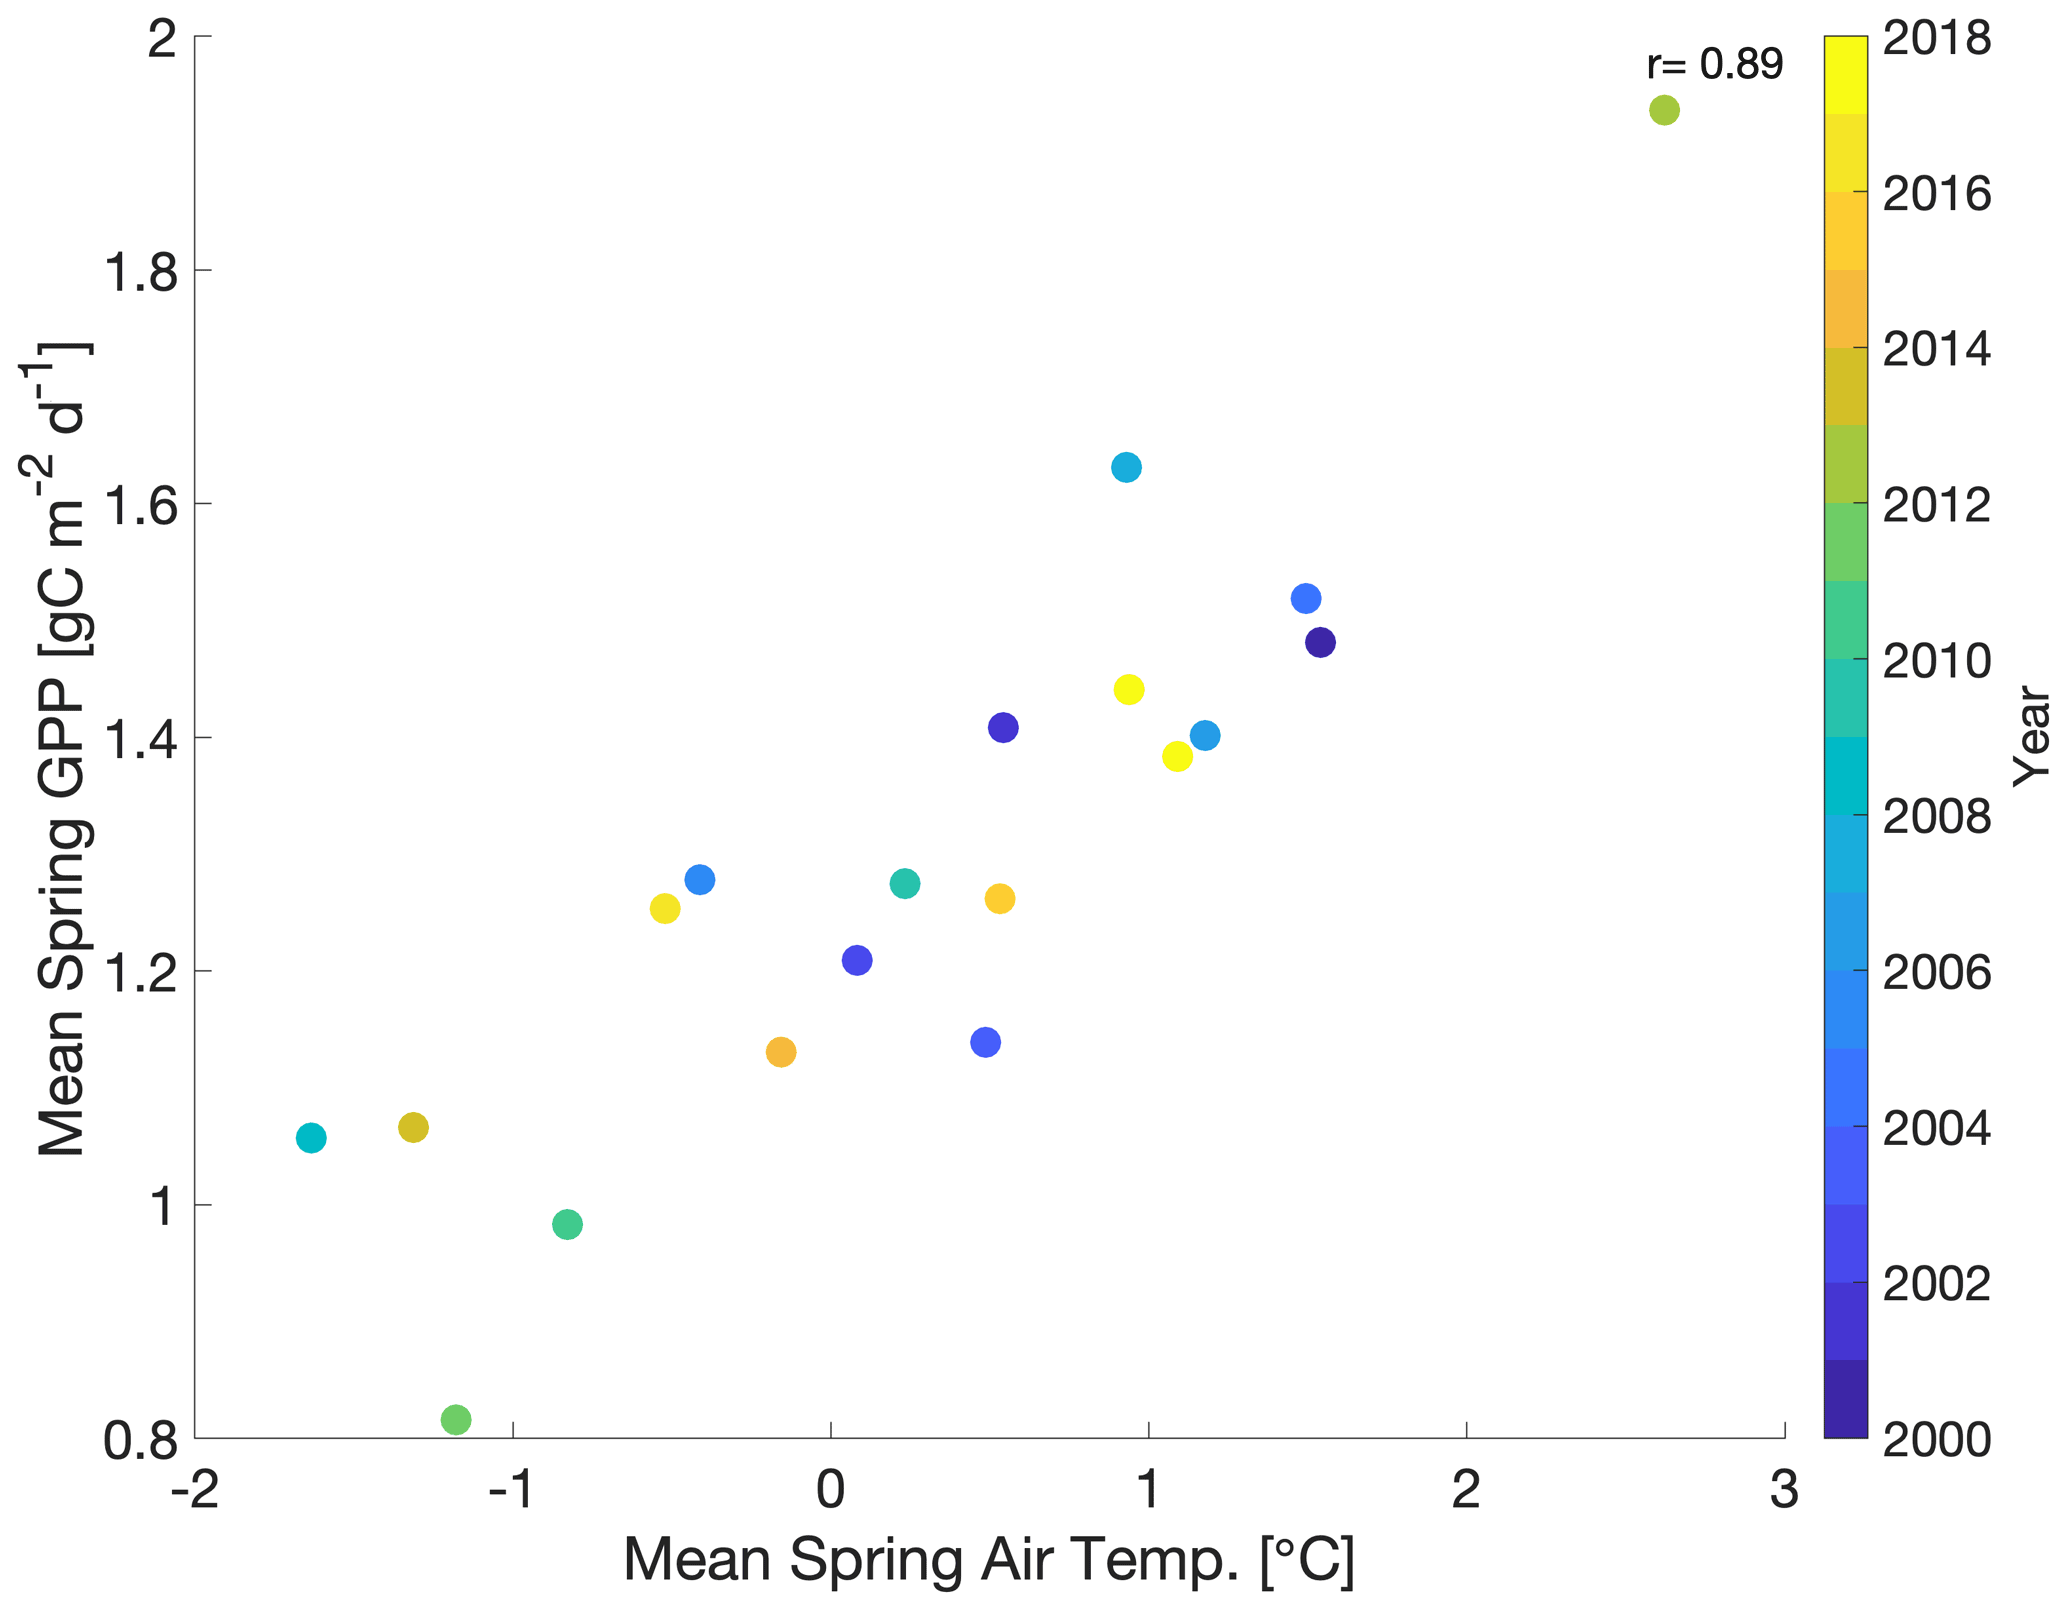
Figure 2Scatterplot of mean spring (March–May) GPP with mean spring air temperature with the color bar showing the corresponding year (2000–2018). r is Pearson's correlation coefficient.
We also find that cold temperature is an important limitation on seasonal GPP at US-NR1. The seasonal cycle of GPP shows peak productivity in early summer (around June), falling to near-zero values by early winter (November) and continuing through late winter (February–March). Comparison of monthly GPP and minimum, maximum and mean monthly air temperature shows an initiation of photosynthesis at monthly maximum air temperatures above 0 ∘C (Fig. 3a) and monthly minimum air temperatures above −5 ∘C (Fig. 3b). The strong dependence of monthly GPP on temperature is consistent with previous findings that temperature is an important driver of spring onset and seasonal variability in GPP in evergreen forests (e.g., Pierrat et al., 2021; Parazoo et al., 2018; Euskirchen et al., 2014; Arneth et al., 2006). As temperature falls in winter-dormant plants, productivity becomes negligible. Productivity is triggered again when spring air temperature becomes warm enough to thaw stems, trigger xylem flow and promote access to soil moisture (e.g., Pierrat et al., 2021; Bowling et al., 2018; Ishida et al., 2001). Due to this observed dependence of GPP on temperature at US-NR1, we focus our analysis specifically on spring GPP, where we hypothesize that cold temperature is the dominant control on spring GPP variability.

Figure 3Scatterplot of mean monthly GPP vs. (a) mean maximum air temperature, (b) mean minimum air temperature and (c) mean air temperature for 2000–2018. Dots are colored with the corresponding month.
In the baseline version of CARDAMOM, seasonal GPP in DALEC2 is limited primarily by incoming shortwave radiation. This light-focused limitation works well for deciduous forests where spring temperature and sunlight are correlated, as well as for high-latitude regions where sunlight is limited. However, for reasons discussed above, this method fails in evergreen forests such as Niwot Ridge, whose green canopies are exposed to high sunlight and below-freezing temperature in spring. As temperature increases, evergreen stems slowly thaw, which enables the trees to access available soil moisture and slowly reactivate their carbon and water exchange processes (Mayr et al., 2014; Bowling et al., 2018). Temperature also impacts the reactivation of photosynthetic activity after winter dormancy (Öquist and Huner, 2003; Tanja et al., 2003). For example, fluctuating temperature in the spring has been shown to limit and sometimes reverse the activation of biochemical processes needed for photosynthesis recovery (Ensminger et al., 2004). Exposure to cold temperature, when combined with increased irradiance in the spring, can also damage evergreen trees (Öquist and Huner, 2003; Yang et al., 2020), therefore disrupting CO2 assimilation. Previous studies have captured these cold-temperature impacts at Niwot Ridge and other evergreen sites. For example, variations in photosynthetic pigments have been tied to seasonal temperature at Niwot Ridge (Magney et al., 2019). Pierrat et al. (2021) identified an increase in plant water flow (measured via changes in the diurnal stem radius) and a change in carotenoid : chlorophyll ratios as temperature increases. The activation of water flow in the evergreen trees, combined with the pigment changes to absorb more sunlight, allows for the recovery of photosynthesis in the spring.
Table 1Summary of CARDAMOM modeling experiments to determine sensitivity of seasonal and interannual spring GPP variability to cold-temperature limitation (CARD vs. CARDcold) and the ability to perform outside the training window (Half).

To represent the integrated impact of the cold-weather processes, here we implement a cold-temperature scaling factor (g) in DALEC2. This scaling factor is developed by analyzing the relationship between monthly minimum and maximum air temperature with tower-derived monthly GPP, where
Tmin(t) is the observed minimum air temperature at Niwot Ridge at time t, GPP(t) is the nominal ACM-based DALEC2 GPP estimate (see Sect. 2.3) and GPPcold is the corresponding cold-temperature GPP estimate. Equation (2) may represent the integrated effect of all cold-weather biophysical limitations, including processes such as the impact of cold weather on plant hydraulics, and changes to carotenoid-chlorophyll ratios. We also theorize that our temperature scaling factor partially captures soil moisture disruptions due to changing soil temperature. The temperature thresholds in Eq. (1) may account for the connection between air temperature and soil temperature, with initial and full soil thawing temperature potentially mirroring the photosynthesis shutdown and initiation air temperature. CARDAMOM does not currently have explicit representations of soil moisture stress due to soil freezing. Therefore, soil freezing stress and other biophysical processes impacted by cold temperature may be approximated by this cold-temperature scaling factor added to CARDAMOM. The temperature thresholds for photosynthesis shutdown (referred to as T0) and initiation (referred to as Tg) are added as model parameters in DALEC2, bringing the total number of parameters to 35. These 35 DALEC parameters are simultaneously optimized in CARDAMOM. The CARDAMOM Bayesian-inference probability distributions (see Appendix A) for the T0 (−7.1 ± 1.1 ∘C) and Tg (6.0 ± 2.6 ∘C) parameters used to define the cold-temperature limitation are plotted in Fig. S4. We refer to the cold-temperature-constrained version of DALEC2 (within CARDAMOM) as DALEC2cold.
The baseline (DALEC2) and cold-temperature (DALEC2cold) versions of the model are run for the 2000–2018 period using tower-observed, gap-filled, monthly meteorological (MET) drivers (including minimum and maximum air temperature, shortwave radiation, vapor pressure deficit, and precipitation). We conduct four experiments, summarized in Table 1: experiments using DALEC2 and DALEC2cold within CARDAMOM, where 19 years of GPP data is assimilated (referred to as CARD and CARDcold) and a corresponding pair of experiments where only the first decade of data (2000–2009) is assimilated (referred to as CARD-Half and CARDcold-Half) and the second decade of data (2010–2019) is withheld for validation, as a train–test scenario. All months of GPP data are assimilated into the model; however our analysis focuses on the constraints on spring (March–May) GPP. These four experiments serve to evaluate the sensitivity of modeled GPP at Niwot Ridge to cold-temperature limitation and parameter optimization. Specifically, the objective of experiments CARD and CARDcold is to determine whether the cold-temperature scaling factor improves the representation of spring GPP variability across the 2000–2018 period; the objective of experiments CARD-Half and CARDcold-Half is to cross validate the predictive skill of CARDcold by assessing whether the addition of a cold-temperature scaling factor, informed by a subset of GPP data, can improve prediction of a withheld subset of GPP data.
2.5 Comparison to terrestrial biosphere model ensemble
A recent model intercomparison study provides an ideal benchmark for evaluating CARDAMOM simulations (Sect. 2.4). Parazoo et al. (2020) conducted an experiment in which an ensemble of state-of-the-art terrestrial biosphere models (TBMs) were forced by the same observed meteorology at Niwot Ridge from 2000–2018 but with differences in spin-up, land surface characteristics and parameter tuning. The TBMs are designed to simulate the exchanges of carbon, water and energy between the biosphere and atmosphere, from global to local scales depending on inputs from meteorological forcing, soil texture and plant functional type (PFT). The experiment was designed primarily to evaluate simulations of solar-induced fluorescence (SIF) and GPP, the latter of which we focus on here. We refer the reader to Parazoo et al. (2020) for a more complete description of models, within-model experiments and between-model differences.
The most important model differences worth noting here include the representation of stomatal conductance, canopy absorption of incoming radiation and limiting factors for photosynthesis. We analyze a subset of the models, which were run for multiple years, including SiB3 and SiB4 (Simple Biosphere model versions 3 and 4, respectively), ORCHIDEE (Organizing Carbon and Hydrology In Dynamic Ecosystems), BEPS (Boreal Ecosystems Productivity Simulator), and CLM4.5 and CLM5.0 (Community Land Model versions 4.5 and 5.0, respectively). We also analyze within-model experiments in SiB3 and ORCHIDEE to isolate effects related to the prescription of the leaf area index (LAI; varying monthly in SiB3-exp1, fixed at 4.0 m2 m−2 in SiB3-exp2), temperature and water stress (ORCHIDEE-exp1 includes temperature stress; ORCHIDEE-exp2 accounts for temperature and water stress) and data assimilation (ORCHIDEE-exp3, in which a subset of model parameters controlling photosynthesis and phenology are optimized against global OCO-2 (Orbiting Carbon Observatory 2) SIF data; Bacour et al., 2019). Most of the TBM model experiments were run with default parameters (BEPS, CLM50, SiB3, SiB4, ORCHIDEE-exp1 and ORCHIDEE-exp2). The other experiments were optimized in the following ways: either (a) parameters were hand-tuned based on the US-NR1 data (CLM4.5) or (b) the parameters were optimized using OCO-2 SIF data (ORCHIDEE-exp3). For more details on the parameterization of the TBM-SIF experiments, we refer the reader to Parazoo et al. (2020). The use of these models provides insight into the spread in model structures and the use of their default parameters. Finally, we note that not all model simulations span the entire observed record (2000–2018). While our analysis focuses on the long-term record from 2000–2018, we provide multiple comparisons to ensure consistency of the time period: (1) IAV from 2001–2018 for SiB3, SiB4, ORCHIDEE and CLM4.5; (2) IAV from 2012–2018 for SiB3, SiB4, ORCHIDEE, CLM4.5 and CLM5.0; and (3) seasonal variability from 2015–2018 for all models. We refer to the ensemble of models and within-model experiments collectively as TBM-MIP.
3.1 Evaluation of CARDAMOM 2000–2018 GPP
When the 19 years of tower-derived GPP data is assimilated into both versions of the model, the mean seasonal cycle is accurately replicated (Fig. 4). Pearson's r values for CARD (Fig. 4a) and CARDcold (Fig. 4b) are almost equal (r is 1.0 and 0.99) with minimal increases in root mean square error (RMSE) and mean bias error (MBE) for CARDcold (RMSE is 0.24 and 0.23 g C m−2 d−1 and MBE is 0.06 and 0.19 g C m−2 d−1 for CARD and CARDcold, respectively). Assimilating only the first decade of GPP data (Half experiments) does not drastically alter model performance (Fig. S5), with only slight changes in RMSE and MBE (ΔRMSE = 0.008 g C m−2 d−1 and ΔMBE = 0.03 g C m−2 d−1 for CARD-Half; ΔRMSE = −0.003 g C m−2 d−1 and ΔMBE = 0.02 g C m−2 d−1 for CARDcold-Half).
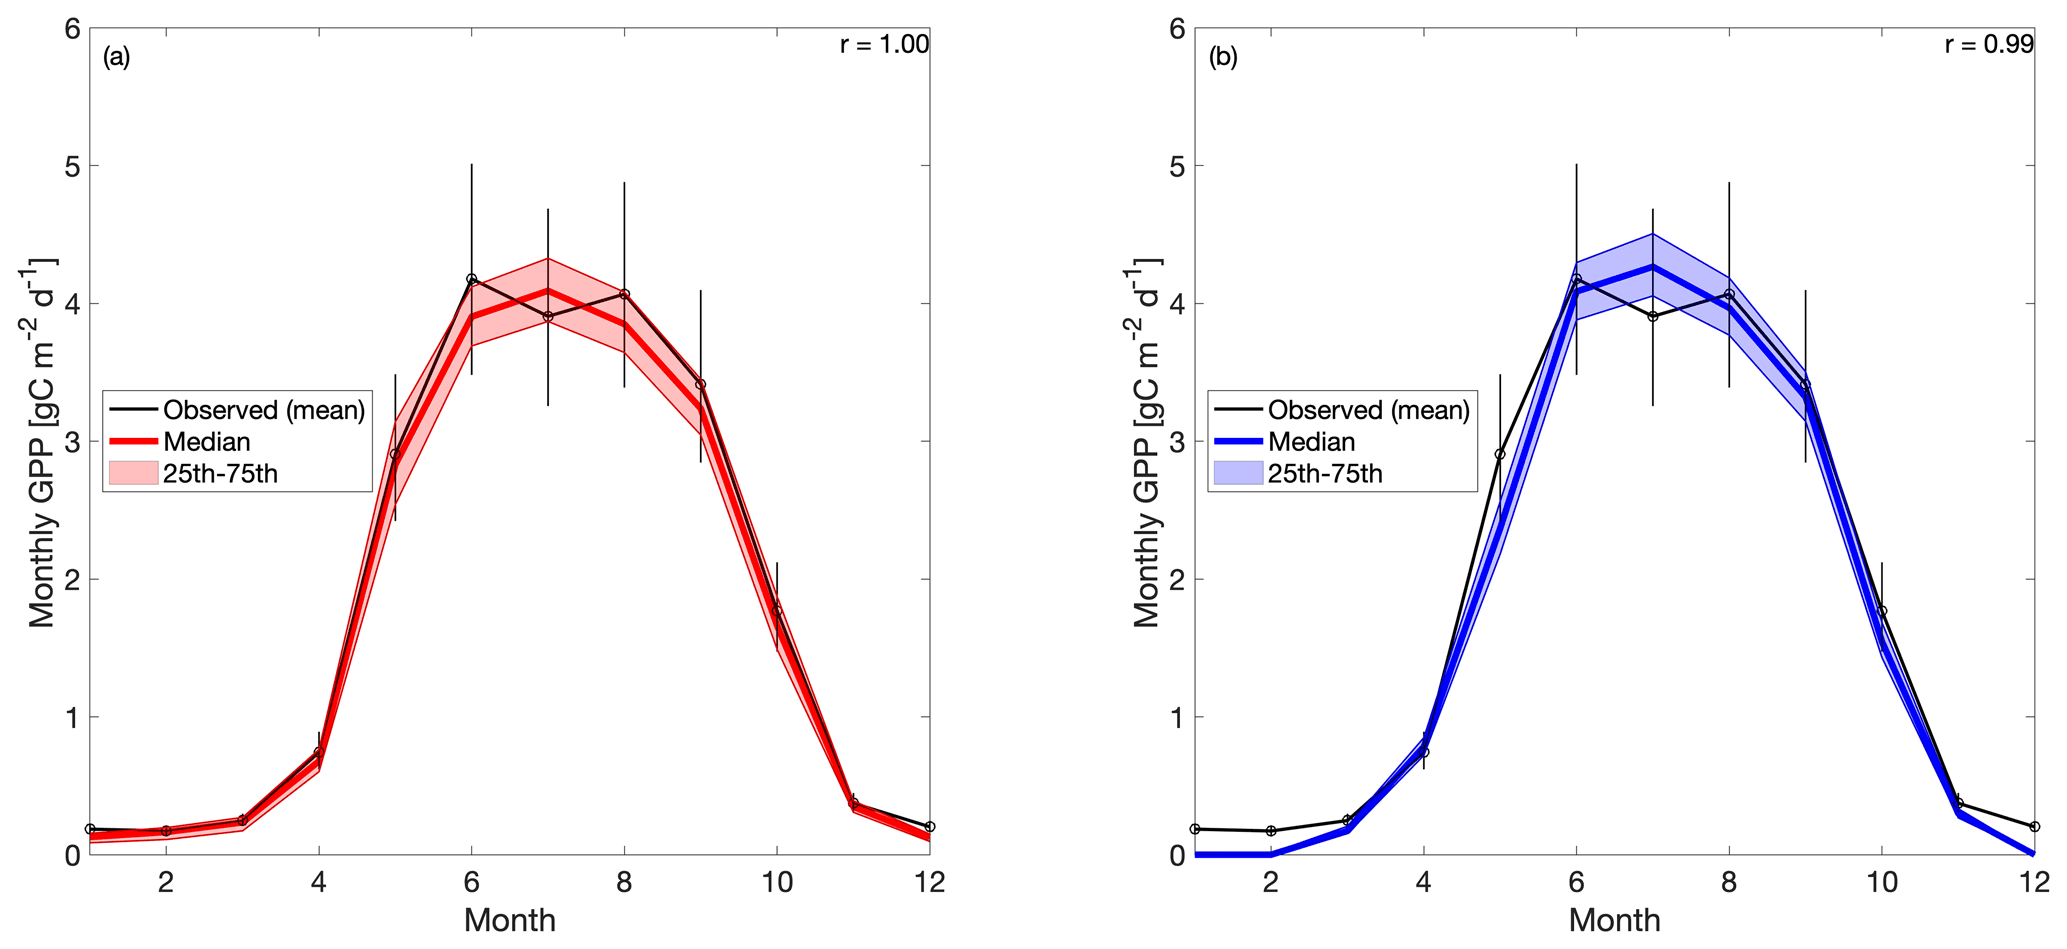
Figure 4Tower-derived average monthly GPP (black line) and modeled GPP seasonal cycles at US-NR1 for 2000–2018, for (a) CARD and (b) CARDcold experiments. The half-assimilation experiments (CARD-Half and CARDcold-Half) can be found in the Supplement (Fig. S5). Model outputs include the median value of each experiment (bold colored line) with the 25th–75th percentiles of the ensembles (shaded area). The median is plotted instead of the mean to avoid impact of outlier ensemble members (N=4000). Error bars are tower-derived GPP multiplied and/or divided by . n is number of years on average (n=19). r is Pearson's coefficient.
The cold experiments exhibit an improved fit to the observed IAV in spring productivity (Fig. 5), relative to CARD (r=0.47 and SD = 0.03 g C m−2 d−1 for CARD; r=0.88 and SD = 0.27 g C m−2 d−1 for CARDcold). CARDcold also has slightly reduced RMSE (−0.01 g C m−2 d−1) and larger MBE (0.13 g C m−2 d−1). Similarly to the seasonal cycle analysis, the assimilation of only the first decade of GPP data (Half experiments) has minimal impact on model performance (ΔRMSE = 0.007 g C m−2 d−1 and ΔMBE = 0.06 g C m−2 d−1 for CARD-Half, and ΔRMSE = 0.02 g C m−2 d−1 and ΔMBE = 0.02 g C m−2 d−1 for CARDcold-Half). We find less agreement between modeled and tower-derived GPP IAV in summer for both CARD and CARDcold (CARD r=0.32 and SD = 0.11 g C m−2 d−1; CARDcold r=0.05 and SD = 0.10 g C m−2 d−1; Fig. S6). While there is little variation in RMSE between the half- and full-assimilation experiments, RMSE is larger for summer than spring GPP (average RMSE = 0.23 g C m−2 d−1 for spring model outputs; average RMSE = 0.35 g C m−2 d−1 for summer model outputs). Model agreement is further reduced when considering annual average GPP (Fig. S7, Table S2). Although the cold-temperature limitation improves IAV slightly, it is still small compared to observed variability (mean annual SD = 0.14 g C m−2 d−1). Correlations to tower-derived GPP at the annual scale are small for both CARD and CARDcold (r=0.19 and r=0.22, respectively; Fig. S7a–b). Overall, the cold-temperature limitation substantially improves agreement between the model and tower-derived spring GPP, with slight reductions in performance for summer and annual GPP.
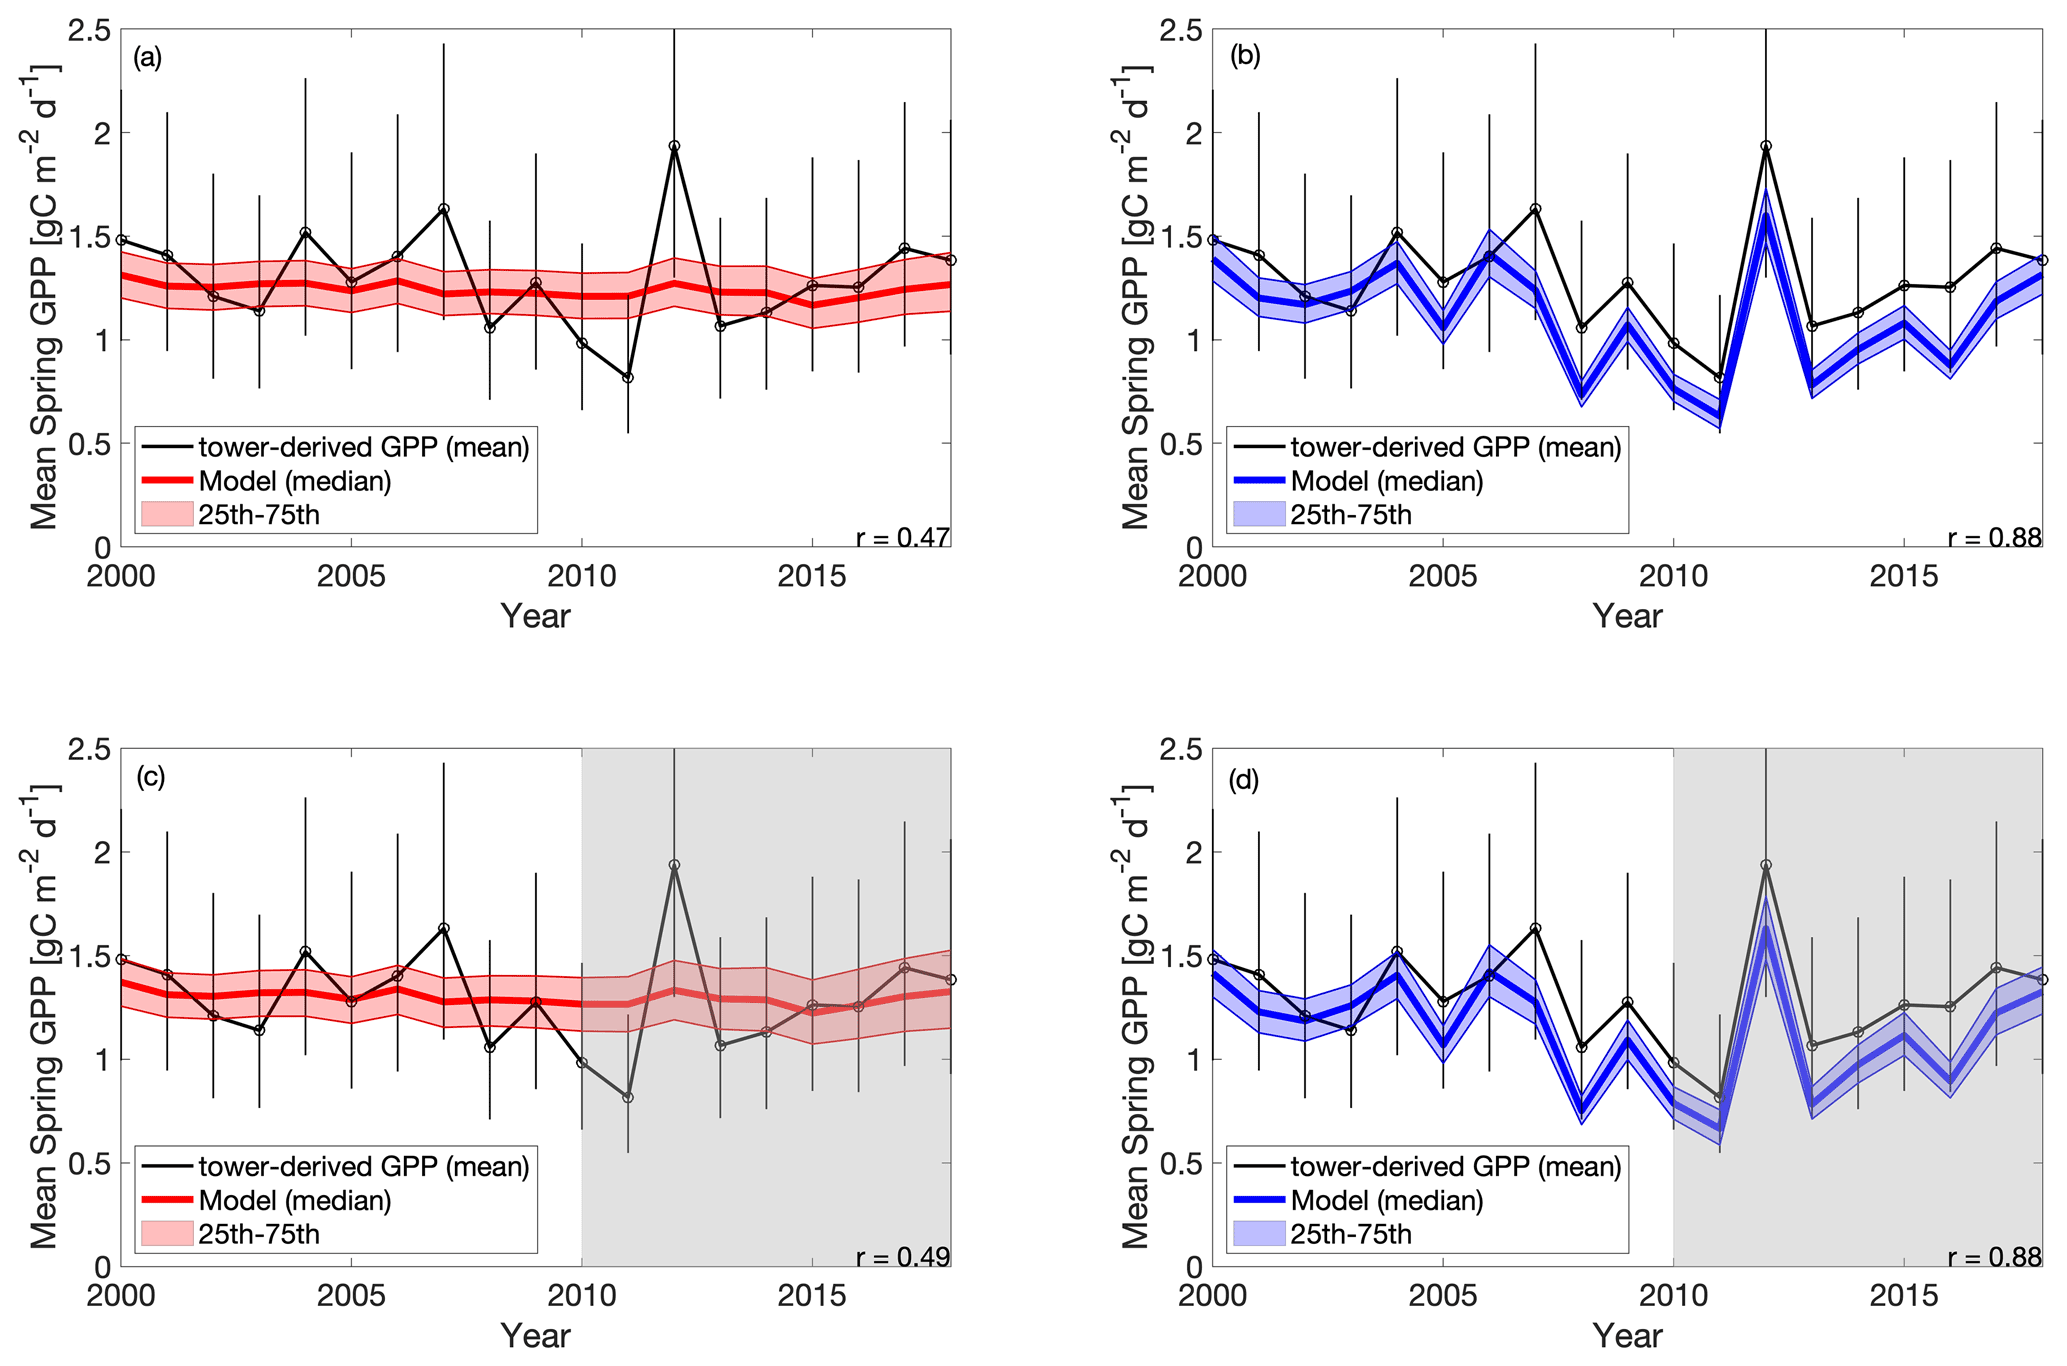
Figure 5Tower-derived (black line) mean spring (March–May) GPP with model interquartile range (shaded area) and median (bold colored line) spring GPP outputs for (a) CARD, (b) CARDcold, (c) CARD-Half and (d) CARDcold-Half experiments. The grey regions indicate no data assimilation (i.e., testing window). Model experiments are the same as in Fig. 4. Uncertainty is , where n is the number of months on average (n=3).
The standard deviation in tower-derived mean spring GPP (March–May) is approximately 0.25 g C m−2 d−1. The addition of the cold-temperature limitation improves the model's ability to match the IAV of mean spring GPP (Fig. 6a–b). An examination of all modeled scenarios for CARD and CARDcold (i.e., all 4000 DALEC2 simulations) shows that the cold-temperature limitation produces spring IAV values much closer to what is observed in the tower-derived GPP data. Only 0.3 % of CARD ensembles produce mean spring IAV values within 20 % of the tower-derived spring GPP standard deviation (0.25 ± 0.05 g C m−2 d−1), whereas 69 % of CARDcold ensembles have standard deviation values within the same range. Interestingly, assimilating only the first 10 years of GPP data (Half experiments, Fig. 6b) slightly increases the number of ensemble members with standard deviations within the mentioned range for both CARD-Half (2.4 %) and CARDcold-Half (70 %). It is promising to see that despite not assimilating the 2010–2018 GPP data into the model, CARDcold-Half is still able to match the average spring IAV of the full data record.
We also consider the IAV in spring GPP for just the second half of the data record (2010–2018). IAV of tower-derived spring GPP increases slightly in 2010–2018 (0.32 g C m−2 d−1). Once again, the cold-temperature limitation enables CARDAMOM to match spring GPP IAV (Fig. 6c–d). Of CARD ensembles, 0.03 % produce mean spring IAV values within 20 % of the tower-derived spring GPP standard deviation for the 2010–2018 period (0.32 ± 0.06 g C m−2 d−1), whereas 76 % of CARDcold ensembles have standard deviation values within the same range. For the Half experiments, 0.6 % of CARD and 75 % of CARDcold ensembles have IAV values within 20 % of the standard deviation for 2010–2018. This improvement in matching IAV is also observed when considering mean annual GPP (Fig. S8), but it is much smaller than the improvements made for spring GPP. Overall, CARDcold produces a less biased distribution of IAV values (relative to both assimilated and withheld observations), whereas CARD is more skewed towards smaller IAVs, which indicates that the cold-temperature limitation enables a mechanistic and statistical improvement in capturing the interannual variability in spring GPP.
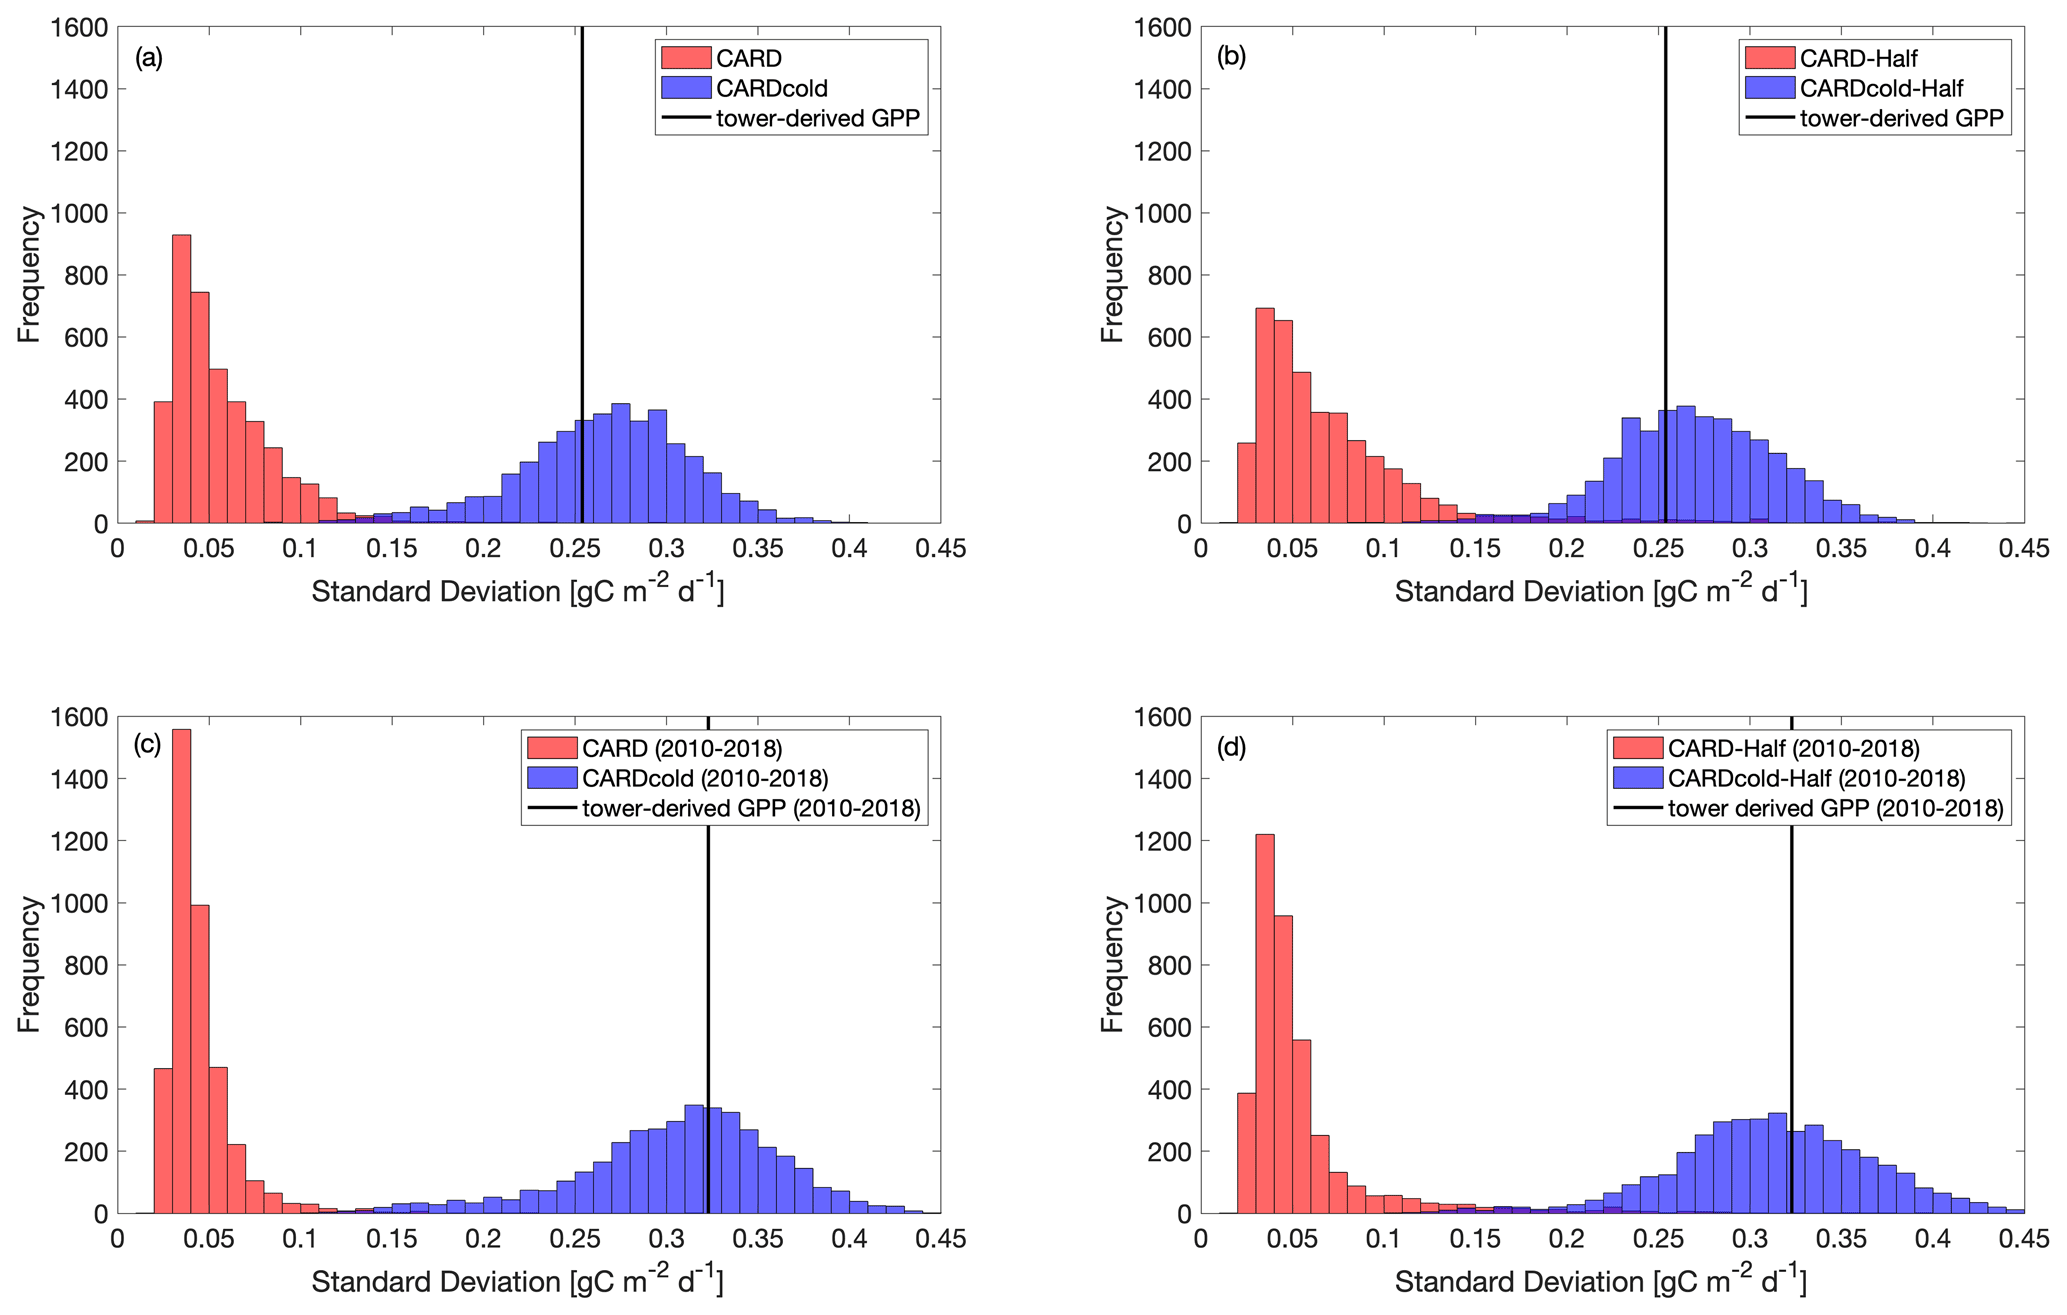
Figure 6Histograms comparing standard deviation in mean spring GPP across all ensembles (N=4000) for CARD (red bars) and CARDcold (blue bars) experiments with (a) full assimilation, (b) half assimilation, (c) full assimilation for the second decade (2010–2018) and (d) half assimilation for the second decade (2010–2018). The black line indicates the standard deviation in tower-derived mean spring GPP (SD = 0.25 g C m−2 d−1 for full period (a–b); SD = 0.32 g C m−2 d−1 for 2010–2018 (c–d)).
3.2 Temperature controls on springtime GPP
The added value of the DALEC2 cold-temperature limitation for modeling mean spring (March–May) GPP is logically due to large fluctuations in spring temperature at Niwot Ridge. The cold-temperature limitation allows DALEC2–CARDAMOM to match the IAV of tower-derived spring GPP closely. Furthermore, the cold-temperature limitation enables the model to match tower spring IAV in the second half of the time period (2010–2018) when only the first 10 years of GPP data is assimilated (2000–2009). This indicates that the cold-temperature limitation is able to estimate spring GPP outside of its training window and could be useful at other sites where data availability is limited. Future work will include evaluating the cold-temperature limitation at other sites to ensure that it is applicable beyond Niwot Ridge, for example using forecast skill metrics proposed by Famiglietti et al. (2021).
The temperature-induced spring onset of GPP is driven by two general processes: (1) initiation of bud burst and leaf expansion leading to an increasing LAI and/or (2) initiation of photosynthetic activity (photosynthetic efficiency, i.e., GPP per unit of LAI) due to temperature-induced changes in plant hydraulics (Ishida et al., 2001; Pierrat et al., 2021) or kinetics of the photosynthetic machinery (e.g., Medlyn et al., 2002). In situ LAI measurements suggest that the LAI at Niwot Ridge is relatively constant across the season, which is somewhat expected given the dominant tree species at the site. Hence, the temperature-induced onset of GPP is likely due to the latter process, increased photosynthetic efficiency, as supported by the measurements (Figs. 1–2), although small changes in the LAI are still feasible given uncertainties in the measurements. The inclusion of the cold-temperature limitation scaling factor in the model, a semi-empirical process, leads to a substantial improvement in the model representation of GPP at the site. Further development may also look to identify the relative roles of an increased LAI and increased photosynthetic efficiency at Niwot Ridge and other evergreen needleleaf sites as changes in GPP can lead to changes in carbon allocation to the LAI, among other plant carbon pools.
Temperature is important in both the reactivation of photosynthetic activity in the spring and the wind down of productivity in the fall (Flynn and Wolkovich, 2018; Stinziano and Way, 2017). Therefore, we anticipate that the cold-temperature scaling function may also improve our ability to model fall productivity. However, other factors such as water availability and the photoperiod must also be considered (Bauerle et al., 2012; Stinziano et al., 2015). Future studies at Niwot Ridge and other sites should investigate the role of these factors (temperature, water, photoperiod) in regulating fall GPP and how we can represent these processes in CARDAMOM.
With the inclusion of the cold-temperature limitation on GPP and its application in CARDAMOM, we provide a data-constrained estimate of the climate sensitivity of the Niwot Ridge forest to spring temperature. Posterior estimates indicate that GPP is gradually inhibited below 6.0 ∘C ± 2.6 ∘C (Tg) and completely inhibited below −7.1 ∘C ± 1.1 ∘C (T0). The gradual limitation of GPP by temperature has been observed on hourly and daily timescales in other cold-weather ecosystems, such as Alaskan conifers (Parazoo et al., 2018) and Canadian spruce (Pierrat et al., 2021). This has been connected to the triggering of transpiration and water flow from xylem into leaves (Ishida et al., 2001). However, both biotic (e.g., carotenoid : chlorophyll ratios) and abiotic (e.g., openness of canopy) factors together regulate GPP response to meteorological forcings, and further process-oriented investigations are required to resolve the emergent response of GPP to temperature. Furthermore, the use of process-based models will be needed to disentangle the individual cold-weather biophysical processes currently represented in the scaling factor (Eqs. 1–2). For now, this is a useful metric for the climate sensitivity of spring GPP, at least in the absence of long-term adaptations. Furthermore, over the 19-year observation period investigated here, the use of temporally constant T0 and Tg yields significantly improved GPP estimates, suggesting that much of the variability can be attributed to climate-driven changes, not interannual variation in vegetation parameters. As temperature continues to increase due to climate change (particularly in the early growing season), productivity at US-NR1 could increase as a result and therefore increase carbon uptake, with productivity peaking earlier in the year (e.g., Xu et al., 2016). However, these spring gains in GPP have been shown to not offset the losses of carbon due to summer droughts (e.g., Buermann et al., 2013; Knowles et al., 2018). It is also unclear how the long-term stress of increased temperature could affect forest productivity directly.
This study focuses on the relationship between temperature and GPP and its usefulness for model predictions of spring GPP, but an important component that cannot be ignored is the confounding effect of water availability on GPP. Future changes in winter precipitation are more uncertain, therefore limiting our ability to analyze how precipitation changes will alter future productivity. While precipitation observations are analyzed to discern any major connections between GPP and meteorological controls, an analysis of how precipitation affects model predictability is not included in this study. The combined results, including the cold-temperature limitation and train–test data assimilation experiments, suggest that other factors besides spring temperature, most notably winter and summer precipitation (Fig. S3) and resulting soil water limitation, also have important impacts on summer GPP. We therefore highlight the need to jointly resolve springtime temperature limitation in conjunction with water stress limitations in future efforts to understand the integrated role of environmental forcings on interannual GPP variability. Furthermore, this analysis does not consider how winter precipitation as snowfall versus rainfall affects productivity or how resulting changes to winter snowpack could alter productivity in the long term. Since annual average GPP appears to be more dependent on winter precipitation/snowpack (Pearson's linear r=0.63; Fig. S3a), future work will include improving model predictability of late-season productivity and quantifying temperature–water effects on carbon uptake. The definition of the seasons could also alter the connections drawn between seasonal temperature, precipitation and productivity.
3.3 Model intercomparison and implications for GPP models
Here, we evaluate DALEC2–CARDAMOM against mean spring GPP estimates from TBM-MIP models (Sect. 2.5 and Parazoo et al., 2020). It is important to remind the reader that the CARDAMOM runs have a significant advantage over the TBM-MIP models in this analysis, as CARDAMOM is trained on US-NR1 GPP data. While TBM-MIP models use tower-observed meteorological inputs, prescribe tower-specific and time-invariant structural properties such as the LAI observed at US-NR1 (SiB3-exp2 and CLM4.5), and use data assimilation of global remote sensing data to constrain globally representative plant functional types (ORCHIDEE-exp3), they are not directly constrained by time-varying carbon fluxes at the tower. As such, we emphasize that our model comparison is not a strict assessment of performance but rather an attempt to learn how model simulation of GPP at an evergreen needleleaf site can be improved.
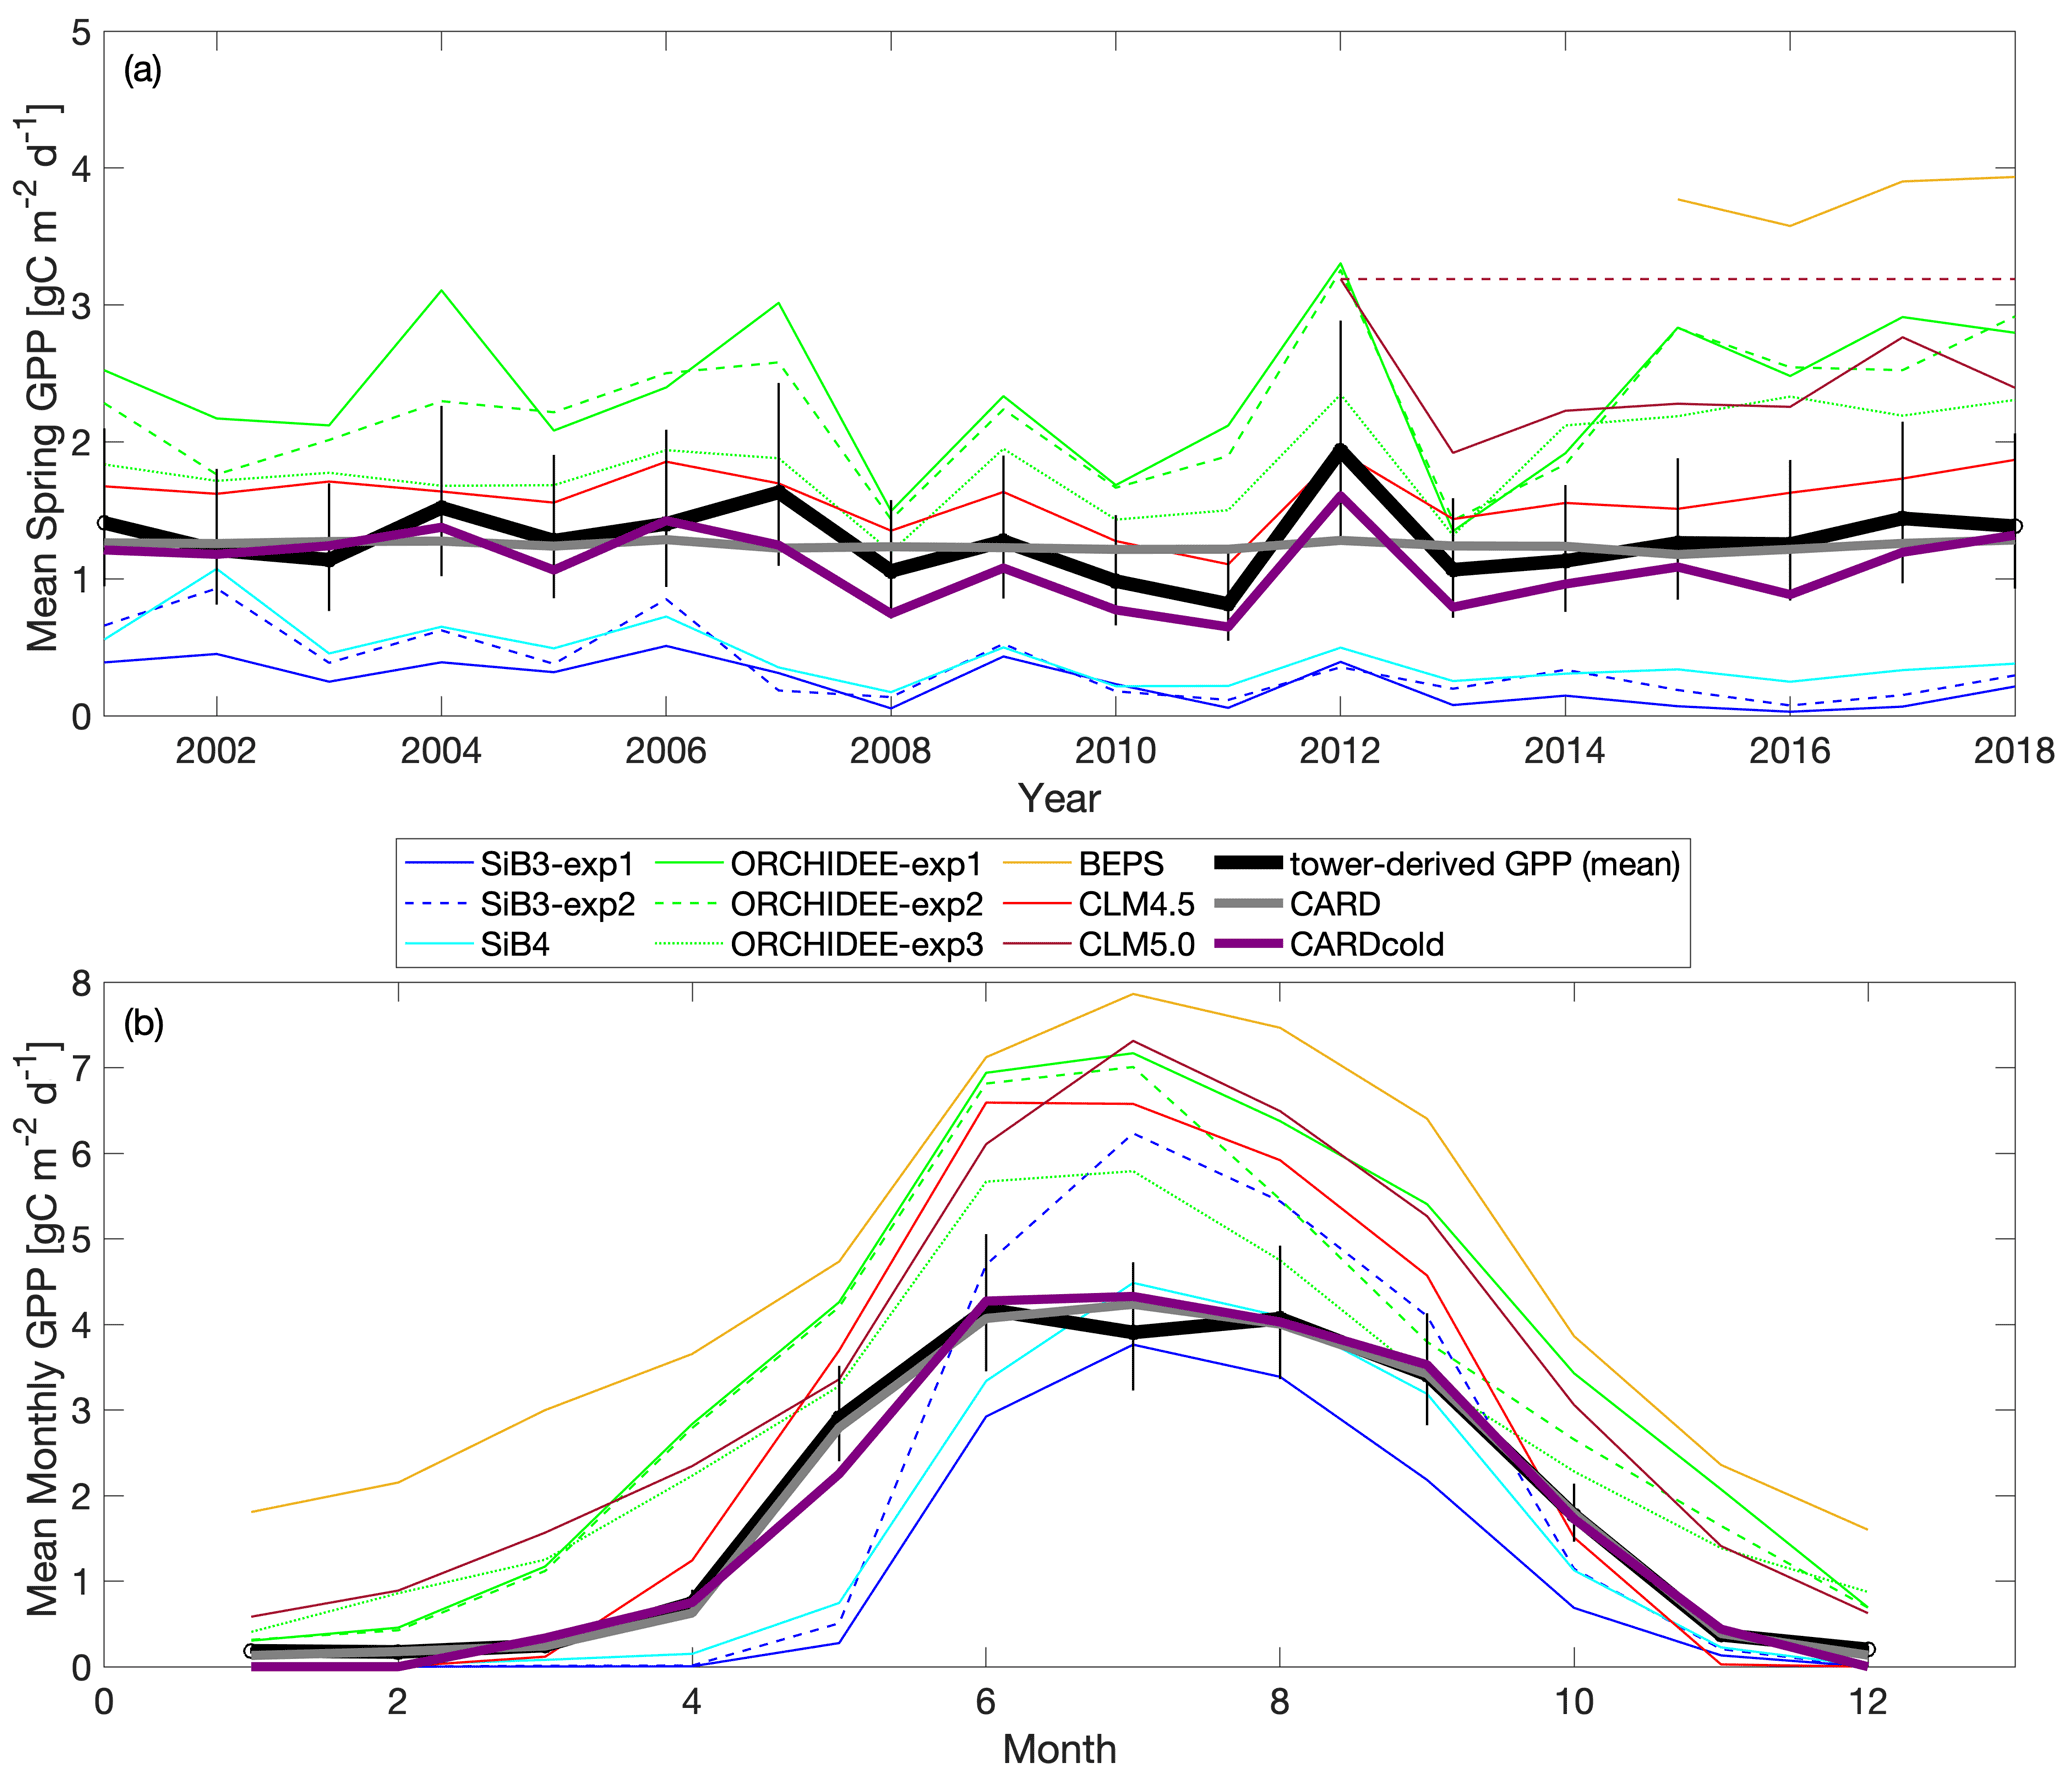
Figure 7Comparison of TBM-MIP models to CARD and CARDcold experiments for (a) mean spring GPP for 2000–2018 and (b) monthly GPP from 2015–2018. Note that fill values are ignored when calculating mean annual values for TBM-MIP experiments. Uncertainty is , where n is the number of years on average (n=19).
There is a wide range in performance of TBM-MIPs in representing the magnitude and IAV of tower-derived spring GPP (Fig. 7a). Pearson's r correlations range from 0.25 to 0.82 (mean r=0.6; Table 2) from 2001–2018, with the same models showing slightly improved performance over the second decade (mean r=0.73 from 2012–2018). ORCHIDEE-exp1 and CLM4.5 show consistently high performance over all three periods analyzed, with CLM5.0 excelling from 2012–2018 and BEPS from 2015–2018 (Table S1). CLM4.5 also shows the smallest mean bias of the TBM-MIP models (RMSE ∼ 0.35) and high agreement in the magnitude of spring GPP variability (1σ standard deviation is 0.21 g C m−2 d−1 for CLM4.5 vs. 0.25 g C m−2 d−1 observed). While acknowledging the advantage of data assimilation, it is promising to see that CARDAMOM (with the addition of the cold-temperature limitation) is able to perform comparably to the TBM-MIP models. In particular, CARDcold is well correlated in the direction (r=0.88) and magnitude (1σ ∼ 0.26) of interannual variability, as well as the overall magnitude of spring GPP (low RMSE and MBE).
Table 2Pearson's linear r, R2, p value, standard deviation, root mean square error (RMSE), and mean bias error (MBE) for TBM-MIP and all CARDAMOM experiments for Niwot Ridge tower-derived mean spring (March–May) GPP. Open values reflect statistics for the 2001–2018 period, while values in parentheses represent the 2012–2018 period. All relevant statistics are calculated at a 5 % significance level.
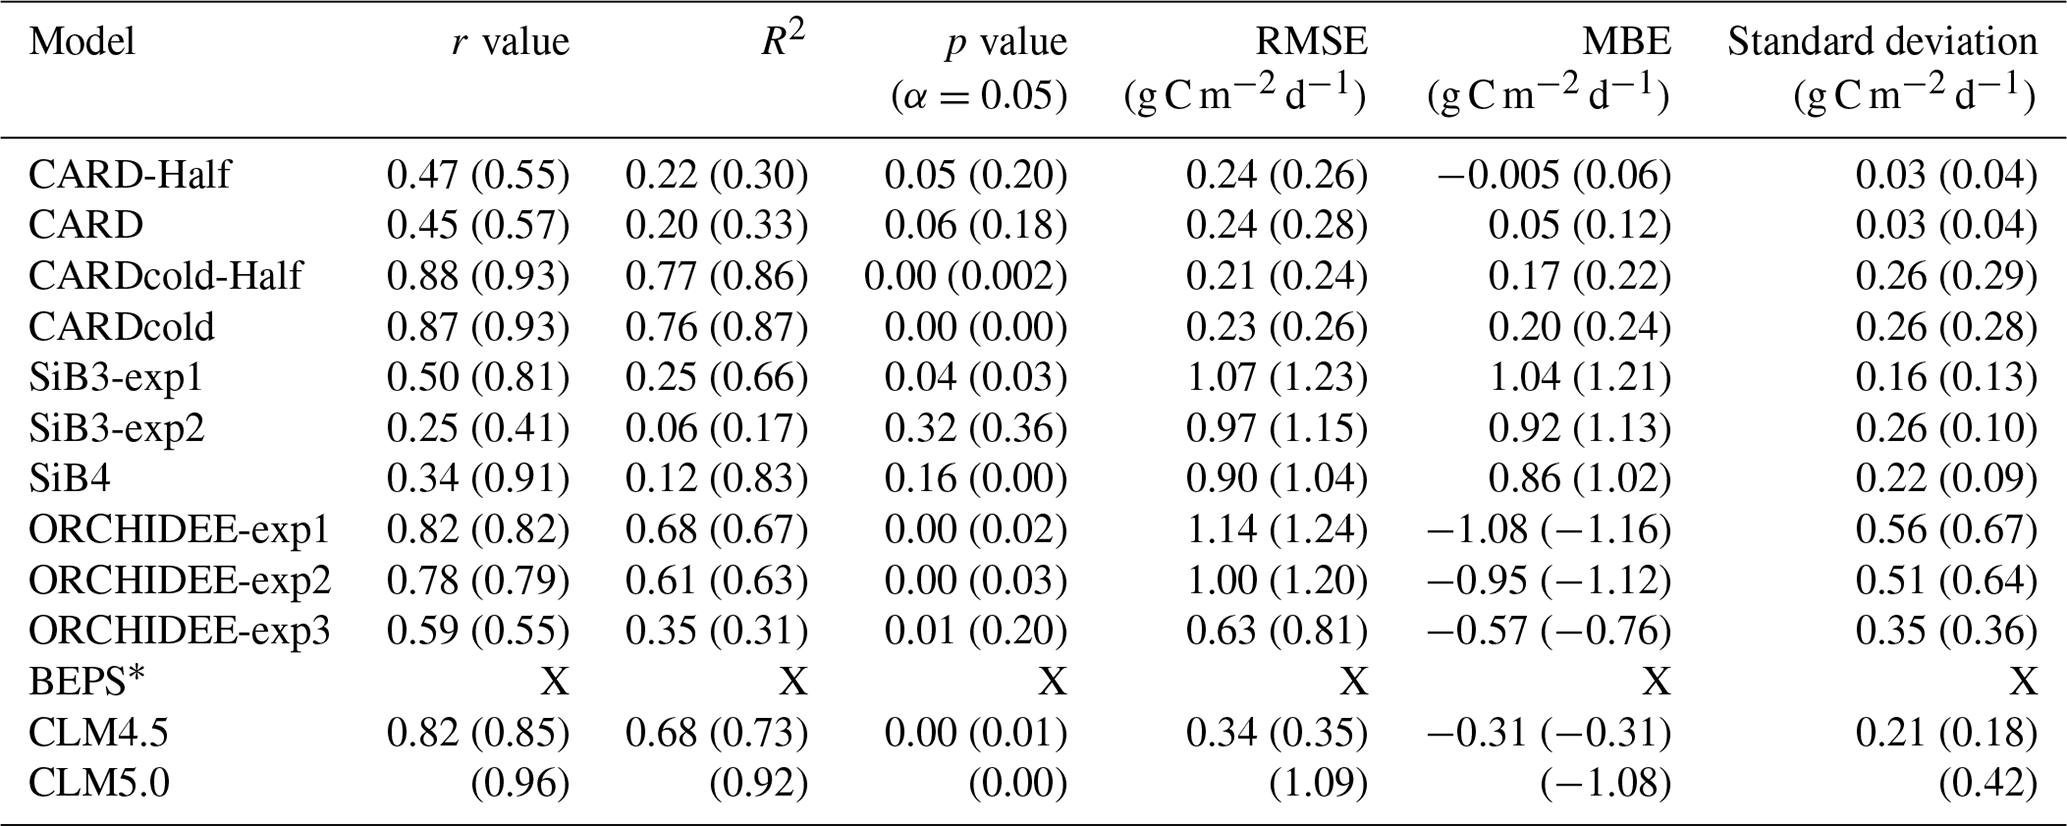
* BEPs statistics are not included in this table as this model only has GPP estimates for 2015–2018.
The range of performances across within-model experiments reveals important processes, as well as uncertainty in process representation, in driving the magnitude and variability in spring GPP. For example, the ORCHIDEE data assimilation experiment (exp3) shows consistently and substantially lower overall correlation (e.g., r=0.59 from 2001–2018) than corresponding free-running experiments (exp1 and exp2, r is 0.78–0.82) but has reduced RMSE and MBE (RMSE is 0.63 g C m−2 d−1 vs. 1–1.14 g C m−2 d−1). Likewise in SiB3, prescribing an empirically based but fixed-in-time LAI of 4.0 m2 m−2 (exp2) reduces mean bias but degrades variability (r=0.25) compared to a time-variable LAI (exp1) prescribed from satellite data (r=0.50).
There is also large variability in the modeled seasonal cycle (Fig. 7b) and mean annual GPP (Fig. S9). For mean annual GPP estimates, Pearson's r values are reduced for all models (Table S2). Once again, ORCHIDEE-exp2 and ORCHIDEE-exp3 stand out with some of the higher correlations (r=0.60 and r=0.64) and p values below the 5 % significance level. Furthermore, ORCHIDEE-exp3 (temperature stress with SIF data assimilation) has the lowest RMSE and MBE of the model set. SiB3-exp2 (fixed LAI) has a standard deviation closest to that of “observations” (0.14 g C m−2 d−1) and the smallest RMSE and MBE of the TBM models.
Most TBM-MIP models capture the shape of the seasonal cycle at Niwot Ridge. For the 2015–2018 period, all models have Pearson's r values larger than 0.91, with p values much smaller than a 5 % significance level (Table S3). With the help of data assimilation, CARDcold accurately captures the seasonal cycle at Niwot Ridge with reduced error (RMSE = 0.22 g C m−2 d−1; MBE = 0.07 g C m−2 d−1), and data assimilation experiments in ORCHIDEE-exp3 show reduced bias relative to free-running experiments. The cold-temperature limitation has little impact on the modeled mean seasonal cycle or mean annual GPP estimates in CARDAMOM and appears to be most valuable for improving spring GPP variability.
In summary, TBM-MIP experiments reveal several key factors that can improve or degrade estimates of spring GPP at Niwot Ridge. For example, adapting model parameters to needleleaf species based on hand-tuning to tower data and formal data assimilation methods (CLM4.5 and ORCHIDEE-exp3, respectively) improves the overall magnitude of spring GPP. Likewise, prescribing the LAI a constant value of 4.0 m2 m−2 based on tower measurements (SiB3-exp2) improves year-to-year variability, while prescribing the time-variable LAI based on MODIS data improves spring GPP magnitude (SiB3-exp1). SiB4, which has prognostic rather than prescribed phenology, represents a compromise in magnitude and variability when looking at the entire record (2001–2018) but is one of the top performers across all TBM-MIP models over the most recent period (2012–2018).
We did not directly consider changes in canopy structural or biophysical characteristics in our CARDAMOM experiments. In CARDAMOM, the LAI is a prognostic quantity (a function of foliar C and leaf carbon mass per area). In the absence of LAI observational constraints, the CARDAMOM LAI is indirectly informed by the constraints of time-varying GPP on DALEC2 parameters (see Sect. 2.3). Our results suggest that additional improvements are possible with careful consideration of in situ-measured vegetation parameters.
TBM-MIP experiments also offer insight into important environmental controls and process representation. Air temperature is an effective constraint of spring GPP onset (CLM4.5, ORCHIDEE-exp1, Fig. 7 and Table 2), but it can be degraded when large-scale data assimilation does not account for local to regional vegetation characteristics in parameter optimization (e.g., ORCHIDEE-exp3, Table 2). Water availability appears to be a secondary but still important driver of spring GPP. While acknowledging the numerous differences between CLM4.5 and CLM5.0, we find it important to note that plant hydraulic water stress (CLM5.0) shows improved IAV performance (high correlation, Table 2) over simplified soil moisture stress functions (CLM4.5). This result further supports efforts to closely analyze seasonal GPP to locate different environmental controls for future model improvements.
Our study of the controls of cold temperature on GPP has important implications for modeling seasonal productivity. First, future work must evaluate cold-temperature limitation at other sites across an array of ecosystem types. Additionally, it is important to determine if the temperature thresholds of photosynthesis initiation and cessation are similar across locations or unique to ecosystem type and/or site. Previous studies have had mixed results, supporting the use of both customized temperature threshold parameters dependent on the site (Tanja et al., 2003; Chang et al., 2020) and a general parameter across multiple sites or biome type (Bergeron et al., 2007). These differences could be due to variations in other variables (e.g., soil temperature, irradiance) and/or physiological differences in the vegetation species. Identifying how photosynthesis temperature thresholds vary across space and ecosystem type would be beneficial in improving model performance in simulating productivity. Our model intercomparison study also provides insights into how we may improve our ability to model seasonal GPP. For example, in Fig. 7b, we see that the ORCHIDEE model growing season starts too early. In the photosynthesis module of ORCHIDEE, the temperature dependency of parameters are described by Arrhenius or modified Arrhenius functions following Medlyn et al. (2002) and Kattge and Knorr (2007). In general, the functions are used to estimate the potential rates of Rubisco activity and electron transport based on temperature, as these rates are needed to determine photosynthetic capacity (Medlyn et al., 2002). The lowest temperatures for productivity mentioned in these studies are 5 and 11 ∘C, respectively. Additionally, there is a test at the start of the photosynthesis subroutine that prevents the computation of photosynthesis if the mean temperature over the last 20 d falls below −4 ∘C. For our study, the only ORCHIDEE experiment that uses specific data related to the plant functional type of this site (OCO-2 SIF data for US-NR1) is ORCHIDEE-exp3. This experiment improves the general behavior of the modeled GPP seasonal cycle but does not improve ORCHIDEE's ability to capture the start of the growing season. So with the future evaluation of cold-temperature limitation at other sites and further study of the potential temperature-influenced bias in the model, ORCHIDEE (and other process-based models) may need to improve its photosynthesis temperature dependency for cold plant functional types. Therefore, we recommend implementing a cold-temperature GPP limitation in a process-based model to confirm its ability to improve model performance. If we (1) identify how photosynthesis initiation and shutdown vary with temperature and location and (2) apply a cold-temperature limitation successfully in a process-based model, then we could expand our analyses to answer bigger Earth science questions. For example, we could use Earth system model temperature trends to determine how changing temperature will impact GPP in the future.
While further experiments are needed, these results demonstrate the value of (1) site level data assimilation for local-scale prediction of GPP magnitude and variability, (2) global data assimilation for reducing magnitude biases, and (3) process formulation for accounting for sensitivity to temperature limitation and water stress. Overall, these results are encouraging for model–data fusion systems which have developed the capacity to bring together temporally and spatially resolved functional and structural vegetation components such as the LAI, SIF, soil organic matter, and above- and belowground biomass (e.g., Bacour et al., 2019; Smith et al., 2020; Bloom et al., 2020). Joint assimilation of these datasets, coupled with observed meteorological forcing, has the potential to introduce more emergent constraints of vegetation change with respect to environmental change, thus improving overall estimates of productivity. Future work will assess the joint impact of SIF, ET (evapotranspiration), the LAI, and biomass data as effective constraints on light-use and water-use efficiency (Smith et al., 2020), which is expected to improve the ability of CARDAMOM to use light with respect to increasing biomass subject to longer growing seasons and heat and water stress.
Despite mechanistic advances in ecosystem modeling, it is still a challenge to simulate temporal variations in GPP. In an attempt to dissect the environmental controls on GPP in an evergreen needleleaf ecosystem, we analyzed the impact of temperature on spring (March–May) productivity by implementing a cold-temperature GPP limitation within a model–data fusion system (DALEC2–CARDAMOM). The cold-weather GPP limitation allows for improved model estimates of mean spring productivity at Niwot Ridge, specifically CARDAMOM's ability to match the interannual variability observed in tower-derived mean spring GPP. Furthermore, CARDAMOM is able to match spring interannual variability between model and tower data outside of the training period. When compared to TBM-MIP models, controls that appear to impact model performance include the inclusion of water stress (e.g., soil moisture) and vegetation parameters (e.g., prescription of the LAI). The fact that the cold-temperature limitation does not improve CARDAMOM's annual GPP estimates suggests that other controls (i.e., winter precipitation) drive GPP variability in other parts of the year, most likely summer (June–September). The cold-temperature limitation may prove useful in understanding future changes in spring productivity due to changes in temperature in other ecosystems as well.
The DALEC2 model parameter values and state variable initial conditions (henceforth x) are optimized using a Bayesian inference approach, where the posterior probability distribution of x given observations O, p(x|O), can be expressed as
where p(x) is the prior probability distribution of x and L(x|O) is the likelihood of the DALEC parameters and initial conditions given observations O. We define the likelihood function as
where for monthly time step i, mi(x) and Oi represent monthly modeled GPP (based on parameters x) and flux tower GPP observation, respectively. Following model–data fusion efforts with a spectrum of temporal modes of variability (Desai, 2010; Quetin et al., 2020; Bloom et al., 2020), we extend the cost function to include mean annual model and tower-derived GPP, ma(x) and Oa, respectively, where a is the year, which allows the GPP cost function to be sensitive to both seasonal and interannual components of the flux tower GPP signal. We log transform modeled and tower-derived GPP values (as done in Bloom and Williams, 2015, and Bloom et al., 2016), which is preferable for characterizing model–data residuals between strictly positive quantities (such as GPP). For lack of better uncertainty estimates of monthly and annual flux tower GPP accuracy – including lack of knowledge on GPP error characteristics at monthly timescales, error covariance between individual GPP estimates and model structural error impacts on GPP – we conservatively prescribed an uncertainty factor of σ=2 for monthly values (roughly ∼ 75 %) and (∼ 18 %) for annual values; in general we found that these values led to robust agreements between flux tower and DALEC2 GPP variability (model–data mismatch metrics are reported in Sect. 3 of the paper).
For all model experiments, we sample the probability of p(x | O), the posterior probability distribution of initial conditions x given observations O; we use the Metropolis–Hastings Markov chain Monte Carlo (MHMCMC; Haario et al., 2001) with four chains for 108 iterations; and we subsample 1000 parameter vectors x, from the latter 50 % of each chain (in total 1000 samples × 4 chains = 4000 samples). We test for convergence in the MHMCMC estimates of x using a the Gelman–Rubin convergence diagnostic to measure convergence between the four chains.
The CARDAMOM code used in this study is available here: https://doi.org/10.5281/zenodo.49041 (Yang et al., 2021b)
The Ameriflux US-NR1 data were obtained from https://doi.org/10.17190/AMF/1246088 (Blanken et al., 2020). The US-NR1 data used in this study, as well as the CARDAMOM and TBM-MIP outputs, are publicly available and provided in .nc file format at http://doi.org/10.5281/zenodo.4928097 (Stettz, 2021).
The supplement related to this article is available online at: https://doi.org/10.5194/bg-19-541-2022-supplement.
SGS, NCP and AAB designed and performed the research. AJN, BR, CB, FM, IB, YZ, BQ and MS contributed model simulations. DRB, SPB and PDB contributed observational data. All authors contributed to the writing of the paper and/or revision of the manuscript.
An author is a member of the editorial board of Biogeosciences. The peer-review process was guided by an independent editor, and the authors have also no other competing interests to declare.
Publisher’s note: Copernicus Publications remains neutral with regard to jurisdictional claims in published maps and institutional affiliations.
A portion of this research was carried out at the Jet Propulsion Laboratory, California Institute of Technology, under contract with NASA. We acknowledge the MEaSUREs program. The National Center for Atmospheric Research (NCAR) is sponsored by NSF.
This research has been supported at the US-NR1 AmeriFlux site by the US DOE, Office of Science, through the AmeriFlux Management Project (AMP) at Lawrence Berkeley National Laboratory under award number 7094866. This research has also been supported by the NASA Earth Science Division Arctic Boreal Vulnerability Experiment (ABoVE). Stephanie G. Stettz was partly supported by a University of California, Irvine graduate student fellowship. David R. Bowling and Brett Raczka were supported by the NASA CMS (80NSSC20K0010) and the NSF Macrosystems Biology and NEON-Enabled Science (1926090) programs. Mingjie Shi was partly supported by the US Department of Energy Office of Science Biological and Environmental Research as part of the Terrestrial Ecosystem Science Program through the Next-Generation Ecosystem Experiments (NGEE) Tropics project. PNNL is operated by Battelle Memorial Institute for the US DOE under contract DE-AC05-76RLO1830.
This paper was edited by Sönke Zaehle and reviewed by two anonymous referees.
Anav, A., Friedlingstein, P., Beer, C., Ciais, P., Harper, A., Jones, C., Murray-Tortarolo, G., Papale, D., Parazoo, N. C., Peylin, P., Piao, S., Sitch, S., Viovy, N., Wiltshire, A., and Zhao, M.: Spatiotemporal patterns of terrestrial gross primary production: A review, Rev. Geophys., 53, 785–818, https://doi.org/10.1002/2015RG000483, 2015.
Arneth, A., Lloyd, J., Shibistova, O., Sogachev, A., and Kolle, O.: Spring in the boreal environment: observations on pre- and post-melt energy and CO2 fluxes in two central Siberian ecosystems, Boreal Environ. Res., 11, 311–328, 2006.
Bacour, C., Maignan, F., MacBean, N., Porcar-Castell, A., Flexas, J., Frankenberg, C., Peylin, P., Chevallier, F., Vuichard, N., and Bastrikov, V.: Improving Estimates of Gross Primary Productivity by Assimilating Solar-Induced Fluorescence Satellite Retrievals in a Terrestrial Biosphere Model Using a Process-Based SIF Model, J. Geophys. Res.-Biogeo., 124, 3281–3306, https://doi.org/10.1029/2019JG005040, 2019.
Baldocchi, D.: “Breathing” of the terrestrial biosphere: lessons learned from a global network of carbon dioxide flux measurement systems, Aust. J. Bot., 56, 1–26, https://doi.org/10.1071/BT07151, 2008.
Baldocchi, D., Chu, H., and Reichstein, M.: Inter-annual variability of net and gross ecosystem carbon fluxes: A review, Agric. For. Meteorol., 249, 520–533, https://doi.org/10.1016/j.agrformet.2017.05.015, 2018.
Bauerle, W. L., Oren, R., Way, D. A., Qian, S. S., Stoy, P. C., Thornton, P. E., Bowden, J. D., Hoffman, F. M., and Reynolds, R. F.: Photoperiodic regulation of the seasonal pattern of photosynthetic capacity and the implications for carbon cycling, P. Natl. Acad. Sci. USA, 109, 8612–8617, https://doi.org/10.1073/pnas.1119131109, 2012.
Beer, C., Reichstein, M., Tomelleri, E., Ciais, P., Jung, M., Carvalhais, N., Rödenbeck, C., Arain, M. A., Baldocchi, D., Bonan, G. B., Bondeau, A., Cescatti, A., Lasslop, G., Lindroth, A., Lomas, M., Luyssaert, S., Margolis, H., Oleson, K. W., Roupsard, O., Veenendaal, E., Viovy, N., Williams, C., Woodward, F. I., and Papale, D.: Terrestrial Gross Carbon Dioxide Uptake: Global Distribution and Covariation with Climate, Science, 329, 834–838, https://doi.org/10.1126/science.1184984, 2010.
Bergeron, O., Margolis, H. A., Black, T. A., Coursolle, C., Dunn, A. L., Barr, A. G., and Wofsy, S. C.: Comparison of carbon dioxide fluxes over three boreal black spruce forests in Canada, Global Change Biol., 13, 89–107, https://doi.org/10.1111/j.1365-2486.2006.01281.x, 2007.
Blanken, P. D., Monson, R. K., Burns, S. P., Bowling, D. R., and Turnipseed, A. A.: Ameriflux US-NR1 Niwot Ridge Forest (LTER NWT1), Ver. 16-5, AmeriFlux AMP [data set], https://doi.org/10.17190/AMF/1246088, 2020.
Bloom, A. A. and Williams, M.: Constraining ecosystem carbon dynamics in a data-limited world: integrating ecological “common sense” in a model–data fusion framework, Biogeosciences, 12, 1299–1315, https://doi.org/10.5194/bg-12-1299-2015, 2015.
Bloom, A. A., Exbrayat, J.-F., Velde, I. R. van der, Feng, L., and Williams, M.: The decadal state of the terrestrial carbon cycle: Global retrievals of terrestrial carbon allocation, pools, and residence times, P. Natl. Acad. Sci. USA, 113, 1285–1290, https://doi.org/10.1073/pnas.1515160113, 2016.
Bloom, A. A., Bowman, K. W., Liu, J., Konings, A. G., Worden, J. R., Parazoo, N. C., Meyer, V., Reager, J. T., Worden, H. M., Jiang, Z., Quetin, G. R., Smallman, T. L., Exbrayat, J.-F., Yin, Y., Saatchi, S. S., Williams, M., and Schimel, D. S.: Lagged effects regulate the inter-annual variability of the tropical carbon balance, Biogeosciences, 17, 6393–6422, https://doi.org/10.5194/bg-17-6393-2020, 2020.
Bowling, D. R., Logan, B. A., Hufkens, K., Aubrecht, D. M., Richardson, A. D., Burns, S. P., Anderegg, W. R. L., Blanken, P. D., and Eiriksson, D. P.: Limitations to winter and spring photosynthesis of a Rocky Mountain subalpine forest, Agric. For. Meteorol., 252, 241–255, https://doi.org/10.1016/j.agrformet.2018.01.025, 2018.
Buermann, W., Bikash, P. R., Jung, M., Burn, D. H., and Reichstein, M.: Earlier springs decrease peak summer productivity in North American boreal forests, Environ. Res. Lett., 8, 024027, https://doi.org/10.1088/1748-9326/8/2/024027, 2013.
Buermann, W., Forkel, M., O'Sullivan, M., Sitch, S., Friedlingstein, P., Haverd, V., Jain, A. K., Kato, E., Kautz, M., Lienert, S., Lombardozzi, D., Nabel, J. E. M. S., Tian, H., Wiltshire, A. J., Zhu, D., Smith, W. K., and Richardson, A. D.: Widespread seasonal compensation effects of spring warming on northern plant productivity, Nature, 562, 110–114, https://doi.org/10.1038/s41586-018-0555-7, 2018.
Burns, S. P., Blanken, P. D., Turnipseed, A. A., Hu, J., and Monson, R. K.: The influence of warm-season precipitation on the diel cycle of the surface energy balance and carbon dioxide at a Colorado subalpine forest site, Biogeosciences, 12, 7349–7377, https://doi.org/10.5194/bg-12-7349-2015, 2015.
Chang, Q., Xiao, X., Wu, X., Doughty, R., Jiao, W., Bajgain, R., Qin, Y., and Wang, J.: Estimating site-specific optimum air temperature and assessing its effect on the photosynthesis of grasslands in mid- to high-latitudes, Environ. Res. Lett., 15, 034064, https://doi.org/10.1088/1748-9326/ab70bb, 2020.
Desai, A. R.: Climatic and phenological controls on coherent regional interannual variability of carbon dioxide flux in a heterogeneous landscape, J. Geophys. Res.-Biogeo., 115, G00J02, https://doi.org/10.1029/2010JG001423, 2010.
Ensminger, I., Sveshnikov, D., Campbell, D. A., Funk, C., Jansson, S., Lloyd, J., Shibistova, O., and Öquist, G.: Intermittent low temperatures constrain spring recovery of photosynthesis in boreal Scots pine forests, Global Change Biol., 10, 995–1008, https://doi.org/10.1111/j.1365-2486.2004.00781.x, 2004.
Euskirchen, E. S., Carman, T. B., and McGuire, A. D.: Changes in the structure and function of northern Alaskan ecosystems when considering variable leaf-out times across groupings of species in a dynamic vegetation model, Global Change Biol., 20, 963–978, https://doi.org/10.1111/gcb.12392, 2014.
Exbrayat, J.-F., Bloom, A. A., Falloon, P., Ito, A., Smallman, T. L., and Williams, M.: Reliability ensemble averaging of 21st century projections of terrestrial net primary productivity reduces global and regional uncertainties, Earth Syst. Dynam., 9, 153–165, https://doi.org/10.5194/esd-9-153-2018, 2018.
Famiglietti, C. A., Smallman, T. L., Levine, P. A., Flack-Prain, S., Quetin, G. R., Meyer, V., Parazoo, N. C., Stettz, S. G., Yang, Y., Bonal, D., Bloom, A. A., Williams, M., and Konings, A. G.: Optimal model complexity for terrestrial carbon cycle prediction, Biogeosciences, 18, 2727–2754, https://doi.org/10.5194/bg-18-2727-2021, 2021.
Flynn, D. F. B. and Wolkovich, E. M.: Temperature and photoperiod drive spring phenology across all species in a temperate forest community, New Phytol., 219, 1353–1362, https://doi.org/10.1111/nph.15232, 2018.
Forkel, M., Carvalhais, N., Rödenbeck, C., Keeling, R., Heimann, M., Thonicke, K., Zaehle, S., and Reichstein, M.: Enhanced seasonal CO2 exchange caused by amplified plant productivity in northern ecosystems, Science, 351, 696–699, https://doi.org/10.1126/science.aac4971, 2016.
Fox, A., Williams, M., Richardson, A. D., Cameron, D., Gove, J. H., Quaife, T., Ricciuto, D., Reichstein, M., Tomelleri, E., Trudinger, C. M., and Van Wijk, M. T.: The REFLEX project: Comparing different algorithms and implementations for the inversion of a terrestrial ecosystem model against eddy covariance data, Agric. For. Meteorol., 149, 1597–1615, https://doi.org/10.1016/j.agrformet.2009.05.002, 2009.
Frank, J. M., Massman, W. J., Ewers, B. E., Huckaby, L. S., and Negrón, J. F.: Ecosystem CO2/H2O fluxes are explained by hydraulically limited gas exchange during tree mortality from spruce bark beetles, J. Geophys. Res.-Biogeo., 119, 1195–1215, https://doi.org/10.1002/2013JG002597, 2014.
Goulden, M. and Bales, R.: California forest die-off linked to multi-year deep soil drying in 2012–2015 drought, Nat. Geosci., 12, 1, https://doi.org/10.1038/s41561-019-0388-5, 2019.
Greenland, D.: The Climate of Niwot Ridge, Front Range, Colorado, U.S.A., Arctic Alpine Res., 21, 380–391, https://doi.org/10.2307/1551647, 1989.
Haario, H., Saksman, E., and Tamminen, J.: An Adaptive Metropolis Algorithm, Bernoulli, 7, 223–242, https://doi.org/10.2307/3318737, 2001.
Hu, J., Moore, D. J. P., Burns, S. P., and Monson, R. K.: Longer growing seasons lead to less carbon sequestration by a subalpine forest, Global Change Biol., 16, 771–783, https://doi.org/10.1111/j.1365-2486.2009.01967.x, 2010.
Huxman, T. E., Turnipseed, A. A., Sparks, J. P., Harley, P. C., and Monson, R. K.: Temperature as a control over ecosystem CO2 fluxes in a high-elevation, subalpine forest, Oecologia, 134, 537–546, https://doi.org/10.1007/s00442-002-1131-1, 2003.
Ishida, A., Nakano, T., Sekikawa, S., Maruta, E., and Masuzawa, T.: Diurnal changes in needle gas exchange in alpine Pinus pumila during snow-melting and summer seasons, Ecol. Res., 16, 107–116, https://doi.org/10.1046/j.1440-1703.2001.00376.x, 2001.
Kattge, J. and Knorr, W.: Temperature acclimation in a biochemical model of photosynthesis: a reanalysis of data from 36 species, Plant Cell Environ., 30, 1176–1190, https://doi.org/10.1111/j.1365-3040.2007.01690.x, 2007.
Keenan, T. F., Davidson, E., Moffat, A. M., Munger, W., and Richardson, A. D.: Using model-data fusion to interpret past trends, and quantify uncertainties in future projections, of terrestrial ecosystem carbon cycling, Global Change Biol., 18, 2555–2569, https://doi.org/10.1111/j.1365-2486.2012.02684.x, 2012.
Keenan, T. F., Gray, J., Friedl, M. A., Toomey, M., Bohrer, G., Hollinger, D. Y., Munger, J. W., O'Keefe, J., Schmid, H. P., Wing, I. S., Yang, B., and Richardson, A. D.: Net carbon uptake has increased through warming-induced changes in temperate forest phenology, Nat. Clim. Change, 4, 598–604, https://doi.org/10.1038/nclimate2253, 2014.
Knowles, J. F., Burns, S. P., Blanken, P. D., and Monson, R. K.: Fluxes of energy, water, and carbon dioxide from mountain ecosystems at Niwot Ridge, Colorado, Plant Ecolog. Divers., 8, 663–676, https://doi.org/10.1080/17550874.2014.904950, 2015.
Knowles, J. F., Molotch, N. P., Trujillo, E., and Litvak, M. E.: Snowmelt-Driven Trade-Offs Between Early and Late Season Productivity Negatively Impact Forest Carbon Uptake During Drought, Geophys. Res. Lett., 45, 3087–3096, https://doi.org/10.1002/2017GL076504, 2018.
Korzukhin, M. D., Ter-Mikaelian, M. T., and Wagner, R. G.: Process versus empirical models: which approach for forest ecosystem management?, Can. J. For. Res., 26, 879–887, https://doi.org/10.1139/x26-096, 2011.
Lasslop, G., Reichstein, M., Papale, D., Richardson, A. D., Arneth, A., Barr, A., Stoy, P., and Wohlfahrt, G.: Separation of net ecosystem exchange into assimilation and respiration using a light response curve approach: critical issues and global evaluation, Global Change Biol., 16, 187–208, https://doi.org/10.1111/j.1365-2486.2009.02041.x, 2009.
Lin, J. C., Mallia, D. V., Wu, D., and Stephens, B. B.: How can mountaintop CO2 observations be used to constrain regional carbon fluxes?, Atmos. Chem. Phys., 17, 5561–5581, https://doi.org/10.5194/acp-17-5561-2017, 2017.
López-Blanco, E., Exbrayat, J.-F., Lund, M., Christensen, T. R., Tamstorf, M. P., Slevin, D., Hugelius, G., Bloom, A. A., and Williams, M.: Evaluation of terrestrial pan-Arctic carbon cycling using a data-assimilation system, Earth Syst. Dynam., 10, 233–255, https://doi.org/10.5194/esd-10-233-2019, 2019.
Magney, T. S., Bowling, D. R., Logan, B. A., Grossmann, K., Stutz, J., Blanken, P. D., Burns, S. P., Cheng, R., Garcia, M. A., Köhler, P., Lopez, S., Parazoo, N. C., Raczka, B., Schimel, D., and Frankenberg, C.: Mechanistic evidence for tracking the seasonality of photosynthesis with solar-induced fluorescence, P. Natl. Acad. Sci. USA, 116, 11640–11645, https://doi.org/10.1073/pnas.1900278116, 2019.
Mayr, S., Schmid, P., Laur, J., Rosner, S., Charra-Vaskou, K., Dämon, B., and Hacke, U. G.: Uptake of Water via Branches Helps Timberline Conifers Refill Embolized Xylem in Late Winter, Plant Physiol., 164, 1731–1740, https://doi.org/10.1104/pp.114.236646, 2014.
Medlyn, B. E., Dreyer, E., Ellsworth, D., Forstreuter, M., Harley, P. C., Kirschbaum, M. U. F., Roux, X. L., Montpied, P., Strassemeyer, J., Walcroft, A., Wang, K., and Loustau, D.: Temperature response of parameters of a biochemically based model of photosynthesis. II. A review of experimental data, Plant Cell Environ., 25, 1167–1179, https://doi.org/10.1046/j.1365-3040.2002.00891.x, 2002.
Monson, R. K., Turnipseed, A. A., Sparks, J. P., Harley, P. C., Scott-Denton, L. E., Sparks, K., and Huxman, T. E.: Carbon sequestration in a high-elevation, subalpine forest, Global Change Biol., 8, 459–478, https://doi.org/10.1046/j.1365-2486.2002.00480.x, 2002.
Moore, D. J. P., Hu, J., Sacks, W. J., Schimel, D. S., and Monson, R. K.: Estimating transpiration and the sensitivity of carbon uptake to water availability in a subalpine forest using a simple ecosystem process model informed by measured net CO2 and H2O fluxes, Agric. For. Meteorol., 148, 1467–1477, https://doi.org/10.1016/j.agrformet.2008.04.013, 2008.
Myneni, R. B., Keeling, C. D., Tucker, C. J., Asrar, G., and Nemani, R. R.: Increased plant growth in the northern high latitudes from 1981 to 1991, Nature, 386, 698–702, https://doi.org/10.1038/386698a0, 1997.
Öquist, G. and Huner, N. P. A.: Photosynthesis of Overwintering Evergreen Plants, Annu. Rev. Plant Biol., 54, 329–355, https://doi.org/10.1146/annurev.arplant.54.072402.115741, 2003.
Parazoo, N. C., Arneth, A., Pugh, T. A. M., Smith, B., Steiner, N., Luus, K., Commane, R., Benmergui, J., Stofferahn, E., Liu, J., Rödenbeck, C., Kawa, R., Euskirchen, E., Zona, D., Arndt, K., Oechel, W., and Miller, C.: Spring photosynthetic onset and net CO2 uptake in Alaska triggered by landscape thawing, Global Change Biol., 24, 3416–3435, https://doi.org/10.1111/gcb.14283, 2018.
Parazoo, N. C., Magney, T., Norton, A., Raczka, B., Bacour, C., Maignan, F., Baker, I., Zhang, Y., Qiu, B., Shi, M., MacBean, N., Bowling, D. R., Burns, S. P., Blanken, P. D., Stutz, J., Grossmann, K., and Frankenberg, C.: Wide discrepancies in the magnitude and direction of modeled solar-induced chlorophyll fluorescence in response to light conditions, Biogeosciences, 17, 3733–3755, https://doi.org/10.5194/bg-17-3733-2020, 2020.
Pierrat, Z., Nehemy, M. F., Roy, A., Magney, T., Parazoo, N. C., Laroque, C., Pappas, C., Sonnentag, O., Grossmann, K., Bowling, D. R., Seibt, U., Ramirez, A., Johnson, B., Helgason, W., Barr, A., and Stutz, J.: Tower-Based Remote Sensing Reveals Mechanisms Behind a Two-phased Spring Transition in a Mixed-Species Boreal Forest, J. Geophys. Res.-Biogeo., 126, e2020JG006191, https://doi.org/10.1029/2020JG006191, 2021.
Quetin, G. R., Bloom, A. A., Bowman, K. W., and Konings, A. G.: Carbon Flux Variability From a Relatively Simple Ecosystem Model With Assimilated Data Is Consistent With Terrestrial Biosphere Model Estimates, J. Adv. Model. Earth Syst., 12, e2019MS001889, https://doi.org/10.1029/2019MS001889, 2020.
Randerson, J. T., Field, C. B., Fung, I. Y., and Tans, P. P.: Increases in early season ecosystem uptake explain recent changes in the seasonal cycle of atmospheric CO2 at high northern latitudes, Geophys. Res. Lett., 26, 2765–2768, https://doi.org/10.1029/1999GL900500, 1999.
Raupach, M. R., Rayner, P. J., Barrett, D. J., DeFries, R. S., Heimann, M., Ojima, D. S., Quegan, S., and Schmullius, C. C.: Model–data synthesis in terrestrial carbon observation: methods, data requirements and data uncertainty specifications, Global Change Biol., 11, 378–397, https://doi.org/10.1111/j.1365-2486.2005.00917.x, 2005.
Reichstein, M., Falge, E., Baldocchi, D., Papale, D., Aubinet, M., Berbigier, P., Bernhofer, C., Buchmann, N., Gilmanov, T., Granier, A., Grünwald, T., Havránková, K., Ilvesniemi, H., Janous, D., Knohl, A., Laurila, T., Lohila, A., Loustau, D., Matteucci, G., Meyers, T., Miglietta, F., Ourcival, J.-M., Pumpanen, J., Rambal, S., Rotenberg, E., Sanz, M., Tenhunen, J., Seufert, G., Vaccari, F., Vesala, T., Yakir, D., and Valentini, R.: On the separation of net ecosystem exchange into assimilation and ecosystem respiration: review and improved algorithm, Global Change Biol., 11, 1424–1439, https://doi.org/10.1111/j.1365-2486.2005.001002.x, 2005.
Richardson, A. D., Williams, M., Hollinger, D. Y., Moore, D. J. P., Dail, D. B., Davidson, E. A., Scott, N. A., Evans, R. S., Hughes, H., Lee, J. T., Rodrigues, C., and Savage, K.: Estimating parameters of a forest ecosystem C model with measurements of stocks and fluxes as joint constraints, Oecologia, 164, 25–40, https://doi.org/10.1007/s00442-010-1628-y, 2010.
Rowland, L., Hill, T. C., Stahl, C., Siebicke, L., Burban, B., Zaragoza-Castells, J., Ponton, S., Bonal, D., Meir, P., and Williams, M.: Evidence for strong seasonality in the carbon storage and carbon use efficiency of an Amazonian forest, Global Change Biol., 20, 979–991, https://doi.org/10.1111/gcb.12375, 2014.
Schimel, D., Schneider, F. D., and JPL Carbon and Ecosystem Participants: Flux towers in the sky: global ecology from space, New Phytol., 224, 570–584, https://doi.org/10.1111/nph.15934, 2019.
Scott-Denton, L. E., Moore, D. J. P., Rosenbloom, N. A., Kittel, T. G. F., Burns, S. P., Schimel, D. S., and Monson, R. K.: Forecasting net ecosystem CO2 exchange in a subalpine forest using model data assimilation combined with simulated climate and weather generation, J. Geophys. Res.-Biogeo., 118, 549–565, https://doi.org/10.1002/jgrg.20039, 2013.
Sippel, S., Forkel, M., Rammig, A., Thonicke, K., Flach, M., Heimann, M., Otto, F. E. L., Reichstein, M., and Mahecha, M. D.: Contrasting and interacting changes in simulated spring and summer carbon cycle extremes in European ecosystems, Environ. Res. Lett., 12, 075006, https://doi.org/10.1088/1748-9326/aa7398, 2017.
Smallman, T. L., Exbrayat, J.-F., Mencuccini, M., Bloom, A. A., and Williams, M.: Assimilation of repeated woody biomass observations constrains decadal ecosystem carbon cycle uncertainty in aggrading forests, J. Geophys. Res.-Biogeo., 122, 528–545, https://doi.org/10.1002/2016JG003520, 2017.
Smith, W. K., Fox, A. M., MacBean, N., Moore, D. J. P., and Parazoo, N. C.: Constraining estimates of terrestrial carbon uptake: new opportunities using long-term satellite observations and data assimilation, New Phytol., 225, 105–112, https://doi.org/10.1111/nph.16055, 2020.
Stavros, E. N., Schimel, D., Pavlick, R., Serbin, S., Swann, A., Duncanson, L., Fisher, J. B., Fassnacht, F., Ustin, S., Dubayah, R., Schweiger, A., and Wennberg, P.: ISS observations offer insights into plant function, Nat. Ecol. Evol., 1, 1–5, https://doi.org/10.1038/s41559-017-0194, 2017.
Stettz, S.: Datasets for Study on Cold Temperature Limitation on GPP in an Evergreen Forest, Zenodo [data set], https://doi.org/10.5281/zenodo.4928097, 2021.
Stinziano, J. R. and Way, D. A.: Autumn photosynthetic decline and growth cessation in seedlings of white spruce are decoupled under warming and photoperiod manipulations, Plant Cell Environ., 40, 1296–1316, https://doi.org/10.1111/pce.12917, 2017.
Stinziano, J. R., Hüner, N. P. A., and Way, D. A.: Warming delays autumn declines in photosynthetic capacity in a boreal conifer, Norway spruce (Picea abies), Tree Physiol., 35, 1303–1313, https://doi.org/10.1093/treephys/tpv118, 2015.
Sun, Y., Frankenberg, C., Wood, J. D., Schimel, D. S., Jung, M., Guanter, L., Drewry, D. T., Verma, M., Porcar-Castell, A., Griffis, T. J., Gu, L., Magney, T. S., Köhler, P., Evans, B., and Yuen, K.: OCO-2 advances photosynthesis observation from space via solar-induced chlorophyll fluorescence, Science, 358, eaam5747, https://doi.org/10.1126/science.aam5747, 2017.
Tanja, S., Berninger, F., Vesala, T., Markkanen, T., Hari, P., Mäkelä, A., Ilvesniemi, H., Hänninen, H., Nikinmaa, E., Huttula, T., Laurila, T., Aurela, M., Grelle, A., Lindroth, A., Arneth, A., Shibistova, O., and Lloyd, J.: Air temperature triggers the recovery of evergreen boreal forest photosynthesis in spring, Global Change Biol., 9, 1410–1426, https://doi.org/10.1046/j.1365-2486.2003.00597.x, 2003.
Thurner, M., Beer, C., Santoro, M., Carvalhais, N., Wutzler, T., Schepaschenko, D., Shvidenko, A., Kompter, E., Ahrens, B., Levick, S. R., and Schmullius, C.: Carbon stock and density of northern boreal and temperate forests, Global Change Biol., 23, 297–310, https://doi.org/10.1111/geb.12125, 2014.
Turnipseed, A. A., Blanken, P. D., Anderson, D. E., and Monson, R. K.: Energy budget above a high-elevation subalpine forest in complex topography, Agric. For. Meteorol., 110, 177–201, https://doi.org/10.1016/S0168-1923(01)00290-8, 2002.
Turnipseed, A. A., Anderson, D. E., Burns, S., Blanken, P. D., and Monson, R. K.: Airflows and turbulent flux measurements in mountainous terrain: Part 2: Mesoscale effects, Agric. For. Meteorol., 125, 187–205, https://doi.org/10.1016/j.agrformet.2004.04.007, 2004.
Wang, Y.-P., Trudinger, C. M., and Enting, I. G.: A review of applications of model–data fusion to studies of terrestrial carbon fluxes at different scales, Agric. For. Meteorol., 149, 1829–1842, https://doi.org/10.1016/j.agrformet.2009.07.009, 2009.
Williams, M., Rastetter, E. B., Fernandes, D. N., Goulden, M. L., Wofsy, S. C., Shaver, G. R., Melillo, J. M., Munger, J. W., Fan, S.-M., and Nadelhoffer, K. J.: Modelling the soil-plant-atmosphere continuum in a Quercus–Acer stand at Harvard Forest: the regulation of stomatal conductance by light, nitrogen and soil/plant hydraulic properties, Plant Cell Environ., 19, 911–927, https://doi.org/10.1111/j.1365-3040.1996.tb00456.x, 1996.
Williams, M., Rastetter, E. B., Fernandes, D. N., Goulden, M. L., Shaver, G. R., and Johnson, L. C.: Predicting Gross Primary Productivity in Terrestrial Ecosystems, Ecol. Appl., 7, 882–894, https://doi.org/10.1890/1051-0761(1997)007[0882:PGPPIT]2.0.CO;2, 1997.
Williams, M., Law, B. E., Anthoni, P. M., and Unsworth, M. H.: Use of a simulation model and ecosystem flux data to examine carbon–water interactions in ponderosa pine, Tree Physiol., 21, 287–298, https://doi.org/10.1093/treephys/21.5.287, 2001.
Williams, M., Schwarz, P. A., Law, B. E., Irvine, J., and Kurpius, M. R.: An improved analysis of forest carbon dynamics using data assimilation, Global Change Biol., 11, 89–105, https://doi.org/10.1111/j.1365-2486.2004.00891.x, 2005.
Winchell, T. S., Barnard, D. M., Monson, R. K., Burns, S. P., and Molotch, N. P.: Earlier snowmelt reduces atmospheric carbon uptake in midlatitude subalpine forests, Geophys. Res. Lett., 43, 8160–8168, https://doi.org/10.1002/2016GL069769, 2016.
Wolf, S., Keenan, T. F., Fisher, J. B., Baldocchi, D. D., Desai, A. R., Richardson, A. D., Scott, R. L., Law, B. E., Litvak, M. E., Brunsell, N. A., Peters, W., and van der Laan-Luijkx, I. T.: Warm spring reduced carbon cycle impact of the 2012 US summer drought, P. Natl. Acad. Sci. USA, 113, 5880, https://doi.org/10.1073/pnas.1519620113, 2016.
Wutzler, T., Lucas-Moffat, A., Migliavacca, M., Knauer, J., Sickel, K., Šigut, L., Menzer, O., and Reichstein, M.: Basic and extensible post-processing of eddy covariance flux data with REddyProc, Biogeosciences, 15, 5015–5030, https://doi.org/10.5194/bg-15-5015-2018, 2018.
Xu, C., Liu, H., Williams, A. P., Yin, Y., and Wu, X.: Trends toward an earlier peak of the growing season in Northern Hemisphere mid-latitudes, Global Change Biol., 22, 2852–2860, https://doi.org/10.1111/gcb.13224, 2016.
Yang, Q., Blanco, N. E., Hermida-Carrera, C., Lehotai, N., Hurry, V., and Strand, Å.: Two dominant boreal conifers use contrasting mechanisms to reactivate photosynthesis in the spring, Nat. Commun., 11, 128, https://doi.org/10.1038/s41467-019-13954-0, 2020.
Yang, Y., Bloom, A. A., Ma, S., Levine, P., Norton, A., Parazoo, N. C., Reager, J. T., Worden, J., Quetin, G. R., Smallman, T. L., Williams, M., Xu, L., and Saatchi, S.: CARDAMOM-FluxVal Version 1.0: a FLUXNET-based Validation System for CARDAMOM Carbon and Water Flux Estimates, Geosci. Model Dev. Discuss. [preprint], https://doi.org/10.5194/gmd-2021-190, in review, 2021a.
Yang, Y., Bloom, A. A., Ma, S., Levine, P., Norton, A., Parazoo, N. C., Reager, J. T., Worden, J., Quetin, G. R., Smallman, T. L., Williams, M., Xu, L., and Saatchi, S.: CARDAMOM-FluxVal Version 1.0, Zenodo [data set, code], https://doi.org/10.5281/zenodo.4904195, 2021b.
Yin, Y., Bloom, A. A., Worden, J., Saatchi, S., Yang, Y., Williams, M., Liu, J., Jiang, Z., Worden, H., Bowman, K., Frankenberg, C., and Schimel, D.: Fire decline in dry tropical ecosystems enhances decadal land carbon sink, Nat. Commun., 11, 1900, https://doi.org/10.1038/s41467-020-15852-2, 2020.