the Creative Commons Attribution 4.0 License.
the Creative Commons Attribution 4.0 License.
 | 06 Dec 2022
Greenhouse gas fluxes in mangrove forest soil in an Amazon estuary
Saúl Edgardo Martínez Castellón
José Francisco Berrêdo
Marcelo Rollnic
Maria de Lourdes Ruivo
Carlos Noriega
Tropical mangrove forests are important carbon sinks, the soil being the main carbon reservoir. Understanding the variability and the key factors that control fluxes is critical to accounting for greenhouse gas (GHG) emissions, particularly in the current scenario of global climate change. This study is the first to quantify carbon dioxide (CO2) and methane (CH4) emissions using a dynamic chamber in natural mangrove soil of the Amazon. The plots for the trace gases study were allocated at contrasting topographic heights. The results showed that the mangrove soil of the Amazon estuary is a source of CO2 (6.66 g CO2 m−2 d−1) and CH4 (0.13 g CH4 m−2 d−1) to the atmosphere. The CO2 flux was higher in the high topography (7.86 g CO2 m−2 d−1) than in the low topography (4.73 g CO2 m−2 d−1) in the rainy season, and CH4 was higher in the low topography (0.13 g CH4 m−2 d−1) than in the high topography (0.01 g CH4 m−2 d−1) in the dry season. However, in the dry period, the low topography soil produced more CH4. Soil organic matter, carbon and nitrogen ratio (), and redox potential influenced the annual and seasonal variation of CO2 emissions; however, they did not affect CH4 fluxes. The mangrove soil of the Amazon estuary produced 35.40 Mg CO2 eq. ha−1 yr−1. A total of 2.16 kg CO2 m−2 yr−1 needs to be sequestered by the mangrove ecosystem to counterbalance CH4 emissions.
- Article
(1267 KB) - Full-text XML
-
Supplement
(365 KB) - BibTeX
- EndNote


Mangrove areas are estimated to be the main contributors to greenhouse gas emissions in marine ecosystems (Allen et al., 2011; Chen et al., 2012). However, mangrove forests are highly productive due to a high nutrient turnover rate (Robertson et al., 1992), and have mechanisms that maximize carbon gain and minimize water loss through plant transpiration (Alongi and Mukhopadhyay, 2015). A study conducted in 25 mangrove forests (between 30∘ latitude and 73∘ longitude) revealed that these forests are the richest in carbon (C) storage in the tropics, containing on average 1023 Mg C ha−1 of which 49 % to 98 % is present in the soil (Donato et al., 2011).
The estimated soil CO2 flux in tropical estuarine areas is 16.2 Tg C yr−1 (Alongi, 2009). However, soil efflux measurements from tropical mangroves revealed emissions ranging from 2.9 to 11.0 g CO2 m−2 d−1 (Castillo et al., 2017; Chen et al., 2014; Shiau and Chiu, 2020). In situ CO2 production is related to the water input of terrestrial, riparian, and groundwater brought by rainfall (Rosentreter et al., 2018b). Due to the periodic tidal movement, the mangrove ecosystem is flooded daily, leaving the soil anoxic and consequently reduced, favoring methanogenesis (Dutta et al., 2013). Thus, estuaries are considered hotspots for CH4 production and emission (Bastviken et al., 2011; Borges et al., 2015). Organic material decomposition by methanogenic bacteria in anoxic environments, such as sediments, inner suspended particles, zooplankton gut (Reeburgh, 2007; Valentine, 2011), and the impact of freshwater should change the electron flow from sulfate-reducing bacteria to methanogenesis (Purvaja et al., 2004), which also results in CH4 formation. On the other hand, high salinity levels, above 18 ppt, may result in an absence of CH4 emissions (Poffenbarger et al., 2011), since CH4 dissolved in pores is typically oxidized anaerobically by sulfate (Chuang et al., 2016). Currently the uncertainty in emitted CH4 values in vegetated coastal wetlands is approximately 30 % (EPA, 2017). Soil flux measurements from tropical mangroves revealed emissions range from 0.3 to 4.4 mg CH4 m−2 d−1 (Castillo et al., 2017; Chen et al., 2014; Kreuzwieser et al., 2003).
The production of greenhouse gases from soils is mainly driven by biogeochemical processes. Microbial activities and gas production are related to soil properties, including total carbon and nitrogen concentrations, moisture, porosity, salinity, and redox potential (Bouillon et al., 2008; Chen et al., 2012). Due to the dynamics of tidal movements, mangrove soils may become saturated and present reduced oxygen availability, or suffer total aeration caused by the ebb tide. Studies attribute soil carbon flux responses to moisture perturbations because of seasonality and flooding events (Banerjee et al., 2016), with fluxes being dependent on tidal extremes (high tide and low tide), and flood duration (Chowdhury et al., 2018). In addition, phenolic compounds inhibit microbial activity and help keep organic carbon intact, thus leading to the accumulation of organic matter in mangrove forest soils (Friesen et al., 2018).
The Amazonian coastal areas in the state of Pará (Brazil) cover 2176.8 km2 where mangroves develop under the macro-tide regime, representing approximately 85 % of the entire area of Brazilian mangroves (Souza Filho, 2005). The objective of this study is to investigate the monthly flux of CO2 and CH4 from the soil, at two topographic heights, in a pristine mangrove area in the Mojuim River estuary, belonging to the Amazon biome. The gas fluxes were studied together with the analysis of the vegetation structure and soil physical–chemical parameters.
2.1 Study site
This study was conducted in the Amazonian coastal zone, Macaca Island (−0.746491 latitude and −47.997219 longitude), located in the Mojuim River estuary, at the Mocapajuba Marine Extractive Reserve, municipality of São Caetano de Odivelas (Fig. 1), state of Pará (Brazil). The Macaca island has an area of 1322 ha of pristine mangroves, and belongs to a mangrove area of 2177 km2 in the state of Pará (Souza Filho, 2005). The climate is type Am (tropical monsoon) according to the Köppen classification (Peel et al., 2007). The climatological data were obtained from the Meteorological Database for Teaching and Research of the National Institute of Meteorology (INMET). The area has a rainy season from January to June (2296 mm of precipitation) and a dry season from July to December (687 mm). March and April were the rainiest months with 505 and 453 mm of precipitation, while October and November were the driest (53 and 61 mm, respectively). The minimum temperatures occur in the rainy period (26 ∘C) and the maximum in the dry period (29 ∘C). The Mojuim estuary has a macrotidal regime, with an average amplitude of 4.9 m during spring tide and 3.2 m during low tide (Rollnic et al., 2018). During the wet season, the Mojuim River has a flow velocity of 1.8 m s−1 at the ebb tide and 1.3 m s−1 at the flood tide, whereas in the dry season, the maximum currents reach 1.9 m s−1 at the flood and 1.67 m s−1 at the ebb tide (Rocha, 2015). The annual mean salinity of the river water is 26.95 PSU (Valentim et al., 2018).
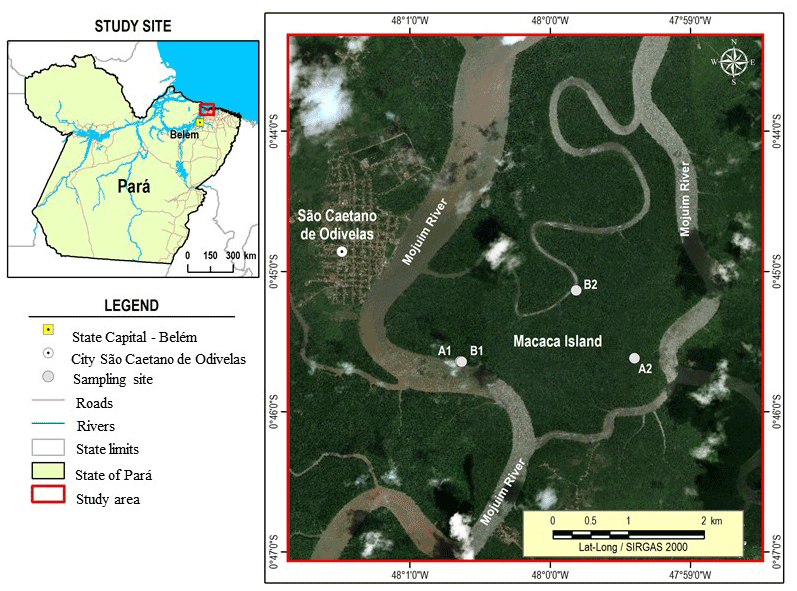
Figure 1The Macaca Island located in the mangrove coast of northern Brazil, municipality of São Caetano de Odivelas (state of Pará), with sampling points at low (plot B1 and plot B2) and high (plot A1 and plot A2) topographies. Image source: © Google Earth.
The Mojuim River region is geomorphologically formed by partially submerged river basins consequent of the increase in the relative sea level during the Holocene (Prost et al., 2001) associated with the formation of mangroves, dunes, and beaches (El-Robrini et al., 2006). Before reaching the estuary, the Mojuim River crosses an area of a dryland forest highly fragmented by family farming, forming remnants of secondary forest (<5.0 ha) of various ages (Fernandes and Pimentel, 2019). The population economically exploited the estuary, primarily by artisanal fishing, crab (Ucides cordatus L.) extraction, and oyster farms.
The flora of the mangrove area of Macaca Island is little anthropized and comprises the plant genera Rhizophora, Avicennia, Laguncularia, and Acrostichum (Ferreira, 2017; França et al., 2016). The estuarine plains are influenced by macro-tide dynamics and can be physiographically divided into four sectors according to the different vegetation covers, associated with the landforms distribution, topographic gradient, tidal inundation, and levels of anthropic transformation (França et al., 2016). The Macaca Island is ranked as being from the fourth sector, which implies having woods of adult trees of the genus Rhizophora with an average height of 10 to 25 m, being located at an elevation of 0 to 5 m, and having silt–clay soil (França et al., 2016).
Four sampling plots were selected in the Macaca Island (Fig. 1) on 19 May 2017, when the moon was in the waning quarter phase: two plots where flooding occurs every day (plots B1 and B2; Fig. 1), called low topography (Top_Low), and two plots where flooding occurs only at high tides during the solstice and on the high tides of the rainy season of the new and full moons (plots A1 and A2; Fig. 1), called high topography (Top_High).
2.2 Greenhouse gas flux measurements
In each plot, eight polyvinyl chloride rings with 0.20 m diameter and 0.12 m height were randomly installed within a circumference with a diameter of 20 m. The rings had an area of 0.028 m−2 (volume of 3.47 L), were fixed 0.05 m into the ground, and remained in place until the study was completed. Once a month, gas fluxes were measured during periods of waning or crescent moon, as these are the times when the soil in the low topography is more exposed. To avoid the influence of mangrove roots on the gas fluxes, the rings were placed in locations without any seedlings or aboveground mangrove roots. The CO2 and CH4 concentrations (ppm) were measured using the dynamic chamber methodology (Norman et al., 1997; Verchot et al., 2000), sequentially connected to a Los Gatos Research portable gas analyzer (Mahesh et al., 2015). The device was calibrated monthly with a high quality standard gas (500 ppm CO2; 5 ppm CH4). The rings were sequentially closed for 3 min with a PVC cap, being connected to the analyzer through two 12.0 m polyethylene hoses. The gas concentration was measured every 2 s and automatically stored by the analyzer. CO2 and CH4 fluxes were calculated from the linear regression of increasing/decreasing CO2 and CH4 concentrations within the chamber, usually between 1 and 3 min after the ring cover was placed (Frankignoulle, 1988; McEwing et al., 2015). The flux is considered zero when the linear regression reaches an R2<0.30 (Sundqvist et al., 2014). However, in our analyses, most regressions reached R2>0.70, and the regressions were weak and considered zero in only 6 % of the samples. At the end of each flux measurement, the height of the ring above ground was measured at four equidistant points with a ruler. The seasonal data were analyzed by comparing the average monthly fluxes in the wet season and dry season separately.
2.3 Vegetation structure and biomass
The floristic survey was conducted in October 2017 using circular 1256.6 m2 plots (Kauffman et al., 2013) divided into four 314.15 m2 subplots, which is the equivalent to 0.38 ha, at the same topographies as the gas flux analysis (Fig. 1). We recorded the diameter above the aerial roots, the diameter of the stem, and total height of all trees with DBH (diameter at breast height; m) greater than 0.05 m. The allometric equations (Howard et al., 2014) to calculate tree biomass (aboveground biomass; AGB) were the following: AGB = 0.1282 * DBH2.6; (R2= 0.92) for R. mangle; AGB = 0.140 * DBH2.4 (R2 = 0.97) for A. germinans; and total AGB = 0.168 × ρ * DBH2.47 (R2 = 0.99), where ρR. mangle= 0.87; ρA. germinans= 0.72 (ρ= wood density).
2.4 Soil sampling and environmental characterization
Four soil samples were collected with an auger at a depth of 0.10 m in all the studied plots for gas flux measurements (Fig. 1) in July 2017 (beginning of the dry season) and January 2018 (beginning of the rainy season). Before the soil samples were removed, pH and redox potential (Eh; mV) were measured with a Metrohm 744 equipment by inserting the platinum probe directly into the intact soil at a depth of 0.10 m (Bauza et al., 2002). The soil samples collected in the field were transported to the laboratory (chemical analysis laboratory of the Museu Paraense Emílio Goeldi) in thermal boxes containing ice. The soil samples were analyzed on the day after collection at the laboratory, and the samples were kept in a freezer. Salinity (Sal; ppt) was measured with PCE-0100, and soil moisture (Sm; %) by the residual gravimetric method (EMBRAPA, 1997).
Organic matter (OM; g kg−1), total carbon (TC; g kg−1), and total nitrogen (TN; g kg−1) were calculated by volumetry (oxidoreduction) using the Walkley–Black method (Kalembasa and Jenkinson, 1973). Microbial carbon (Cmic; mg kg−1) and microbial nitrogen (Nmic; mg kg−1) were determined through the 2.0 min of irradiation–extraction method of soil by microwave technique (Islam and Weil, 1998). Microwave heated soil extraction proved to be a simple, fast, accurate, reliable, and safe method to measure soil microbial biomass (de Araujo, 2010; Ferreira et al., 1999; Monz et al., 1991). The Cmic was determined by dichromate oxidation (Kalembasa and Jenkinson, 1973; Vance et al., 1987). The Nmic was analyzed following the method described by Brookes et al. (1985), changing fumigation to irradiation, which uses the difference between the amount of TN in irradiated and non-irradiated soil. We used the flux conversion factor of 0.33 (Sparling and West, 1988) and 0.54 (Almeida et al., 2019; Brookes et al., 1985), for carbon and nitrogen, respectively. Particle size analysis was performed separately on four soil samples collected at each flux plot, in the two seasons (October 2017 and March 2018), according to EMBRAPA (1997).
At each gas flux measurement, environmental variables such as air temperature (Tair, ∘C), relative humidity (RH, %), and wind speed (Ws, m s−1) were quantified with a portable thermo-hygrometer (model AK821) at the height of 2.0 m above the soil surface. Soil temperature (Ts, ∘C) was measured with a portable digital thermometer (model TP101) after each gas flux measurement. Daily precipitation was obtained from an automatic precipitation station installed at a pier on the banks of the Mojuim River in São Caetano das Odivelas (coordinates: −0.738333 latitude; −48.013056 longitude).
2.5 Statistical analyses
On the Macaca Island, two treatments were allocated (low and high topography), with two plots in either treatment. In each plot, eight chambers were randomly distributed, which were considered sample repetitions. The normality of the data of CH4 and FCO2 flux, and soil physicochemical parameters was evaluated using the Shapiro–Wilks method. The soil CO2 and CH4 flux showed a non-normal distribution. Therefore, we used the non-parametric ANOVA (Kruskal-Wallis, p<0.05) to test the differences between the two treatments among months and seasons. The physicochemical parameters were normally distributed. Therefore, a parametric ANOVA was used to test the statistical differences (p<0.05) between the two treatments among months and seasons. Pearson correlation coefficients were calculated to determine the relationships between soil properties and gas fluxes in the months (dry and wet season) when the chemical properties of the soil were analyzed at the same time as gas fluxes were measured. Statistical analyses were performed with the free statistical software Infostat 2015®.
3.1 Carbon dioxide and methane fluxes
CO2 fluxes differed significantly between topographies only in January (H = 3.915; p = 0.048), July (H = 9.091; p = 0.003), and November (H = 11.294; p<0.001) (Fig. 2; Supplement S1), with generally higher fluxes at the high topography than at the low topography. At the high topography, CO2 fluxes were significantly higher (H = 24.510; p = 0.011) in July compared to August and December, March, October, and May, not differing from the other months of the year. Similarly, at the low topography, CO2 fluxes were statistically significantly higher (H = 19.912; p = 0.046) in September and February when compared to January and November, not differing from the other months. We found a mean monthly flux of 7.9 ± 0.7 g CO2 m−2 d−1 (mean ± standard error) and 5.4 ± 0.5 g CO2 m−2 d−1 at the high and low topographies, respectively.

Figure 2CO2 (a) and CH4 (b) fluxes (g CO2 or CH4 m−2 d−1) monthly (July 2018 to June 2019) (n = 16). Seasonal (dry and rainy) and annual fluxes of CO2 (c) and CH4 (d), at high (Top_High) and low (Top_Low) topographies (n = 96), in a mangrove forest soil compared to tide level (tide level). The bars represent the standard error of the mean.
The CH4 fluxes were statistically different between topographies only in November (H = 9.276; p = 0.002) and December (H = 4.945; p = 0.005), with higher fluxes at the low topography (Fig. 2, Supplement S1). At the high topography, CH4 fluxes were significantly (H = 40.073; p<0.001) higher in April and July compared to the other months studied, and in November CH4 was consumed from the atmosphere (Fig. 2; Supplement S1). Similarly, CH4 fluxes at the low topography did not vary significantly among months (H = 10.114; p = 0.407).
Greenhouse gas fluxes (Fig. 2) were only significantly different between topographies in the dry season (Fig. 3), the period when CO2 fluxes were higher (H = 7.378; p = 0.006) at the high topography and CH4 fluxes at the low topography (H = 8.229; p<0.001). In Macaca Island, the mean annual fluxes of CO2 and CH4 were 6.659 ± 0.419 g CO2 m−2 d−1 and 0.132 ± 0.053 g CH4 m−2 d−1, respectively. During the study year, the CO2 flux from the mangrove soil ranged from −5.06 to 68.96 g CO2 m−2 d−1 (mean 6.66 g CO2 m−2 d−1), while the CH4 flux ranged from −5.07 to 11.08 g CH4 m−2 d−1 (mean 0.13 g CH4 m−2 d−1), resulting in a total carbon efflux rate of 1.92 g C m−2 d−1 or 7.00 Mg C ha−1 yr−1 (Fig. 2).
3.2 Weather data
There was a marked seasonality during the study period (Fig. 2), with 2155.0 mm of precipitation during the rainy period and 1016.5 mm during the dry period. The highest tides occurred in the period of greater precipitation (Fig. 3) due to the rains. However, the rainfall distribution was different from the climatological normal (Fig. 3). The precipitation in the rainy season was 553.2 mm below and in the dry season was 589.1 mm above the climatological normal. Thus, in the period studied, the dry season was rainier and the rainy season drier than the climatological normal, which may be a consequence of the La Niña event (Wang et al., 2019).
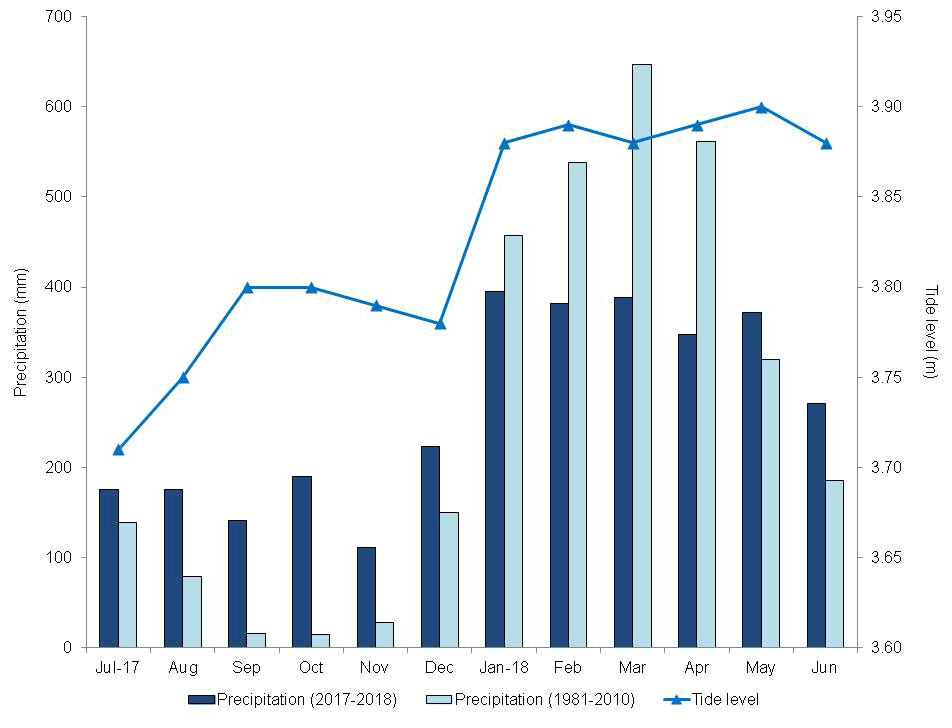
Figure 3Monthly climatological normal in the municipality of Soure (1981–2010, mm), monthly precipitation (mm), and maximum tide height (m) from 2017–2018, in the municipality of São Caetano de Odivelas (PA).
Tair was significantly higher (LSD = 0.72, p = 0.01) at the high (31.24 ± 0.26 ∘C) than at the low topography (30.30 ± 0.25 ∘C) only in the rainy season (Fig. 4a). No significant variation in Ts was found between topographies in either season (Fig. 4b). RH was significantly higher (LSD = 2.55, p = 0.01) at the high topography (70.54 ± 0.97 %) than at the low topography (66.85 ± 0.87 %) only in the rainy season (Fig. 4c). Ws (Fig. 4d) was significantly higher (LSD = 0.15, p<0.00) at the low (0.54 ± 0.06 m s−1) than at the high topography (0.24 ± 0.04 m s−1) also in the rainy season.
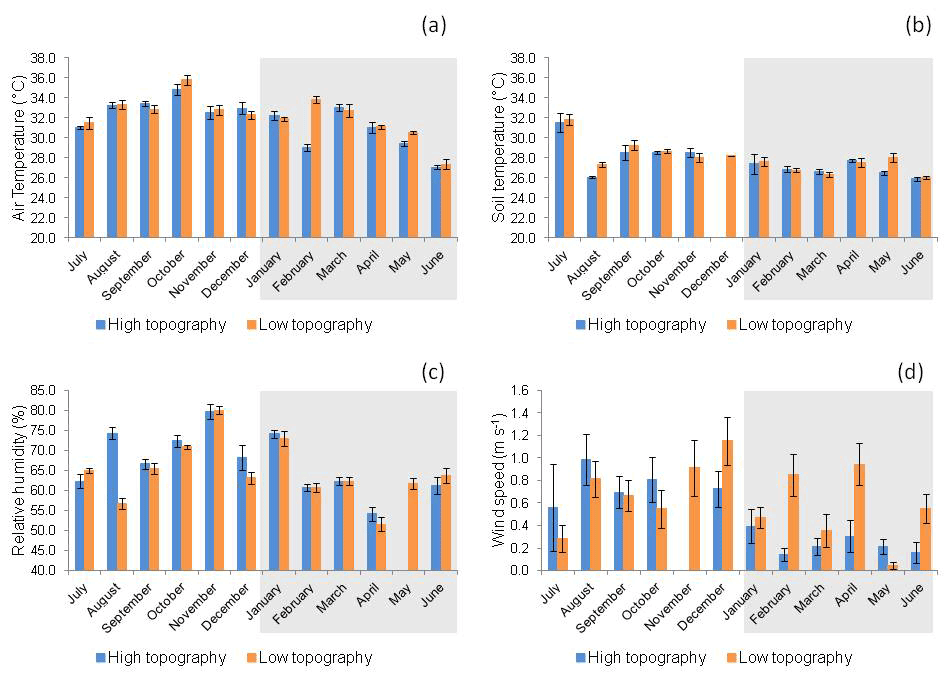
Figure 4(a) Air temperature (∘ C), (b) soil temperature (∘C), (c) relative humidity (%), and (d) wind speed (m s−1) at high and low topographies, from July 2017 to June 2018 in a mangrove area in the Mojuim River estuary. Bars highlighted in grey correspond to the rainy season (n = 16). The bars represent the standard error.
3.3 Soil characteristics
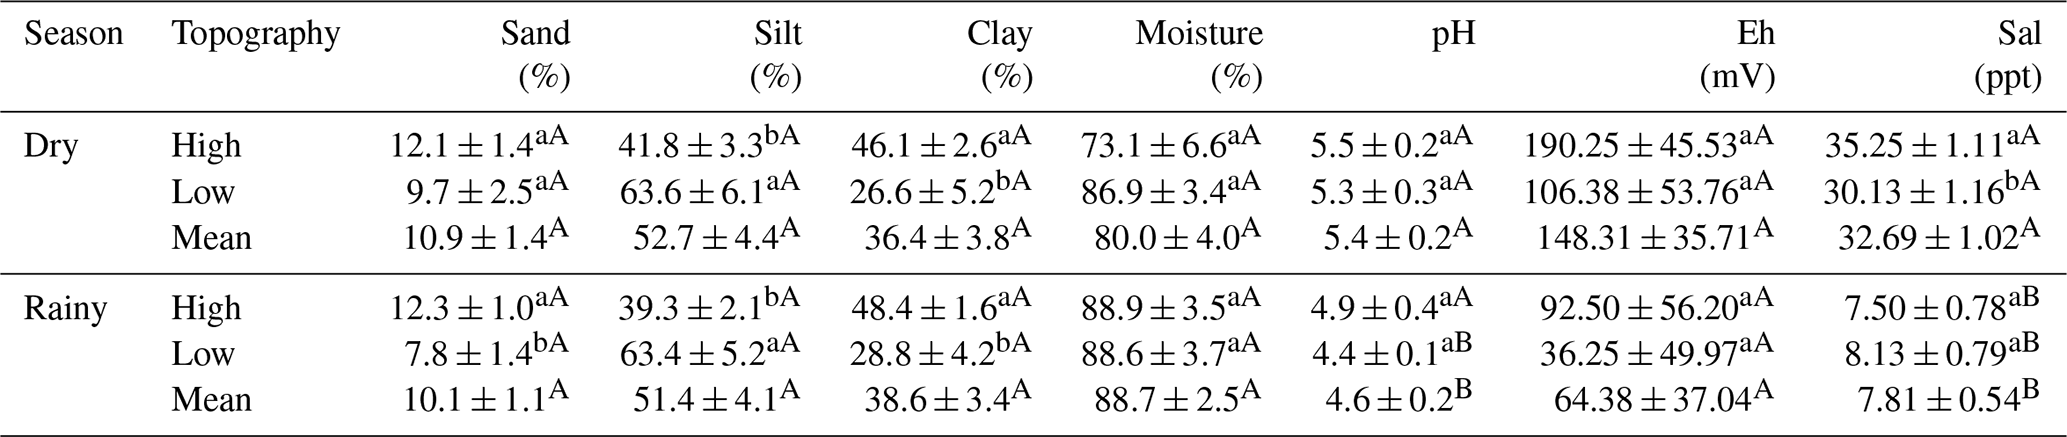
Silt concentration was higher at the low topography (LSD: 14.763; p = 0.007) and clay concentration was higher at the high topography plots (LSD: 12.463; p = 0.005), in both seasons studied (Table 1). Soil particle size analysis did not differ statistically (p>0.05) between the two seasons (Table 1). Soil moisture did not vary significantly (p>0.05) between topographies at each season, or between seasonal periods at the same topography (Table 1). The pH varied statistically (LSD: 5.950; p = 0.006) only at the low topography when the two seasons were compared, being more acidic in the dry period (Table 1). The pH values were significantly (LSD: 0.559; p = 0.008) higher in the dry season (Table 1). No variation in Eh was identified between topographies and seasons (Table 1), although it was higher in the dry season than in the rainy season. However, Sal values were higher (LSD: 3.444; p = 0.010) at the high topography than at the low topography in the dry season (Table 1). In addition, Sal was significantly higher in the dry season than in the rainy season, in both high (LSD: 2.916; p<0.001) and low (LSD: 3.003; p<0.001) topographies (Table 1).
Table 1Analysis of sand (%), silt (%), clay (%), moisture (%), pH, redox potential (Eh, mV), and salinity (Sal; ppt) in the mangrove soil of high and low topographies, and in the rainy and dry seasons (Macaca island, São Caetano das Odivelas). Numbers represent the mean ± standard error of the mean. Lowercase letters compare topographies in each seasonal period and uppercase letters compare the same topography between seasonal periods. Different letters indicate statistical difference (LSD, p<0.05).
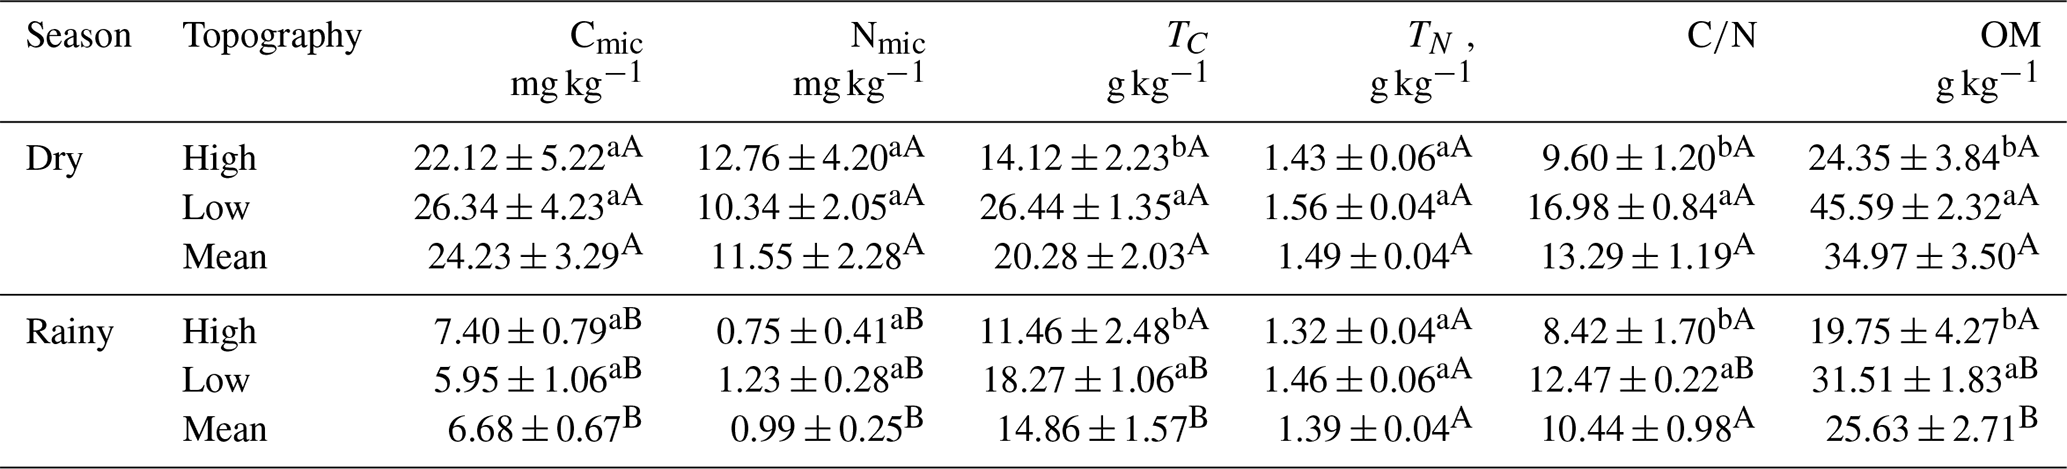
The Cmic did not differ between topographies in the two seasons (Table 2). However, TC was significantly higher in the low topography in the dry season (LSD: 5.589; p<0.000) and in the rainy season (LSD: 5.777; p = 0.024). In addition, Cmic was higher in the dry season in both the high (LSD: 11.325; p<0.010) and low (LSD: 9.345; p<0.000) topographies (Table 2). Nmic did not vary between topographies seasonally. However, Nmic in the high (LSD: 9.059; p = 0.013) and low topographies (LSD: 4.447; p = 0.001) was higher during the dry season (Table 2). The ratio (Table 2) was higher in the low than in the high topography in both the dry (LSD: 3.142; p<0.000) and rainy seasons (LSD: 3.675; p = 0.033). However, only in the low topography was the ratio higher (LSD: 1.863; p<0.000) in the dry season than in the rainy season (Table 2). Soil OM was higher at the low topography in the rainy (LSD: 9.950; p = 0.024) and in the dry seasons (LSD: 9.630; p<0.000). Only in the lowland topography was the OM concentration higher in the dry season than in the rainy season (Table 2).
Table 2Seasonal and topographic variation in microbial carbon (Cmic; mg kg−1), microbial nitrogen (Nmic, mg kg−1), total carbon (TC; g kg−1), total nitrogen (NT; g kg−1), carbon/nitrogen ratio (), and soil organic matter (OM; g kg−1). Numbers represent the mean (± standard error). Lowercase letters compare topographies at each season, and uppercase letters compare the topography between seasons.
3.4 Vegetation structure and biomass
Only the species R. mangle and A. germinans were found in the floristic survey carried out. The DBH did not vary significantly between the topographies for either species (Table 3). However, R. mangle had a higher DBH than A. germinaris at both high (LSD: 139.304; p = 0.037) and low topographies (LSD: 131.307; p = 0.001). The basal area (BA) and AGB did not show significant variation (Table 3). A total aboveground biomass of 322.1 ± 49.6 Mg ha−1 was estimated.
Table 3Summed diameter at breast height (DBH; cm), basal area (BA; m2 ha−1), and aboveground biomass (AGB; Mg ha−1) at high and low topographies in the mangrove forest of the Mojuim River estuary. Numbers represent the mean ± standard error of the mean. Lowercase letters compare topographic height for each species, and uppercase letters compare species at each topographic height, using Tukey's test (p<0.05).
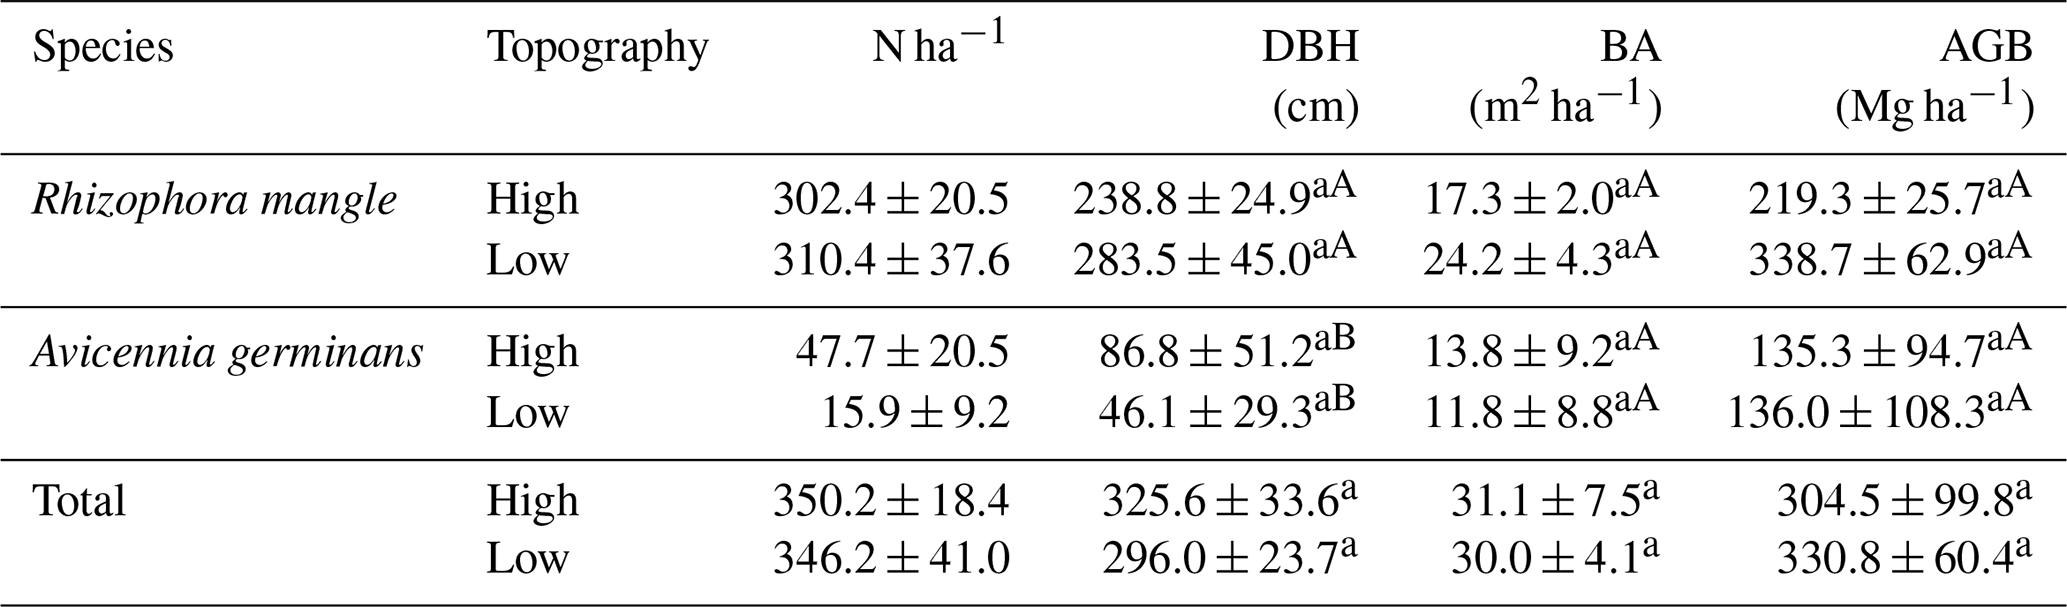
The equations for biomass estimates (AGB) were the following: R. mangle = 0.1282 * DBH2.6; A. germinans = 0.14 * DBH2.4; and Total = 0.168 * ρ * DBH2.47, where ρR. mangle= 0.87; ρA. germinans= 0.72 (Howard et al., 2014).
3.5 Drivers of greenhouse gas fluxes
In the rainy season, CO2 efflux was correlated with Tair (Pearson = 0.23, p = 0.03), RH (Pearson = −0.32, p<0.00), and Ts (Pearson = 0.21, p = 0.04) only at the low topography. In the dry season, CO2 flux was correlated with Ts (Pearson = 0.39, p<0.00) at the low topography. The dry season was the period in which we found the greatest amount of significant correlations between CO2 efflux and soil chemical parameters, while the ratio, OM, and Eh were correlated with CO2 efflux in both seasons (Table 4). The negative correlation between TC, NT, , and OM, along with the positive correlation of Nmic with soil CO2 flux, in the dry period, indicates that microbial activity is a decisive factor for CO2 efflux (Table 4). Soil moisture in the Mojuim River mangrove forest negatively influenced CO2 flux in both seasons (Table 4). However, soil moisture was not correlated with CH4 flux. No significant correlations were found between CH4 efflux and the chemical properties of the soil in the mangrove of the Mojuim River estuary (Table 4).
Table 4Correlation coefficient (Pearson) of CO2 and CH4 fluxes with chemical parameters of the soil in a mangrove area in the Mojuim River estuary.
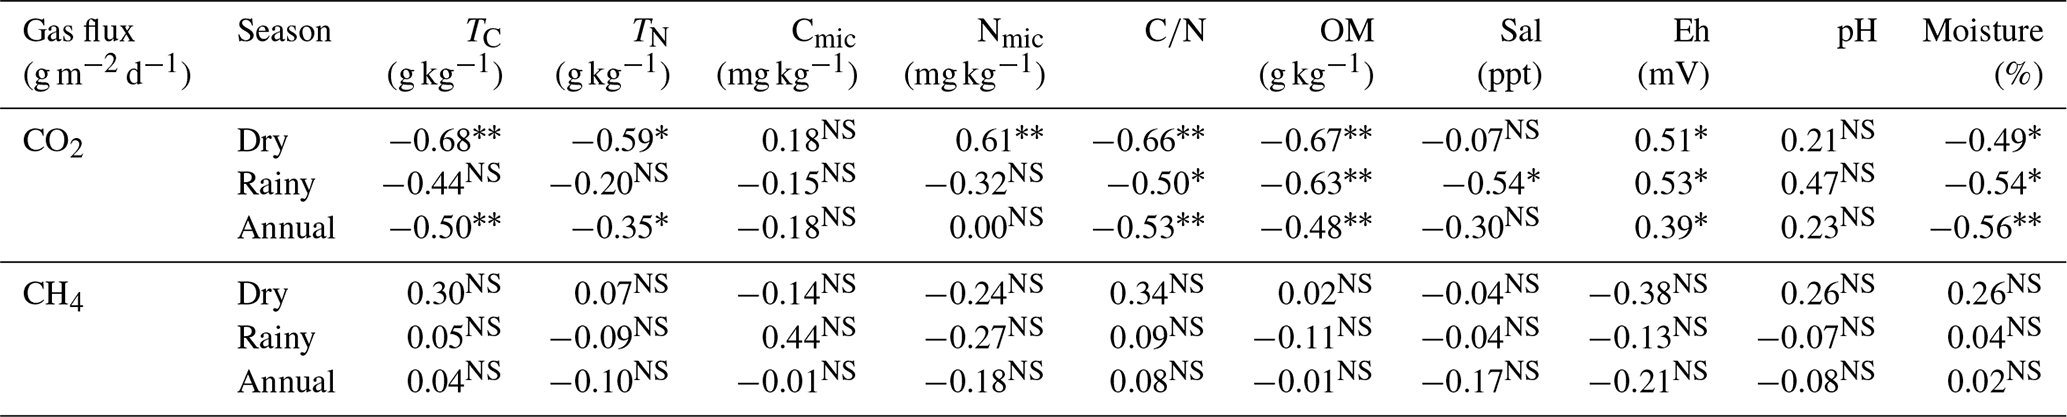
total carbon (TC; g kg−1); total nitrogen (TN; g kg−1); microbial carbon (Cmic, g kg−1); microbial nitrogen (Nmic, g kg−1); carbon and nitrogen ratio (); organic matter (OM; g kg−1); salinity (Sal; ppt); redox potential (Eh; mV); soil moisture (moisture, %). NS represents not significant; * significant effects at p ≤ 0.05; significant effects at p ≤ 0.01.
4.1 Carbon dioxide and methane flux
It is important to consider that the year under study was rainier in the dry season (2017) and less rainy in the wet season (2018) when the climatological average is concerned (1981–2010) (Fig. 3). Perhaps this variation is related to the La Niña effects (extreme event), taking into account that the intensification and higher frequency of extreme events result from climate change (Barichivich et al., 2018). Under these conditions, negative and positive fluxes of the two greenhouse gases were found (negative values represented gas consumption). The negative CO2 flux is apparently a consequence of the increased CO2 solubility in tidal waters or of the increased sulfate reduction, as described in the literature (Borges et al., 2018; Chowdhury et al., 2018; Nóbrega et al., 2016). Fluctuations in redox potential altered the availability of the terminal electron acceptor and donor, and the forces of recovery of their concentrations in the soil, such that a disproportionate release of CO2 can result from the alternative anaerobic degradation processes such as sulfate and iron reduction (Chowdhury et al., 2018). The soil carbon flux in the mangrove area in the Amazon region was within the range of findings for other tropical mangrove areas (2.6 to 11.0 g CO2 m−2 d−1; Shiau and Chiu, 2020). However, the mean flux of 6.2 mmol CO2 m−2 h−1 recorded in this Amazonian mangrove was much higher than the mean efflux of 2.9 mmol CO2 m−2 h−1 recorded in 75 mangroves during low tide periods (Alongi, 2009).
An emission of 0.01 Tg CH4 yr−1, 0.6 g CH4 m−2 d−1 (Rosentreter et al., 2018a), or 26.7 mg CH4 m−2 h−1, has been reported for tropical latitudes (0 and 5∘). In our study, the monthly average of CH4 flux was higher at the low (7.3 ± 8.0 mg CH4 m−2 h−1) than at the high topography (0.9 ± 0.6 mg C m−2 h−1), resulting in 0.1 g CH4 m−2 d−1 or 0.5 Mg CH4 ha−1 yr−1 (Fig. 2). Therefore, the CH4-C fluxes from the mangrove soil in the Mojuim River estuary were much lower than expected. It is known that there is a microbial functional module for CH4 production and consumption (Xu et al., 2015) and diffusibility of CH4 (Sihi et al., 2018), and this module considers three key mechanisms: acetoclastic methanogenesis (acetate production), hydrogenotrophic methanogenesis (H2 and CO2 production), and aerobic methanotrophy (CH4 oxidation and O2 reduction). The average emission from the soil of 8.4 mmol CH4 m−2 d−1 was well below the fluxes recorded in the Bay of Bengal, with 18.4 mmol CH4 m−2 d−1 (Biswas et al., 2007). In the Amazonian mangrove studied, the mean annual carbon equivalent efflux was 429.6 mg CO2 eq. m−2 h−1. This value was very low compared to the projected erosion losses of 103.5 Tg CO2 eq. ha−1 yr−1 for the next century in tropical mangrove forests (Adame et al., 2021). These higher CO2 flux concomitantly with lower CH4 flux in this Amazonian estuary are probably a consequence of changes in the rainfall pattern already underway, where the dry season was wetter and the rainy season drier when compared to the climatological normal. The most recent estimate between latitude 0 to 23.5∘S shows an emission of 2.3 g CO2 m−2 d−1 (Rosentreter et al., 2018b). However, the efflux in the mangrove of the Mojuim River estuary was 6.7 g CO2 m−2 d−1. For the same latitudinal range, Rosentreter et al. (2018c) estimated an emission of 0.6 g CH4 m−2 d−1, and we found an efflux of 0.1 g CH4 m−2 d−1.
4.2 Drivers of greenhouse gas fluxes
Mangrove areas are periodically flooded, with a larger flood volume during the syzygy tides, especially in the rainy season. The hydrological condition of the soil is determined by the microtopography and can regulate the respiration of microorganisms (aerobic or anaerobic), being a decisive factor in controlling the CO2 efflux (Dai et al., 2012; Davidson et al., 2000; Ehrenfeld, 1995). No significant influence on CO2 flux was observed due to the low variation in high tide level throughout the year (0.19 m) (Fig. 2), although it was numerically higher at the high topography. However, tidal height and the rainy season resulted in a higher CO2 flux (rate high/low = 1.7) at the high topography (7.86 ± 0.04 g CO2 m−2 d−1) than at the low topography (4.73 ± 0.34 g CO2 m−2 d−1) (Fig. 2; Supplement S1). This result may be due to the root systems of most flood-tolerant plants remaining active when flooded (Angelov et al., 1996). Still, the high topography has longer flood-free periods, which only happens when the tides are syzygy or when the rains are torrential.
CO2 efflux was higher in the high topography than in the low topography in the rainy season (when soils are more subject to inundation), i.e., 39.8 % lower in the forest soil exposed to the atmosphere for less time. Measurements performed on mangrove forest soils showed an average flux of 2.87 mmol CO2 m−2 h−1 when the soil was exposed to the atmosphere (dry soil), while results on flooded mangrove forest soils showed an average emission of 2.06 mmol CO2 m−2 h−1 (Alongi, 2007, 2009), i.e., 28.2 % less than for the dry soil. This reflects the increased facility gases have for molecular diffusion than fluids, and the increased surface area available for aerobic respiration and chemical oxidation during air exposure (Chen et al., 2010). Some studies attribute this variation to the temperature of the soil when it is exposed to tropical air (Alongi, 2009), which increases the export of dissolved inorganic carbon (Maher et al., 2018). However, despite the lack of significant variation in soil temperature between topographies at each time of year (Fig. 4b), there was a positive correlation (Pearson = 0.15, p = 0.05) between CO2 efflux and soil temperature at the low topography.
Some studies show that CH4 efflux is a consequence of the seasonal temperature variation in mangrove forest under temperate/monsoon climates (Chauhan et al., 2015; Purvaja and Ramesh, 2001; Whalen, 2005). However, in our study, CH4 efflux was correlated with Ta (Pearson = −0.33, p<0.00) and RH (Pearson = 0.28, p = 0.01) only in the dry season and at the low topography. The results show that the physical parameters do not affect the fluxes in a standardized way, and their greater or lesser influence depends on the topography and seasonality.
A compilation of several studies showed that the total CH4 emissions from the soil in a mangrove ecosystem range from 0 to 23.68 mg C m−2 h−1 (Shiau and Chiu, 2020), and our study showed a range of −0.01 to 31.88 mg C m−2 h−1 (mean of 4.70 ± 5.00 mg C m−2 h−1). The monthly CH4 fluxes were generally higher at the low (0.232 ± 0.256 g CH4 m−2 d−1) than at the high (0.026 ± 0.018 g CH4 m−2 d−1) topography, especially during the rainy season when the tides were higher (Fig. 2). Only in the dry season was there a significantly higher production at the low than at the high topography (Fig. 2; Supplement S1). The low topography produced 0.0249 g C m−2 h−1 more to the atmosphere in the rainy season than in the dry season (Fig. 2), and a similar seasonal pattern was recorded in other studies (Cameron et al., 2021).
The mangrove soil in the Mojuim River estuary is rich in silt and clay (Table 1), which reduces sediment porosity and fosters the formation and maintenance of anoxic conditions (Dutta et al., 2013). In addition, the lack of oxygen in the flooded mangrove soil favors microbial processes such as denitrification, sulfate reduction, methanogenesis, and redox reactions (Alongi and Christoffersen, 1992). A significant amount of CH4 produced in wetlands is dissolved in the pore water due to high pressure, causing supersaturation, which allows CH4 to be released by diffusion from the sediment to the atmosphere and by boiling through the formation of bubbles.
Studies show that the CO2 flux tends to be lower with high soil saturation (Chanda et al., 2014; Kristensen et al., 2008). A total of 395 Mg C ha−1 was found at the soil surface (0.15 m) in the mangrove of the Mojuim River estuary, which was slightly higher than the 340 Mg C ha−1 found in other mangroves in the Amazon (Kauffman et al., 2018), however being significantly 1.8 times greater at the low topography (Table 2). The finer soil texture at the low topography (Table 1) reduces groundwater drainage which facilitates the accumulation of C in the soil (Schmidt et al., 2011).
4.3 Mangrove biomass
Only the species R. mangle and A. germinans were found in the floristic survey carried out, which is aligned with the results of other studies in the same region (Menezes et al., 2008). Thus, the variations found in the flux between the topographies in the Mojuim River estuary are not related to the mangrove forest structure, because there was no difference in the aboveground biomass. Since there was no difference in the species composition, the belowground biomass is not expected to differ either (Table 3).
Assuming that the amount of carbon stored is 42.0 % of the total biomass (Sahu and Kathiresan, 2019), the mangrove forest biomass of the Mojuim River estuary stores 127.9 and 138.9 Mg C ha−1 at the high and low topographies, respectively. This result is lower than the 507.8 Mg C ha−1 estimated for Brazilian mangroves (Hamilton and Friess, 2018), but is near the 103.7 Mg C ha−1 estimated for a mangrove at Guará's island (Salum et al., 2020), 108.4 Mg C ha−1 for the Bragantina region (Gardunho, 2017), and 132.3 Mg C ha−1 in French Guiana (Fromard et al., 1998). Thus, the biomass found in the Mojuim estuary does not differ from the biomass found in other Amazonian mangroves. The estimated primary production for tropical mangrove forests is 218 ± 72 Tg C yr−1 (Bouillon et al., 2008).
4.4 Biogeochemical parameters
During the seasonal and annual periods, CH4 efflux was not significantly correlated with chemical parameters (Table 4), similar as observed in another study (Chen et al., 2010). Flooded soils present reduced gas diffusion rates, which directly affects the physiological state and activity of microbes, by limiting the supply of the dominant electron acceptors (e.g., oxygen), and gases (e.g., CH4) (Blagodatsky and Smith, 2012). The importance of soil can be reflected in bacterial richness and diversity compared to pore spaces filled with water (Banerjee et al., 2016). On the other hand, increasing soil moisture provides the microorganisms with essential substrates such as ammonium, nitrate, and soluble organic carbon, and increases gas diffusion rates in the water (Blagodatsky and Smith, 2012). Biologically available nitrogen often limits marine productivity (Bertics et al., 2010), and thus can affect CO2 fluxes to the atmosphere. However, a mangrove fertilization experiment showed that CH4 emission rates were not affected by N addition (Kreuzwieser et al., 2003). A higher concentration of Cmic and Nmic in the dry period (Table 2), both in the high and low topographies, indicated that microorganisms are more active when the soil spends more time aerated in the dry period (Table 2), time when only the high tides produce anoxia in the mangrove soil mainly in the low topography. Under reduced oxygen conditions, in a laboratory-incubated mangrove soil, the addition of nitrogen resulted in a significant increase in the microbial metabolic quotient, showing no concomitant change in microbial respiration, which was explained by a decrease in microbial biomass (Craig et al., 2021).
The high OM concentration at the two topographic locations (Table 2), at the two seasons studied, and the respective negative correlation with CO2 flux (Table 5), confirm the importance of microbial activity in mangrove soils (Gao et al., 2020). Also, CH4 produced in flooded soils can be converted mainly to CO2 by the anaerobic oxidation of CH4 (Boetius et al., 2000; Milucka et al., 2015; Xu et al., 2015) which may contribute to the higher CO2 efflux in the Mojuim River estuary compared to other tropical mangroves (Rosentreter et al., 2018b). The belowground C stock is considered the largest C reservoir in a mangrove ecosystem, and it results from the low OM decomposition rate due to flooding (Marchand, 2017).
The higher water salinity influenced by the tidal movement in the dry season (Table 1) seems to result in a lower CH4 flux at the low topography (Dutta et al., 2013; Lekphet et al., 2005; Shiau and Chiu, 2020). High SO concentration in the marine sediments inhibits methane formation due to competition between SO reduction and methanogenic fermentation, as sulfate-reducing bacteria are more efficient at using hydrogen than methanotrophic bacteria (Abram and Nedwell, 1978; Kristjansson et al., 1982), a key factor fostering reduced CH4 emissions. At high SO concentrations, methanotrophic bacteria use CH4 as an energy source and oxidize it to CO2 (Coyne, 1999; Segarra et al., 2015), increasing the efflux of CO2 and reduced CH4 (Megonigal and Schlesinger, 2002; Roslev and King, 1996). This may explain the high CO2 and low CH4 efflux found throughout the year at the high and especially at the low topographies (Fig. 3).
Studies in coastal ecosystems in Taiwan have reported that methanotrophic bacteria can be sensitive to soil pH, and reported an optimal growth at pH ranging from 6.5 to 7.5 (Shiau et al., 2018). The higher soil acidity in the Mojuim River wetland (Table 1) may be inhibiting the activity of methanogenic bacteria by increasing the population of methanotrophic bacteria, which are efficient in CH4 consumption (Chen et al., 2010; Hegde et al., 2003; Shiau and Chiu, 2020). In addition, the pneumatophores present in R. mangle increase soil aeration and reduce CH4 emissions (Allen et al., 2011; He et al., 2019). Spatial differences (topography) in CH4 emissions in the soil can be attributed to substrate heterogeneity, salinity, and the abundance of methanogenic and methanotrophic bacteria (Gao et al., 2020). Increases in CH4 efflux with reduced salinity were found as a consequence of intense oxidation or reduced competition from the more energetically efficient SO and NO3−-reducing bacteria when compared to the methanogenic bacteria (Biswas et al., 2007). This fact can be observed in the CH4 efflux in the mangrove of the Mojuim River, because there was an increased CH4 production especially in the low topography in the rainy season (Fig. 3), when water salinity is reduced (Table 1) due to the increased precipitation. However, we did not find a correlation between CH4 efflux and salinity, as previously reported (Purvaja and Ramesh, 2001).
Seasonality was important for CH4 efflux but did not influence CO2 efflux. The differences in fluxes may be an effect of global climate changes on the terrestrial biogeochemistry at the plant–soil–atmosphere interface, as indicated by the deviation in precipitation values from the climatology normal, making it necessary to extend this study for more years. Using the factor of 23 to convert the global warming potential of CH4 to CO2 (IPCC, 2001), the CO2 equivalent emission was 35.4 Mg CO2 eq. ha−1 yr−1. Over a 100-year time period, a radiative forcing due to the continuous emission of 0.05 kg CH4 m−2 yr−1 found in this study would be offset if CO2 sequestration rates were 2.16 kg CO2 m−2 yr−1 (Neubauer and Megonigal, 2015).
Microtopography should be considered when determining the efflux of CO2 and CH4 in mangrove forests in an Amazon estuary. The low topography in the mangrove forest of Mojuim River had a higher concentration of organic carbon in the soil. However, it did not produce a higher CO2 efflux because it was negatively influenced by soil moisture, which was indifferent to CH4 efflux. OM, ratio, and Eh were critical in soil microbial activity, which resulted in a variation in CO2 flux during the year and seasonal periods. Thus, the physicochemical properties of the soil are important for CO2 flux, especially in the rainy season. Still, they did not influence CH4 fluxes.
The data used in this article belong to the doctoral thesis of Saul Castellón, within the Postgraduate Program in Environmental Sciences, at the Federal University of Pará. Access to these data can be requested from Saúl Edgardo Martínez Castellón (saulmarz22@gmail.com), who holds the set of all data used in this paper.
The supplement related to this article is available online at: https://doi.org/10.5194/bg-19-5483-2022-supplement.
SEMC and JHC designed the study and wrote the article with the help of JFB, MR, MdLR, and CN. JFB assisted in the field experiment. MR provided logistical support in field activities.
The contact author has declared that none of the authors has any competing interests.
Publisher's note: Copernicus Publications remains neutral with regard to jurisdictional claims in published maps and institutional affiliations.
This article is part of the special issue “Global change effects on terrestrial biogeochemistry at the plant–soil interface”. It is not associated with a conference.
The authors are grateful to the Program of Alliances for Education and Training of the Organization of the American States and to Coimbra Group of Brazilian Universities, for the financial support, as well as to Paulo Sarmento for the assistance at laboratory analysis, and to Maridalva Ribeiro and Lucivaldo da Silva for the fieldwork assistance. Furthermore, the authors would like to thank the Laboratory of Biogeochemical Cycles (Geosciences Institute, Federal University of Pará) for the equipment provided for this research.
This work has been financially supported by a doctoral thesis elaboration scholarship.
This paper was edited by Lucia Fuchslueger and reviewed by two anonymous referees.
Abram, J. W. and Nedwell, D. B.: Inhibition of methanogenesis by sulphate reducing bacteria competing for transferred hydrogen, Arch. Microbiol., 117, 89–92, https://doi.org/10.1007/BF00689356, 1978.
Adame, M. F., Connolly, R. M., Turschwell, M. P., Lovelock, C. E., Fatoyinbo, T., Lagomasino, D., Goldberg, L. A., Holdorf, J., Friess, D. A., Sasmito, S. D., Sanderman, J., Sievers, M., Buelow, C., Kauffman, J. B., Bryan-Brown, D., and Brown, C. J.: Future carbon emissions from global mangrove forest loss, Glob. Change Biol., 27, 2856–2866, https://doi.org/10.1111/gcb.15571, 2021.
Allen, D., Dalal, R. C., Rennenberg, H., and Schmidt, S.: Seasonal variation in nitrous oxide and methane emissions from subtropical estuary and coastal mangrove sediments, Australia, Plant Biol., 13, 126–133, https://doi.org/10.1111/j.1438-8677.2010.00331.x, 2011.
Almeida, R. F. de, Mikhael, J. E. R., Franco, F. O., Santana, L. M. F., and Wendling, B.: Measuring the labile and recalcitrant pools of carbon and nitrogen in forested and agricultural soils: A study under tropical conditions, Forests, 10, 544, https://doi.org/10.3390/f10070544, 2019.
Alongi, D. M.: The contribution of mangrove ecosystems to global carbon cycling and greenhouse gas emissions, in: Greenhouse gas and carbon balances in mangrove coastal ecosystems, edited by: Tateda, Y., Upstill-Goddard, R., Goreau, T., Alongi, D. M., Nose, A., Kristensen, E., and Wattayakorn, G., 1–10, Gendai Tosho, Kanagawa, Japan, ISBN: 978-4-906666-94-2, 2007.
Alongi, D. M.: The Energetics of Mangrove Forests, Springer Netherlands, Dordrecht, ISBN: 978-1-4020-4271-3, https://doi.org/10.1007/978-1-4020-4271-3, 2009.
Alongi, D. M. and Christoffersen, P.: Benthic infauna and organism-sediment relations in a shallow, tropical coastal area: influence of outwelled mangrove detritus and physical disturbance, Mar. Ecol. Prog. Ser., 81, 229–245, https://doi.org/10.3354/meps081229, 1992.
Alongi, D. M. and Mukhopadhyay, S. K.: Contribution of mangroves to coastal carbon cycling in low latitude seas, Agr. Forest Meteorol., 213, 266–272, https://doi.org/10.1016/j.agrformet.2014.10.005, 2015.
Angelov, M. N., Sung, S. J. S., Doong, R. Lou, Harms, W. R., Kormanik, P. P., and Black, C. C.: Long-and short-term flooding effects on survival and sink-source relationships of swamp-adapted tree species, Tree Physiol., 16, 477–484, https://doi.org/10.1093/treephys/16.5.477, 1996.
Banerjee, S., Helgason, B., Wang, L., Winsley, T., Ferrari, B. C., and Siciliano, S. D.: Legacy effects of soil moisture on microbial community structure and N2O emissions, Soil Biol. Biochem., 95, 40–50, https://doi.org/10.1016/j.soilbio.2015.12.004, 2016.
Barichivich, J., Gloor, E., Peylin, P., Brienen, R. J. W., Schöngart, J., Espinoza, J. C., and Pattnayak, K. C.: Recent intensification of Amazon flooding extremes driven by strengthened Walker circulation, Sci. Adv., 4, https://doi.org/10.1126/sciadv.aat8785, 2018.
Bastviken, D., Tranvik, L. J., Downing, J. A., Crill, P. M., and Enrich-Prast, A.: Freshwater Methane Emissions Offset the Continental Carbon Sink, Science, 331, 50–50, https://doi.org/10.1126/science.1196808, 2011.
Bauza, J. F., Morell, J. M., and Corredor, J. E.: Biogeochemistry of Nitrous Oxide Production in the Red Mangrove (Rhizophora mangle) Forest Sediments, Estuar. Coast. Shelf Sci., 55, 697–704, https://doi.org/10.1006/ECSS.2001.0913, 2002.
Bertics, V. J., Sohm, J. A., Treude, T., Chow, C. E. T., Capone, D. G., Fuhrman, J. A., and Ziebis, W.: Burrowing deeper into benthic nitrogen cycling: The impact of Bioturbation on nitrogen fixation coupled to sulfate reduction, Mar. Ecol. Prog. Ser., 409, 1–15, https://doi.org/10.3354/meps08639, 2010.
Biswas, H., Mukhopadhyay, S. K., Sen, S., and Jana, T. K.: Spatial and temporal patterns of methane dynamics in the tropical mangrove dominated estuary, NE coast of Bay of Bengal, India, J. Mar. Syst., 68, 55–64, https://doi.org/10.1016/j.jmarsys.2006.11.001, 2007.
Blagodatsky, S. and Smith, P.: Soil physics meets soil biology: Towards better mechanistic prediction of greenhouse gas emissions from soil, Soil Biol. Biochem., 47, 78–92, https://doi.org/10.1016/J.SOILBIO.2011.12.015, 2012.
Boetius, A., Ravenschlag, K., Schubert, C. J., Rickert, D., Widdel, F., Gleseke, A., Amann, R., Jørgensen, B. B., Witte, U., and Pfannkuche, O.: A marine microbial consortium apparently mediating anaerobic oxidation methane, Nature, 407, 623–626, https://doi.org/10.1038/35036572, 2000.
Borges, A. V., Abril, G., Darchambeau, F., Teodoru, C. R., Deborde, J., Vidal, L. O., Lambert, T., and Bouillon, S.: Divergent biophysical controls of aquatic CO2 and CH4 in the World's two largest rivers, Sci. Rep., 5, 1–10, https://doi.org/10.1038/srep15614, 2015.
Borges, A. V., Abril, G., and Bouillon, S.: Carbon dynamics and CO2 and CH4 outgassing in the Mekong delta, Biogeosciences, 15, 1093–1114, https://doi.org/10.5194/bg-15-1093-2018, 2018.
Bouillon, S., Borges, A. V., Castañeda-Moya, E., Diele, K., Dittmar, T., Duke, N. C., Kristensen, E., Lee, S. Y., Marchand, C., Middelburg, J. J., Rivera-Monroy, V. H., Smith, T. J., and Twilley, R. R.: Mangrove production and carbon sinks: A revision of global budget estimates, Global Biogeochem. Cy., 22, 1–12, https://doi.org/10.1029/2007GB003052, 2008.
Brookes, P. C., Landman, A., Pruden, G., and Jenkinson, D. S.: Chloroform fumigation and the release of soil nitrogen: A rapid direct extraction method to measure microbial biomass nitrogen in soil, Soil Biol. Biochem., 17, 837–842, https://doi.org/10.1016/0038-0717(85)90144-0, 1985.
Cameron, C., Hutley, L. B., Munksgaard, N. C., Phan, S., Aung, T., Thinn, T., Aye, W. M., and Lovelock, C. E.: Impact of an extreme monsoon on CO2 and CH4 fluxes from mangrove soils of the Ayeyarwady Delta, Myanmar, Sci. Total Environ., 760, 143422, https://doi.org/10.1016/j.scitotenv.2020.143422, 2021.
Castillo, J. A. A., Apan, A. A., Maraseni, T. N., and Salmo, S. G.: Soil greenhouse gas fluxes in tropical mangrove forests and in land uses on deforested mangrove lands, Catena, 159, 60–69, https://doi.org/10.1016/j.catena.2017.08.005, 2017.
Chanda, A., Akhand, A., Manna, S., Dutta, S., Das, I., Hazra, S., Rao, K. H., and Dadhwal, V. K.: Measuring daytime CO2 fluxes from the inter-tidal mangrove soils of Indian Sundarbans, Environ. Earth Sci., 72, 417–427, https://doi.org/10.1007/s12665-013-2962-2, 2014.
Chauhan, R., Datta, A., Ramanathan, A., and Adhya, T. K.: Factors influencing spatio-temporal variation of methane and nitrous oxide emission from a tropical mangrove of eastern coast of India, Atmos. Environ., 107, 95–106, https://doi.org/10.1016/j.atmosenv.2015.02.006, 2015.
Chen, G. C., Tam, N. F. Y., and Ye, Y.: Spatial and seasonal variations of atmospheric N2O and CO2 fluxes from a subtropical mangrove swamp and their relationships with soil characteristics, Soil Biol. Biochem., 48, 175–181, https://doi.org/10.1016/j.soilbio.2012.01.029, 2012.
Chen, G. C., Ulumuddin, Y. I., Pramudji, S., Chen, S. Y., Chen, B., Ye, Y., Ou, D. Y., Ma, Z. Y., Huang, H., and Wang, J. K.: Rich soil carbon and nitrogen but low atmospheric greenhouse gas fluxes from North Sulawesi mangrove swamps in Indonesia, Sci. Total Environ., 487, 91–96, https://doi.org/10.1016/j.scitotenv.2014.03.140, 2014.
Chen, G. C. C., Tam, N. F. Y. F. Y., and Ye, Y.: Summer fluxes of atmospheric greenhouse gases N2O, CH4 and CO2 from mangrove soil in South China, Sci. Total Environ., 408, 2761–2767, https://doi.org/10.1016/j.scitotenv.2010.03.007, 2010.
Chowdhury, T. R., Bramer, L., Hoyt, D. W., Kim, Y. M., Metz, T. O., McCue, L. A., Diefenderfer, H. L., Jansson, J. K., and Bailey, V.: Temporal dynamics of CO2 and CH4 loss potentials in response to rapid hydrological shifts in tidal freshwater wetland soils, Ecol. Eng., 114, 104–114, https://doi.org/10.1016/j.ecoleng.2017.06.041, 2018.
Chuang, P.-C., Young, M. B., Dale, A. W., Miller, L. G., Herrera-Silveira, J. A., and Paytan, A.: Methane and sulfate dynamics in sediments from mangrove-dominated tropical coastal lagoons, Yucatán, Mexico, Biogeosciences, 13, 2981–3001, https://doi.org/10.5194/bg-13-2981-2016, 2016.
Coyne, M.: Soil Microbiology: An Exploratory Approach, Delmar Publishers, New York, NY, USA, ISBN: 978-0-8273-8434-7, 1999.
Craig, H., Antwis, R. E., Cordero, I., Ashworth, D., Robinson, C. H., Osborne, T. Z., Bardgett, R. D., Rowntree, J. K., and Simpson, L. T.: Nitrogen addition alters composition, diversity, and functioning of microbial communities in mangrove soils: An incubation experiment, Soil Biol. Biochem., 153, 108076, https://doi.org/10.1016/j.soilbio.2020.108076, 2021.
Dai, Z., Trettin, C. C., Li, C., Li, H., Sun, G., and Amatya, D. M.: Effect of Assessment Scale on Spatial and Temporal Variations in CH4, CO2, and N2O Fluxes in a Forested Wetland, Water Air Soil Pollut., 223, 253–265, https://doi.org/10.1007/s11270-011-0855-0, 2012.
Davidson, E. A., Verchot, L. V., Cattanio, J. H., Ackerman, I. L., and Carvalho, J. E. M.: Effects of soil water content on soil respiration in forests and cattle pastures of eastern Amazonia, Biogeochemistry, 48, 53–69, https://doi.org/10.1023/a:1006204113917, 2000.
de Araujo, A. S. F. : Is the microwave irradiation a suitable method for measuring soil microbial biomass?, Rev. Environ. Sci. Biotechnol., 9, 317–321, https://doi.org/10.1007/s11157-010-9210-y, 2010.
Donato, D. C., Kauffman, J. B., Murdiyarso, D., Kurnianto, S., Stidham, M., and Kanninen, M.: Mangroves among the most carbon-rich forests in the tropics, Nat. Geosci., 4, 293–297, https://doi.org/10.1038/ngeo1123, 2011.
Dutta, M. K., Chowdhury, C., Jana, T. K., and Mukhopadhyay, S. K.: Dynamics and exchange fluxes of methane in the estuarine mangrove environment of the Sundarbans, NE coast of India, Atmos. Environ., 77, 631–639, https://doi.org/10.1016/j.atmosenv.2013.05.050, 2013.
Ehrenfeld, J. G.: Microsite differences in surface substrate characteristics in Chamaecyparis swamps of the New Jersey Pinelands, Wetlands, 15, 183–189, https://doi.org/10.1007/BF03160672, 1995.
El-Robrini, M., Alves, M. A. M. S., Souza Filho, P. W. M., El-Robrini M. H. S., Silva Júnior, O. G., and França, C. F.: Atlas de Erosão e Progradação da zona costeira do Estado do Pará – Região Amazônica: Áreas oceânica e estuarina, in: Atlas de Erosão e Progradação da Zona Costeira Brasileira, edited by: Muehe, D., 11–41, São Paulo, https://www.mma.gov.br/estruturas/ (last access: 25 February 2021), 2006.
EMBRAPA (EMPRESA BRASILEIRA DE PESQUISA AGROPECUÁRIA): Manual de métodos de análise de solo, 2ºed., Rio de Janeiro, Centro Nacional de Pesquisa de Solos, 212 pp., 1997.
EPA (U.S. Environmental Protection Agency): Inventory of U.S. Greenhouse Gas Emissions and Sinks: 1990–2015, https://www.epa.gov/sites/default/files/ (last access: 11 June 2021), 2017.
Fernandes, W. A. A. and Pimentel, M. A. da S.: Dinâmica da paisagem no entorno da RESEX marinha de São João da Ponta/PA: utilização de métricas e geoprocessamento, Caminhos Geogr., 20, 326–344, https://doi.org/10.14393/RCG207247140, 2019.
Ferreira, A. S., Camargo, F. A. O., and Vidor, C.: Utilização de microondas na avaliação da biomassa microbiana do solo, Rev. Bras. Ciência do Solo, 23, 991–996, https://doi.org/10.1590/S0100-06831999000400026, 1999.
Ferreira, S. da S.: Entre marés e mangues: paisagens territorializadas por pescadores da resex marinha de São João da Ponta (PA), Federal University of Pará, Ph.D. thesis, Federal University of Pará, Brazil, 132 pp., 2017.
França, C. F. de, Pimentel, M. A. D. S., and Neves, S. C. R.: Estrutura Paisagística De São João Da Ponta, Nordeste Do Pará, Geogr. Ensino Pesqui., 20, 130–142, https://doi.org/10.5902/2236499418331, 2016.
Frankignoulle, M.: Field measurements of air-sea CO2 exchange, Limnol. Oceanogr., 33, 313–322, 1988.
Friesen, S. D., Dunn, C., and Freeman, C.: Decomposition as a regulator of carbon accretion in mangroves: a review, Ecol. Eng., 114, 173–178, https://doi.org/10.1016/j.ecoleng.2017.06.069, 2018.
Fromard, F., Puig, H., Cadamuro, L., Marty, G., Betoulle, J. L., and Mougin, E.: Structure, above-ground biomass and dynamics of mangrove ecosystems: new data from French Guiana, Oecologia, 115, 39–53, https://doi.org/10.1007/s004420050489, 1998.
Gao, G. F., Zhang, X. M., Li, P. F., Simon, M., Shen, Z. J., Chen, J., Gao, C. H., and Zheng, H. L.: Examining Soil Carbon Gas (CO2, CH4) Emissions and the Effect on Functional Microbial Abundances in the Zhangjiang Estuary Mangrove Reserve, J. Coast. Res., 36, 54–62, https://doi.org/10.2112/JCOASTRES-D-18-00107.1, 2020.
Gardunho, D. C. L.: Estimativas de biomassa acima do solo da floresta de mangue na península de Ajuruteua, Bragança – PA, Ph.D. thesis, Federal University of Pará, Belém, Brazil, 130 pp., 2017.
Hamilton, S. E. and Friess, D. A.: Global carbon stocks and potential emissions due to mangrove deforestation from 2000 to 2012, Nat. Clim. Chang., 8, 240–244, https://doi.org/10.1038/s41558-018-0090-4, 2018.
He, Y., Guan, W., Xue, D., Liu, L., Peng, C., Liao, B., Hu, J., Zhu, Q., Yang, Y., Wang, X., Zhou, G., Wu, Z., and Chen, H.: Comparison of methane emissions among invasive and native mangrove species in Dongzhaigang, Hainan Island, Sci. Total Environ., 697, 133945, https://doi.org/10.1016/j.scitotenv.2019.133945, 2019.
Hegde, U., Chang, T.-C., and Yang, S.-S.: Methane and carbon dioxide emissions from Shan-Chu-Ku landfill site in northern Taiwan, Chemosphere, 52, 1275–1285, https://doi.org/10.1016/S0045-6535(03)00352-7, 2003.
Howard, J., Hoyt, S., Isensee, K., Telszewski, M., and Pidgeon, E.: Coastal Blue Carbon: Methods for Assessing Carbon Stocks and Emissions Factors in Mangroves, Tidal Salt Marshes, and Seagrasses, edited by: Howard, J., Hoyt, S., Isensee, K., Telszewski, M., and Pidgeon, E., International Union for Conservation of Nature, Arlington, Virginia, USA, http://www.cifor.org/publications/pdf_files/Books/BMurdiyarso1401.pdf (last access: 11 September 2019), 2014.
IPCC: Impacts, Adaptation and Vulnerability, Contribution of Working Group II to the Third Assessment Report of the Intergovernmental Panel on Climate Change, edited by: McCarthy, J. J., Canziani, O. F., Leary, N. A., Dokken, D. J. and White, K. S., University Press, Cambridge, UK, and New York, USA, p. 1032, ISBN 0-521-01500-6, 2001.
Islam, K. R. and Weil, R. R.: Microwave irradiation of soil for routine measurement of microbial biomass carbon, Biol. Fertil. Soils, 27, 408–416, https://doi.org/10.1007/s003740050451, 1998.
Kalembasa, S. J. and Jenkinson, D. S.: A comparative study of titrimetric and gavimetric methods for determination of organic carbon in soil, J. Sci. Food Agric., 24, 1085–1090, 1973.
Kauffman, B. J., Donato, D., and Adame, M. F.: Protocolo para la medición, monitoreo y reporte de la estructura, biomasa y reservas de carbono de los manglares, Bogor, Indonesia, https://doi.org/10.17528/cifor/004386, 2013.
Kauffman, J. B., Bernardino, A. F., Ferreira, T. O., Giovannoni, L. R., de O. Gomes, L. E., Romero, D. J., Jimenez, L. C. Z., and Ruiz, F.: Carbon stocks of mangroves and salt marshes of the Amazon region, Brazil, Biol. Lett., 14, 20180208, https://doi.org/10.1098/rsbl.2018.0208, 2018.
Kreuzwieser, J., Buchholz, J., and Rennenberg, H.: Emission of Methane and Nitrous Oxide by Australian Mangrove Ecosystems, Plant Biol., 5, 423–431, https://doi.org/10.1055/s-2003-42712, 2003.
Kristensen, E., Bouillon, S., Dittmar, T., and Marchand, C.: Organic carbon dynamics in mangrove ecosystems: A review, Aquat. Bot., 89, 201–219, https://doi.org/10.1016/J.AQUABOT.2007.12.005, 2008.
Kristjansson, J. K., Schönheit, P., and Thauer, R. K.: Different Ks values for hydrogen of methanogenic bacteria and sulfate reducing bacteria: An explanation for the apparent inhibition of methanogenesis by sulfate, Arch. Microbiol., 131, 278–282, https://doi.org/10.1007/BF00405893, 1982.
Lekphet, S., Nitisoravut, S., and Adsavakulchai, S.: Estimating methane emissions from mangrove area in Ranong Province, Thailand, Songklanakarin, J. Sci. Technol., 27, 153–163, 2005.
Maher, D. T., Call, M., Santos, I. R., and Sanders, C. J.: Beyond burial: Lateral exchange is a significant atmospheric carbon sink in mangrove forests, Biol. Lett., 14, 1–4, https://doi.org/10.1098/rsbl.2018.0200, 2018.
Mahesh, P., Sreenivas, G., Rao, P. V. N. N., Dadhwal, V. K., Sai Krishna, S. V. S. S., and Mallikarjun, K.: High-precision surface-level CO2 and CH4 using off-axis integrated cavity output spectroscopy (OA-ICOS) over Shadnagar, India, Int. J. Remote Sens., 36, 5754–5765, https://doi.org/10.1080/01431161.2015.1104744, 2015.
Marchand, C.: Soil carbon stocks and burial rates along a mangrove forest chronosequence (French Guiana), Forest Ecol. Manage., 384, 92–99, https://doi.org/10.1016/j.foreco.2016.10.030, 2017.
McEwing, K. R., Fisher, J. P., and Zona, D.: Environmental and vegetation controls on the spatial variability of CH4 emission from wet-sedge and tussock tundra ecosystems in the Arctic, Plant Soil, 388, 37–52, https://doi.org/10.1007/s11104-014-2377-1, 2015.
Megonigal, J. P. and Schlesinger, W. H.: Methane-limited methanotrophy in tidal freshwater swamps, Global Biogeochem. Cy., 16, 35-1–35-10, https://doi.org/10.1029/2001GB001594, 2002.
Menezes, M. P. M. de, Berger, U., and Mehlig, U.: Mangrove vegetation in Amazonia: a review of studies from the coast of Pará and Maranhão States , north Brazil, Acta Amaz., 38, 403–420, https://doi.org/10.1590/S0044-59672008000300004, 2008.
Milucka, J., Kirf, M., Lu, L., Krupke, A., Lam, P., Littmann, S., Kuypers, M. M. M., and Schubert, C. J.: Methane oxidation coupled to oxygenic photosynthesis in anoxic waters, ISME J., 9, 1991–2002, https://doi.org/10.1038/ismej.2015.12, 2015.
Monz, C. A., Reuss, D. E., and Elliott, E. T.: Soil microbial biomass carbon and nitrogen estimates using 2450 MHz microwave irradiation or chloroform fumigation followed by direct extraction, Agric. Ecosyst. Environ., 34, 55–63, https://doi.org/10.1016/0167-8809(91)90093-D, 1991.
Neubauer, S. C. and Megonigal, J. P.: Moving Beyond Global Warming Potentials to Quantify the Climatic Role of Ecosystems, Ecosystems, 18, 1000–1013, 2015.
Nóbrega, G. N., Ferreira, T. O., Siqueira Neto, M., Queiroz, H. M., Artur, A. G., Mendonça, E. D. S., Silva, E. D. O., and Otero, X. L.: Edaphic factors controlling summer (rainy season) greenhouse gas emissions (CO2 and CH4) from semiarid mangrove soils (NE-Brazil), Sci. Total Environ., 542, 685–693, https://doi.org/10.1016/j.scitotenv.2015.10.108, 2016.
Norman, J. M., Kucharik, C. J., Gower, S. T., Baldocchi, D. D., Crill, P. M., Rayment, M., Savage, K., and Striegl, R. G.: A comparison of six methods for measuring soil-surface carbon dioxide fluxes, J. Geophys. Res.-Atmos., 102, 28771–28777, https://doi.org/10.1029/97JD01440, 1997.
Peel, M. C., Finlayson, B. L., and McMahon, T. A.: Updated world map of the Köppen-Geiger climate classification, Hydrol. Earth Syst. Sci., 11, 1633–1644, https://doi.org/10.5194/hess-11-1633-2007, 2007.
Poffenbarger, H. J., Needelman, B. A., and Megonigal, J. P.: Salinity Influence on Methane Emissions from Tidal Marshes, Wetlands, 31, 831–842, https://doi.org/10.1007/s13157-011-0197-0, 2011.
Prost, M. T., Mendes, A. C., Faure, J. F., Berredo, J. F., Sales, M. E. ., Furtado, L. G., Santana, M. G., Silva, C. A., Nascimento, I., Gorayeb, I., Secco, M. F., and Luz, L.: Manguezais e estuários da costa paraense: exemplo de estudo multidisciplinar integrado (Marapanim e São Caetano de Odivelas), in: Ecossistemas Costeiros: Impactos e Gestão Ambiental, edited by: Prost, M. T. and Mendes, A., 25–52, FUNTEC and Paraense Museum “Emílio Goeldi,” Belém, Brazil, 2001.
Purvaja, R. and Ramesh, R.: Natural and Anthropogenic Methane Emission from Coastal Wetlands of South India, Environ. Manage., 27, 547–557, https://doi.org/10.1007/s002670010169, 2001.
Purvaja, R., Ramesh, R., and Frenzel, P.: Plant-mediated methane emission from an Indian mangrove, Glob. Chang. Biol., 10, 1825–1834, https://doi.org/10.1111/j.1365-2486.2004.00834.x, 2004.
Reeburgh, W. S.: Oceanic Methane Biogeochemistry, Chem. Rev., 2, 486–513, https://doi.org/10.1021/cr050362v, 2007.
Robertson, A. I., Alongi, D. M., and Boto, K. G.: Food chains and carbon fluxes, in Coastal and Estuarine Studies, edited by: Robertson, A. I. and Alongi, D. M., 293–326, American Geophysical Union, ISBN 0-8790-255-3, 1992.
Rocha, A. S.: Caracterização física do estuário do rio Mojuim em São Caetano de Odivelas – PA, Federal University of Pará, http://repositorio.ufpa.br/jspui/handle/2011/11390 (last access: 16 January 2019), 2015.
Rollnic, M., Costa, M. S., Medeiros, P. R. L., and Monteiro, S. M.: Tide Influence on Suspended Matter Transport in an Amazonian Estuary, J. Coast. Res., 85, 121–125, https://doi.org/10.2112/SI85-025.1, 2018.
Rosentreter, J. A., Maher, D. T., Erler, D. V., Murray, R. H., and Eyre, B. D.: Methane emissions partially offset “blue carbon” burial in mangroves, Sci. Adv., 4, 1–11, https://doi.org/10.1126/sciadv.aao4985, 2018a.
Rosentreter, J. A., Maher, D. . T., Erler, D. V. V., Murray, R., and Eyre, B. D. D.: Seasonal and temporal CO2 dynamics in three tropical mangrove creeks – A revision of global mangrove CO2 emissions, Geochim. Cosmochim. Acta, 222, 729–745, https://doi.org/10.1016/j.gca.2017.11.026, 2018b.
Roslev, P. and King, G. M.: Regulation of methane oxidation in a freshwater wetland by water table changes and anoxia, FEMS Microbiol. Ecol., 19, 105–115, https://doi.org/10.1111/j.1574-6941.1996.tb00203.x, 1996.
Sahu, S. K. and Kathiresan, K.: The age and species composition of mangrove forest directly influence the net primary productivity and carbon sequestration potential, Biocatal. Agric. Biotechnol., 20, 101235, https://doi.org/10.1016/j.bcab.2019.101235, 2019.
Salum, R. B., Souza-Filho, P. W. M., Simard, M., Silva, C. A., Fernandes, M. E. B., Cougo, M. F., do Nascimento, W., and Rogers, K.: Improving mangrove above-ground biomass estimates using LiDAR, Estuar. Coast. Shelf Sci., 236, 106585, https://doi.org/10.1016/j.ecss.2020.106585, 2020.
Schmidt, M. W. I., Torn, M. S., Abiven, S., Dittmar, T., Guggenberger, G., Janssens, I. A., Kleber, M., Kögel-Knabner, I., Lehmann, J., Manning, D. A. C., Nannipieri, P., Rasse, D. P., Weiner, S., and Trumbore, S. E.: Persistence of soil organic matter as an ecosystem property, Nature, 478, 49–56, https://doi.org/10.1038/nature10386, 2011.
Segarra, K. E. A., Schubotz, F., Samarkin, V., Yoshinaga, M. Y., Hinrichs, K. U., and Joye, S. B.: High rates of anaerobic methane oxidation in freshwater wetlands reduce potential atmospheric methane emissions, Nat. Commun., 6, 1–8, https://doi.org/10.1038/ncomms8477, 2015.
Shiau, Y.-J. and Chiu, C.-Y.: Biogeochemical Processes of C and N in the Soil of Mangrove Forest Ecosystems, Forests, 11, 492, https://doi.org/10.3390/f11050492, 2020.
Shiau, Y. J., Cai, Y., Lin, Y. Te, Jia, Z., and Chiu, C. Y.: Community Structure of Active Aerobic Methanotrophs in Red Mangrove (Kandelia obovata) Soils Under Different Frequency of Tides, Microb. Ecol., 75, 761–770, https://doi.org/10.1007/s00248-017-1080-1, 2018.
Sihi, D., Davidson, E. A., Chen, M., Savage, K. E., Richardson, A. D., Keenan, T. F., and Hollinger, D. Y.: Merging a mechanistic enzymatic model of soil heterotrophic respiration into an ecosystem model in two AmeriFlux sites of northeastern USA, Agr. Forest Meteorol., 252, 155–166, https://doi.org/10.1016/J.AGRFORMET.2018.01.026, 2018.
Souza Filho, P. W. M.: Costa de manguezais de macromaré da Amazônia: cenários morfológicos, mapeamento e quantificação de áreas usando dados de sensores remotos, Rev. Bras. Geofísica, 23, 427–435, https://doi.org/10.1590/S0102-261X2005000400006, 2005.
Sparling, G. P. and West, A. W.: A direct extraction method to estimate soil microbial C: calibration in situ using microbial respiration and 14C labelled cells, Soil Biol. Biochem., 20, 337–343, https://doi.org/10.1016/0038-0717(88)90014-4, 1988.
Sundqvist, E., Vestin, P., Crill, P., Persson, T., and Lindroth, A.: Short-term effects of thinning, clear-cutting and stump harvesting on methane exchange in a boreal forest, Biogeosciences, 11, 6095–6105, https://doi.org/10.5194/bg-11-6095-2014, 2014.
Valentim, M., Monteiro, S., and Rollnic, M.: The Influence of Seasonality on Haline Zones in An Amazonian Estuary, J. Coast. Res., 85, 76–80, https://doi.org/10.2112/SI85-016.1, 2018.
Valentine, D. L.: Emerging Topics in Marine Methane Biogeochemistry, Ann. Rev. Mar. Sci., 3, 147–171, https://doi.org/10.1146/annurev-marine-120709-142734, 2011.
Vance, E. D., Brookes, P. C., and Jenkinson, D. S.: An extraction method for measuring soil microbial biomass C, Soil Biol. Biochem., 19, 703–707, https://doi.org/10.1016/0038-0717(87)90052-6, 1987.
Verchot, L. V., Davidson, E. A., Cattânio, J. H., and Ackerman, I. L.: Land-use change and biogeochemical controls of methane fluxes in soils of eastern Amazonia, Ecosystems, 3, 41–56, https://doi.org/10.1007/s100210000009, 2000.
Wang, X., Zhong, S., Bian, X., and Yu, L.: Impact of 2015–2016 El Niño and 2017–2018 La Niña on PM2.5 concentrations across China, Atmos. Environ., 208, 61–73, https://doi.org/10.1016/J.ATMOSENV.2019.03.035, 2019.
Whalen, S. C.: Biogeochemistry of Methane Exchange between Natural Wetlands and the Atmosphere, Environ. Eng. Sci., 22, 73–94, https://doi.org/10.1089/ees.2005.22.73, 2005.
Xu, X., Elias, D. A., Graham, D. E., Phelps, T. J., Carroll, S. L., Wullschleger, S. D., and Thornton, P. E.: A microbial functional group-based module for simulating methane production and consumption: Application to an incubated permafrost soil, J. Geophys. Res.-Biogeo., 120, 1315–1333, https://doi.org/10.1002/2015JG002935, 2015.