the Creative Commons Attribution 4.0 License.
the Creative Commons Attribution 4.0 License.
 | 19 Dec 2022
Carbon emission and export from the Ket River, western Siberia
Artem G. Lim
Ivan V. Krickov
Sergey N. Vorobyev
Mikhail A. Korets
Sergey Kopysov
Liudmila S. Shirokova
Jan Karlsson
Oleg S. Pokrovsky
Despite recent progress in the understanding of the carbon (C) cycle of Siberian permafrost-affected rivers, spatial and seasonal dynamics of C export and emission from medium-sized rivers (50 000–300 000 km2 watershed area) remain poorly known. Here we studied one of the largest tributaries of the Ob River, the Ket River (watershed = 94 000 km2), which drains through pristine taiga forest of the boreal zone in the West Siberian Lowland (WSL). We combined continuous and discrete measurements of carbon dioxide (CO2) concentration using submersible CO2 sensor and floating chamber flux (FCO2), with methane (CH4), dissolved organic and inorganic C (DOC and DIC, respectively), particulate organic C and total bacterial concentrations over an 800 km transect of the Ket River main stem and its 26 tributaries during spring flood (May 2019) and 12 tributaries during summer baseflow (end of August–beginning of September 2019). The partial pressure of CO2 (pCO2) was lower and less variable in the main stem (2000 to 2500 µatm) compared to that in the tributaries (2000 to 5000 µatm). In the tributaries, the pCO2 was 40 % higher during baseflow compared to spring flood, whereas in the main stem, it did not vary significantly across the seasons. The methane concentration in the main stem and tributaries was a factor of 300 to 1900 (flood period) and 100 to 150 times lower than that of CO2 and ranged from 0.05 to 2.0 µmol L−1. The FCO2 ranged from 0.4 to 2.4 g C m−2 d−1 in the main channel and from 0.5 to 5.0 g C m−2 d−1 in the tributaries, being highest during August in the tributaries and weakly dependent on the season in the main channel. During summer baseflow, the DOC aromaticity, bacterial number, and needleleaf forest coverage of the watershed positively affected CO2 concentrations and fluxes. We hypothesize that relatively low spatial and seasonal variability in FCO2 of the Ket River is due to a flat homogeneous landscape (bogs and taiga forest) that results in long water residence times and stable input of allochthonous dissolved organic matter (DOM), which dominate the FCO2. The open water period (May to October) C emission from the fluvial network (main stem and tributaries) of the Ket River was estimated to 127 ± 11 Gg C yr−1, which is lower than the downstream dissolved and particulate C export during the same period. The estimated fluvial C emissions are highly conservative and contain uncertainties linked to ignoring hotspots and hot moments of emissions, notably in the floodplain zone. This stresses the need to improve the temporal resolution of FCO2 and water coverage across seasons and emphasizes the important role of WSL rivers in the release of CO2 into the atmosphere.
- Article
(3027 KB) - Full-text XML
- Companion paper
-
Supplement
(1745 KB) - BibTeX
- EndNote


Assessment of greenhouse gas (GHG) emission from rivers is crucially important for understanding the C cycle under various climate change scenarios (Campeau and del Giorgio, 2014; Chadburn et al., 2017; Tranvik et al., 2018; Vachon et al., 2020). Rivers receive terrestrial C and process and emit a significant share of this C during transit to the sea (Liu et al., 2022). Quantifications of riverine C emissions are sufficiently robust for relatively well-studied regions of the world such as the European and North American boreal zone (Dawson et al., 2004; Dinsmore et al., 2013; Wallin et al., 2013; Leith et al., 2015; Zolkos et al., 2019; Hutchins et al., 2020) or Arctic and subarctic rivers of Alaska (Striegl et al., 2012; Crawford et al., 2013; Stackpoole et al., 2017) but are subject to great uncertainty. Despite significant progress in assessing riverine pCO2 in previously underrepresented or ignored regions such as lotic systems of Asia (Ran et al., 2015, 2017) or South America (Almeida et al., 2017), these studies generally use a combination of pH and alkalinity (DIC) to calculate the pCO2 instead of direct in situ measurements, like the studies of global emissions (Raymond et al., 2013; Lauerwald et al., 2015). At the same time, there is a growing number of studies reporting directly measured riverine pCO2 – either discretely (Alin et al., 2011; Borges et al., 2015; Amaral et al., 2018, 2022; Leng et al., 2022), continuously at fixed sites (Crawford et al., 2016a; Schneider et al., 2020; Gómez-Gener et al., 2021a), or along the river flow (Abril et al., 2014; Crawford et al., 2016b, 2017; Borges et al., 2019). However, these studies are limited to tropical and temperate zones of the world and boreal regions of western Europe and North America, and thus further continuous and discrete measurements of CO2 concentrations and fluxes in rivers from underrepresented regions such as northern Eurasia, and in particular Siberia, are needed. The ongoing interest in Siberia comes from the fact that this region hosts large C stocks in soils and wetlands intersected by extensive river networks that deliver the majority of water and C to the Arctic Ocean (Feng et al., 2013).
A few works on Siberian fluvial systems dealt with small (Castro-Morales et al., 2022) and large (Denfeld et al., 2013; Vorobyev et al., 2021) rivers, but these were performed in eastern Siberia in the continuous permafrost zone. More progress has been achieved in quantification of downstream carbon export by permafrost-affected great Arctic rivers of Siberia (Lobbes et al., 2000; Raymond et al., 2007; Cooper et al., 2008; Semiletov et al., 2011; Feng et al., 2013; Griffin et al., 2018; Wild et al., 2019). However, spatial and seasonal features of C emission from tributaries of large Siberian rivers still remain poorly known. Existing data on western Siberia (Serikova et al., 2018; Karlsson et al., 2021) suggest that C (predominantly as CO2) emissions from rivers can vary largely over space and time. Such high variations do not allow reliable quantitative assessment of C emission and integration of these values into regional and global C models.
In order to better understand and constrain the magnitude of C emission from Siberian rivers, we studied the Ket River (watershed 94 000 km2), a typical tributary of the Ob River in western Siberia. The Ob River is the largest (in terms of watershed area) Siberian river and drains large pristine territories of taiga forest and bogs. The catchment of the Ob includes extensive regions of permafrost, but a major part of it (>80 %) is situated in the permafrost-free zone, of which very few data exist on riverine C emissions (Karlsson et al., 2021). The Ket River drains through dense southern taiga forest and abundant wetlands with almost no human activity, thus serving as a representative system for understanding C cycling in permafrost-free Siberian rivers. We followed, via a boat routing over the main stem and main tributaries of the river, the in situ CO2 concentrations combined with discrete sampling for dissolved CH4, dissolved organic carbon (DOC), dissolved inorganic carbon (DIC), total bacterial number and particulate organic matter. These measurements were complemented by regular floating chamber measurements of CO2 emission fluxes. We performed these observations during the two main open water seasons of the year – the peak of the spring flood and the end of the summer baseflow. Our first objective was to quantify the difference in C concentration and emission during two seasons for the main stem and the tributaries and to relate these differences to the main physicochemical parameters of the water column and physio-geographical parameters (land cover) of the river watersheds. Our second objective was to obtain the total C emission flux from the river watershed area and compare it to the downstream export yield of dissolved and particulate carbon.
2.1 The Ket River and its tributaries
The Ket River's main stem and its 26 tributaries sampled in this study include watersheds of distinct sizes (the catchment area ranged from 94 000 km2 at the Ket's mouth to 20 km2 of the smallest tributary) but rather similar lithology, climate and vegetation (Fig. 1, Table S1). Strahler's order of sampled rivers and streams ranges from 9 for the Ket at its mouth to 2 for the smallest stream. The poorly accessible Ket River basin is fully pristine (50 % forest, 40 % wetlands) and has almost no agricultural and forestry activity. The watershed of the Ket has a very low population density (0.27 persons per square kilometer) and lacks road infrastructure due to the absence of oil and gas development and production. In this regard, this river can serve as a model for medium-sized bog-forest rivers of the West Siberian Lowland (WSL), and results obtained from this watershed can be extrapolated to much larger territory, comprising about 1 million km2 of permafrost-free taiga forest and bog regions of the southern part of the WSL.
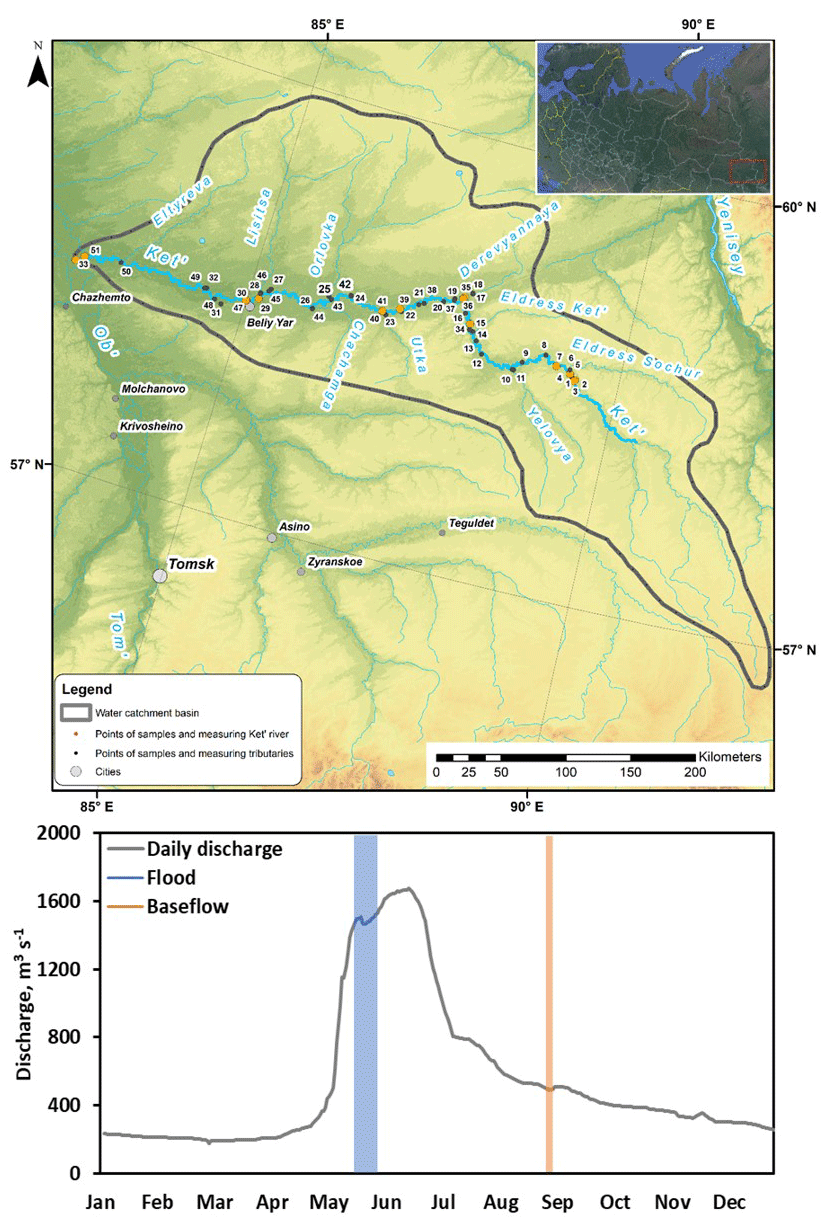
Figure 1(a) Map of the studied Ket River watershed with continuous pCO2 measurements in the main stem (credit map: Yu Kolesnichenko). (b) Daily discharge (Q) at the gauging station of the Ket mouth, Rodionovka, in 2019. Highlighted in blue and orange are two sampling campaigns of this study, spring flood and summer–fall baseflow.
The mean annual air temperature (MAAT) is −0.7 ± 0.1 ∘C, and the mean annual precipitation is 520 ± 20 mm yr−1 in the central part of the basin. The lithology of this part of the West Siberian Lowland is dominated by Pleistocene silts and sands with carbonate concretions overlayed by Quaternary deposits (loess, fluvial, glacial and lacustrine deposits). The dominant soils are podzols in forest areas and Histosols in peat bog regions. Further description of climate, lithology and landscape features of the territory is provided in former studies (Frey and Smith, 2007; Pokrovsky et al., 2015).
The peak of annual discharge in 2019 occurred at the end of May; in August, the discharge was 3 to 5 times smaller (Fig. 1). Note that low runoff, lack of relief and highly homogenous landscape coverage of the permafrost-free zone of western Siberia in general and of the Ket River basin in particular provide quite smooth hydrographs of the rivers. In this regard, the spring flood period is extended over 2 months, from the beginning of May to the middle of July, whereas summer baseflow includes the second half of July, August and September. As a result, similar to previous study of rivers along a 2500 km transect of the WSL territory, the timing of the two sampling campaigns covered approximately 80 % of the annual water discharge in the basins (Serikova et al., 2018). From 18 to 28 May 2019 and from 30 August to 2 September 2019, we started the boat trip in the middle course of the Ket River (Beliy Yar) and moved, first, 475 km upstream of the Ket River till its headwaters and then 834 km downstream till the river mouth, with an average speed of 20 km h−1. During summer baseflow, the 4 h trip was shortened by 200 km due to a too low water level in the upper reaches of the main stem and some small tributaries. We stopped every 30–50 km along the Ket River and sampled for major hydrochemical parameters, GHG, river suspended matter and total bacterial number of the main stem. We also moved several kilometers upstream of selected tributaries to record CO2 concentrations for at least 1 h and to sample for river hydrochemistry. On several occasions during spring flood, we monitored CO2 concentration and performed chamber measurements in the main stem and tributaries during both the daytime and nighttime periods.
2.2 CO2 and CH4 concentrations and CO2 fluxes by floating chambers
Surface water CO2 concentration was measured continuously in situ by deploying a portable infrared gas analyzer (IRGA, GMT222 CARBOCAP® probe, Vaisala®; accuracy ± 1.5 %) of two ranges (2000 and 10 000 ppm) as described in previous work by our group on the Lena River (Vorobyev et al., 2021). Sensor preparation was conducted in the lab following the method described by Johnson et al. (2009). The measurement unit (MI70, Vaisala®; accuracy ± 0.2 %) was connected to the sensor, allowing instantaneous readings of pCO2. The sensors were calibrated in the lab against standard gas mixtures (0, 800, 3000, 8000 ppm; linear regression with R2>0.99) before and after the field campaign. The sensors' drift was 0.03 %–0.06 % d−1, and the overall error was 4 %–8 % (relative standard deviation, RSD). Following calibration, post-measurement correction of the sensor output induced by changes in water temperature and barometric pressure was done by applying empirically derived coefficients following Johnson et al. (2009). These corrections never exceeded 5 % of the measured values. During the cruise, we routinely measured atmospheric CO2 with the probe as a check for its good functioning. Furthermore, we tested two different sensors at several sites of the river transect: a main probe used for continuous measurements and another probe used as a control and never employed for continuous measurements. We did not find any sizable (>10 %) difference in measured CO2 concentration between these two probes.
The probe was enclosed within a waterproof and gas-permeable membrane. For this, we used a protective expanded polytetrafluoroethylene (PTFE) sleeve that is highly permeable to CO2 but impermeable to water (Johnson et al., 2009). The sensor was placed in a tube which was submerged 0.5 m below the water surface. A Campbell logger was connected to the system, allowing continuous recording of the CO2 concentration, water temperature and pressure every minute. These readings were averaged over 10 min intervals yielding 732 individual pCO2, water temperature and pressure values. The CO2 concentrations in the Ket River tributaries included between 10 and 20 averaged pCO2 values for each tributary (250 measurements in total) during the spring flood period. In addition to continuous in situ CO2 measurements, we estimated pCO2 via measured pH and DIC values, using the set of constants typically applied for riverine pCO2 estimation in organic-rich waters (Cai and Wang, 1998; DelDuco and Xu, 2017). The U test (Mann–Whitney) demonstrated a lack of significant difference in CO2 concentrations measured by Vaissala and calculated from the pH and DIC of the river water.
Discrete CO2 fluxes were measured by using two floating CO2 chambers equipped with non-dispersive infrared SenseAir® CO2 loggers (Bastviken et al., 2015) at each of the seven (spring flood) and six (summer baseflow) sampling locations of the main stem and 26 tributaries following the procedures described elsewhere (Serikova et al., 2019; Krickov et al., 2021). The chambers were not anchored but slowly free-drifted together with the boat, because it is known that anchored chambers can artificially enhance fluxes due to turbulence, thus providing erroneous estimates (Lorke et al., 2015). The CO2 accumulation rate inside each chamber was recorded continuously at 300 s intervals. We used the first 0.5–1 h of measurements for computing the CO2 accumulation rate inside each chamber by linear regression.
For CH4 analyses, unfiltered water was sampled in 60 mL serum bottles. For this, the bottles and caps were manually submerged at approximately 30 cm depth from the water surface. The bottles were closed without air bubbles using vinyl stoppers and aluminum caps and immediately poisoned by adding 0.2 mL of saturated HgCl2 via a two-way needle system. The samples were stored for approximately 1 week in the refrigerator before the analyses. In the laboratory, a headspace was created by displacing approximately 40 % of water with N2 (99.999 %). Two 0.5 mL replicates of the equilibrated headspace were analyzed for their concentrations of CH4 using a Bruker GC-456 gas chromatograph (GC) equipped with flame ionization and thermal conductivity detectors (Serikova et al., 2019; Vorobyev et al., 2021). After every 10 samples, a calibration of the detectors was performed using Air Liquide gas standards (i.e., 145 ppmv). Duplicate injection of the samples showed that the results were reproducible within ± 5 %. The specific gas solubility for CH4 (Yamamoto et al., 1976) was used in calculation of the CH4 content in the water. We calculated instantaneous diffusive CH4 fluxes for each of the chambers using a chamber-specific gas transfer velocity (KT) and the concentrations of dissolved CH4 in the water and in air–water equilibrium (atm = 1.8 ppm) following the procedure outlined in Serikova et al. (2018), who used the same setup for measurements of GHG emissions from small- and medium-sized rivers of the WSL. Note that this setup does not allow measurement of the ebullitive CH4 fluxes, and thus it is possible that the evasion of CH4, especially in the stagnant zone of the river flow and floodplain in this study, is sizably underestimated (i.e., Spawn et al., 2015; Stanley et al., 2016; Villa et al., 2021).
2.3 Chemical analyses of the river water
The dissolved oxygen (CellOx 325; accuracy ± 5 %), specific conductivity (TetraCon 325; ± 1.5 %), and water temperature (± 0.2 ∘C) were measured in situ at 20 cm depth using a WTW 3320 Multimeter. The pH was measured using a portable Hanna instrument via a combined Schott glass electrode calibrated with standard buffer solutions (4.01, 6.86 and 9.18 at 25 ∘C), with an uncertainty of 0.01 pH units. The temperature of the buffer solutions was within ± 2 ∘C of that of the river water. The water was sampled in a pre-cleaned polypropylene bottle from 20 to 30 cm depth in the middle of the river and immediately filtered through disposable single-use sterile Sartorius filter units (0.45 µm pore size). The first 50 mL of the filtrate was discarded. The DOC and DIC were determined by a Shimadzu TOC-VSCN Analyzer (Kyoto, Japan) with an uncertainty of 3 % and a detection limit of 0.1 mg L−1. Blanks of MilliQ water passed through the filters demonstrated negligible release of DOC from the filter material. The specific ultraviolet absorbance (SUVA) was measured via ultraviolet absorbance at 254 nm using a 10 mm quartz cuvette on a Bruker CARY-50 UV-VIS spectrophotometer.
The concentration of C and N in suspended material (particulate organic carbon and nitrogen – POC and PON, respectively) was determined via filtration of 1 to 2 L of freshly collected river water (at the river bank or in the boat) with pre-weighted Whatman® glass microfiber filters (47 mm, 0.45 µm) and Nalgene 250 mL polystyrene filtration units using a Mityvac® manual vacuum pump. Particulate C and N were measured using catalytic combustion with Cu–O at 900 ∘C with an uncertainty of ≤ 0.5 % using a Thermo Flash 2000 CN Analyzer at EcoLab, Toulouse. The samples were analyzed before and after 1:1 HCl treatment to distinguish between total and inorganic C; however, the ratio of Corganic : Ccarbonate in the river-suspended matter (RSM) was always above 20, and the contribution of carbonate C to total C in the RSM was equal on average to 0.3 ± 0.3 % (2 SD, n=30).
Total microbial cell concentration was measured after sample fixation in glutaraldehyde by flow cytometry (Guava® EasyCyteTM systems, Merck). Cells were stained using 1 µL of a 10 times diluted SYBR GREEN solution (Merck) added to 250 µL of each sample before analysis. Particles were identified as cells based on green fluorescence and forward scatter (Marie et al., 2001).
2.4 Riverine carbon export flux by the Ket catchment
The C export flux over the active (unfrozen) period (May to October) from the Ket River basin was calculated based on monthly-averaged discharge at the river mouth in 2019 available from the Russian Hydrological Survey and DOC, DIC and POC concentrations measured in the low reaches of the Ket River in this study (see the hydrograph in Fig. 1). Riverine element fluxes should usually be estimated using a LOADEST method (Holmes et al., 2012) from calculated daily element loads. The latter was typically obtained from a calibration regression applied to daily discharge. This calibration regression can be constructed from time series of paired streamflow and measured element concentration data for a sufficient period of the year. In our previous works in this and other similar boreal regions, we demonstrated that this method provides reasonable (within 10 % to 30 %) agreement with monthly export fluxes calculated by multiplying mean monthly discharge by mean monthly concentration (Chupakov et al., 2020; Pokrovsky et al., 2022a; Vorobyev et al., 2019). Given that the intrinsic uncertainties in mean monthly discharge are also between 10 % and 20 % (see the discussion for the WSL rivers in Pokrovsky et al., 2020), in this study, for open water period export flux calculation, we used DOC, DIC and POC concentrations measured during spring flood (for the May and June periods) and baseflow (for the August, September and October periods). For the month of July, we used the mean concentrations of the end of May and August–September, which is in agreement with the seasonal discharge pattern of the Ket River. Note that the contribution of the non-studied October month to the total open water period water flux is <10 % and thus cannot provide sizable uncertainties.
2.5 Landscape parameters and water surface area of the Ket River basin
The physio-geographical characteristics of the 26 Ket tributaries and the seven points of the Ket main stem (Table S1, Fig. S1) were determined by applying available digital elevation model (DEM GMTED2010), soil, vegetation and lithological maps. The landscape parameters were typified using the TerraNorte Database of Land Cover of Russia (Bartalev et al., 2018). This included various types of forest (evergreen, deciduous, needleleaf/broadleaf), grassland, tundra, wetlands, water bodies and riparian zones. Note that the land cover data correspond to the whole catchment area upstream of the sampling point. The climate parameters of the watershed were obtained from CRU grid data (1950–2016) (Harris et al., 2014) and NCSCD data (Hugelius et al., 2013), respectively. The biomass was obtained from the BIOMASAR2 dataset in raster format with a spatial resolution of 1×1 km (Santoro et al., 2010). The soil OC content was taken from the Northern Circumpolar Soil Carbon Database (NCSCD). The original NCSCD dataset produced in GIS vector format corresponds to the 1:1 000 000 scale of the topographic map. It could be rasterized to 1×1 km pixel resolution. The lithology layer was taken from the GIS version of the Geological Map of the Russian Federation (scale 1:5 000 000, http://www.geolkarta.ru/, last access: 15 December 2022). We quantified river water surface area using the global SDG database with 30 m2 resolution (Pekel et al., 2016), including both seasonal and permanent water for the open water period of 2019 and for the multiannual average (reference period 2000–2004). We also used the more recent GRWL Mask Database which incorporates first-order temporary non-active streams (Allen and Pavelsky, 2018).
2.6 Data analysis
Carbon concentrations and fluxes for all the datasets were tested for normality using a Shapiro–Wilk test. In case the data were not normally distributed, we used nonparametric statistics. Comparisons of GHG parameters in the main stem and tributaries during two sampling seasons were conducted using a nonparametric Mann–Whitney test at a significance level of 0.05. For comparison of unpaired data, a nonparametric H-criterion Kruskal–Wallis test was used to reveal the differences between different study sites. The Pearson rank order correlation coefficient (p<0.05) was used to determine the relationship between CO2 concentrations and emission fluxes and the main landscape parameters of the Ket River tributaries as well as other potential drivers such as pH, O2, water temperature, specific conductivity, DOC, DIC, particulate carbon and nitrogen, and total bacterial number.
Further identification of C pattern drivers in river waters included a principal component analysis which allowed us to test the effect of various hydrochemical and landscape parameters on CO2 and CH4 concentrations and CO2 emissions. In addition to principal component analysis (PCA), a redundancy analysis (RDA) was used to extract and summarize the variation in the C pattern that can be explained by a set of explanatory variables (environmental, climatic and hydrochemical factors). The RDA combines a PCA and multiple regression analysis, and it was run in XLSTAT, statistical software that works as an add-on to Excel.
3.1 Greenhouse gases and dissolved and particulate C
The main hydrochemical parameters and greenhouse gas concentration and exchange fluxes of the Ket River and its tributaries are listed in Table 1, and primary data are provided in Table S2 of the Supplement. Continuous pCO2 measurements in the main stem during the spring (764 individual data points) over the full distance of the boat route (834 km) demonstrated a lack of systematic change in CO2 concentration from headwaters to the mouth. The CO2 concentration in tributaries was generally higher than that in the main stem. As a result, the pCO2 changed by a factor of 1.5 to 2 when tributaries with high CO2 concentrations join the main stem (Fig. 2a). There were strong but non-systematic variations in CO2 concentrations in the tributaries during the summer (Fig. 2c). The CH4 concentration (Table 1 and Figs. S2a, b) was low in the Ket River (around 0.17 and 0.86 µmol L−1 in May and August, respectively) and in the tributaries (range 0.09 to 2.6 µmol L−1, 2 to 3 times higher values during the baseflow). These values are generally higher than the range of CH4 concentration in large Siberian rivers such as the Lena (0.03 to 0.199 µmol L−1, Bussman, 2013; Vorobyev et al., 2021) but are consistent with concentrations in surface layers of eastern Siberian ponds (0.6–2.4 µmol L−1, Rehder et al., 2021). In the Ket River main stem and tributaries, the CH4 concentrations are 300–2000 and 100–150 times lower than those of CO2 during spring and summer, respectively, and ranged from 0.05 to 2.0 µmol L−1. Consequently, diffuse CH4 emissions (Table 1, Fig. S2c, d) constituted 0.1 % to 0.5 % of total C emissions and are not discussed in further detail.
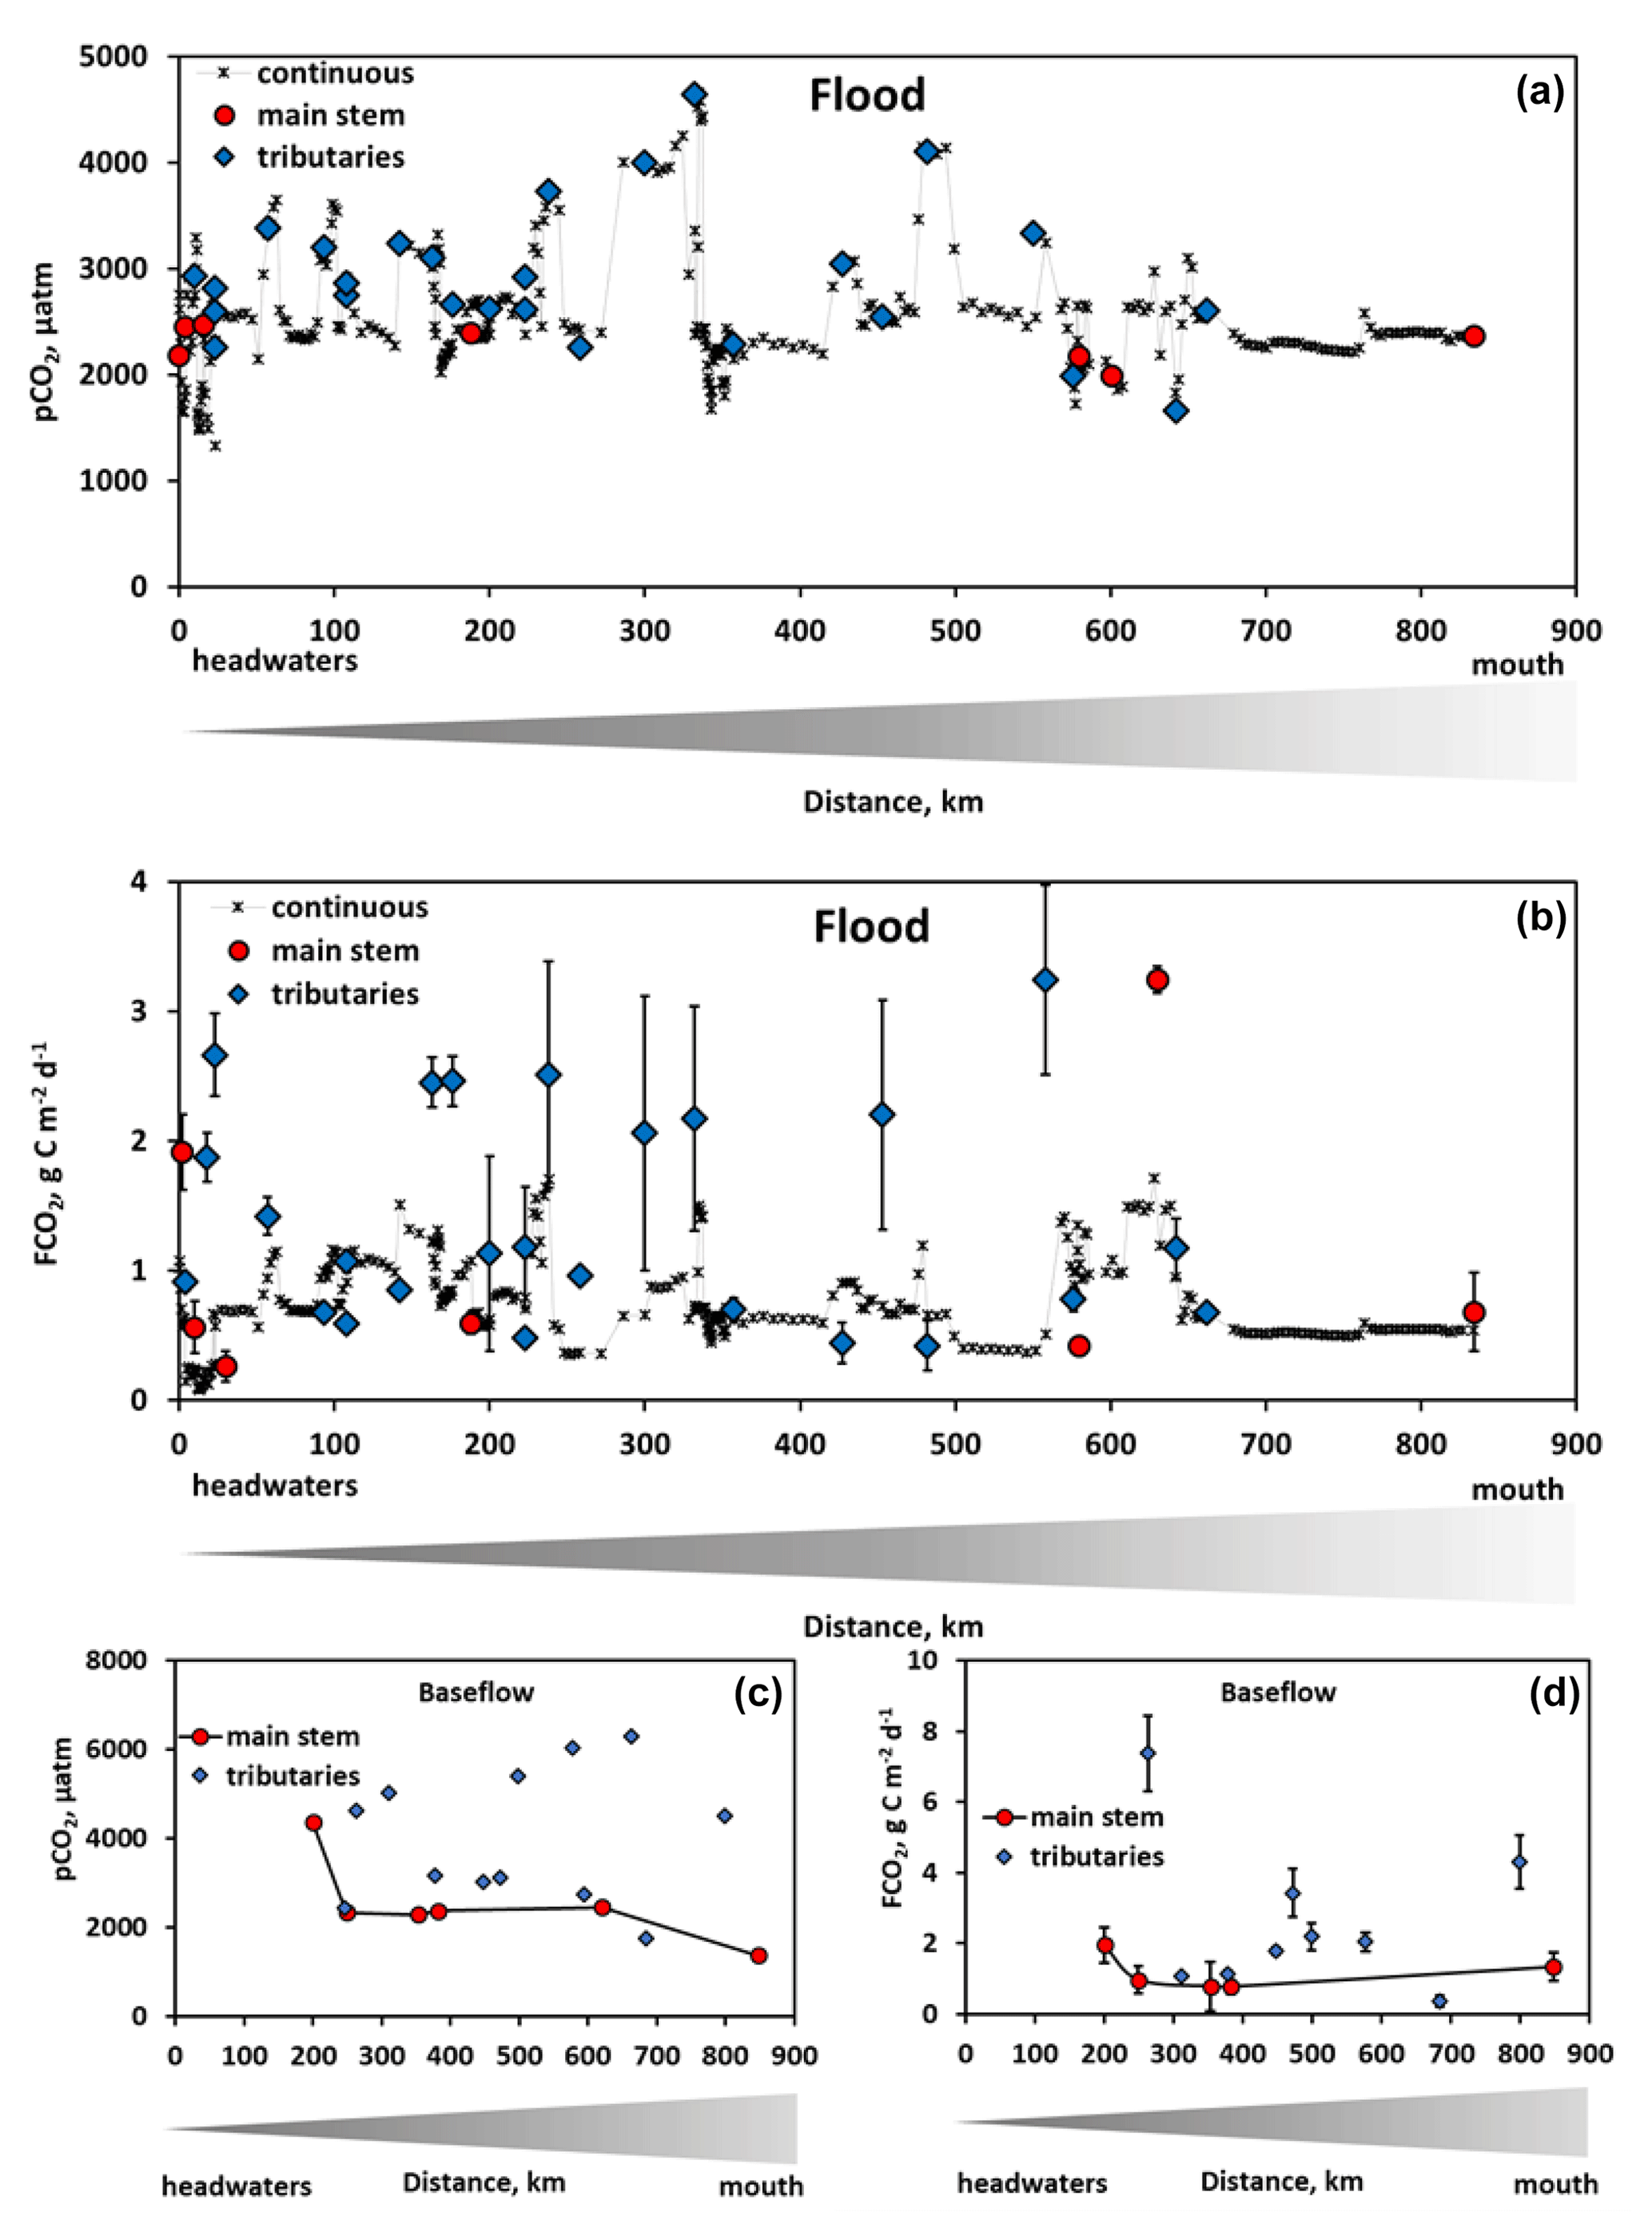
Figure 2The measured pCO2 (a, c) and CO2 fluxes (b, d) during spring flood (a, b) and summer baseflow (c, d) of the Ket River main stem and tributaries (over the 830 km distance, from the headwaters to the mouth – left to right). The symbols represent discrete in situ pCO2 (Vaissala) and FCO2 (floating chamber) measurements of the main stem (red circles) and tributaries (blue diamonds). Continuous in situ pCO2 measurements and calculated FCO2 are available only for the main stem in spring (black crosses). For the latter, we used an average value of measured gas transfer velocity (KT) between two chamber sites (separated by a distance of 50 to 100 km) to calculate the FCO2 from in situ measured pCO2 in the river section between these two sites. Note that, during summer baseflow, the water level did not allow the headwaters of the Ket River to be reached (first 0–200 km on the river course).
Table 1Measured hydrochemical and GHG exchange parameters in the Ket River main stem and tributaries (average ± SD; n is the number of measurements). The FCO2 and KT are chamber-measured CO2 flux and gas transfer velocity, respectively, whereas diffusive CH4 flux (FCH4) was calculated using a chamber-specific transfer coefficient.
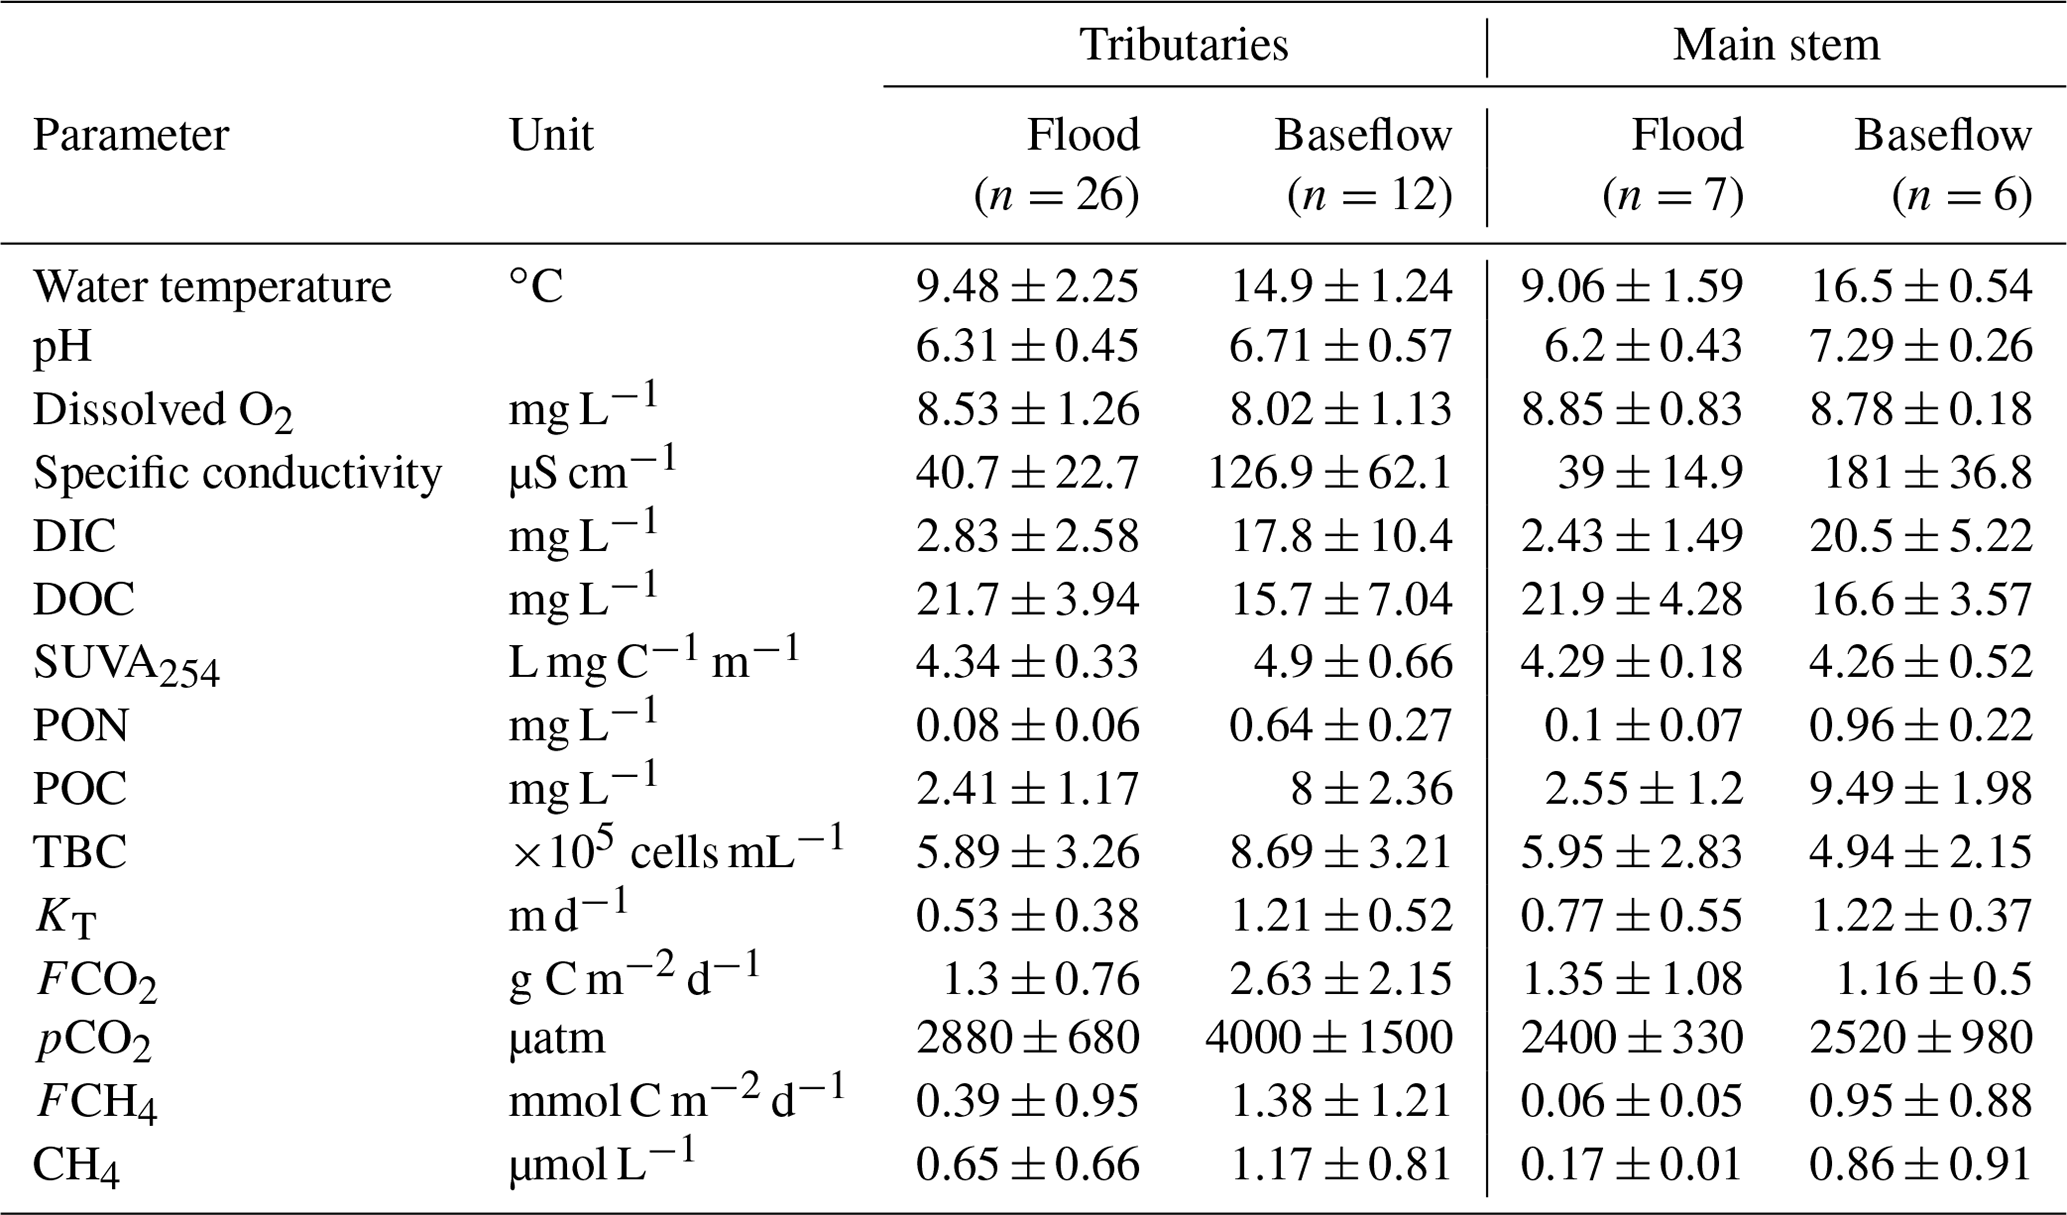
During spring flood, CO2 fluxes ranged from 0.26 to 3.2 g C m−2 d−1 in the main stem and tributaries (Table 1; Fig. 2b). During baseflow, the flux in the tributaries varied from 0.37 to 7.4 g C m−2 d−1 and was a factor of 2 to 3 higher than that in the main stem (Fig. 2d; Table 1). The CO2 concentration in the river water and the gas transfer velocity assessed from discrete measurements by floating chambers (KT=0.08–1.83 m d−1 in the main stem; 0.2–1.86 m d−1 in the tributaries, Table 1) allowed for calculation of the continuous CO2 fluxes (Fig. 2b). For this, we used an average value of KT measured between two chamber sites (separated by a distance of 50 to 100 km) to calculate the FCO2 from in situ measured pCO2 in the river section between these two sites.
The DIC concentration increased by 5 to 10 times between the spring (2.4 to 2.8 mg L−1) and summer baseflow (18 to 20 mg L−1), and the pH increased by 0.5–0.7 units between spring freshet and summer baseflow (Figs. 3 and S3a, b of the Supplement). The DOC concentration ranged from 18 to 25 mg L−1 during flood and from 15 to 18 mg L−1 during baseflow (Fig. 3). There were no systematic variations in DOC concentration over the 834 km of the main stem (20.7 ± 3.6 and 15.0 ± 1.4 mg L−1 in May and August, respectively); however, it was slightly higher and more variable in the tributaries (22.0 ± 4.0 and 16.5 ± 7.4 mg L−1, Fig. S3c, d). The SUVA254 remained highly stable throughout the seasons for both the tributaries and the main stem (range from 4.2 to 4.9 L mg C−1 m−1, Table 1). The POC was 3 times higher during baseflow compared to spring and ranged from 2 to 10 mg L−1 (Figs. 3 and S3e, f). The total bacterial number ranged from 5.0×10⁵ to 8.7×10⁵ cells mL−1 for the main stem and tributaries, without significant (p>0.05) seasonal variation (Figs. 3 and S3g, h).

Figure 3Mean (± SD) GHG concentration and chamber-measured fluxes (FCO2), hydrochemical parameters, particulate organic carbon and nitrogen (POC and PON, respectively) and total bacteria count (TBC) in the main channel (orange column) and the tributaries (blue column) of the Ket River in spring flood and summer (early fall) baseflow.
3.2 Diurnal and spatial variation in CO2 concentration and flux
The diel (day/night) measurements of CO2 concentrations have been performed on six tributaries of the Ket River during the spring flood period (Fig. 4). In two of them (the Sochur and Lopatka), we measured both CO2 concentration and CO2 fluxes via floating chambers. Continuous CO2 concentrations over 10–38 h exhibited a variation between 5 % and 25 % of the average value. Only in the case of a small tributary, the Segondenka (Fig. 4e), when we measured CO2 over 38 h, was there a local maximum in concentration between 18:00 and 19:00 during the first and second days of monitoring, without any significant link to the water temperature. The deviation of FCO2 from the average value over the period of observation in the two tributaries (Fig. 4a, b) did not exceed 20 %, without any detectable difference between the day and night periods.

Figure 4Continuous pCO2 concentration (a–f, blue circles) and chamber-based fluxes (a, b) measured during the spring flood period in tributaries (a Sochur No. 3, b Lopatka No. 8, c Derevyannaya No. 12, d Ob River entrance, e Segondenka No. 26) and in the Ket River main stem (middle course) near Stepanovka (f), including nighttime measurements (shaded area). The measurement frequency was one per hour. Variations in water temperature were within the range of 0.3 to 0.6 ∘C and did not exhibit significant correlations with pCO2 and FCO2. Note that, for the small river Segondenka (Swatershed=472 km2), where the CO2 peak was observed at 19:00 (e), there was quite heavy rainfall between 07:00 and 15:00.
The spatial variations in pCO2 and FCO2 were tested during springtime in the flood zone of the Ket River middle course, where the flood zone was connected to the main channel. Regardless of the distance from the main stem and the size of the water body, the variations in pCO2 and chamber-based fluxes were within 30 % of the values measured in the main stem. This suggests that the main stem parameters can be used for upscaling the C emissions to the overall flood plain during May, provided that the water bodies are connected to the rivers. Further tests of spatial variation were performed on selected small tributaries when we moved 8 to 16 km upstream towards the headwaters and monitored the CO2 concentration in the river water. There was no sizable trend in CO2 concentration over several kilometers of the tributary, consistent with small fluctuations over the 100 km scale of the main stem (Fig. S4a). Altogether, rather minor spatial and diel variations in both CO2 concentration and emission fluxes support the chosen sampling strategy and allow reliable extrapolation of the obtained results to the full surface of lotic waters of the Ket River basin during the open water period.
3.3 Impact of water chemistry and catchment characteristics on CO2 concentrations and emissions
There were generally no strong correlations between CO2 and CH4 and the main parameters of the water column – DOC, DIC, POC, total bacterial count (TBC) and SUVA (Table 2). The CO2 concentration negatively correlated with O2 concentration (, p<0.05) and FCO2 positively correlated with SUVA254 (R=0.34, p<0.05) in Fig. 5a, b. Other hydrochemical characteristics of the water column did not impact CO2 and CH4 concentration and CO2 flux. During spring flood, there was no positive correlation between FCO2 of the river water and various hydrochemical characteristics. During the summer baseflow, there were positive correlations between CO2 concentration or flux and SUVA and total bacterial number (Table 2).
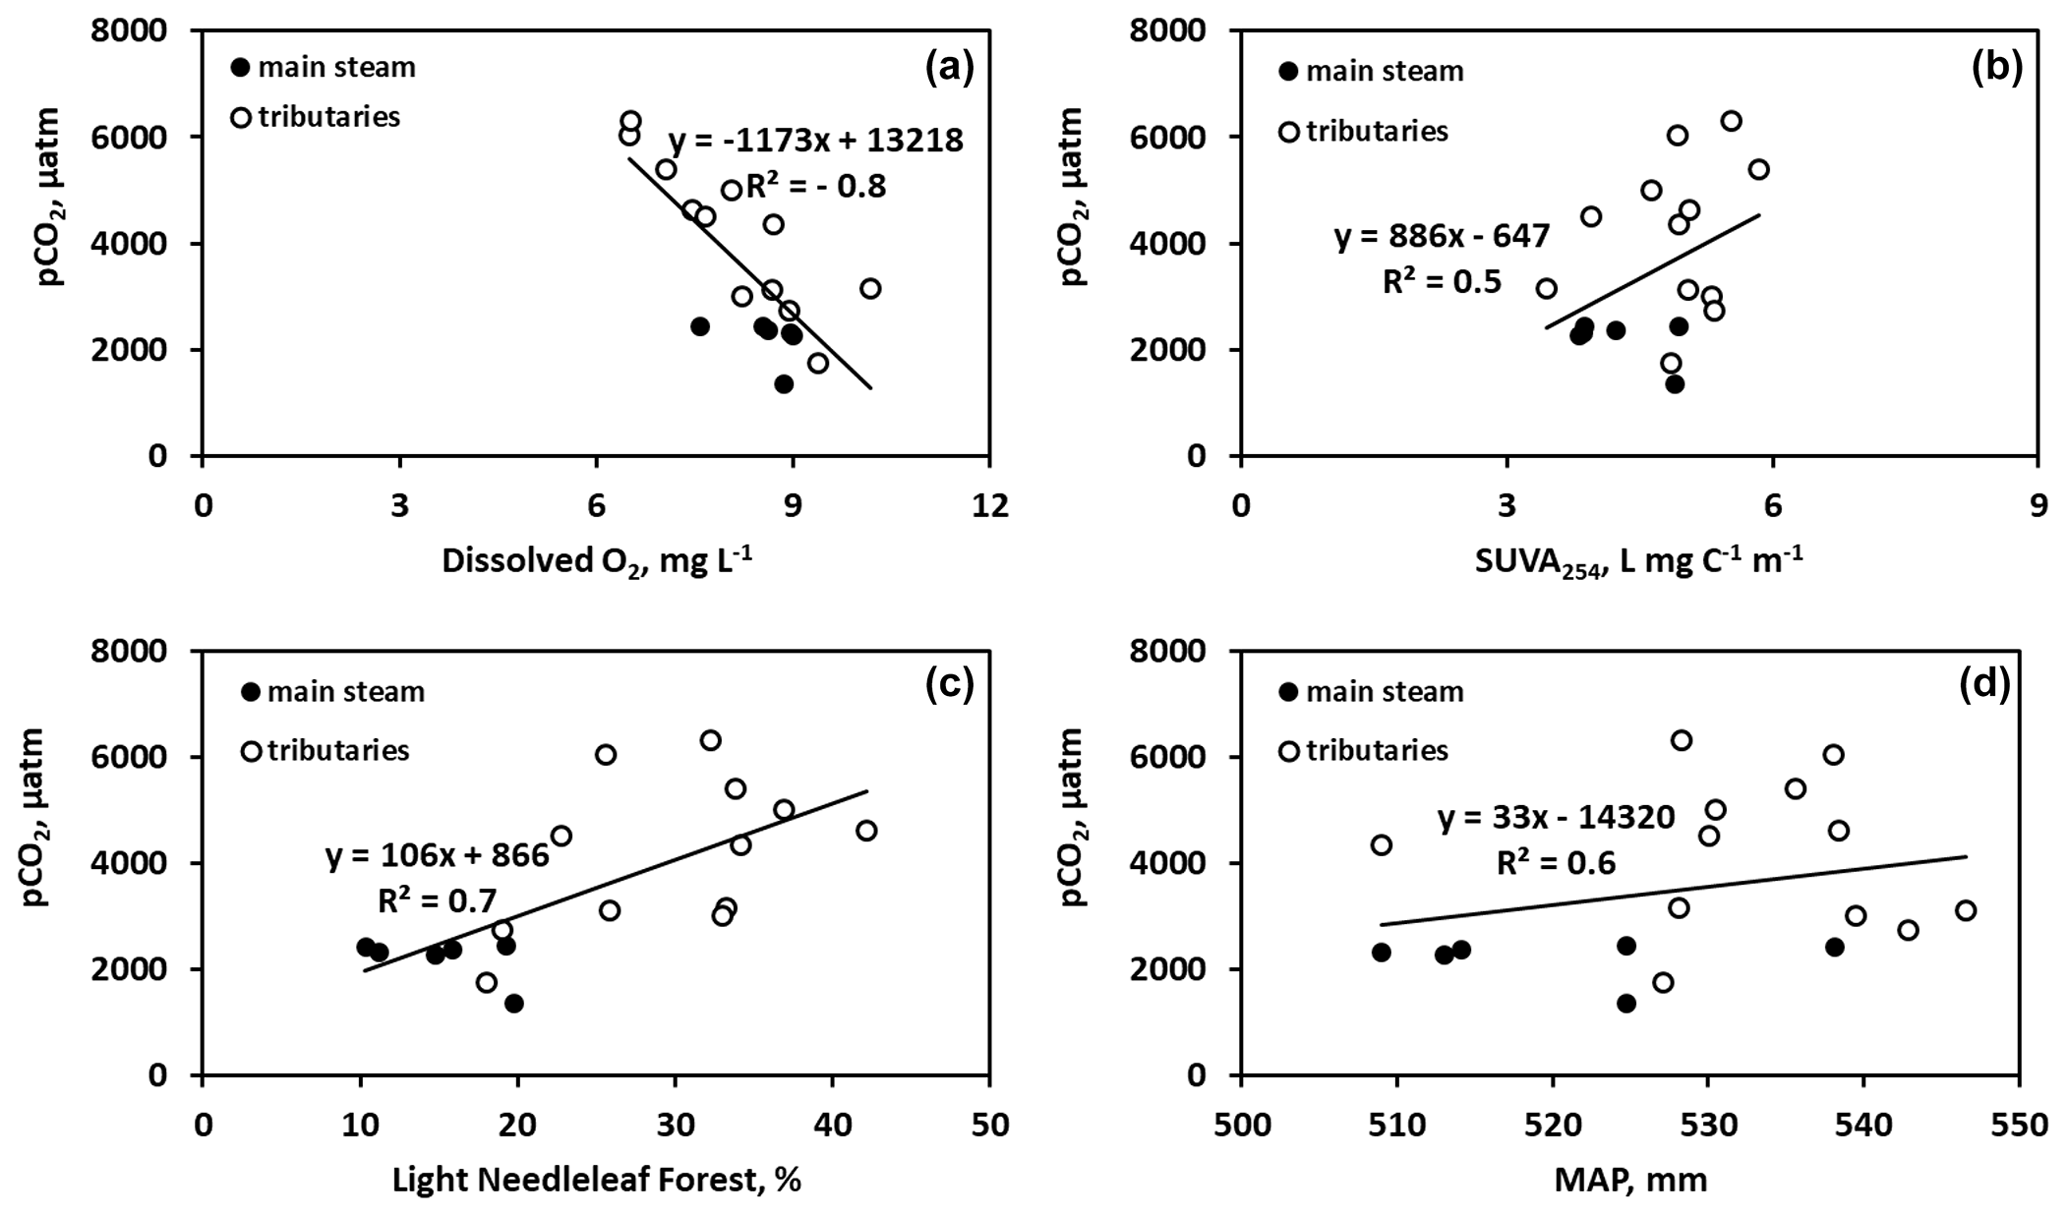
Figure 5Significant (p<0.05) control of dissolved oxygen (a), SUVA254 (b), light needleleaf forest (c), and mean annual precipitation (d) on CO2 concentration in the Ket River and tributaries during summer baseflow.
Table 2Pearson correlation coefficients of measured FCO2, CO2, and CH4 concentrations with hydrochemical parameters of the water column (DOC, SUVA, particulate organic carbon and nitrogen, total bacterial cells) and landscape parameters of the tributaries and the main stem of the Ket River. Significant (p<0.05) values are labeled with asterisks.
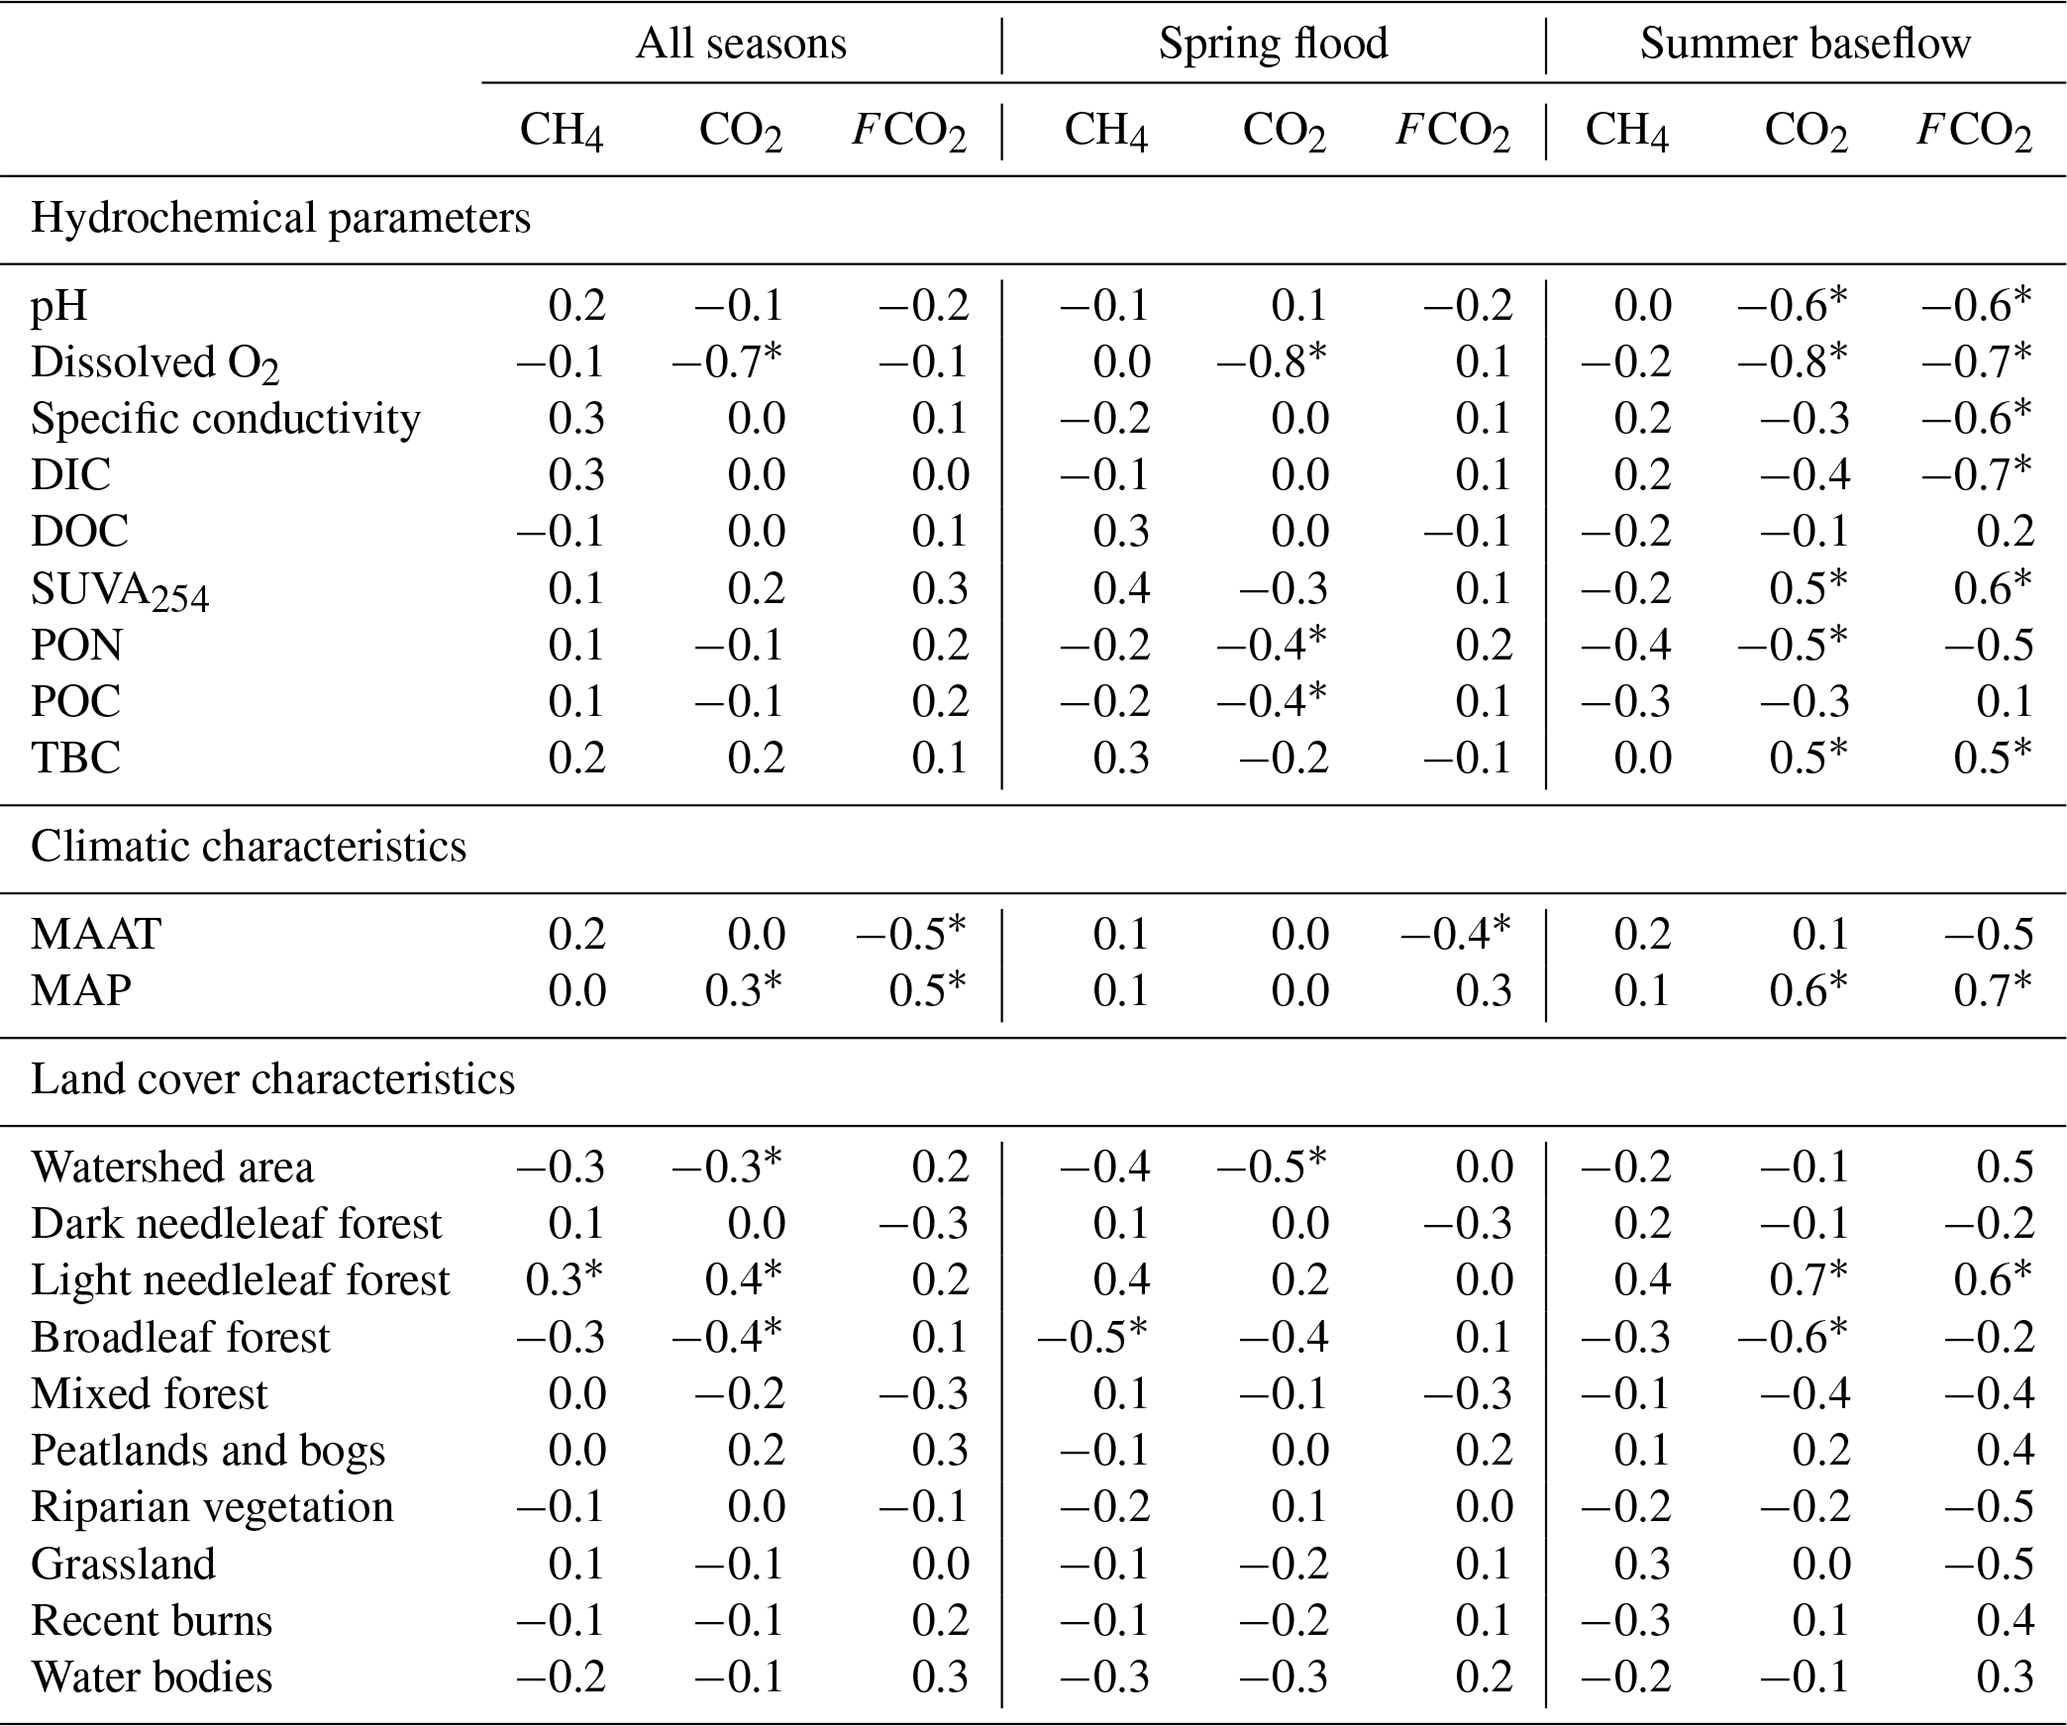
There was a decrease in pCO2 with an increase in the stream order (Fig. S5a), consistent with negative correlation between pCO2 and Swatershed during the spring (Table 2). However, neither FCO2 nor the gas transfer coefficient exhibited a significant link to the stream order (Fig. S5b, c) or the watershed surface area (Table 2). Among the different landscape factors, only deciduous light needleleaf forest (larch trees) exhibited significant (p<0.01) positive correlations () with the CO2 concentration and flux of the Ket River main stem and tributaries, detectable only during the summer baseflow period (Fig. 5c). The peatland and bogs at the watershed exhibited only weak although positive (0.2<RPearson<0.4) correlation with pCO2 and FCO2 (Table 2). The other potentially important landscape factors of the river watershed (type of forest, riparian and total aboveground vegetation, recent burns, water bodies) did not significantly impact the CO2 and CH4 concentration and measured CO2 fluxes in the Ket River basin (Table 2). The mean annual precipitation (MAP) at the watershed positively correlated with pCO2 and FCO2 during the baseflow (Fig. 5d).
PCA demonstrated a general lack of control of physicochemical parameters of the water column and watershed land cover on C emission patterns in the river waters. The PCA identified two factors that had a generally low ability to describe the variance (19 % and 7 %, respectively; Table S3 of the Supplement). None of the factors acted significantly on dissolved CO2, CH4 or CO2 flux in the river water. The RDA treatment did not provide additional insights into environmental control of the C pattern across the rivers and seasons. After normalization, the main result was that the analyses are not statistically significant (p>0.05).
3.4 Areal C emissions and export fluxes
The C emissions (>99.5 % CO2, <0.5 % CH4) from the lotic waters of the Ket River basin were assessed based on total river water coverage of the Ket watershed in 2019 (856 km2, of which 691 km2 is seasonal water, according to the Global SDG database). Given that the measurements were performed at the peak of the spring flood in 2019, we used the maximal water coverage of the Ket River basin to calculate the emissions during May and June and baseflow coverage for measurements during the July–October period.
For C emission calculation, we used the mean values of FCO2 of the main stem and the tributaries (1.31 ± 0.81 g C m−2 d−1 for spring flood; 2.11 ± 1.86 g C m−2 d−1 for summer–fall baseflow) which cover the full variability of both tributaries and the Ket River main channel (Table 1, Fig. 3). For the month of July, which was not sampled in this work and which represents a transition period between the flood and the baseflow, we used the mean value of May and August (1.55 g C m−2 d−1). For the 2 months of maximal water flow (May–June), the C emission from the whole Ket basin amounts to 68 ± 42 Gg. When summed up with the July (25 ± 20 Gg) and summer–fall baseflow period (August to October) emission (32 ± 28 Gg), the total open water season emission flux is 125 Gg. The uncertainty in the total emission over 6 months of the open water period is difficult to quantify, but it can be estimated as between 30 % and 50 %. This range covers both the uncertainty of the water coverage of the territory (i.e., Krickov et al., 2021) and the seasonal and spatial variations in CO2 emission in the Ket basin assessed in the present study.
Based on the yield calculations described in Sect. 2.4, the total annual (excluding the ice-covered period) riverine C export from the Ket River basin (Swatershed=94 000 km2) is 0.35 Tg (3.7 t C km yr−1), of which DOC, DIC and POC account for 56 %, 24 % and 20 %, respectively. Therefore, over the 6 months of the open water period, the C emissions from lotic waters of the Ket watershed constituted less than 30 % of the dissolved and particulate downstream export of carbon.
4.1 Temporal and spatial pattern of CO2 emissions from the river waters
The first important result of the present study is quite low spatial and seasonal variability in both CO2 concentration and emissions as well as in DOC concentration and aromaticity (reflected by SUVA254) in the main channel (Figs. 3, S3, Table 1). The variability in the tributaries was much larger, with differences in dissolved and gaseous C parameters between spring flood and summer–fall baseflow (Table S4a). While CO2 concentrations were different between tributaries and the main stem during both flood and baseflow, the CO2 flux was not different between the main stem and tributaries, regardless of season (Table S4b). This, together with lack of diel variations in CO2 concentrations and emissions during the spring period of maximal water coverage (Fig. 4), suggests a rather stable pattern of CO2 in the river water not linked to short-scale processes (primary productivity, photolysis, daily temperature variation). Indeed, negligible primary productivity in the water column may stem from low water temperatures (9.3 ∘C), a shallow photic layer of organic-rich waters (DOC of 22 mg L−1) and a lack of periphyton activity during high flow of the spring flood. Note that this finding contrasts with the recent results of high-frequency pCO2 measurements in temperate rivers that show a 30 % higher nocturnal emission compared to daytime observations due to the photosynthesis/respiration cycle (Gómez-Gener et al., 2021b). In the Ambolikha River of eastern Siberia, a small (Swatershed=121 km2) Arctic stream of the continuous permafrost zone, the diel CO2 cycle exhibited a moderate increase during the day, which was attributed to external lateral sources and photochemical oxidation of terrestrial DOC rather than in-stream metabolism (Castro-Morales et al., 2022). At the same time, several studies in tropical dissolved organic matter (DOM)-rich rivers such as the Congo (Borges et al. 2019) have not detected diel variations in CO2 because aquatic pelagic primary production was low (Descy et al., 2018) due to strong light attenuation in the water column by DOM.
Concerning the spatial variability of C concentrations and emissions during the spring flood, pCO2 did not demonstrate sizable variation along the main stem of the Ket River and some of its tributaries when moving from the mouth to the headwaters. The SUVA also remained highly stable along the river flow. This, together with a lack of FCO2 correlation with river watershed area during this period (Table 2) and the absence of a link between the stream's Strahler order and measured FCO2 and KT (Fig. S5b, c), suggests relatively modest control of headwater C cycling by “fresh” unprocessed organic matter from upland mire waters on CO2 emissions from the Ket River basin. Much stronger control of mire waters is reported in the boreal zone of northern Europe (Wallin et al., 2013, 2018). Furthermore, our results on the Ket River main stem and tributaries are in contrast to the general view of disproportional importance of headwater streams in overall CO2 emission from river basins (Li et al., 2021). Thus, across the United States fluvial system, the stream's Strahler order was shown to be an important driver of CO2 evasion from river water surfaces, with lower-order streams exhibiting the highest pCO2 and gas transfer velocity (Butman and Raymond, 2011). A likely explanation is relative low values of gas transfer velocity measured in the small streams of the Ket River basin in this study (0.2–2.0 m d−1, Table 1). Based on a hydraulic model of stream velocity and mean channel slope (Eq. 4 in Raymond et al., 2012), we calculated the gas transfer velocities in the studied rivers as a median of 1.02 and IQR from 0.27 to 1.52 m d−1, in very good agreement with chamber-measured values for the Ket River main stem and tributaries. Although these calculated values are also consistent with transfer coefficients for western Siberia calculated by Liu et al. (2022) based on reach slope and flow velocity (i.e., KT≤2 m d−1), they are typical of lakes rather than rivers (i.e., Kokic et al., 2015). We believe that low KT values for the Ket River basin stem from a low channel slope (0.2 to 0.7 m km−1) and flow rate (1–2 km h−1) and a strongly forested and wind-protected river bed without a distinct valley due to a generally flat orographic context of this part of the WSL (Serikova et al., 2018). Furthermore, due to the small size and short fetch of the Ket River and its tributaries (see the pictures of typical environments in Fig. S4b–d of the Supplement), the extended floodplain zone also contributes to low values of KT measured in the studied river basin. This is consistent with observations in other flooded regions, where a canopy of vegetation protects the water–air interface from wind stress, thus rendering the gas transfer velocity lower compared to open water such as a large river (i.e., Foster-Martinez and Variano, 2016; Ho et al., 2018; Abril and Borges, 2019). We therefore warn against the use of high values of transfer velocity, suitable for large Siberian rivers (i.e., Karlsson et al., 2021; Vorobyev et al., 2021), for assessing the emissions of medium- and small-sized sheltered streams with extensive riparian vegetation, another important aspect linked to C emissions from flooded forests (notably birch trees; see Fig. S4b) of the floodplain (e.g., Pangala et al., 2017) not investigated in this study.
4.2 Environmental factors possibly controlling CO2 concentration and emission patterns in the Ket River main stem and tributaries
Despite sizable variability of pCO2 in the tributaries, especially during the baseflow, there were no correlations between either pCO2 or FCO2 and the main hydrochemical parameters of the water column (Table 2). The only exception is O2 concentration, which negatively correlated with pCO2 during spring flood and both pCO2 and FCO2 during summer baseflow (Fig. 5a). This finding suggests the potential importance of a shallow suboxic riparian flooded zone, meadows and forest, as well as floodplain lakes in controlling CO2 buildup in the water column due to diffusion from sediments or decaying macrophytes, as was shown for the floodplain of the Ob River's middle course (Krickov et al., 2021). We believe that the main reasons for the remarkable stability in CO2 concentrations and emissions and weak environmental control on dissolved and gaseous patterns in the Ket River basin are (1) essentially homogeneous landscapes, lithology and Quaternary deposits of the whole river basin (20 %–25 % bogs, 60 %–70 % forest, 3 %–5 % riparian zone) and (2) strong dominance of allochthonous sources in both dissolved and particulate organic matter. Indeed, the SUVA and bacterial number (TBC) positively correlated with both pCO2 and FCO2 during summer (Fig. 5b; Table 2), which may indicate a non-negligible role of bacterial processing of allochthonous (aromatic) DOC delivered to the water column from wetlands and mires. As such, homogeneous land cover and essentially allochthonous DOC can still lead to variations in CO2 per stream size, with small systems showing higher values than large systems, as predicted conceptually (Hotchkiss et al., 2015) and verified at the basin scale (e.g., Borges et al., 2019). Consistent with this, we observed systematically higher CO2 concentration and flux in small tributaries (which were fed by mire waters with “non-processed” OM) compared to the main stem (Table 2). Furthermore, the positive correlation between mean annual precipitation (MAP) and pCO2 and FCO2 during the baseflow (Table 2, Fig. 5d) could reflect the importance of water storage in the mires and wetlands (which also showed positive but less significant correlations, Table 2) during the summertime and progressive release of CO2 and DOC-rich waters from the wetlands to the streams. Other indirect evidence of the mire water control on CO2 emission from the river comes from a daily CO2 pattern in a tributary of the Ket River (Fig. 4e). For this relatively small river (Swatershed=472 km2), we noted that there was quite heavy rainfall between 07:00 and 15:00 local time prior to the CO2 peak which was observed at 19:00. Given that water residence time is very short during spring flood, when the soils are partially frozen, the delivery of allochthonous DOM and elevated CO2 from adjacent mires could be the cause of the observed CO2 peak. Generally, the terrestrial source controlling the CO2 pattern in the Ket River could be either soil litter leachates (in spring) or bog water (during baseflow, when the river water is substantially derived from wetlands, Ala-aho et al., 2018a, b). Therefore, the patterns in CO2 emissions observed in the present study during summer baseflow suggest the importance of allochthonous organic matter from the peatland for CO2 production in the water column and in soils where the degradation of DOC is enhanced by the presence of bacteria. This is consistent with observations in other regions that, during summertime, numerous processes contribute to increasing CO2 in rivers such as higher temperature stimulating microbial metabolism, longer residence time and enhanced flowpaths of soil water (Borges et al., 2018).
A correlation between CO2 flux during baseflow and the proportion of deciduous needleleaf forest at the watershed (Fig. 5c) may suggest the importance of C cycling by larch trees and their possible control on the delivery of degradable organic matter to the river. Similar control of larch vegetation on riverine CO2 has been suggested for the Lena River, eastern Siberia (Vorobyev et al., 2021), although we acknowledge that further observations of contrasted Siberian watersheds are necessary to confirm the observation that larch tree litterfall led to export of degradable OM to the river.
In the Ket River basin, the local soil water/groundwater effects are expected to be more pronounced during baseflow, due to the lower impact of dilution, compared to the spring flood period. The hypothesis of a deeper flowpath in summer compared to spring is confirmed for the WSL (Frey and McClelland, 2009; Pokrovsky et al., 2015; Serikova et al., 2018) and is supported in this study by a strong increase in DIC concentration between spring and summer (Fig. 3). Thus, although the pairwise correlations between parameters do not support any particular mechanism, the possibility is not excluded that OM bio- and photo-degradation and local mire water feeding drive FCO2 in spring and that deeper flowpaths and DIC export drive the elevated FCO2 in summer. The latter is consistent with results of analysis of streams and rivers across the contiguous United States, which demonstrated that ∼ 60 % of CO2 evasion is from external sources rather than internal production (Hotchkiss et al., 2015). In view of the lack of a correlation of CO2 emissions in the Ket River and tributaries with hydrochemical parameters of the water column, we believe that the external source of CO2 in the studied river system represents a sizable contribution to total riverine CO2 evasion across the seasons and sampling sites. In particular, in small peatland streams, the CO2-rich deep peat/groundwater is known to be the major source of aquatic CO2 under low-flow conditions (Dinsmore and Billett, 2008), whereas in boreal headwater streams of northern Sweden the main source of stream CO2 was inflowing CO2-rich soil waters (Winterdahl et al., 2016).
Another important factor responsible for higher CO2 production in the water column in summer compared to spring could be POC degradation. The riverine POC is known to be much more biodegradable than DOC (Attermeyer et al., 2018), and the POC concentration in the Ket River basin increased 4-fold between spring and summer (Table 1). The origin of summertime POC and its lability remain elusive but could be a combination of plankton bloom and mire- or forest-derived DOC coagulation products in the water column (Krickov et al., 2018). Furthermore, pronounced heterogeneity in CO2 emission during baseflow among tributaries may also reflect the heterogeneity of riverine organic matter, which is known to be maximal during low-flow conditions and minimal during high flow (Lynch et al., 2019).
The main unexpected result of this study is that none of the physiochemical parameters of the water column and the land cover factor is sufficiently strong to drive the CO2 and CH4 patterns, although they show pronounced spatial and seasonal variations. Although correlations do not necessarily imply causation and some correlations could be spurious or indirect, this analysis, together with the PCA treatment, allows first-order assessment of possible governing factors or dismissal of the environmental parameters that do not contribute to GHG pattern control. A likely explanation is that simultaneous operations of multiple aquatic processes that include carbon, oxygen, nutrient, and plankton and periphyton dynamics as well as sediment respiration control the CO2 and CH4 exchanges with the atmosphere, as is known for boreal lakes and floodplain zones of the boreal rivers (i.e., Bayer et al., 2019; Zabelina et al., 2021; Krickov et al., 2019). Given that even a multiparametric statistical treatment (PCA) did not demonstrate a sizable explanation capacity of the dataset, we cannot exclude the possibility that these potential physicochemical, microbiological and landscape drivers are working in different (opposing) directions and have counteracted each other. However, further in-depth analysis of these interactions requires much better seasonal resolution, ideally over the full period of the year, which was beyond the scope of the present study.
4.3 Emissions from the Ket River basin compared to downstream export of riverine carbon
The estimated C emissions (>99.5 % C; <0.5 % CH4) from the Ket River main channel over an 830 km distance (0.5 to 2.5 g C m−2 d−1) are comparable to those of the Ob River main channel (1.32 ± 0.14 g C m−2 d−1 in the permafrost-free zone; Karlsson et al., 2021). The CO2 emissions in the Ket's tributaries (1 to 2 g C m−2 d−1 in spring; 1 to 5 g C m−2 d−1 in summer) are within the range reported for small rivers and streams of the permafrost-free zone of western Siberia (0 to 3.6 g C m−2 d−1 in spring; 4 to 9 g C m−2 d−1 in summer; Serikova et al., 2018), forest and wetland headwater streams of northern Sweden (0.5 to 5 g C m−2 d−1; Gómez-Gener et al., 2021a), and boreal streams in Canada and Alaska (0.8 to 5.2 g C m−2 d−1, Koprivnjak et al., 2010; Teodoru et al., 2009; Crawford et al., 2013; Campeau et al., 2014). Total C emissions from the water surfaces of the Ket River basin assessed in this study (148 g C-CO2 m yr−1, assuming no emission under ice), when normalized to the Ket River basin area (Swatershed=94 000 km2), amount to 1.35 g C m yr−1. Generally higher land-area-specific emissions, comparable to or exceeding those of the Ket River, were reported in Québec (1.0 to 4.6 g C m−2 yr−1; Campeau and del Giorgio, 2014; Hutchins et al., 2019; Teodoru et al., 2009), Sweden (1.6 to 8.6 g C m−2 yr−1; Humborg et al., 2010; Jonsson et al., 2007; Lundin et al., 2013; Wallin et al., 2011, 2018) and boreal portions of the Yukon River (7 to 9 g C m−2 yr−1; Striegl et al., 2012; Stackpoole et al., 2017). Possible reasons for these differences could be the different areal coverage of the territory by river network, the calculated rather than measured CO2 fluxes, or the higher gas transfer velocity in the rivers from mountainous regions.
The regional assessments of the Ket River basin performed in this study are based on direct chamber measurements of emissions and as such provide a rigorous basis for upscaling the CO2 emissions from currently understudied lotic waters of the permafrost-free zone of western Siberia. The C evasion from the fluvial network of the Ket River assessed in the present work (127 ± 11 Gg yr−1, ignoring the emission during the ice breakup in early spring) is 3 times lower than the total (DOC + DIC + POC) downstream export by this river from the same territory (0.35 Tg C yr−1). The riverine C yield for the Ket River (3.7 t C km yr−1) is in agreement with the regional C (DOC + DIC) yield by permafrost-free small- and medium-sized rivers of the WSL (3 to 4 t C km yr−1, Pokrovsky et al., 2020) and with the Ob River in the permafrost-free zone (3.6 t C km yr−1, Vorobyev et al., 2019). Note that the latter study of the Ob River, which is very similar in the environmental context to the Ket River, included high-frequency weekly sampling over several years of monitoring. Thus, the similarity of downstream export fluxes of the Ket and Ob rivers supports the validity of approaches for sampling and C yield calculation employed in the present study. Such high C yields in the southern, permafrost-free part of the WSL stem from essentially inorganic carbon originating from groundwater discharge of carbonate mineral-rich reservoirs abundant in this region (Pokrovsky et al., 2015). At the same time, the organic C yield in rivers of this region is quite low and represents less than 20 % of the total C yield (Pokrovsky et al., 2020; Vorobyev et al., 2019). This can explain the anomalously low value of C evasion : C export of the Ket River (1 : 3) measured in this work as compared to the average values for the permafrost-free zone of western Siberia (1 : 1, Serikova et al., 2019). Another factor potentially leading to underestimation of C evasion in this study is GIS-based minimal water coverage, which does not include seasonal oxbow lakes, flooded forest and temporary water bodies of the floodplain which provide sizable emissions (see Krickov et al., 2021). We also do not exclude the possibility that some important hot moments/hotspots of C emission were missed in our sampling campaign, such as summer baseflow/fall peaks (Serikova et al., 2019) or stagnant zones of the floodplain in summer (Krickov et al., 2021; Castro-Morales et al., 2021). This shows a need for higher spatial and temporal resolution monitoring of C emission, with a special focus on important events across the full hydrological continuum.
Via a combination of a discrete floating chamber and hydrochemistry and continuous CO2 concentration measurements over 830 km of a large pristine boreal river of the western Siberian main channel and its 26 tributaries during the peak of spring flood and summer–fall baseflow, we quantified spatial and temporal variations, overall emissions of C (CO2, CH4) and export of DOC, DIC and POC during the 6 months of the open water period. The range of CO2 and CH4 concentrations in the main channel and tributaries as well as CO2 emissions were consistent with other boreal and subarctic regions but demonstrated rather low seasonal and spatial variability. The diel CO2 flux by floating chambers and continuous pCO2 measurements in the tributaries of the Ket River during spring flood demonstrated negligible impact of the day/night period on the CO2 concentrations and emission fluxes.
We hypothesize that homogeneous landscape coverage (bog and taiga forest) provides stable allochthonous input of DOM, as confirmed by very weak spatial and seasonal variations in DOM aromaticity. Among possible driving factors of CO2 production in the water column (bio- and photo-degradation of DOC and POC, plankton metabolism), none seems to be sizably important for persistent CO2 supersaturation and relevant emissions. The landscape factors of the watershed (bog and forest coverage, soil organic carbon stock) of the tributaries and along the main stem did not sizably affect the C concentration and emission pattern across the two seasons. We hypothesize that stable terrestrial input of the strongly aromatic DOM, shallow photic layer and humic waters of the Ket River basin preclude sizable daily and seasonal variations in C parameters. Punctual discharge of groundwater, resuspension of sediments or shallow subsurface influx from mires and the riparian zone may be responsible for small-scale heterogeneities in C emissions and concentrations along the main stem and among the tributaries. These effects are much more strongly pronounced during summer baseflow compared to spring flood. Overall, deeper flowpaths in summer compared to spring enhance the DIC discharge within the river bed and the tributaries, thus leading to elevated CO2 flux in summer. An additional factor responsible for higher CO2 emission during this season could be mire-originating particulate organic matter (POM) processing in the water column.
The 6-month open water period C emissions from the lotic waters of the Ket River basin were sizably lower than the downstream total C export by this river during the same period. We conclude that regional estimations of the C balance in lotic systems should be based on a combination of direct chamber measurements, discrete hydrochemical sampling and continuous in situ monitoring with submersible sensors, at least during the two most important hydrological periods of the year, which are, for boreal regions, the spring flood and the summer–fall baseflow. We believe that this is the best trade-off between scientific rigor and logistical feasibility in poorly accessible, pristine and strongly understudied regions.
The data set used in this paper is available at Mendeley Data https://doi.org/10.17632/snwbkvg6tc.1 (Pokrovsky et al., 2022b).
The supplement related to this article is available online at: https://doi.org/10.5194/bg-19-5859-2022-supplement.
AGL and OSP designed the study and wrote the paper. AGL, SNV, IVK and OSP performed sampling, analysis and their interpretation. LSS performed bacterial assessment and DOC/DIC analysis and interpretation. MAK performed landscape characterization of the Ket River basin and calculated the water surface area. SK performed hydrological analysis. JK provided analyses of literature data, transfer coefficients for FCO2 calculations and global estimations of areal emission vs. export.
The contact author has declared that none of the authors has any competing interests.
Publisher's note: Copernicus Publications remains neutral with regard to jurisdictional claims in published maps and institutional affiliations.
We are grateful to Alexander Sorochinskiy for his invaluable help during field work.
This research has been supported by the Russian Science Foundation (grant no. 22-17-00253), the Russian Foundation for Basic Research (grant no. 20-05-00729), Tomsk State University (grant no. Priority-2030), and the Svenska Forskningsrådet Formas (grant no. 2016-05275).
This paper was edited by Gwenaël Abril and reviewed by Lishan Ran and two anonymous referees.
Abril, G. and Borges, A. V.: Ideas and perspectives: Carbon leaks from flooded land: do we need to replumb the inland water active pipe?, Biogeosciences, 16, 769–784, https://doi.org/10.5194/bg-16-769-2019, 2019.
Abril, G., Martinez, J.-M., Artigas, L. F., Moreira-Turcq, P., Benedetti, M. F., Vidal, L., Meziane, T., Kim, J.-H., Bernardes, M. C., Savoye, N., Deborde, J., Albéric, P., Souza, M. F. L., Souza, E. L., and Roland, F.: Amazon river carbon dioxide outgassing fueled by wetlands, Nature, 505, 395–398, https://doi.org/10.1038/nature12797, 2014.
Ala-Aho, P., Soulsby, C., Pokrovsky, O. S., Kirpotin, S. N., Karlsson, J., Serikova, S., Manasypov, R., Lim, A., Krickov, I., Kolesnichenko, L. G., Laudon, H., and Tetzlaff, D.: Permafrost and lakes control river isotope composition across a boreal Arctic transect in the Western Siberian lowlands, Environ. Res. Lett., 13, 034028, https://doi.org/10.1088/1748-9326/aaa4fe, 2018a.
Ala-Aho, P., Soulsby, C., Pokrovsky, O. S., Kirpotin, S. N., Karlsson, J., Serikova, S., Vorobyev, S. N., Manasypov, R. M., Loiko, S., and Tetzlaff, D.: Using stable isotopes to assess surface water source dynamics and hydrological connectivity in a high-latitude wetland and permafrost influenced landscape, J. Hydrol., 556, 279–293, https://doi.org/10.1016/j.jhydrol.2017.11.024, 2018b.
Alin, S. R., Rasera, M. D. F. F. L., Salimon, C. I., Richey, J. E., Holtgrieve, G. W., Krusche, A. V., and Snidvongs, A.: Physical controls on carbon dioxide transfer velocity and flux in low-gradient river systems and implications for regional carbon budgets, J. Geophys. Res.-Biogeo., 116, G01009, https://doi.org/10.1029/2010JG001398, 2011.
Allen, G. H. and Pavelsky, T. M.: Global extent of rivers and streams, Science, 361, 585–588, https://doi.org/10.1126/science.aat0636, 2018.
Almeida, R. M., Pacheco, F. S., Barros, N., Rosi, E., and Roland, F.: Extreme floods increase CO2 outgassing from a large Amazonian rive, Limnol. Oceanogr., 62, 989–999, https://doi.org/10.1002/lno.10480, 2017.
Amaral, J. H. F., Borges, A. V., Melack, J. M., Sarmento, H., Barbosa, P. M., Kasper, D., Melo, M. L., de Fex Wolf., D., da Silva, J. S., and Forsberg, B. R.: Influence of plankton metabolism and mixing depth on CO2 dynamics in an Amazon floodplain lake, Sci. Total. Env., 630, 1381–1393, https://doi.org/10.1016/j.scitotenv.2018.02.331, 2018.
Amaral, J. H. F., Melack, J. M., Barbosa, P. M., Borges, A. V., Kasper, D., Cortes, A. C., Zhou, W., MacIntyre, S., and Forsberg, B. R.: Inundation, hydrodynamics and vegetation influences carbon dioxide concentrations in Amazon floodplain lakes, Ecosystem, 25, 911–930, https://doi.org/10.1007/s10021-021-00692-y, 2022.
Attermeyer, K., Catalán, N., Einarsdottir, K., Freixa, A., Groeneveld, M., Hawkes, J. A., Bergquist, J., and Tranvik, L. J.: Organic carbon processing during transport through boreal inland waters: particles as important sites, J. Geophys. Res.-Biogeo., 123, 2412–2428, https://doi.org/10.1029/2018JG004500, 2018.
Bartalev, S. A., Egorov, V. A., Ershov, D. V., Isaev, A. S., Lupyan, E. A., Plotnikov, D. E., and Uvarov, I. A.: Remote mapping of vegetation land cover of Russia based on data of MODIS spectroradmeter, Mod. Probl. Earth Remote Sens. Space, 8, 285–302, 2018.
Bastviken, D., Sundgren, I., Natchimuthu, S., Reyier, H., and Gålfalk, M.: Technical Note: Cost-efficient approaches to measure carbon dioxide (CO2) fluxes and concentrations in terrestrial and aquatic environments using mini loggers, Biogeosciences, 12, 3849–3859, https://doi.org/10.5194/bg-12-3849-2015, 2015.
Bayer, T. K., Gustafsson, E., Brakebusch, M., and Beer, C.: Future carbon emission from boreal and permafrost lakes are sensitive to catchment organic carbon loads, J. Geophys. Res.-Biogeo., 124, 1827–1848, https://doi.org/10.1029/2018JG004978, 2019.
Borges, A. V., Darchambeau, F., Teodoru, C. R., Marwick, T. R., Tamooh, F., Geeraert, N., Omengo, F. O., Guérin, F., Lambert, T., Morana, C., Okuku, E., and Bouillon, S.: Globally significant greenhouse gas emissions from African inland waters, Nat. Geosci., 8, 637–642, https://doi.org/10.1038/NGEO2486, 2015.
Borges, A. V., Darchambeau, F., Lambert, T., Bouillon, S., Morana, C., Brouyère, S., Hakoun, V., Jurado, A., Tseng, H-C., Descy, J.-P., and Roland, F. A. E.: Effects of agricultural land use on fluvial carbon dioxide, methane and nitrous oxide concentrations in a large European river, the Meuse (Belgium), Sci. Total Environ., 610/611, 342–355, https://doi.org/10.1016/j.scitotenv.2017.08.047, 2018.
Bussmann, I.: Distribution of methane in the Lena Delta and Buor-Khaya Bay, Russia, Biogeosciences, 10, 4641–4652, https://doi.org/10.5194/bg-10-4641-2013, 2013.
Butman, D. and Raymond, P.: Significant efflux of carbon dioxide from streams and rivers in the United States, Nat. Geosci., 4, 839–842, https://doi.org/10.1038/ngeo1294, 2011.
Cai, W.-J. and Wang, Y.: The chemistry, fluxes, and sources of carbon dioxide in the estuarine waters of the Satilla and Altamaha Rivers, Georgia, Limnol. Oceanogr., 43, 657–668, https://doi.org/10.4319/lo.1998.43.4.0657, 1998.
Campeau, A. and del Giorgio, P. A.: Patterns in CH4 and CO2 concentrations across boreal rivers: Major drivers and implications for fluvial greenhouse emissions under climate change scenarios, Glob. Change Biol., 20, 1075–1088, https://doi.org/10.1111/gcb.12479, 2014.
Campeau, A., Lapierre, J.-F., Vachon, D., and del Giorgio, P. A.: Regional contribution of CO2 and CH4 fluxes from the fluvial network in a lowland boreal landscape of Québec, Global Biogeochem. Cy., 28, 57–69, https://doi.org/10.1002/2013GB004685, 2014.
Castro-Morales, K., Canning, A., Körtzinger, A., Göckede, M., Küsel, K., Overholt, W. A., Wichard, T., Redlich, S., Arzberger, S., Kolle, O., and Zimov, N.: Effects of reversal of water flow in an Arctic floodplain river on fluvial emissions of CO2 and CH4, J. Geophys. Res.-Biogeo., 127, e2021JG006485, https://doi.org/10.1029/2021JG006485, 2022.
Chadburn, S. E., Krinner, G., Porada, P., Bartsch, A., Beer, C., Belelli Marchesini, L., Boike, J., Ekici, A., Elberling, B., Friborg, T., Hugelius, G., Johansson, M., Kuhry, P., Kutzbach, L., Langer, M., Lund, M., Parmentier, F.-J. W., Peng, S., Van Huissteden, K., Wang, T., Westermann, S., Zhu, D., and Burke, E. J.: Carbon stocks and fluxes in the high latitudes: using site-level data to evaluate Earth system models, Biogeosciences, 14, 5143–5169, https://doi.org/10.5194/bg-14-5143-2017, 2017.
Chupakov, A. V., Pokrovsky, O. S., Moreva, O. Y., Shirokova, L. S., Neverova, N. V., Chupakova, A. A., Kotova, E. I., and Vorobyeva, T. Y.: High resolution multi-annual riverine fluxes of organic carbon, nutrient and trace element from the largest European Arctic river, Severnaya Dvina, Chem. Geol., 538, https://doi.org/10.1016/j.chemgeo.2020.119491, 2020.
Cooper, L. W., McClelland, J. W., Holmes, R. M., Raymond, P. A., Gibson, J. J., Guay, C. K., and Peterson, B. J.: Flow-weighted values of runoff tracers (δ18O, DOC, Ba, alkalinity) from the six largest Arctic rivers, Geophys. Res. Lett., 35, L18606, https://doi.org/10.1029/2008GL035007, 2008.
Crawford, J. T., Striegl, R. G., Wickland, K. P., Dornblaser, M. M., and Stanley, E. H.: Emissions of carbon dioxide and methane from a headwater stream network of interior Alaska, J. Geophys. Res.-Biogeo., 118, 482–494, https://doi.org/10.1002/jgrg.20034, 2013.
Crawford, J. T., Stanley, E. H., Dornblaser, M. M., and Striegl, R. G.: CO2 time series patterns in contrasting headwater streams of North America, Aquat. Sci., 79, 473–486, https://doi.org/10.1007/s00027-016-0511-2, 2016a.
Crawford, J. T., Loken, L. C., Stanley, E. H., Stets, E. G., Dornblaser, M. M., and Striegl, R. G.: Basin scale controls on CO2 and CH4 emissions from the Upper Mississippi River, Geophys. Res. Lett., 43, 1973–1979, https://doi.org/10.1002/2015GL067599, 2016b.
Dawson, J. J., Billett, M. F., Hope, D., Palmer, S. M., and Deacon, C.: Sources and sinks of aquatic carbon in a peatland stream continuum, Biogeochemistry, 70, 71–92, 2004.
Descy, J. P., Darchambeau, F., Lambert, T., Stoyneva, M. P., Bouillon, S., and Borges, A. V.: Phytoplankton dynamics in the Congo River, Freshwater Biol., 62, 87–101, https://doi.org/10.1111/fwb.12851, 2017.
DelDuco, E. M. and Xu, Y. J.: Dissolved carbon transport and processing in North America's largest swamp river entering the Northern Gulf of Mexico, Water, 11, 1395, https://doi.org/10.3390/w11071395, 2019.
Denfeld, B. A., Frey, K. E., Sobczak, W. V., Mann, P. J., and Holmes, R. M.: Summer CO2 evasion from streams and rivers in the Kolyma River basin, north-east Siberia, Polar Res., 32, 19704, https://doi.org/10.3402/polar.v32i0.19704, 2013.
Dinsmore, K. J. and Billett, M. F.: Continuous measurement and modeling of CO2 losses from a peatland stream during stormflow events, Water Resour. Res., 44, W12417, https://doi.org/10.1029/2008WR007284, 2008.
Dinsmore, K. J., Billett, M. F., and Dyson, K. E.: Temperature and precipitation drive temporal variability in aquatic carbon and GHG concentrations and fluxes in a peatland catchment, Glob. Change Biol., 19, 2133–2148, https://doi.org/10.1111/gcb.12209, 2013.
Feng, X., Vonk, J. E., Dongen, B. E. V., Gustafsson, Ö., Semiletov, I. P., Dudarev, O. V., Wang, Z., Montluçon, D. B., Wacker, L., and Eglinton, T. I.: Differential mobilization of terrestrial carbon pools in Eurasian Arctic river basins, P. Natl. Acad. Sci. USA, 110, 14168–14173, https://doi.org/10.1073/pnas.1307031110, 2013.
Foster-Martinez, M. R. and Variano, E. A.: Air-water gas exchange by waving vegetation stems, J. Geophys. Res.-Biogeo., 121, 1916–1923, https://doi.org/10.1002/2016JG003366, 2016.
Frey, K. E. and McClelland, J. W.: Impacts of permafrost degradation on arctic river biogeochemistry, Hydrol. Process., 23, 169–182, https://doi.org/10.1002/hyp.7196, 2009.
Frey, K. E. and Smith, L. C.: How well do we know northern land cover? Comparison of four global vegetation and wetland products with a new ground-truth database for West Siberia, Global Biogeochem. Cy., 21, GB1016, https://doi.org/10.1029/2006GB002706, 2007.
Gómez-Gener, L., Rocher-Ros, G., Battin, T., Cohen, M. J., Dalmagro, H. J., Dinsmore, K. J., Drake, T. W., Duvert, C., Enrich-Prast, A., Horgby, Å., Johnson, M. S., Kirk, L., Machado-Silva, F., Marzolf, N. S., McDowell, M. J., McDowell, W. H., Miettinen, H., Ojala, A. K., Peter, H., Pumpanen, J., Ran, L., Riveros-Iregui, D. A., Santos, I. R., Six, J., Stanley, E. H., Wallin, M. B., White, S. A., and Sponseller, R. A.: Global carbon dioxide efflux from rivers enhanced by high nocturnal emissions, Nat. Geosci., 14, 289–294, https://doi.org/10.1038/s41561-021-00722-3, 2021a.
Gómez-Gener, L., Hotchkiss, E. R., Laudon, H., and Sponseller, R. A.: Integrating discharge-concentration dynamics across carbon forms in a boreal landscape, Water Resour. Res., 57, e2020WR028806, https://doi.org/10.1029/2020WR028806, 2021b.
Griffin, C. G., McClelland, J. W., Frey, K. E., Fiske, G., and Holmes, R. M.: Quantifying CDOM and DOC in major Arctic rivers during ice-free conditions using Landsat TM and ETM+ data, Remote Sens. Environ., 209, 395–409, https://doi.org/10.1016/j.rse.2018.02.060, 2018.
Harris, I., Jones, P. D., Osborn, T. J., and Lister, D. H.: Updated high-resolution grids of monthly climatic observations – the CRU TS3.10 Dataset, Int. J. Climatol., 34, 623–642, https://doi.org/10.1002/joc.3711, 2014.
Ho, D. T., Engel, V. C., Ferrón, S., Hickman, B., Choi, J., and Harvey, J. W.: On factors influencing air-water gas exchange in emergent wetlands, J. Geophys. Res.-Biogeo., 123, 178–192, https://doi.org/10.1002/2017JG004299, 2018.
Holmes, R. M., McClelland, J. W., Peterson, B. J., Tank, S. E., Bulygina, E., Eglinton, T. I., Gordeev, V. V., Gurtovaya, T. Y., Raymond, P. A., Repeta, D. J., Staples, R., Striegl, R. G., Zhulidov, A. V., and Zimov , S. A.: Seasonal and annual fluxes of nutrients and organic matter from large rivers to the Arctic Ocean and surrounding seas, Estuar. Coast., 35, 369–382, https://doi.org/10.1007/s12237-011-9386-6, 2012.
Hotchkiss, E. R., Hall Jr, R. O., Sponseller, R. A., Butman, D., Klaminder, J., Laudon, H., Rosvall, M., and Karlsson, J.: Sources of and processes controlling CO2 emissions change with the size of streams and rivers, Nat. Geosci., 8, 696–699, https://doi.org/10.1038/ngeo2507, 2015.
Hugelius, G., Tarnocai, C., Broll, G., Canadell, J. G., Kuhry, P., and Swanson, D. K.: The northern circumpolar soil carbon database: Spatially distributed datasets of soil coverage and soil carbon storage in the northern permafrost regions, Earth Syst. Sci. Data, 5, 3–13, https://doi.org/10.5194/essd-5-3-2013, 2013.
Humborg, C., Mörth, C.-M., Sundbom, M., Borg, H., Blenckner, T., Giesler, R., and Ittekkot, V.: CO2 supersaturation along the aquatic conduit in Swedish watersheds as constrained by terrestrial respiration, aquatic respiration and weathering, Glob. Change Biol., 16, 1966–1978, https://doi.org/10.1111/j.1365-2486.2009.02092.x, 2010.
Hutchins, R. H. S., Prairie, Y. T., and del Giorgio, P. A.: Large-Scale Landscape Drivers of CO2, CH4, DOC, and DIC in Boreal River Networks, Global Biogeochem. Cy., 33, 125–142, https://doi.org/10.1029/2018GB006106, 2019.
Hutchins, R. H. S., Tank, S. E., Olefeldt, D., Quinton, W. L., Spence, C., Dion, N., Estop-Aragonés, C., and Mengistu, S. G.: Fluvial CO2 and CH4 patterns across wildfire-disturbed ecozones of subarctic Canada: Current status and implications for future change, Glob. Change Biol., 26, 2304–2319, https://doi.org/10.1111/gcb.14960, 2020.
Johnson, M. S., Billett, M. F., Dinsmore, K. J., Wallin, M., Dyson, K. E., and Jassal, R. S.: Direct and continuous measurement of dissolved carbon dioxide in freshwater aquatic systems–method and applications, Ecohydrology, 3, 68–78, https://doi.org/10.1002/eco.95, 2009.
Jonsson, A., Algesten, G., Bergström, A.-K., Bishop, K., Sobek, S., Tranvik, L. J., and Jansson, M.: Integrating aquatic carbon fluxes in a boreal catchment carbon budget, J. Hydrol., 334, 141–150, https://doi.org/10.1016/j.jhydrol.2006.10.003, 2007.
Karlsson, J., Serikova, S., Vorobyev, S. N., Rocher-Ros, G., Denfeld, B., and Pokrovsky, O. S.: Carbon emission from Western Siberian inland waters, Nat. Commun., 12, 825, https://doi.org/10.1038/s41467-021-21054-1, 2021.
Kokic, J., Wallin, M. B., Chmiel, H. E., Denfeld, B. A., and Sobek, S.: Carbon dioxide evasion from headwater systems strongly contributes to the total export of carbon from a small boreal lake catchment, J. Geophys. Res.-Biogeo., 120, 13–28, https://doi.org/10.1002/2014JG002706, 2015.
Koprivnjak, J.-F., Dillon, P. J., and Molot, L. A.: Importance of CO2 evasion from small boreal streams, Global Biogeochem. Cy., 24, GB4003, https://doi.org/10.1029/2009GB003723, 2010.
Krickov, I. V., Lim, A. G., Manasypov, R. M., Loiko, S. V., Shirokova, L. S., Kirpotin, S. N., Karlsson, J., and Pokrovsky, O. S.: Riverine particulate C and N generated at the permafrost thaw front: case study of western Siberian rivers across a 1700 km latitudinal transect, Biogeosciences, 15, 6867–6884, https://doi.org/10.5194/bg-15-6867-2018, 2018.
Krickov, I. V., Serikova, S., Pokrovsky, O. S., Vorobyev, S. N., Lim, A. G., Siewert, M. B., and Karlsson, J.: Sizable carbon emission from the floodplain of Ob River, Ecol. Indic., 131, 108164, https://doi.org/10.1016/j.ecolind.2021.108164, 2021.
Lauerwald, R., Laruelle, G. G., Hartmann, J., Ciais, P., and Regnier, P. A. G.: Spatial patterns in CO2 evasion from the global river network, Global Biogeochem. Cy., 29, 534–554, https://doi.org/10.1002/2014GB004941, 2015.
Leith, F. I., Dinsmore, K. J., Wallin, M. B., Billett, M. F., Heal, K. V., Laudon, H., Öquist, M. G., and Bishop, K.: Carbon dioxide transport across the hillslope–riparian–stream continuum in a boreal headwater catchment, Biogeosciences, 12, 1881–1892, https://doi.org/10.5194/bg-12-1881-2015, 2015.
Leng, P., Li, Z., Zhang, Q., Li, F., and Koschorreck, M.: Fluvial CO2 and CH4 in a lowland agriculturally impacted river network: Importance of local and longitudinal controls, Environ. Pollut., 303, 119125, https://doi.org/10.1016/j.envpol.2022.119125, 2022.
Li, M., Peng, C., Zhang, K., Xu, L., Wang, J., Yang, Y., Li, P., Liu, Z., and He, N.: Headwater stream ecosystem: an important source of greenhouse gases to the atmosphere, Water Res., 190, 116738, https://doi.org/10.1016/j.watres.2020.116738, 2021.
Liu S., Kuhn, C., Amatulli, G., Aho, K., Butman, D. E., Allen, G. H., Lin, P., Pan, M., Yamazaki, D., Brinkerhoff, C., Gleason, C., Xia, X., and Raymond, P. A.: The importance of hydrology in routing terrestrialcarbon to the atmosphere via global streams and rivers, P. Natl. Acad. Sci. USA, 119, e2106322119, https://doi.org/10.1073/pnas.2106322119, 2022.
Lobbes, J. M., Fitznar, H. P., and Kattner, G.: Biogeochemical characteristics of dissolved and particulate organic matter in Russian rivers entering the Arctic Ocean, Geochim. Cosmochim. Ac., 64, 2973–2983, https://doi.org/10.1016/S0016-7037(00)00409-9, 2000.
Lorke A., Bodmer, P., Noss, C., Alshboul, Z., Koschorreck, M., Somlai-Haase, C., Bastviken, D., Flury, S., McGinnis, D. F., Maeck, A., Müller, D., and Premke, K.: Technical note: drifting versus anchored flux chambers for measuring greenhouse gas emissions from running waters, Biogeosciences, 12, 7013–7024, https://doi.org/10.5194/bg-12-7013-2015, 2015.
Lundin, E. J., Giesler, R., Persson, A., Thompson, M. S., and Karlsson, J.: Integrating carbon emissions from lakes and streams in a subarctic catchment, J. Geophys. Res.-Biogeo., 118, 1200–1207, https://doi.org/10.1002/jgrg.20092, 2013.
Lynch, L. M., Sutfin, N. A., Fegel, T. S., Boot, C. M., Covino, T. P., and Wallenstein, M. D.: River channel connectivity shifts metabolite composition and dissolved organic matter chemistry, Nat. Commun., 10, 459, https://doi.org/10.1038/s41467-019-08406-8, 2019.
Marie, D., Partensky, F., Vaulot, D., and Brussaard, C.: Enumeration of Phytoplankton, Bacteria, and Viruses in Marine Samples, Curr. Protoc. Cytom., 10, 11111–111115, https://doi.org/10.1002/0471142956.cy1111s10, 1999.
Pangala, S., Enrich-Prast, A., Basso, L., Peixoto, R. B., Bastviken, D., Hornibrook, E. R. C., Gatti, L. V., Marotta, H., Braucks Calazans, , L. S., Sakuragui, C. M., Rodrigues Bastos, W., Malm, O., Gloor, E., Miller, J. B., and Gauci, V.: Large emissions from floodplain trees close the Amazon methane budget, Nature, 552, 230–234, https://doi.org/10.1038/nature24639, 2017.
Pekel, J.-F., Cottam, A., Gorelick, N., and Belward, A. S.: High-resolution mapping of global surface water and its long-term changes, Nature, 540, 418–422, https://doi.org/10.1038/nature20584, 2016.
Pokrovsky, O. S., Manasypov, R. M., Loiko, S., Shirokova, L. S., Krickov, I. A., Pokrovsky, B. G., Kolesnichenko, L. G., Kopysov, S. G., Zemtzov, V. A., Kulizhsky, S. P., Vorobyev, S. N., and Kirpotin, S. N.: Permafrost coverage, watershed area and season control of dissolved carbon and major elements in western Siberian rivers, Biogeosciences, 12, 6301–6320, https://doi.org/10.5194/bg-12-6301-2015, 2015.
Pokrovsky, O. S., Manasypov, R. M., Kopysov, S. G., Krickov, I. V., Shirokova, L. S., Loiko, S. V., Lim, A. G., Kolesnichenko, L. G., Vorobyev, S. N., and Kirpotin, S. N.: Impact of permafrost thaw and climate warming on riverine export fluxes of carbon, nutrients and metals in Western Siberia, Water, 12, 1817, https://doi.org/10.3390/w12061817, 2020.
Pokrovsky, O. S., Manasypov, R. M., Chupakov, A. V., and Kopysov, S.: Element transport in the Taz River, western Siberia, Chem. Geol., 614, 121180, https://doi.org/10.1016/j.chemgeo.2022.121180, 2022a.
Pokrovsky, O., Lim, A., Krickov, I., Korets, M., and Vorobyev, S.: Ket River hydrochemistry, CO2 concentration and landscape parameters, Mendeley Data [data set], https://doi.org/10.17632/snwbkvg6tc.1, 2022b.
Ran, L., Lu, X. X., Richey, J. E., Sun, H., Han, J., Yu, R., Liao, S., and Yi, Q.: Long-term spatial and temporal variation of CO2 partial pressure in the Yellow River, China, Biogeosciences, 12, 921–932, https://doi.org/10.5194/bg-12-921-2015, 2015.
Ran, L., Lu, X. X., and Liu, S.: Dynamics of riverine CO2 in the Yangtze River fluvial network and their implications for carbon evasion, Biogeosciences, 14, 2183–2198, https://doi.org/10.5194/bg-14-2183-2017, 2017.
Raymond, P. A., McClelland, J. W., Holmes, R. M., Zhulidov, A. V., Mull, K., Peterson, B. J., Striegl, R. G., Aiken, G. R., and Gurtovaya, T. Y.: Flux and age of dissolved organic carbon exported to the Arctic Ocean: A carbon isotopic study of the five largest arctic rivers, Global Biogeochem. Cy., 21, GB4011, https://doi.org/10.1029/2007GB002934, 2007.
Raymond, P. A., Zappa, C. J., Butman, D., Bott, T. L., Potter, J., Mulholland, P., Laursen, A. E., McDowell, W. H., and Newbold, D.: Scaling the gas transfer velocity and hydraulic geometry in streams and small rivers, Limnol. Oceanogr., 2, 41–53, https://doi.org/10.1215/21573689-1597669, 2012.
Raymond, P. A., Hartmann, J., Lauerwald, R., Sobek, S., McDonald, C., Hoover, M., Butman, D., Striegl, R., Mayorga, E., Humborg, C., Kortelainen, P., Dürr, H., Meybeck, M., Ciais, P., and Guth, P.: Global carbon dioxide emissions from inland waters, Nature, 503, 355–359, https://doi.org/10.1038/nature12760, 2013.
Rehder, Z., Zaplavnova, A., and Kutzbach, L.: Identifying drivers behind spatial variability of methane concentrations in East Siberian ponds, Front. Earth Sci., 9, 617662, https://doi.org/10.3389/feart.2021.617662, 2021.
Santoro, M., Beer, C., Cartus, O., Schmullius, C., Shvidenko, A., McCallum, I., Wegmüller, U., and Wiesmann, A.: The BIOMASAR algorithm: An approach for retrieval of forest growing stock volume using stacks of multi-temporal SAR data, in: Proceedings of ESA Living Planet Symposium, Bergen, Norway, 28 June–2 July, https://biomasar.org/fileadmin/biomasar/papers/santoro_biomasar_LPSympo_2010.pdf (last access: 15 December 2022), 2010.
Schneider, C. L., Herrera, M., Raisle, M. L., Suarez, E., and Riveros-Iregui, D. A.: Carbon Dioxide (CO2) Fluxes from terrestrial and aquatic environments in a high altitude tropical catchment, J Geophys. Res.-Biogeo., 125, e2020JG005844, https://doi.org/10.1029/2020JG005844, 2020.
Semiletov, I. P., Pipko, I. I., Shakhova, N. E., Dudarev, O. V., Pugach, S. P., Charkin, A. N., McRoy, C. P., Kosmach, D., and Gustafsson, Ö.: Carbon transport by the Lena River from its headwaters to the Arctic Ocean, with emphasis on fluvial input of terrestrial particulate organic carbon vs. carbon transport by coastal erosion, Biogeosciences, 8, 2407–2426, https://doi.org/10.5194/bg-8-2407-2011, 2011.
Serikova, S., Pokrovsky, O. S., Ala-Aho, P., Kazantsev, V., Kirpotin, S. N., Kopysov, S. G., Krickov, I. V., Laudon, H., Manasypov, R. M., Shirokova, L. S., Soulsby, C., Tetzlaff, D., and Karlsson, J.: High riverine CO2 emissions at the permafrost boundary of Western Siberia, Nat. Geosci., 11, 825–829, https://doi.org/10.1038/s41561-018-0218-1, 2018.
Serikova, S., Pokrovsky, O. S., Laudon, H., Krickov, I. V., Lim, A. G., Manasypov, R. M., and Karlsson, J.: High carbon emissions from thermokarst lakes of Western Siberia, Nat. Commun., 10, 1552, https://doi.org/10.1038/s41467-019-09592-1, 2019.
Spawn, S. A., Dunn, S. T., Fiske, G. E., Natali, S. M., Schade, J. D., and Zimov, N. S.: Summer methane ebullition from a headwater catchment in Northeastern Siberia, Inland Waters, 5, 224–230, https://doi.org/10.5268/IW-5.3.845, 2015.
Stackpoole, S. M., Butman, D. E., Clow, D. W., Verdin, K. L., Gaglioti, B. V., Genet, H., and Striegl, R. G.: Inland waters and their role in the carbon cycle of Alaska, Ecol. Appl., 27, 1403–1420, https://doi.org/10.1002/eap.1552, 2017.
Stanley, E. H., Casson, N. J., Christel, S. T., Crawford, J. T., Loken, L. C., and Oliver, S. K.: The ecology of methane in streams and rivers: patterns, controls, and global significance, Ecol. Monogr. 86, 146–171, 2016.
Striegl, R. G., Dornblaser, M. M., McDonald, C. P., Rover, J. A., and Stets, E. G.: Carbon dioxide and methane emissions from the Yukon River system, Global Biogeochem. Cy., 26, GB0E05, https://doi.org/10.1029/2012GB004306, 2012.
Teodoru, C. R., del Giorgio, P. A., Prairie, Y. T., and Camire, M.: Patterns in pCO2 in boreal streams and rivers of northern Quebec, Canada, Global Biogeochem. Cy., 23, GB2012, https://doi.org/10.1029/2008GB003404, 2009.
Tranvik, L., Cole, J. J., and Prairie, Y. T.: The study of carbon in inland waters-from isolated ecosystems to players in the global carbon cycle, Limnol. Oceanogr. Lett., 3, 41–48, https://doi.org/10.1002/lol2.10068, 2018.
Vachon, D., Sponseller, R. A., and Karlsson, J.: Integrating carbon emission, accumulation and transport in inland waters to understand their role in the global carbon cycle, Glob. Change Biol., 27, 719–727, https://doi.org/10.1111/gcb.15448, 2021.
Villa, J. A., Ju, Y., Yazbeck, T., Waldo, S., Wrighton, K. C., and Bohrer, G.: Ebullition dominates methane fluxes from the water surface across different ecohydrological patches in a temperate freshwater marsh at the end of the growing season, Sci. Total Environ., 767, 144498, https://doi.org/10.1016/j.scitotenv.2020.144498, 2021.
Vorobyev, S. N., Pokrovsky, O. S., Kolesnichenko, L. G., Manasypov, R. M., Shirokova, L. S., Karlsson, J., and Kirpotin, S. N.: Biogeochemistry of dissolved carbon, major, and trace elements during spring flood periods on the Ob River, Hydrol. Process., 33, 1579–1594, https://doi.org/10.1002/hyp.13424, 2019.
Vorobyev, S. N., Karlsson, J., Kolesnichenko, Y. Y., Korets, M. A., and Pokrovsky, O. S.: Fluvial carbon dioxide emission from the Lena River basin during the spring flood, Biogeosciences, 18, 4919–4936, https://doi.org/10.5194/bg-18-4919-2021, 2021.
Wallin, M. B., Öquist, M. G., Buffam, I., Billett, M. F., Nisell, J., and Bishop, K. H.: Spatiotemporal variability of the gas transfer coefficient (KCO2) in boreal streams: Implications for large scale estimates of CO2 evasion, Global Biogeochem. Cy., 25, GB3025, https://doi.org/10.1029/2010GB003975, 2011.
Wallin, M. B., Grabs, T., Buffam, I., Laudon, H., Ågren, A., Öquist, M. G., and Bishop, K.: Evasion of CO2 from streams – The dominant component of the carbon export through the aquatic conduit in a boreal landscape, Glob. Change Biol., 19, 785–797, https://doi.org/10.1111/gcb.12083, 2013.
Wallin, M. B., Campeau, A., Audet, J., Bastviken, D., Bishop, K., Kokic, J., Laudon, H., Lundin, E., Löfgren, S., Natchimuthu, S., Sobek, S., Teutschbein, C., Weyhenmeyer, G. A., and Grabs, T.: Carbon dioxide and methane emissions of Swedish low-order streams – a national estimate and lessons learnt from more than a decade of observations, Limnol. Oceanogr. Lett., 3, 156–167, https://doi.org/10.1002/lol2.10061, 2018.
Wild, B., Andersson, A., Bröder, L., Vonk, J., Hugelius, G., McClelland, J. W., Song, W., Raymond, P. A., and Gustafsson, Ö.: Rivers across the Siberian Arctic unearth the patterns of carbon release from thawing permafrost, P. Natl. Acad. Sci. USA, 116, 10280–10285, https://doi.org/10.1073/pnas.1811797116, 2019.
Winterdahl, M., Wallin, M. B., Karlsen, R. H., Laudon, H., Öquist, M., and Lyon, S. W.: Decoupling of carbon dioxide and dissolved organic carbon in boreal headwater streams, J. Geophys. Res.-Biogeosciences, 121, 2630–2651, https://doi.org/10.1002/2016JG003420, 2016.
Yamamoto, S., Alcauskas, J. B., and Crozier, T. E.: Solubility of methane in distilled water and seawater, J. Chem. Eng. Data., 21, 78–80, 1976.
Zabelina, S. V., Shirokova, L. S., Klimov, S. I., Chupakov, A. V., Lim, A. G., Polishchuk, Y. M., Polishchuk, V. M., Bogdanov, A. N., Muratov, I. N., Gueren, F., Karlsson, J., and Pokrovsky, O. S.: Seasonal and spatial variations of CO2 and CH4 concentrations and fluxes in surface waters of frozen peatlands (NE Europe): morphological and hydrochemical control, Limnol. Oceanogr., 66, S216–S230, https://doi.org/10.1002/lno.11560, 2021.
Zolkos, S., Tank, S. E., Striegl, R. G., and Kokelj, S. V.: Thermokarst effects on carbon dioxide and methane fluxes in streams on the Peel Plateau (NWT, Canada), J. Geophys. Res.-Biogeo., 124, 1781–1798, https://doi.org/10.1029/2019JG005038, 2019.