the Creative Commons Attribution 4.0 License.
the Creative Commons Attribution 4.0 License.
 | 09 Sep 2021
Fluvial carbon dioxide emission from the Lena River basin during the spring flood
Sergey N. Vorobyev
Jan Karlsson
Yuri Y. Kolesnichenko
Mikhail A. Korets
Oleg S. Pokrovsky
Greenhouse gas (GHG) emission from inland waters of permafrost-affected regions is one of the key factors of circumpolar aquatic ecosystem response to climate warming and permafrost thaw. Riverine systems of central and eastern Siberia contribute a significant part of the water and carbon (C) export to the Arctic Ocean, yet their C exchange with the atmosphere remains poorly known due to lack of in situ GHG concentration and emission estimates. Here we present the results of continuous in situ pCO2 measurements over a 2600 km transect of the Lena River main stem and lower reaches of 20 major tributaries (together representing a watershed area of 1 661 000 km2, 66 % of the Lena's basin), conducted at the peak of the spring flood. The pCO2 in the Lena (range 400–1400 µatm) and tributaries (range 400–1600 µatm) remained generally stable (within ca. 20 %) over the night–day period and across the river channels. The pCO2 in tributaries increased northward with mean annual temperature decrease and permafrost increase; this change was positively correlated with C stock in soil, the proportion of deciduous needleleaf forest, and the riparian vegetation. Based on gas transfer coefficients obtained from rivers of the Siberian permafrost zone (k=4.46 m d−1), we calculated CO2 emission for the main stem and tributaries. Typical fluxes ranged from 1 to 2 (>99 % CO2, <1 % CH4), which is comparable with CO2 emission measured in the Kolyma, Yukon, and Mackenzie rivers and permafrost-affected rivers in western Siberia. The areal C emissions from lotic waters of the Lena watershed were quantified by taking into account the total area of permanent and seasonal water of the Lena basin (28 000 km2 ). Assuming 6 months of the year to be an open water period with no emission under ice, the annual C emission from the whole Lena basin is estimated as 8.3±2.5 Tg C yr−1, which is comparable to the DOC and dissolved inorganic carbon (DIC) lateral export to the Arctic Ocean.
- Article
(6819 KB) - Full-text XML
- Companion paper
-
Supplement
(1874 KB) - BibTeX
- EndNote


Climate warming in high latitudes is anticipated to result in mobilization, decomposition, and atmospheric release of significant amounts of carbon (C) stored in permafrost soils, providing a positive feedback (Schuur et al., 2015). Permafrost thawing is expected to also increase the lateral C export to rivers and lakes (Frey and Smith, 2005). The exported permafrost C is relatively labile and largely degraded to greenhouse gases (GHGs) in recipient freshwaters (e.g., Vonk et al., 2015). As a result, assessment of GHG emission in rivers of permafrost-affected regions is crucially important for understanding the high-latitude C cycle under various climate change scenarios (Chadburn et al., 2017; Vonk et al., 2019). Among six great Arctic rivers, the Lena is the most emblematic one, situated chiefly within the continuous permafrost zone and exhibiting the highest seasonal variation in discharge. Over the past 2 decades, there has been an explosive interest to the Lena River hydrology (Yang et al., 2002; Berezovskaya et al., 2005; Smith and Pavelsky, 2008; Ye et al., 2009; Gelfan et al., 2017; Suzuki et al., 2018), organic C (OC) transport (Lara et al., 1998; Raymond et al., 2007; Semiletov et al., 2011; Goncalves-Araujo et al., 2015; Kutscher et al., 2017; Griffin et al., 2018), and general hydrochemistry (Gordeev and Sidorov, 1993; Cauwet and Sidorov, 1996; Huh et al., 1998a, b; Huh and Edmond, 1999; Wu and Huh, 2007; Kuzmin et al., 2009; Pipko et al., 2010; Georgiadi et al., 2019; Juhls et al., 2020), including novel isotopic approaches for nutrients (Si, Sun et al., 2018) and trace metals such as Li (Murphy et al., 2018) and Fe (Hirst et al., 2020). This interest is naturally linked to the Lena River location within the forested continuous permafrost–taiga zone covered by organic-rich yedoma soil. Under ongoing climate warming, the soils of the Lena River watershed are subjected to strong thawing and active (seasonally unfrozen) layer deepening (Zhang et al., 2005) accompanied by an overall increase in river water discharge (McClelland et al., 2004; Ahmed et al., 2020), flood intensity, and frequency (Gautier et al., 2018). The Lena River exhibits the highest DOC concentration among all great Arctic rivers (i.e., Holmes et al., 2013), which may reflect weak DOC degradation in the water column and massive mobilization of both contemporary and ancient OC to the river from the watershed (Feng et al., 2013; Wild et al., 2019). In contrast to rather limited works on CO2 and CH4 emissions from water surfaces of eastern Siberia (Semiletov, 1999; Denfeld et al., 2013), extensive studies were performed on land, in the polygonal tundra of the Lena River delta (Wille et al., 2008; Bussman, 2013; Sachs et al., 2008; Kutzbach et al., 2007) and the Indigirka Lowland (van der Molen et al., 2007). Finally, there have been several studies of sediment and particular matter transport by the Lena River to the Laptev Sea (Rachold et al., 1996; Dudarev et al., 2006) together with detailed research of the Lena River delta (Zubrzycki et al., 2013; Siewert et al., 2016).
Surprisingly, despite such extensive research on C transport, storage, and emission in eastern Siberian landscapes, C emissions of the Lena River main stem and tributaries remain virtually unknown, compared to a relatively good understanding of those in the Yukon (Striegl et al., 2012; Stackpoole et al., 2017), Mackenzie (Horan et al., 2019), Ob (Karlsson et al., 2021; Pipko et al., 2019), and Kolyma (Denfeld et al., 2013). The only available estimates of C emission from inland waters of the Lena basin are based on a few indirect (calculated gas concentration and modeled fluxes) snapshot data with very low spatial and temporal resolution (Raymond et al., 2013). Similar to other regions, this introduces uncertainties and cannot adequately capture total regional C emissions (Abril et al., 2015; Denfeld et al., 2018; Park et al., 2018; Klaus et al., 2019; Klaus and Vachon, 2020; Karlsson et al., 2021). In particular, no detailed studies at the peak of spring flood have been performed, and the information on various contrasting tributaries of the Lena River remains very limited. As a result, reliable estimations of magnitude and controlling factors of C emission in the Lena River basin are poorly understood. The present work represents a first assessment of CO2 and CH4 concentration and fluxes of the main stem and tributaries during the peak of spring flow, via calculating C emission and relating these data to river hydrochemistry and GIS-based landscape parameters. This should allow identification of environmental factors controlling GHG concentration and emission in the Lena River watershed in order to use this knowledge to foresee future changes in C balance of the largest permafrost-affected Arctic river.
2.1 Lena River and its tributaries
The sampled Lena River main stem and 20 tributaries are located along a 2600 km latitudinal transect SW to NE and include watersheds of distinct sizes, geomorphology, permafrost extent, lithology, climate, and vegetation (Fig. 1, S1A in the Supplement; Table S1 in the Supplement). The total watershed area of the rivers sampled in this work is approximately 1.66 million square kilometers, representing 66 % of the entire Lena River basin. Permafrost is mostly continuous except some discontinuous and sporadic patches in the southern part of the Lena basin (Brown et al., 2002). The mean annual air temperatures (MAATs) along the transect range from −5 ∘C in the southern part of the Lena basin to −9 ∘C in the central part of the basin. The range of MAAT for 20 tributaries is from −4.7 to −15.9 ∘C. The mean annual precipitation ranges from 350–500 mm yr−1 in the southern and southwestern parts of the basin to 200–250 mm yr−1 in the central and northern parts (Chevychelov and Bosikov, 2010). The lithology of the Siberian platform which is drained by the Lena River is highly diverse and includes Archean and Proterozoic crystalline and metamorphic rocks; Upper Proterozoic, Cambrian, and Ordovician dolostones and limestones; volcanic rocks of the Permo–Triassic age; and essentially terrigenous silicate sedimentary rocks of the Phanerozoic. Further description of the Lena River basin landscapes, vegetation, and lithology can be found elsewhere (Rachold et al., 1996; Huh et al., 1998a, b; Pipko et al., 2010; Semiletov et al., 2011; Kutscher et al., 2017; Juhls et al., 2020).
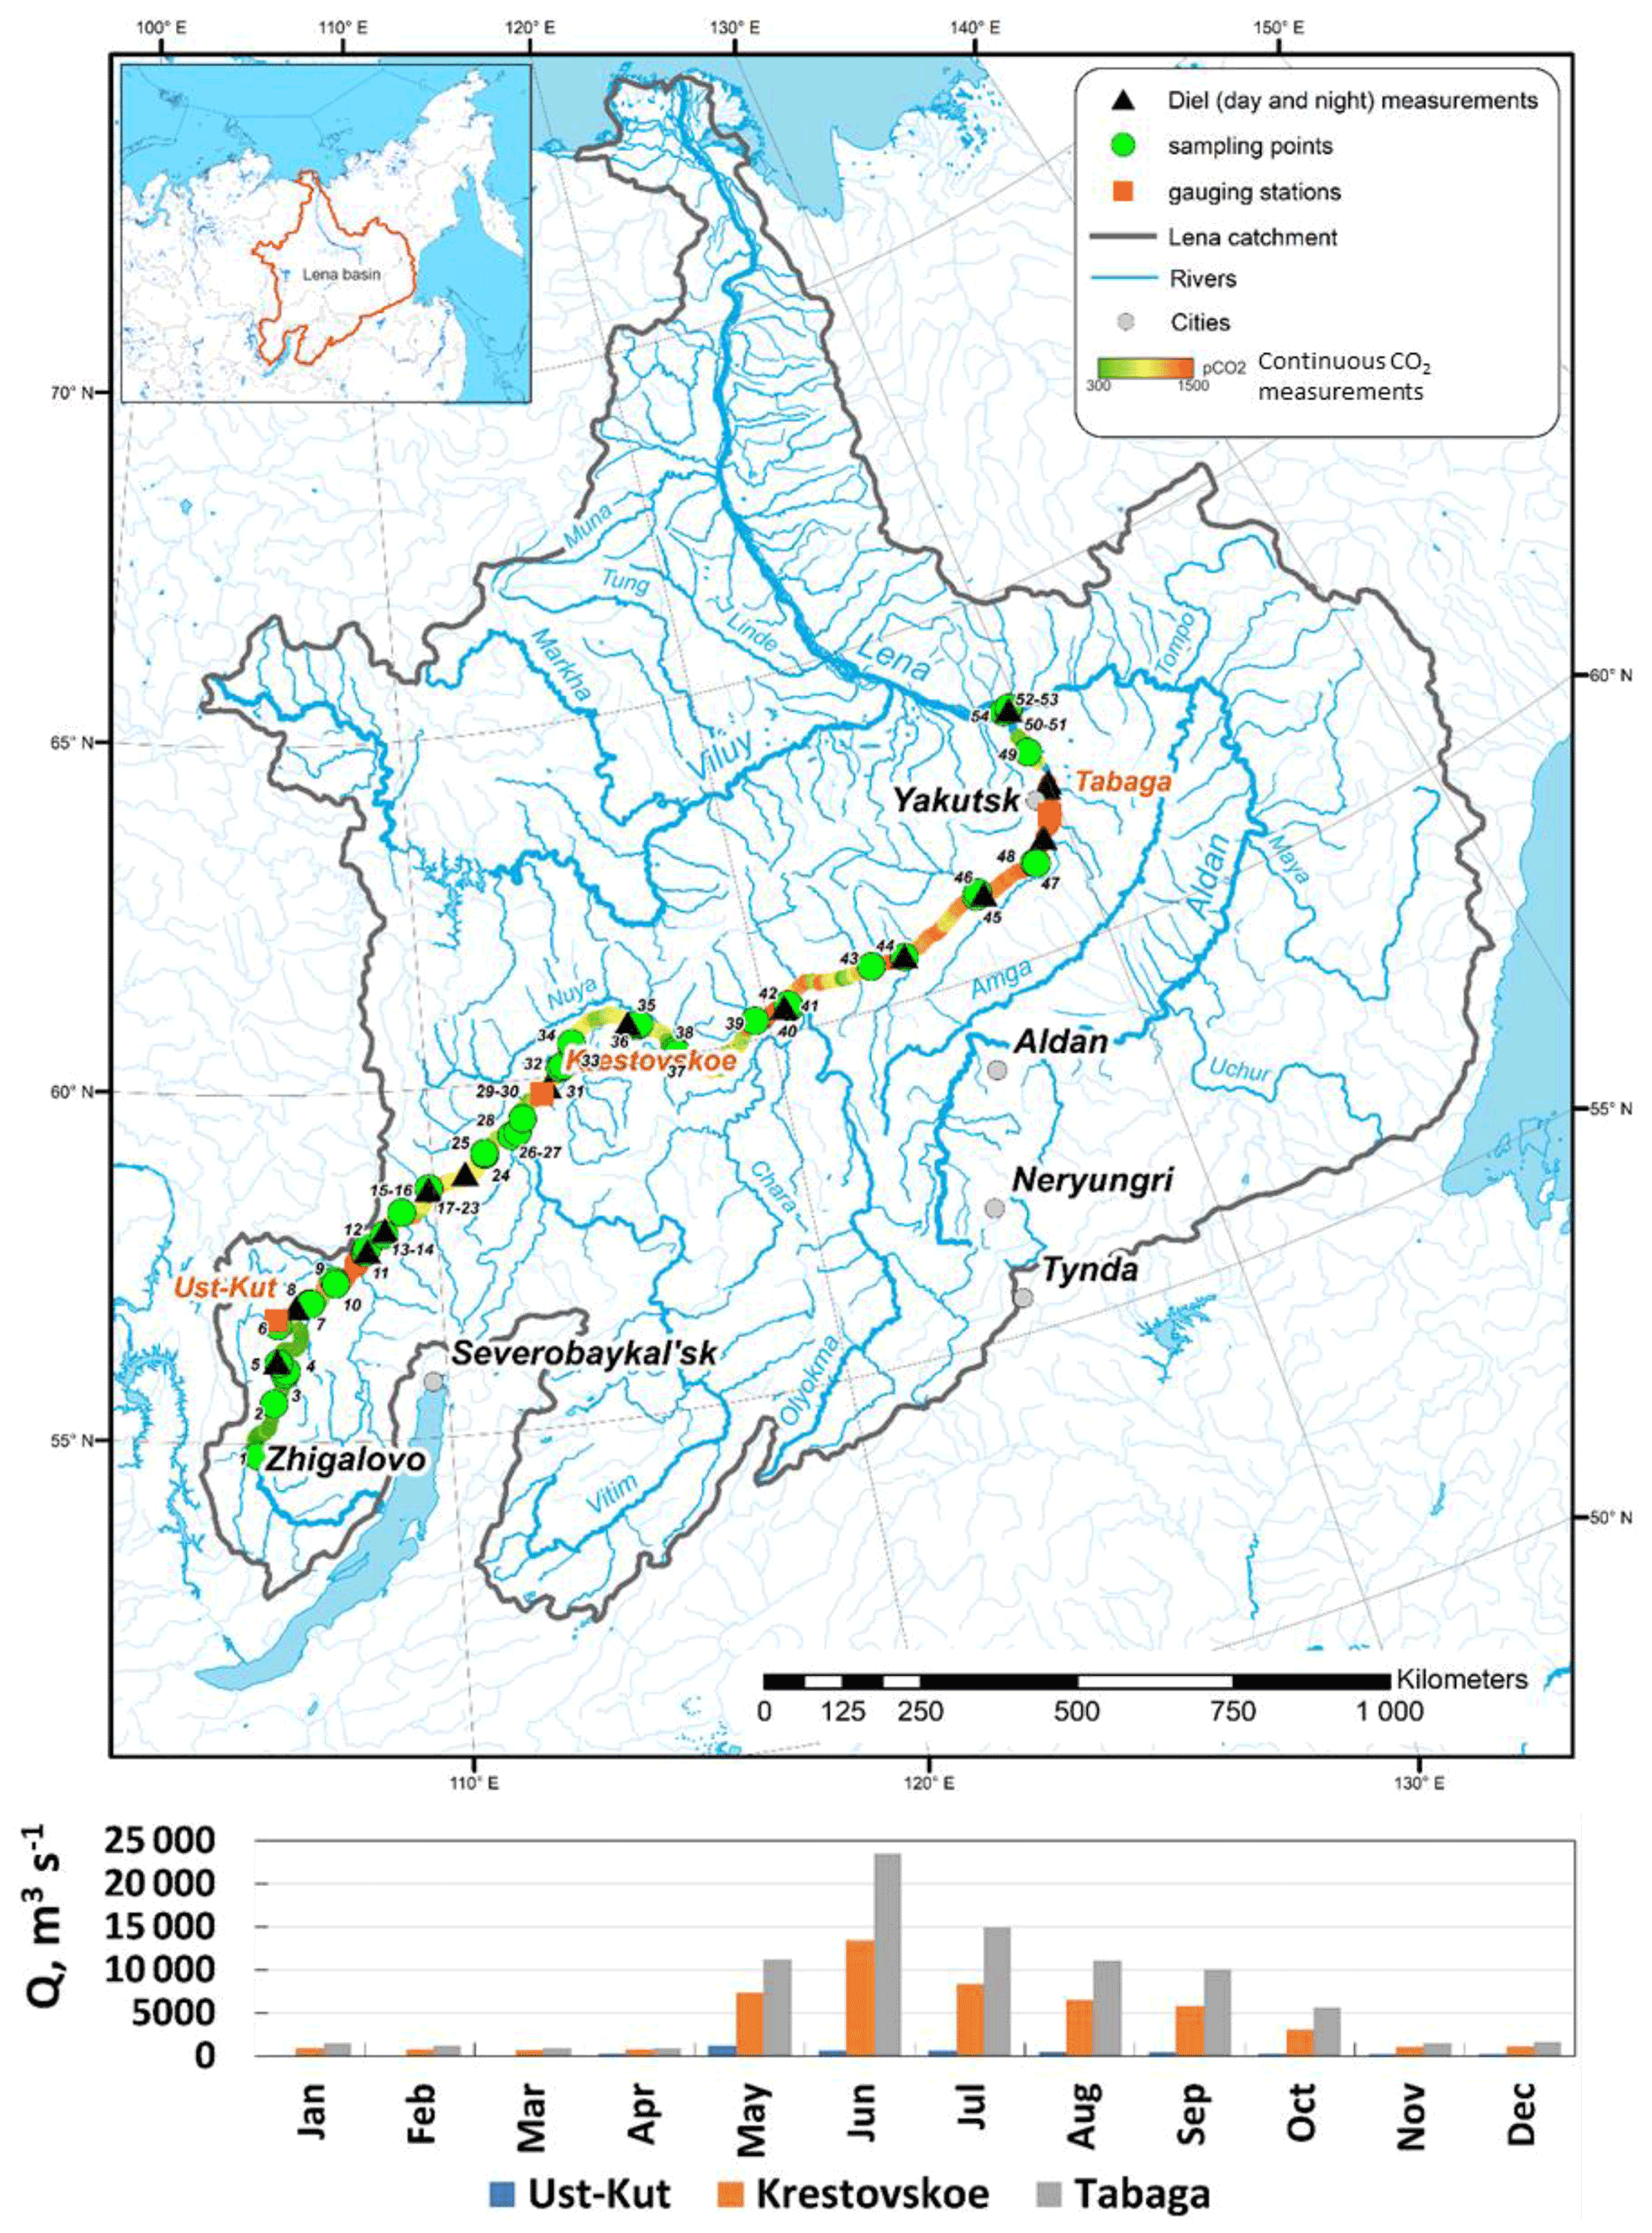
Figure 1Map of the studied Lena River watershed with continuous pCO2 measurements in the main stem. Bottom: mean multi-annual monthly discharge (Q) at Ust-Kut, Krestovskoe, and Tabaga stations (labeled in red on the map).
The peak of annual discharge depends on the latitude (Fig. 1) and occurs in May in the south (Ust-Kut) and in June in the middle and low reaches of the Lena River (Yakutsk, Kysyr). From 29 May to 17 June 2016, we moved downstream on the Lena River by boat with an average speed of 30 km h−1 (Gureyev, 2016). As such, we followed the progression of the spring and moved from the southwest to the northeast, thus collecting river water at approximately the same stage of maximal discharge. Note that transect sampling is a common way to assess river water chemistry in extreme environments (Huh and Edmond, 1999; Spence and Telmer, 2005), and generally, a single sampling during high-flow season provides the best agreement with time-series estimates (Qin et al., 2006). Regular stops each 80–100 km along the Lena River allowed sampling for major hydrochemical parameters and CH4 along the main stem. We also moved 500–1500 m upstream of selected tributaries to record CO2 concentrations for at least 1 h and to sample for river hydrochemistry; see examples of spatial coverage in Fig. S1B. From late afternoon–evening to the next morning, we stopped for sleep but continued to record pCO2 in the Lena River main stem (15 sites, evenly distributed over the full 2600 km transect) and two tributaries (Aldan and Tuolba).
2.2 CO2 and CH4 concentrations
Surface water CO2 concentration was measured continuously, in situ by deploying a portable infrared gas analyzer (IRGA, GMT222 CARBOCAP® probe, Vaisala®; accuracy ±1.5 %) of two ranges (2000 and 10 000 ppm). This system was mounted on a small boat in a perforated steel pipe ∼0.5 m below water surface. The tube had two necessary openings of different diameters, which allowed free water flow with a constant rate while the boat was moving. The probe was enclosed within a waterproof and gas-permeable membrane. The key to aqueous deployment of the IRGA sensor is the use of a protective expanded polytetrafluoroethylene (PTFE) tube or sleeve that is highly permeable to CO2 but impermeable to water (Johnson et al., 2009). The material is available for purchase as a flexible tube that fits over the IRGA sensor (Product number 200-07; International Polymer Engineering, Tempe, Arizona, USA). We also used a copper mesh screen to minimize biofouling effects (i.e., Yoon et al., 2016). However these effects are expected to be low in cold waters of the virtually pristine Lena River and its tributaries. During sampling, the sensor was left to equilibrate in the water for 10 min before measurements were recorded.
The probe was enclosed and placed into a tube which was submerged 0.5 m below the water surface. Within this tube, we designed a special chamber that allowed low-turbulent water flow around the probe without gas bubbles. Previous studies (Park et al., 2021; Crawford et al., 2015; Yoon et al., 2016) reported some effects of boat speed on sensor CO2 measurements due to turbulence. Although the turbulence was minimized in the tube–chamber design used in the present study, on a selected river transect (∼10 km) we have also tested the impact of the boat speed (5, 10, 20, 30, and 40 km h−1) on the sensor performance and have not detected any sizable (>10 %, p<0.05, n=25) difference in the CO2 concentrations recorded by our system.
A Campbell logger was connected to the system, allowing continuous recording of the CO2 concentration (ppm), water temperature (∘C) and pressure (mbar) every minute during 5 over 10 min intervals yielding 4285 individual pCO2, water temperature, and pressure measurements in total. These data were averaged for three consecutive slots of 5 min measurements, which represented the approximate 20 km interval of the main stem route. CO2 concentrations in the Lena River tributaries were measured over the first 500–2000 m distance upstream of the tributary mouth and comprised between 5 and 34 measurements for daytime visits and between 305 and 323 individual pCO2 readings for each tributary for daytime and nighttime monitoring.
Sensor preparation was conducted in the lab following the method described by Johnson et al. (2009). The measurement unit (MI70, Vaisala®; accuracy ±0.2 %) was connected to the sensor, allowing instantaneous readings of pCO2. The sensors were calibrated in the lab against standard gas mixtures (0, 800, 3000, 8000 ppm; linear regression with R2>0.99) before and after the field campaign. The sensors' drift was 0.03 %–0.06 % per day, and overall error was 4 %–8 % (relative standard deviation, RSD). Following calibration, post-measurement correction of the sensor output induced by changes in water temperature and barometric pressure was done by applying empirically derived coefficients following Johnson et al. (2009). These corrections never exceeded 5 % of the measured values. Furthermore, we tested two different sensors in several sites of the river transect: a main probe used for continuous measurements and another probe used as a control and never employed for continuous measurements. We did not find any sizable (>10 %) difference in measured CO2 concentration between these two probes.
For CH4 analyses, unfiltered water was sampled in 60 mL serum bottles and closed without air bubbles using vinyl stoppers and aluminum caps and immediately poisoned by adding 0.2 mL of saturated HgCl2 via a two-way needle system. In the laboratory, a headspace was created by displacing approx. 40 % of water with N2 (99.999 %). Two 0.5 mL replicates of the equilibrated headspace were analyzed for their concentrations of CH4, using a Bruker GC-456 gas chromatograph (GC) equipped with flame ionization and thermal conductivity detectors. After every 10 samples, a calibration of the detectors was performed using Air Liquid gas standards (i.e., 145 ppmv). Duplicate injection of the samples showed that results were reproducible within ±5 %. The specific gas solubility for CH4 (Yamamoto et al., 1976) was used in calculation of total CH4 content in the vials and then recalculated to µmol L−1 of the initial waters.
2.3 Chemical analyses of the river water
The dissolved oxygen (CellOx 325; accuracy of ±5 %), specific conductivity (TetraCon 325; ±1.5 %), and water temperature (±0.2 ∘C) were measured in situ at 20 cm depth using a WTW 3320 multimeter. The pH was measured using a portable Hanna instrument via a combined Schott glass electrode calibrated with NIST buffer solutions (4.01, 6.86, and 9.18 at 25 ∘C), with an uncertainty of 0.01 pH units. The temperature of buffer solutions was within ±5 ∘C of that of the river water. The water was sampled in a pre-cleaned polypropylene bottle from 20–30 cm depth in the middle of the river and immediately filtered through disposable single-use sterile Sartorius filter units (0.45 µm pore size). The first 50 mL of filtrate was discarded. The DOC and dissolved inorganic carbon (DIC) were determined by a Shimadzu TOC-VSCN analyzer (Kyoto, Japan) with an uncertainty of 3 % and a detection limit of 0.1 mg L−1. Blanks of Milli-Q water passed through the filters demonstrated negligible release of DOC from the filter material.
2.4 Flux calculation
CO2 flux () was calculated following Cai and Wang (1998):
where Kh is Henry's constant corrected for temperature and pressure (), is the gas exchange velocity at a given temperature, Cwater is the water CO2 concentration, and Cair is the CO2 concentration in the ambient air. In order to convert CO2 concentration in water and air into CO2 partial pressure, we followed Wanninkhof et al. (1992) and Lauerwald et al. (2015). We used the average CO2 concentrations of 402 ppm in May–June 2016 (from 129 stations all over the world, https://community.wmo.int/wmo-greenhouse-gas-bulletins, last access: 3 September 2021), which is consistent with the value recorded at the nearest Tiksi station in 2016 (404±0.9 ppm; Ivakhov et al., 2019). Temperature-specific solubility coefficients were used to calculate respective CO2 concentrations in the water following Wanninkhof et al. (1992). To standardize to a Schmidt number of 600, we used the following equation (Alin et al., 2011; Vachon et al., 2010):
where is CO2 Schmidt number for a given temperature (t, ∘C) in the freshwater (Wanninkhof, 1992):
The exponent n (Eq. 2) is a coefficient that describes water surface ( for a smooth water surface regime and for a rippled and a turbulent one), and the Schmidt number for 20 ∘C in freshwater is 600. We used because all water surfaces of sampled rivers were considered flat and had a laminar flow (Alin et al., 2011; Jähne et al., 1987) with wind speed always below 3.7 m s−1 (Guérin et al., 2007).
In this study, we used a (a median gas transfer coefficient) value of 4.464 m d−1 measured in the four largest rivers of the Western Siberia Lowland (WSL) in June 2015 (Ob', Pur, Pyakupur, and Taz rivers; Karlsson et al., 2021). These rivers are similar to Lena and its tributaries in size but exhibit lower velocity than those of the Lena River. In fact, due to more mountainous relief, the Lena River main stem and tributaries present much higher turbulence than that of the Ob River and tributaries, and as such the value used in this study can be considered rather conservative. This value is consistent with the reported for the Kolyma River and its large tributaries (3.9±2.5 m d−1; Denfeld et al., 2013), tributaries and main stem of the Yukon River basin (4.9–7.6 m d−1; Striegl et al., 2012), large rivers in the Amazon and Mekong basins (3.5±2.1 m d−1; Alin et al., 2011) and with modeling results of k for large rivers across the world (3–4 m d−1; Raymond et al., 2013). Note that decreasing the k to the most conservative value of 3 m d−1 of Raymond et al. (2013) will decrease specific emissions by ca. 30 %.
Instantaneous diffusive CH4 fluxes were calculated using an equation similar to Eq. (1) with k from western Siberia rivers (Serikova et al., 2018), concentrations of dissolved CH4 in the water, and an air–water equilibrium pCH4 concentration of 1.8 ppm, and mean annual pCH4 concentration in the air for 2016 (Mauna Loa Observatory ftp://aftp.cmdl.noaa.gov/products/trends/ch4/ch4_annmean_gl.txt) following standard procedures (Serikova et al., 2018, 2019).
2.5 Landscape parameters and water surface area of the Lena basin
The physio-geographical characteristics of the 20 Lena tributaries sampled in this study and the two points of the Lena main stem (upstream and downstream of the Aldan, Table S1) were determined by applying available digital elevation model (DEM GMTED2010), soil, vegetation, lithological, and geocryological maps. The landscape parameters were typified using the TerraNorte Database of Land Cover of Russia (Bartalev et al., 2011). This included various types of forest (evergreen, deciduous, needleleaf/broadleaf), grassland, tundra, wetlands, water bodies, and other areas. The climate and permafrost parameters of the watershed were obtained from CRU grid data (1950–2016) (Harris et al., 2014) and NCSCD data (https://doi.org/10.5879/ecds/00000001, Hugelius et al., 2013), respectively, whereas the biomass and soil OC content was obtained from the BIOMASAR2 (Santoro et al., 2010) and NCSCD databases. The lithology layer was taken from the GIS version of the geological map of the Russian Federation (scale 1:5 000 000, http://www.geolkarta.ru/, last access: 3 September 2021). To test the effect of carbonate rocks on dissolved C parameters, we distinguished acidic crystalline, terrigenous silicate rocks and dolostones, and limestones of upper Proterozoic, Cambrian, and Ordovician age. We quantified river water surface area using the global SDG database with 30 m2 resolution (Pekel et al., 2016) including both seasonal and permanent water for the open water period of 2016 and for the multiannual average (reference period 2000–2004). We also used a more recent GRWL Mask Database which incorporates first-order wetted streams (Allen and Pavelsky, 2018).
The Pearson rank order correlation coefficient (Rs, p<0.05) was used to determine the relationship between CO2 concentrations and climatic and landscape parameters of the Lena River tributaries. Further statistical treatment of CO2, DIC, and DOC concentration drivers in river waters included a principal component analysis, which allowed us to test the effect of various hydrochemical and climatic parameters on the dissolved C pattern. For the principal component analysis (PCA) treatment, all variables were normalized as necessary in the standard package of STATISTICA-7 (http://www.statsoft.com, last access: 3 September 2021) because the units of measurement for various components were different. The factors were identified via the raw data method. To run the scree test, we plotted the eigenvalues in descending order of their magnitude against their factor numbers. There was significant decrease in the PCA values between F1 and F2, suggesting that a maximum of two factors were interpretable.
3.1 CO2, CH4, DIC, and DOC in the main stem and Lena tributaries and C emission fluxes
The main hydrological C parameters of the Lena River and its tributaries (pCO2, CH4, pH, DIC, and DOC) are listed in Tables 1 and 2. Continuous pCO2 measurements in the main stem (4285 individual data points) averaged for each 20 km interval over the full distance of the boat route demonstrated a sizable increase (from ca. 380 to 1040 µatm) in pCO2 northward (Fig. 2). There was a positive correlation between the pCO2 and distance from the headwaters of the Lena River (r=0.625, p<0.01, Fig. 3a). The CH4 concentration was low (0.054±0.023 and 0.061±0.028 µmol L−1 in the Lena River and 20 tributaries, respectively) and did not change appreciably along the main stem and among the 20 tributaries (Fig. 3b). The DOC concentration did not demonstrate any systematic variations over the main stem (10.5±2.4 mg L−1, Fig. 3c); however it was higher and more variable in tributaries (15.8±8.6 mg L−1). The DIC concentration decreased about 5-fold from the headwaters to the middle course of the Lena River (Fig. 3d), and pH decreased by 0.8 units downstream (Fig. 3e).
Table 1Measured water temperature, pCO2, calculated CO2 flux, CH4, DOC, and DIC concentrations and pH in the Lena River main stem (average±SD; (n) is number of measurements).
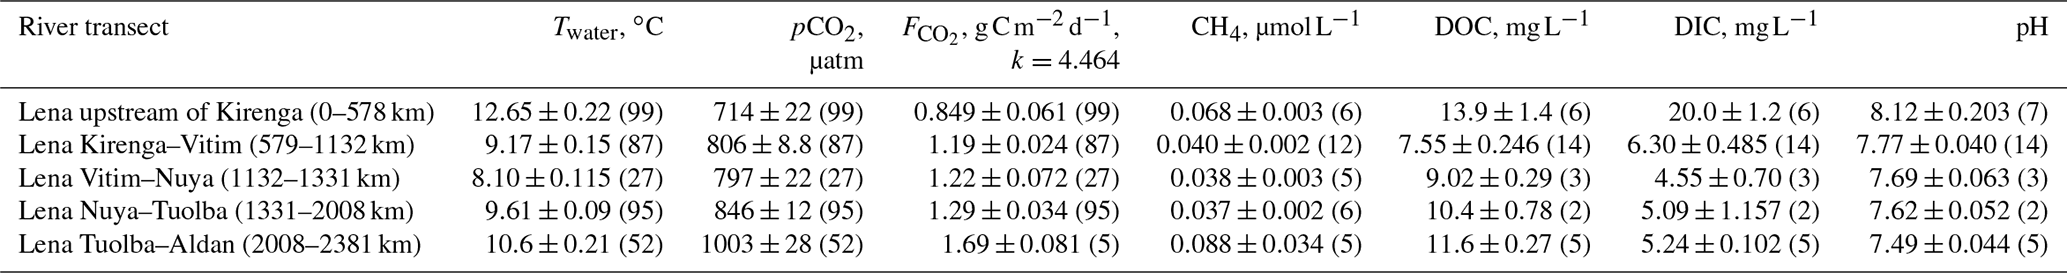
Table 2Measured water temperature, pCO2, calculated CO2 flux, CH4, DOC, DIC concentration, and pH in the tributaries (average±SD; (n) is number of measurements).

In all tributaries except Aldan, there was only one measurement of CH4, DOC, DIC, and pH.
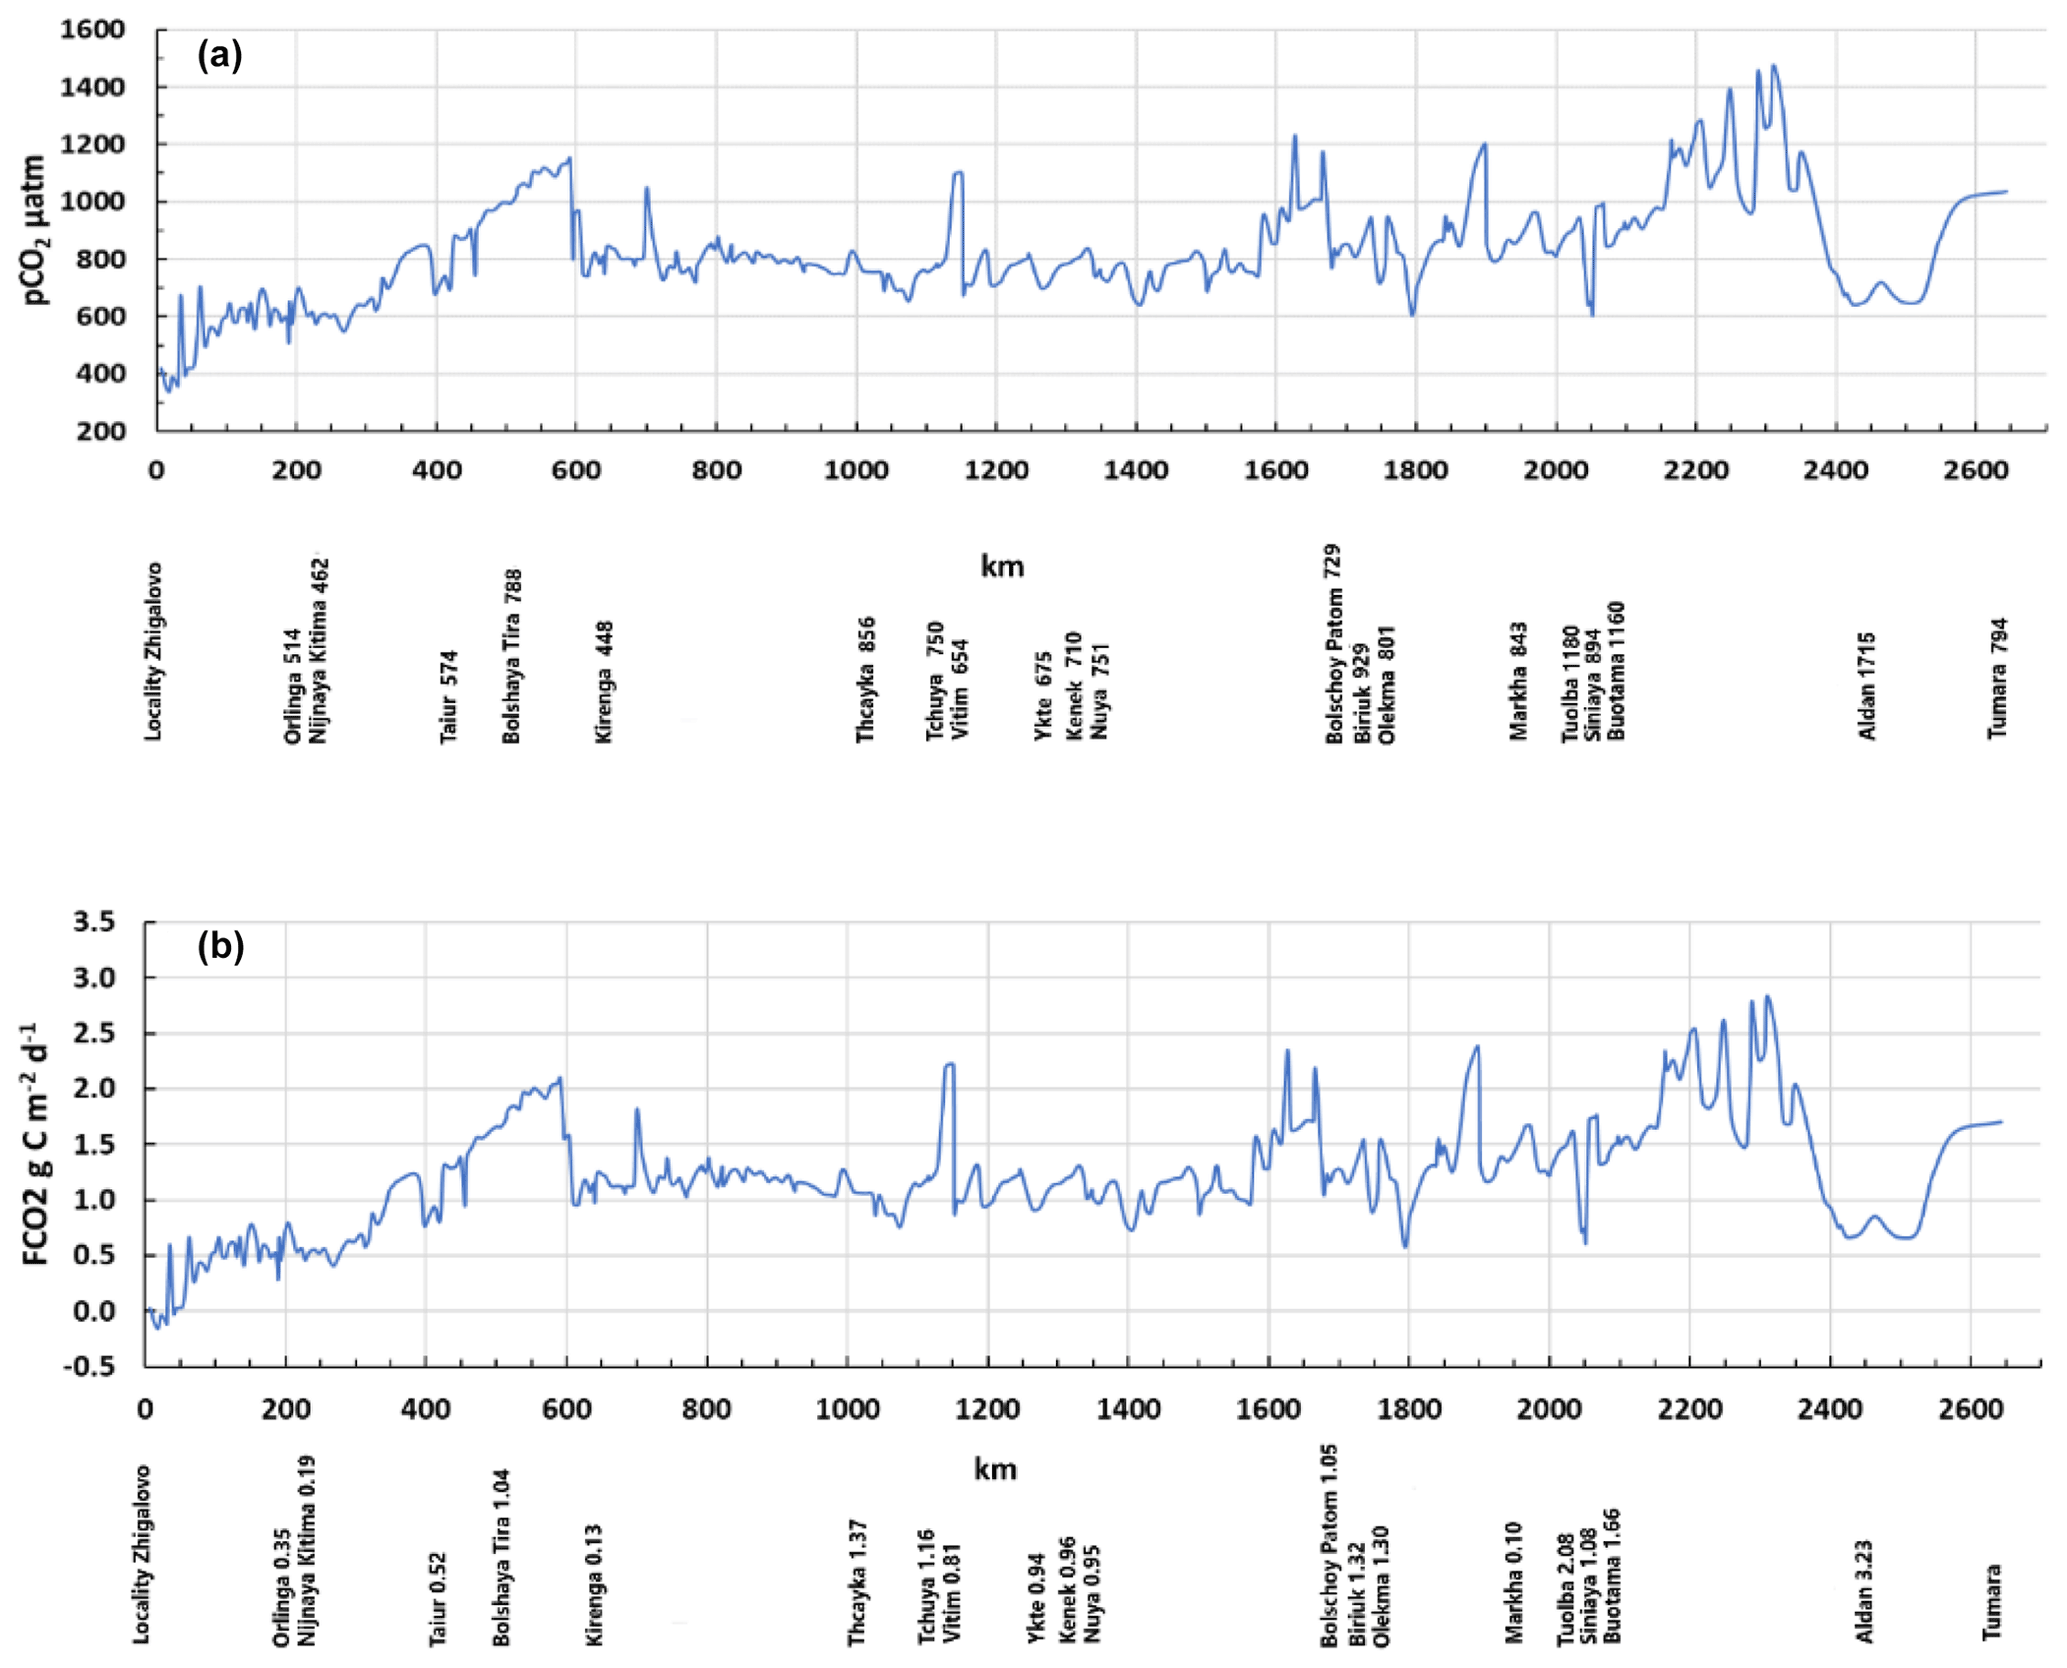
Figure 2A 20 km averaged pCO2 profile (a) and calculated CO2 fluxes (b) of the Lena River main stem of over 2600 km distance, from Zhigalovo to the Tumara River. The average pCO2 (µatm) and fluxes () of the main sampled tributaries are provided as numbers below the x axis. Note that peaks of CO2 concentration at the main stem are not linked to conflux with tributaries.
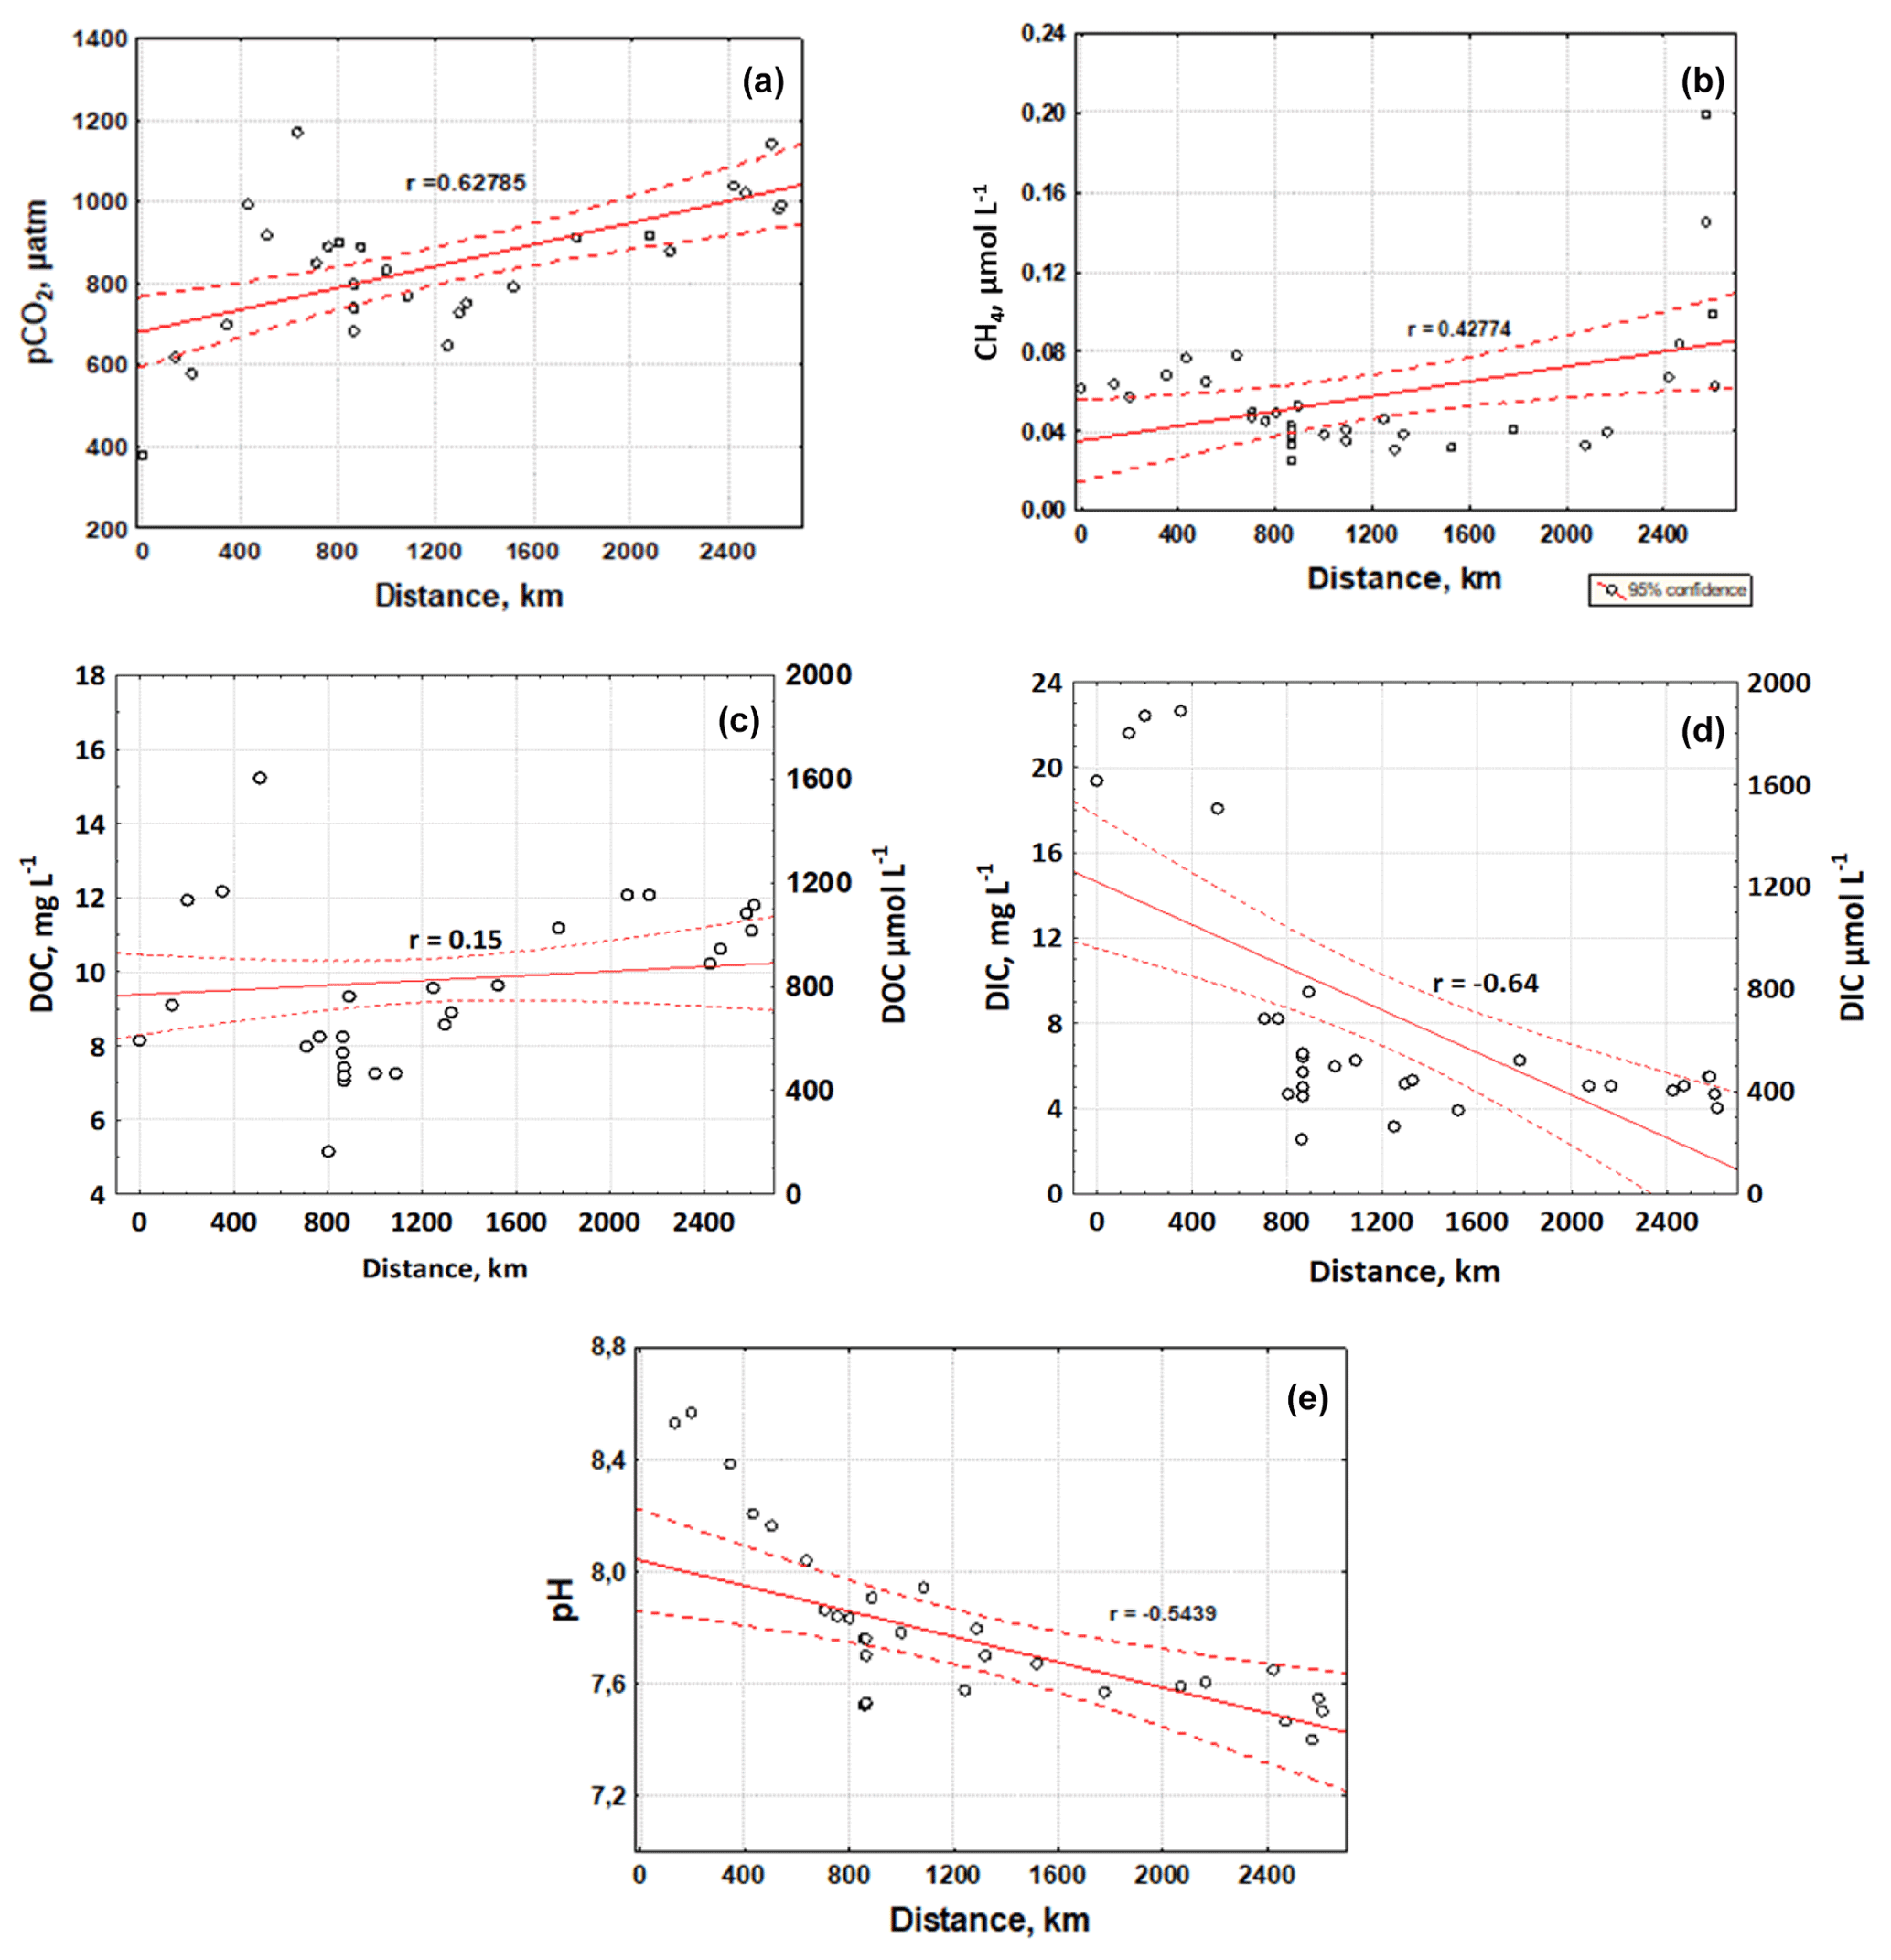
Figure 3Averaged (over 20 km distance) CO2 (a), CH4 (b), DOC (c), DIC (d), and pH (e) concentration over the distance of the boat route at the Lena River, from the southwest to northeast.
Generally, the concentrations of DOC measured in the present study during the peak of the spring flood are at the highest range of previous assessments during summer baseflow (around 5 mg L−1; range of 2 to 12 mg L−1; Cauwet and Sidorov, 1996; Lara et al., 1998; Lobbes et al., 2000; Kuzmin et al., 2009; Kutscher et al., 2017). The DIC concentration in the main stem during spring flood was generally lower than that reported during summer baseflow (around 10 mg L−1; range of 5 to 50 mg L−1) but consistent with values reported in Yakutsk during May and June period (7 to 20 mg L−1, Sun et al., 2018). A sizable decrease in DIC concentration between the headwaters (first 500 km of the river) and the Lena River middle course was also consistent with the alkalinity pattern reported in previous works during summer baseflow (Pipko et al., 2010; Semiletov et al., 2011). For the Lena River tributaries, the most comprehensive data set on major ions was acquired in July–August of 1991–1996 by Huh and Edmond's group (Huh and Edmond, 1999; Huh et al., 1998a, b) and by Sun et al. (2018) in July 2012 and at the end of June 2013. For most tributaries, the concentration of DIC was a factor of 2 to 5 lower during the spring flood compared to summer baseflow. This result can be explained by the strong dilution of carbonate-rich groundwaters feeding the river in spring high flow compared to summer low flow.
The measured pCO2 in the river water and published (Karlsson et al., 2021) gas transfer coefficient (4.46 m d−1) allowed for calculation of the CO2 fluxes over the full length of the studied main stem (2600 km) and the sampled tributaries. Calculated CO2 fluxes of the main stem and tributaries ranged from zero and slightly negative (uptake) values in the most southern part of the Lena River and certain tributaries (northern Katyma) to between 0.5–2.0 in the rest of the main stem and tributaries (Tables 1 and 2; Fig. 2b). The largest part of the Lena River main stem, 1429 km from Kirenga to Tuolba, exhibited a quite stable flux of 1.1±0.2 . In the last ∼400 km part of the Lena River main stem studied in this work, from Tuolba to Aldan, the calculated fluxes increased to 1.7±0.08 .
The river water concentrations of dissolved CH4 in the tributaries and the main channel (0.059±0.006; interquartile (IQR) range from 0.025 to 0.199 µmol L−1; Tables 1 and 2) did not exhibit any trend with distance from headwaters or landscape parameters of the catchments. These values are consistent with the range of CH4 concentration in the low reaches of the Lena River main channel (0.03–0.085 µmol L−1; Bussman, 2013) and are 100–500 times lower than those of CO2. Consequently, diffuse CH4 emissions constituted less than 1 % of total C emissions and are not discussed in further detail.
3.2 Diurnal (night–day) pCO2 variations and spatial variations across the river transect
The continuous diel CO2 measurements of three tributaries (Kirenga, Tuolba, and Aldan) and 14 sites of the Lena River main channel showed generally modest variation with diurnal range within 10 % of the average pCO2 (Figs. 4 and S2 in the Supplement). The observed variations in pCO2 between day and night were not linked to water temperature (p>0.05), which did not vary more than 1–2 ∘C between the day and night periods.

Figure 4Continuous pCO2 concentration in the Lena River and two tributaries from late afternoon to morning the next day. The red part of the line represents nighttime. Variations in water temperature did not exceed 2 ∘C.
The spatial variations in hydrochemical parameters were tested in the upper reaches of the Lena main stem and its largest tributary – the Aldan River (Fig. S3 in the Supplement). In the Lena River, over a lateral distance of 550 m across the riverbed, the pCO2 and CH4 concentrations were equal to 569±4.6 µatm and 0.0406±0.0074 µmol L−1, respectively, whereas the DIC and DOC concentrations varied <15 % (n=5). In the Aldan River, over a 2700 m transect across the flow, the pCO2 and CH4 concentrations were equal to 1035±95 µatm and 0.078±0.00894 µmol L−1, respectively, whereas DIC and DOC varied within <20 % (n=4). Overall, these results supported our design of punctual (snap shot) sampling in the middle of the river.
3.3 Impact of catchment characteristics on pCO2 in tributaries of the Lena River
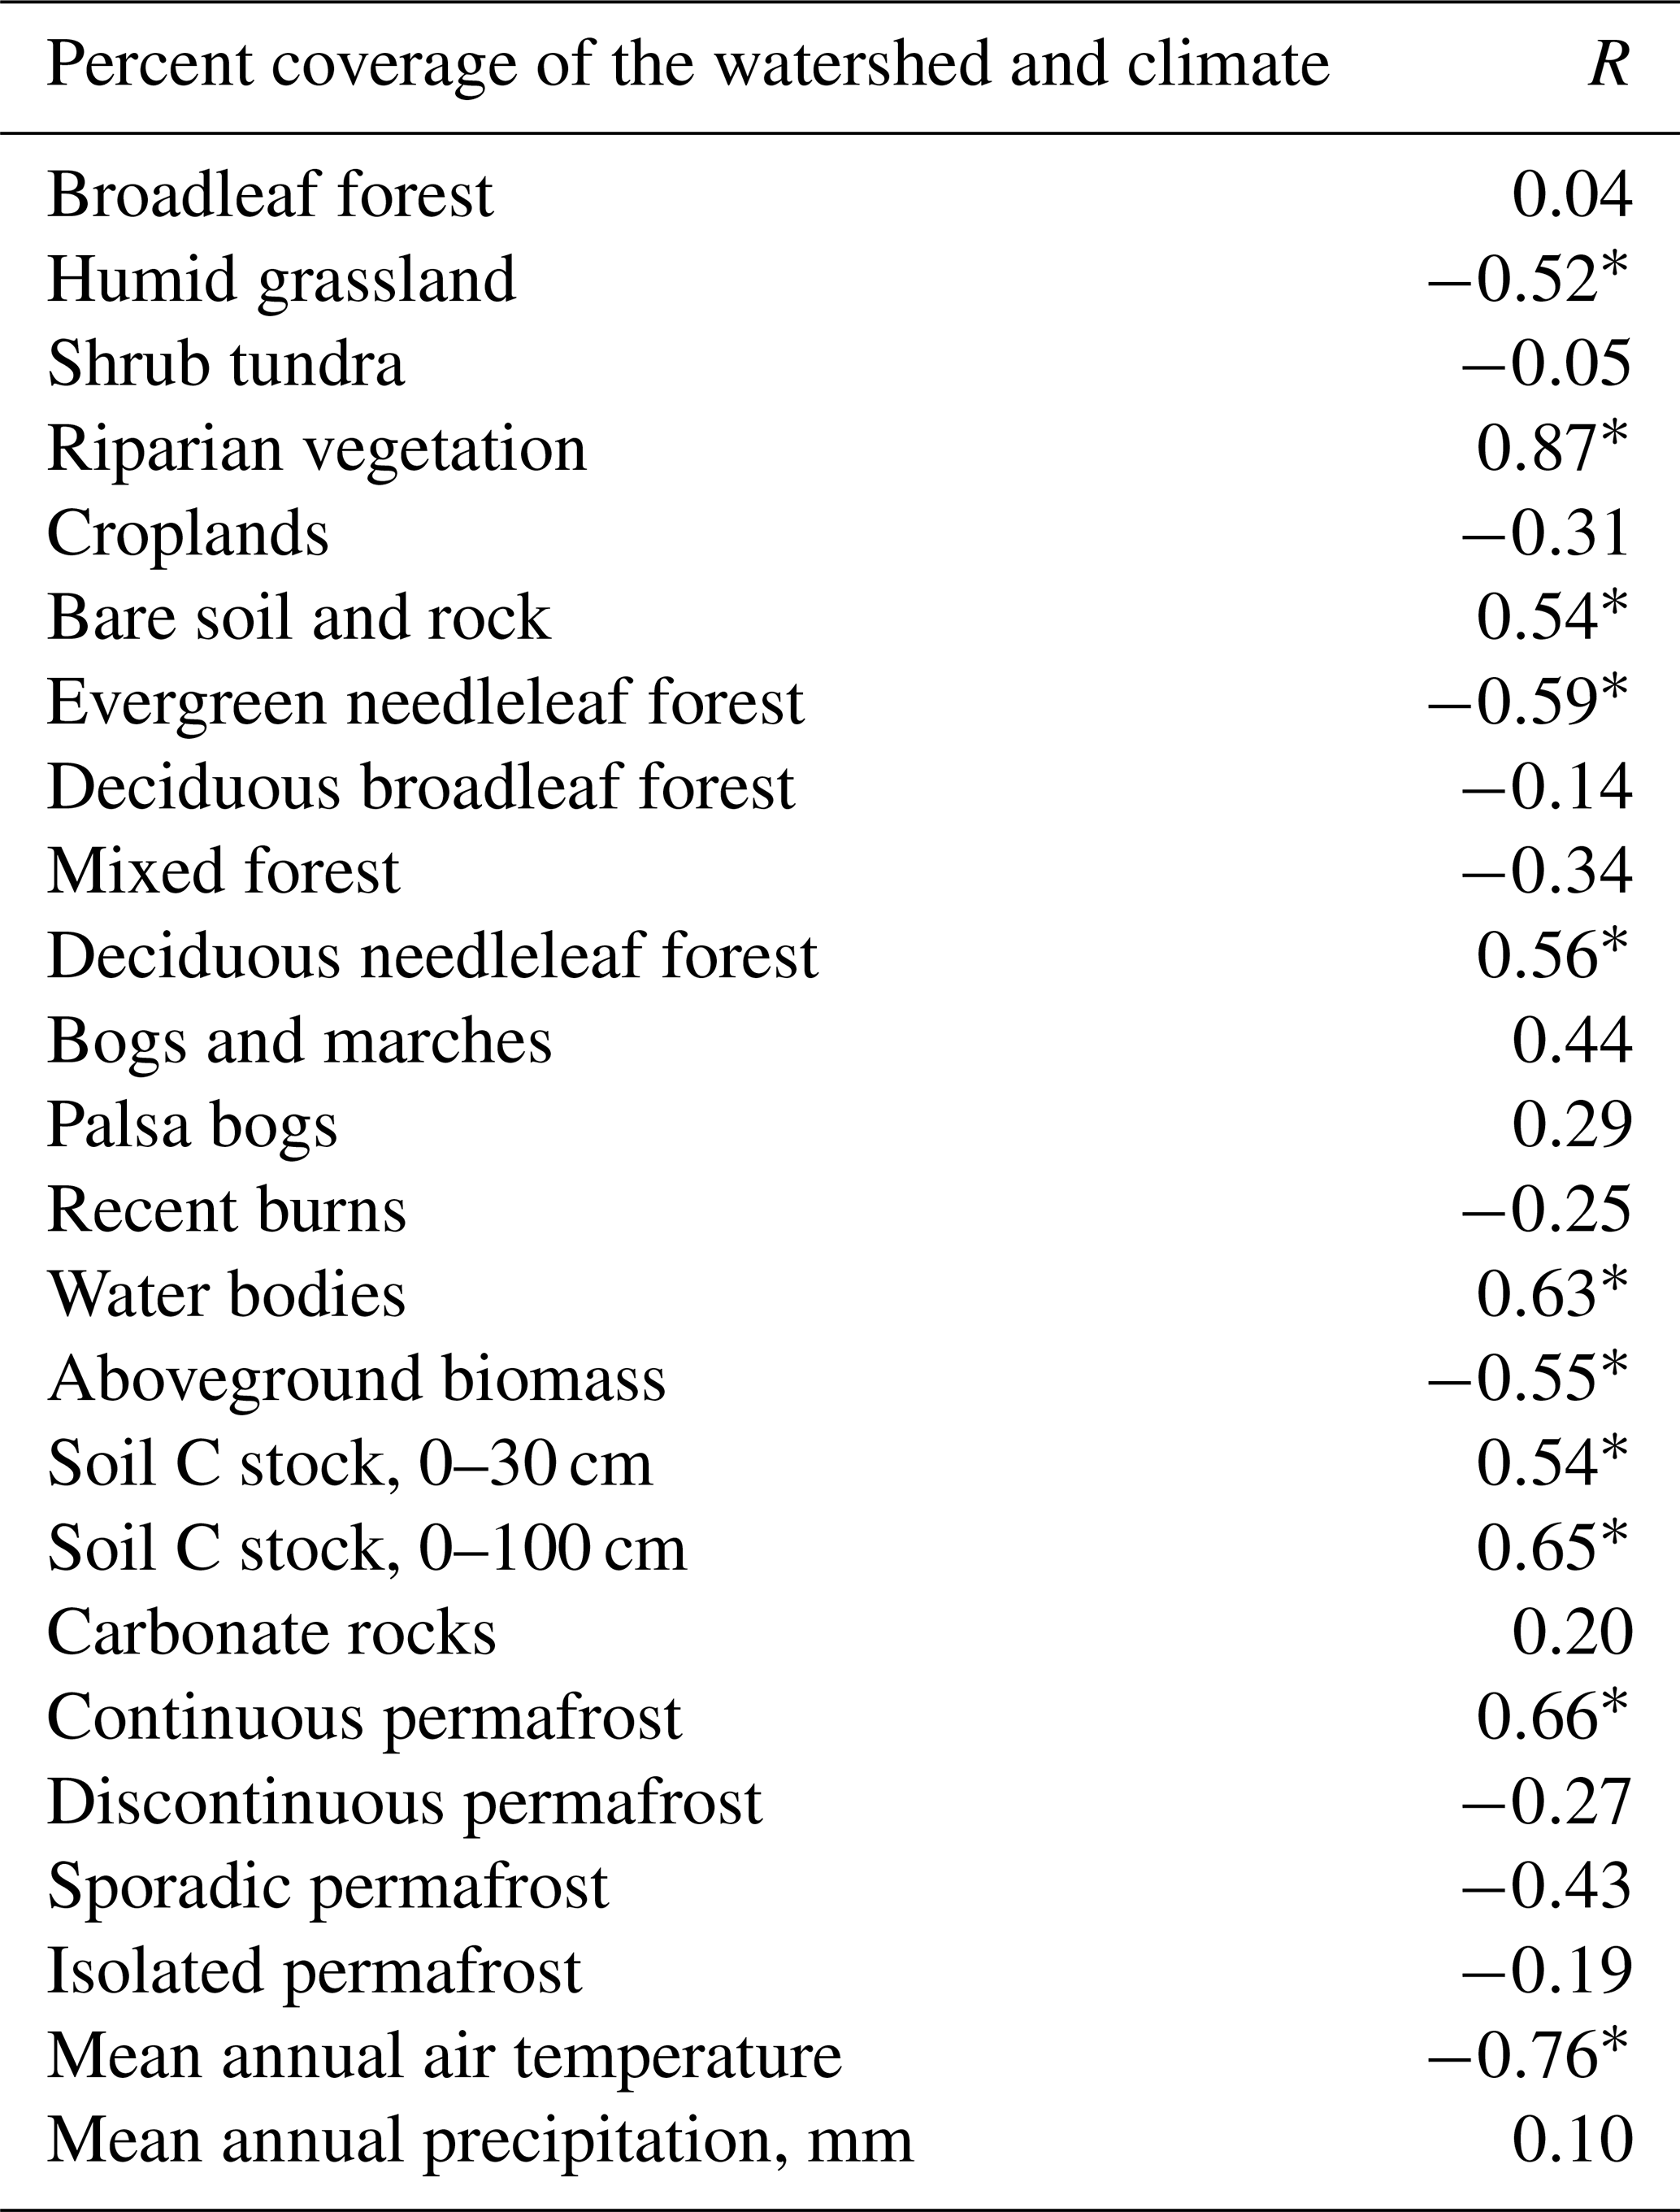
The CO2 concentration in the Lena River main stem and tributaries increased from the southwest to northeast (Tables 1 and 2; Fig. 2), and this was reflected in a positive (R=0.66) correlation between CO2 concentration and continuous permafrost coverage and a negative () correlation with MAAT (Table 3). Among different landscape factors, C stock in the upper 0–30 and 0–100 cm of soil, proportion of riparian vegetation and bare rocks, coverage by deciduous needleleaf forest, and coverage of river watershed by water bodies (mostly lakes) exhibited significant (p<0.01, n=19) positive correlations () with average pCO2 of the Lena River tributaries (Fig. 5). The other potentially important landscape factors of the river watershed (proportion of peatland and bogs, tundra coverage, total aboveground vegetation, type of permafrost, annual precipitation) did not significantly impact the CO2 concentration in the Lena River tributaries (Table 3).

Figure 5Significant (p<0.05) positive control of landscape parameters – OC stock in 0–100 cm of soil (a), and proportion of deciduous needleleaf forest (b), riparian vegetation (c), and bare soil and rock (d) in the watershed for pCO2 in the Lena River tributaries.
Table 3Pearson correlation coefficients (R) between pCO2 and landscape parameters of the Lena tributaries. Significant correlations (p<0.05) are marked by an asterisk. Methane concentration did not exhibit any significant correlation with all tested parameters.
Further assessment of landscape factor control on C parameters of the river water was performed via a PCA. This analysis basically confirmed the results of linear regressions and revealed two factors capable of explaining only 12.5 % and 3.5 % of variability (Fig. S4 in the Supplement). The F1 strongly acted on the sample location at the Lena transect, the content of OC in soils, the watershed coverage by deciduous needleleaf forest and shrubs, riparian vegetation (a proxy for the width of the riparian zone) and proportion of tundra, bare rock and soils, water bodies, peatland, and bogs (>0.90 loading). The pCO2 was significantly linked to F1 (0.72 loading).
3.4 Areal emission from the Lena River basin
The areal emission of CO2 from the lotic waters of the Lena River watershed were assessed based on total river water coverage of the Lena basin in 2016 (28 197 km2, of which 5022 km2 is seasonal water, according to the global SDG database). This value is consistent with the total river surface area from the GRWL Mask database (22 479 km2). Given that the measurements were performed at the peak of the spring flood in 2016, we used the maximal water coverage of the Lena River basin.
Based on past calculated pCO2 of the Lena River (400–1000 µatm; Semiletov, 1999; Semiletov et al., 2011; Pipko et al., 2010), both the seasonality and spatial differences downstream are relatively small. Indeed, for the lower reaches of the Lena River, from Yakutsk to the Lena Delta, Semiletov (1999) and Semiletov et al. (2011) reported, for August–September 1995, an average pCO2 of 538±96 µatm (range 380–727 µatm). This value is very similar to the one obtained in July 2003 for the low reaches of the Lena (559 µatm, Pipko et al., 2010). Over the full length of the Lena River, from Ust-Kut to the Lena mouth, Pipko et al. (2010) reported an average pCO2 of 450±100 µatm in June–July 2003. At the same time, calculated pCO2 values from previous field campaigns are generally lower than the pCO2 of the Lena River main stem directly measured in this study: 700–800 µatm for the Ust-Kut–Nuya segment (1331 km) and 845–1050 µatm for the Nuya–Aldan segment (1050 km).
Thus, despite the absolute values of calculated pCO2 involving uncertainties (our calculated–measured pCO2 ratio in the Lena River main channel and tributaries equaled 0.67±0.15 (n=47)), this suggests spatial and temporal stability of the pCO2 in the Lena River waters and allows for extrapolation of the measured pCO2 in the Lena River from Yakutsk to Aldan to the lower reaches of the river. As for the Lena tributaries, to the best of our knowledge there is no published information on pCO2 concentration and emission. Overall, the major uncertainty in estimation of the Lena River basin emission stems from a lack of direct pCO2 measurements in the northern part of the main channel over ca. 1000 km downstream of the Aldan River including the large tributary Vilyi. Further, we noted that the largest northern tributary, the Aldan River providing 70 % of the springtime discharge of the Lena River (Pipko et al., 2010), demonstrated sizably higher emissions compared to the Lena River main channel upstream of Aldan (3.2±0.5 and 1.69±0.08 , respectively).
For areal emission calculations, we used the range of CO2 emissions from 1 to 2 , which covers full variability of both large and small tributaries and the Lena River main channel (Tables 1 and 2, Fig. 2b). This estimation assumes lack of pCO2 dependence on the size of the watershed in the Lena basin as confirmed by our data (Fig. S5 in the Supplement). For an alternative areal emission calculation, we explicitly took into account the water area of the main stem (43 % relative to the total water area of the Lena catchment), and we introduced the partial weight of emission from the three largest tributaries (Aldan, Olekma, and Vitim) according to their catchment surface areas (43 %, 12 %, and 14 % of all sampled territory, respectively). We summed up the contribution of the Lena River main stem and the tributaries, and we postulated the average emission from the main stem upstream of Aldan (1.25±0.30 ) as representative of the whole Lena River. This resulted in an updated value of 1.65±0.5 , which is within the range of 1 to 2 assessed previously. Note that this value is most likely underestimated because emissions from the main stem downstream of Aldan are at least 10 % higher (Table 1, Fig. 1b).
For the 2 months of maximal water flow (middle of May–middle of July), the C emission from the whole Lena basin equates to 2.8±0.85 Tg C, which is 20 % to 30 % of the DOC and DIC lateral export to the Arctic Ocean. Assuming 6 months of open water period and no emission during winter, this yields 8.3±2.5 Tg C yr−1 of annual emission for the whole Lena River basin (2 490 000 km2), with a total lotic water area of 28 100 km2. Considering the only 23 200 km2 of water area in July–October (and maximal water coverage in May–June), these numbers decrease by 12 %, which is below the uncertainties associated with our evaluation.
4.1 Possible driving factors of CO2 pattern in the Lena River basin
Generally, the SW-to-NE increase in CO2 concentrations and fluxes of the tributaries was consistent with the CO2 pattern in the main stem (Fig. 2; Tables 1 and 2) and thus can be considered a specific feature of CO2 exchange between lotic waters and atmosphere in the studied part of the Lena Basin. At the same time, there were sizable local variations (peaks) in CO2 concentration of the main stem along the sampling route (Fig. 2a). Peaks shown on the diagram of the main stem are not necessarily linked to CO2-rich tributaries but likely reflect local processes in the main stem, including lateral influx from the shores and shallow subsurface waters, which is typical for permafrost regions of forested Siberian watersheds (i.e., Bagard et al., 2011). Given that the data were averaged over a ∼20 km distance, we believe that these peaks are not artifacts but reflect local heterogeneity of the pCO2 pattern in the main stem (turbulence, suprapermafrost water discharge, sediment resuspension, and respiration). Note that such a heterogeneity was not observed in the tributaries, at least at the scale of our spatial coverage (see Figs. S1B and S3).
The PCA demonstrated an extremely low ability to describe the data variability (12 % by F1 and only 3.5 % by F2). We believe that the most likely reason for weak PCA capacity is the rather homogeneous distribution of CO2 and CH4 among the tributaries, primarily linked to the specific hydrological period studied in this work – the spring flood. During this high-flow period, the local lithological and soil heterogeneities among tributaries or the segments of the main stem virtually disappear, and surface flow (via vegetation leaching) becomes the most important driver of riverine chemistry, as is known from adjacent permafrost territories in central Siberia (i.e., Bagard et al., 2011). Nevertheless, some specific features of the data structure could be established. The first factor, significantly linked to pCO2 (0.72 loading), strongly acted on the sample location at the Lena transect, the watershed coverage by deciduous needleleaf forest and shrubs, riparian vegetation, and also the proportion of tundra, bare rock and soils, water bodies, peatland, and bogs (>0.90 loading). This is fully consistent with spatial variation in pCO2 along the permafrost and climate gradient in the main channel and sampled tributaries. Positive loading of riparian vegetation, peatlands, and bogs on F1 (0.927 and 0.989, respectively) could reflect a progressive increase in the feeding of the river basin by mire waters, an increase in the proportion of needleleaf deciduous trees and in the width of the riparian zone from the SW to the NE direction.
Lack of sizable variation in pCO2 between the day and night periods or across the riverbed suggests quite low site-specific and diurnal variability. It may be indicative of a negligible role of primary productivity in the water column given the low water temperatures, shallow photic layer of organic-rich and turbid waters, and lack of periphyton activity during high flow of the spring flood. The pCO2 increased by a factor of 2 to 4 along the permafrost–temperature gradient from the southwest to the northeast, for both the main channel and sampled tributaries. This may reflect a progressive increase in the feeding of the river basin by mire waters, an increase in the proportion of needleleaf deciduous forest, and an increase in the width of the riparian zone. Another strong correlation is observed between the stock of OC in soils (both 0–30 and 0–100 cm depth) and the pCO2 of Lena tributaries. Organic-rich soils are widely distributed in the central and northern parts of the basin. The most southern part of the Lena basin is dominated by carbonate rocks and crystalline silicates in generally mountainous terrain, where only thin mineral soils are developed. The northern (downstream of the Olekma River) part of the basin consists of soils developed on sedimentary silicate rocks as well as vast areas of easily eroded yedoma soils. It is likely that both organic matter mineralization in OC-rich permafrost soils and lateral export of CO2 from these soils, together with particulate and dissolved OC export and mineralization in the water column, are the main sources of CO2 in the river water. Although some studies have demonstrated high lability of dissolved organic matter (DOM) in arctic waters (Cory et al., 2014; Ward et al., 2017; Cory and Kling, 2018), others suggest that DOM photo- and bio-degradation are low and do not support the major part of CO2 supersaturation in water (Shirokova et al., 2019; Payandi-Rolland et al., 2020; Laurion et al., 2021). Note that we have not observed any significant relationship between the DOC and pCO2 in the Lena River and tributaries (Fig. S6A). Lack of such a correlation and absence of diurnal pCO2 variations imply that in-stream processing of dissolved terrestrial OC is not the main driver of CO2 supersaturation in the river waters of the Lena River basin. Furthermore, a lack of lateral (across the riverbed) variations in pCO2 does not support a sizable input of soil waters from the shore, although we admit that much higher spatial coverage along the river shore is needed to confirm this hypothesis.
The role of underground water discharge in regulating pCO2 pattern of the tributaries is expected to be most pronounced in the SW part of the basin (Lena headwaters), where carbonate rocks of the basement would provide sizable amounts of CO2 discharge in the riverbed. However, there was no relationship between the proportion of carbonate rocks on the watershed and the pCO2 in the tributaries (Fig. S6B). Furthermore, for the Lena River main stem, the lowest CO2 concentrations were recorded in the upper reaches (first 0–800 km) where carbonate rocks dominate. Altogether, this makes the impact of CO2 from underground carbonate reservoirs on river water CO2 concentrations unlikely. This is further illustrated by a lack of correlation between pCO2 and DIC or pH (Fig. S7A of the Supplement). The pH did not control the CO2 concentration in the main stem and only weakly impacted the CO2 in the tributaries (Fig. S7B). The latter could reflect an increase in pCO2 in the northern tributaries, which exhibited generally lower pH compared to the SW tributaries hosted within the carbonate rocks. Overall, such low correlations of CO2 with DIC and pH reflected a generally low predictive capacity to calculate pCO2 from measured pH, temperature, and alkalinity (see Sect. 3.4).
Therefore, other sources of riverine CO2 may include particulate organic carbon processing in the water column (Attermeyer et al., 2018), river sediments (Humborg et al., 2010), and riparian zone (Leith et al., 2014, 2015), which require further investigation. In addition, although there was no sizable variation in pCO2 between the day and night periods or across the riverbed, the flux could show different spatial and temporal patterns if k shows larger variability (see Beaulieu et al., 2012). This calls for a need of direct flux measurements in representative rivers and streams of the Lena River basin. Overall, the present study demonstrates highly dynamic and non-equilibrium behavior of CO2 in the river waters, with possible hot spots from various local sources. For these reasons, in situ, high-spatial-resolution measurements of CO2 concentration in rivers – such as those reported for the Lena Basin in this study – are crucially important for quantifying the C emission balance in lotic waters of high latitudes.
4.2 Areal emission from the Lena River basin vs. lateral export to the Arctic Ocean
The estimated CO2 emissions from the Lena River main channel over 2600 km distance (0.8–1.7 ) are comparable to values directly measured in rivers and streams of the continuous permafrost zone of western Siberia (0.98 ; Serikova et al., 2018), the Kolyma River (0.35 in the main stem; 2.1 for lotic waters of the basin), and the Ob River main channel (1.32±0.14 in the permafrost-free zone; Karlsson et al., 2021). At the same time, the Lena River flux () values are lower than typical emissions from running waters in the contiguous Unites States (3.1 ; Hotchkiss et al., 2015), small mountain streams in northern Europe (3.3 ; Rocher-Ros et al., 2019), and small streams of the northern Kolyma River (6 to 7 ; Denfeld et al., 2013) and Ob River in the permafrost-affected zone (3.8 to 5.4 ; Karlsson et al., 2021). In contrast to the main stem, the range of in the tributaries is larger (0.2 to 3.2 ) and presumably reflects a strong variability in environmental conditions across a sizable landscape and climate transect.
Total C emissions from other major eastern Eurasian permafrost-draining rivers (i.e., sum of Kolyma, Lena, and Yenisei rivers) based on indirect estimates (40 Tg C yr−1, Raymond et al., 2013) are generally supportive of the estimations of the Lena River in this study (5 to 10 Tg C yr−1). At the same time, the C emissions from the Lena River basin (28 100 km2 water area) are lower than those of the lotic waters of western Siberia (30 Tg C yr−1 for 33 389 km2 water area; Karlsson et al., 2021). The latter drain through thick, partially frozen peatlands within the discontinuous, sporadic, and permafrost-free zones, which can cause high OC input and processing and, thus, enhanced C emissions (Serikova et al., 2018).
Despite the high uncertainty on our regional estimations (due to lack of directly measured gas transfer values and low seasonal resolution), we believe that these estimations are conservative and can be considered first-order values pending further improvements. In order to justify extrapolation of our data to all seasons and the entire area of the Lena basin, we analyzed data for spatial and temporal variations in pCO2 of the Lena River main stem from available literature. From the literature there were three important findings. First, based on published data, the seasonal and spatial variabilities of pCO2 across the majority of the Lena River main stem are not high during the open water period, although the low reaches of the Lena River may exhibit higher emissions compared to the middle and upper courses (see Sect. 3.4). Second, although small mountainous headwater streams of the tributaries may exhibit high k due to turbulence, this could be counteracted by lower CO2 supply from low OC in mineral soil, lack of riparian zone, and scarce vegetation. Third, although these small streams (watershed area <100 km2) may represent >60 % of total watershed surfaces of the Lena basin (Ermolaev et al., 2018), their contribution to the total water surface is <20 % (19 % from combined analysis of DEM GMTED2010 and 16 % from the GRWL or the global SDG database as estimated in this study). Therefore, given that (i) within the stream–river continuum the CO2 efflux increases only 2-fold, demonstrating a discharge decrease by a factor of 10 000 (from 100 to 0.01 m3 s−1; Hotchkiss et al., 2015) and (ii) the watershed area had no impact on pCO2 in the river water (Fig. S5), this uncertainty is likely less important. As such, instead of integrating indirect literature data, we used the pCO2 values measured in the present study to calculate the overall CO2 emission from all lotic waters of the Lena basin.
The C evasion from the Lena basin assessed in the present work is comparable to the total (DOC+DIC) lateral export by the Lena River to the Arctic Ocean (10 Tg C yr−1 by Semiletov et al., 2011; or 11 Tg C yr−1 () by Cooper et al., 2008). Moreover, the C evasion strongly exceeds sedimentary C input to the Laptev Sea by all Siberian rivers (1.35 Tg C yr−1; Rachold et al., 1996, and Dudarev et al., 2006), the Lena River annual discharge of particulate organic carbon (0.38 Tg yr−1; Semiletov et al., 2011), and OC burial on the Kara Sea shelf (0.37 Tg C yr−1; Gebhardt et al., 2005).
Typical concentrations of CH4 in the Lena tributaries and the main channel are 100 to 500 times lower than those of CO2. Given that the global warming potential (GWP) of methane on a 100-year scale is only 25 times higher than that of CO2, the long-term diffuse methane emission from the Lena River basin is still 4 to 20 times lower than that of CO2. However, on a short-term scale (20 years), the GWP of methane can be as high as 96 (Alvarez et al., 2018), and its role in climate regulation becomes comparable to that of CO2. This has to be taken into account for climate modeling of the region.
The follow-up studies of this large heterogenous and important system should include CO2 measurements in (1) the low reaches of the Lena River, downstream of Aldan, where notably large organic-rich tributaries such as Vilyi (454 000 km2) and where the huge flood zone (20–30 km wide) with a large number of lakes and wetlands is developed, and (2) highly turbulent eastern tributaries of the Lena River downstream of Aldan, which drain the Verkhoyansk Ridge and are likely to exhibit elevated gas transfer coefficients.
Continuous pCO2 measurements over 2600 km of the upper and middle parts of the Lena River main channel and 20 tributaries during the peak of the spring flood allowed to quantify, for the first time, in situ pCO2 variations which ranged from 500 to 1700 µatm and exhibited a 2- to 4-fold increase in CO2 concentration northward. There was no major variation in pCO2 between the day and night periods or across the riverbed, which supports the chosen sampling strategy. The northward increase in pCO2 was correlated with an increased proportion of needleleaf deciduous trees, the width of the riparian zone, and the stock of organic C in soils. Among the potential drivers of riverine pCO2, changes in the vegetation pattern (northward migration of larch tree line in Siberia; Kruse et al., 2019) and soil OC stock are likely to be most pronounced during ongoing climate warming, and thus the established link deserves further investigation. The total C emission from the lotic waters of the Lena River basin ranges from 5 to 10 Tg C yr−1, which is comparable to the annual lateral export (50 % DOC, 50 % DIC) by the Lena River to the Arctic Ocean. However, these preliminary estimations of C emission should be improved by direct flux measurements across seasons in different types of riverine systems of the basin, notably in the low reaches of the Lena River.
All the data obtained in our study are listed in Tables 1 and 2. There are no other data sets associated with this work.
The supplement related to this article is available online at: https://doi.org/10.5194/bg-18-4919-2021-supplement.
SNV and OSP designed the study and wrote the paper. SNV, YYK, and OSP performed sampling, analysis, and their interpretation. MK performed landscape characterization of the Lena River basin and calculated water surface area. JK provided analyses of literature data, transfer coefficients for calculations, and global estimations of areal emission vs. export.
The contact author has declared that neither they nor their co-authors have any competing interests.
Publisher's note: Copernicus Publications remains neutral with regard to jurisdictional claims in published maps and institutional affiliations.
We acknowledge support from an RSF grant 18-17-00237_P, the Belmont Forum Project VULCAR-FATE, and the Swedish Research Council (no. 2016-05275). We thank the editor Ji-Hyung Park and the three anonymous reviewers for their very constructive comments. Chris Benker is thanked for English editing of a previous version of the paper.
This research has been supported by the Government Council on Grants, Russian Federation (grant no. 14.B25.31.0001) and the Försvarsdepartementet, Sveriges (grant no. 2016-05275).
This paper was edited by Ji-Hyung Park and reviewed by three anonymous referees.
Abril, G., Bouillon, S., Darchambeau, F., Teodoru, C. R., Marwick, T. R., Tamooh, F., Ochieng Omengo, F., Geeraert, N., Deirmendjian, L., Polsenaere, P., and Borges, A. V.: Technical Note: Large overestimation of pCO2 calculated from pH and alkalinity in acidic, organic-rich freshwaters, Biogeosciences, 12, 67–78, https://doi.org/10.5194/bg-12-67-2015, 2015.
Ahmed, R., Prowse, T., Dibike, Y., Bonsal, B., and O'Neil H.: Recent trends in freshwater influx to the Arctic Ocean from four major Arctic-draining rivers, Water, 12, 1189, https://doi.org/10.3390/w12041189, 2020.
Alin, S. R., Rasera, M. F. F. L., Salimon, C. I., Richey, J. E., Holtgrieve, G. W., Krusche, A. V., and Shidvongs, A.: Physical controls on carbon dioxide transfer velocity and flux in low-gradient river systems and implications for regional carbon budgets, J. Geophys. Res.-Biogeo., 116, G01009. https://doi.org/10.1029/2010jg001398, 2011.
Allen, G. H. and Pavelsky, T. M.: Global extent of rivers and streams, Science, 361, 585–588, https://doi.org/10.1126/science.aat0636, 2018.
Alvarez, R. A., Zavala-Araiza, D., Lyon, D. R., Allen, D. T., Barkley, Z. R., Brandt, A. R., Davis, K. J.,Herndon, S. C., Jacob, D. J., Karion, A., Kort, E. A., Lamb, B. K., Lauvaux, T., Maasakkers, J. D., Marchese, A. J., Omara, M., Pacala, S. W., Peischl, J., Robinson, A. L., Shepson, P. B.,Sweeney, C., Townsend-Small, A., Wofsy, S. C., and Hamburg, S. P.: Assessment of methane emissions from the U.S. oil and gas supply chain, Science, 361, 186–188, https://doi.org/10.1126/science.aar7204, 2018.
Attermeyer, K., Catalan, N., Einarsdottir, K., Freixa, A., Groeneveld, M., Hawkes, J. A., Bergquist, J., and Tranvik, L. J.: Organic carbon processing during transport through boreal inland waters: particles as important sites, J. Geophys. Res.-Biogeo., 123, 2412–2428, https://doi.org/10.1029/2018JG004500, 2018.
Bagard, M. L., Chabaux, F., Pokrovsky, O. S., Viers, J., Prokushkin, A. S., Stille, P., Rihs, S., Schmitt, A. D., and Dupre, B.: Seasonal variability of element fluxes in two Central Siberian rivers draining high latitude permafrost dominated areas, Geochim. Cosmochim. Ac., 75, 3335–3357, 2011.
Bartalev, S. A., Egorov, V. A., Ershov, D. V., Isaev, A. S., Lupyan, E. A., Plotnikov, D. E., and Uvarov, I. A.: Remote mapping of vegetation land cover of Russia based on data of MODIS spectroradmeter, Modern Problems of Earth Remote Sensing from Space, Modern Problems of Earth Remote Sensing from Space, 8, 285–302, http://d33.infospace.ru/d33_conf/2011v8n4/285-302.pdf (last access: 3 September 2021), 2011.
Beaulieu, J. J., Shuster, W. D., and Rebholz, J. A.: Controls on gas transfer velocities in a large river, J. Geophys. Res., 117, G02007, https://doi.org/10.1029/2011JG001794, 2012.
Berezovskaya, S., Yang, D., and Hinzman, L.: Long-term annual water balance analysis of the Lena River, Global Planet. Change, 48, 84–95, https://doi.org/10.1016/j.gloplacha.2004.12.006, 2005.
Brown, J., Ferrians Jr., O. J., Heginbottom, J. A., and Melnikov, E. S.: Circum-Arctic Map of Permafrost and Ground Ice Conditions, National Snow and Ice Data Center/World Data Center for Glaciology, Boulder, CO, USA, Digital media, 2002.
Bussmann, I.: Distribution of methane in the Lena Delta and Buor-Khaya Bay, Russia, Biogeosciences, 10, 4641–4652, https://doi.org/10.5194/bg-10-4641-2013, 2013.
Cai, W.-J. and Wang, Y.: The chemistry, fluxes, and sources of carbon dioxide in the estuarine waters of the Satilla and Altamaha Rivers, Georgia, Limnol. Oceanogr., 43, 657–668, https://doi.org/10.4319/lo.1998.43.4.0657, 1998.
Cauwet, G. and Sidorov I.: The biogeochemistry of Lena River: organic carbon and nutrients distribution, Mar. Chem., 53, 211–227, https://doi.org/10.1016/0304-4203(95)00090-9, 1996.
Chadburn, S. E., Krinner, G., Porada, P., Bartsch, A., Beer, C., Belelli Marchesini, L., Boike, J., Ekici, A., Elberling, B., Friborg, T., Hugelius, G., Johansson, M., Kuhry, P., Kutzbach, L., Langer, M., Lund, M., Parmentier, F.-J. W., Peng, S., Van Huissteden, K., Wang, T., Westermann, S., Zhu, D., and Burke, E. J.: Carbon stocks and fluxes in the high latitudes: using site-level data to evaluate Earth system models, Biogeosciences, 14, 5143–5169, https://doi.org/10.5194/bg-14-5143-2017, 2017.
Chevychelov, A. P. and Bosikov, N. P.: Natural Conditions, in: The Far North, edited by: Troeva, E. I., Isaev, A. P., Cherosov, M. M., and Karpov, N. S., 123, Springer, the Netherlands, https://doi.org/10.1007/978-90-481-3774-9_1, 2010.
Cooper, L. W., McClelland, J. W., Holmes, R. M., Raymond, P. A., Gibson, J. J., Guay, C. K., and Peterson, B. J.: Flow-weighted values of runoff tracers (δ18O, DOC, Ba, alkalinity) from the six largest Arctic rivers, Geophys. Res. Lett., 35, L18606, https://doi.org/10.1029/2008GL035007, 2008.
Cory, R. M. and Kling, G. W.: Interactions between sunlight and microorganisms influence dissolved organic matter degradation along the aquatic continuum, Limnol. Oceanogr. Lett., 3, 102–116, https://doi.org/10.1002/lol2.10060, 2018.
Cory, R. M., Ward, C. P., Crump, B. C., and Kling, G. W.: Sunlight controls water column processing of carbon in arctic fresh waters, Science, 345, 925–928, https://doi.org/10.1126/science.1253119, 2014.
Crawford, J. T., Loken, L. C., Casson, N. J., Smith, C., Stone, A. G, and Winslow, L. A.: High-speed limnology: using advanced sensors to investigate spatial variability in biogeochemistry and hydrology, Environ. Sci. Technol., 2015, 49, 442–450, https://doi.org/10.1021/es504773x, 2015.
Denfeld, B. A., Frey K. E., Sobczak, W. V., Mann P. J., and Holmes, R. M.: Summer CO2 evasion from streams and rivers in the Kolyma River basin, north-east Siberia, Polar Res., 32, 19704, https://doi.org/10.3402/polar.v32i0.19704, 2013.
Denfeld, B. A., Baulch, H. M., del Giorgio, P. A., Hampton, S. E., and Karlsson, J.: A synthesis of carbon dioxide and methane dynamics during the ice-covered period of northern lakes, Limnol. Oceanogr. Lett., 3, 117–131, https://doi.org/10.1002/lol2.10079, 2018.
Dudarev, O. V., Semiletov, I. P., and Charkin, A. N.: Particulate material composition in the Lena River–Laptev Sea system: Scales of heterogeneities, Dokl. Earth Sci., 411A, 1445–1451, https://doi.org/10.1134/S1028334X0609025X.pdf, 2006.
Ermolaev, O. P., Maltzev K. A., Mukharamova S. S., Khomyakov P. V., and Shynbergenov E. A.: Cartographic model of small rivers of the Lena River basin, Ychenue Zapiski Kazansky Univ., Ser. Natural Sciences, 160, 126–144, https://cyberleninka.ru/article/n/kartograficheskaya-model-basseynovyh-geosistem-malyh-rek-vodosbora-reki-leny/viewer (last access: 3 September 2021), 2018.
Feng, X. J., Vonk, J. E., van Dongen, B. E., Gustafsson, O., Semiletov, I. P., Dudarev, O. V., Wang, Z. H., Montlucon, D. B., Wacker, L., and Eglinton, T. I.: Differential mobilization of terrestrial carbon pools in Eurasian Arctic river basins, P. Natl. Acad. Sci. USA, 110, 14168–14173, https://doi.org/10.1073/pnas.1307031110, 2013.
Frey, K. E. and Smith, L. C.: Amplified carbon release from vast West Siberian peatlands by 2100, Geophys. Res. Lett., 32, L09401, https://doi.org/10.1029/2004GL022025, 2005.
Gautier, E., Depret, T., Costard, F., Virmoux, C., Fedorov, A., Grancher, D., Konstantinov, P., and Brunstein, D.: Going with the flow: Hydrologic response of middle Lena River (Siberia) to the climate variability and change, J. Hydrol. 557, 475–488, https://doi.org/10.1016/j.jhydrol.2017.12.034, 2018.
Gebhardt, A. C., Gaye-Haake, B., Unger, D., Lahajnar, N., and Ittekkot, V.: A contemporary sediment and organic carbon budget for the Kara Sea shelf (Siberia), Mar. Geol., 220, 83–100, https://doi.org/10.1016/j.margeo.2005.06.035, 2005.
Gelfan, A., Gustafsson, D., Motovilov, Y., Arheimer, B., Kalugin, A., Krylenko, I., and Lavrenov A.: Climate change impact on the water regime of two great Arctic rivers: modelling and uncertainty issues, Climate Change, 414, 499–515, https://doi.org/10.1007/s10584-016-1710-5m, 2017.
Georgiadi, A. G., Tananaev, N. I., and Dukhova L. A.: Hydrochemical conditions at the Lena River in August 2018, Oceanology, 59, 797–800, https://doi.org/10.1134/S0001437019050072, 2019.
Goncalves-Araujo, R., Stedmon, C. A., Heim, B., Dubinenkov, I., Kraberg, A., Moiseev, D., and Brachler A.: From fresh to marine waters: Characterization and fate of dissolved organic matter in the Lena River delta region, Siberia, Frontiers in Marine Science, 2, 108, https://doi.org/10.3389/fmars.2015.00108, 2015.
Gordeev, V. V. and Sidorov, I. S.: Concentrations of major elements and their outflow into the Laptev Sea by the Lena River, Mar. Chem., 43, 33–46, 1993.
Griffin, C. G., McClelland, J. W., Frey, K. E., Fiske, G., and Holmes, R. M.: Quantifying CDOM and DOC in major Arctic rivers during ice-free conditions using Landsat TM and ETM+ data, Remote Sens. Environ., 209, 395–409, https://doi.org/10.1016/j.rse.2018.02.060, 2018.
Guérin, F., Abril, G., Serça, D., Delon, C., Richard, S., Delmas, R., Tremblay, A., and Varfalvy, L.: Gas transfer velocities of CO2 and CH4 in a tropical reservoir and its river downstream, J. Marine Syst., 66, 161–172, https://doi.org/10.1016/j.jmarsys.2006.03.019, 2007.
Gureyev, D.: Tomsk State University: The expedition on the Lena River from the headwaters to the Aldan River, 2016, https://www.youtube.com/watch?v=7IEiO4bgxc8 (last access: 3 September 2021), 2016.
Harris, I., Jones, P. D., Osborn, T. J., and Lister, D. H.: Updated high-resolution grids of monthly climatic observations – the CRU TS3.10 Dataset, Int. J. Climatol., 34, 623–642, https://doi.org/10.1002/joc.3711, 2014.
Hirst, K., Andersson, P., Kooijman, E., Kutscher, L., Maximov, T., Moth, C.-M., and Porcelli, D.: Iron isotopes reveal the sources of Fe-bearing particles and colloids in the Lena River basin, Geochim. Cosmochim. Ac., 269, 678–692, https://doi.org/10.1016/j.gca.2019.11.004, 2020.
Holmes, R. M., Coe, M. T., Fiske, G. J., Gurtovaya, T., McClelland, J. W., Shiklomanov, A. I., Spencer, R. G. M., Tank, S. E., and Zhulidov, A. V.: Climate change impacts on the hydrology and biogeochemistry of Arctic Rivers, in: Climatic Changes and Global warming of Inland Waters: Impacts and Mitigation for Ecosystems and Societies, edited by: Goldman, C. R., Kumagi, M., and Robarts, R. D., John Wiley and Sons, 1–26, 2013.
Horan, K.; Hilton, R. G., Dellinger, M., Tipper, E., Galy, V., Calmels, D., Selby, D., Gaillardet, J., Ottley, C. J., Parsons, D. R., and Burton, K. W.: Carbon dioxide emissions by rock organic carbon oxidation and the net geochemical carbon budget of the Mackenzie River Basin, Am. J. Sci., 319, 473–499, https://doi.org/10.2475/06.2019.02, 2019.
Hotchkiss, E., Hall Jr, R., Sponseller, R., Butman, D., Klaminder, J., Laudon, H., Rosvall, M., and Karlsson, J.: Sources of and processes controlling CO2 emissions change with the size of streams and rivers, Nat. Geosci., 8, 696–699, https://doi.org/10.1038/ngeo2507, 2015.
Hugelius, G., Tarnocai, C., Broll, G., Canadell, J. G., Kuhry, P., and Swanson, D. K.: The Northern Circumpolar Soil Carbon Database: spatially distributed datasets of soil coverage and soil carbon storage in the northern permafrost regions, Earth Syst. Sci. Data, 5, 3–13, https://doi.org/10.5194/essd-5-3-2013, 2013.
Huh, Y., Tsoi, M. Y., Zaitsev, A., and Edmond, J. M.: The fluvial geochemistry of the rivers of eastern Siberia: I. Tributaries of the Lena River draining the sedimentary platform of the Siberian Craton, Geochim. Cosmochim. Ac., 62, 1657–1676, https://doi.org/10.1016/S0016-7037(98)00107-0, 1998a.
Huh, Y., Panteleyev, G., Babich, O., Zaitsev, A., and Edmond, J. M.: The fluvial geochemistry of the rivers of Eastern Siberia: II. Tributaries of the Lena, Omoloy, Yana, Indigirka, Kolyma, and Anadyr draining the collisional/accretionary zone of the Verkhoyansk and Cherskiy ranges, Geochim. Cosmochim. Ac., 62, 5063–5075, 1998b.
Huh, Y. and Edmond, J. M.: The fluvial geochemistry of the rivers of Eastern Siberia: III. Tributaries of the Lena and Anabar draining the basement terrain of the Siberian Craton and the Trans-Baikal Highlands, Geochim. Cosmochim. Ac., 63, 967–987, https://doi.org/10.1016/S0016-7037(99)00045-9, 1999.
Humborg, C., Morth, C.-M., Sundbom, M., Borg, H., Blenckner, T., Giesler, R., and Ittekkot, V.: CO2 supersaturation along the aquatic conduit in Swedish watersheds as constrained by terrestrial respiration, aquatic respiration and weathering, Glob. Change Biol., 16, 1966–1978, https://doi.org/10.1111/j.1365-2486.2009.02092.x, 2010.
Ivakhov, V. M., Paramonova, N. N., Privalov, V. I., Zinchenko, A. V., Loskutova, M. A., Makshtas, A. P., Kustov, V. Y., Laurila, T., Aurela, M., and Asmi, E.: Atmospheric Concentration of Carbon Dioxide at Tiksi and Cape Baranov Stations in 2010–2017, Russ. Meteorol. Hydrol., 44, 291–299, https://doi.org/10.3103/S1068373919040095, 2019.
Jähne, B., Heinz, G., and Dietrich, W.: Measurement of the diffusion coefficients of sparingly soluble gases in water, J. Geophys. Res.-Oceans, 92, 10767–10776, https://doi.org/10.1029/JC092iC10p10767, 1987.
Johnson, M. S., Billett, M. F., Dinsmore, K. J., Wallin, M., Dyson, K. E., and Jassal, R. S.: Direct and continuous measurement of dissolved carbon dioxide in freshwater aquatic systems-method and applications, Ecohydrology, 3, 68–78, https://doi.org/10.1002/eco.95, 2009.
Juhls, B., Stedmon, C. A., Morgenstern, A., Meyer, H., Holemann, J., Heim, B., Povazhnyi, V., and Overduin P. P.: Identifying drivers of seasonality in Lena River biogeochemistry and dissolved organic matter fluxes, Front. Environ. Sci., 8, 53, https://doi.org/10.3389/fenvs.2020.00053, 2020.
Karlsson, J., Serikova, S., Rocher-Ros, G., Denfeld, B., Vorobyev, S. N., and Pokrovsky, O. S.: Carbon emission from Western Siberian inland waters, Nat. Commun., 12, 825, https://doi.org/10.1038/s41467-021-21054-1, 2021.
Klaus, M. and Vachon, D.: Challenges of predicting gas transfer velocity from wind measurements over global lakes, Aquat. Sci., 82, 53, https://doi.org/10.1007/s00027-020-00729-9, 2020.
Klaus, M., Seekell, D. A., Lidberg, W., and Karlsson, J.: Evaluations of climate and land management effects on lake carbon cycling need to account temporal variability in CO2 concentration, Global Biogeochem. Cy., 33, 243–265, https://doi.org/10.1029/2018gb005979, 2019.
Kruse, S., Gerdes, A., Kath, N. J., Epp, L. S., Stoof-Leichsenring, K. R., Pestryakova, L. A., and Herzschuh, U.: Dispersal distances and migration rates at the arctic treeline in Siberia – a genetic and simulation-based study, Biogeosciences, 16, 1211–1224, https://doi.org/10.5194/bg-16-1211-2019, 2019.
Kutscher, L., Mörth, C.-M., Porcelli, D., Hirst, C., Maximov, T. C., Petrov, R. E., and Andersson, P. S.: Spatial variation in concentration and sources of organic carbon in the Lena River, Siberia, J. Geophys. Res.-Biogeo., 122, 1999–2014, https://doi.org/10.1002/2017JG003858, 2017.
Kutzbach, L., Wille, C., and Pfeiffer, E.-M.: The exchange of carbon dioxide between wet arctic tundra and the atmosphere at the Lena River Delta, Northern Siberia, Biogeosciences, 4, 869–890, https://doi.org/10.5194/bg-4-869-2007, 2007.
Kuzmin, M. I., Tarasova, E. N., Bychinskii, V. A., Karabanov, E. B., Mamontov, A. A., and Mamontova, E. A.: Hydrochemical regime components of Lena water, Water Resour., 36, 418–430, https://doi.org/10.1134/S0097807809040058, 2009.
Lara, R. J., Rachold, V., Kattner, G., Hubberten, H. W., Guggenberger, G., Annelie, S., and Thomas, D. N.: Dissolved organic matter and nutrients in the Lena River, Siberian Arctic: Characteristics and distribution, Mar. Chem., 59, 301–309, https://doi.org/10.1016/S0304-4203(97)00076-5, 1998.
Lauerwald, R., Laruelle, G. G., Hartmann, J., Ciais, P., and Regnier, P. A. G.: Spatial patterns in CO2 evasion from the global river network, Global Biogeochem. Cy., 29, 534–554, https://doi.org/10.1002/2014GB004941, 2015.
Laurion, I., Massicotte, P., Mazoyer, F., Negandhi, K., and Mladenov, N.: Weak mineralization despite strong processing of dissolved organic matter in Eastern Arctic tundra ponds, Limnol. Oceanogr., 66, S47–S63, https://doi.org/10.1002/lno.11634, 2021.
Leith, F. I., Garnett, M. H., Dinsmore, K. J., Billett, M. F., and Heal, K. V.: Source and age of dissolved and gaseous carbon in a peatland-riparian-stream continuum: a dual isotope (14C and δ13C) analysis, Biogeochemistry, 119, 415–433, https://doi.org/10.1007/s10533-014-9977-y, 2014.
Leith, F. I., Dinsmore, K. J., Wallin, M. B., Billett, M. F., Heal, K. V., Laudon, H., Öquist, M. G., and Bishop, K.: Carbon dioxide transport across the hillslope–riparian–stream continuum in a boreal headwater catchment, Biogeosciences, 12, 1881—1892, https://doi.org/10.5194/bg-12-1881-2015, 2015.
Lobbes, J. M., Friznar, H. P., and Kattner, G.: Biogeochemical characteristics of the dissolved and particulate organic matter in Russian rivers entering the Arctic Ocean, Geochim. Cosmochim. Ac., 64, 2973–2983, 2000.
McClelland, J. W., Holmes, R. M., Peterson, B. J., and Strieglitz, M.: Increasing river discharge in the Eurasian Arctic: Consideration of dams, permafrost thaw, and fires as potential agents of change, J. Geophys. Res.-Atmos., 109, D18102, https://doi.org/10.1029/2004JD004583, 2004.
Murphy, M., Porcelli, D., Pogge von Strandmann, P., Hirst, K., Kutscher, L., Katchinoff, J., Morth, C.-M., Maximov, T., and Andresson, P.: Tracing silicate weathering processes in the permafrost-dominated Lena River watershed using lithium isotopes, Geochim. Cosmochim. Ac., 245, 154–171, https://doi.org/10.1016/j.gca.2018.10.024, 2018.
Park, J.-H., Nayna, O. K., Begum, M. S., Chea, E., Hartmann, J., Keil, R. G., Kumar, S., Lu, X., Ran, L., Richey, J. E., Sarma, V. V. S. S., Tareq, S. M., Xuan, D. T., and Yu, R.: Reviews and syntheses: Anthropogenic perturbations to carbon fluxes in Asian river systems – concepts, emerging trends, and research challenges, Biogeosciences, 15, 3049–3069, https://doi.org/10.5194/bg-15-3049-2018, 2018.
Park, J.-H., Jin, H., Yoon, T. K., Begum, M. S., Eliyan, C., Lee, E.-J., Lee, S.-C., and Oh, N.-H.: Wastewater-boosted biodegradation amplifying seasonal variations of pCO2 in the Mekong–Tonle Sap river system, Biogeochemistry, 155, 219–235, https://doi.org/10.1007/s10533-021-00823-6, 2021.
Payandi-Rolland, D., Shirokova, L. S., Nakhle, P., Tesfa, M., Abdou, A., Causserand, C., Lartiges, B., Rols, J. L., Guérin, F., Bénézeth, P., and Pokrovsky, O. S.: Aerobic release and biodegradation of dissolved organic matter from frozen peat: Effects of temperature and heterotrophic bacteria, Chem. Geol., 536, 119448, https://doi.org/10.1016/j.chemgeo.2019.119448, 2020.
Pekel, J. F., Cottam, A., Gorelick, N., and Belward, A. S.: High-resolution mapping of global surface water and its long-term changes, Nature, 540, 418–422, https://doi.org/10.1038/nature20584, 2016.
Pipko, I. I., Pugach, S. P., Dudarev, O. V., Charkin, A. N., and Semiletov, I. P.: Carbonate parameters of the Lena River: Characteristics and distribution, Geochem. Int., 48, 1131–1137, https://doi.org/10.1134/S0016702910110078, 2010.
Pipko, I. I., Pugach, S. P., Savichev, O. G., Repina, I. A., Shakhova, N. E., Moiseeva, Yu. A., Barskov, K. V., Sergienko, V. I., and Semiletov, I. P.: Dynamics of dissolved inorganic carbon and CO2 fluxes between the water and the atmosphere in the main channel of the Ob River, Dokl. Chem., 484, 52–57, https://doi.org/10.1134/S0012500819020101, 2019.
Qin, J., Huh, Y., Edmond, J. M., Du, G., and Ran, J.: Chemical and Physical weathering in the Min Jiang, a headwater tributary of the Yangtze River, Chem. Geol., 227, 53–69, https://doi.org/10.1016/j.chemgeo.2005.09.011, 2006.
Rachold, V., Alabyan, A., Hubberten, H.-W., Korotaev, V. N., and Zaitsev, A. A.: Sediment transport to the Laptev Sea - hydrology and geochemistry of the Lena River, Polar Res., 15, 183–196, https://doi.org/10.3402/polar.v15i2.6646, 1996.
Raymond, P. A., McClelland, J. W., Holmes, R. M., Zhulidov, A. V., Mull, K., Peterson, B. J., Striegl, R. G., Aiken, G. R., and Gurtovaya, T. Y.: Flux and age of dissolved organic carbon exported to the Arctic Ocean: A carbon isotopic study of the five largest arctic rivers, Global Biogeochem. Cy., 121, GB4011, https://doi.org/10.1029/2007GB002934, 2007.
Raymond, P. A., Hartmann, J., Lauerwald, R., Sobek, S., McDonald, C., Hoover, M., Butman, D., Striegl, R., Mayorga, E., Humborg, C., Kortelainen, P., Dürr, H., Meybeck, M., Ciais, P., and Guth, P.: Global carbon dioxide emissions from inland waters, Nature, 503, 355–359, https://doi.org/10.1038/nature12760, 2013.
Rocher-Ros, G., Sponseller, R. A., Lidberg, W., Mörth, C-M., and Giesler, R.: Landscape process domains drive patterns of CO2 evasion from river networks, Limnol. Oceanogr. Lett., 4, 87–95, https://doi.org/10.1002/lol2.10108, 2019.
Sachs, T., Wille, C., Boike, J., and Kutzbach, L.: Environmental controls on ecosystem-scale CH4 emission from polygonal tundra in the Lena River Delta, Siberia, J. Geophys. Research-Biogeo., 113, G00A03, https://doi.org/10.1029/2007JG000505, 2008.
Santoro, M., Beer, C., Cartus, O., Schmullius, C., Shvidenko, A., McCallum, I., Wegmueller, U., and Wiesmann, A.: The BIOMASAR algorithm: An approach for retrieval of forest growing stock volume using stacks of multi-temporal SAR data, in: Proceedings of ESA Living Planet Symposium, 28 June–2 July 2010 (ESA SP-686, December 2010), available at: https://www.researchgate.net/publication/230662433 (last access: 4 September 2021), 2010.
Schuur, E. A. G., McGuire, A. D., Schädel, C., Grosse, G., Harden, J. W., Hayes, D. J., Hugelius, G., Koven, C. D., Kuhry, P., Lawrence, D. M., Natali, S. M., Olefeldt, C., Romanovsky, V. E., Schaefer, K., Turetsky, M. R., Treat, C. C., and Vonk. J. E.: Climate change and the permafrost carbon feedback, Nature 520, 171–179, https://doi.org/10.1038/nature14338, 2015.
Semiletov, I. P.: Aquatic sources and sinks of CO2 and CH4 in the polar regions, J. Atmos. Sci., 56, 286–306, https://doi.org/10.1175/1520-0469(1999)056<0286:ASASOC>2.0.CO;2, 1999.
Semiletov, I. P., Pipko, I. I., Shakhova, N. E., Dudarev, O. V., Pugach, S. P., Charkin, A. N., McRoy, C. P., Kosmach, D., and Gustafsson, Ö.: Carbon transport by the Lena River from its headwaters to the Arctic Ocean, with emphasis on fluvial input of terrestrial particulate organic carbon vs. carbon transport by coastal erosion, Biogeosciences, 8, 2407–2426, https://doi.org/10.5194/bg-8-2407-2011, 2011.
Serikova, S., Pokrovsky, O. S., Ala-aho, P., Kazantsev, V., Kirpotin, S. N. Kopysov, S. G., Krickov, I. V., Laudon, H., Manasypov, R. M., Shirokova, L. S., Sousby, C., Tetzlaff, D., and Karlsson, J.: High riverine CO2 emissions at the permafrost boundary of Western Siberia, Nat. Geosci., 11, 825–829, https://doi.org/10.1038/s41561-018-0218-1, 2018.
Serikova S., Pokrovsky O. S., Laudon, H., Krickov, I. V., Lim, A. G., Manasypov, R. M., and Karlsson, J.: C emissions from lakes across permafrost gradient of Western Siberia, Nat. Commun., 10, 1552, https://doi.org/10.1038/s41467-019-09592-1, 2019.
Siewert, M. B., Hugelius, G., Heim, B., and Faucherre, S.: Landscape controls and vertical variability of soil organic carbon storage in permafrost-affected soils of the Lena River Delta, Catena, 147, 725–741, https://doi.org/10.1016/j.catena.2016.07.048, 2016.
Smith, L. C. and Pavelksky, T. M.: Estimation of river discharge, propagation speed, and hydraulic geometry from space: Lena River, Siberia, Water Resour. Res., 44, W03427, https://doi.org/10.1029/2007WR006133, 2008.
Spence, J. and Telmer, K.: The role of sulfur in chemical weathering and atmospheric CO2 fluxes: evidence from major ions, δ13CDIC, and in rivers of the Canadian Cordillera, Geochim. Cosmochim. Ac., 69, 5441–5458, https://doi.org/10.1016/j.gca.2005.07.011, 2005.
Stackpoole, S. M., Butman, D. E., Clow, D. W., Verdin, K. L., Gaglioti, B. V., Genet, H., and Striegl, R. G.: Inland waters and their role in the carbon cycle of Alaska, Ecol. Appl., 27, 1403–1420, https://esajournals.onlinelibrary.wiley.com/doi/pdf/10.1002/eap.1552 (last access: 4 September 2021), 2017.
Striegl, R. G., Dornblaser, M. M., McDonald, C. P., Rover, J. R., and Stets E. G.: Carbon dioxide and methane emissions from the Yukon River system, Global Biogeochem. Cy., 26, GB0E05, https://doi.org/10.1029/2012GB004306, 2012.
Sun, X., Mörth, C.-M., Porcelli, D., Kutscher, L., Hirst, C., Murphy, M. J., Maximov, T., Petrov, R. E., Humborg, C., Schmitt, M., and Andersson, P. S.: Stable silicon isotopic compositions of the Lena River and its tributaries: Implications for silicon delivery to the Arctic Ocean, Geochim. Cosmochim. Ac. 241, 120–133, https://doi.org/10.1016/j.gca.2018.08.044, 2018.
Suzuki, K., Matsuo, K., Yamazaki, D., Ichii, K., Iijima, Y., Papa, F., Yanagi, Y., and Hiyama, T.: Hydrological variability and changes in the Arctic circumpolar tundra and the three largest Pan-Arctic river basins from 2002 to 2016, Remote Sens., 10, 402, https://doi.org/10.3390/rs10030402, 2018.
Vachon, D., Prairie, Y. T., and Cole, J. J.: The relationship between near-surface turbulence and gas transfer velocity in freshwater systems and its implications for floating chamber measurements of gas exchange, Limnol. Oceanogr., 55, 1723–173, https://doi.org/10.4319/lo.2010.55.4.1723, 2010.
van der Molen, M. K., van Huissteden, J., Parmentier, F. J. W., Petrescu, A. M. R., Dolman, A. J., Maximov, T. C., Kononov, A. V., Karsanaev, S. V., and Suzdalov, D. A.: The growing season greenhouse gas balance of a continental tundra site in the Indigirka lowlands, NE Siberia, Biogeosciences, 4, 985–1003, https://doi.org/10.5194/bg-4-985-2007, 2007.
Vonk, J. E., Tank, S. E., Mann, P. J., Spencer, R. G. M., Treat, C. C., Striegl, R. G., Abbott, B. W., and Wickland, K. P.: Biodegradability of dissolved organic carbon in permafrost soils and aquatic systems: a meta-analysis, Biogeosciences, 12, 6915–6930, https://doi.org/10.5194/bg-12-6915-2015, 2015.
Vonk, J. E., Tank, S. E., and Walvoord, M. A.: Integrating hydrology and biogeochemistry across frozen landscapes, Nat. Commun. 10, 1–4, https://doi.org/10.1038/s41467-019-13361-5, 2019.
Wanninkhof, R.: Relationship between wind speed and gas exchange over the ocean, J. Geophys. Res. 97, 7373–7382, https://doi.org/10.4319/lom.2014.12.351, 1992.
Ward, C. P., Nalven, S. G., Crump, B. C., Kling, G. W., and Cory, R. M.: Photochemical alteration of organic carbon draining permafrost soils shifts microbial metabolic pathways and stimulates respiration, Nat. Commun., 8, 772, https://doi.org/10.1038/s41467-017-00759-2, 2017.
Wild, B., Andersson, A., Bröder, L., Vonk, J., Hugelius, G., McClelland, J. W., Song, W., Raymond P. A., and Gustafsson, Ö.: Rivers across the Siberian Arctic unearth the patterns of carbon release from the thawing permafrost, PNAS, 116, 10280–10285, https://www.pnas.org/content/116/21/10280 (last access: 4 September 2021), 2019.
Wille, C., Kutzbach, L., Sachs, T., Wagner, D., and Pfeiffer, E. M.: Methane emission from Siberian arctic polygonal tundra: eddy covariance measurements and modeling, Glob. Change Biol., 14, 1395–1408, https://doi.org/10.1111/j.1365-2486.2008.01586.x, 2008.
Wu, L. and Huh, Y.: Dissolved reactive phosphorus in large rivers of East Asia, Biogeochemistry 85, 263–288, https://doi.org/10.1007/s10533-007-9133-z, 2007.
Yang, D. Q., Kane, D. L., Hinzman, L. D., Zhang, X. B., Zhing, T. J., and Ye, H. C.: Siberian Lena River hydrological regime and recent change, J. Geophys. Res.-Atmos., 107, 4694, https://doi.org/10.1029/2002JD002542, 2002.
Yamamoto, S., Alcauskas, J. B., and Crozier, T. E.: Solubility of methane in distilled water and seawater, J. Chem. Eng. Data, 21, 78–80, https://doi.org/10.1021/je60068a029, 1976.
Ye, B., Yang, D., Zhang, Z., and Kane, D. L.: Variation of hydrological regime with permafrost coverage over Lena basin in Siberia, J. Geophys. Res., 114, D07102, https://doi.org/10.1029/2008JD010537, 2009.
Yoon, T. K., Jin, H., Oh, N.-H., and Park, J.-H.: Technical note: Assessing gas equilibration systems for continuous pCO2 measurements in inland waters, Biogeosciences, 13, 3915–3930, https://doi.org/10.5194/bg-13-3915-2016, 2016.
Zhang, T., Frauenfeld, O. W., Serreze, M. C., Etringer, A., Oelke, C., McCreight, J., Barry, R. G., Gilichinsky, D., Yang, D., Ye, H., Ling, F., and Chudinova, S.: Spatial and temporal variability in active layer thickness over the Russian Arctic drainage basin, J. Geophys. Res., 110, D16101, https://doi.org/10.1029/2004JD005642, 2005.
Zubrzycki, S., Kutzbach, L., Grosse, G., Desyatkin, A., and Pfeiffer, E.-M.: Organic carbon and total nitrogen stocks in soils of the Lena River Delta, Biogeosciences, 10, 3507–3524, https://doi.org/10.5194/bg-10-3507-2013, 2013.