the Creative Commons Attribution 4.0 License.
the Creative Commons Attribution 4.0 License.
 | 21 Dec 2022
Role of phosphorus in the seasonal deoxygenation of the East China Sea shelf
Haiyan Zhang
Katja Fennel
The Changjiang is the largest river in Asia and the main terrestrial source of freshwater and nutrients to the East China Sea (ECS). Nutrient concentrations have long been increasing in the Changjiang, especially after 1960 with urbanization, the development of industrial animal production, and fertilizer application in agriculture, resulting in coastal eutrophication and recurring summer hypoxia. The supply of anthropogenic nitrogen (N) exceeds that of phosphorus (P) relative to the Redfield ratio. This results in seasonal P limitation in the Changjiang plume. P limitation and its effects on primary production, respiration, and hypoxia in the ECS have not been studied systematically, although such knowledge is needed to understand bloom dynamics in the region, to assess the consequences of altered nutrient loads, and to implement nutrient reduction strategies that mitigate hypoxia. Using a coupled physical–biogeochemical model of the ECS that was run with and without P limitation, we quantify the distribution and effects of P limitation. The model shows that P limitation develops eastward of the Changjiang Estuary and on the Yangtze Bank but rarely southward along the Zhejiang coast. P limitation modifies oxygen sinks over a large area of the shelf by partly relocating primary production and respiration offshore, away from the locations prone to hypoxia near the Changjiang Estuary. This relocation drastically reduces sediment oxygen consumption nearshore and dilutes the riverine-driven primary production and respiration over a large area offshore. Our results suggest that the hypoxic zone would be 48 % larger in its horizontal extent, on average, if P limitation was not occurring. Results are summarized in a conceptual model of P limitation on the ECS shelf that is also applicable to other systems. Then we carried out nutrient reduction simulations which indicate that, despite the effect of P limitation on hypoxia, reducing only P inputs as a nutrient reduction strategy would not be effective. A dual N + P nutrient reduction strategy would best mitigate hypoxia. The model results suggest that decreasing the size of the hypoxic zone by 50 % and 80 % would require reductions in N + P load of 28 % and 44 %, respectively.
- Article
(7628 KB) - Full-text XML
-
Supplement
(2125 KB) - BibTeX
- EndNote


The expansion of eutrophication-driven hypoxic conditions, i.e., O2<2 mg L−1 or 62.5 mmol m−3, has been a growing issue for the coastal ocean in the past decades (Diaz and Rosenberg, 2008; Fennel and Testa, 2019). Coastal eutrophication occurs when excess nitrogen (N) and phosphorus (P) nutrients, associated mainly with the use of synthetic fertilizer in agriculture, wastewater discharge in urban areas, and livestock farming (Alexander et al., 2008; Chen et al., 2020) reach the coastal ocean where they stimulate primary production, the development of harmful algal blooms (Glibert et al., 2014; Heisler et al., 2008), and subsequently respiration and O2 depletion in subsurface waters (Fennel and Testa, 2019). Low O2 can have detrimental effects on the benthos (Levin et al., 2009) and the food web (Kidwell et al., 2009) and ultimately have economic consequences for fisheries (Rabalais and Turner, 2001; Smith et al., 2017).
In large eutrophicated estuaries and river plumes (e.g., Mississippi River plume, Changjiang Estuary, Chesapeake Bay), phytoplankton growth is typically limited by light in winter, as well as in the highly turbid waters in the vicinity of the river outflow, whereas maximum production often occurs downstream where both light and nutrients are plentiful (Cloern, 1987; Fennel et al., 2011; Lohrenz et al., 1997, 1999). In downstream waters, productivity is controlled by the availability of nutrients (Fennel and Laurent, 2018; Malone et al., 1996). There, the stoichiometry of dissolved inorganic N (DIN), P (DIP), and possibly silicate (Si) in the river source will partly determine where, when, and which nutrient is most limiting (Dagg et al., 2004; Laurent et al., 2012).
The stoichiometry of dissolved inorganic N (DIN) and P (DIP) inputs from rivers has been modified by the onset of cultural eutrophication. Sources of DIN are usually spatially diffuse, associated with the use of fertilizer for agriculture (Seitzinger and Harrison, 2008). Although diffuse sources of DIP are also important in intensive farming regions (Boesch, 2019; Wurtsbaugh et al., 2019), sewage point sources can dominate DIP export (Harrison et al., 2010). The construction of dams in a river basin may also alter the delivery of particulate phosphorus to the coastal ocean (Beusen et al., 2016; Hu et al., 2020). Successful point source mitigation has modified nutrient stoichiometry in rivers resulting in a growing excess of N and DIN : DIP ratios significantly larger than the Redfield ratio of 16 (Westphal et al., 2020). This leads to P limitation of phytoplankton growth in coastal waters and the modification of bloom dynamics (Laurent et al., 2012) and consequently hypoxia (Laurent and Fennel, 2014, 2017).
One of the world's largest eutrophication-induced hypoxic zones is in the East China Sea (ECS), a large and highly productive marginal sea on the western edge of the North Pacific surrounded by Taiwan, China, Korea, and Japan. The main terrestrial source of freshwater and nutrients to the ECS is the Changjiang (Tong et al., 2015), the largest river in Asia (Liu et al., 2003). Nutrient concentrations have long been increasing in the Changjiang, especially after 1960 with the development of urbanization, industrial animal production, and fertilizer application in agriculture (Dai et al., 2011; Jiang et al., 2014; Liu et al., 2009, 2018; Strokal et al., 2016; Wang et al., 2020; Yan et al., 2003, 2010). Coastal eutrophication within the Changjiang plume leads to recurrent algal blooms (Chen et al., 2019a; Li et al., 2014; Wang and Wu, 2009) and the development of subsurface hypoxic conditions in summer (Li et al., 2011; Ning et al., 2011; Wang et al., 2016). Although freshwater (stratification) and wind (destratification) are important for the establishment and sustainment of hypoxic conditions (Zhang et al., 2020), the Changjiang's N load has been shown to be the main contributor to hypoxia on the shelf (Große et al., 2020).
Typically, primary production is limited by light in the Changjiang estuarine and sediment plume waters, whereas nutrient limitation may occur in the transition zone and further offshore (Harrison et al., 1990; Li et al., 2021; Zhu et al., 2009). As elsewhere, the unbalanced supply of DIN and DIP from the Changjiang (Liu et al., 2003, 2018; Shi et al., 2022) led to the development of P limitation on the shelf (Li et al., 2009; Wang et al., 2015). Based on laboratory studies and local observations, there are indications that high N : P and the onset of P limitation on the ECS shelf alter the species composition of phytoplankton blooms (Li et al., 2009; Ou et al., 2020; Xing et al., 2016; Zhou et al., 2008). Despite this knowledge, P limitation has not been studied systematically in the region, and its effects on primary production, respiration, and hypoxia remain unknown. However, understanding the effects of nutrient limitation on O2 biogeochemistry is essential for assessing the consequences of altered nutrient loads on hypoxia dynamics and therefore to implement nutrient reduction strategies to mitigate hypoxia on the shelf. Preliminary N load reduction experiments in the Changjiang show that significant N reduction is necessary to mitigate hypoxia (Große et al., 2020; Zhou et al., 2017). P was not included in these experiments but needs to be considered to assess the efficiency of single versus dual nutrient management strategies.
Here, through simulations with and without P limitation in the coupled circulation–biogeochemical model of Zhang et al. (2020), we investigate nutrient limitation in the ECS. The goal is to quantify the effects of P limitation and provide insights for reducing hypoxia in the region. First, we validate the model with observed nutrient concentrations. We then describe the occurrence and spatial distribution of P limitation on the shelf and its effect on O2 sources and sinks and hypoxia. Using these results, we develop a conceptual model of P limitation for the ECS. Finally, by conducting scenario simulations with reduced nutrient loads from the Changjiang, we investigate the efficiency of different nutrient reduction strategies to mitigate hypoxia on the shelf.
2.1 Model description
The circulation model is a regional implementation of the Regional Ocean Modelling System (ROMS, version 3.7; Haidvogel et al., 2008) configured for the East China Sea and surrounding areas (Bian et al., 2013; Fig. 1). The grid has a ∘ resolution and 30 vertical layers with increased resolution near the surface and bottom. The circulation model uses the recursive multidimensional positive definite advection transport algorithm (MPDATA) for the horizontal advection of tracers and a third-order upwind scheme for the advection of momentum. Vertical mixing is parameterized using the generic length scale (GLS) turbulence closure scheme (Umlauf and Burchard, 2003).
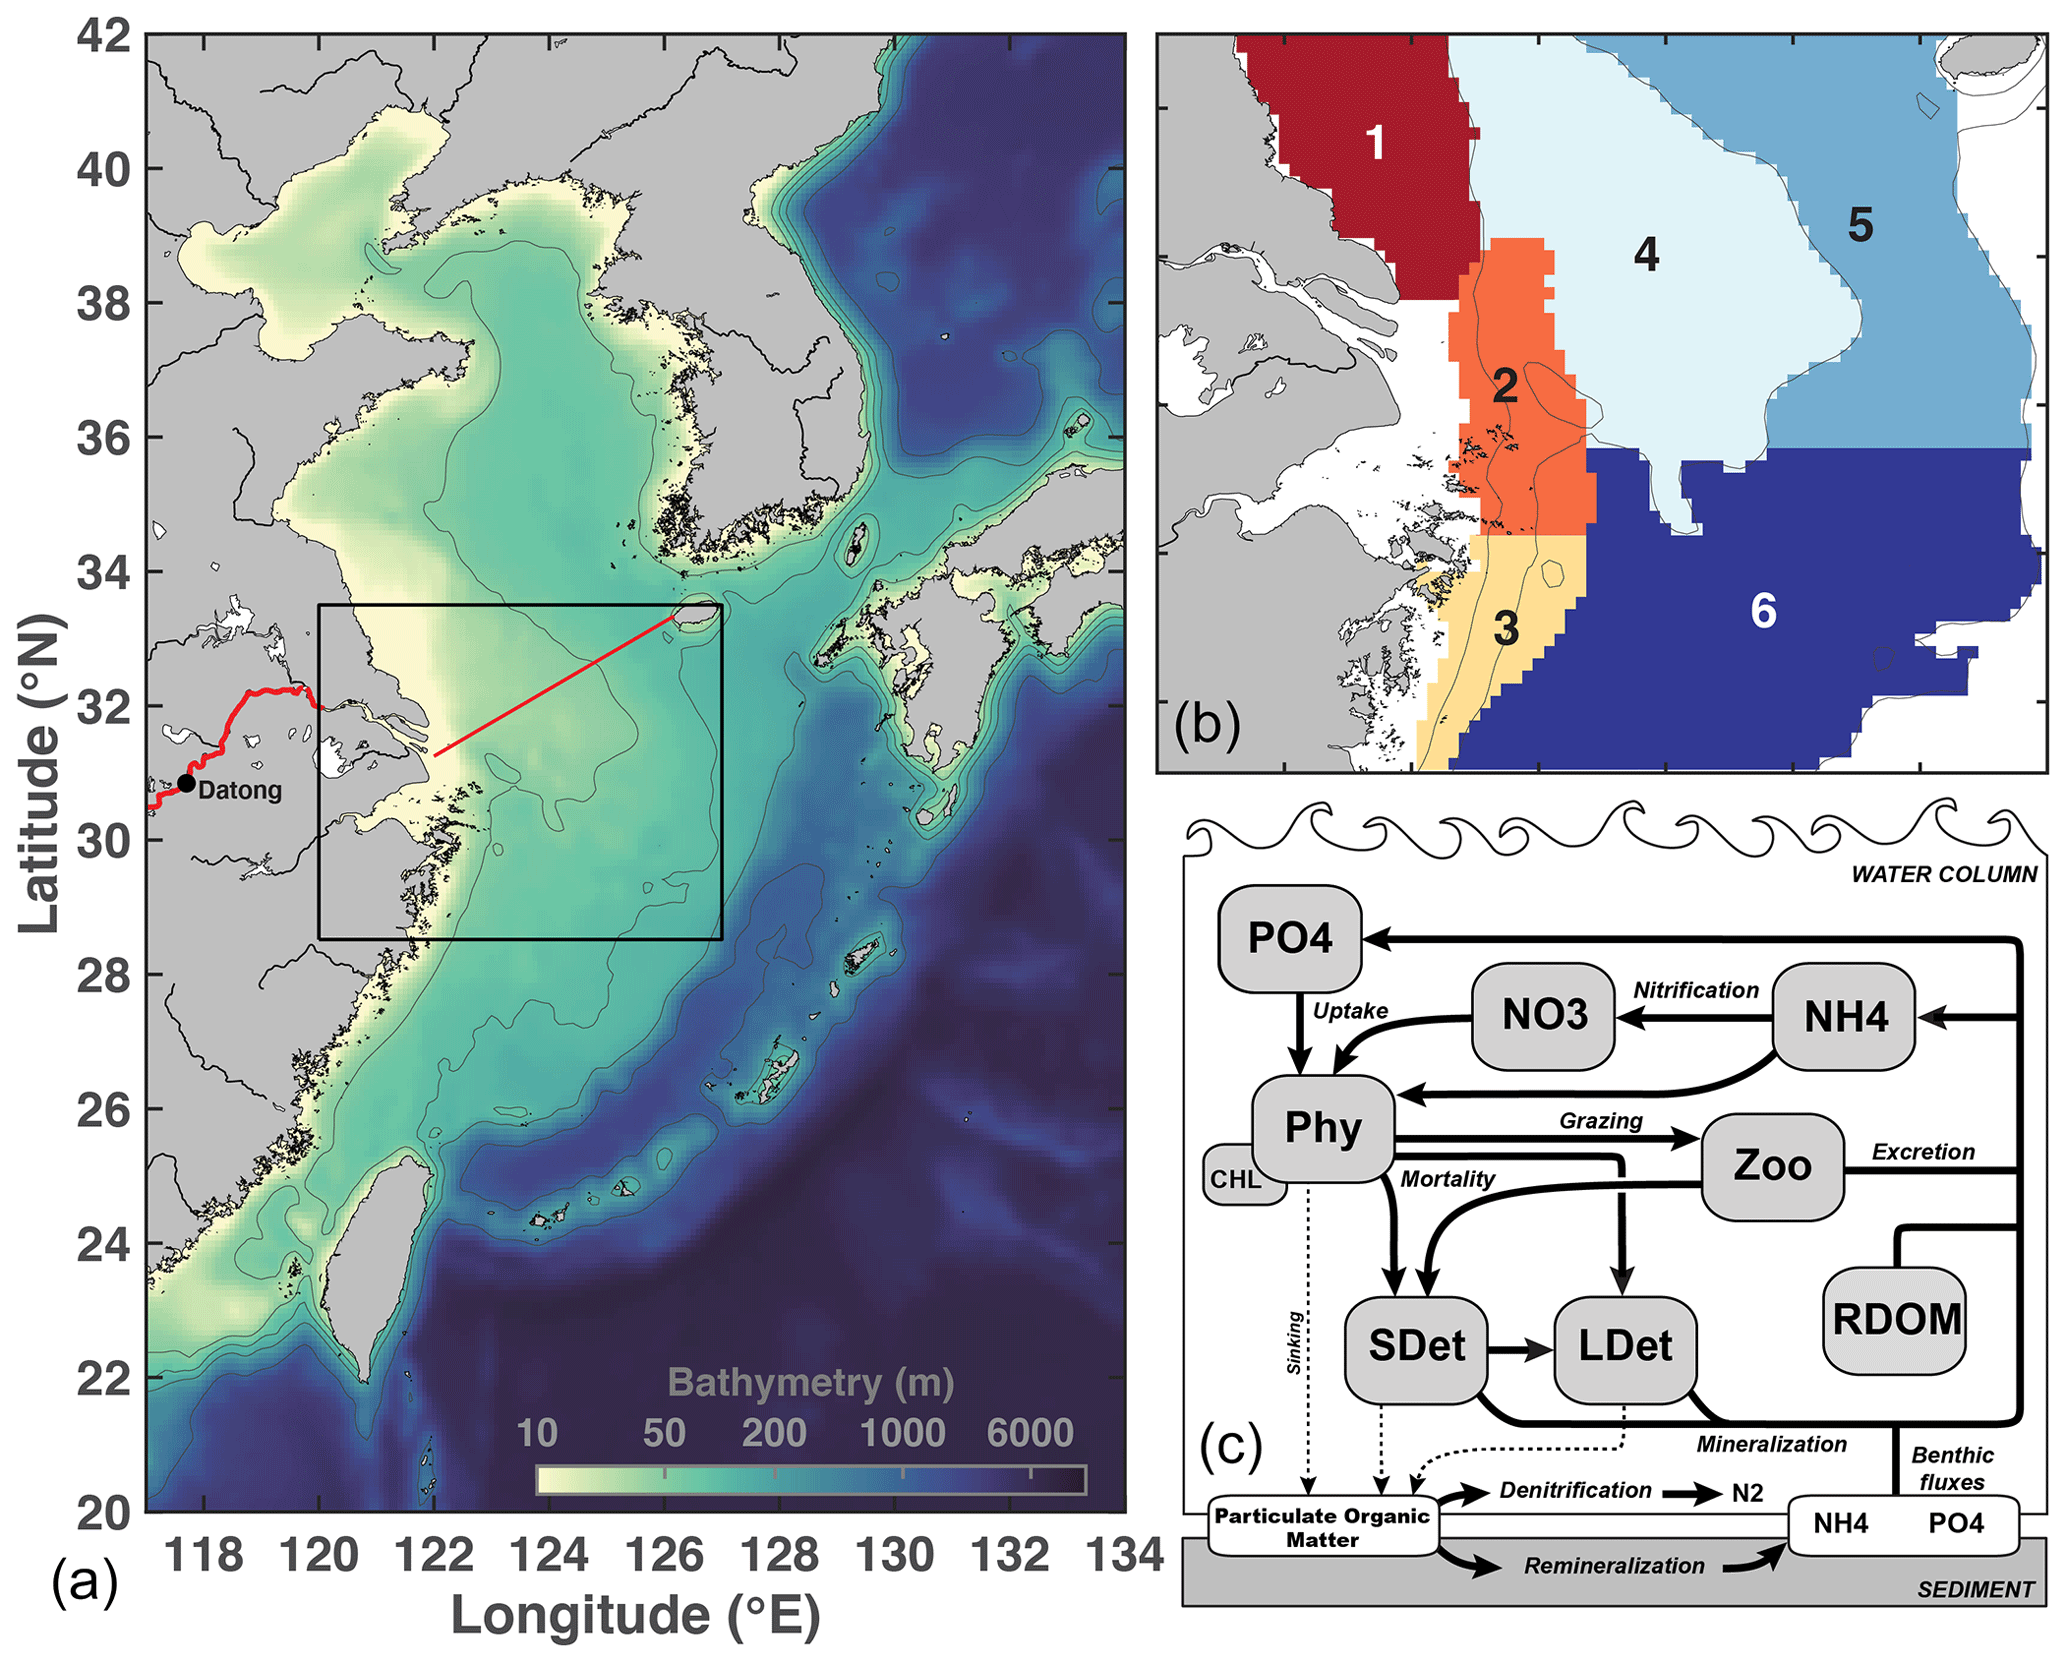
Figure 1Model domain and bathymetry (a), subregions used for analysis (zones 1–6, b), and schematic of the biological model (c). Details on O2 sources and sinks are provided in Laurent et al. (2017). On the left panel, the Changjiang is shown in red. The CE–Jeju Island transect is represented by a red line. The black box is the limit of the region shown in (b).
The circulation model is coupled online with the biogeochemical model of Fennel et al. (2006, 2011) that was extended to include phosphate (Laurent et al., 2012), O2 (Fennel et al., 2013), river dissolved organic matter (DOM; Yu et al., 2015), and a light attenuation scheme that simulates higher attenuation in shallow areas and in the river plume (Zhang et al., 2020). The model has 10 state variables: phytoplankton, chlorophyll, zooplankton, nitrate and ammonium (DIN), phosphate (DIP), O2, and three detritus pools (small and large detritus, river DOM). Silicate (Si) is not included in the model as it is assumed to be non-limiting. During the simulation period, observed Si N and Si P were close to and above Redfield, respectively (Shi et al., 2022). The single phytoplankton group includes all phytoplankton types and therefore does not differentiate between diatoms and dinoflagellates. Zhang et al. (2020) showed that these choices are appropriate to represent the bulk surface chlorophyll in the Changjiang plume, as well as spatial and temporal variations in subsurface O2. At the sediment–water interface, sinking particulate organic N (PON) and P (POP) are instantaneously remineralized into ammonium and phosphate, respectively, accounting for a fraction of PON lost through denitrification (Fennel et al., 2006). Sediment O2 consumption (SOC) is parameterized assuming a linear relationship with denitrification (Fennel et al., 2013; Seitzinger and Giblin, 1996).
The model includes seven rivers. Daily freshwater discharge observations from Datong hydrological station (Fig. 1) and monthly NO3 and PO4 loads from the Global NEWS model (Wang et al., 2015) are used to represent Changjiang conditions. Monthly or annual climatologies are used for the other rivers. Boundary conditions for temperature, salinity, NO3, PO4, and O2 are specified from the World Ocean Atlas (Garcia et al., 2013a, b; Locarnini et al., 2013; Zweng et al., 2013), whereas horizontal velocities and sea surface elevation use the SODA dataset (Carton and Giese, 2008). A small positive value is used for all other biological variables. Surface forcing is prescribed using the ECMWF ERA-Interim dataset (Dee et al., 2011).
A schematic of the biogeochemical model is provided in Fig. 1. The model equations are available in the supporting information of Laurent et al. (2017); setup and validation are described in detail in Zhang et al. (2020). Biogeochemical model parameters are also available in Zhang et al. (Table S1).
2.2 Nutrient limitation
Phytoplankton growth is limited by light (E), temperature (T), and the most limiting nutrient (either DIN or DIP) such that the specific phytoplankton growth rate (μ; d−1) is calculated as follows:
where μmax(ET) is the light- and temperature-dependent maximum growth rate of phytoplankton, and Ltot ( is the minimum of the nutrient limitation factor for DIN (LN) and DIP (LP). Ltot is calculated from nitrate (NO3), ammonium (NH4), and DIP using Eqs. (2)–(5) below.
Following Laurent et al. (2012), we assume in the following analysis that N is limiting when Ltot<0.85 and LN<LP, whereas P is limiting when Ltot<0.85 and LP<LN. Although this threshold is somewhat arbitrary, our assumption is only used to describe the regions where N and P are most limiting, and therefore, the selected value does not influence the simulation results, only their interpretation.
2.3 Simulations
All the simulations were run for 8 years with daily output. The first 2 years were considered spin-up, and the period 1 January 2008 to 31 December 2013 was used for analysis. The “baseline” simulation, as described above, is identical to Zhang et al. (2020). To assess the effect of P limitation, the baseline is compared to a simulation without P limitation (“NoPlim”), which is implemented by disabling P in the biological model but otherwise keeping everything identical to the “baseline” simulation. Because this model did not include P, it simulated the situation without any P limitation. In addition, 15 scenario simulations were carried out where riverine N, riverine P, and riverine N and P concentrations were decreased stepwise in 20 % increments. Otherwise, these simulations were identical to the baseline simulation. Each reduction level is applied to all nutrient subspecies (i.e., dissolved inorganic, dissolved and particulate organic).
For analysis, the shelf region adjacent to the Changjiang Estuary (CE) is divided into six zones. Zone 1 represents the Jiangsu coastal area (z<25 m; lat: 31.70∘–33.50∘). Zones 2 and 3 are the northern and southern hypoxia cores, respectively, defined in Zhang et al. (2020). Zone 4 represents the Yangtze Bank area (z<50 m; lat: 30.75∘–33.50∘), whereas Zones 5 (lat: 30.75∘–33.50∘) and 6 (lat: 28.52∘–30.75∘) represent the northern and southern deep shelf waters (50<z<100 m), respectively.
3.1 Riverine input
DIN and DIP concentrations are high year-round in the Changjiang (Fig. 2), although DIP concentration tends to peak in the fall, whereas DIN concentrations can vary from year to year. DIN and DIP loads are highly correlated with freshwater discharge (Pearson's correlations of 0.95 and 0.98, respectively), and therefore, their annual maxima occur at the time of highest discharge, usually from June to August. The DIN : DIP ratio is 69 on average, well above the Redfield ratio of 16, and ranges from 54 to 78. Hence, nutrient loads from the Changjiang are conducive to P limitation on the continental shelf near the CE.
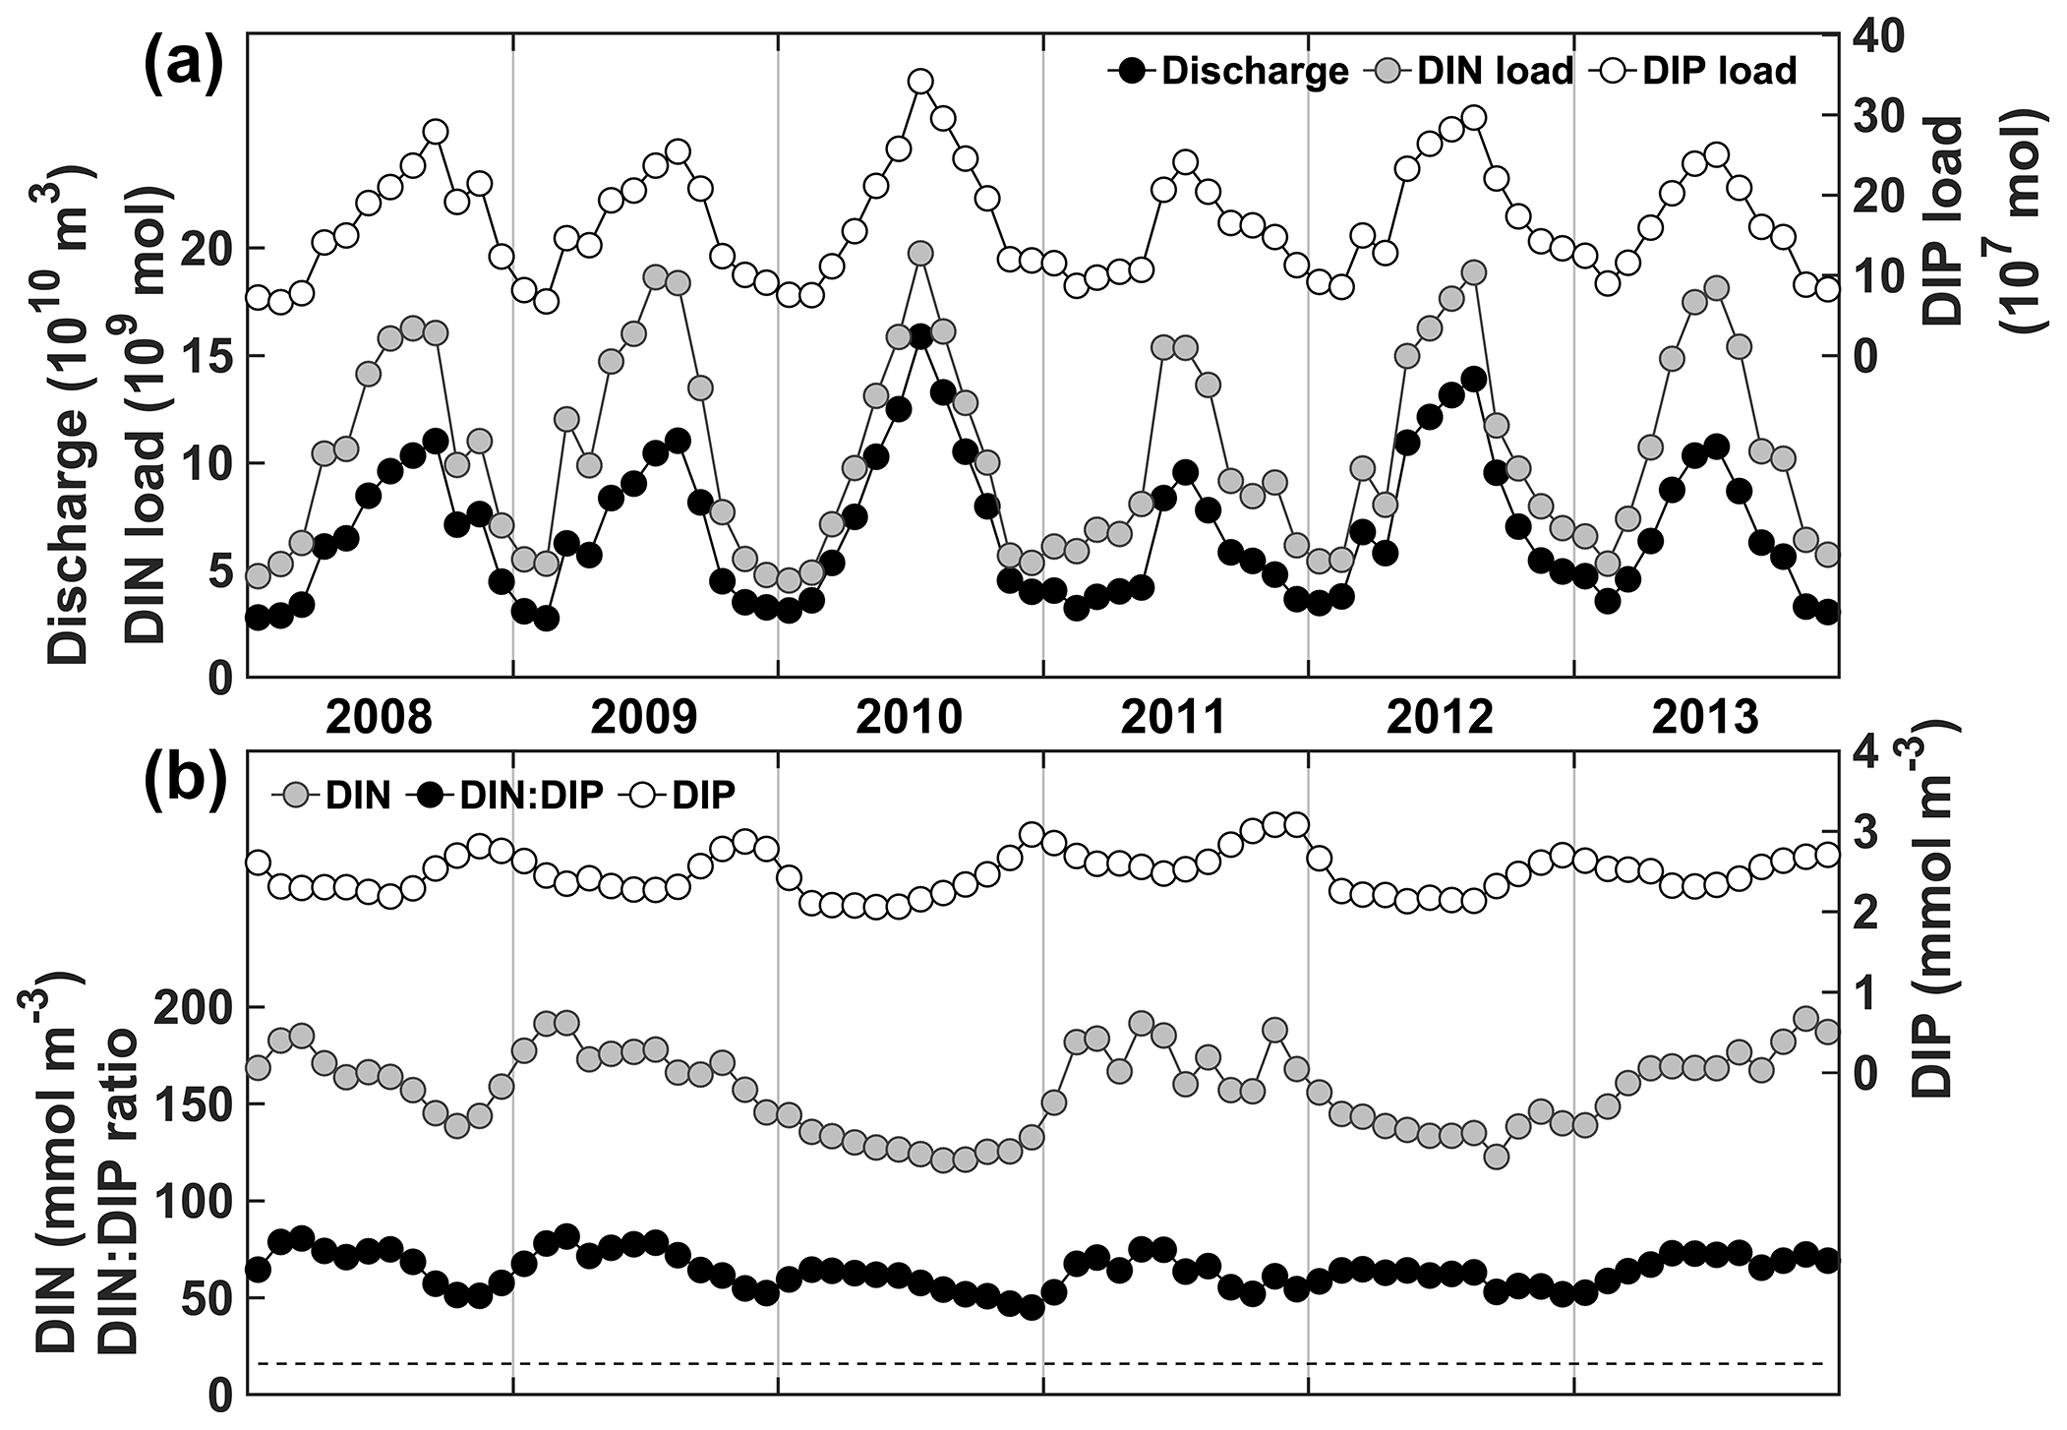
Figure 2Changjiang river forcing data. (a) Freshwater discharge from the Datong hydrological station (Fig. 1) and nutrient loads. (b) Nutrient concentrations and ratio.
3.2 Surface nutrient concentration
In fall and winter, the Changjiang plume is restricted to the coast, and the surface PO4 concentration is high (>2 mmol m−3) in the CE and Hangzhou Bay (Fig. 3a, d). PO4 concentration in the plume is at an annual maximum at this time, and PO4 is transported southwestward with the plume along the Zhejiang coast. The circulation reverses in spring when the plume transports Changjiang waters offshore northeastward over the Yangtze Bank (Fig. 3b). Offshore transport is at its annual maximum in summer (Fig. 3c). PO4 is ∼ 2 mmol m−3 in the CE, but plume concentrations decrease to very low values offshore (Fig. 3e, g, h, k). NO3 follows similar seasonal and spatial patterns, but plume concentrations remain elevated offshore in summer (20–40 mmol m−3; Fig. S1), contrasting with PO4 concentrations.
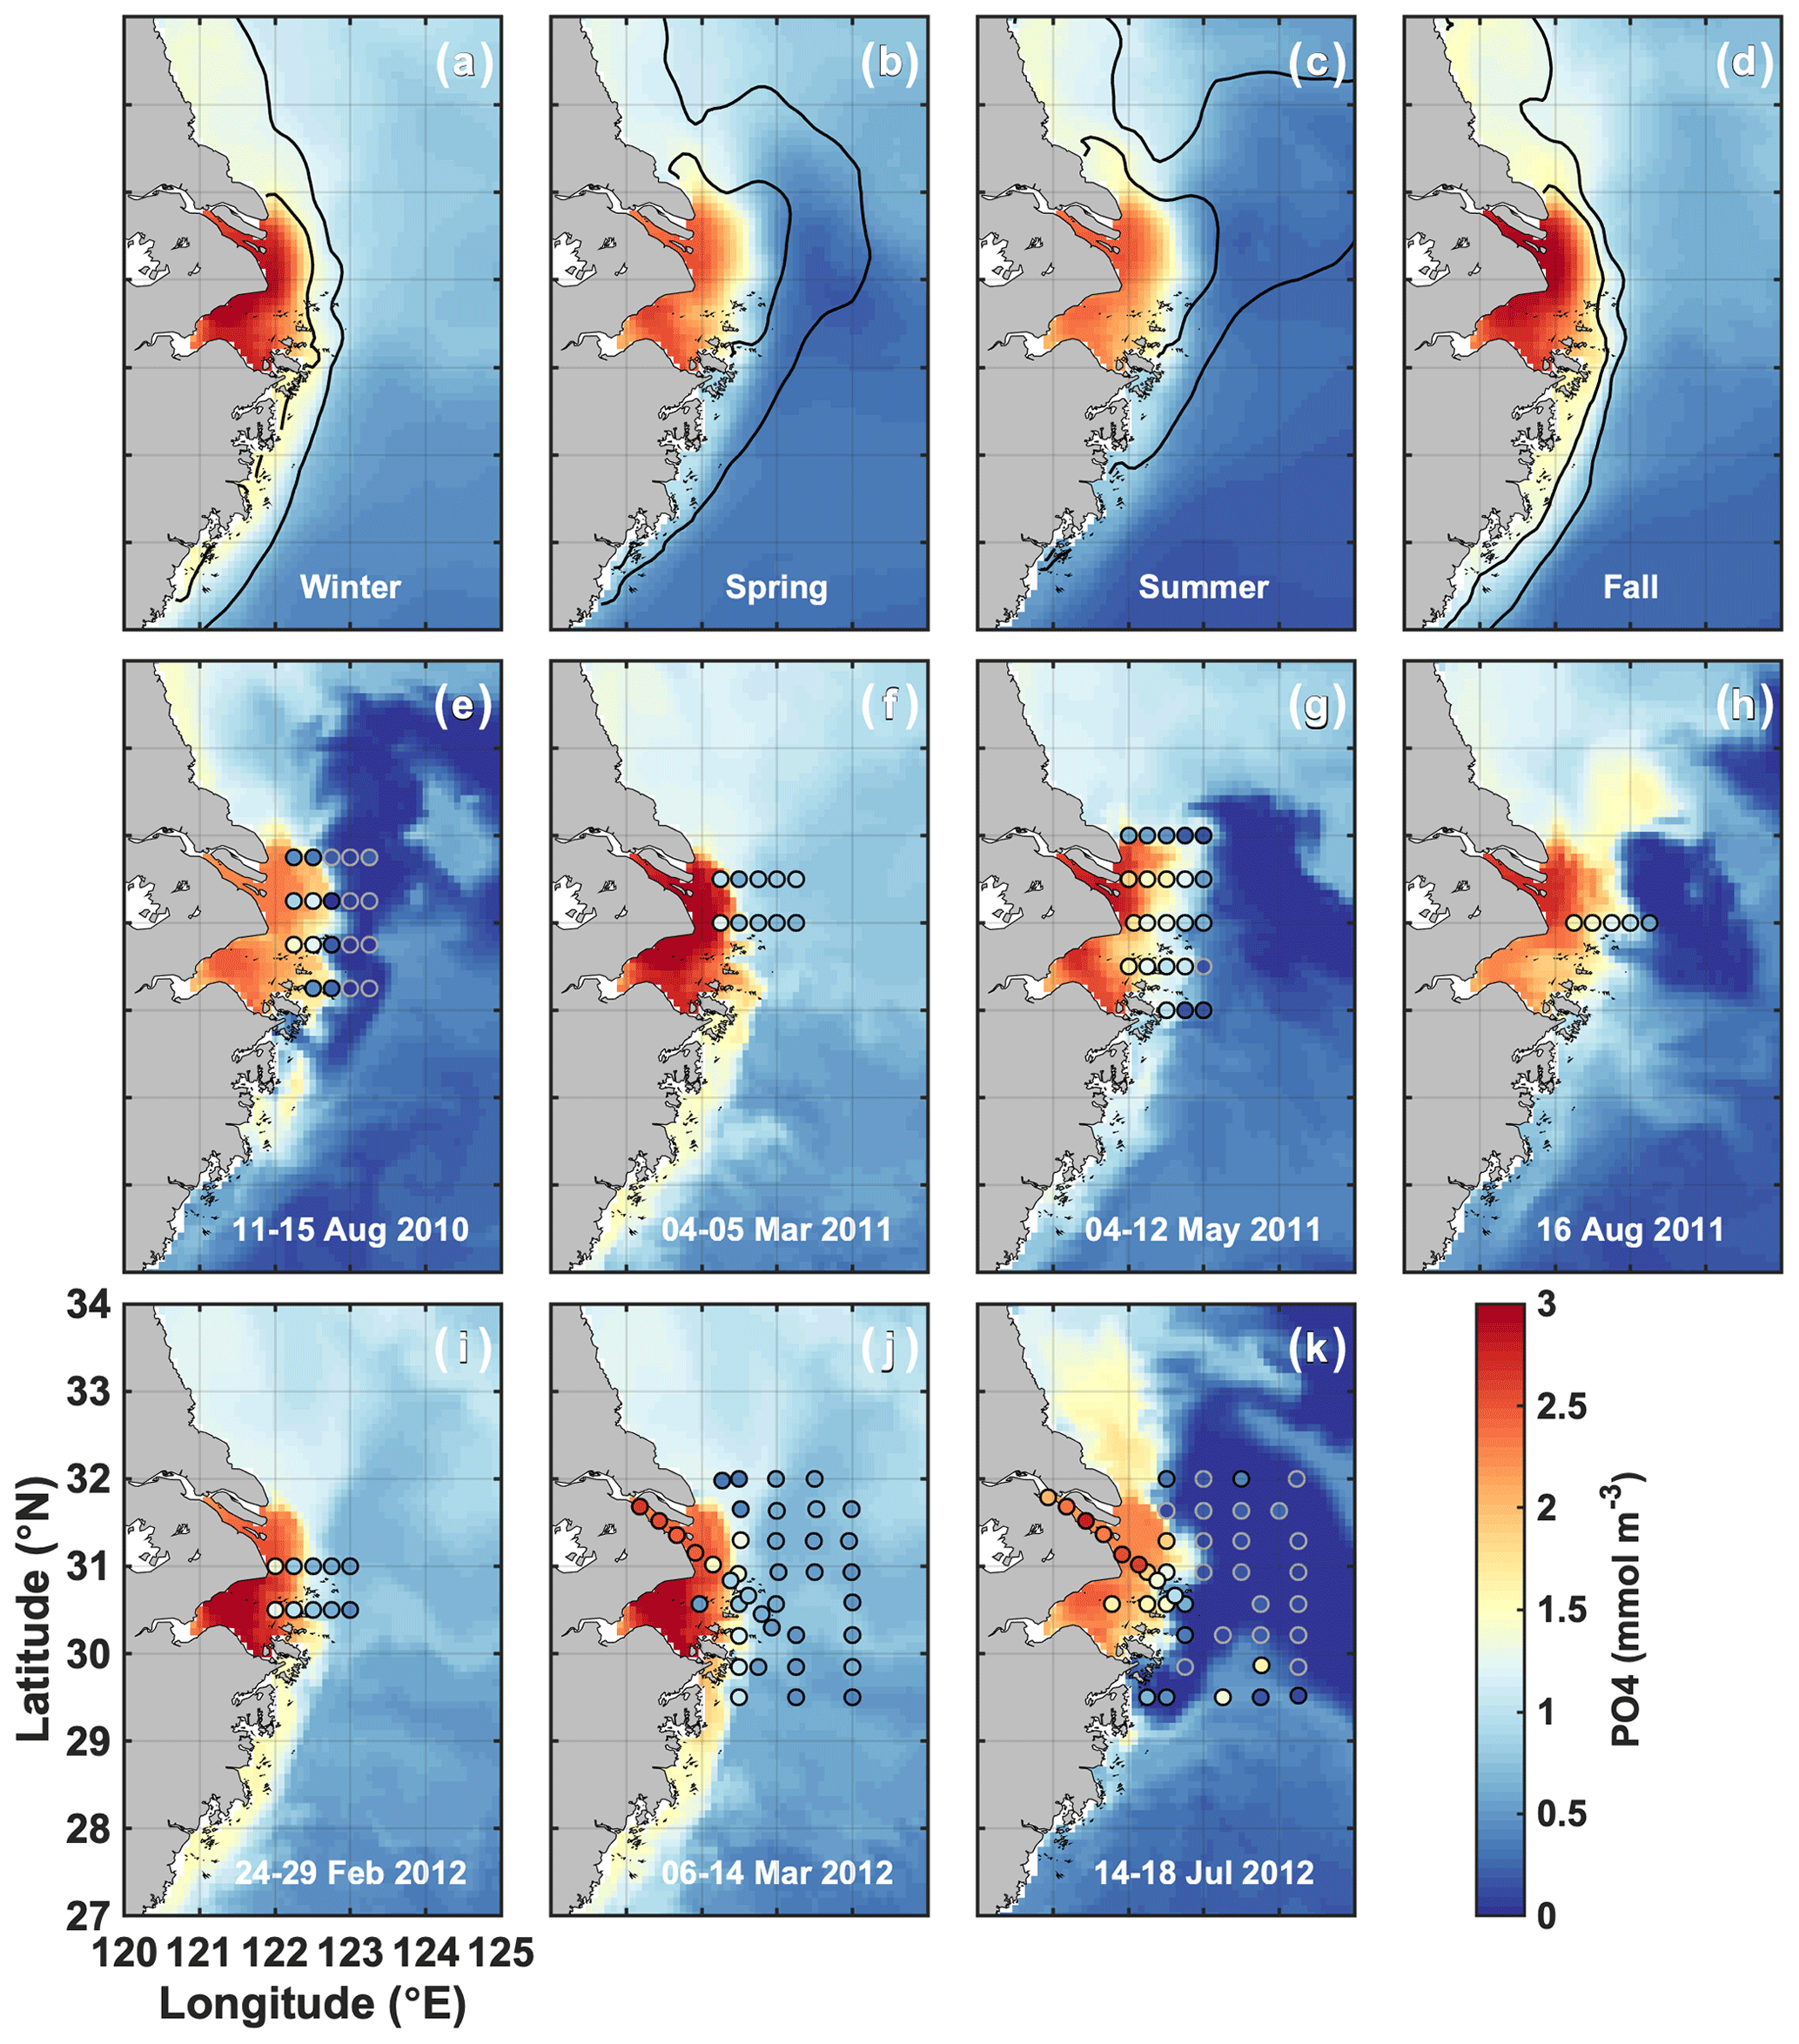
Figure 3(a–d) Simulated seasonal means of surface PO4 (2008–2013). The black contours indicate the 25 and 30 isohalines. (e–k) Comparison of simulated surface PO4 (colored maps) with the observations of Gao et al. (2015) for the dates indicated in each panel (colored dots). Simulated PO4 corresponds to the average conditions during the cruise.
Simulated surface nutrient concentrations are compared with the observations of Gao et al. (2015) in Fig. 3e–k (PO4) and Ge et al. (2020) in the Supplement Fig. S1 (NO3). PO4 and NO3 concentrations compare reasonably well with Pearson's correlation coefficients of 0.75 and 0.84, respectively. The model simulates the observed CE offshore gradient, as well as the magnitude of nutrient concentrations in the CE and the Changjiang plume. The model also captures the locations of PO4 and NO3 depletion in offshore waters in summer.
3.3 P limitation on the ECS shelf
The spatial distribution of nutrient limitation is shown in Fig. 4. As mentioned earlier, we assume hereafter that N or P limitation occurs when the limitation factor is <0.85, and otherwise there is light limitation or no limitation. In Fig. 4, the daily occurrence of such conditions for N and P is presented as an annual average (days of N or P limitation per year). Near the CE, nutrient concentrations are high (see Figs. 3 and S1), and neither N (left panel) nor P (right panel) is limiting. Nonetheless, light can limit phytoplankton growth in this region (Zhang et al., 2020). Offshore (z>5 m) and outside the freshwater plume and along the northern Jiangsu coast, N is limiting for most of the year. P limitation occurs for 2–3 months near and on the Yangtze Bank in zones 2 and 4. It also occurs occasionally further east and in zone 3 but never in the coastal area north of the CE where N is limiting. N limitation is prevalent offshore (zones 5 and 6).

Figure 4Annual duration in days of N (a) and P (b) limitation in surface waters. The grey contours indicate the limits of the six zones (see Fig. 1).
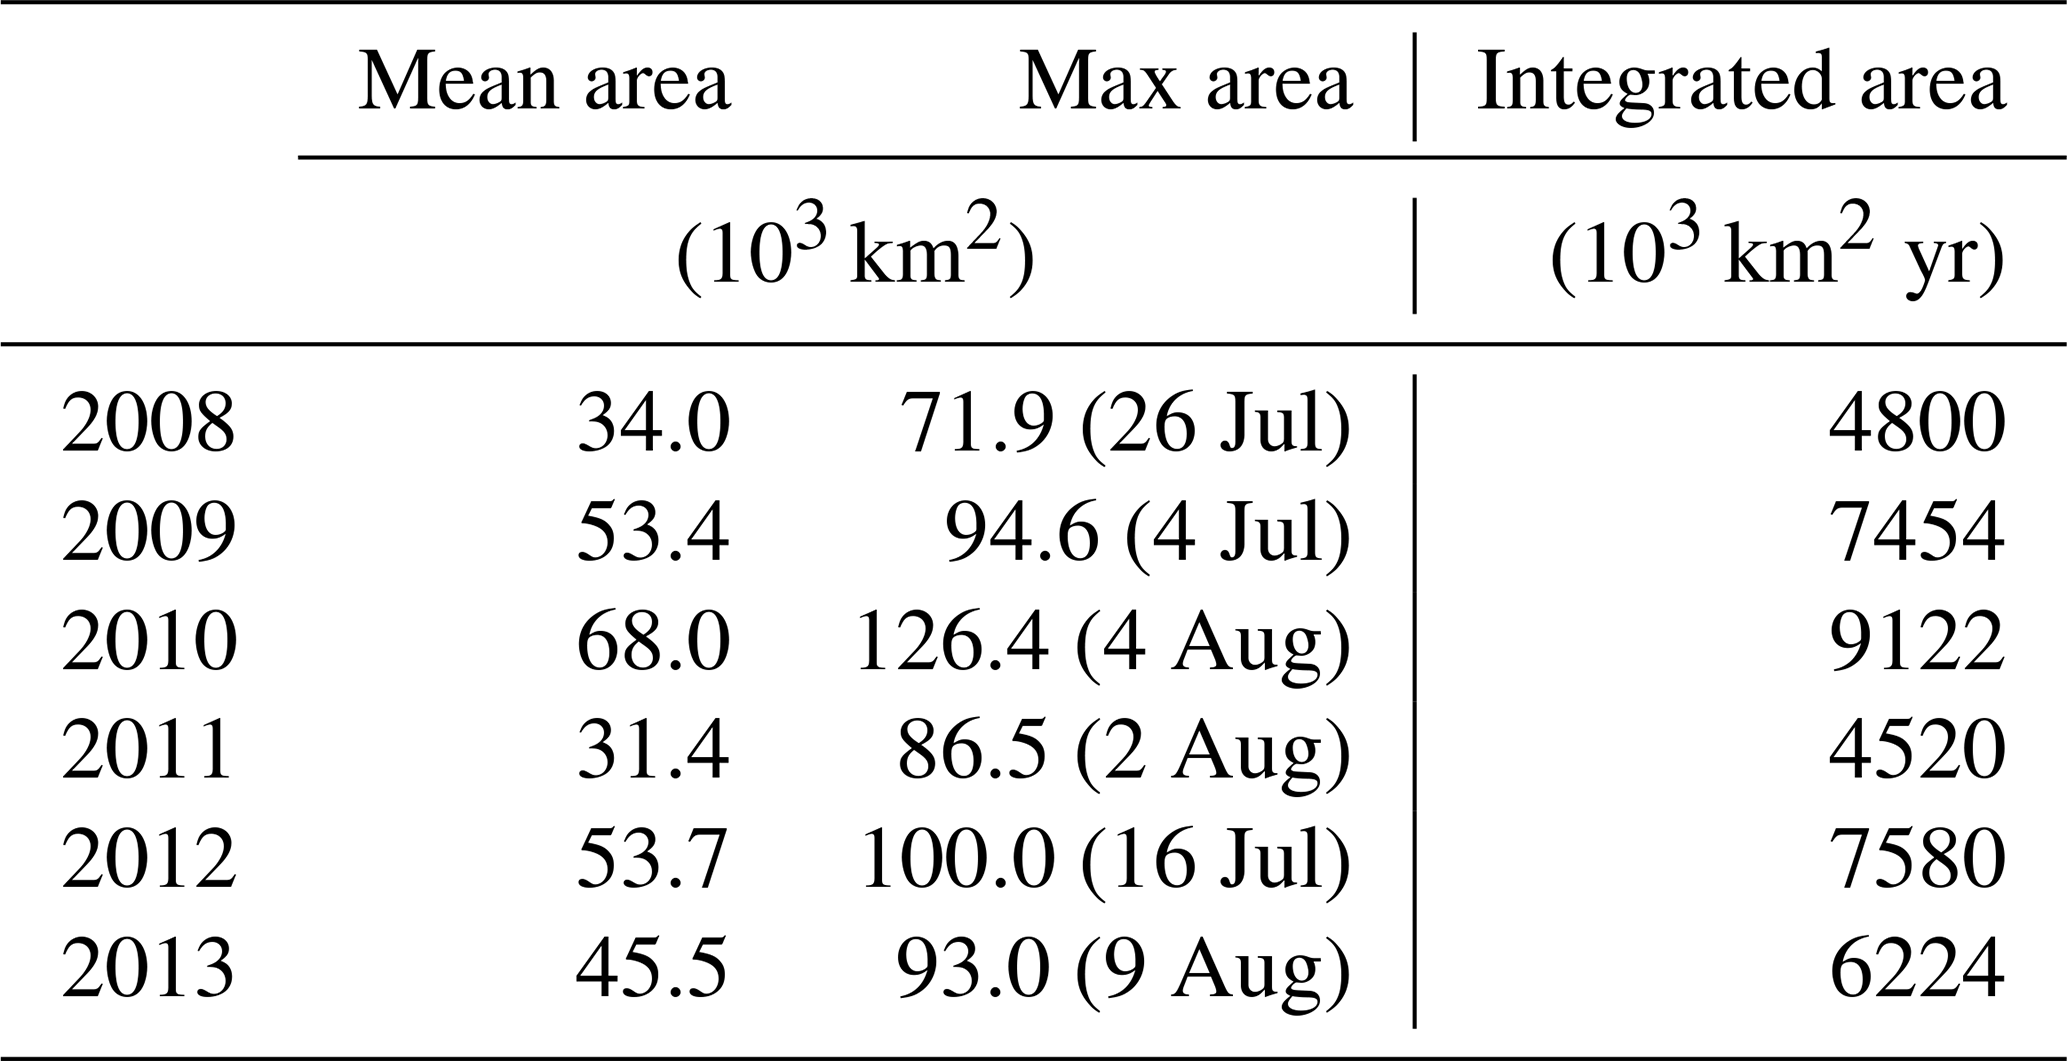
Spatial variability in P limitation occurs mainly along a west–east axis from the CE, in particular along the CE–Jeju Island (JI) line (northeastward; Fig. 1). The variability along this axis is presented through CE–JI transects in Figs. 5, 6, and S2. P limitation develops about 100 km offshore of the CE between May and September (Fig. 5) and is found sporadically all the way to Jeju Island in August–September. Outside of a 100–150 km wide area that forms the core of seasonal P limitation, mostly within zone 4, the occurrence of P limitation is variable and depends on the offshore expansion of the Changjiang plume, as represented by the 29 isohaline in Fig. 5. For example, in 2010 (high discharge; Fig. 2) P limitation occurred over 68.0 × 10³ km2 on average (May–August), extending all the way to Jeju Island for >2 weeks in August. In comparison, P limitation covered only 31.4 × 10³ km2 on average in 2011 (low discharge). The maximum annual extent of P limitation usually occurs in late July–early August (95.4 × 10³ km2, 2008–2012 average; Table 1). The annually integrated area of P limitation is highly correlated with freshwater discharge from the Changjiang (r=0.79, p=0.06). Higher discharge promotes a larger and more sustained area of P-limited surface waters.
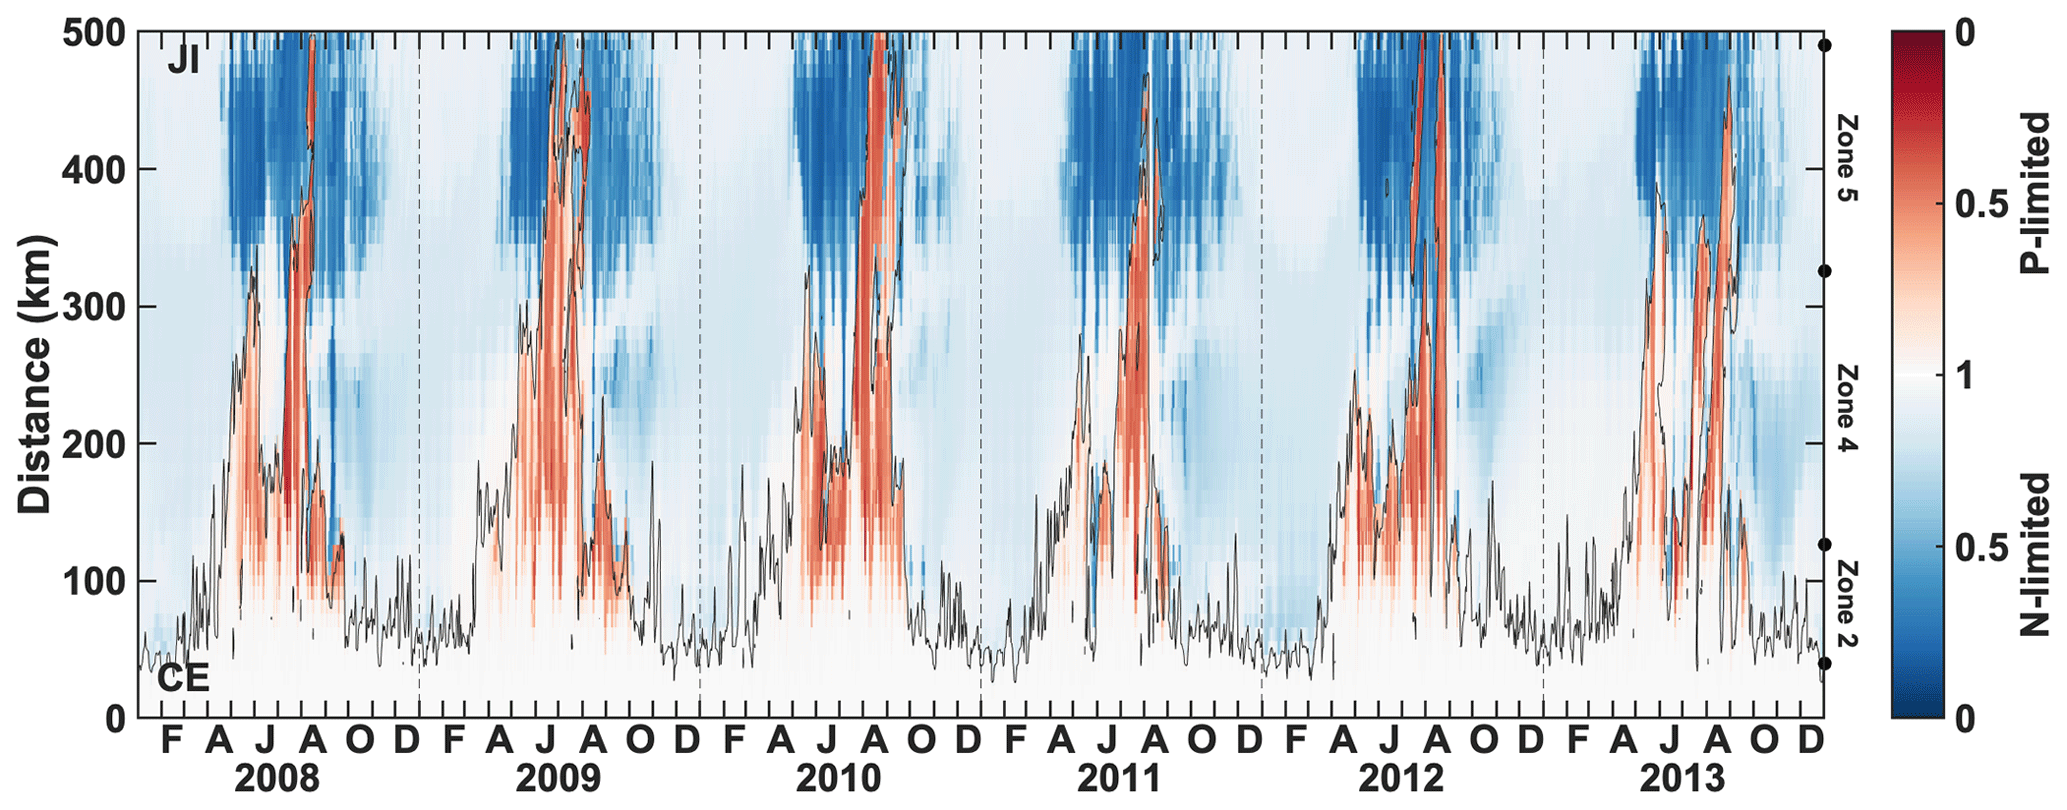
Figure 5Time series of the nutrient limitation factor along the CE–JI transect (see Fig. 1). The color represents the most limiting nutrient at each time and location, either N (blue) or P (red). The thin black line indicates the location of the 29 isohaline. The dots on the right y axis indicate the limits of zones 2, 4, and 5.
Table 1Extent of P limitation on the shelf in 2008–2012 and timing of the maximum area.
In most years, the expansion of P limitation along the transect occurs over two periods: one of limited spatial extent in the spring and the main one in summer (Fig. 5). In spring and summer when the plume does not reach Jeju Island, the shelf area surrounding the island is strongly N-limited.
The vertical distribution along the transect line indicates that P limitation is well developed in late July and occurs mainly in the upper 5 m of zone 4, where the offshore edge of the plume is located (Fig. 6a). Further offshore, outside of the plume, strong N limitation occurs within the upper 10 m. P limitation is more variable and starts to break down in late August (Fig. 6d).
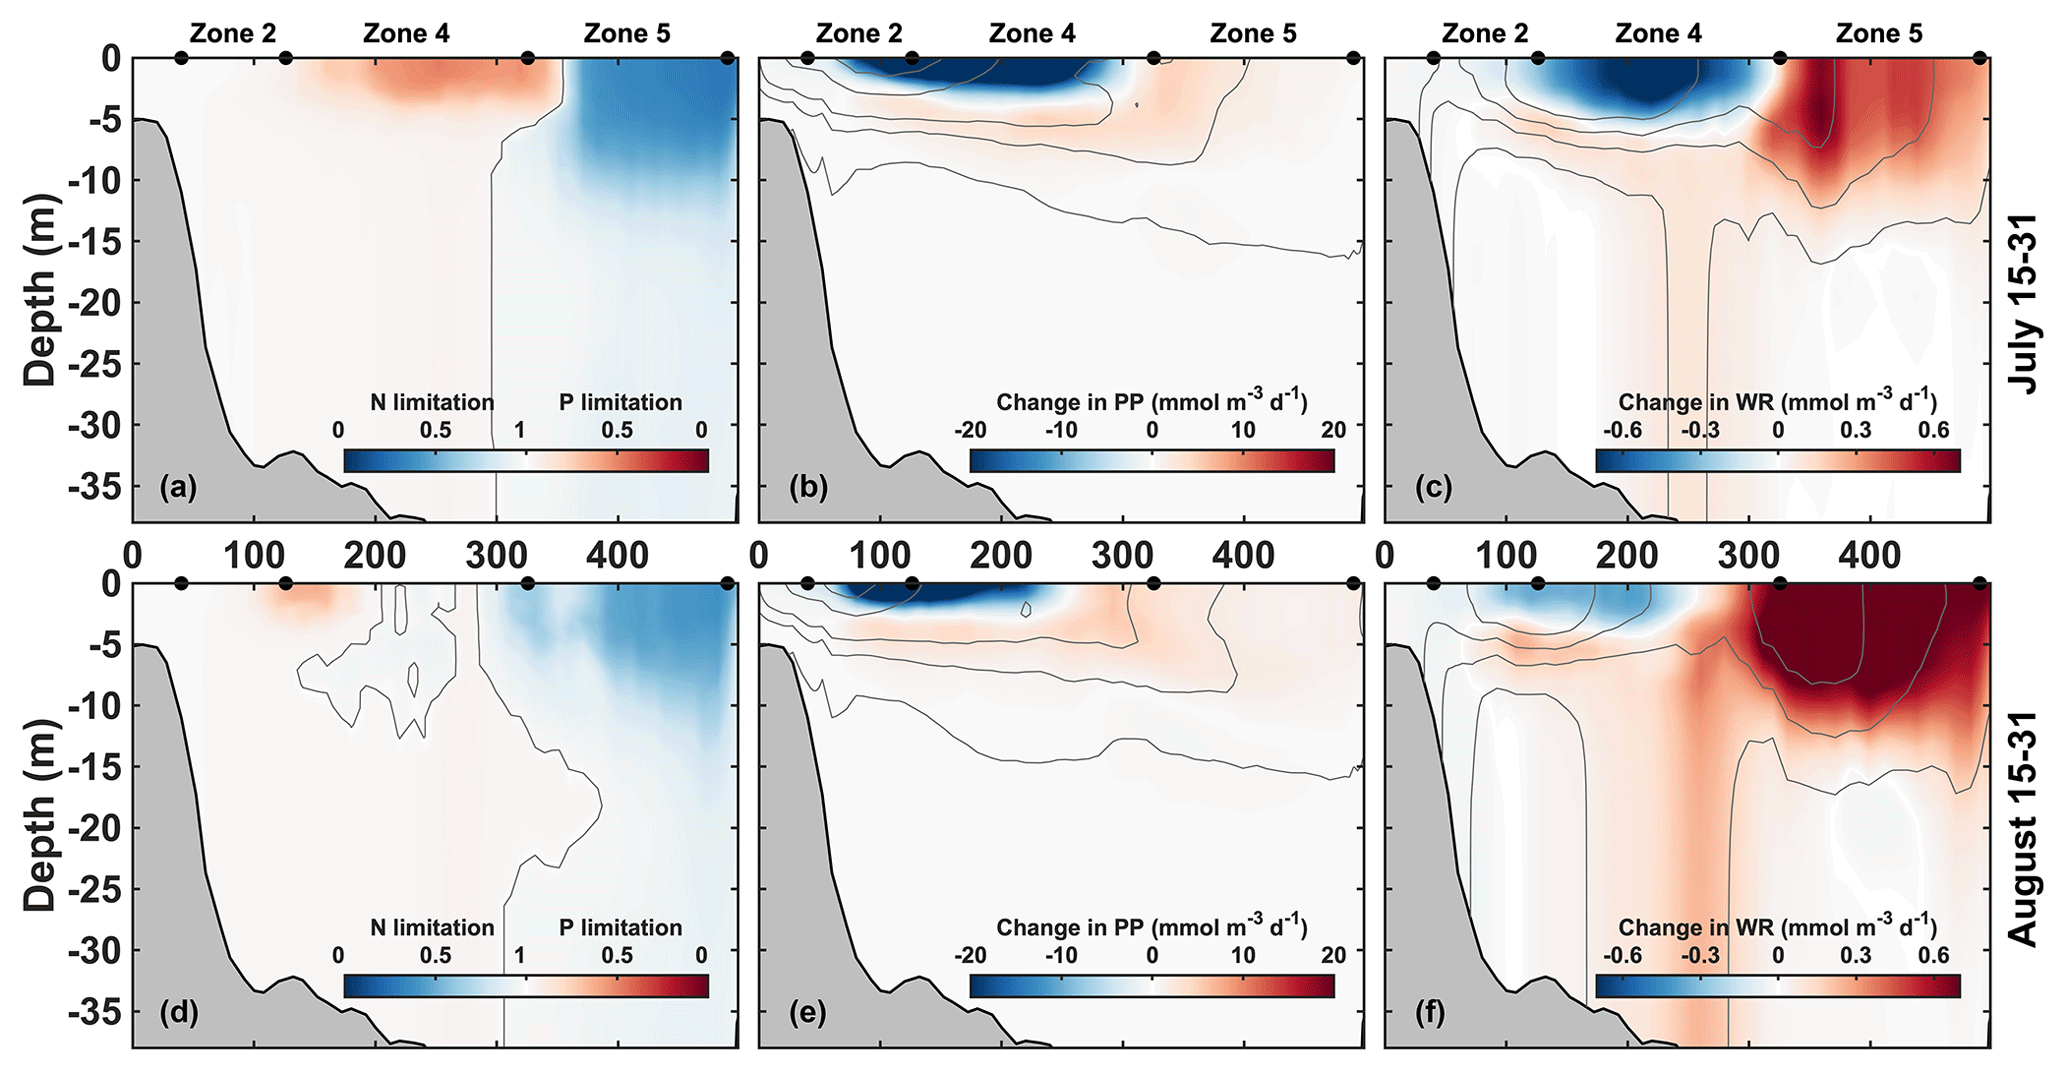
Figure 6Mean vertical transects along the CE–JI line (see Fig. 1) for 15–31 July (a–c) and 15–31 August (d–f). Left panels (a, d): nutrient limitation factors. The color represents the most limiting nutrient at each location and depth, either N (blue) or P (red). Central and right panels: change in primary production (b, e) and water column respiration (c, f) due to P limitation (baseline – NoPlim). Thin grey lines represent the no limitation isoline in panels (a) and (d) (limitation factor = 1) and are indicative of PP and WR contours in panels (b) and (e) and panels (c) and (f), respectively. The x axis is in kilometers from the CE along the CE–JI line.
3.4 Consequences of P limitation
The effects of P limitation are quantified from the difference between the baseline and NoPlim simulations. Along the CE–JI transect, P limitation reduces primary production by 20 and 45 mmol O2 m−2 d−1 on average in July in zones 2 and 4, respectively (Fig. 6b, Supplement Table S1). The reduction occurs at the surface, whereas an increase is found just below (zone 4) and offshore (+45.0 mmol O2 m−2 d−1 in zone 5). The decrease in primary production translates into sediment O2 consumption (SOC) which decreases significantly around zone 4 (−32.9 mmol O2 m−2 d−1; Supplement Fig. S2) and into water column respiration (WR) that is also reduced at the surface in zone 4 (Fig. 6c). This WR reduction is compensated by a subsurface increase; thus, integrated over the water column, the change in WR is negligible in zone 4 in July (Supplement Table S1). The change in respiration can be explained by the effect of particulate organic matter (POM) concentration on POM flux (Supplement Fig. S2). As primary production decreases at the surface of zone 4, less organic matter settles down to the bottom (−4.6 mmol N m−2 d−1). Concurrently, as POM aggregation is proportional to the square of small POM concentration (phytoplankton + small detritus), the POM sinking rate decreases, and proportionally more remineralization occurs in the water column and less in the sediment. This explains the subsurface increase in water column respiration in zone 4 despite the decrease in surface primary production. Further offshore in zone 5, WR increases as well (+5.20 mmol O2 m−2 d−1).
When P limitation breaks down in late August (Fig. 6d–f), primary production is still reduced near the coast (−25.0 mmol O2 m−2 d−1 in zone 2) but increases in the upper 5 m in the northeastern part of zone 4 and in zone 5 (+17.0 mmol O2 m−2 d−1). Concomitantly, a significant increase in water column respiration occurs throughout the water column in the northeastern part of zone 4 (+4.90 mmol O2 m−2 d−1 overall) and in the surface waters of zone 5 (+9.90 mmol O2 m−2 d−1).
Figure 7 provides the spatially integrated seasonal evolution of the effect of P limitation on production and respiration. Note that the zones have different sizes (Fig. 1), and therefore, at the same magnitude, the effect shown in Fig. 7 is spatially more concentrated in smaller areas (zone 2) and more diffuse in larger areas (zones 4–5). Spatially averaged values are also available for each zone in the Supplement Fig. S3. In zone 2, P limitation has a negative effect on primary production that is reduced from April to September (−546 × 108 mol O2 yr−1), whereas it supports primary production in zone 5 from May to October, with a peak in July–August (+684 × 108 mol O2 yr−1; Fig. 7a). In the intermediate zone 4, primary production decreases from April to July and then increases between August and October (−197 × 108 mol O2 yr−1). This temporal switch is also found when the effect of P limitation on primary production is integrated over the shelf (zones 1–6, grey area). Overall, the integrated change in primary production is negligible relative to total primary production (PP; −34.0 × 10⁸ mol O2 yr−1; Supplement Table S2). The spatial relocation also occurs in the O2 sinks, but simultaneously, there is a shift in respiration from the sediment to the water column (Fig. 7b–c). Water column respiration does not change significantly in zone 2 (−21.0 × 10⁸ mol O2 yr−1) but increases in zones 4 (August–October, +188 × 108 mol O2 yr−1) and 5 (June–October, +329 × 108 mol O2 yr−1; Fig. 7b). Sediment respiration increases simultaneously in zone 5 (+202 × 108 mol O2 yr−1; Fig. 7c), somewhat compensating for the decrease in zone 2 (−271 × 108 mol O2 yr−1). A large decrease in sediment respiration occurs in zone 4 between May and August (−553 × 108 mol O2 yr−1; Fig. 7c). The shift in respiration is clear when integrating over the shelf (shaded areas in Fig. 7b–c). The negative effect on sediment respiration is larger than the positive effect on water column respiration, and therefore, the total change in respiration over the shelf (zones 1–6) is −164 × 108 mol O2 yr−1 (Supplement Table S2).
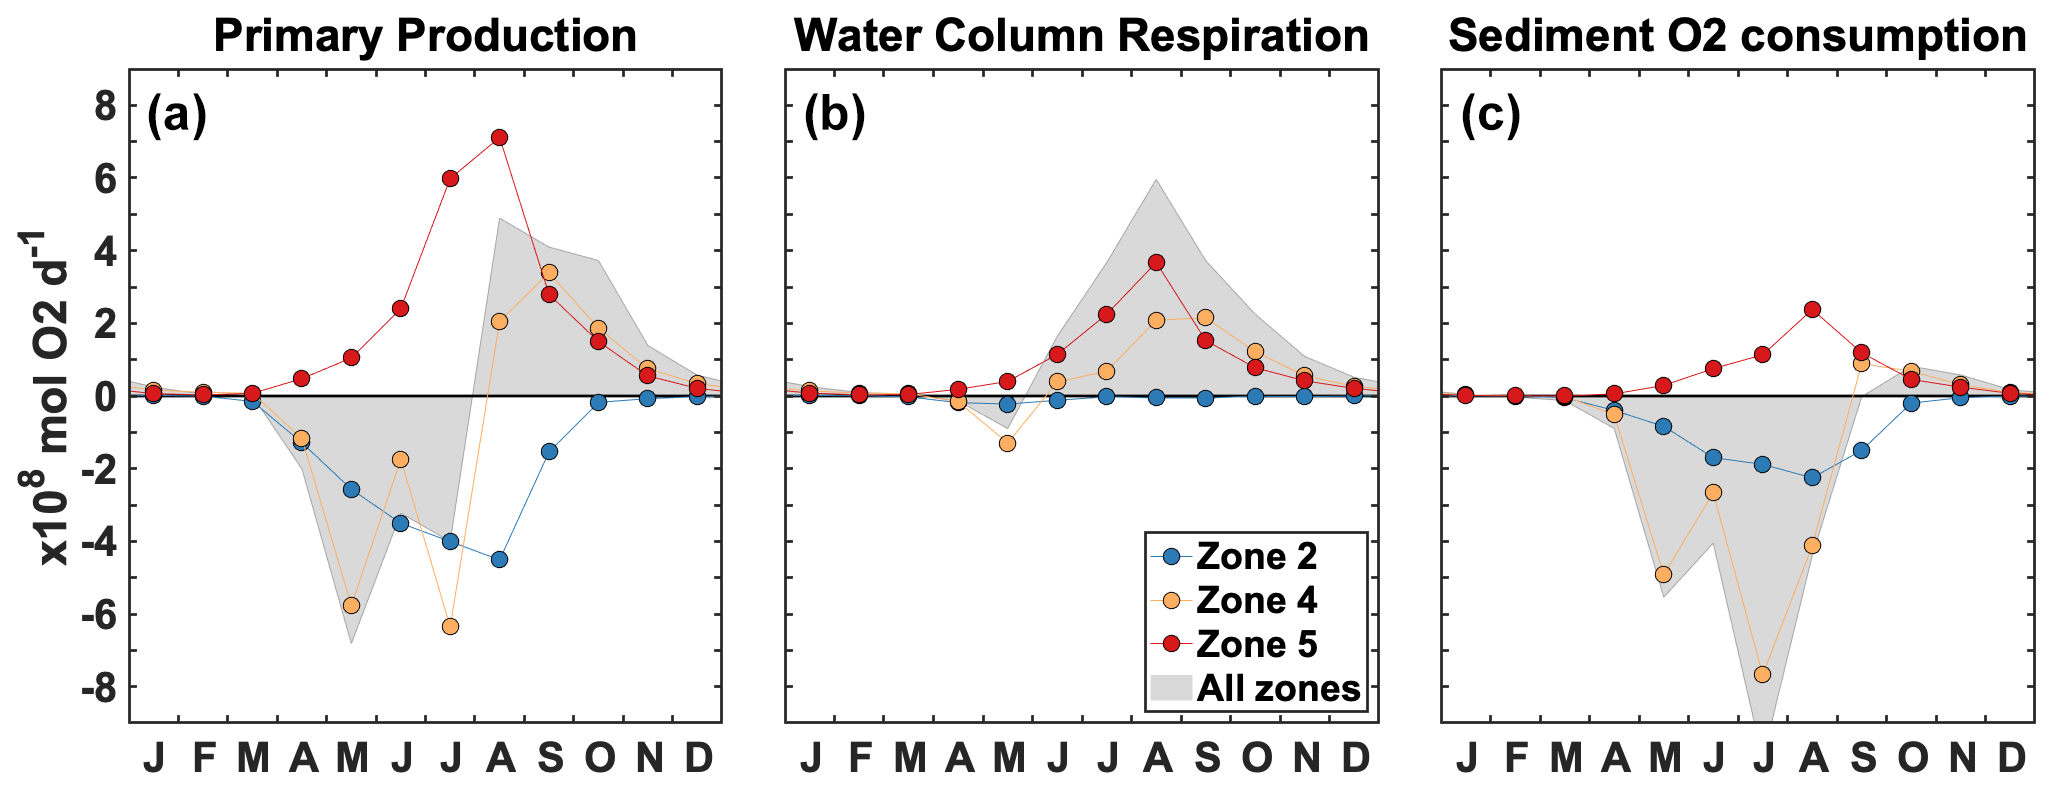
Figure 7Spatially integrated change due to P limitation for primary production (a), water column respiration (b), and sediment O2 consumption (c) in zone 2 (blue), zone 4 (orange), zone 5 (red), and zones 1–6 combined (shaded area). Each dot represents a monthly mean for 2008–2013.
The effect of P limitation on respiration influences the duration and spatial extent of hypoxia mainly north of 30∘ N (Fig. 8a). The largest effect occurs in the region adjacent to the CE where hypoxia duration decreases by up to 31 d yr−1 on average. Hypoxia extends further north and northeast into zone 4 without P limitation; hypoxia is less frequent in this area but can last up to 20 d yr−1 on average (Fig. 8a). The areal difference in the region exposed to hypoxia with and without P limitation is 21 957 km2, which represents a 34 % decrease due to P limitation (Fig. 8a). Integrating hypoxia in time and/or space is informative for the effect of P limitation (Fig. 9). Typically, the hypoxic area starts developing in June and extends throughout August to reach its maximum size in early September (Fig. 9a). The effect of P limitation on the hypoxic area is large in August and remains significant at the peak extent in September. The decrease in hypoxia extent occurs mainly in zones 2 and 4, with a small additional decrease in zone 3 in September and October (Fig. 9b). In zone 2, the change is somewhat proportional to the size of the hypoxic area, whereas in zone 4 most of the effect is concentrated in August, hence the large decrease in hypoxic area in August.
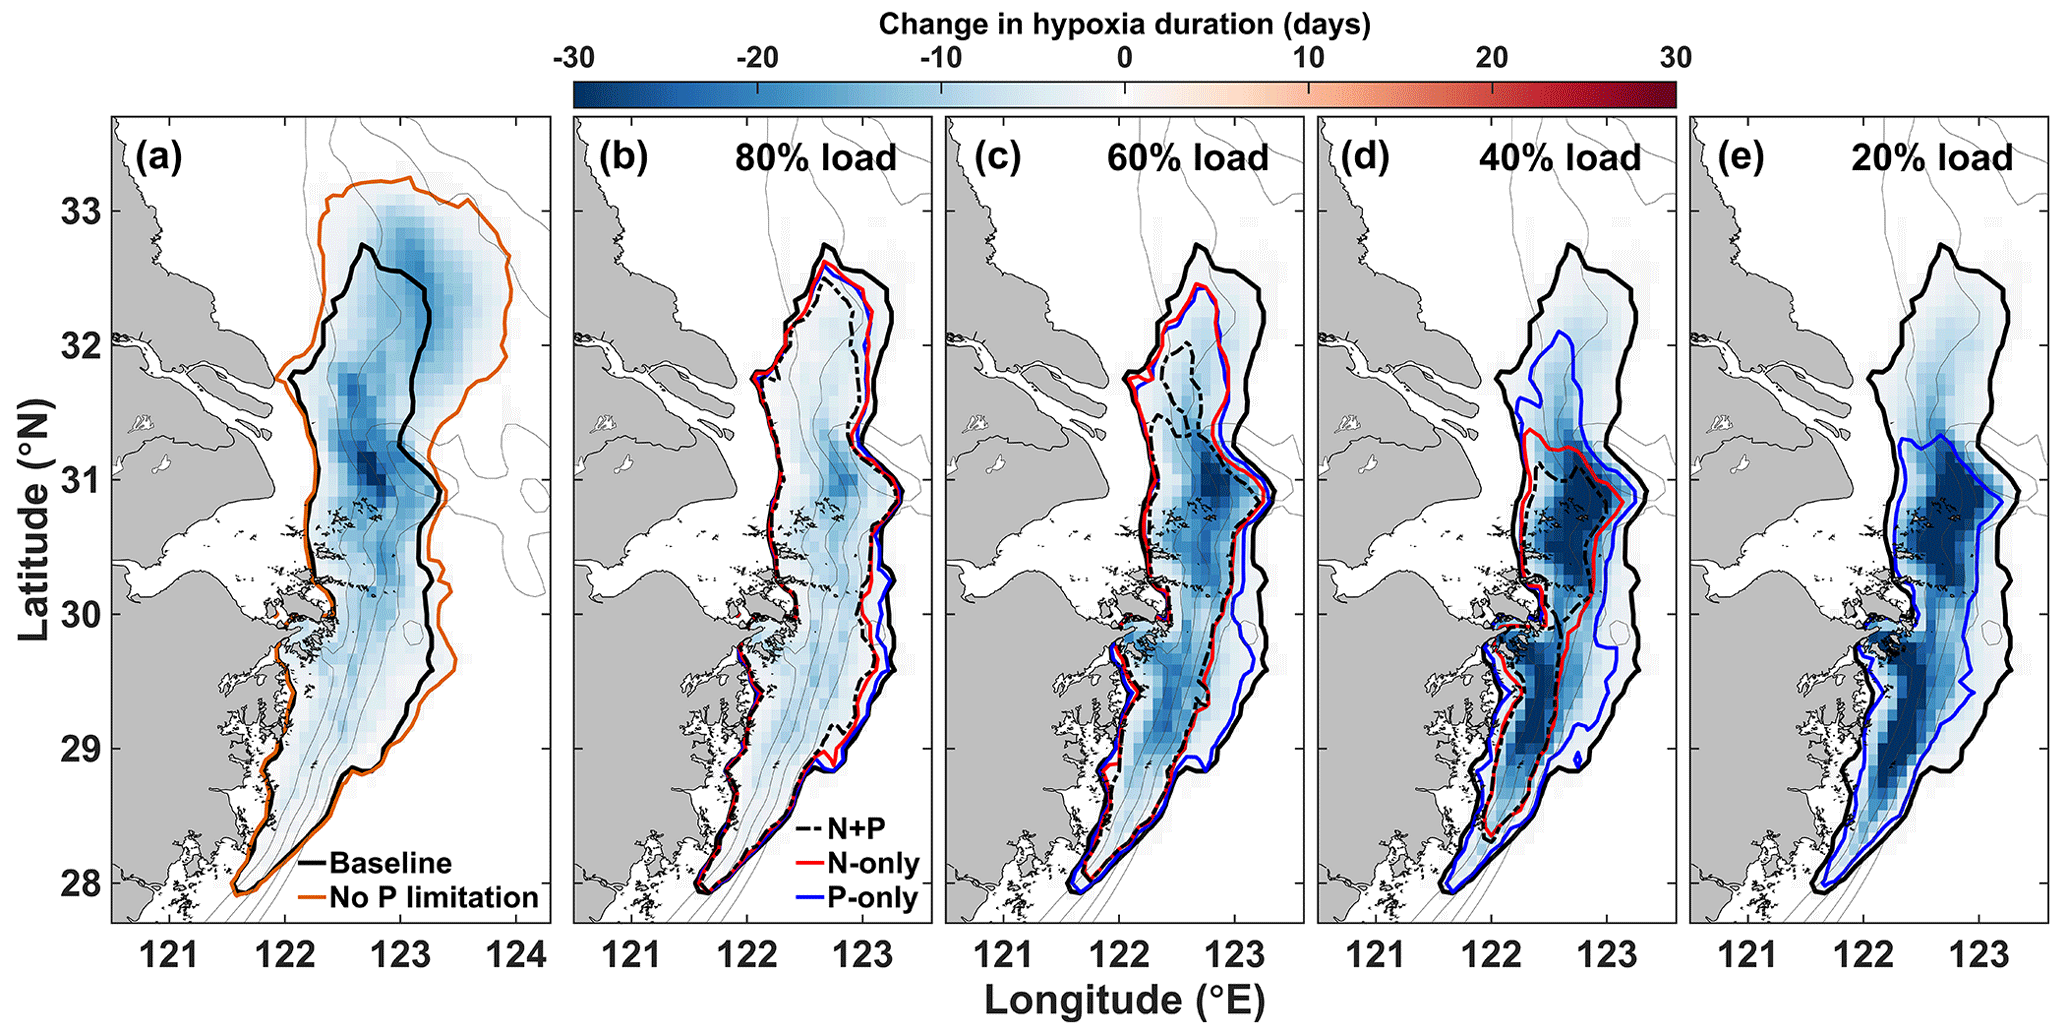
Figure 8Change in hypoxia duration due to (a) P limitation (baseline – NoPlim) and to (b–e) nutrient reduction in the Changjiang. The black contour indicates the area where annual hypoxia duration is at least 1 d in the baseline simulation (2008–2013 mean). The orange contour (a) and the dashed red and blue contours (b–e) are the equivalents in the NoPlim and nutrient load simulations, respectively.

Figure 9Averaged hypoxic area in the baseline (blue) and NoPlim (red) simulations (a) and difference in time-integrated hypoxic area for each zone (baseline – NoPlim) (b). Both panels represent averaged values for 2008–2013.
3.5 Effects of altered nutrient loads
Reducing N and/or P concentration in the Changjiang river affects the spatial distribution and the duration of hypoxia on the shelf (Fig. 8b–e). Lowering nutrient concentrations first reduces hypoxia duration in the northern hypoxia core next to the Changjiang Estuary (Fig. 8b–c). The effect of nutrient reduction extends to the southern hypoxia core at higher reduction levels (Fig. 8c–d). The spatial differences for each reduction type (N + P, N-only, or P-only) are small for a 20 % reduction (corresponding to 80 % load; Fig. 8b) but significant at a 40 % nutrient reduction or more (Fig. 8c–e). N + P and N-only reductions have a similar effect on hypoxia reduction in the southern area (zone 3), but N + P reduction enhances hypoxia reduction in the northern area (zone 2). The N + P and N-only reduction strategies reduce hypoxia to the two core zones at a 60 % nutrient reduction level (Fig. 8d) and lead to normoxic waters with an 80 % reduction (Fig. 8e). On the contrary, hypoxia remains widely distributed with a P-only strategy, especially in the southern hypoxia core that does not respond to P reduction. Even at 80 % P reduction the effect on hypoxia is limited in this area (Fig. 8e).
The general outcome of the three strategies is explored by integrating the hypoxic area over time in zones 2–3 and over all areas at various nutrient loadings (Fig. 10, Table 2, and the Supplement Tables S3 and S4). The N + P strategy has the largest effect on hypoxia over the ECS. At 80 % and 60 % of the original river N + P load, hypoxia is reduced on average by 37 % and 69 %, respectively (Table 2). The N-only strategy has a lesser effect, whereas the effect of a P-only strategy is limited. The P limitation effect on hypoxia is not spatially homogeneous and varies between zone 2 (north) and zone 3 (south) (Fig. 10, Supplement Tables S3 and S4). N + P reduction is clearly the best strategy to reduce hypoxia in zone 2, whereas N-only and P-only have a similar effect at low to intermediate reductions, and P-only has less of an effect at high P reduction. Although N + P reduction has the largest effect on hypoxia in zone 3, there is little difference with the N-only strategy. In this region the P-only strategy has a much smaller effect on hypoxia.
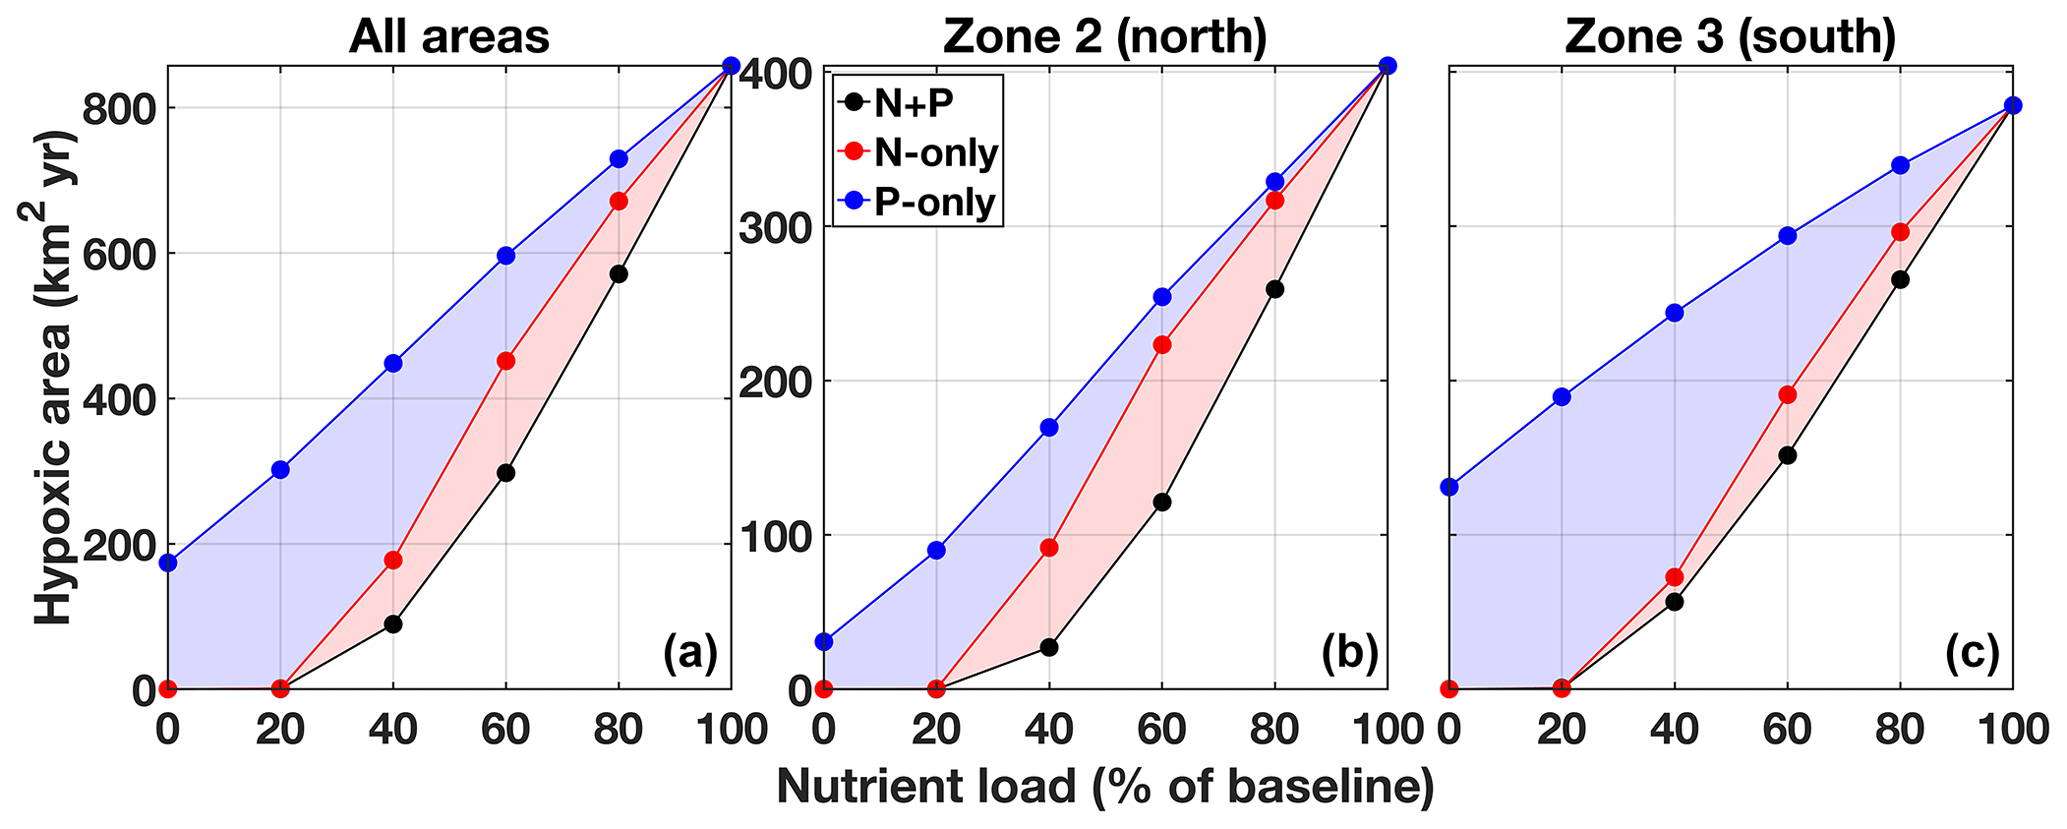
Figure 10Effect of nutrient reduction on the size of the hypoxic area (time integrated) for zones 1–6 combined (a), zone 2 (b), and zone 3 (c). The results presented are an average for 2008–2010. The equivalent for 2011–2013 is presented in the Supplement Fig. S4.
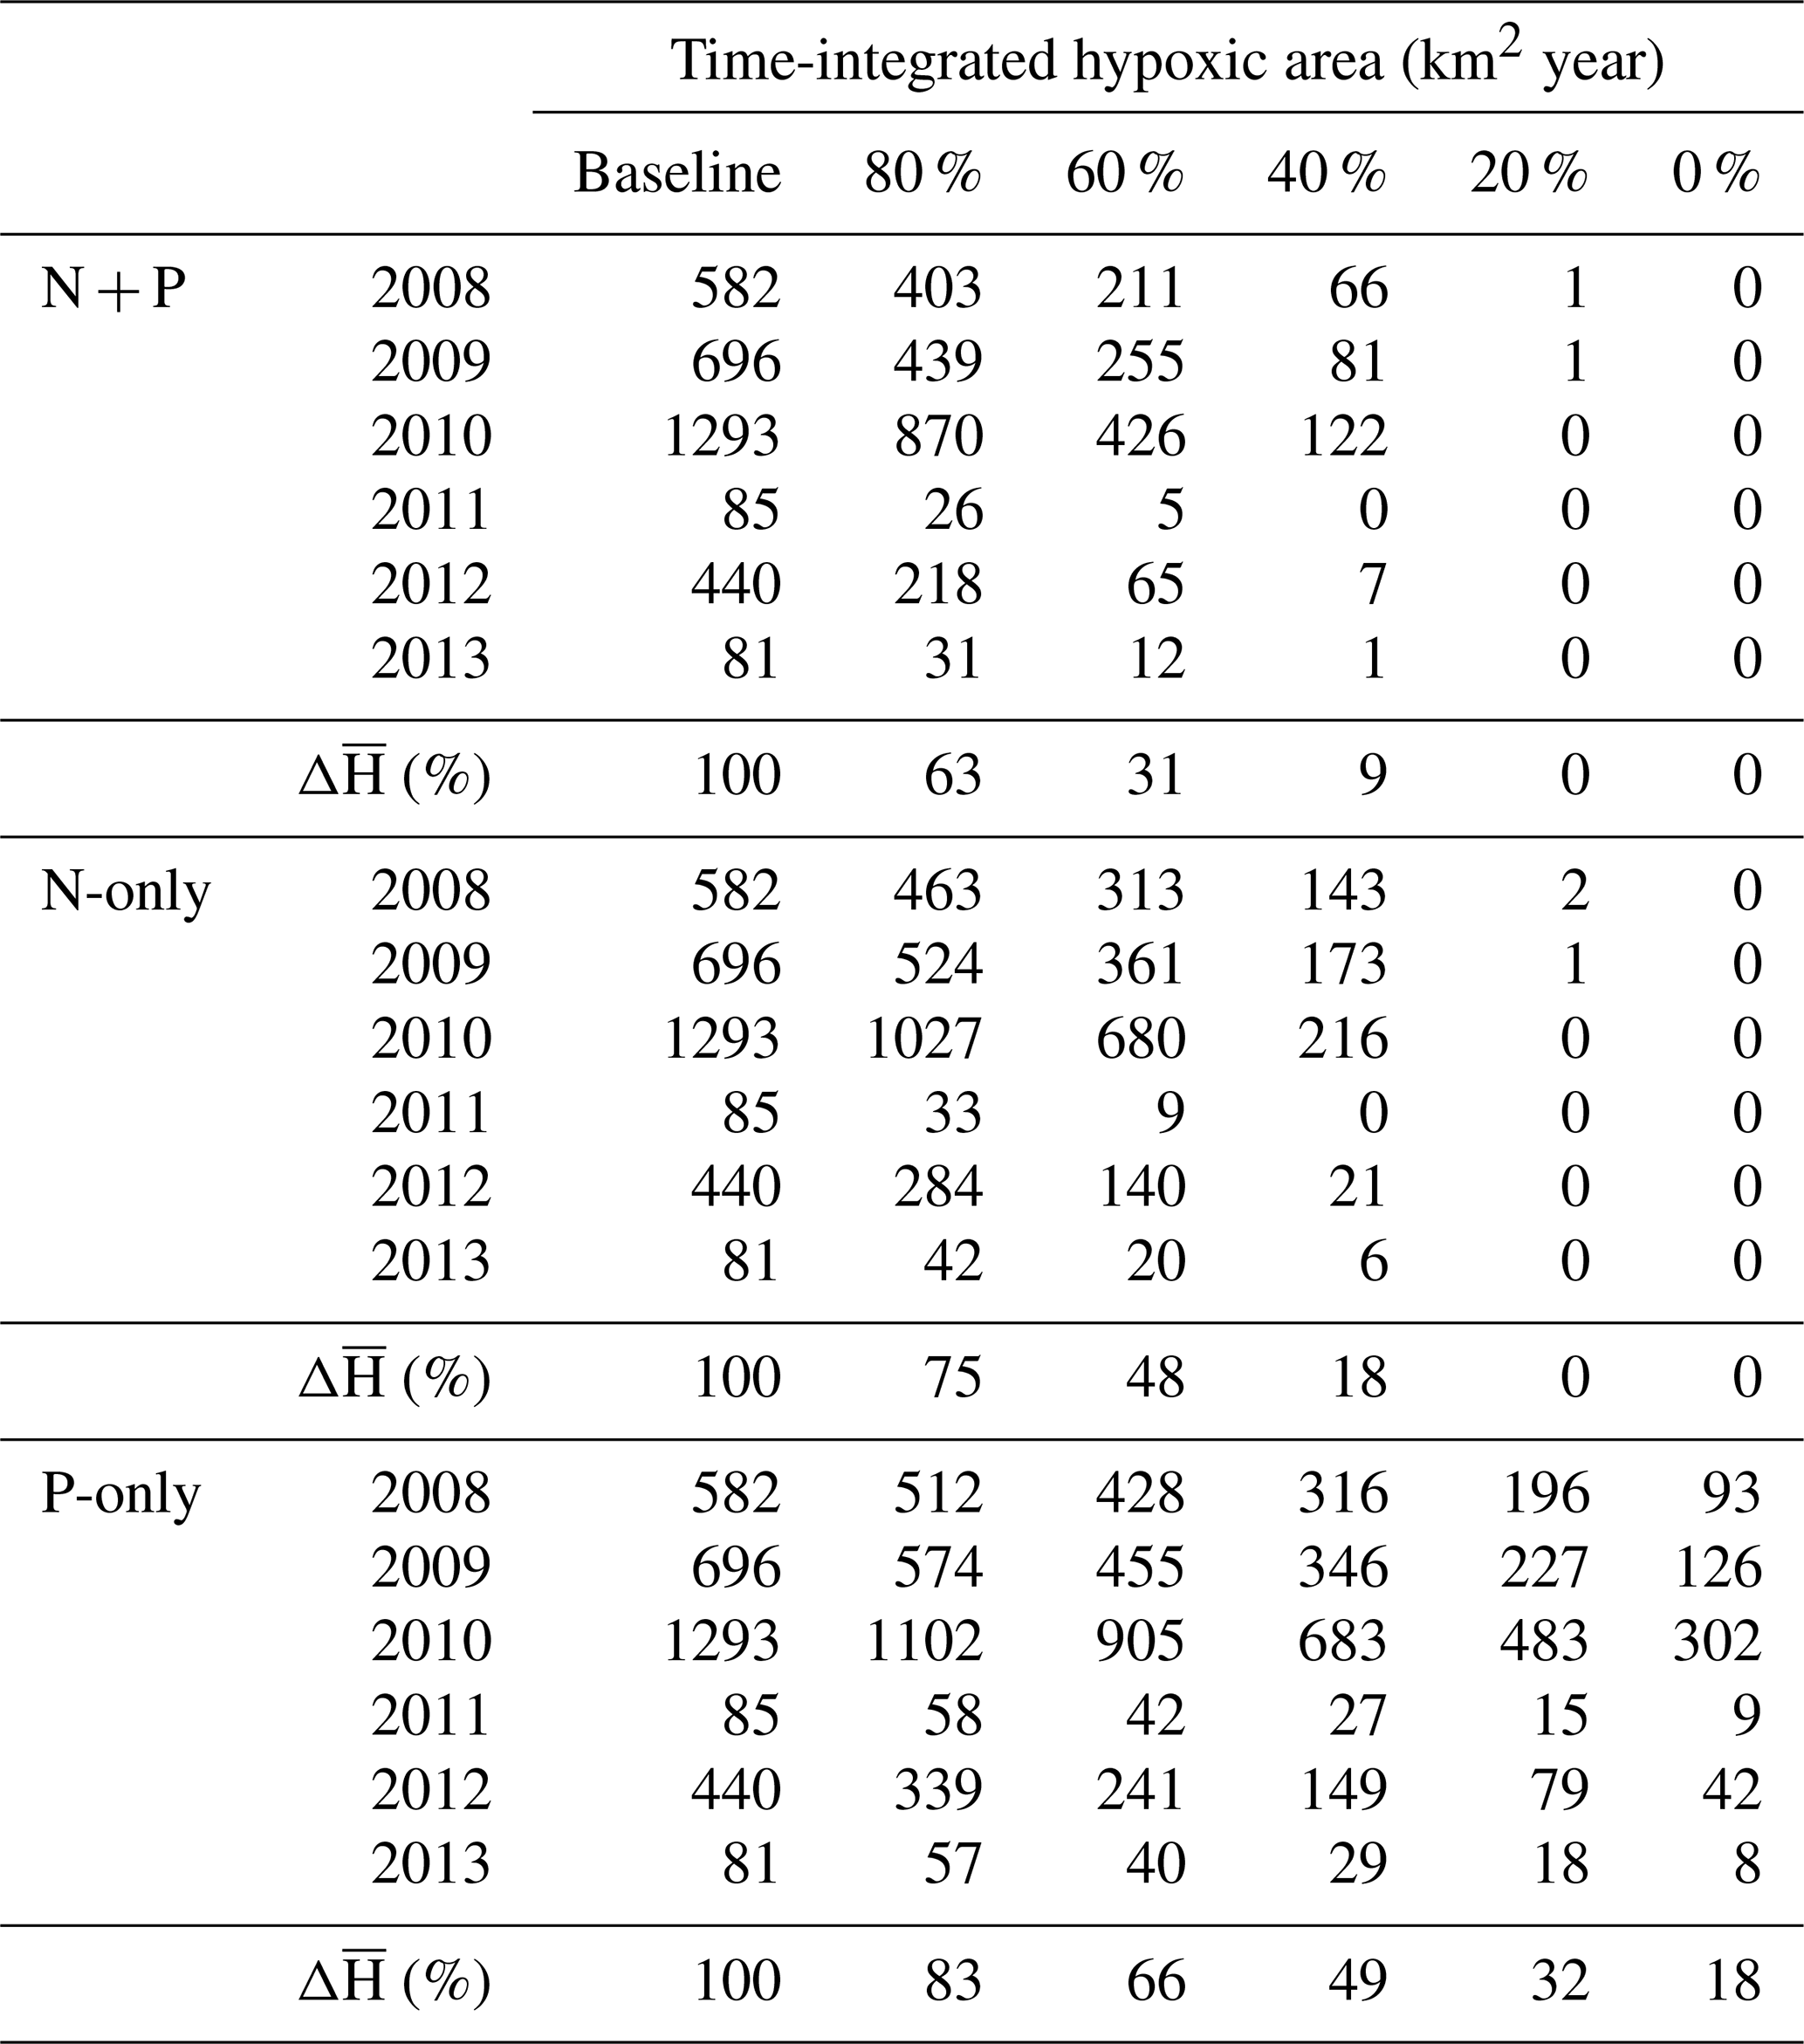
Table 2Summary of time-integrated hypoxic area (km2 year) in the baseline and nutrient reduction experiments. Experiments are indicated as percent load relative to the baseline.
Overall, the efficiency of a N + P nutrient reduction strategy, i.e., percent reduction in hypoxia (Hbar) per percent reduction in nutrients (Table 2), is 1.87, 1.73, and 1.52 for a 20 %, 40 %, and 60 % reduction, respectively. At these levels the average efficiency of a N-only nutrient reduction strategy is 1.31, whereas the average efficiency is only 0.84 for a P-only nutrient reduction strategy. The efficiency is somewhat higher in zone 2 at 2.02, 1.86, and 1.58 for a 20 %, 40 %, and 60 % N + P reduction and an average of 1.31 for N-only and 1.01 for P-only reductions (Supplement Table S3). The efficiency is lower in zone 3 at 1.58, 1.55, and 1.44 for a 20 %, 40 %, and 60 % N + P reduction and an average of 1.29 for N-only and 0.58 for P-only reductions (Supplement Table S4).
4.1 Distribution of P limitation on the shelf
Simulated nitrogen and phosphorus distributions off the CE (Figs. 3, S1) were in good agreement with observations (Gao et al., 2015; Tseng et al., 2014; Wang et al., 2014). P limitation did not occur in the vicinity of the CE where both NO3 and PO4 are high, as well as along the Jiangsu coast. This northwestern area is N-limited for most of the year, indicating a general lack of influence by Changjiang nutrients. During the productive season, PO4 was depleted rapidly in the plume and the excess nitrogen transported northeastward with the Changjiang plume in late spring and summer.
The resulting P limitation in offshore waters expanded to Jeju Island in the northeast at the seasonal peak of the plume expansion (Fig. 5). Observations were limited to the inner shelf, and nutrient addition bioassays were not available to compare with the simulated patterns. Nonetheless, early bioassay measurements confirm the presence of P limitation in the region (Harrison et al., 1990). Furthermore, the large-scale distribution of surface nutrients and their limitation effect on primary production are consistent with the main seasonal circulation (Bai et al., 2014; Liu et al., 2021), with observations off the CE (Li et al., 2009; Wang et al., 2015), as well as with observations of Changjiang-related excess NO3 in the northeastern ECS (Wong et al., 1998) and near Jeju Island (Kodama et al., 2017; Moon et al., 2021). Yet, additional bioassay data would be useful to validate the simulated patterns of nutrient limitation.
Despite its large-scale distribution, P limitation was most prominent over the southwestern part of the Yangtze Bank (Fig. 4) from mid-July to early August (Fig. 6), i.e., around the peak of the discharge. The temporal evolution (appearance in late spring, peak in mid-summer, disappearance in late summer and fall) and spatial distribution of P limitation (development downstream in the plume, peak at mid-shelf, switch to N limitation further offshore) were characteristic of river-induced P limitation in open, dispersive systems (Laurent and Fennel, 2017). For instance, in the somewhat similar Mississippi River plume in the northern Gulf of Mexico, seasonal P limitation is observed around mid-shelf at the peak of annual production, between a light-limited area in the vicinity of the river and the N-limited downstream and offshore waters (Laurent et al., 2012; Sylvan et al., 2006). Phytoplankton growth limitation in the ECS followed these general patterns along the CE–JI transect but over a larger spatial scale given the dispersive nature of the Changjiang plume (Liu et al., 2021).
The particularity of the ECS was the lack of sustained P limitation in the southern hypoxia core (zone 3). Several factors may be at play there: local P regeneration, offshore P supply, or the plume orientation. N and P regeneration have different dynamics in the model; regenerated N is partly lost through denitrification in the sediment, whereas P is regenerated following Redfield (1:16 N : P). “Excess” P (relative to Redfield) is therefore produced during remineralization in the sediment. Yang et al. (2017) found the highest sediment P recycling and DIP sediment–water flux along the Zhejiang coast (zone 3), which is consistent with the spatial distribution of P limitation in the baseline simulation. P limitation reduces SOC in zones 2 and 4 (Fig. 7c) and therefore lowers the “excess” P associated with sediment recycling, which represents a positive feedback on P limitation in the northeastern area. This decrease is 14 % and 16 % in zones 2 and 4, respectively (−0.06 and −0.05 mmol P m−2 d−1), but only 4 % in zone 3 (−0.01 mmol P m−2 d−1) on average. Nonetheless, this effect is somewhat small, and therefore P regeneration is only partly responsible for the lack of P limitation in zone 3. Große et al. (2020) recently showed that N supply from the Kuroshio and Taiwan Strait contributes 38 % of oxygen consumption in the southern hypoxic region (equivalent to zone 3). Assuming at least equal contributions of N and P, then offshore supply should be an important factor mitigating P limitation in zone 3. Evidence of P supply from the Kuroshio (Yang et al., 2012) and from the Taiwan Strait (Huang et al., 2019) to the southern ECS supports this mechanism. Those are also a source of O2 to the region (Zhang et al., 2020). Hypoxia occurs later in the southern core region, when the circulation reverses in late summer/early fall. This different timing and the dynamic of the plume at that time (i.e., attached to the coast) may also prevent the development of P limitation in the southern hypoxia core.
4.2 Effects on oxygen dynamics and hypoxia
4.2.1 Spatial shift and dilution
The hotspot of P limitation off the CE and on the Yangtze Bank had an important controlling effect on primary production, respiration (Figs. 6, 7, S2, and S3), and consequently on the duration and extent of the hypoxic area in summer (Fig. 8). In estuarine and coastal systems, P limitation promotes N export to downstream waters, thereby shifting primary production both in time and space (Paerl et al., 2004). This shift is concomitant with a dilution in dispersive systems and therefore limits the deoxygenation of bottom waters (Laurent and Fennel, 2017). The shift/dilution effect occurred in our simulations (Fig. 7a). Part of the production was spatially relocated from zones 2 and 4 (spring–summer) to zones 4 and 5 (summer). The total change in primary production in the study area (zones 1–6) varied by less than 1 % between the baseline and the NoPlim simulations, and therefore the induced variations remained within the shelf. The downstream dilution effect can therefore be quantified by calculating the area-specific change in primary production between the baseline and the NoPlim simulations (Supplement Table S5). The annual change in primary production due to P limitation was −3010 mmol O2 m−2 in zone 2 and +1310 mmol O2 m−2 in zone 5. The decrease in the area-specific value from zone 2 to zone 5 reveals that primary production was diluted during its relocation downstream. In comparison, the area-specific change in primary production is small in the intermediate zone 4 (−328 mmol O2 m−2). The dilution of PP is an important characteristic of P limitation because it modifies POM flux, respiration, and therefore the formation of hypoxia (Laurent and Fennel, 2017). Similarly, we can calculate that the annual change in total respiration (WR + SOC) is −1610 mmol O2 m−2 in zone 2 and +1020 mmol O2 m−2 in zone 5, which represents a 37 % decrease in the absolute change (+1230 mmol O2 m−2 and a 23.6 % decrease for zone 4).
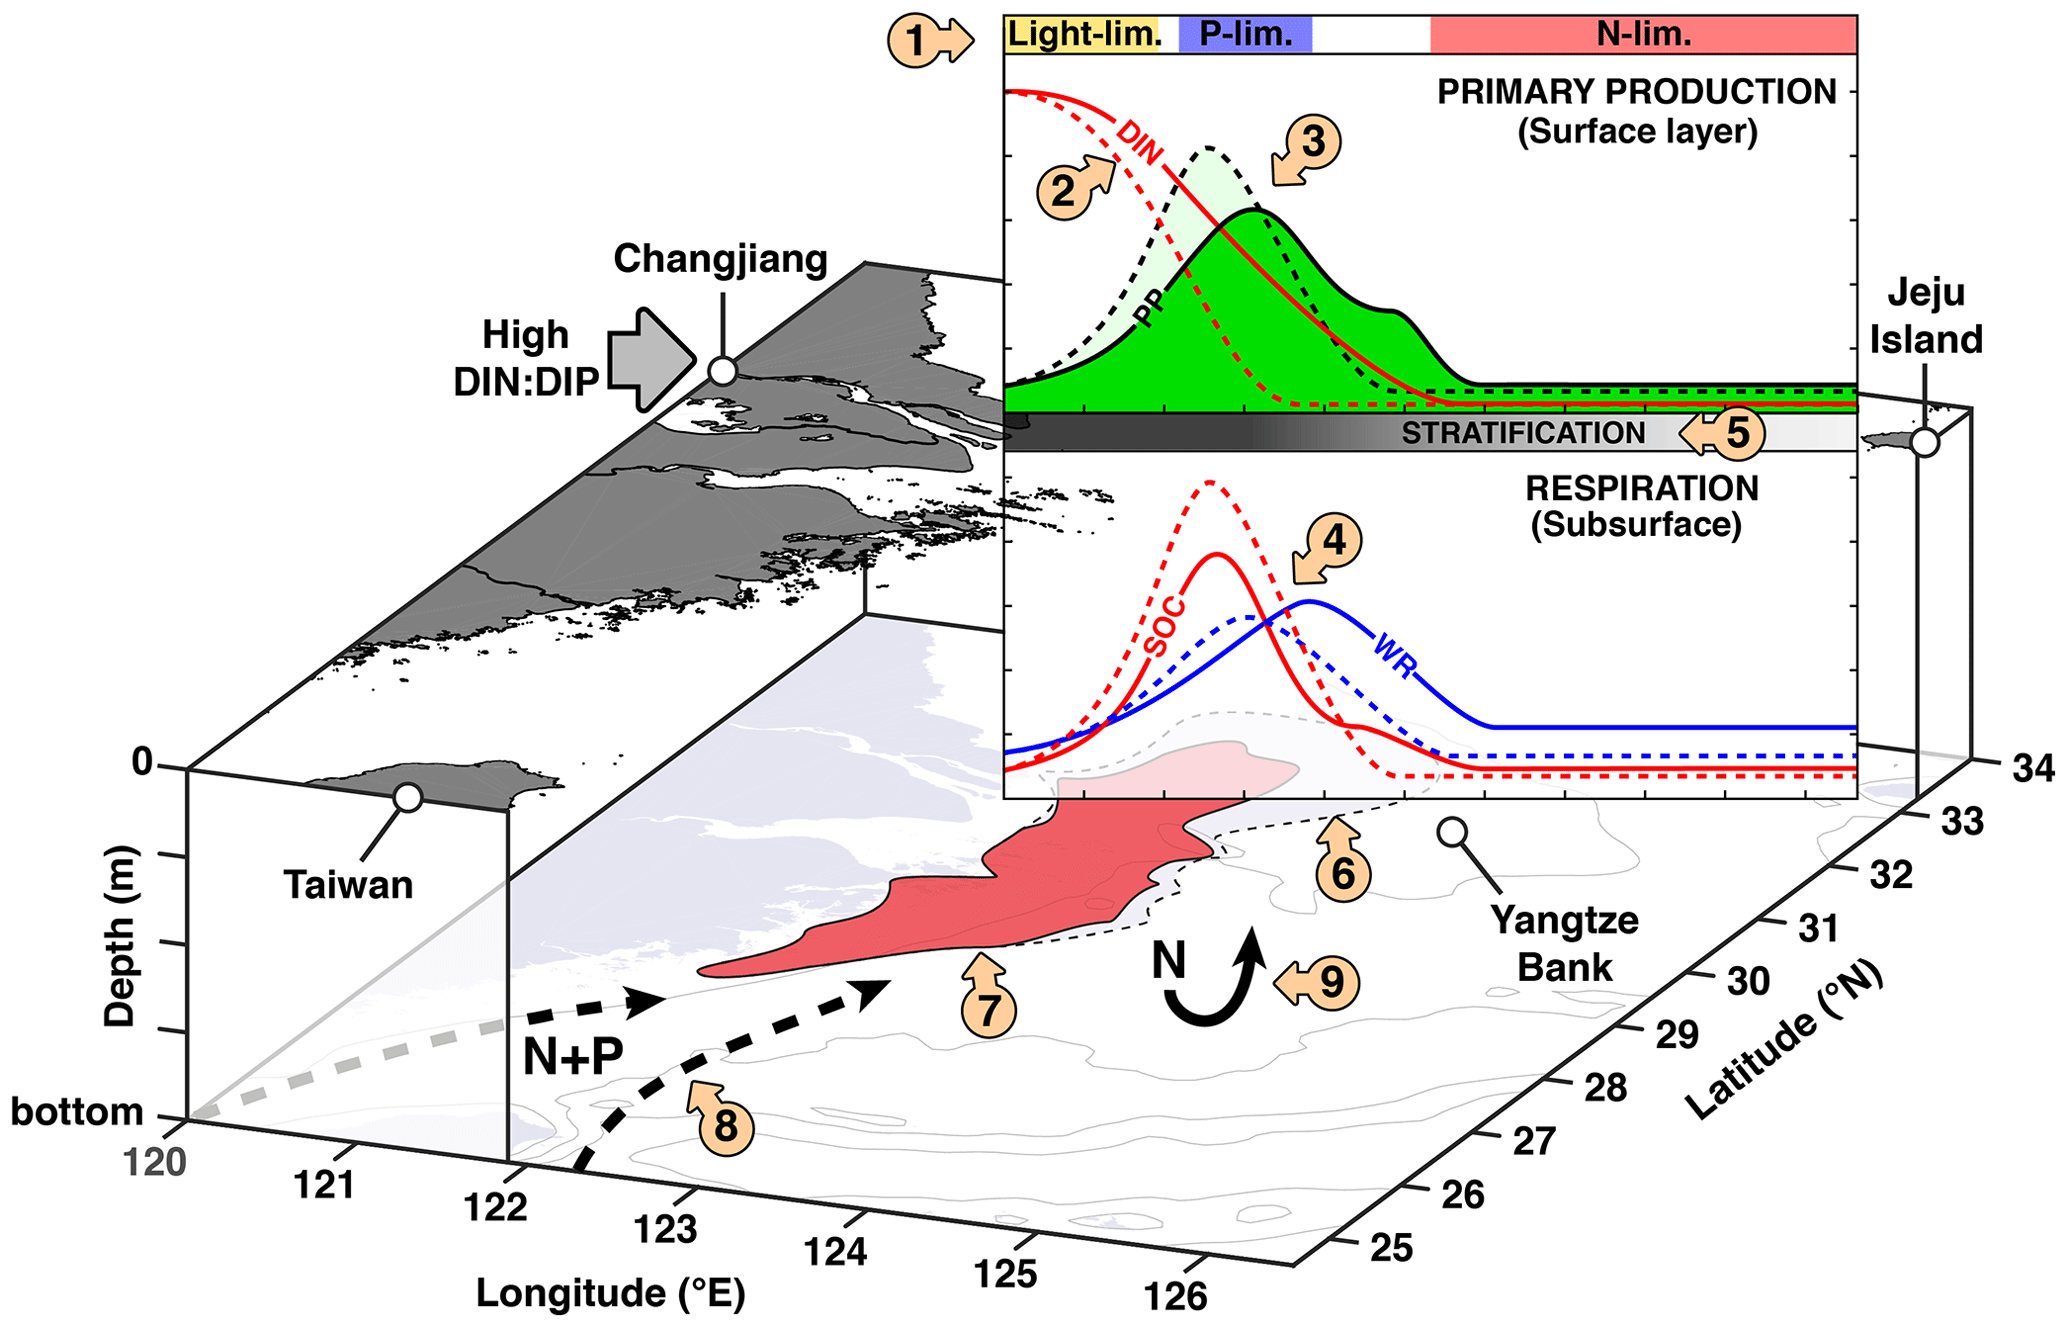
Figure 11Conceptual model of P limitation on the ECS shelf. Dashed lines indicate the effects without P limitation (NoPlim simulation). (1)–(5) Conceptual model of river-induced P limitation along the Changjiang–Jeju Island transect adapted from Laurent and Fennel (2017). (1) dominant limitation factor; (2) spatial and temporal relocation of “excess N”; (3) spatial relocation and dilution of PP; (4) spatial shift and dilution and vertical relocation of respiration; (5) weakening of stratification due to plume mixing; (6) mitigating effect on the northern hypoxia core and the Yangtze Bank; (7) no effect of P limitation on the southern hypoxia core; (8) nutrient sources from the Taiwan Strait and the Kuroshio as shown by Große et al. (2020); (9) lower denitrification represents a small positive feedback on eutrophication.
4.2.2 Vertical relocation
The change in primary production affected not only total respiration but also its vertical distribution. POM aggregation, and thus sinking rate, is a quadratic function of concentration in the model, and therefore, lower primary production favors remineralization in the water column rather than in the sediment. This vertical relocation was relatively small in comparison to the dilution effect; the maximum change in the ratio WR : (WR + SOC) was +11 %, +16 %, and −3 % in zones 2, 4, and 5, respectively (see Supplement Fig. S5). The relative increase in SOC in zone 5 was due to the additional primary production that led to increased deposition. This effect was small in comparison to zones 2 and 4 partly because zone 5 is deeper (zmean=75 m versus ∼ 37 m).
4.2.3 Positive feedback on eutrophication
The net increase in WR relative to SOC is important because of the proportionality between sediment denitrification and SOC (Fennel et al., 2009). Denitrification ranges from 0.7 (zone 5) to 2.9 (zone 2) mmol N m−2 d−1 in the baseline simulation (annual average). This is within the lower range of recent observations in the coastal ECS (Lin et al., 2017). The total annual decrease in denitrification resulting from P limitation over the study area (zones 1–6) was 75.0 × 10⁸ mol N (−6.2 %). This effect is quite small in comparison to the spatial relocation and dilution of O2 sinks but nevertheless represents a positive feedback on eutrophication in the ECS.
4.2.4 Mitigating effect on the northern hypoxia core and the Yangtze Bank
SOC is an important process in the ECS (Zhou et al., 2017) and the dominant O2 sink below the pycnocline (Zhang et al., 2020). It is therefore not surprising that the change in SOC around the northern hypoxic center and on the Yangtze Bank in July–August, i.e., −11 and −10 mmol O2 m−2 d−1 (−15 % and −20 %) in zones 2 and 4, respectively, had a significant effect on hypoxia (Figs. 8a, 9). This effect varies spatially between the two hypoxic centers. Around the northern hypoxic center, the lack of PO4 limits the duration and the spatial expansion of hypoxic conditions and therefore moderates hypoxia. This is where P limitation has the largest effect on hypoxia.
P limitation also prevents the expansion of hypoxic conditions further northwest, on the western side of the Yangtze Bank (Fig. 8a). Hypoxia only occurs sporadically in this region and in small patches (909 km2 on average; maximum extent: 3260 km2) that develop when the plume extends over the bank in July–August. Without P limitation, hypoxia was more frequent and widespread in this area, covering 5429 km2 on average when hypoxia occurs (maximum: 12 375 km2). The effect on the Yangtze Bank can be related to the lower SOC and a weakening of stratification as the plume mixes with ocean waters downstream. The spatial distribution of the potential energy anomaly (a proxy for stratification; see Große et al., 2020, for details) in summer illustrates this change in stratification over the western Yangtze Bank (Supplement Fig. S6). This stratification effect is consistent with the idea that hypoxia is tightly controlled by the pycnocline in the northern region (Chi et al., 2017). It was also shown to be an important controlling factor in the context of P limitation in the northern Gulf of Mexico (Laurent and Fennel, 2014).
Overall, the area of the shelf that can be exposed to hypoxia decreases by 34 % with P limitation, whereas the size of the hypoxic zone in reduced by 48 % on average, mainly in August (Fig. 8a).
4.3 Conceptual model of the effect of P limitation in the ECS
To summarize our findings, we provide a conceptual model of P limitation in the ECS (Fig. 11). Along the CE–Jeju Island it follows the general framework of Laurent and Fennel (2017) for multi-dimensional dispersive systems, in which the “excess” DIN transported downstream results in a spatial shift and dilution of primary production. The dilution and relocation of O2 sinks are added here, as well as the weakening of stratification downstream. These processes were implied originally. Based on our results, we also add several processes that were not included in the original framework, namely the vertical relocation of O2 sinks and the change in denitrification that represents a small positive feedback on eutrophication. The lack of changes around the southern hypoxic core is specific to the ECS. Große et al. (2020) recently showed with the same model that relative to the Changjiang, nutrient sources from the Taiwan Strait and the Kuroshio are important contributors to O2 consumption along the Zhejiang coast (<30∘ N). This process is added to the conceptual model. This source of nutrients contributes to the occurrence of harmful algal blooms in the area (Che et al., 2022).
As mentioned above, we found similarities in the effect of P limitation between the ECS and other systems. Along the CE–JI line, the dispersive conditions favor the dilution of eutrophication with a positive effect on subsurface water oxygenation within the northern hypoxia core. The same mechanism was found in the northern Gulf of Mexico (Laurent and Fennel, 2014, 2017) and off the Pearl River Estuary (PRE) under severe P limitation (Yu and Gan, 2022). The “dilution effect” (Laurent and Fennel, 2017) is therefore a prevalent consequence of P limitation that is applicable to other river plume systems. We did not find a positive feedback of P limitation on hypoxia as suggested by Yu and Gan (2022) for the PRE. Their study indicates severe, widespread P limitation in offshore waters, which is not in line with our findings for the ECS. This positive feedback may be specific to the PRE system.
4.4 Sensitivity of hypoxia to altered nutrient loads
We carried out the first systematic analysis of the effect of nutrient reduction strategies on hypoxia in the ECS. Große et al. (2020) recently suggested that N management in the Changjiang has the potential to mitigate hypoxia on the shelf. However, they did not assess nutrient reduction strategies. Our results are in line with Große et al. (2020) and further indicate that hypoxia can be eliminated on the shelf at high nutrient reduction levels (Figs. 8, 10, and S4). This highlights the direct link between cultural eutrophication and hypoxia in the ECS (Li et al., 2011; Wang et al., 2016). The simulations indicated that management effects vary with the level and type of nutrient reduction, as well as the area of interest. The N + P nutrient reduction strategy was the most effective to mitigate hypoxia, as reported previously for other coastal systems (Fennel and Laurent, 2018; Kemp et al., 2005; O'Boyle et al., 2015; Paerl, 2009; Scavia and Donnelly, 2007) and for their upstream freshwater systems (Paerl et al., 2016). The dual N + P reduction is generally accepted as the most effective strategy to mitigate eutrophication and hypoxia (Wurtsbaugh et al., 2019). Nonetheless, the efficiency of nutrient reduction strategies (N + P, N-only, or P-only) varied between the northern (zone 2) and southern (zone 3) hypoxia cores and was related to the spatial distribution of P limitation. Similar spatial variations in the effectiveness of nutrient reduction strategies (P-only or N-only) were also reported elsewhere (e.g., Chesapeake Bay; Kemp et al., 2005). In the southern zone 3, where P limitation is not frequent, a N-only strategy was nearly as effective as a N + P strategy in mitigating hypoxia, whereas its efficiency was low at moderate levels of reductions in the northern zone 2 (Fig. 10). This spatially explicit response differs from the northern Gulf of Mexico (Mississippi plume) mentioned above, where nutrient limitation follows an upstream–downstream continuum, as described here along the CE–JI transect.
According to the nutrient load experiments, the level of reduction that is necessary to mitigate hypoxia in the ECS is somewhat moderate due to the high efficiency of the N + P reduction strategy (Figs. 8, 10). Long-term hypoxia mitigation goals are not in place in the ECS, and eutrophication is expected to worsen in the future with the increased use of fertilizer for agriculture (Strokal et al., 2014; Wang et al., 2020). Nonetheless, we explore the feasibility of possible intermediate (−50 %) and long-term (−80 %) goals to mitigate the hypoxic zone (Figs. 9, S4). Our experiments showed that a 50 % decrease in the hypoxic area would require a 28 % reduction in N + P loads (38 % for N-only and 60 % for P-only), whereas an 80 % decrease in hypoxic area would require a 44 % reduction in N + P loads. At such mitigation levels, hypoxia still occurred over a large area in our model but was limited in duration (Fig. 8). Since the sediment layer is not explicitly represented in the model (instant remineralization), there is no “legacy” effect of eutrophication on hypoxia that may be associated with long-term organic matter accumulation in the sediment (Turner et al., 2008; Van Meter et al., 2018). The nutrient reduction levels mentioned above therefore represent a lower limit to the necessary management measures.
In the Changjiang nutrient mitigation experiments we applied the same reduction level to all nutrient subspecies (i.e., dissolved inorganic, dissolved and particulate organic). Changjiang N is dominated by nitrate, with particulate and dissolved organic N contributing only 8 %–13 % of total N (Große et al., 2020). Most of the mitigation efforts should therefore target the inorganic subspecies. More efficient N recycling from sewage may be a short-term measure to limit DIN load to the CE (Yu et al., 2019). The long-term goal for N reduction may be more challenging due to diffuse sources of DIN in the Changjiang basin (Chen et al., 2019b). Manure and fertilizers are major nutrient sources to the Changjiang, and therefore, nutrient reduction targets could partly be met through cost-effective management such as increased manure recycling to cropland (Strokal et al., 2020; Yu et al., 2019), more efficient fertilizer application (e.g., by increasing farm size, Wu et al., 2018), and, more generally, by increasing nutrient recycling in the Changjiang basin (Yu et al., 2019). Several strategies have been proposed to enhance water quality in the Changjiang (Guo et al., 2021; Yu et al., 2019); our experiments can help estimate their effectiveness to mitigate hypoxia on the shelf. Further investigations of the link between nutrient limitation in the coastal ECS and the change in land cover and land use in the Changjiang basin over the last decades may help refine nutrient management strategies.
We carried out the first systematic assessment of the effects of P limitation and nutrient loadings in the Changjiang–ECS system. P limitation modifies O2 sinks over a large area of the shelf by partly relocating and diluting primary production offshore, away from the locations prone to hypoxia outside the Changjiang Estuary. The resulting horizontal and vertical relocations of O2 sinks drastically reduce the size of the hypoxic area (by about half), mostly off the Changjiang Estuary and on the Yangtze Bank. P limitation had only small effects along the southern Zhejiang coast. The incremental decrease in river nutrients in the Changjiang showed that despite the effect of P limitation on hypoxia, N + P reductions remain the best strategy to mitigate hypoxia. Tentative goals for intermediate (−28 %) and long-term (−44 %) N + P load reductions were proposed to reduce the hypoxic zone by 50 % and 80 % of its current area, respectively.
The ROMS source code is available from http://myroms.org, last access: 10 August 2019 (Haidvogel et al., 2008). Model results are available on request.
The supplement related to this article is available online at: https://doi.org/10.5194/bg-19-5893-2022-supplement.
AL and KF conceived the study. HZ set up the model. AL set up the simulations and conducted the analyses. AL wrote the manuscript with input from all co-authors.
The contact author has declared that none of the authors has any competing interests.
Publisher's note: Copernicus Publications remains neutral with regard to jurisdictional claims in published maps and institutional affiliations.
We thank Compute Canada for providing computing resources under the resource allocation project qqh-593-ac.
This research has been supported by the Natural Sciences and Engineering Research Council of Canada (NSERC) Discovery program (grant no. RGPIN-2014-03938).
This paper was edited by Tina Treude and reviewed by three anonymous referees.
Alexander, R. B., Smith, R. A., Schwarz, G. E., Boyer, E. W., Nolan, J. V., and Brakebill, J. W.: Differences in Phosphorus and Nitrogen Delivery to The Gulf of Mexico from the Mississippi River Basin, Environ. Sci. Technol., 42, 822–830, https://doi.org/10.1021/es0716103, 2008.
Bai, Y., He, X., Pan, D., Chen, C.-T. A., Kang, Y., Chen, X., and Cai, W.-J.: Summertime Changjiang River plume variation during 1998–2010, J. Geophys. Res.-Ocean., 119, 6238–6257, https://doi.org/10.1002/2014JC009866, 2014.
Beusen, A. H. W., Bouwman, A. F., Van Beek, L. P. H., Mogollón, J. M., and Middelburg, J. J.: Global riverine N and P transport to ocean increased during the 20th century despite increased retention along the aquatic continuum, Biogeosciences, 13, 2441–2451, https://doi.org/10.5194/bg-13-2441-2016, 2016.
Bian, C., Jiang, W., and Greatbatch, R. J.: An exploratory model study of sediment transport sources and deposits in the Bohai Sea, Yellow Sea, and East China Sea, J. Geophys. Res.-Ocean., 118, 5908–5923, https://doi.org/10.1002/2013JC009116, 2013.
Boesch, D. F.: Barriers and Bridges in Abating Coastal Eutrophication, Front. Mar. Sci., 6, 123, https://doi.org/10.3389/fmars.2019.00123, 2019.
Carton, J. A. and Giese, B. S.: A Reanalysis of Ocean Climate Using Simple Ocean Data Assimilation (SODA), Mon. Weather Rev., 136, 2999–3017, https://doi.org/10.1175/2007MWR1978.1, 2008.
Che, H., Zhang, J., Liu, Q., and Zhao, M.: A driving factor for harmful algal blooms in the East China Sea coastal marine ecosystems – Implications of Kuroshio subsurface water invasion, Mar. Pollut. Bull., 181, 113871, https://doi.org/10.1016/j.marpolbul.2022.113871, 2022.
Chen, L., Liu, J., Xu, G., and Li, F.: Phytoplankton productivity and community structure variations over the last 160 years in the East China Sea coast in response to natural and human-induced environmental changes, The Holocene, 29, 1145–1154, https://doi.org/10.1177/0959683619838040, 2019a.
Chen, X., Strokal, M., Kroeze, C., Ma, L., Shen, Z., Wu, J., Chen, X., and Shi, X.: Seasonality in river export of nitrogen: A modelling approach for the Yangtze River, Sci. Total Environ., 671, 1282–1292, https://doi.org/10.1016/j.scitotenv.2019.03.323, 2019b.
Chen, X., Strokal, M., Kroeze, C., Supit, I., Wang, M., Ma, L., Chen, X., and Shi, X.: Modeling the Contribution of Crops to Nitrogen Pollution in the Yangtze River, Environ. Sci. Technol., 54, 11929–11939, https://doi.org/10.1021/acs.est.0c01333, 2020.
Chi, L., Song, X., Yuan, Y., Wang, W., Zhou, P., Fan, X., Cao, X., and Yu, Z.: Distribution and key influential factors of dissolved oxygen off the Changjiang River Estuary (CRE) and its adjacent waters in China, Mar. Pollut. Bull., 125, 440–450, https://doi.org/10.1016/j.marpolbul.2017.09.063, 2017.
Cloern, J. E.: Turbidity as a control on phytoplankton biomass and productivity in estuaries, Cont. Shelf Res., 7, 1367–1381, https://doi.org/10.1016/0278-4343(87)90042-2, 1987.
Dagg, M., Benner, R., Lohrenz, S., and Lawrence, D.: Transformation of dissolved and particulate materials on continental shelves influenced by large rivers: plume processes, Cont. Shelf Res., 24, 833–858, https://doi.org/10.1016/j.csr.2004.02.003, 2004.
Dai, Z., Du, J., Zhang, X., Su, N., and Li, J.: Variation of Riverine Material Loads and Environmental Consequences on the Changjiang (Yangtze) Estuary in Recent Decades (1955–2008)†, Environ. Sci. Technol., 45, 223–227, https://doi.org/10.1021/es103026a, 2011.
Dee, D. P., Uppala, S. M., Simmons, A. J., Berrisford, P., Poli, P., Kobayashi, S., Andrae, U., Balmaseda, M. A., Balsamo, G., Bauer, P., Bechtold, P., Beljaars, A. C. M., van de Berg, L., Bidlot, J., Bormann, N., Delsol, C., Dragani, R., Fuentes, M., Geer, A. J., Haimberger, L., Healy, S. B., Hersbach, H., Hólm, E. V., Isaksen, L., Kållberg, P., Köhler, M., Matricardi, M., McNally, A. P., Monge-Sanz, B. M., Morcrette, J.-J., Park, B.-K., Peubey, C., de Rosnay, P., Tavolato, C., Thépaut, J.-N., and Vitart, F.: The ERA-Interim reanalysis: configuration and performance of the data assimilation system, Q. J. R. Meteorol. Soc., 137, 553–597, https://doi.org/10.1002/qj.828, 2011.
Diaz, R. J. and Rosenberg, R.: Spreading Dead Zones and Consequences for Marine Ecosystems, Science, 321, 926–929, https://doi.org/10.1126/science.1156401, 2008.
Fennel, K. and Laurent, A.: N and P as ultimate and proximate limiting nutrients in the northern Gulf of Mexico: implications for hypoxia reduction strategies, Biogeosciences, 15, 3121–3131, https://doi.org/10.5194/bg-15-3121-2018, 2018.
Fennel, K. and Testa, J. M.: Biogeochemical Controls on Coastal Hypoxia, Ann. Rev. Mar. Sci., 11, 105–130, https://doi.org/10.1146/annurev-marine-010318-095138, 2019.
Fennel, K., Wilkin, J., Levin, J., Moisan, J., O'Reilly, J., and Haidvogel, D.: Nitrogen cycling in the Middle Atlantic Bight: Results from a three-dimensional model and implications for the North Atlantic nitrogen budget, Global Biogeochem. Cy., 20, GB3007, https://doi.org/10.1029/2005GB002456, 2006.
Fennel, K., Brady, D., DiToro, D., Fulweiler, R. W., Gardner, W. S., Giblin, A., McCarthy, M. J., Rao, A., Seitzinger, S., Thouvenot-Korppoo, M., and Tobias, C.: Modeling denitrification in aquatic sediments, Biogeochemistry, 93, 159–178, https://doi.org/10.1007/s10533-008-9270-z, 2009.
Fennel, K., Hetland, R., Feng, Y., and DiMarco, S.: A coupled physical-biological model of the Northern Gulf of Mexico shelf: model description, validation and analysis of phytoplankton variability, Biogeosciences, 8, 1881–1899, https://doi.org/10.5194/bg-8-1881-2011, 2011.
Fennel, K., Hu, J., Laurent, A., Marta-Almeida, M., and Hetland, R.: Sensitivity of hypoxia predictions for the northern Gulf of Mexico to sediment oxygen consumption and model nesting, J. Geophys. Res.-Ocean., 118, 990–1002, https://doi.org/10.1002/jgrc.20077, 2013.
Gao, L., Li, D., Ishizaka, J., Zhang, Y., Zong, H., and Guo, L.: Nutrient dynamics across the river-sea interface in the Changjiang (Yangtze River) estuary-East China Sea region, Limnol. Oceanogr., 60, 2207–2221, https://doi.org/10.1002/lno.10196, 2015.
Garcia, H. E., Boyer, T. P., Locarnini, R. A., Antonov, J. I., Mishonov, A. V., Baranova, O. K., Zweng, M. M., Reagan, J. R., Johnson, D. R., and Levitus, S.: World Ocean Atlas 2013, Volume 3: Dissolved oxygen, apparent oxygen utilization, and oxygen saturation, National Oceanic and Atmospheric Administration (NOAA), Silver Spring, MD, Silver Spring, MD, NOAA, https://doi.org/10.7289/V5XG9P2W, 2013a.
Garcia, H. E., Locarnini, R., Boyer, T. P., Antonov, J. I., Baranova, O. K., Zweng, M. M., Reagan, J. R., and Johnson, D. R.: World Ocean Atlas 2013, Volume 4: Dissolved Inorganic Nutrients (phosphate, nitrate, silicate), National Oceanic and Atmospheric Administration (NOAA), Silver Spring, MD, NOAA, https://doi.org/10.7289/V5J67DWD, 2013b.
Ge, J., Shi, S., Liu, J., Xu, Y., Chen, C., Bellerby, R., and Ding, P.: Interannual Variabilities of Nutrients and Phytoplankton off the Changjiang Estuary in Response to Changing River Inputs, J. Geophys. Res.-Ocean., 125, e2019JC015595, https://doi.org/10.1029/2019JC015595, 2020.
Glibert, P. M., Maranger, R., Sobota, D. J., and Bouwman, L.: The Haber Bosch–harmful algal bloom (HB–HAB) link, Environ. Res. Lett., 9, 105001, https://doi.org/10.1088/1748-9326/9/10/105001, 2014.
Große, F., Fennel, K., Zhang, H., and Laurent, A.: Quantifying the contributions of riverine vs. oceanic nitrogen to hypoxia in the East China Sea, Biogeosciences, 17, 2701–2714, https://doi.org/10.5194/bg-17-2701-2020, 2020.
Guo, C., Bai, Z., Shi, X., Chen, X., Chadwick, D., Strokal, M., Zhang, F., Ma, L., and Chen, X.: Challenges and strategies for agricultural green development in the Yangtze River Basin, J. Integr. Environ. Sci., 18, 37–54, https://doi.org/10.1080/1943815X.2021.1883674, 2021.
Haidvogel, D. B., Arango, H., Budgell, W. P., Cornuelle, B. D., Curchitser, E., Lorenzo, E. Di, Fennel, K., Geyer, W. R., Hermann, A. J., Lanerolle, L., Levin, J., McWilliams, J. C., Miller, A. J., Moore, A. M., Powell, T. M., Shchepetkin, A. F., Sherwood, C. R., Signell, R. P., Warner, J. C., and Wilkin, J.: Ocean forecasting in terrain-following coordinates: Formulation and skill assessment of the Regional Ocean Modeling System, J. Comput. Phys., 227, 3595–3624, https://doi.org/10.1016/j.jcp.2007.06.016, 2008 (code available at http://myroms.org, last access: 10 August 2019).
Harrison, J. A., Bouwman, A. F., Mayorga, E., and Seitzinger, S.: Magnitudes and sources of dissolved inorganic phosphorus inputs to surface fresh waters and the coastal zone: A new global model, Global Biogeochem. Cy., 24, GB1003, https://doi.org/10.1029/2009GB003590, 2010.
Harrison, P. J., Hu, M. H., Yang, Y. P., and Lu, X.: Phosphate limitation in estuarine and coastal waters of China, J. Exp. Mar. Bio. Ecol., 140, 79–87, https://doi.org/10.1016/0022-0981(90)90083-O, 1990.
Heisler, J., Glibert, P. M., Burkholder, J. M., Anderson, D. M., Cochlan, W., Dennison, W. C., Dortch, Q., Gobler, C. J., Heil, C. A., Humphries, E., Lewitus, A., Magnien, R., Marshall, H. G., Sellner, K., Stockwell, D. A., Stoecker, D. K., and Suddleson, M.: Eutrophication and harmful algal blooms: A scientific consensus, Harmful Algae, 8, 3–13, https://doi.org/10.1016/j.hal.2008.08.006, 2008.
Hu, M., Liu, Y., Zhang, Y., Shen, H., Yao, M., Dahlgren, R. A., and Chen, D.: Long-term (1980–2015) changes in net anthropogenic phosphorus inputs and riverine phosphorus export in the Yangtze River basin, Water Res., 177, 115779, https://doi.org/10.1016/j.watres.2020.115779, 2020.
Huang, T.-H., Chen, C.-T. A., Lee, J., Wu, C.-R., Wang, Y.-L., Bai, Y., He, X., Wang, S.-L., Kandasamy, S., Lou, J.-Y., Tsuang, B.-J., Chen, H.-W., Tseng, R.-S., and Yang, Y. J.: East China Sea increasingly gains limiting nutrient P from South China Sea, Sci. Rep., 9, 5648, https://doi.org/10.1038/s41598-019-42020-4, 2019.
Jiang, Z., Liu, J., Chen, J., Chen, Q., Yan, X., Xuan, J., and Zeng, J.: Responses of summer phytoplankton community to drastic environmental changes in the Changjiang (Yangtze River) estuary during the past 50 years, Water Res., 54, 1–11, https://doi.org/10.1016/j.watres.2014.01.032, 2014.
Kemp, W. M., Boynton, W. R., Adolf, J. E., Boesch, D. F., Boicourt, W. C., Brush, G., Cornwell, J. C., Fisher, T. R., Glibert, P. M., Hagy, J., Harding, L. W., Houde, E. D., Kimmel, D. G., Miller, W. D., Newell, R. I. E., Roman, M. R., Smith, E. M., and Stevenson, J. C.: Eutrophication of Chesapeake Bay: historical trends and ecological interactions, Mar. Ecol. Prog. Ser., 303, 1–29, https://doi.org/10.3354/meps303001, 2005.
Kidwell, D. M., Lewitus, A. J., Brandt, S., Jewett, E. B., and Mason, D. M.: Ecological impacts of hypoxia on living resources, J. Exp. Mar. Bio. Ecol., 381, S1–S3, https://doi.org/10.1016/j.jembe.2009.07.009, 2009.
Kodama, T., Morimoto, A., Takikawa, T., Ito, M., Igeta, Y., Abe, S., Fukudome, K.-I., Honda, N., and Katoh, O.: Presence of high nitrate to phosphate ratio subsurface water in the Tsushima Strait during summer, J. Oceanogr., 73, 759–769, https://doi.org/10.1007/s10872-017-0430-4, 2017.
Laurent, A. and Fennel, K.: Simulated reduction of hypoxia in the northern Gulf of Mexico due to phosphorus limitation, Elem. Sci. Anthr., 2, 000022, https://doi.org/10.12952/journal.elementa.000022, 2014.
Laurent, A. and Fennel, K.: Modeling River-Induced Phosphorus Limitation in the Context of Coastal Hypoxia, in: Modeling Coastal Hypoxia, edited by: Justic, D., Rose, K. A., Hetland, R. D., and Fennel, K., 149–171, Springer International Publishing, Cham, Springer, ISBN: 978-3-319-54569-1, 2017.
Laurent, A., Fennel, K., Hu, J., and Hetland, R.: Simulating the effects of phosphorus limitation in the Mississippi and Atchafalaya River plumes, Biogeosciences, 9, 4707–4723, https://doi.org/10.5194/bg-9-4707-2012, 2012.
Laurent, A., Fennel, K., Cai, W.-J., Huang, W.-J., Barbero, L., and Wanninkhof, R.: Eutrophication-induced acidification of coastal waters in the northern Gulf of Mexico: insights into origin and processes from a coupled physical-biogeochemical model, Geophys. Res. Lett., 44, 946–956, https://doi.org/10.1002/2016GL071881, 2017.
Levin, L. A., Ekau, W., Gooday, A. J., Jorissen, F., Middelburg, J. J., Naqvi, S. W. A., Neira, C., Rabalais, N. N., and Zhang, J.: Effects of natural and human-induced hypoxia on coastal benthos, Biogeosciences, 6, 2063–2098, https://doi.org/10.5194/bg-6-2063-2009, 2009.
Li, H.-M., Tang, H.-J., Shi, X.-Y., Zhang, C.-S., and Wang, X.-L.: Increased nutrient loads from the Changjiang (Yangtze) River have led to increased Harmful Algal Blooms, Harmful Algae, 39, 92–101, https://doi.org/10.1016/j.hal.2014.07.002, 2014.
Li, J., Glibert, P., Zhou, M., Lu, S., and Lu, D.: Relationships between nitrogen and phosphorus forms and ratios and the development of dinoflagellate blooms in the East China Sea, Mar. Ecol. Prog. Ser., 383, 11–26, https://doi.org/10.3354/meps07975, 2009.
Li, W., Ge, J., Ding, P., Ma, J., Glibert, P. M., and Liu, D.: Effects of Dual Fronts on the Spatial Pattern of Chlorophyll-a Concentrations in and off the Changjiang River Estuary, Estuar. Coast., 44, 1408–1418, https://doi.org/10.1007/s12237-020-00893-z, 2021.
Li, X., Bianchi, T. S., Yang, Z., Osterman, L. E., Allison, M. A., DiMarco, S. F., and Yang, G.: Historical trends of hypoxia in Changjiang River estuary: Applications of chemical biomarkers and microfossils, J. Mar. Syst., 86, 57–68, https://doi.org/10.1016/j.jmarsys.2011.02.003, 2011.
Lin, X., Liu, M., Hou, L., Gao, D., Li, X., Lu, K., and Gao, J.: Nitrogen Losses in Sediments of the East China Sea: Spatiotemporal Variations, Controlling Factors, and Environmental Implications, J. Geophys. Res.-Biogeo., 122, 2699–2715, https://doi.org/10.1002/2017JG004036, 2017.
Liu, S. M., Zhang, J., and Chen, H.: Nutrients in the Changjiang and its tributaries, Biogeochemistry, 62, 1–18, https://doi.org/10.1023/A:1021162214304, 2003.
Liu, S. M., Hong, G.-H., Zhang, J., Ye, X. W., and Jiang, X. L.: Nutrient budgets for large Chinese estuaries, Biogeosciences, 6, 2245–2263, https://doi.org/10.5194/bg-6-2245-2009, 2009.
Liu, X., Beusen, A. H. W., Van Beek, L. P. H., Mogollón, J. M., Ran, X., and Bouwman, A. F.: Exploring spatiotemporal changes of the Yangtze River (Changjiang) nitrogen and phosphorus sources, retention and export to the East China Sea and Yellow Sea, Water Res., 142, 246–255, https://doi.org/10.1016/j.watres.2018.06.006, 2018.
Liu, Z., Gan, J., Wu, H., Hu, J., Cai, Z., and Deng, Y.: Advances on Coastal and Estuarine Circulations Around the Changjiang Estuary in the Recent Decades (2000–2020), Front. Mar. Sci., 8, 615929, https://doi.org/10.3389/fmars.2021.615929, 2021.
Locarnini, R. A., Mishonov, A. V., Antonov, J. I., Boyer, T. P., Garcia, H. E., Baranova, O. K., Zweng, M. M., Paver, C. R., Reagan, J. R., Johnson, D. R., Hamilton, M., and Seidov, D.: World Ocean Atlas 2013, Vol. 1, Temperature, edited by: Levitus, S., A. Mishonov Technical Ed., NOAA, NOAA Atlas NESDIS 73, https://doi.org/10.7289/V55X26VD, 2013.
Lohrenz, S. E., Gary, L., Lang, G. A., Chen, X., and Michael, J.: Variations in primary production of northern Gulf of Mexico continental shelf waters linked to nutrient inputs from the Mississippi River, Cont. Shelf Res., 155, 45–54, 1997.
Lohrenz, S. E., Fahnenstiel, G. L., Redalje, D. G., Lang, G. a., Dagg, M. J., Whitledge, T. E., and Dortch, Q.: Nutrients, irradiance, and mixing as factors regulating primary production in coastal waters impacted by the Mississippi River plume, Cont. Shelf Res., 19, 1113–1141, https://doi.org/10.1016/S0278-4343(99)00012-6, 1999.
Malone, T. C., Conley, D. J., Fisher, T. R., Glibert, P. M., Harding, L. W., and Sellner, K. G.: Scales of Nutrient-Limited Phytoplankton in Chesapeake Bay Productivity, Estuaries, 19, 371–385, 1996.
Moon, J., Lee, K., Lim, W., Lee, E., Dai, M., Choi, Y., Han, I., Shin, K., Kim, J., and Chae, J.: Anthropogenic nitrogen is changing the East China and Yellow seas from being N deficient to being P deficient, Limnol. Oceanogr., 66, 914–924, https://doi.org/10.1002/lno.11651, 2021.
Ning, X., Lin, C., Su, J., Liu, C., Hao, Q., and Le, F.: Long-term changes of dissolved oxygen, hypoxia, and the responses of the ecosystems in the East China Sea from 1975 to 1995, J. Oceanogr., 67, 59–75, https://doi.org/10.1007/s10872-011-0006-7, 2011.
O'Boyle, S., Wilkes, R., McDermott, G., Ní Longphuirt, S., and Murray, C.: Factors affecting the accumulation of phytoplankton biomass in Irish estuaries and nearshore coastal waters: A conceptual model, Estuar. Coast. Shelf Sci., 155, 75–88, https://doi.org/10.1016/j.ecss.2015.01.007, 2015.
Ou, L., Qin, X., Shi, X., Feng, Q., Zhang, S., Lu, S., and Qi, Y.: Alkaline phosphatase activities and regulation in three harmful Prorocentrum species from the coastal waters of the East China Sea, Microb. Ecol., 79, 459–471, https://doi.org/10.1007/s00248-019-01399-3, 2020.
Paerl, H. W.: Controlling Eutrophication along the Freshwater–Marine Continuum: Dual Nutrient (N and P) Reductions are Essential, Estuar. Coast., 32, 593–601, https://doi.org/10.1007/s12237-009-9158-8, 2009.
Paerl, H. W., Valdes, L. M., Joyner, A. R., Piehler, M. F., and Lebo, M. E.: Solving problems resulting from solutions: evolution of a dual nutrient management strategy for the eutrophying Neuse River Estuary, North Carolina., Environ. Sci. Technol., 38, 3068–3073, 2004.
Paerl, H. W., Gardner, W. S., Havens, K. E., Joyner, A. R., McCarthy, M. J., Newell, S. E., Qin, B., and Scott, J. T.: Mitigating cyanobacterial harmful algal blooms in aquatic ecosystems impacted by climate change and anthropogenic nutrients, Harmful Algae, 54, 213–222, https://doi.org/10.1016/J.HAL.2015.09.009, 2016.
Rabalais, N. N. and Turner, R. E. (Eds.): Coastal Hypoxia: Consequences for Living Resources and Ecosystems, American Geophysical Union, Washington, DC, American Geophysical Union, https://doi.org/10.1029/CE058, 2001.
Scavia, D. and Donnelly, K. A.: Reassessing Hypoxia Forecasts for the Gulf of Mexico, Environ. Sci. Technol., 41, 8111–8117, https://doi.org/10.1021/es0714235, 2007.
Seitzinger, S. P. and Giblin, A. E.: Estimating denitrification in North Atlantic continental shelf sediments, Biogeochemistry, 35, 235–260, https://doi.org/10.1007/BF02179829, 1996.
Seitzinger, S. P. and Harrison, J. A.: Land-Based Nitrogen Sources and Their Delivery to Coastal Systems, in Nitrogen in the Marine Environment, 469–510, Elsevier, Academic Press, https://doi.org/10.1016/B978-0-12-372522-6.00009-8, 2008.
Shi, S., Xu, Y., Li, W., and Ge, J.: Long-term response of an estuarine ecosystem to drastic nutrients changes in the Changjiang River during the last 59 years: A modeling perspective, Front. Mar. Sci., 9, https://doi.org/10.3389/fmars.2022.1012127, 2022.
Smith, M. D., Oglend, A., Kirkpatrick, A. J., Asche, F., Bennear, L. S., Craig, J. K., and Nance, J. M.: Seafood prices reveal impacts of a major ecological disturbance, P. Natl. Acad. Sci. USA, 114, 1512–1517, https://doi.org/10.1073/pnas.1617948114, 2017.
Strokal, M., Yang, H., Zhang, Y., Kroeze, C., Li, L., Luan, S., Wang, H., Yang, S., and Zhang, Y.: Increasing eutrophication in the coastal seas of China from 1970 to 2050, Mar. Pollut. Bull., 85, 123–140, https://doi.org/10.1016/j.marpolbul.2014.06.011, 2014.
Strokal, M., Ma, L., Bai, Z., Luan, S., Kroeze, C., Oenema, O., Velthof, G., and Zhang, F.: Alarming nutrient pollution of Chinese rivers as a result of agricultural transitions, Environ. Res. Lett., 11, 024014, https://doi.org/10.1088/1748-9326/11/2/024014, 2016.
Strokal, M., Kahil, T., Wada, Y., Albiac, J., Bai, Z., Ermolieva, T., Langan, S., Ma, L., Oenema, O., Wagner, F., Zhu, X., and Kroeze, C.: Cost-effective management of coastal eutrophication: A case study for the Yangtze river basin, Resour. Conserv. Recycl., 154, 104635, https://doi.org/10.1016/j.resconrec.2019.104635, 2020.
Sylvan, J. B., Dortch, Q., Nelson, D. M., Brown, A. F. M., Morrison, W., and Ammerman, J. W.: Phosphorus limits phytoplankton growth on the Louisiana shelf during the period of hypoxia formation., Environ. Sci. Technol., 40, 7548–7553, 2006.
Tong, Y., Zhao, Y., Zhen, G., Chi, J., Liu, X., Lu, Y., Wang, X., Yao, R., Chen, J., and Zhang, W.: Nutrient Loads Flowing into Coastal Waters from the Main Rivers of China (2006–2012), Sci. Rep., 5, 16678, https://doi.org/10.1038/srep16678, 2015.
Tseng, Y.-F., Lin, J., Dai, M., and Kao, S.-J.: Joint effect of freshwater plume and coastal upwelling on phytoplankton growth off the Changjiang River, Biogeosciences, 11, 409–423, https://doi.org/10.5194/bg-11-409-2014, 2014.
Turner, R. E., Rabalais, N. N., and Justic, D.: Gulf of Mexico Hypoxia: Alternate States and a Legacy, Environ. Sci. Technol., 42, 2323–2327, https://doi.org/10.1021/es071617k, 2008.
Umlauf, L. and Burchard, H.: A generic length-scale equation for geophysical turbulence models, J. Mar. Res., 61, 235–265, https://doi.org/10.1357/002224003322005087, 2003.
Van Meter, K. J., Van Cappellen, P., and Basu, N. B.: Legacy nitrogen may prevent achievement of water quality goals in the Gulf of Mexico, Science, 360, 427–430, https://doi.org/10.1126/science.aar4462, 2018.
Wang, H., Dai, M., Liu, J., Kao, S.-J., Zhang, C., Cai, W.-J., Wang, G., Qian, W., Zhao, M., and Sun, Z.: Eutrophication-Driven Hypoxia in the East China Sea off the Changjiang Estuary, Environ. Sci. Technol., 50, 2255–2263, https://doi.org/10.1021/acs.est.5b06211, 2016.
Wang, J. and Wu, J.: Occurrence and potential risks of harmful algal blooms in the East China Sea, Sci. Total Environ., 407, 4012–4021, https://doi.org/10.1016/j.scitotenv.2009.02.040, 2009.
Wang, J., Yan, W., Chen, N., Li, X., and Liu, L.: Modeled long-term changes of DIN : DIP ratio in the Changjiang River in relation to Chl-a and DO concentrations in adjacent estuary, Estuar. Coast. Shelf Sci., 166, 153–160, https://doi.org/10.1016/j.ecss.2014.11.028, 2015.
Wang, K., Chen, J., Jin, H., Li, H., Gao, S., Xu, J., Lu, Y., Huang, D., Hao, Q., and Weng, H.: Summer nutrient dynamics and biological carbon uptake rate in the Changjiang River plume inferred using a three end-member mixing model, Cont. Shelf Res., 91, 192–200, https://doi.org/10.1016/j.csr.2014.09.013, 2014.
Wang, M., Kroeze, C., Strokal, M., Vliet, M. T. H., and Ma, L.: Global Change Can Make Coastal Eutrophication Control in China More Difficult, Earth's Futur., 8, e2019EF001280, https://doi.org/10.1029/2019EF001280, 2020.
Westphal, K., Musolff, A., Graeber, D., and Borchardt, D.: Controls of point and diffuse sources lowered riverine nutrient concentrations asynchronously, thereby warping molar N:P ratios, Environ. Res. Lett., 15, 104009, https://doi.org/10.1088/1748-9326/ab98b6, 2020.
Wong, G. T. F., Gong, G.-C., Liu, K.-K., and Pai, S.-C.: `Excess Nitrate' in the East China Sea, Estuar. Coast. Shelf Sci., 46, 411–418, https://doi.org/10.1006/ecss.1997.0287, 1998.
Wu, Y., Xi, X., Tang, X., Luo, D., Gu, B., Lam, S. K., Vitousek, P. M., and Chen, D.: Policy distortions, farm size, and the overuse of agricultural chemicals in China, P. Natl. Acad. Sci. USA, 115, 7010–7015, https://doi.org/10.1073/pnas.1806645115, 2018.
Wurtsbaugh, W. A., Paerl, H. W., and Dodds, W. K.: Nutrients, eutrophication and harmful algal blooms along the freshwater to marine continuum, Wiley Interdiscip. Rev. Water, 6, e1373, https://doi.org/10.1002/wat2.1373, 2019.
Xing, L., Zhao, M., Zhang, T., Yu, M., Duan, S., Zhang, R., Huh, C.-A., Liao, W.-H., and Feng, X.: Ecosystem responses to anthropogenic and natural forcing over the last 100 years in the coastal areas of the East China Sea, The Holocene, 26, 669–677, https://doi.org/10.1177/0959683615618248, 2016.
Yan, W., Zhang, S., Sun, P., and Seitzinger, S. P.: How do nitrogen inputs to the Changjiang basin impact the Changjiang River nitrate: A temporal analysis for 1968–1997, Global Biogeochem. Cy., 17, 1091, https://doi.org/10.1029/2002GB002029, 2003.
Yan, W., Mayorga, E., Li, X., Seitzinger, S. P., and Bouwman, A. F.: Increasing anthropogenic nitrogen inputs and riverine DIN exports from the Changjiang River basin under changing human pressures, Global Biogeochem. Cy., 24, GB0A06, https://doi.org/10.1029/2009GB003575, 2010.
Yang, D., Yin, B., Liu, Z., Bai, T., Qi, J., and Chen, H.: Numerical study on the pattern and origins of Kuroshio branches in the bottom water of southern East China Sea in summer, J. Geophys. Res.-Ocean., 117, C02014, https://doi.org/10.1029/2011JC007528, 2012.
Yu, C., Huang, X., Chen, H., Godfray, H. C. J., Wright, J. S., Hall, J. W., Gong, P., Ni, S., Qiao, S., Huang, G., Xiao, Y., Zhang, J., Feng, Z., Ju, X., Ciais, P., Stenseth, N. C., Hessen, D. O., Sun, Z., Yu, L., Cai, W., Fu, H., Huang, X., Zhang, C., Liu, H., and Taylor, J.: Managing nitrogen to restore water quality in China, Nature, 567, 516–520, https://doi.org/10.1038/s41586-019-1001-1, 2019.
Yu, L. and Gan, J.: Reversing impact of phytoplankton phosphorus limitation on coastal hypoxia due to interacting changes in surface production and shoreward bottom oxygen influx, Water Res., 212, 118094, https://doi.org/10.1016/j.watres.2022.118094, 2022.
Yu, L., Fennel, K., Laurent, A., Murrell, M. C., and Lehrter, J. C.: Numerical analysis of the primary processes controlling oxygen dynamics on the Louisiana shelf, Biogeosciences, 12, 2063–2076, https://doi.org/10.5194/bg-12-2063-2015, 2015.
Zhang, H., Fennel, K., Laurent, A., and Bian, C.: A numerical model study of the main factors contributing to hypoxia and its interannual and short-term variability in the East China Sea, Biogeosciences, 17, 5745–5761, https://doi.org/10.5194/bg-17-5745-2020, 2020.
Zhou, F., Chai, F., Huang, D., Xue, H., Chen, J., Xiu, P., Xuan, J., Li, J., Zeng, D., Ni, X., and Wang, K.: Investigation of hypoxia off the Changjiang Estuary using a coupled model of ROMS-CoSiNE, Prog. Oceanogr., 159, 237–254, https://doi.org/10.1016/j.pocean.2017.10.008, 2017.
Zhou, M., Shen, Z., and Yu, R.: Responses of a coastal phytoplankton community to increased nutrient input from the Changjiang (Yangtze) River, Cont. Shelf Res., 28, 1483–1489, https://doi.org/10.1016/j.csr.2007.02.009, 2008.
Zhu, Z.-Y., Ng, W.-M., Liu, S.-M., Zhang, J., Chen, J.-C., and Wu, Y.: Estuarine phytoplankton dynamics and shift of limiting factors: A study in the Changjiang (Yangtze River) Estuary and adjacent area, Estuar. Coast. Shelf Sci., 84, 393–401, https://doi.org/10.1016/j.ecss.2009.07.005, 2009.
Zweng, M. M., Reagan, J. R., Antonov, J. I., Locarnini, R. A., Mishonov, A. V., Boyer, T. P., Garcia, H. E., Baranova, O. K., Johnson, D. R., Seidov, D., and Biddle, M. M.: World Ocean Atlas 2013, Volume 2, Salinity, edited by: Levitus, S., A. Mishonov Technical Ed., NOAA, NOAA Atlas NESDIS 74, https://doi.org/10.7289/V5251G4D, 2013.