the Creative Commons Attribution 4.0 License.
the Creative Commons Attribution 4.0 License.
 | 14 Feb 2022
Will daytime community calcification reflect reef accretion on future, degraded coral reefs?
William Leggat
Jessica L. Bergman
Alexander Fordyce
Charlotte Page
Thomas Mesaglio
Tracy D. Ainsworth
Coral bleaching events continue to drive the degradation of coral reefs worldwide, causing a shift in the benthic community from coral- to algae-dominated ecosystems. Critically, this shift may decrease the capacity of degraded coral reef communities to maintain net positive accretion during warming-driven stress events (e.g., reef-wide coral bleaching). Here we measured rates of net ecosystem calcification (NEC) and net ecosystem production (NEP) on a degraded coral reef lagoon community (coral cover < 10 % and algae cover > 20 %) during a reef-wide bleaching event in February 2020 at Heron Island on the Great Barrier Reef. We found that during this bleaching event, rates of NEP and NEC across replicate transects remained positive and did not change in response to bleaching. Repeated benthic surveys over a period of 20 d indicated an increase in the percent area of bleached coral tissue, corroborated by relatively low Symbiodiniaceae densities (∼ 0.6 × 106 cm−2) and dark-adapted photosynthetic yields in photosystem II of corals (∼ 0.5) sampled along each transect over this period. Given that a clear decline in coral health was not reflected in the overall NEC estimates, it is possible that elevated temperatures in the water column that compromise coral health enhanced the thermodynamic favorability for calcification in other ahermatypic benthic calcifiers. These data suggest that positive NEC on degraded reefs may not equate to the net positive accretion of a complex, three-dimensional reef structure in a future, warmer ocean. Critically, our study highlights that if coral cover continues to decline as predicted, NEC may no longer be an appropriate proxy for reef growth as the proportion of the NEC signal owed to ahermatypic calcification increases and coral dominance on the reef decreases.
- Article
(7451 KB) - Full-text XML
-
Supplement
(593 KB) - BibTeX
- EndNote


Coral have long been the focus of climate change research in tropical oceans as they are a keystone species responsible for the biogenic construction of complex reef habitat (Grigg and Dollar, 1990). Adverse effects to their ability to construct calcium carbonate structure have negative implications for coral reef ecosystems, given corals are the major organism responsible for collectively maintaining the accumulation of permanent reef structure at a rate that overcomes the biological and physical mechanisms that act to break reefs down (carbonate dissolution, bioerosion, storm activity; Eyre et al., 2018). In contrast to coral-derived calcium carbonate, other benthic marine calcifiers, such as non-sessile Gastropods, Echinoderms, or Halimeda algae (Ries et al., 2009; Harney and Fletcher, 2007), secrete calcium carbonate that is relatively temporary and does not contribute to the long-term reef structure. Traditionally, corals are classed as the dominant calcifier on tropical coral reefs, occupying between 10 %–50 % of benthic area in healthy coral reef lagoons (Bruno and Selig, 2007; Brown et al., 2004). As such, estimates of net ecosystem calcification (NEC) are considered synonymous with the growth and function of the entire coral reef community and can be used to represent the collective response in coral reef community health to anthropogenic stressors such as ocean warming and subsequent reef-wide bleaching events (Courtney et al., 2018).
Presently, records of coral reef NEC during a reef-wide bleaching event (driven by sea surface temperatures plus 1 ∘C above monthly maximum means; Heron et al., 2016; Sully et al., 2019) are rare (McMahon et al., 2019). The effects of bleaching events, and their associated thermal seawater temperature anomalies, on coral reef NEC have been predominately studied ex situ using recreated communities in aquaria (Dove et al., 2013) or scaling up the response from organism-level studies, both ex situ (Castillo et al., 2014) and in situ (Cantin et al., 2010). In studies conducted ex situ in aquaria, a warming treatment strong enough to cause bleaching (between 1–4 ∘C above the summer mean) reduced coral calcification rates by 30 %–90 % (Cantin et al., 2010; D'Olivo and McCulloch, 2017). In situ observations following bleaching events have shown a 20 %–90 % reduction in individual coral calcification rates (Castillo et al., 2014) and a significant reduction in the coral endosymbiont photosynthetic yields (evidence of damage to their photosystems; Warner et al., 1999). At the whole community level, the few in situ studies that have observed community metabolism during a bleaching event recorded a 40 % (Dongsha Atoll, Taiwan; DeCarlo et al., 2017) to 100 % (Kaneohe Bay, Hawaii; Courtney et al., 2018; Kayanne et al., 2005; Palau) decline in reef NEC. This effect has been observed to linger 6 to 12 months after these events, with NEC remaining depressed by as much as 40 %–46 % (Lizard Island; McMahon et al., 2019) and an ultimate loss of 30 %–90 % of the benthic coral cover (Brown and Suharsono, 1990; Baird et al., 2002). Experiments with simulated communities in aquaria (e.g., Dove et al., 2013) validate these organism- and community-level in situ studies, in which this same magnitude of warming leads to a reduction in the experimental community coral cover by 30 %, a 70 % decline in NEC, and subsequent out-competition of corals by neighboring algae.
The overgrowth of algae has been mirrored in the natural reef lagoon environment several times following bleaching events (Hughes et al., 1999; Diaz-Pulido et al., 2009). Despite a recovery to normal pre-disturbance NEC within 2 years following a 2014 bleaching event at Lizard Island (Pisapia et al., 2019), there was a permanent shift from coral to algae as the dominant benthic community member, with a decline in coral cover from 8 %–3 % along transects established at the southeast end of the lagoon (McMahon et al., 2019). This response has been seen elsewhere on the Great Barrier Reef, where reef-wide bleaching events lead to the overgrowth of unpalatable Lobophora variegata algae (Diaz-Pulido et al., 2009) to the extent that coral became a minority constituent (∼ 2 %–5 %) in the lagoon's benthic community. This transition to an algal-dominated reef community jeopardizes the efficacy of NEC as a proxy for reef growth given that hermatypic corals can no longer be considered the dominant benthic organism (Courtney et al., 2018). Similar questions have been raised after other anthropogenically driven stress events (e.g., eutrophication and sedimentation; Edinger et al., 2000) in which coral growth rates on undisturbed reefs did not differ from those measured on polluted, algal-dominated reefs where habitat structure was clearly degrading. If the community predominantly becomes covered in algae and the habitat structure is visibly degrading, does NEC still represent reef growth or does it now reflect a greater proportion of ahermatypic organism calcification not contributing to permanent structure?
Shifts from coral- to algal-dominated reefs without the concomitant decline in NEC have been observed by Kayanne et al. (2005; 7.1 % coral cover), in which no change in NEC on Shiraho Reef, Japan, was measured despite 51 % of the corals bleaching during a 1998 bleaching event and a decline to 5.8 % coral cover. This study suggested that continued calcification by living, unbleached corals, calcifying algae, or other benthic calcifiers (e.g., foraminifera, gastropods, echinoderms) may have compensated for any expected bleaching-driven decline in coral calcification. This discrepancy between Kayanne et al. (2005; no change in NEC on a reef with < 10 % coral cover) and that of other NEC estimates during a bleaching event (decline in NEC on a reef ≥ 10 % coral cover; DeCarlo et al., 2014) may be due to a critical threshold in the relationship between NEC and percent coral cover. This is of specific concern when using NEC to monitor community function (i.e., the net accretion of reef structure) during coral bleaching or other disturbance events on future, degraded reefs where algae will likely become the dominant benthic member.
To address these emerging concerns, this study investigated community metabolism on a degraded coral reef community (coral cover < 10 %, algae cover > 20 %) during a bleaching event at Heron Island on the Great Barrier Reef in February 2020. Flow-metabolism transects were established on two areas within the Heron Island lagoon, and estimates of community metabolism (net ecosystem production, NEP, and NEC), coral metaorganism function (photosynthetic yields, Symbiodiniaceae densities), benthic cover, and bleaching extent (percent bleached coral tissue) were assessed during the period of peak thermal stress.
2.1 Study area
This study was conducted from 15 January to 10 February 2020. Two separate 200 m × 100 m lagoon sites (lagoon sites 1 and 2; Fig. 1) that each differed in total coral cover were established on the southern side of the Heron Island lagoon (23∘26′670′ S, 151∘54.901′ E). Community metabolism, physiochemical data, benthic community cover, and bleaching extent were then repeatedly measured on each transect over a period of 20 d. HOBO temperature loggers (Onset, USA), which recorded temperature (∘C) at an interval of 15 min, were deployed at nine upstream and downstream locations (1–9) across the study area (Fig. 1). Overlapping loggers located at the middle deployment locations (2, 5, and 8) were used for both lagoon sites 1 and 2, resulting in six loggers per site.
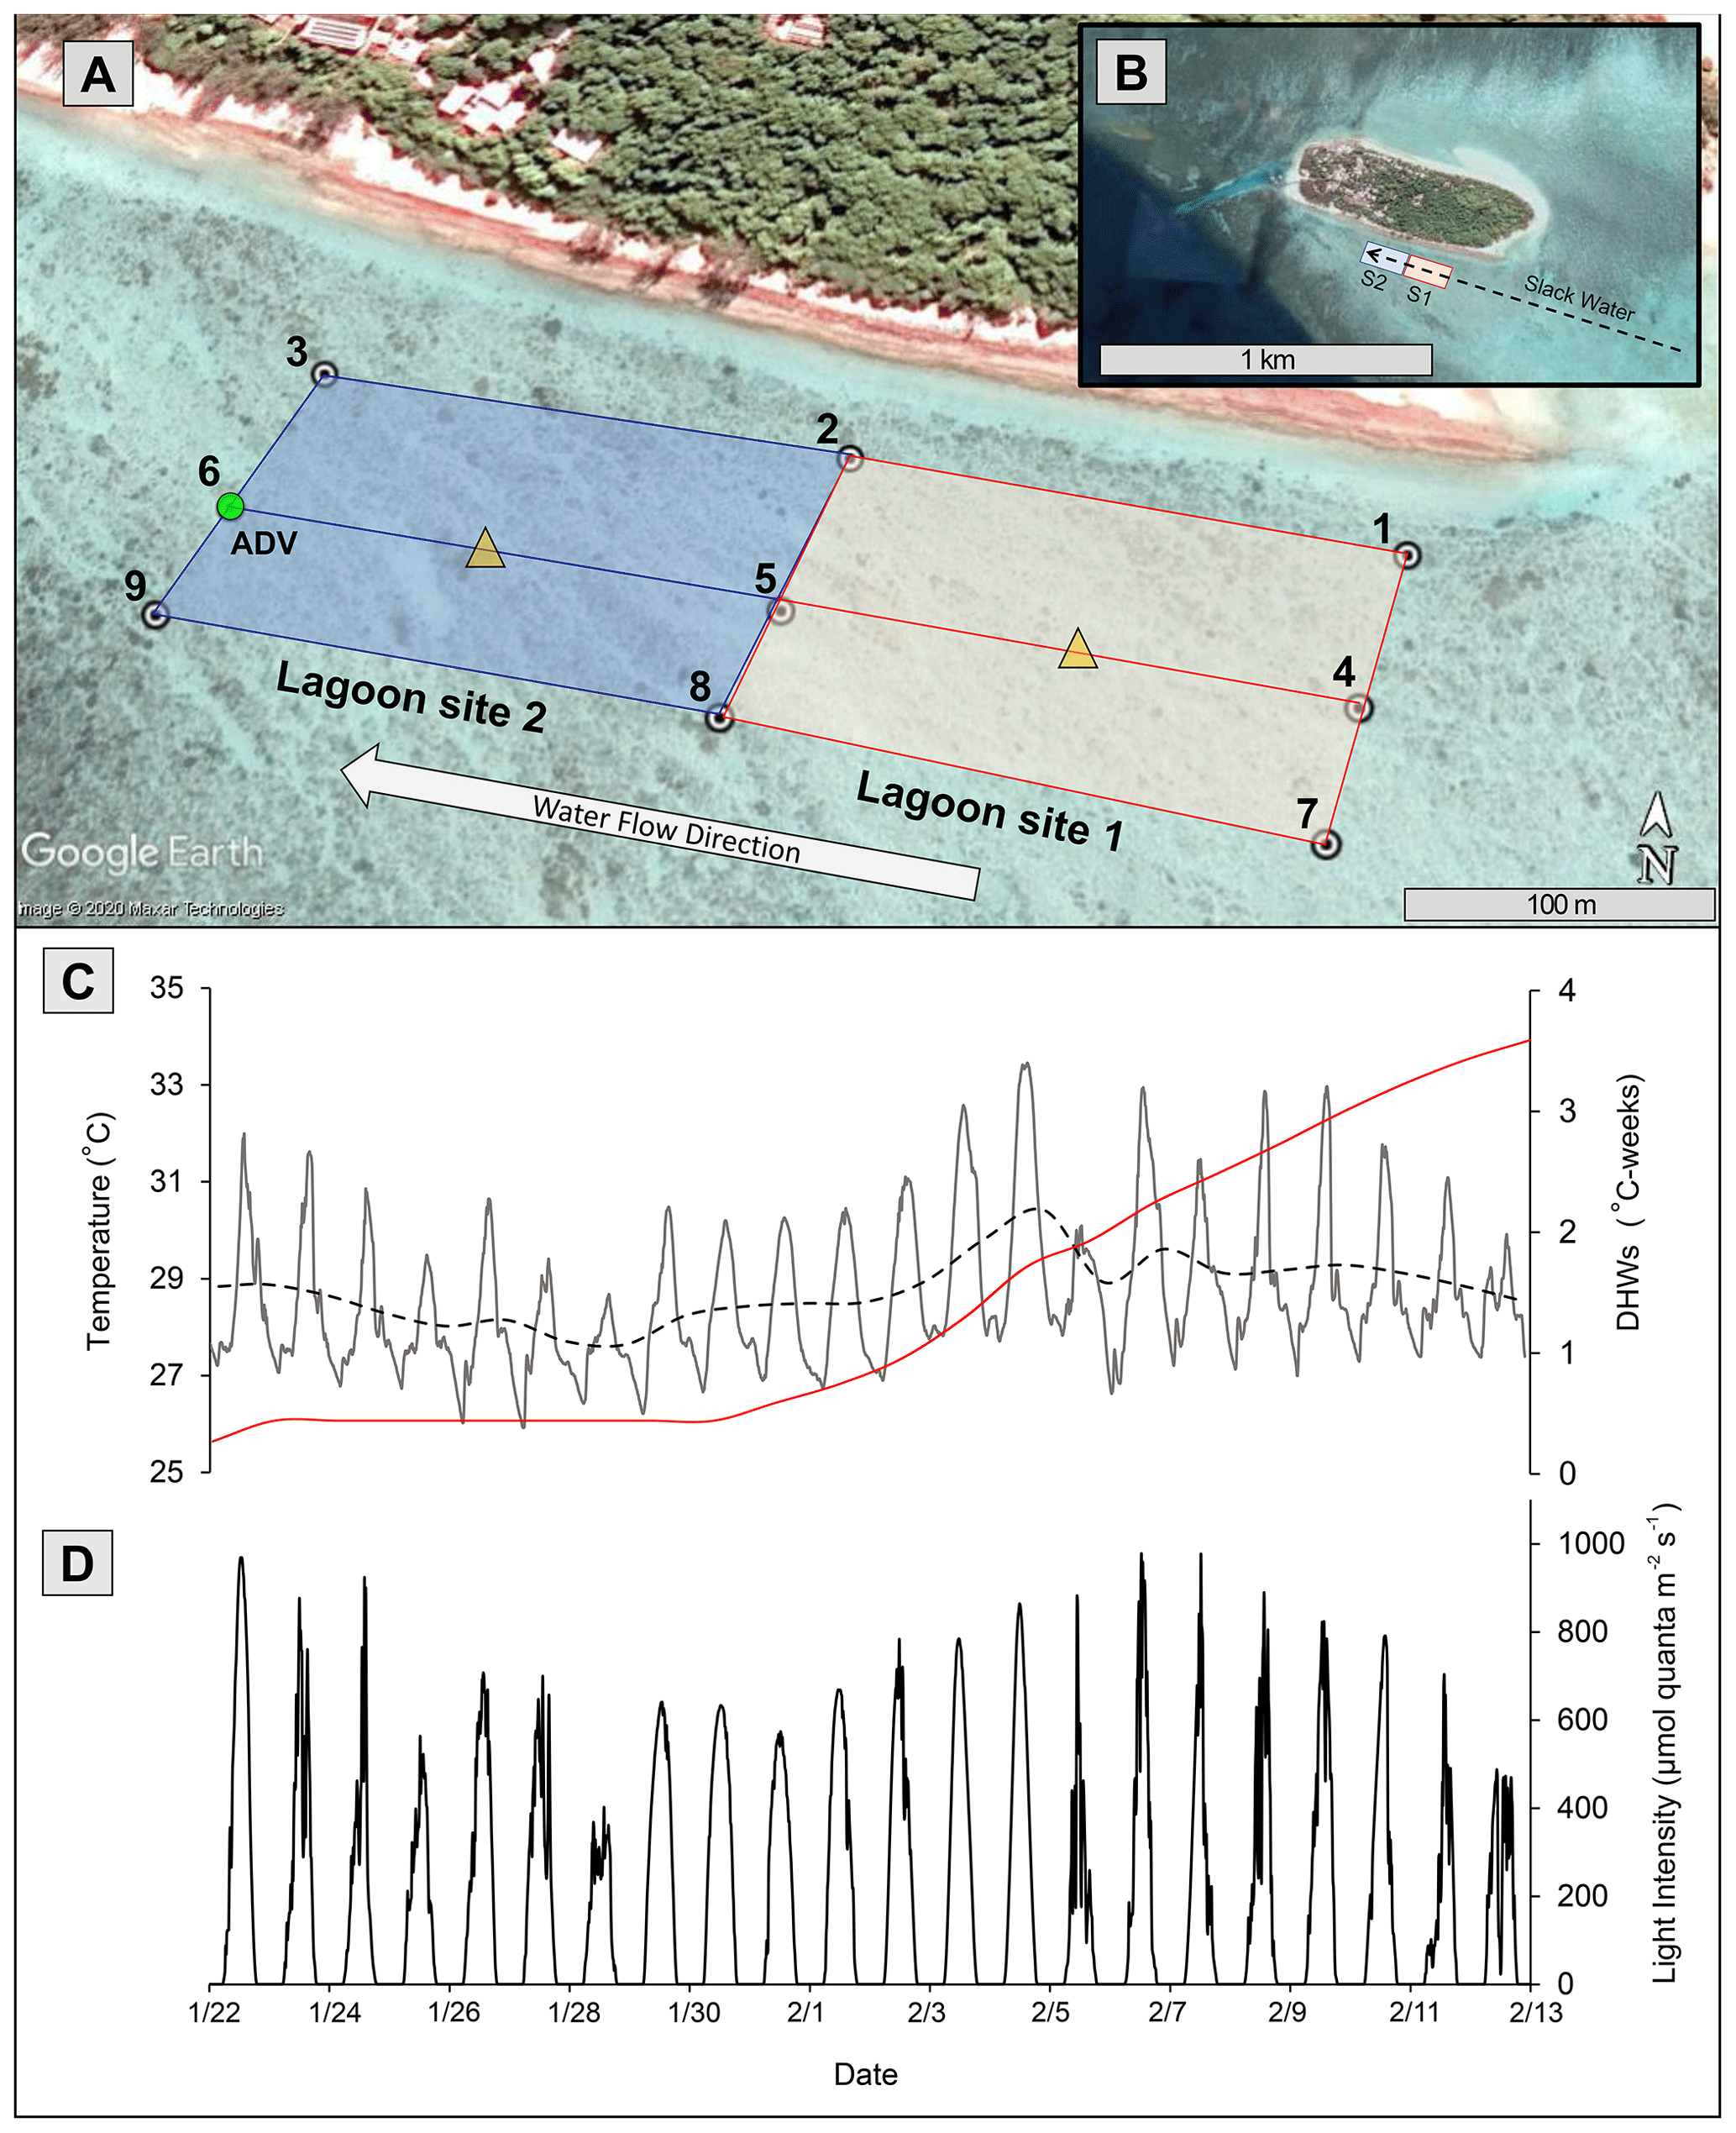
Figure 1(a) Study area (100 m scale) subdivided into lagoon site 1 (red) and lagoon site 2 (blue). Numbered white circles (1–9) indicate of location water samples and temperature loggers. Yellow triangles indicate location of light loggers. (b) Study area (1 km scale) showing lagoon site 1 (S1) and lagoon site 2 (S2) in relation to Heron Island and the larger slack-water area. (c) In situ lagoon temperature (∘C) averaged across both sites measured by temperature loggers. The dashed black line represents the 24 h average of these temperature data, and the red line indicates the accumulation of degree heating weeks (DHWs; ∘C weeks) in these data. (d) Light intensity (µmol quanta m−2 s−1) averaged across two light loggers. The green circle represents location of ADV flow meter during Eulerian estimates. All data were recorded at 15 min intervals from 22 January to 13 February 2020. Aerial photograph is provided by © Google Earth.
To measure the accumulation of temperature stress above the local bleaching threshold (defined here as the maximum of the monthly means, MMM + 1 = 28.3 ∘C; Liu et al. 2014), mean temperatures across all nine loggers were used to calculate the number of degree heating weeks (DHWs), which represents the 12-week accumulation of temperatures above the MMM (Heron et al., 2016). Because HOBO temperature loggers may record higher temperatures than surrounding seawater due to internal heating of the transparent plastic casing (Bahr et al., 2016), HOBO loggers were deployed in the shade on a cinder block, and downloaded temperature data were corrected for precision (48 h side-by-side logging of all nine loggers in an aquarium) and accuracy (deployment next to Hanna HI98194 multimeter recording temperature). Light loggers (2π Odyssey PAR sensor) were deployed within the middle of each study site (n=1 per site). Loggers were attached to a star picket to ensure the sensor was exactly 20 cm above the benthos and recorded light intensity at 15 min intervals. Odyssey light logger data were converted to micromoles quanta of photosynthetic active radiation (PAR) per square meter per second (µmol quanta m−2 s−1) using a linear calibration over a 24 h period with a 2π quantum sensor LI-190R and a LI-COR LI-1400 m (R2=0.92).
2.2 Benthic community surveys
The benthic community along each 200 m transect was described using four survey approaches: (1) point-contact surveys, (2) photo-quadrat surveys, (3) mobile invertebrate counts, and (4) invertebrate and algal taxonomy descriptions. For the (1) point-contact surveys and (2) photo-quadrat surveys, benthic cover was categorized as coral (hermatypic, live), coral (bleached), coral (soft), algae (fleshy, non-calcifying), other calcifier (e.g., Halimeda spp.), rubble, and sediment. For the point-contact method, the occupier of benthic space was recorded underneath each 1 m interval (n=200 per transect) at the beginning and end of the study, and data are presented as relative percent cover. These surveys were repeated twice per transect at the beginning of the study (18–20 January 2020) to provide an initial understanding of the community assemblage prior to flow-metabolism measurements. For the (2) photo-quadrat method, a photo of a 1 m2 PVC quadrat was taken at every 5 m interval (n=40 per transect) three times throughout the study: (1) at the beginning prior to any observed bleaching (24 January 2020), (2) in the middle after the first observed bleaching event (6 February 2020), and (3) at the end of the study after several more observed bleaching incidents (13 February 2020). These images were analyzed in ImageJ using one side of the photo quadrat to set the scale (1 m) and the area tracing tool to calculate the relative percent area of each category over time.
For mobile invertebrate surveys, a transect tape was laid along each 200 m transect length, and relatively large, easily visible mobile invertebrates (e.g., sea cucumbers, sea hares, sea urchins) located 1 m to the left or right along the transect were counted. Surveys were conducted at dawn to ensure a balance of visibility and invertebrate activity and repeated three times along each transect (n=9 per site). Data are presented as abundance counts per square meter (individuals m−2). Individuals present at less than 0.1 m−2 were excluded from the final data reported but were included as part of the invertebrate taxonomy described below. For general invertebrate taxonomy, while conducting the survey approaches detailed above, each time a new invertebrate morphospecies was encountered, photographs were taken and uploaded to iNaturalist, a biodiversity citizen science platform where identifications are contributed in real time by both amateur naturalists and professional taxonomists as part of a consensus system (https://www.inaturalist.org, last access: 10 October 2020). Using a combination of taxonomic keys and crowdsourcing via iNaturalist, algae, corals, and other sampled marine invertebrates were identified to as fine a taxonomic level as possible. These data are presented as presence/absence across the entire 200 m × 400 m study area. Because sampling was conducted at low tide, most fish usually present in the lagoon were absent and excluded from benthic survey data.
2.3 Bleached coral physiology
Following the qualitative appearance of bleaching (white corals in photo quadrat surveys), efforts were made to provide physiological data that would corroborate bleaching observations. This was accomplished through Symbiodiniaceae density analyses for both Acropora spp. (Acropora aspera, Acropora millepora, Acropora muricata, Acropora humilis) and “Other” corals (Pocillopora damicornis, Isopora palifera, Porites cylindrica, Montipora digitata). For photophysiology, replicate coral fragments (n= ∼ 15–35 per time point) of both Acropora spp. and “Other” corals were collected across all transects at lagoon sites 1 and 2 by hand on 4 and 9 February 2020 (once bleaching was apparent) and used to measure photosynthetic efficiency of in hospite Symbiodiniaceae cells. Measurements of photosystem II dark-adapted yield were taken using a pulse-amplitude modulated (PAM) fluorometer (MAXI Imaging PAM, Waltz, Effeltrich, Germany) using imaging PAM analysis (n=3 technical replicates per fragment).
For quantification of Symbiodiniaceae densities, replicate coral fragments (n= ∼ 15–35 per time point) of both Acropora spp. and “Other” corals were collected across all transects at lagoon sites 1 and 2 by hand on 30 January and 12 February 2020. At each sampling time point the most visually “stressed” (ranging from pale to completely bleached) corals were collected. A total of 15 fragments from each group (Acropora spp. or “Other”) were collected at the study site and directly frozen in Whirl-Pak© bags at −80 ∘C. Tissue was removed from the skeleton using an airpik and compressed air from diving tanks. Tissue was blown into a ziplock bag with 50 mL of 0.45 µm filtered seawater. The algal pellet was washed three times (centrifuged at 3856 × g, 4 ∘C for 5 min) to remove mucous and coral tissue before being frozen at −20 ∘C for later analysis. The pellet was suspended in 10 mL of filtered seawater, and aliquots were counted in triplicate using an improved Neubauer haemocytometer. Counts were normalized to fragment surface area using the wax method (Stimson and Kinzie, 1991).
2.4 Lagoon community metabolism measurements
Rates of daytime net ecosystem production (NEP; mmol O2 m−2 h−1) and net ecosystem calcification (NEC; mmol CaCO3 m−2 h−1) were estimated daily (tides and full sunlight permitting) over the course of 20 d (22 January to 12 February 2020) along the six transects. To estimate rates of NEP and NEC, changes in dissolved oxygen (DO) and total alkalinity (AT) were measured, respectively, during a 3 h window around low tide and peak sunlight using both the slack-water and flow-respirometry (Eulerian) approaches. Because differences in sunlight are a major driver in NEP variability, measurements were refined to days of full sunlight and low tides coinciding with near midday (11:00–15:00). Flow speeds across the transect were measured with an acoustic Doppler velocimeter (ADV; SonTek, cm s−1) recording data at 15 min intervals. This ADV was placed at the end of the middle transect (Fig. 1). Depth varied between 0.1–1 m and was measured concurrently with water sample collections at each location. Depth was also measured at peak low tide at 5 m intervals along each transect (n=120 site 1) to ensure that sample location depths adequately represented the entirety of the transect.
Salinity (psu) and DO (mg L−1) was measured with a Hanna HI98194 multimeter, and DO was converted to micromoles per kilogram (µmol kg−1) using seawater density. DO probe calibration was performed weekly using a two-point calibration at 0 % (sodium thiosulfate) and 100 % saturated seawater equilibrated with the atmosphere. Samples for AT were collected in 60 mL sample polycarbonate sample bottles, preserved with saturated mercuric chloride according to CO2 best practices (Dickson, 2007), and sealed with a screw top lid and parafilm. Seawater AT was analyzed by potentiometric titration using a Metrohm 848 Titrino plus automatic titrator (∼ 40 mL of seawater per sample) in duplicates (SD uncertainty < 2 µmol kg−1). Overall analytical uncertainty for AT (SD = ± 2.4 µmol kg−1) measurements was estimated from repeated measurements of certified reference materials from the Scripps Institute of Oceanography (CRM; Batch 161).
2.4.1 Eulerian approach
Flow metabolism transects were established along a reef area previously characterized as degraded, where there is less than 10 % coral cover (Roelfsema et al., 2018). The flow-respirometry (i.e., Eulerian approach) measurements were conducted within two designated reef areas (100 m × 200 m; 0.02 km2) that significantly differed in coral cover. The defined study area was determined based on the necessary transect length to achieve measurable differences in seawater dissolved oxygen (ΔDO = ± 4–7 mg L−1) between upstream and downstream locations (∼ 200 + m; Langdon et al., 2010).
Repeated deployments of fluorescein dye packets across the research zone at differing tidal periods determined a specific 400 m × 100 m area of the reef where flow was unidirectional from east to west. This period spanned from 2 h before to 1 h after peak low tide (3 h total). Outside of this period, the reef lagoon was no longer physically separated from the open ocean, flow became multidirectional, and the defined lagoon area became too deep and diluted with open ocean water to measure significant changes in seawater chemistry. The 400 m × 100 m area was then designated as two. The spread of the dye path varied ± 25 m in a north–south direction, and triplicate 200 m transects were spaced 50 m apart in parallel at each site so that NEC and NEP were averaged across the three downstream locations, representing all potential water flow paths of the overall study site area. A flow meter was rotated between downstream water sample collection locations (n=3 per sampling location), and the determined continued placement of the one available ADV at the middle downstream location was adequate to represent flow speed across all three transects. Within each area, three 200 m transects were established in parallel, 50 m distance from one another (Fig. 1). Water samples were collected as close in time as possible at these fixed upstream and downstream locations (n=3 per area) at peak low tide, while lagoon currents were unidirectional, running east to west.
The Eulerian approach requires the following measurements: the change in DO and AT (ΔDO and ΔAT; mmol kg−1), the mean seawater density (ρ; kg m−3), the mean current speed (cm s−1), the mean depth over the transect (d; meters), and the length of the transect (l; meters). For specific details on the arrangement of the equations above, including the parameter (to convert cm s−1 to m h−1), please refer to Langdon et al. (2010).
2.4.2 Slack-water approach
The slack-water approach was used to estimate rates of NEP and NEC over a relatively larger area of reef (∼ 0.3 km2) during a period of 3 h around low tide. This period was chosen based on initial observations of current speed and direction that aligned with previous slack-water estimates on this specific area of the Heron lagoon (Stoltenberg et al., 2020). Starting 2 h before peak low tide, the lagoon becomes separated from the open ocean, and the current begins flowing unidirectionally toward the lagoon outlet to the west. This unidirectional flow behavior continues until roughly 2 h after peak low tide; at that time the flow begins to reverse as the tide fills back in over the reef crest. To avoid dilution with the open ocean and changing current vector directions confounding residence time estimates, water samples were collected from the same three locations (n=3 d−1) 2 h before peak low tide and 1 h following.
The slack-water approach requires the following measurements: the change in DO and AT (ΔDO and ΔAT; mmol kg−1), the mean seawater density (ρ; kg m−3), mean depth over the transect (d; meters), and time between sampling (Δt; hours). Given the time between samples (∼ 3 h) and mean current speeds (∼ 20 cm s−1), these measurements represent a transect length of roughly 2.5–3 km of reef.
2.4.3 Approach comparison
Both approaches to estimate NEP and NEC provide limitations and advantages with respect to each other (see Langdon et al., 2010). In the Eulerian approach, the exact benthic area contributing to measured changes in seawater chemistry is known, and its constituents can be quantified and related to the calculated rates of benthic metabolism. This approach, however, measures change in alkalinity over a relatively smaller area and time period. Resulting fluxes in AT (± 30–60 µmol kg−1) and DO (± 20–50 µmol kg−1) are relatively small compared to the slack-water approach, thereby providing less confidence in calculated rates of benthic metabolism.
In contrast, the slack-water approach benefits from the relatively large changes in total alkalinity (AT: ± 100–200 µmol kg−1) and dissolved oxygen (DO: ± 80–150 µmol kg−1), which provides more confidence in AT anomaly calculations and represents a large area of the reef flat relative to this study's flow-respirometry estimates. This approach, however, lacks specificity of the exact area of reef affecting changes in chemistry, and DO fluxes are more vulnerable to gas exchange anomalies. As such, relating metabolic rates to the benthic community provides uncertainties given daily changes in mean current speed and, subsequently, the area of benthos reflected in the AT and DO anomaly.
Overall, the combination of both approaches can work in tandem to compensate for their respective weaknesses. However, neither approach can accommodate dilution with the open ocean, and they generally need to be conducted in full sunlight or darkness so that community metabolism does not transition between autotrophy and heterotrophy in the middle of the measurements. For this reason, community metabolism estimates were paused from 27 January–2 February when peak low tide occurred around dawn and dusk, and changes in DO and AT were negligible.
2.4.4 Air–sea gas exchange corrections
NEP estimates were corrected for the air–sea gas exchange () of oxygen using the gas-transfer velocity relationships outlined by Wanninkhof (1992) and Wanninkhof et al. (2009). was calculated with the following equation.
where k is the gas transfer velocity (calculated using and averaged daily wind speed from BOM data), K0 is the gas transfer coefficient, fO2water is the concentration of seawater dissolved oxygen (mg L−1) at the time of the downstream measurement, and fO2air (mg L−1) was assumed to be 100 % saturation at the air temperature over the 3 h measurement period (∼ 8.10 mg L−1).
2.4.5 Statistical analyses
All statistical analyses were performed with the SPSS statistics software (SPSS Inc. 2013 Version 26.0). To compare measured differences in benthic cover (percent coral, percent algae, percent bleached coral tissue, sediment overgrowth) and community metabolism (NEP and NEC) between triplicate transects, measurement days (n=12), and lagoon sites (lagoon site 1, lagoon site 2, and slack water), a one-way analysis of variance (ANOVA) model was used where transect, day, or site was a fixed effect, and measured values for percent cover, NEP, and NEC were treated as the response variable. Results for percent cover compared among triplicate transects and lagoon sites are displayed in Tables S1 and S2, respectively. Before community metabolism measurements were compared, assumptions of normality and equality of variance were evaluated with a Shapiro–Wilk test (Table S4). Results for community metabolism compared among triplicate transects, measurement days, and lagoon sites are displayed in Tables S5, S6, and S7, respectively. A Tukey HSD post hoc test was used to perform pairwise comparisons for measured NEC between lagoon site 1, lagoon site 2, and the slack-water approach (Table S7). To explore relationships between NEC as a function of NEP, Model II regression techniques were used to test for significant linear relationships (cutoff value p< 0.1), and an ANCOVA was used to test for differences in NEC vs. NEP slope categorized by lagoon site (lagoon site 1 and lagoon site 2).
3.1 Lagoon community assemblage
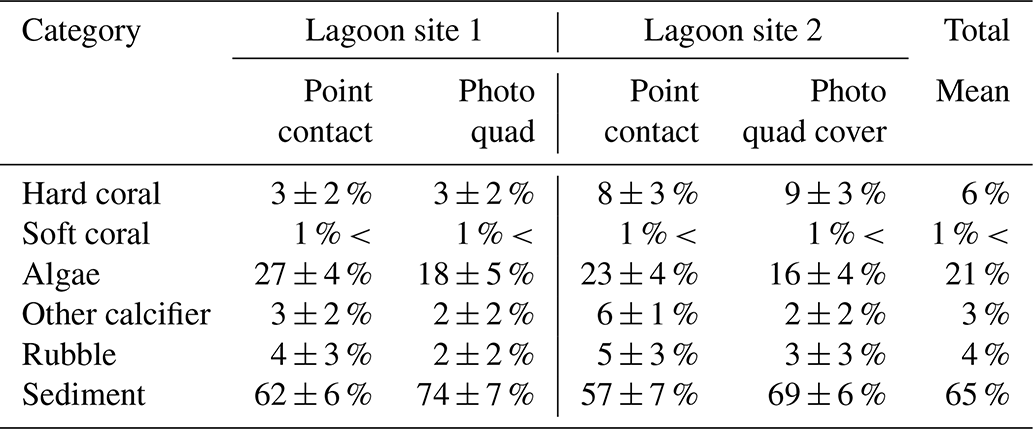
Across the whole study area (lagoon site 1 and lagoon site 2 combined), the benthic community was predominately covered by sediment (59 ± 7 %) and fleshy algae (25 ± 6 %). Coral cover (5 ± 3 %) was slightly higher relative to other recorded sessile calcifiers (4 ± 1 %) and carbonate rubble covered in coralline algae (5 ± 2 %). Algae was the dominant benthic organism in both lagoon site 1 (28 ± 4 %) and lagoon site 2 (22 ± 4 %), and cover was significantly higher at lagoon site 1 (p=0.011) (Table 1). Lagoon site 2 exhibited a significantly higher coral coverage (8 ± 3 %) relative to lagoon site 1 (3 ± 2 %) (p=0.001), the majority of which were A. aspera, A. millepora, and M. digitata. A description of the mobile and sessile invertebrate diversity is described in Fig. 2 and the Supplement (Table S4). A full list of observed invertebrates and accompanying photos can be found at https://www.inaturalist.org/projects/heron-island-survey-corals-inverts-and-algae, last access: 10 October 2020.
Table 1Percent cover (mean ± SD) measured during point-contact and photo-quadrat surveys. Data for point contact surveys were pooled across triplicate transects and repeated survey efforts (n=6 per site) within each lagoon site area. Data for photo-quadrat surveys were pooled across triplicate transects and repeated survey efforts within each lagoon site area (n=360 per site).
Overall, we found 25 coral species in the lagoonal reef study area, 22 of which were hard corals and 3 soft corals (Fig. 2; Table S8). A total of 13 algae morphospecies were observed, with one identified as species Valonia ventricosa and the rest unidentified. Across all other invertebrate taxa, 19 species of echinoderms, bivalves, and polychaetes and 24 species of crustaceans and gastropods were observed. Of the 43 non-coral invertebrate species, 15 were associated with colonies of Pocillopora corals. Sea cucumbers (e.g., Holothuria spp., Stichopus spp.) were the dominant mobile invertebrate, and the lollyfish sea cucumber (Holothuria atra) was the most common across both lagoon sites (1.2 ± 0.2 individuals m−2). Second in abundance was the Herrmann's sea cucumber (Stichopus herrmanni) (0.4 ± 0.1 individuals m−2). Other notable invertebrates included Linckia sea stars (Linckia guildingia, Linckia laevigata) and white-speckled sea hares (Aplysia argus) (all found in abundances < 0.1 individuals m−2). The largest mobile invertebrates observed were Bailer Shell snails (Melo amphora) at 30 cm in length and white-spotted hermit crabs (Dardanus megistos) occupying Bailer shells (< 0.1 individuals m−2).

Figure 2Cross section of coral, algal, and invertebrate diversity observed within the study area. (a) Dipsastraea sp.; (b) Stylophora pistillata; (c) Montipora digitata; (d) Sarcophyton sp.; (e) Acropora sp.; (f) Pocillopora sp.; (g) Platygyra sp.; (h) Acropora secale; (i) Porites attenuata; (j) Halimeda sp.; (k) Holothuria atra; (l) Dardanus megistos; (m) Trapezia serenei; (n) assemblage of Caulerpa sp. and Laurencia sp. algae covered in scum sp.; (o) Linckia laevigata; (p) Stichopus herrmanni; (q) Melo amphora; (r) Tridacna maxima.
Our observations included eight species with a conservation status of near threatened or higher, including the small giant clam Tridacna maxima, Herrmann's sea cucumber (Stichopus herrmanni), and six coral species (Porites attenuata, Acropora secale, Isopora palifera, Stylophora pistillata, Favites halicora, Favites rotundata). Notably, our observation of the aglajid slug Tubulophilinopsis gardineri is one of just five from Heron Island, representing the southernmost limit of its eastern coast distribution. We also observed an undescribed nudibranch species, a yellow-brown Gymnodoris. A complete list of all species described can be found in the Supplement (Table S8).
3.2 Lagoon light and temperature
Temperature across lagoon site 1 exhibited a mean value of 28.6 ± 1.5 ∘C and varied between a minimum of 25.8 ∘C and a maximum of 34.8 ∘C (Table 2). Light at lagoon site 1 exhibited a mean value of 328 ± 247 µmol quanta m−2 s−1 and maximum values of 1001 µmol quanta m−2 s−1 (Fig. 1). Temperature across lagoon site 2 exhibited a mean value of 28.6 ± 1.5 ∘C and varied between a minimum of 25.9 ∘C and a maximum of 34.6 ∘C. Light at lagoon site 2 exhibited a mean value of 336 ± 254 µmol quanta m−2 s−1 and maximum values of 969 µmol quanta m−2 s−1.
Table 2Mean values for physiochemical parameters measured at lagoon site 1 and lagoon site 2 over the course of the study. Temperature and light were logged continuously at 15 min intervals. Temperature data are separated by the pre-bleaching period (22 January–1 February 2020) and bleaching period (2–10 February 2020). Salinity was measured with each collected water sample (n=60 per site). Depth was measured at peak low tide at 5 m intervals along each transect (n=120 per site). The flow meter was rotated between downstream water sample collection locations on each day of collection (n=5 per site).
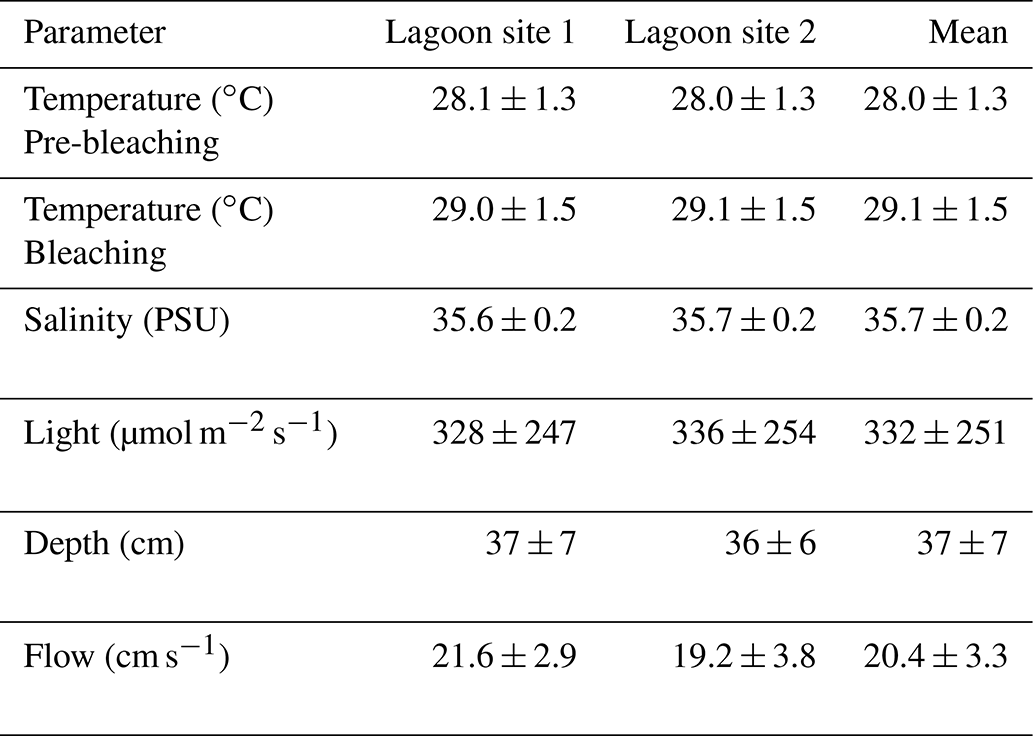
Satellite monitoring data (5 km pixel resolution; NOAA Coral Reef Watch; Liu et al., 2006) indicated the accumulation of heat stress beginning on 1 February 2020. Lagoon temperatures peaked 3 d following 4 February (Fig. 1) at which time the first signs of coral bleaching were anecdotally observed within the study area and in other areas of the Heron lagoon. Over the course of the study period a total of 3.59 DHWs were accumulated. In the periods before and after the accumulation of heat stress (1 February 2020), lagoon site 1 mean temperatures were 28.1 ± 1.4 and 29.0 ± 1.5 ∘C, respectively, and lagoon site 2 mean temperatures were 28.0 ± 1.3 and 29.1 ± 1.5 ∘C, respectively. Further details on recorded light and temperature data can be found in the Supplement (Table S5).
3.3 Lagoon community bleaching extent
Dark-adapted yield was 0.662 ± 0.010 for Acropora spp. fragments and 0.576 ± 0.020 for “Other” fragments (mean ± SE, n=35) on 4 February. On 9 February, yield declined 35 % for Acropora spp. to 0.430 ± 0.014 (n=15) and 25 % for “Other” fragments to 0.434 ± 0.018 (n=20). Symbiodiniaceae densities were 0.976 ± 0.135 × 106 cm−2 for Acropora spp. (n=15) and 0.507 ± 0.160 × 106 cm−2 for “Other” fragments (n=10) on 30 January. On 12 February, Acropora spp. densities had declined by 48 % to 0.504 ± 0.0849 × 106 cm−2 (n=15) and by 18 % for “Other” fragments to 0.414 ± 0.094 × 106 cm−2 (n=15) (Fig. 3).
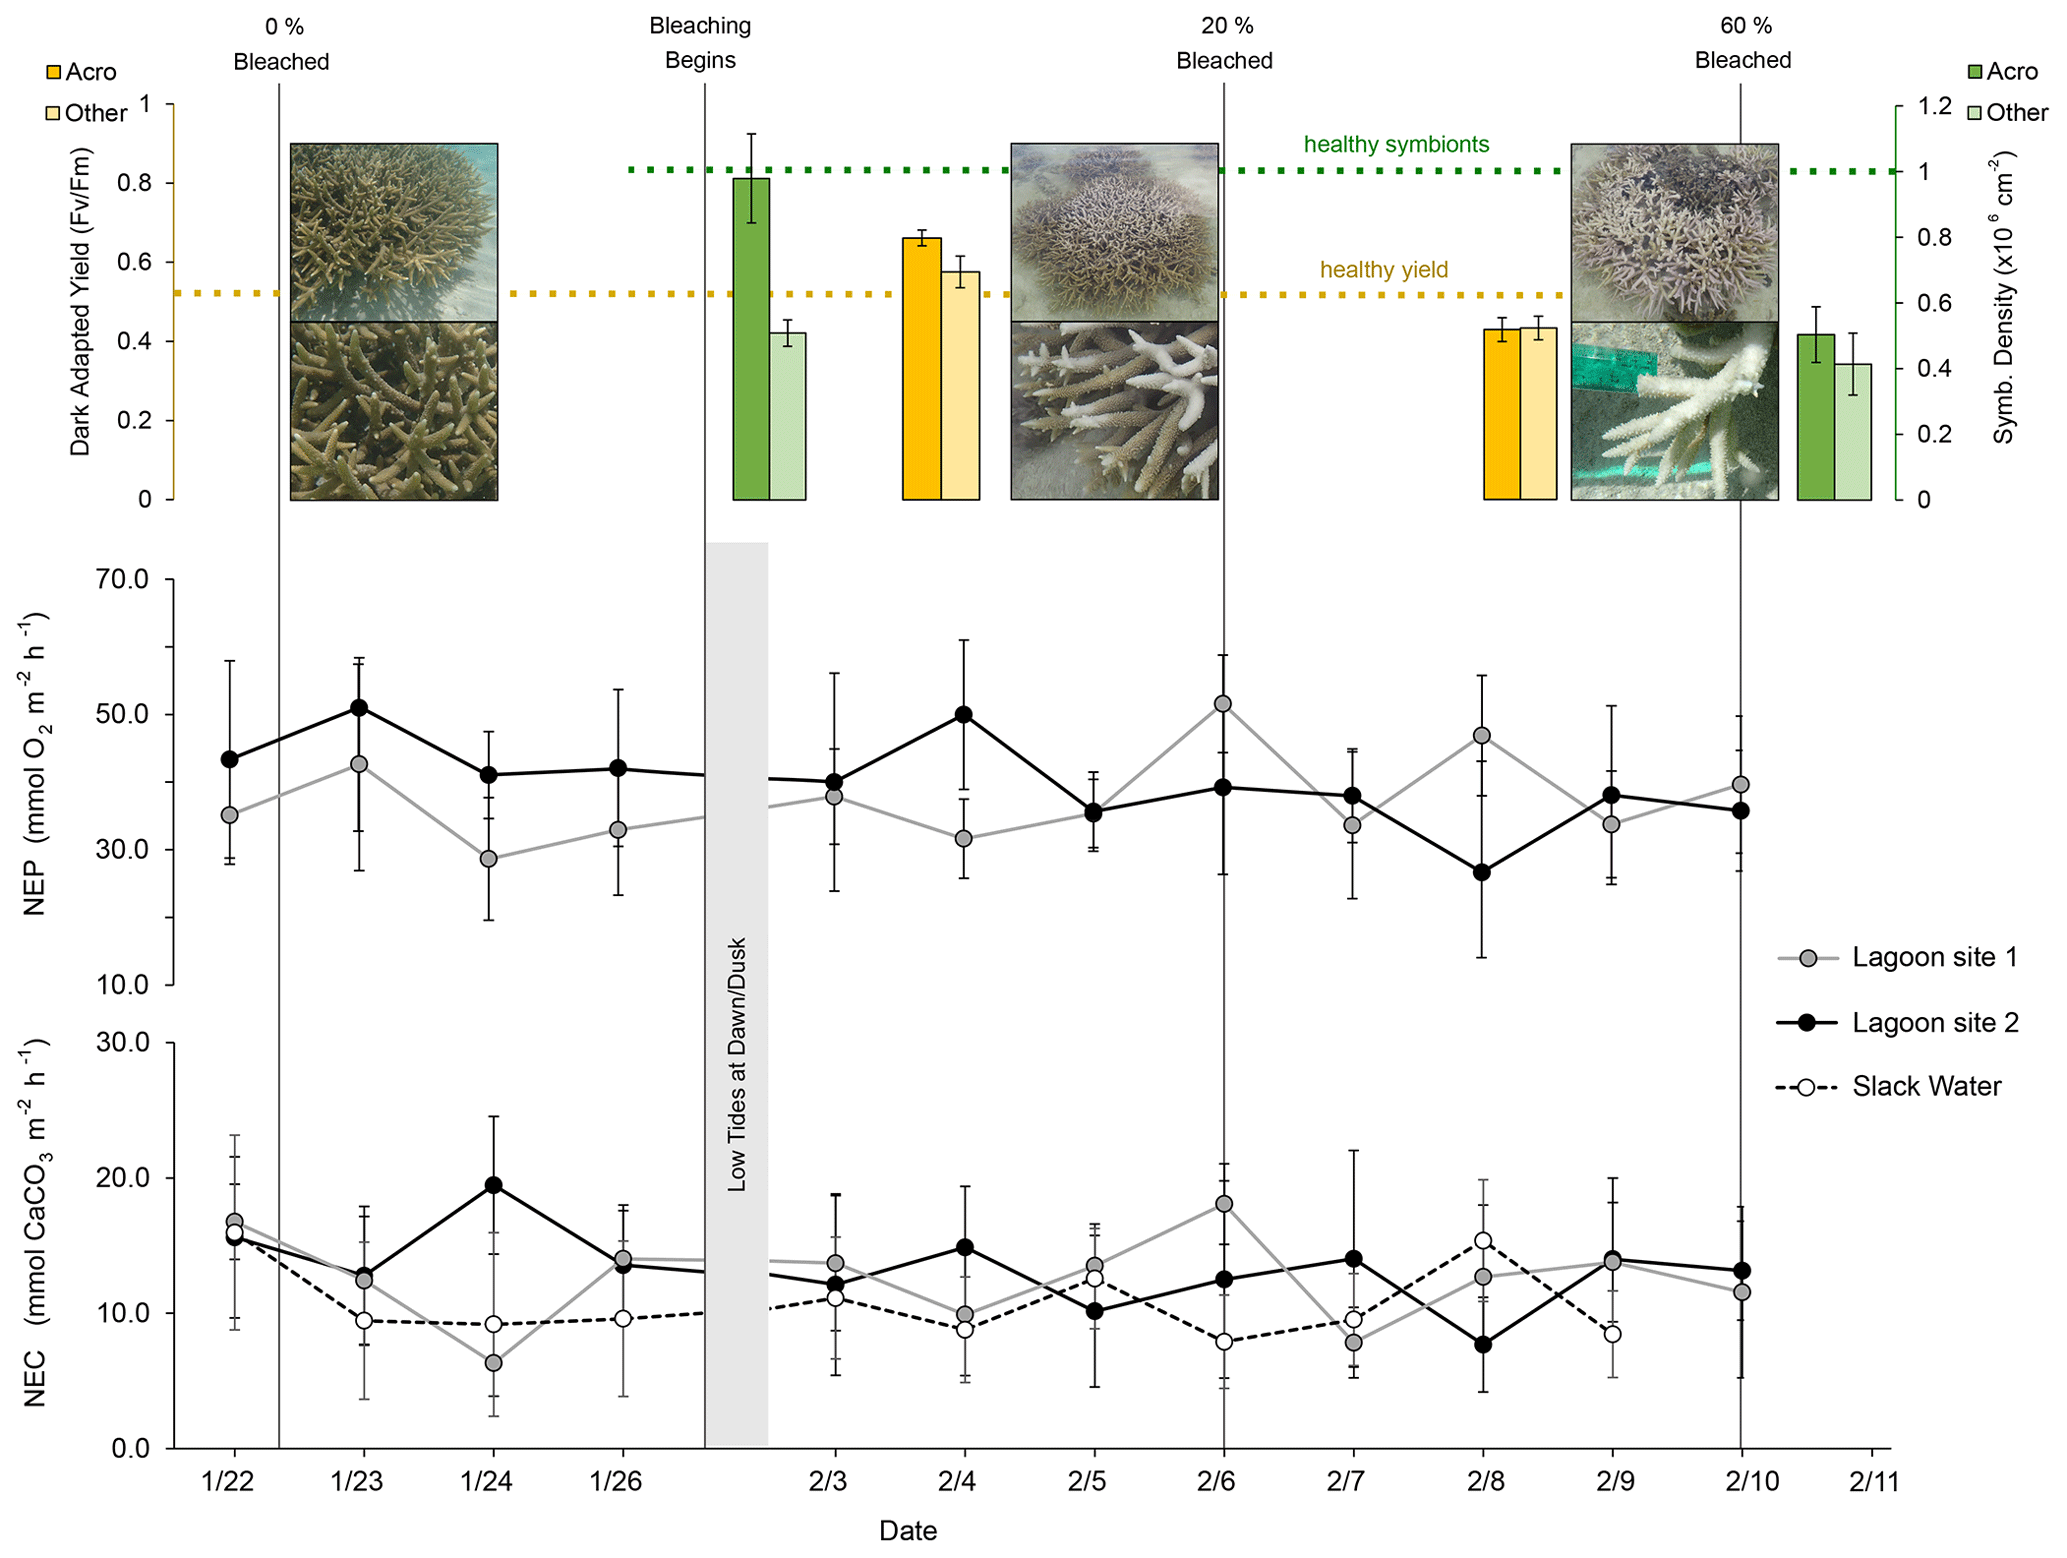
Figure 3Dark-adapted yield (yellow; top left), Symbiodiniaceae densities (green; top right), rates of net ecosystem production (NEP; middle), and net ecosystem calcification (NEC; bottom) at lagoon site 1 (gray), lagoon site 2 (black), and the larger reef area (dashed; slack water). Dashed yellow and green lines indicate expected healthy values for dark-adapted yield and Symbiodiniaceae densities, respectively. Vertical gray lines indicate the date of photo-quadrat surveys and the resulting percent area of coral that was bleached. NEP and NEC estimates were paused between 26 January and 3 February due to low tides occurring at dawn and dusk in low light conditions, preventing estimates of NEC. Slack-water estimates are excluded from the NEP data given the large error associated with air–sea gas exchange corrections.
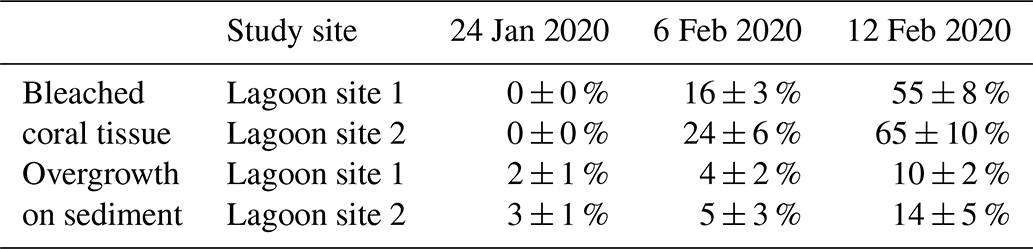
Altogether, the percentage of coral tissue exhibiting bleaching increased from 0 % to 60 ± 11 % over the course of the three photo-quadrat survey efforts (Table 3; Fig. S1). Reef sediment was found to exhibit increased growth of green and red microbial biofilms, which grew in cover from 2 ± 1 % to 12 ± 4 %. Coral bleaching observed during the study period was confirmed by PAM fluorometry (dark-adapted yield; ) and Symbiodiniaceae densities (cells × 106 cm−2) measured during observed bleaching (Table S6).
Table 3Change in the relative percent area (mean ± SD) of coral tissue exhibiting paling or bleaching (bleached coral tissue) and relative percent area (mean ± SD) of sediment exhibiting overgrowth in the form of visible cyanobacteria mats or Chlorophyta growth (overgrowth on sediment) over the course of three different survey efforts. Data for each date are pooled across parallel transects within each lagoon site (n=120 per site).
3.4 Lagoon community metabolism
The mean ± SD value of NEP and NEC at lagoon site 1 and lagoon site 2 (pooled together across triplicate transects and measurement days; n=36) is displayed in Table 4 and Fig. 3 and separated by the pre-bleaching (22 January to 1 February 2020) and bleaching periods (2 to 10 February 2020). Mean daytime net ecosystem production (NEP), averaged across all days and sites, was 39.4 ± 12.2 mmol O2 m−2 h−1. NEP did not significantly differ across triplicate transects within lagoon site 1 (p=0.471) or lagoon site 2 (p=0.917), so these data were pooled together to represent the overall community NEP of each site (Fig. 3). The measured NEP throughout the study period was highly variable and did not significantly differ over time (n=12) at either lagoon site 1 (p=0.181) (lowest coral cover site) or lagoon site 2 (p=0.099) (highest coral cover site). NEP did not significantly differ between lagoon site 1 and lagoon site 2 (p=0.067). NEP values were not included for the slack-water approach given the large source of error in air–sea oxygen exchange.
Table 4Mean ± SD values for daytime net ecosystem production (NEP; mmol O2 m−2 h−1) and net ecosystem calcification (NEC; mmol CaCO3 m−2 h−1) for lagoon site 1 and lagoon site 2, where the Eulerian approach was used (n=12). NEC for the slack-water approach included for daytime (n=11) and nighttime (n=3) estimates. Data are separated by the pre-bleaching period (22 January–1 February 2020) and bleaching period (2–10 February 2020; n=8). Nighttime rates for NEC are included. NEP values are not included for the slack-water approach given the large source of error in air–sea oxygen exchange.

Mean daytime NEC, averaged across all days and sites, was 12.2 ± 4.5 mmol CaCO3 m−2 h−1. Measured rates of daytime NEC did not significantly differ across triplicate transects within lagoon site 1 (p=0.471), lagoon site 2 (p=0.917) or the slack water (p=0.581), so these data were pooled together to represent the overall NEC of each area (Table 4). Measured NEC was also highly variable and did not significantly differ over time at lagoon site 1 (p=0.506), lagoon site 2 (p=0.365), and the slack water (p=0.073). Estimated NEC in the slack-water approach was significantly lower compared to Eulerian estimates at lagoon site 1 (p=0.010) and lagoon site 2 (p=0.001); these two latter sites did not significantly differ (p=0.666). Changes in NEC were significantly related to changes in NEP at both lagoon site 1 (r2=0.32; p=0.042) and lagoon site 2 (r2=0.28; p=0.046). Slope values for daytime NEC vs. NEP for lagoon sites 1 and 2 were 0.28 and 0.24, respectively (Fig. S2).
To determine potential effects of bleaching on nighttime dissolution and respiration, nighttime estimates of NEC and NEP were conducted three times throughout the study near the dates of observed progressed bleaching (23 January, 4 and 12 February). However, AT and DO changes were too small during lagoon site 1 and lagoon site 2 Eulerian estimates, so nighttime NEC could only be confidently calculated from slack-water estimates. We found mean slack-water nighttime NEC (−3.1 ± 1.1 mmol CaCO3 m−2 h−1) did not significantly differ across transects (p=0.617) or over time (p=0.083) within the current study.
4.1 Community metabolism response to bleaching
The southwestern lagoon area of Heron Island (southern Great Barrier Reef) is a community characterized by low coral cover of approximately 5 %–8 %. Within this reef area, the predominant benthic cover was unpalatable algae (approximately 21 %), dominated by the two genera Laurencia spp. and Lobophora spp., consistent with that of a degraded coral habitat (Hughes et al., 1999). Prior surveys of the benthic cover in this area of the Heron Island lagoon (scientific zone) have also estimated relatively low coral cover (0 %–10 %; Roelfsema et al., 2018).
Accumulation of heat stress in the lagoon over the study period resulted in 3.59 DHWs as in situ mean temperature was elevated from ∼ 28.0 to ∼ 29.1 ∘C (+1.1 ∘C). Over this period, we found that approximately 60 % of corals present within both lagoon sites 1 and 2 exhibited bleaching. These bleaching observations were corroborated by both photosynthetic yields and Symbiodiniaceae densities of all corals sampled. Photosynthetic yields recorded on 4 February 2020 in both the Acropora spp. and “Other” category were barely above values considered “healthy” (0.5; Gierz et al., 2020) and, by 9 February 2020, exhibited symbiont loss with values below 0.5 (Acro = 0.43 ± 0.01; other = Acro = 0.43 ± 0.01). Mean Symbiodiniaceae densities across both time points for the Acropora spp. (0.74 ± 0.11 × 106 cm−2) and “Other” corals (0.46 ± 0.13 × 106 cm−2) were also below normally healthy values previously recorded in both Acropora spp. (1–2 × 106 cm−2, Gierz et al., 2020) and corals in the “Other” category (e.g., Montipora digitata; 2–3 × 106 cm−2; Klueter et al., 2006) collected from the Heron Island reef flat.
Despite the ongoing reef-wide bleaching event and measured decline in coral endosymbiont densities, we find that NEP and NEC at both lagoon sites did not significantly differ from estimates during the pre-bleaching period or prior estimates on other Great Barrier Reef lagoon communities of similar coral cover (e.g., 10–20 mmol CaCO3 m−2 h−1; Albright et al., 2015; Pisapia et al., 2019; Stoltenberg et al., 2021). The lack of a bleaching effect was also mirrored in the slack-water NEP and NEC data, which represented a much larger cross section of the lagoon community (∼ 2–3 km transects), where bleaching was also observed (but not quantified during this study period). Importantly, these trends differ from those observed by Courtney et al. (2018) during a 2015 bleaching event in Kaneohe Bay, Hawaii (∼ 10 % total cover), where a similar ∼ 1 ∘C increase in mean reef temperature resulted in bleaching of 46 % of the coral community, and both NEP and NEC were driven to zero. However, our results support those of Kayanne et al. (2005), in which NEC and NEP remained relatively constant during a bleaching event (29 ∘C; 51 % bleached) in September of 1998 at Shiraho Reef in Japan (5 %–7 % total coral cover). The critical difference between these studies is likely due to a threshold in total coral cover, in which bleaching is less impactful on NEC when coral is not the dominant calcifying organism relative to the other calcifying constituents (sediments, rubble, calcifying algae, and other sessile or mobile gastropods and echinoderms) that are also known to contribute to the total reef carbonate budget and, in some cases, exhibit positive temperature–calcification relationships (Cornwall et al., 2019).
4.2 Estimated organism contribution to NEC at elevated temperatures
Importantly, if we consider that rubble observed in lagoon sites 1 and 2 (approximate cover of 4 %) was predominately covered in crustose coralline algae (CCA) and combine these with the other sessile calcifiers observed (which were predominantly Halimeda spp.; 3 % cover), then hermatypic corals were not the dominant reef calcifier. Further, if 60 % of the total coral cover was calcifying roughly 60 % slower due to bleaching (D'Olivo and McCulloch, 2017), this would imply that active calcifying coral cover was likely reduced to only 2 %–4 %. This adjusted “calcifying percent coral cover” is minor compared to the sum of all other benthic constituents that were actively calcifying regardless of the sea surface temperature (SST) conditions (Sediment + CCA + Halimeda = 72 %).
One possible explanation for the lack of any observed changes in NEC could be due to the simultaneous thermal enhancement of calcification in other benthic members when the reef seawater was warmed from 28.0 to 29.1 ∘C. To investigate the relative contribution to overall NEC from the assemblage of benthic calcifiers at these respective temperatures, we created an equation based on reported rates in the literature at 28.0 and 29.1 ∘C (Eq. 1) at which the summed community-level calcification rate (NEC) at the respective temperature (T) is equal to the sum of the described calcification rates for each benthic organism category (net organism calcification: NOC) multiplied by the recorded cover (Cover) across lagoon sites 1 and 2 at that temperature (T).
To estimate the potential effect of a +1.1 ∘C change in seawater temperature on coral calcification for corals observed within the lagoon study sites, the following aquaria manipulation studies were reviewed: Edmunds (2005), Anthony et al. (2008), Cantin et al. (2010), and Comeau et al. (2013, 2016); the following meta-analysis and modeling studies were reviewed: Lough and Barnes (2000), McNeil et al. (2004), Evenhuis et al. (2015), Kornder et al. (2018), and Bove et al. (2020). Together, these studies suggest that mean calcification rates across coral genera most common to the Heron reef flat (Acropora spp., Montipora spp., Porites spp., Pocillopora spp.) at 28.0 ∘C (4.53 ± 2.31 mmol CaCO3 m−2 h−1) increase by approximately 22 % when warmed to a temperature of 29.1 ∘C. It is important to note this percentage increase is highly variable and species specific, so numbers used here are simply for the purpose of discussion. In comparison, calcification by crustose coralline algae (CCA), which is the next most studied organism (see meta-analysis by Cornwall et al., 2019), has not exhibited changes until temperatures are as high as 5 ∘C above ambient temperatures. Therefore, no change was estimated for mean reported rates (0.36 ± 0.09 mmol CaCO3 m−2 h−1) for commonly studied CCA species (Lithophyllum kotschyanum and Hydrolithon onkodes).
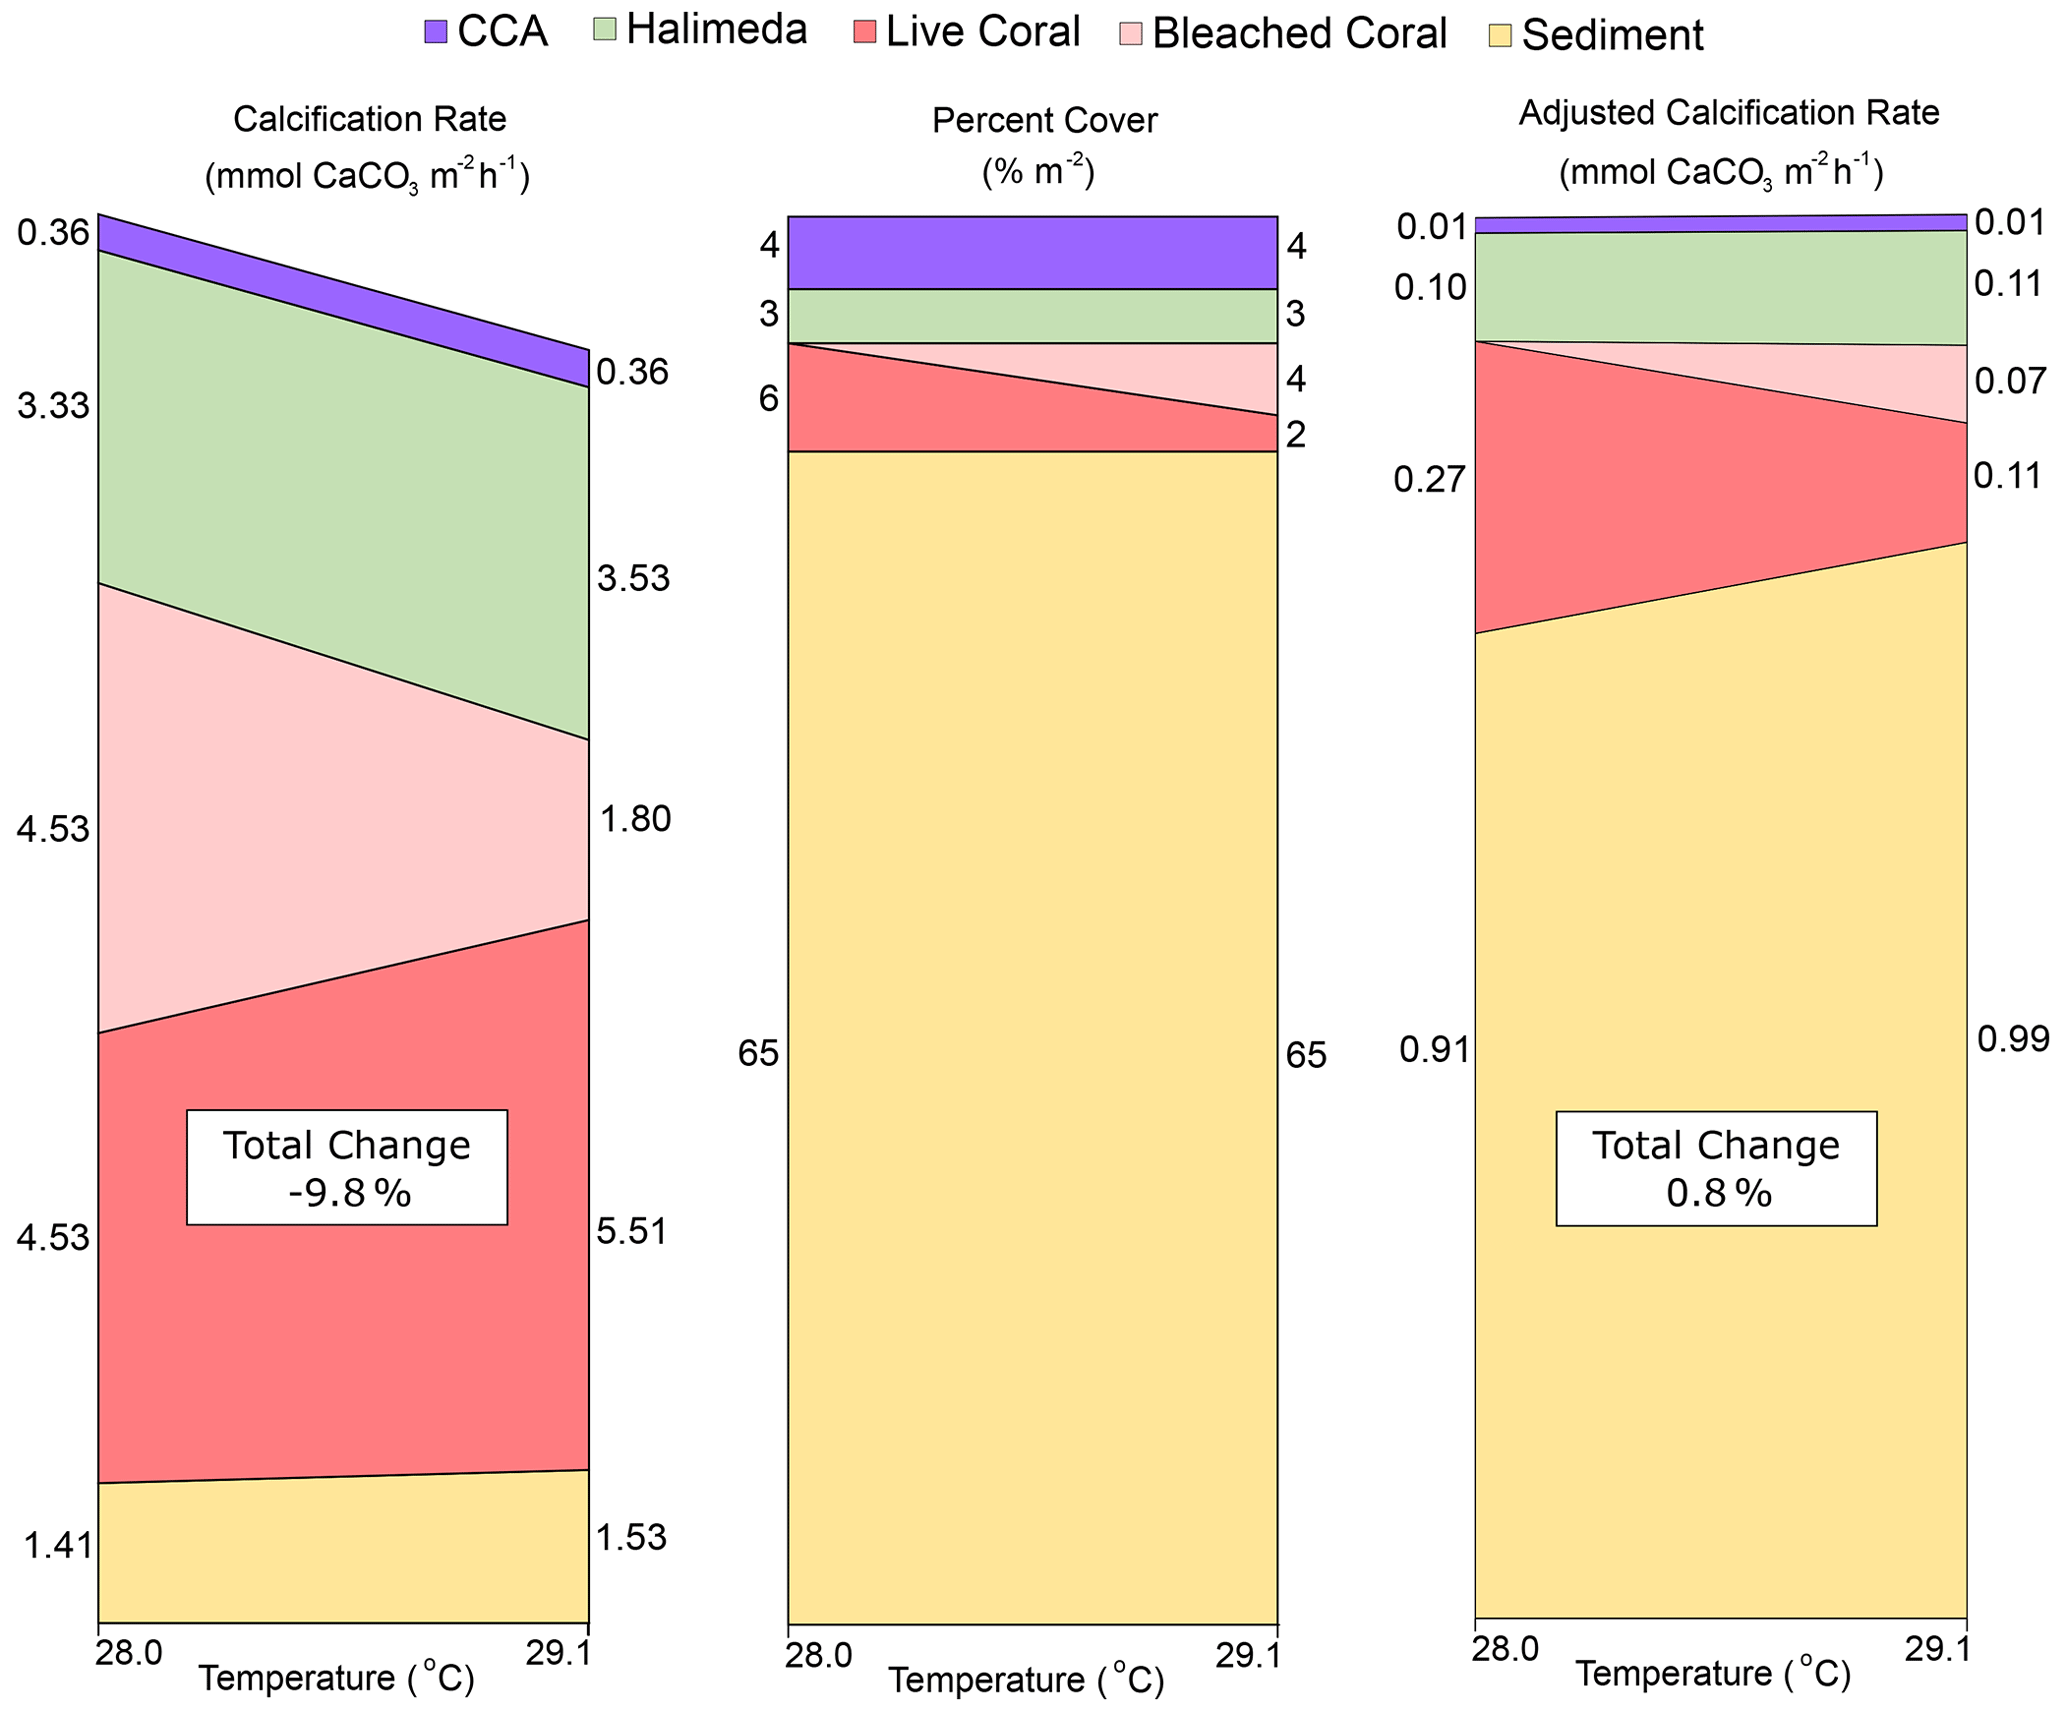
Figure 4Visualization of the changes caused by a transition from pre-bleaching (28.0 ∘C) to bleaching (29.1 ∘C) temperatures in (a) estimated individual organism calcification rates from the literature (converted to mmol CaCO3 m−2 h−1), (b) percent cover across lagoon site 1 and lagoon site 2 combined, and (c) the “adjusted calcification rate” (mmol CaCO3 m−2 h−1) calculated by multiplying (a) by (b) at each temperature. Total change (%) represents the percent difference in the sum of all rates at 29.1 ∘C relative to 28 ∘C. Rubble and other calcifier categories were assumed to be CCA and Halimeda spp., respectively.
Responses in calcification to warming for Halimeda algae are equivocal (Campbell et al., 2016; Wei et al., 2020). If constrained to species commonly identified on the Great Barrier Reef (such as H. opuntia and H. cylindracea; Anon, 2020), then it can be expected that increasing temperatures will increase rates of calcification up to temperatures of 30 ∘C; above that they bleach and exhibit a negative calcification response. As such, narrowed within the ranges observed during this study, calcification rates of Halimeda (3.33 ± 2.29 mmol CaCO3 m−2 h−1) are estimated to increase by approximately 7.9 % in response to warming from 28.0 to 29.1 ∘C. Calcification responses to warming in carbonate sediments are overall the least studied of the benthic categories in this study but potentially the most significant given the dominant cover of sediment. A study within the Heron Island lagoon indicates that daytime sediment calcification at 28 ∘C (1.41 ± 0.29 mmol CaCO3 m−2 h−1) would increase ∼ 9 % when seawater is warmed to 29.1 ∘C (Lantz et al., 2017).
When these trends are summed together with the expected 60 % decline in calcification for the proportion of coral that was bleached, a collective 9.8 % decline in NEC can be expected (Fig. 4). However, when each category is adjusted for the percent cover observed at the end of the study at 29.1 ∘C across both lagoon sites, the total change in NEC increases by ∼ 0.8 %. This is largely owed to positive trends in the calcification of other benthic community members and provides an explanation why no significant differences were observed in NEC during reef-wide coral bleaching. These estimates illustrate how the decline in coral calcification may be overshadowed by thermal acceleration in calcification in ahermatypic benthic calcifiers. Although some of these calcifiers still accrete limestone structure (e.g., coralline algae), none replace the complex, three-dimensional structure uniquely created by corals. Our findings highlight the need to better adjust how NEC is applied as a metric for community function during bleaching events as these data suggest warming may create a divergence between estimated daytime NEC and actual reef growth on future degraded reef ecosystems.
4.3 Future considerations
Our study highlights three considerations that may affect NEC and need to be further investigated to resolve monitoring issues for degraded coral reef communities. First is the impact of nighttime dissolution on overall 24 h NEC. Estimates of NEC at night (n=3) in the current study did not exhibit a response to bleaching, but a higher frequency is needed. Courtney et al. (2018) hypothesized that the dissolution signal was a major driver of the net 24 h zero NEC signal during bleaching. These findings were more recently corroborated at the organism level by Orte et al. (2021), in which algal turfs on dead coral calcified at the same rate as coral during the day but transitioned to net dissolving at night. This is supported by calcification responses to warming in the sediment, the most dominant benthic member in this study, where warming-driven daytime increases in NEC were largely overshadowed by nighttime increases in dissolution (Lantz et al., 2017), and the sediments transitioned to net dissolving over the full 24 h. These results suggest that future studies need to include nighttime measurements of NEC and NOC but also highlight the limitation of flow-metabolism approaches as a representation of reef health given that not all reefs are easily accessible at night for such measurements.
Secondly the longer-term changes in NEC (when bleached coral eventually dies or the thermal benefits to other calcifiers expire) need to be investigated if we are to accurately estimate community function in future reef scenarios. In the current study we did not monitor the response in NEC following the 2020 bleaching event when a return to 28 ∘C or lower would likely reduce the thermal benefits to daytime calcification in the sediment, rubble, live coral, and Halimeda algae that potentially masked the minimized contribution from bleached coral. Under these assumptions, a 7.6 % decline in NEC would be expected when temperatures return to 28 ∘C. Additionally, if we assume the bleached coral eventually dies, and a 60 % reduction to calcification increases to a 100 % reduction, then community NEC would in theory exhibit a 13.1 % total decline. These post-bleaching estimates may explain the differences between this study and post-bleaching NEC estimates reported on similarly degraded reef transects at Lizard Island, Australia (3 % coral cover), by McMahon et al., 2019. At Lizard Island, post-bleaching NEC in 2016 declined by 40 %–46 % relative to pre-bleaching estimates in 2008 when coral cover was higher (∼ 8 % coral).
Finally, the indirect feedbacks on NOC from non-calcifying community members (e.g., algae) and the carbonate substrate they occupy also need to be considered to predict future reef growth (Orte et al., 2021). The sum of adjusted NOC (Fig. 4; 1.30 mmol CaCO3 m−2 h−1) only explains 10.6 % of the measured NEC (12.3 mmol CaCO3 m−2 h−1). Such discrepancies may be explained by the exclusion of the 21 % of space occupied by non-calcifying algae in the NOC summation exercise in Fig. 4. It is possible algae can provide positive feedback mechanisms to coral calcification through adjacent algal-driven NEP (and subsequent modifications to the surrounding seawater carbonate chemistry; Gattuso et al., 1998; Unsworth et al., 2012) or the endolithic micro-calcifiers living inside the dead carbonate substrate colonized by algal communities (Orte et al., 2021). For example, endolithic microflora (Cyanophyta and Chlorophyta) living within carbonate rocks have been found to modify interstitial pH just beneath the substrate surface to values as high as 8.5 (Reyes-Nivia et al., 2013), thereby creating localized zones supersaturated with aqueous Ca2+ and CO ions (Krause et al., 2019) and promoting the inorganic precipitation of minerals such as brucite, micrite, and dolomite. Critically, these microfloral communities are more diverse and abundant when living beneath turf algae compared to corals (Gutiérrez-Isaza et al., 2015), are comparable in their productivity to overlying turf algae (Tribollet et al., 2006), and have been found to precipitate dolomite at an accelerated rate when seawater temperatures were increased from 28 to 30 ∘C (Diaz-Pulido et al., 2014). Taken together, this shows that these microfloral communities have the capacity to influence bulk seawater chemistry measurements particularly during coral bleaching events, when warm and well-lit conditions promote their growth. In addition to these microflora, various cryptic infaunal and endolithic macrofauna calcify to produce protective shells or burrows (e.g., Díaz-Castañeda et al., 2019) and may also be contributing to the NEC signal measured during the bleaching event.
Ocean warming and subsequent coral bleaching events have already degraded coral reef ecosystems for over four decades and will continue to degrade coral reefs worldwide, reducing their capacity to provide a complex, three-dimensional habitat structure. While estimates of NEC via the alkalinity anomaly technique may be an appropriate benchmark of community function well after bleaching events have occurred and degradation to the coral community is fully realized, the results from this study highlight the shortcomings of using this approach to estimate daytime NEC when monitoring the effect of bleaching on reef accretion in real time. These results, in conjunction with available literature on the importance of nighttime dissolution, suggest that flow-metabolism approaches to estimate community health may be limited to reefs accessible at night (e.g., those near a research station or without navigational hazards). Moreover, our study highlights that if coral cover continues to decline as predicted, NEC may no longer be an appropriate proxy for reef accretion as the proportion of the NEC signal owed to ahermatypic calcification increases. Additional estimates of NEC during bleaching events are urgently needed to further explore the potential decoupling of positive NEC and reef growth. Concerningly, the data herein suggest that NEC may begin to exhibit limitations as a monitoring tool for reef growth when coral becomes the minority benthic constituent.
Data are presently being submitted to the Figshare data repository under the DOI https://doi.org/10.6084/m9.figshare.18733019 (Lantz et al., 2022).
The supplement related to this article is available online at: https://doi.org/10.5194/bg-19-891-2022-supplement.
CAL is responsible for study design, data collection, analysis, and writing. WL and TDS are responsible for study design, data analysis, and writing. JLB, AF, CP, and TM are responsible for data collection, analysis, and writing.
The contact author has declared that they or their co-authors have competing interests as specified in the information for the associate editor (cover letter).
Publisher's note: Copernicus Publications remains neutral with regard to jurisdictional claims in published maps and institutional affiliations.
This work was funded by the Australian Research Council DP 180103199. We thank the Heron Island Research Station scientific staff for their support during research. We also thank all iNaturalist users that helped identify the invertebrates photographed during this study, especially Joe Rowlett, Sean Ono, Frédéric Ducarme, and Pierre Mascar.
This research has been supported by the Australian Research Council (grant no. DP 180103199).
This paper was edited by Jean-Pierre Gattuso and reviewed by three anonymous referees.
Anon: Halimeda composition and biomass along the Great Barrier Reef, AIMS metadata, aims.gov.au, available at: https://apps.aims.gov.au/metadata/view/7f7e70a0-c3db-472c-90d4-1ae243d8180b (last access: 1 September 2020), 2020.
Anthony, K. R. N., Kline, D. I., Diaz-Pulido, G., Dove, S., and Hoegh-Guldberg, O.: Ocean acidification causes bleaching and productivity loss in coral reef builders, P. Natl. Acad. Sci. USA, 105, 17442–17446, https://doi.org/10.1073/pnas.0804478105, 2008.
Albright, R., Benthuysen, J., Cantin, N., Caldeira, K., and Anthony, K.: Coral reef metabolism and carbon chemistry dynamics of a coral reef flat, Geophys. Res. Lett., 42, 3980–3988, https://doi.org/10.1002/2015GL063488, 2015.
Bahr, K. D., Jokiel, P. L., and Rodgers, K. S.: Influence of solar irradiance on underwater temperature recorded by temperature loggers on coral reefs, Limnol. Oceanogr.-Meth., 14, 338–342, https://doi.org/10.1002/lom3.10093, 2016.
Baird, A. H. and Marshall, P. A.: Mortality, growth and reproduction in scleractinian corals following bleaching on the Great Barrier Reef, Mar. Ecol. Prog. Ser., 237, 133–141, https://doi.org/10.3354/meps237133, 2002.
Bove, C. B., Umbanhowar, J., and Castillo, K. D.: Meta-Analysis Reveals Reduced Coral Calcification Under Projected Ocean Warming but Not Under Acidification Across the Caribbean Sea, Front. Mar. Sci., 7, p. 127, https://doi.org/10.3389/fmars.2020.00127, 2020.
Brown, B. E. and Suharsono: Damage and recovery of coral reefs affected by El Niño related seawater warming in the Thousand Islands, Indonesia, Coral Reefs, 8, 163–170, https://doi.org/10.1007/BF00265007, 1990.
Brown, J. H., Gillooly, J. F., Allen, A. P., Savage, V. M., and West, G. B.: Toward a metabolic theory of ecology, John Wiley & Sons, Ltd., Ecology, 85, 1771–1789, 2004.
Bruno, J. F. and Selig, E. R.: Regional decline of coral cover in the Indo-Pacific: Timing, extent, and subregional comparisons, edited by: Freckleton, R., PLoS One, 2, e711, https://doi.org/10.1371/journal.pone.0000711, 2007.
Campbell, J. E., Fisch, J., Langdon, C., and Paul, V. J.: Increased temperature mitigates the effects of ocean acidification in calcified green algae (Halimeda spp.), Coral Reefs, 35, 357–368, https://doi.org/10.1007/s00338-015-1377-9, 2016.
Cantin, N. E., Cohen, A. L., Karnauskas, K. B., Tarrant, A. M., and McCorkle, D. C.: Ocean warming slows coral growth in the central Red Sea, Science, 329, 322–325, https://doi.org/10.1126/science.1190182, 2010.
Castillo, K. D., Ries, J. B., Bruno, J. F., and Westfield, I. T.: The reef-building coral siderastrea siderea exhibits parabolic responses to ocean acidification and warming, Proc. R. Soc. B, 281, 1–9, https://doi.org/10.1098/rspb.2014.1856, 2014.
Comeau, S., Edmunds, P. J., Spindel, N. B., and Carpenter, R. C.: The responses of eight coral reef calcifiers to increasing partial pressure of CO2 do not exhibit a tipping point, Limnol. Oceanogr., 58, 388–398, https://doi.org/10.4319/lo.2013.58.1.0388, 2013.
Comeau, S., Carpenter, R. C., Lantz, C. A., and Edmunds, P. J.: Parameterization of the response of calcification to temperature and pCO2 in the coral Acropora pulchra and the alga Lithophyllum kotschyanum, Coral Reefs, 35, 929–939, https://doi.org/10.1007/s00338-016-1425-0, 2016.
Cornwall, C. E., Diaz-Pulido, G., and Comeau, S.: Impacts of ocean warming on coralline algae: Knowledge gaps and key recommendations for future research, Front. Mar. Sci., 6, p. 186, https://doi.org/10.3389/fmars.2019.00186, 2019.
Courtney, T. A., De Carlo, E. H., Page, H. N., Bahr, K. D., Barro, A., Howins, N., Tabata, R., Terlouw, G., Rodgers, K. S., and Andersson, A. J.: Recovery of reef-scale calcification following a bleaching event in Kāne'ohe Bay, Hawai`i, Limnol. Oceanogr. Lett., 3, 1–9, https://doi.org/10.1002/lol2.10056, 2018.
DeCarlo, T. M., Cohen, A. L., Wong, G. T. F., Shiah, F. K., Lentz, S. J., Davis, K. A., Shamberger, K. E. F., and Lohmann, P.: Community production modulates coral reef pH and the sensitivity of ecosystem calcification to ocean acidification, J. Geophys. Res.-Ocean., 122, 745–761, https://doi.org/10.1002/2016JC012326, 2017.
Díaz-Castañeda, V., Erin Cox, T., Gazeau, F., Fitzer, S., Delille, J., Alliouane, S., and Gattuso, J. P.: Ocean acidification affects calcareous tube growth in adults and reared offspring of serpulid polychaetes, J. Exp. Biol., 222, 13, https://doi.org/10.1242/jeb.196543, 2019.
Diaz-Pulido, G., McCook, L. J., Dove, S., Berkelmans, R., Roff, G., Kline, D. I., Weeks, S., Evans, R. D., Williamson, D. H., and Hoegh-Guldberg, O.: Doom and Boom on a Resilient Reef: Climate Change, Algal Overgrowth and Coral Recovery, edited by: Sandin, S. A., PLoS One, 4, e5239, https://doi.org/10.1371/journal.pone.0005239, 2009.
Diaz-Pulido, G., Nash, M. C., Anthony, K. R. N., Bender, D., Opdyke, B. N., Reyes-Nivia, C., and Troitzsch, U.: Greenhouse conditions induce mineralogical changes and dolomite accumulation in coralline algae on tropical reefs, Nat. Commun., 5, 1–9, https://doi.org/10.1038/ncomms4310, 2014.
Dickson, A. G., Sabine, C. L., and Christian, J. R.: Guide to best practices for ocean CO2 measurements, North Pacific Marine Science Organization, 2007.
D’Olivo, J. P. and McCulloch, M. T.: Response of coral calcification and calcifying fluid composition to thermally induced bleaching stress, Sci. Rep., 7, 1–15, https://doi.org/10.1038/s41598-017-02306-x, 2017.
Dove, S. G., Kline, D. I., Pantos, O., Angly, F. E., Tyson, G. W., and Hoegh-Guldberg, O.: Future reef decalcification under a business-as-usual CO2 emission scenario, P. Natl. Acad. Sci. USA, 110, 15342–15347, https://doi.org/10.1073/pnas.1302701110, 2013.
Edinger, E. N., Limmon, G. V., Jompa, J., Widjatmoko, W., Heikoop, J. M., and Risk, M. J.: Normal coral growth rates on dying reefs: Are coral growth rates good indicators of reef health?, Mar. Pollut. Bull., 40, 404–425, https://doi.org/10.1016/S0025-326X(99)00237-4, 2000.
Edmunds, P. J.: The effect of sub-lethal increases in temperature on the growth and population trajectories of three scleractinian corals on the southern Great Barrier Reef, Oecologia, 146, 350–364, https://doi.org/10.1007/s00442-005-0210-5, 2005.
Evenhuis, C., Lenton, A., Cantin, N. E., and Lough, J. M.: Modelling coral calcification accounting for the impacts of coral bleaching and ocean acidification, Biogeosciences, 12, 2607–2630, https://doi.org/10.5194/bg-12-2607-2015, 2015.
Eyre, B. D., Cyronak, T., Drupp, P., De Carlo, E. H., Sachs, J. P., and Andersson, A. J.: Coral reefs will transition to net dissolving before end of century, Science, 359, 908–911, https://doi.org/10.1126/science.aao1118, 2018.
Gattuso, J. P., Frankignoulle, M., Bourge, I., Romaine, S., and Buddemeier, R. W.: Effect of calcium carbonate saturation of seawater on coral calcification, Glob. Planet. Change, 18, 37–46, https://doi.org/10.1016/S0921-8181(98)00035-6, 1998.
Gierz, S., Ainsworth, T. D., and Leggat, W.: Diverse symbiont bleaching responses are evident from 2-degree heating week bleaching conditions as thermal stress intensifies in coral, Mar. Freshw. Res., 71, 1149, https://doi.org/10.1071/MF19220, 2020.
Grigg, R. W. and Dollar, S. J.: Natural and anthropogenic disturbance on coral reefs, Coral Reefs, 25, 439–452, 1990.
Gutiérrez-Isaza, N., Espinoza-Avalos, J., León-Tejera, H. P., and González-Solís, D.: Endolithic community composition of Orbicella faveolata (Scleractinia) underneath the interface between coral tissue and turf algae, Coral Reefs, 34, 625–630, https://doi.org/10.1007/s00338-015-1276-0, 2015.
Harney, J. N. and Fletcher, C. H.: A Budget of Carbonate Framework and Sediment Production, Kailua Bay, Oahu, Hawai'i, J. Sediment. Res., 73, 856–868, https://doi.org/10.1306/051503730856, 2007.
Heron, S. F., Maynard, J. A., Van Hooidonk, R., and Eakin, C. M.: Warming Trends and Bleaching Stress of the World's Coral Reefs 1985–2012, Sci. Rep., 6, 1–14, https://doi.org/10.1038/srep38402, 2016.
Hughes, T., Szmant, A. M., Steneck, R., Carpenter, R., and Miller, S.: Algal blooms on coral reefs: What are the causes?, Limnol. Oceanogr., 44, 1583–1586, https://doi.org/10.4319/lo.1999.44.6.1583, 1999.
Kayanne, H., Hata, H., Kudo, S., Yamano, H., Watanabe, A., Ikeda, Y., Nozaki, K., Kato, K., Negishi, A., and Saito, H.: Seasonal and bleaching-induced changes in coral reef metabolism and CO2 flux, Global Biogeochem. Cy., 19, 1–11, https://doi.org/10.1029/2004GB002400, 2005.
Klueter, A., Loh, W., Hoegh-Guldberg, O., and Dove, S.: Physiological and genetic properties of two fluorescent colour morphs of the coral Montipora digitata, Symbiosis, 42, 123–134, available at: https://www.cabdirect.org/cabdirect/abstract/20073143496 (last access: 23 September 2020), 2006.
Kornder, N. A., Riegl, B. M., and Figueiredo, J.: Thresholds and drivers of coral calcification responses to climate change, Glob. Change Biol., 24, 5084–5095, https://doi.org/10.1111/gcb.14431, 2018.
Krause, S., Liebetrau, V., Nehrke, G., Damm, T., Büsse, S., Leipe, T., Vogts, A., Gorb, S. N., and Eisenhauer, A.: Endolithic Algae Affect Modern Coral Carbonate Morphology and Chemistry, Front. Earth Sci., 7, p. 304, https://doi.org/10.3389/feart.2019.00304, 2019.
Langdon, C., Gattuso, J.-P., Andersson, A., Océanologique, O., and Pierre, U.: Part 3: Measurements of CO2 – sensitive processes Measurements of calcifi cation and dissolution of benthic organisms and communities, in: Guide to best practICES for ocean acidification research and data reporting, Luxembourg, Publications Office of the European Union, 213–232, 2010.
Lantz, C. A., Schulz, K. G., Stoltenberg, L., and Eyre, B. D.: The short-term combined effects of temperature and organic matter enrichment on permeable coral reef carbonate sediment metabolism and dissolution, Biogeosciences, 14, 5377–5391, https://doi.org/10.5194/bg-14-5377-2017, 2017.
Lantz, C., Leggat, W., Bergman, J., Fordyce, A., Page, C., Mesaglio, T., Ainsworth, T.: Will daytime community calcification reflect reef accretion on future, degraded coral reefs?, figshare [data set], https://doi.org/10.6084/m9.figshare.18733019.v1, 2022.
Liu, G., Strong, A. E., Skirving, W. J., and Arzayus, L. F.: Overview of NOAA Coral Reef Watch Program's near-real-time satellite global coral bleaching monitoring activities, NOAA, available at: http://coralreefwatch.noaa.gov/ (last access: 15 April 2020), 2006.
Lough, J. M. and Barnes, D. J.: Environmental controls on growth of the massive coral Porites, J. Exp. Mar. Bio. Ecol., 245, 225–243, https://doi.org/10.1016/S0022-0981(99)00168-9, 2000.
McMahon, A., Santos, I. R., Schulz, K. G., Scott, A., Silverman, J., Davis, K. L., and Maher, D. T.: Coral Reef Calcification and Production After the 2016 Bleaching Event at Lizard Island, Great Barrier Reef, J. Geophys. Res.-Ocean., 124, 4003–4016, https://doi.org/10.1029/2018JC014698, 2019.
McNeil, B. I., Matear, R. J., and Barnes, D. J.: Coral reef calcification and climate change: The effect of ocean warming, Geophys. Res. Lett., 31, 1–4, https://doi.org/10.1029/2004GL021541, 2004.
Orte, M. R. de, Koweek, D. A., Cyronak, T., Takeshita, Y., Griffin, A., Wolfe, K., Szmant, A., Whitehead, R., Albright, R., and Caldeira, K.: Unexpected role of communities colonizing dead coral substrate in the calcification of coral reefs, Limnol. Oceanogr., 66, 1793–1803, https://doi.org/10.1002/LNO.11722, 2021.
Pisapia, C., Hochberg, E. J., and Carpenter, R.: Multi-Decadal Change in Reef-Scale Production and Calcification Associated With Recent Disturbances on a Lizard Island Reef Flat, Front. Mar. Sci., 6, p. 575, https://doi.org/10.3389/fmars.2019.00575, 2019.
Reyes-Nivia, C., Diaz-Pulido, G., Kline, D., Guldberg, O. H., and Dove, S.: Ocean acidification and warming scenarios increase microbioerosion of coral skeletons, Glob. Change Biol., 19, 1919–1929, https://doi.org/10.1111/gcb.12158, 2013.
Ries, J. B., Cohen, A. L., and McCorkle, D. C.: Marine calcifiers exhibit mixed responses to CO2-induced ocean acidification, Geology, 37, 1131–1134, https://doi.org/10.1130/G30210A.1, 2009.
Roelfsema, C., Kovacs, E., Ortiz, J. C., Wolff, N. H., Callaghan, D., Wettle, M., Ronan, M., Hamylton, S. M., Mumby, P. J., and Phinn, S.: Coral reef habitat mapping: A combination of object-based image analysis and ecological modelling, Remote Sens. Environ., 208, 27–41, https://doi.org/10.1016/j.rse.2018.02.005, 2018.
Stimson, J. and Kinzie, R. A.: The temporal pattern and rate of release of zooxanthellae from the reef coral Pocillopora damicornis (Linnaeus) under nitrogen-enrichment and control conditions, J. Exp. Mar. Bio. Ecol., 153, 63–74, https://doi.org/10.1016/S0022-0981(05)80006-1, 1991.
Stoltenberg, L., Schulz, K. G., Lantz, C. A., Cyronak, T., and Eyre, B. D.: Late afternoon seasonal transition to dissolution in a coral reef: An early warning of a net dissolving ecosystem?, Geophys. Res. Lett., 48, e2020GL090811, https://doi.org/10.1029/2020gl090811, 2021.
Sully, S., Burkepile, D. E., Donovan, M. K., Hodgson, G., and van Woesik, R.: A global analysis of coral bleaching over the past two decades, Nat. Commun., 10, 1–5, https://doi.org/10.1038/s41467-019-09238-2, 2019.
Tribollet, A., Langdon, C., Golubic, S., and Atkinson, M.: Endolithic microflora are major primary producers in dead carbonate substrates of Hawaiian coral reefs, J. Phycol., 42, 292–303, https://doi.org/10.1111/j.1529-8817.2006.00198.x, 2006.
Unsworth, R. K. F., Collier, C. J., Henderson, G. M., and McKenzie, L. J.: Tropical seagrass meadows modify seawater carbon chemistry: Implications for coral reefs impacted by ocean acidification, Environ. Res. Lett., 7, 024026, https://doi.org/10.1088/1748-9326/7/2/024026, 2012.
Wanninkhof, R.: Relationship between wind speed and gas exchange over the ocean, J. Geophys. Res., 97, 7373–7382, https://doi.org/10.1029/92JC00188, 1992.
Wanninkhof, R., Asher, W. E., Ho, D. T., Sweeney, C., and McGillis, W. R.: Advances in Quantifying Air-Sea Gas Exchange and Environmental Forcing, Ann. Rev. Mar. Sci., 1, 213–244, https://doi.org/10.1146/annurev.marine.010908.163742, 2009.
Warner, M. E., Fitt, W. K., and Schmidt, G. W.: Damage to photosystem II in symbiotic dinoflagellates: A determinant of coral bleaching, P. Natl. Acad. Sci. USA, 96, 8007–8012, https://doi.org/10.1073/pnas.96.14.8007, 1999.
Wei, Z., Mo, J., Huang, R., Hu, Q., Long, C., Ding, D., Yang, F., and Long, L.: Physiological performance of three calcifying green macroalgae Halimeda species in response to altered seawater temperatures, Acta Oceanol. Sin., 39, 89–100, https://doi.org/10.1007/s13131-019-1471-3, 2020.
Yvon-Durocher, G., Jones, J. I., Trimmer, M., Woodward, G., and Montoya, J. M.: Warming alters the metabolic balance of ecosystems, Philos. T. R. Soc. B, 365, 2117–2126, https://doi.org/10.1098/rstb.2010.0038, 2010.