the Creative Commons Attribution 4.0 License.
the Creative Commons Attribution 4.0 License.
 | 16 Mar 2023
Determination of respiration and photosynthesis fractionation factors for atmospheric dioxygen inferred from a vegetation–soil–atmosphere analogue of the terrestrial biosphere in closed chambers
Clémence Paul
Clément Piel
Joana Sauze
Nicolas Pasquier
Frédéric Prié
Sébastien Devidal
Roxanne Jacob
Arnaud Dapoigny
Olivier Jossoud
Alexandru Milcu
Amaëlle Landais
The isotopic composition of dioxygen in the atmosphere is a global tracer which depends on the biosphere flux of dioxygen toward and from the atmosphere (photosynthesis and respiration) as well as exchanges with the stratosphere. When measured in fossil air trapped in ice cores, the relative concentration of 16O, 17O, and 18O of O2 can be used for several applications such as ice core dating and past global productivity reconstruction. However, there are still uncertainties about the accuracy of these tracers as they depend on the integrated isotopic discrimination of different biological processes of dioxygen production and uptake, for which we currently have very few independent estimates. Here we determined the respiration and photosynthesis fractionation factors for atmospheric dioxygen from experiments carried out in a replicated vegetation–soil–atmosphere analogue of the terrestrial biosphere in closed chambers with growing Festuca arundinacea. The values for 18O discrimination during soil respiration and dark respiration in leaves are equal to ‰ and ‰, respectively. In these closed biological chambers, we also found a value attributed to terrestrial photosynthetic isotopic discrimination equal to ‰. This last estimate suggests that the contribution of terrestrial productivity in the Dole effect may have been underestimated in previous studies.
- Article
(6876 KB) - Full-text XML
-
Supplement
(1247 KB) - BibTeX
- EndNote


The oxygen cycle represents one of the most important biogeochemical cycles on Earth, as oxygen is the second most important gaseous component in the atmosphere. Oxygen is an essential component for life on Earth as it is consumed by all aerobic organisms through respiration and produced by autotrophic organisms through photosynthesis.
The analysis of the oxygen isotopic composition classically expressed as δ18O and δ17O of O2 in air bubbles trapped in ice cores is currently used to provide information on the variations of the low-latitude water cycle and the productivity of the biosphere during the Quaternary (Bender et al., 1994; Luz et al., 1999; Malaizé et al., 1999; Severinghaus et al., 2009; Blunier et al., 2002; Landais et al., 2010). δ18O of O2 is also a very useful proxy for ice core dating through the resemblance of its variations with the variations of precession or summer insolation in the Northern Hemisphere (Shackleton, 2000; Dreyfus et al., 2007). These tracers are however complex, and their interpretation relies on the precise knowledge of the various fractionation factors in the oxygen cycle.
First, interpreting the relationship between δ18O of O2 (or δ18Oatm) variations in ice core air and the low-latitude water cycle (e.g. Severinghaus et al., 2009; Landais et al., 2010; Seltzer et al., 2017) is still debated because of the multiple processes involved. Dole (1936) reported the relative atomic weight of oxygen in the air and water of Lake Michigan and gave as a measure of the δ18O value between both of about 21 ‰. Barkan and Luz (2005) showed that δ18Oatm is enriched compared to the δ18O of water of the global ocean (taken here as the Vienna Standard Mean Ocean Water, VSMOW) with a value of 23.88 ‰. With the more recent values of Pack et al. (2017) of 24.15 ‰ and Wostbrock and Sharp (2021) of 24.05 ‰, we can envisage an enrichment of δ18Oatm with respect to the VSMOW of about ∼ 24 ‰. This Dole effect is the result of several isotopic discriminations caused by biotic processes that enrich the δ18Oatm relative to the oceanic values of water δ18O. First measurements have shown that the photosynthesis itself is not associated with a strong isotopic discrimination and produces oxygen with an isotopic composition which is close to the isotopic composition of the consumed water (Vinogradov et al., 1959; Stevens et al., 1975; Guy et al., 1993; Helman et al., 2005; Luz and Barkan, 2005). This is in contrast to the early results of Dole and Jenks (1944), who proposed a photosynthetic isotopic discrimination for plants and algae of 5 ‰. Vinogradov et al. (1959) challenged the results of Dole and Jenks (1944) by explaining that the 18O enrichment of O2 during their photosynthesis experiments is the result of contamination by atmospheric O2 and respiration. Guy et al. (1993) studied the photosynthetic isotopic discrimination on spinach thylakoids, cyanobacteria (Anacystis nidulans), and diatoms (Phaeodactylum tricornutum) and found on average only a slight isotopic discrimination of 0.3 ‰, which they considered negligible. Luz and Barkan (2005) also corroborate this idea by studying photosynthetic isotopic discrimination on Philodendron and did not obtain a 18O enrichment of the O2 produced. This absence of isotopic discrimination can be theoretically explained by the process of O2 generation within photosynthesis (photosystem II) involving water oxidation by the oxygen evolving complex (Tcherkez and Farquhar, 2007). For the oceanic biosphere, the isotopic composition of O2 produced by photosynthesis is very close to the isotopic composition of the ocean. However, in terrestrial biosphere the δ18O of water split during photosynthesis (leaf water) is highly variable both spatially and temporally because of the decrease of δ18O of meteoric water toward higher latitudes (Dansgaard, 1974) and the enrichment in heavy isotopes in leaf water during evaporation (Dongmann et al., 1974). The mean δ18O enrichment of leaf water isotopic composition has been estimated between +4.5 ‰ and +6 ‰ with respect to the isotopic composition of mean global ocean water (Bender et al., 1994; Hoffmann et al., 2004). On top of this enrichment, the terrestrial and oceanic Dole effects are mostly explained by the respiratory isotopic discrimination of the order of magnitude of +18 ‰ (Bender et al., 1994).
Because of the isotopic enrichment in leaf water, the terrestrial Dole effect has been initially estimated to be 5 ‰ higher than the oceanic Dole effect and δ18Oatm used to estimate changes in the balance between land and marine productivity (Wang et al., 2008; Bender et al., 1994; Hoffmann et al., 2004). However, the evidence by Eisenstadt et al. (2010) of isotopic discrimination up to +6 ‰ for marine phytoplankton photosynthesis rather suggests that the marine and terrestrial Dole effects are of the same order of magnitude. More specifically, Eisenstadt et al. (2010) determined several photosynthetic isotopic discrimination values depending on the phytoplankton studied (Phaeodactylum tricornutum: 4.5 ‰, Nannochloropsis sp.: ‰, Emiliania huxleyi: 5.5 ‰, and Chlamydomonas reinhardtii: 7 ‰). If marine and terrestrial Dole effects are similar, then the past variations of δ18Oatm cannot be attributed to different proportions of terrestrial or marine Dole effects. They would be better related to the low-latitude water cycle influencing the leaf water δ18O consumed by photosynthesis and then the δ18O of O2 produced by this process (with a larger flux in the low-latitude vegetated regions). This is supported by orbital and millennial variations of δ18Oatm in phase with calcite δ18O in Chinese speleothem, a proxy strongly related to the intensity of the hydrological cycle in south-east Asia (Severinghaus et al., 2009; Landais et al., 2010; Extier et al., 2018). The aforementioned studies show that qualitative and quantitative interpretation of δ18Oatm relies strongly on the estimate of O2 fractionation factors in the biological cycle, but data to constrain the fractionation factors associated with respiration and photosynthesis for the different ecosystems are sparse.
In addition to the use of δ18Oatm, the combination of δ17O and δ18O of O2 provides a way to quantify variations in past global productivity (Luz et al., 1999). This method relies on the fact that O2-fractionating processes in the stratosphere and within the biosphere lead to different relationships between δ17O and δ18O of O2. Oxygen is fractionated in a mass-independent manner in the stratosphere, producing approximately equal 17O and 18O enrichments (Luz et al., 1999). On the contrary, the biosphere fractionating processes are mass-dependent such that the 17O enrichment is about half the 18O enrichment relative to 16O. We thus define a Δ17O anomaly as
Δ17O of O2 is equal to 0 by definition in the present-day troposphere (the standard for isotopic composition of atmospheric oxygen is the present-day atmospheric value). Δ17O of O2 is negative in the stratosphere, and increases in biosphere productivity lead to an increase of Δ17O of O2. As for the interpretation of δ18Oatm, the quantitative link between Δ17O of O2 and biosphere productivity depends on the exact fractionation factors associated with biosphere processes (Brandon et al., 2020).
Several studies have been conducted to estimate the fractionation factors during biosphere processes of O2 production and consumption. These fractionation factors are then implemented in global modelling approaches involving the use of models of global vegetation and oceanic biosphere for interpretation of Δ17O of O2 and δ18Oatm in terms of environmental parameters (Landais et al., 2007; Blunier et al., 2012; Reutenauer et al., 2015; Brandon et al., 2020). Most of the fractionation factors used in these modelling approaches were obtained from studies conducted at the cell level: cyanobacterium (Helman et al., 2005), E. coli (Stolper et al., 2018), and microalgae (Eisenstadt et al., 2010). In these studies, the underlying assumption is that the fractionation factor associated with O2 measured at the cell level can be applied at the ecosystem scale. Yet, results from studies conducted at a larger scale, e.g. at the soil scale by Angert et al. (2001) found a global terrestrial respiratory of O2 discrimination for soil microorganisms varying between −12 ‰ and −15 ‰. This is lower than the −18 ‰ discrimination classically used for respiration, with diffusion in soil playing a role in addition to the biological respiration isotopic discrimination. Angert et al. (2001) also showed using experiments on roots of Philodendron plants and wheat seedlings that the respiratory discrimination of a soil with roots is lower (about −12 ‰) than the −18 ‰ discrimination associated with dark respiration. This is due to the low O2 concentration in roots whose presence favours a slower diffusion. Later, Angert et al. (2003) found an even larger spread of O2 isotopic discrimination in soil and showed that temperate and boreal soils have higher isotopic discrimination, respectively, of −17.8 ‰ and −22.5 ‰.
It has been suggested that the strong discrimination observed for boreal and temperate soils is due to the involvement of the alternative oxidase pathway (AOX, Bendall and Bonner, 1971) in addition to the usual cyclooxygenase (COX) respiratory pathway. In the COX respiration pathway, present in the majority in plants, the cytochrome oxidase enzyme catalyses the oxygen reduction reaction. In the AOX pathway, the oxidation of ubiquinol molecules is directly coupled to the reduction of oxygen. Guy et al. (1989, 1992) showed that, for green tissues, the respiratory discrimination of the AOX pathway is much higher (−31 ‰) than the one of the COX pathway (−21 ‰). Similarly, Ribas-Carbo et al. (1995) found a higher respiratory discrimination in phytoplankton that engages the AOX pathway (−31 ‰) relative to bacteria that engage the COX pathway (−24 ‰).
Other studies had attempted to investigate the different respiratory discriminations in the light (dark respiration, Mehler reaction, and photorespiration). As during the light period, dark respiration can be inhibited (70 % inhibition found by Tcherkez et al., 2017, and Keenan et al., 2019), so that the other O2 consuming processes are important to consider. The Mehler reaction reduces oxygen to form a superoxide ion which is converted to hydrogen peroxide (H2O2) in photosystem I and then further converted to water (Mehler, 1951). Photorespiration is the result of the oxygenase activity of Rubisco (Sharkey et al., 1998). This enzyme can oxidise ribulose-1,5-bisphosphate with an oxygen molecule O2. This reaction causes a loss of CO2 incorporation, thus decreasing the photosynthetic yield (Bauwe et al., 2010). Guy et al. (1993) first found a photorespiratory discrimination of −21.7 ‰ and a discrimination of −15.3 ‰ for the Mehler reaction. Later, on a study performed on peas, Helman et al. (2005) found discriminations of −21.3 ‰ and −10.8 ‰, respectively, for photorespiration and the Mehler reaction.
The above-presented state of the art shows contrasting results for the determination of fractionation factors for the different photosynthesis and O2 uptake processes, thus underlining the importance of performing new measurements to correctly interpret global variations of the isotopic composition of oxygen. Moreover, because there may be a difference between the fractionation factors at the cell level and at a broader level as shown for dark respiration in soil, we will favour here an approach at the scale of a terrarium including plant and soil.
In this study we developed a simplified vegetation–soil–atmosphere analogue of the terrestrial biosphere in a closed chamber of 120 dm3 with the aim of estimating the fractionation factors of atmospheric dioxygen due to soil respiration, plant respiration, and photosynthesis. With this set-up we carried out several experimental runs with soil only and soil with plants in order to estimate the isotopic discrimination of the different compartments and check values obtained at the cell level. The implications for our interpretation of the Dole effect are also discussed.
2.1 Growth chamber and closed system
2.1.1 Plant growth and experimental set-up
Seeds of Festuca arundinacea(Schreb.), also commonly called tall fescue, were first sown in a commercial potting soil (Terreau universel, Botanic, France; composition: black and blond peat, wood fibre, green compost, and vermicompost manure, organic and organo-mineral fertilisers and micronutrient fertilisers). During 15 to 20 d, they were then placed in a growth chamber of the Microcosms experimental platform of the European Ecotron of Montpellier (https://www.ecotron.cnrs.fr, last access: 9 March 2023) under diurnal light–dark cycles (Table S1 in the Supplement), air temperature set at 20 ∘C (Tair), air relative humidity (RH) at 80 %, and CO2 atmospheric concentration close to ambient air (concentration of CO2=400 ppm).

Figure 1A vegetation–soil–atmosphere analogue of the terrestrial biosphere in a closed chamber. (a) Schematic of the closed chamber set-up used for the terrestrial biosphere model. The 120 dm3 gas tight closed chamber containing a terrestrial biosphere analogue is enclosed in a larger growth chamber from the Ecotron Microcosms platform. Main environmental parameters inside the closed chamber are actively controlled and monitored: temperature (T), light intensity, CO2, relative humidity (RH), and pressure differential (ΔP). The water cycle in the closed chamber is shown in blue. (b) Photograph of the closed chamber used in the experiment with Festuca arundinacea.
Twelve pots (8 cm × 8 cm × 12 cm with 180 to 200 g of dry soil) containing approximately 25 to 30 mature fescue plants were used for each experimental run. All plants were placed in a plastic tray filled with tap water inside an airtight transparent chamber manufactured from welded polycarbonate (10 mm wall thickness and 120 L volume) similar to the chambers used by Milcu et al. (2013) (Fig. 1). The sealing of the closed chamber was checked before each experiment using helium.
To control temperature and light intensity inside the closed chamber, this smaller chamber was placed in a larger controlled-environment growth chamber. Light was provided by two plasma lamps (GAVITA Pro 300 LEP02; GAVITA) with PAR = 200 µmol m−2 s−1, and air temperature inside the closed chamber was regulated at 19 ± 1 ∘C by adjusting the growth chamber temperature.
The closed chamber (Fig. 1) was used as a closed gas-exchange system with controlled, and continuously monitored, environmental parameters. Air and soil temperature (CTN 35, Carel), air relative humidity (PFmini72, Michell instrument, USA), and CO2 atmospheric concentration (GMP343, Vaisala, Finland) were measured and recorded using the growth chamber datalogger (sampling rate = 1 min). O2 concentration was continuously monitored using an optical sensor (Oxy1-SMA, Presens, Germany). Because precise O2 concentrations are determined in our samples by mass spectrometry (see next section), the measurements of the Oxy1-SMA were only used as a control during the experiment. The measured O2 value for atmospheric air was adjusted to 20.9 % before each sequence of experiments, and the same adjustment (offset) was then applied to the O2 record during the following sequence.
Air relative humidity was regulated between 80 % and 90 % using a heat exchanger (acting as a condenser) connected to a closed-cycle water cooling system. The condenser was positioned in a way to create a closed water cycle in the biological chamber (water vapour from evapotranspiration was condensed back into irrigation water). In order to keep the CO2 mixing ratio close to 400 ppm during the light periods, photosynthetic CO2 uptake was compensated with injections of pure CO2 using a mass flow controller (F200CV, Bronkhorst, the Netherlands). During the dark periods, a soda lime trap connected to a micro-pump (NMS 020B, KNF, Germany) was used to remove the excess CO2 coming from respiration. CO2 atmospheric concentration during the night was kept below 200 ppm.
To ensure atmospheric pressure stability in the closed chamber, a pressure compensation system, made of two connected 10 L gas tight bags (Restek multi-layer polyvinyl fluoride foil gas sampling bag, USA), was installed. Each bag was half full of atmospheric air; the first one was installed in the closed chamber while the second one was outside the chamber. This way, each bag inflated or deflated in response to pressure variations caused either by O2 or CO2 uptake or release. The pressure difference between the closed chamber and the atmosphere was regularly measured using a differential sensor (FD A602-S1K Almemo, Ahlborn, Germany).
Finally, the enclosed air was mixed using seven brushless fans and considered homogeneous.
2.1.2 Gas sampling
To measure the isotopic composition along the experiment, small samples of gas were collected in 5 mL glass flasks, made of two Louwers HV glass valves (1-way bore 9 mm Ref. LH10402008, Louwers Hanique, the Netherlands) welded together. Those flasks, previously evacuated, were mounted on PFA tubing (th) using two th UltraTorr fittings (SS-4-UT-9, Swagelok, USA). Two manual valves (SS-4H, Swagelok, USA) were also installed on the PFA tubes to open or close the circuit. A micro-pump (NMS 20B, KNF, Germany) was finally turned on during air sampling to ensure closed chamber atmosphere circulation through the flask. The flow rate was equal to 1.6 L min−1.
2.2 Isotopic measurements
2.2.1 Water extraction from leaf and isotopic analysis
After each experiment, the plant leaves were collected, placed in airtight flasks, and immediately frozen at −20 ∘C for at least 24 h to make sure there was minimal loss of water through vaporisation when the vial was opened later. The extraction of water from leaves was done according to the procedure detailed in Alexandre et al. (2018). The vial was fixed onto a cryogenic extraction line and was first immersed in a liquid nitrogen Dewar to prevent any sublimation of the water. The water extraction line was emptied of most of its air ( Pa). Once this pressure was reached, the pump was turned off and a valve was closed in order to keep a constant static void within the system. The “reception” vial was then immerged in a liquid nitrogen Dewar which will act as a water trap, whilst the sample vial for the water was then transferred to a water bath maintained at 75 ∘C. The system was kept in these conditions for no less than 6 h, so that all the water present in the leaf and stems was extracted. Afterwards, in order to remove all of the organic compounds of the extracted water, an active charcoal was placed in the extracted water and left under agitation for the night.
For analysis of δ17O and δ18O of water, leaf water was converted to O2 using a fluorination line for reaction of H2O with CoF3 heated to 370 ∘C at LSCE. The isotopic composition of the dioxygen was measured with an IRMS equipped with a dual inlet (Thermo Scientific MAT253 mass spectrometer). The standard that was chosen was an O2 standard calibrated against VSMOW. The precision was 0.015 ‰ for δ17O, 0.010 ‰ for δ18O, and 6 ppm for Δ17O (Eq. 1); for more details, refer to Landais et al. (2006).
The values of δ18O and δ17O of leaf water measured with respect to VSMOW are then expressed with respect to the isotopic composition of dioxygen in atmospheric air (classical standard for δ18O and δ17O of O2 measurements). No consensus has been reached for the values of δ18O and δ17O of O2 in atmospheric air with respect to δ17O and δ18O of H2O of VSMOW. These differences are most probably to be attributed to the different analytical techniques used for preparing and measuring the samples (Yeung et al., 2018; Wostbrock et al., 2021). In our case, because we use a similar set-up to the one developed by Barkan and Luz (2003) for the analyses of the triple isotopic composition of O2 in the air (cf. next section), we have chosen to base our calculation on their estimates. In this study, we have thus chosen the value of 23.88 ‰ for δ18O of O2 values with respect to VSMOW following Barkan and Luz, 2005. As for the δ17O of O2 value with respect to the VSMOW value, we use two different possible estimates from these authors, either 12.03 ‰ (Luz and Barkan, 2011) or 12.08 ‰ (Barkan and Luz, 2005). We acknowledge that because of the absence of consensus, slightly different values could be obtained for the fractionation factors determined in this study if a different choice is made for the reference values of δ18O and δ17O of O2 in atmospheric air with respect to δ17O and δ18O of H2O of VSMOW.
2.2.2 O2 purification and isotopic analysis
The air samples collected in the closed chambers were transported to LSCE for analyses of the isotopic composition of O2. The flasks were connected on a semi-automatic separation line inspired from Barkan and Luz (2003) which was made up of eight ports in which two standards (outside air) and six samples were analysed daily (Brandon et al., 2020). After pumping the whole line, the air was circulated through a water trap (ethanol at −100 ∘C) and then through a carbon dioxide trap immersed in liquid nitrogen at −196 ∘C. After collection of the gas samples on a molecular sieve trap cooled at −196 ∘C, a helium flow carried it through a chromatographic column which was immersed in a water reservoir at 0 ∘C to separate the dioxygen and the argon from the dinitrogen. After separation of the dioxygen and argon from helium, the gas was collected in a stainless steel manifold immersed in liquid helium at −269 ∘C.
After collection, the samples were analysed by the IRMS, previously mentioned for leaf water analyses. The following ratios were measured: , , and (as an indicator of the O2 concentration because Ar is an inert gas). δ17O and δ18O of O2 each sample were obtained through three series of 24 dual inlet measurements against a standard made of O2 and Ar. This sequence was followed by two peak jumping analyses of the ratio, including separate measurements of the O2 and Ar signals for both the standard and the sample. The uncertainty associated with each measurement was obtained from the standard deviation of the three runs and from the repeated peak jumping measurement for which was defined by , and n(O2) is the number of moles of O2 and n(Ar) the number of moles of Ar. The uncertainty values for Δ17O, δ18O, and were, respectively, 10 ppm, 0.05 ‰, and 0.5 ‰.
Each day, we performed measurements of the dioxygen isotopic composition and ratio on two samples of outside air, which is the standard for the isotopic composition of O2 (Hillaire-Marcel et al., 2021), so that the calibrated δ18O value for our sample was calculated as in Eq. (2).
2.3 Experimental runs
2.3.1 General strategy
Our goal was to calculate the fractionation factor associated with δ17O and δ18O for soil respiration, dark leaf respiration, and photosynthesis using the microcosm described above. In order to quantify the fractionation factors, we needed to work in closed and controlled conditions. Given the volume of the closed chamber (120 dm3, hence about 1.12 mol of O2) and the order of magnitude of dark respiration (order of magnitude of 0.08 µmol O2 s−1 for soil respiration) and net photosynthetic fluxes (order of magnitude of 0.45 µmol O2 s−1) inside the chamber, we calculated that experiments should last from 3 d to more than 2 weeks so that more than of the O2 in the chamber can be recycled by the plant and soil. This recycling allows the creation of sufficiently large isotopic signals (especially Δ17O of O2) to be detected and measured. We set up two different experiments in the closed chamber, each experiment being repeated three or four times to characterise the experimental repeatability of the system.
The first experiment (repeated four times, i.e. in four sequences) aimed at studying the fractionation factors during soil respiration. The second experiment (repeated three times, i.e. in three sequences, each sequence being divided into several periods with or without light) aimed at studying the fractionation factors during dark respiration and photosynthesis of plants.
Prior to the aforementioned experiments, measurements were carried out on a closed empty chamber to check the absence of leaks as well as the absence of isotopic fractionation (Table S2).
2.3.2 Soil respiration experiment
To conduct the soil respiration experiment, 2.6 kg of soil (Terreau universel, Botanic) were placed in 12 different pots. The light was turned off during this experimental run (Table S1). We decided not to apply any diurnal cycles during dark respiration experimentations for two reasons. First, we wanted to prevent the development of algae, mosses, or any photosynthetic organisms in the chamber. Secondly, it was easier to optimise temperature control as the light radiation could increase the temperature inside the closed chamber. During this dark period, CO2 from soil respiration accumulates in the biological closed chamber. To have a stable concentration of CO2 during the whole dark period, the CO2 was trapped using soda lime. Four sequences were performed with respective durations of 53, 51, 43, and 36 d.
2.3.3 Photosynthesis and dark respiration experiment
We used the same soil with plants (Festuca arundinacea) grown before the start of the three sequences of the photosynthesis and dark respiration experiment. In order to obtain a significant change of the Δ17O of O2 signal in our closed 120 dm3 chambers, the three experiments were run for 1 to 2 months. CO2 level was controlled to 400 ppm by a CO2 trap and CO2 injections. This was done to ensure that the CO2 in the chamber did not reach levels too far from the atmospheric composition as this could have affected the physiology of the plant. The light cycle was controlled to alternate between day (photosynthesis and respiration) and night conditions (respiration) (Table S1).
The values of the leaf water measurements are presented in Table S3. Because the experiments had to be carried in a closed chamber, we could not sample leaves during the experiment and only got a value at the end of each sequence. Nevertheless, we could compare the isotopic composition of the irrigation and soil water at the start and at the end of the experiment.
2.4 Quantification of fractionation factors
We detail below how we used the results from our experiments to quantify the associated fractionation factors. Notations used below are gathered in Table 1.
Table 1List of variables used to quantify fractionations and their definitions (* means either oxygen 17 or oxygen 18).

The isotopic fractionation factor of oxygen is expressed through the fractionation factor α.
where α is the fractionation factor and 18R is the ratio of the concentration with n the number of moles of O2 containing 18O or 16O. 18R is linked to the δ18O value through
The isotopic discrimination is related to the isotopic fractionation factor through
The same Eqs. (3), (4), and (5) can be proposed for δ17O, and the relationship between the fractionation factors 17α and 18α is written as
In some studies, referred to later, the notation γ is also used with .
2.4.1 Soil respiration
Respiration is associated with isotopic fractionation. The light isotopes, 16O, are more easily integrated by microorganisms than the heavy isotopes, 18O, which hence remain in the atmosphere. We express the fractionation factor for soil respiration as
In our experiment, the respiratory process took place in a closed reservoir so that we could calculate the fractionation factors from the evolution of the concentration and isotopic composition of dioxygen in the chamber. The number of molecules of dioxygen in the air of the closed chamber, n(O2), between time t and time t+dt can be written as
with dn(O2) the number of dioxygen molecules respired during the time period dt. A similar equation can be written for the number of dioxygen molecules containing 18O remaining in the air of the chamber:
The evolution of the isotopic ratio of oxygen, 18R, between time t and time t+dt can be written as:
Combining equations Eqs. (8), (9), and (10); neglecting the second order term ; and integrating from t0 (starting time of the experiment when the chamber is closed) to t leads to
Because argon is an inert gas, we can link to , so that
2.4.2 Dark respiration
In order to calculate the isotopic fractionation associated with soil and plant respiration during the dark period, we followed the same calculation as for the soil respiration (Sect. 2.4.1). In this case, we selected only night periods from each sequence of the photosynthesis and dark respiration experiment.
2.4.3 Photosynthesis
During photosynthesis, the oxygen atoms in the dioxygen produced by the plant come from the oxygen atom of water consumed by photosynthesis in the leaves, so that the fractionation factor during photosynthesis can be expressed as
where lw stands for leaf water.
For our study of Festuca arundinacea, we consider that the water in the mesophyll layer can be represented by bulk leaf water.
Photosynthesis occurs during the light periods. However, it should be noted that dark respiration, photorespiration, and the Mehler reaction occur at the same time. In a first approach, we made the assumption that respiration rates remain the same during the light and dark periods. This assumption is probably true for soil respiration since flux of heterotrophic dark respiration is not expected to change for different light conditions if the other environmental drivers (e.g. humidity, temperature, soil organic matter) are constant. However, autotrophic dark respiration is expected to decrease during light periods compared to dark periods. As a consequence, we present sensitivity tests to the dependence of a vanishing dark respiration of leaves during the dark period in Table S4.
Thus, at each stage, dioxygen is both produced by photosynthesis and consumed by the aforementioned O2 uptake processes (hereafter total_respi) by the plant according to the mass conservation equation
where dntotal_respi is the number of molecules of O2 consumed by dark respiration, photorespiration, and the Mehler reaction between time t and t+dt, and dnphotosynthesis is the number of molecules of O2 produced by photosynthesis between t and t+dt.
The budget for 18O of O2 can be written as
where 18αtotal_respi is the fractionation factors associated with each O2 consuming process period throughout the whole experiment.
We introduced the normalised fluxes of photosynthesis and total respiration as
This led to the following expression of 18αphotosynthesis:
This equation can be simplified at t=0 for and : 18αphotosynthesis depends on the values of 18αtotal_respi and of Ftotal_respi, themselves dependent on the values of 18αMehler (fractionation factor associated with Mehler reaction), FMehler (flux of oxygen related to Mehler reaction), 18αdark_respi, Fdark_respi, 18αphotorespi (fractionation factor associated with photorespiration), and Fphotorespi (photorespiration flux of oxygen). These last four parameters could not be determined in our global experiment. Our determination of 18αphotosynthesis will thus rely on assumptions for the estimations of 18αMehler, FMehler, 18αphotorespi, and Fphotorespi.
To separate the 18αdark_respi from the other fractionation factors, we defined
with
f indicates the fraction of the total oxygen uptake flux corresponding to each process (dark respiration, photorespiration, and Mehler reaction) so that
In the absence of further constraints, we used here as first approximation the global values from Landais et al. (2007) for fdark_respi (0.6), fphotorespi (0.3) and fMehler (0.1). Values for αphotorespi and αMehler were based on the most recent estimates of Helman et al. (2005).
3.1 Soil respiration
3.1.1 Experimental data
During the four sequences, the respiration activity led to a decreasing level of the O2 concentration measured by the optical sensor or through the evolution from IRMS measurements (Fig. S1 in the Supplement). The comparison of the evolution of the O2 concentration during the different sequences showed that respiratory fluxes were different with a maximum factor of 4 between the different sequences (Fig. S1). In parallel to the decrease in O2 concentration, the δ18O increased as expected because respiration preferentially consumes the lightest isotopes: over the 51 d of the second soil respiration sequence, we observed a linear decrease of oxygen concentration by more than 5 % while δ18O increased by 8 ‰ (Fig. 2). A Mann–Kendall trend test showed that the Δ17O of O2 does not show any statistically significant trend over the four sequences (Fig. S2) (p values were equal to 0.40, 0.08, 0.58, and 0.47, respectively).

Figure 2Evolution of the different concentrations and isotopic ratios in the sequence 2 of the soil respiration experiment (day 0 is the beginning of the sequence). (a) δ18O of O2 (red) variations. (b) Δ17O of O2 (blue) variations. (c) Dioxygen concentration (purple) from the optical sensor and variations (green) measured by IRMS.
3.1.2 Fractionation factors
We used the 15 to 20 samples obtained during each sequence of the soil respiration experiment to draw the relative evolution of vs. following Eq. (11) (Fig. 3). The slope of the corresponding regression line provided the isotopic discrimination 18εsoil_respi and hence the fractionation factor 18αsoil_respi for each sequence (Table S5). It could be observed that despite differences in respiratory fluxes for the different sequences (the standard deviation is equal to 50 % of the average flux across sequences; see Table S5), the relationship between δ18O of O2 and O2 concentration (or ), and hence the calculated fractionation factor associated with respiration, is not much affected.
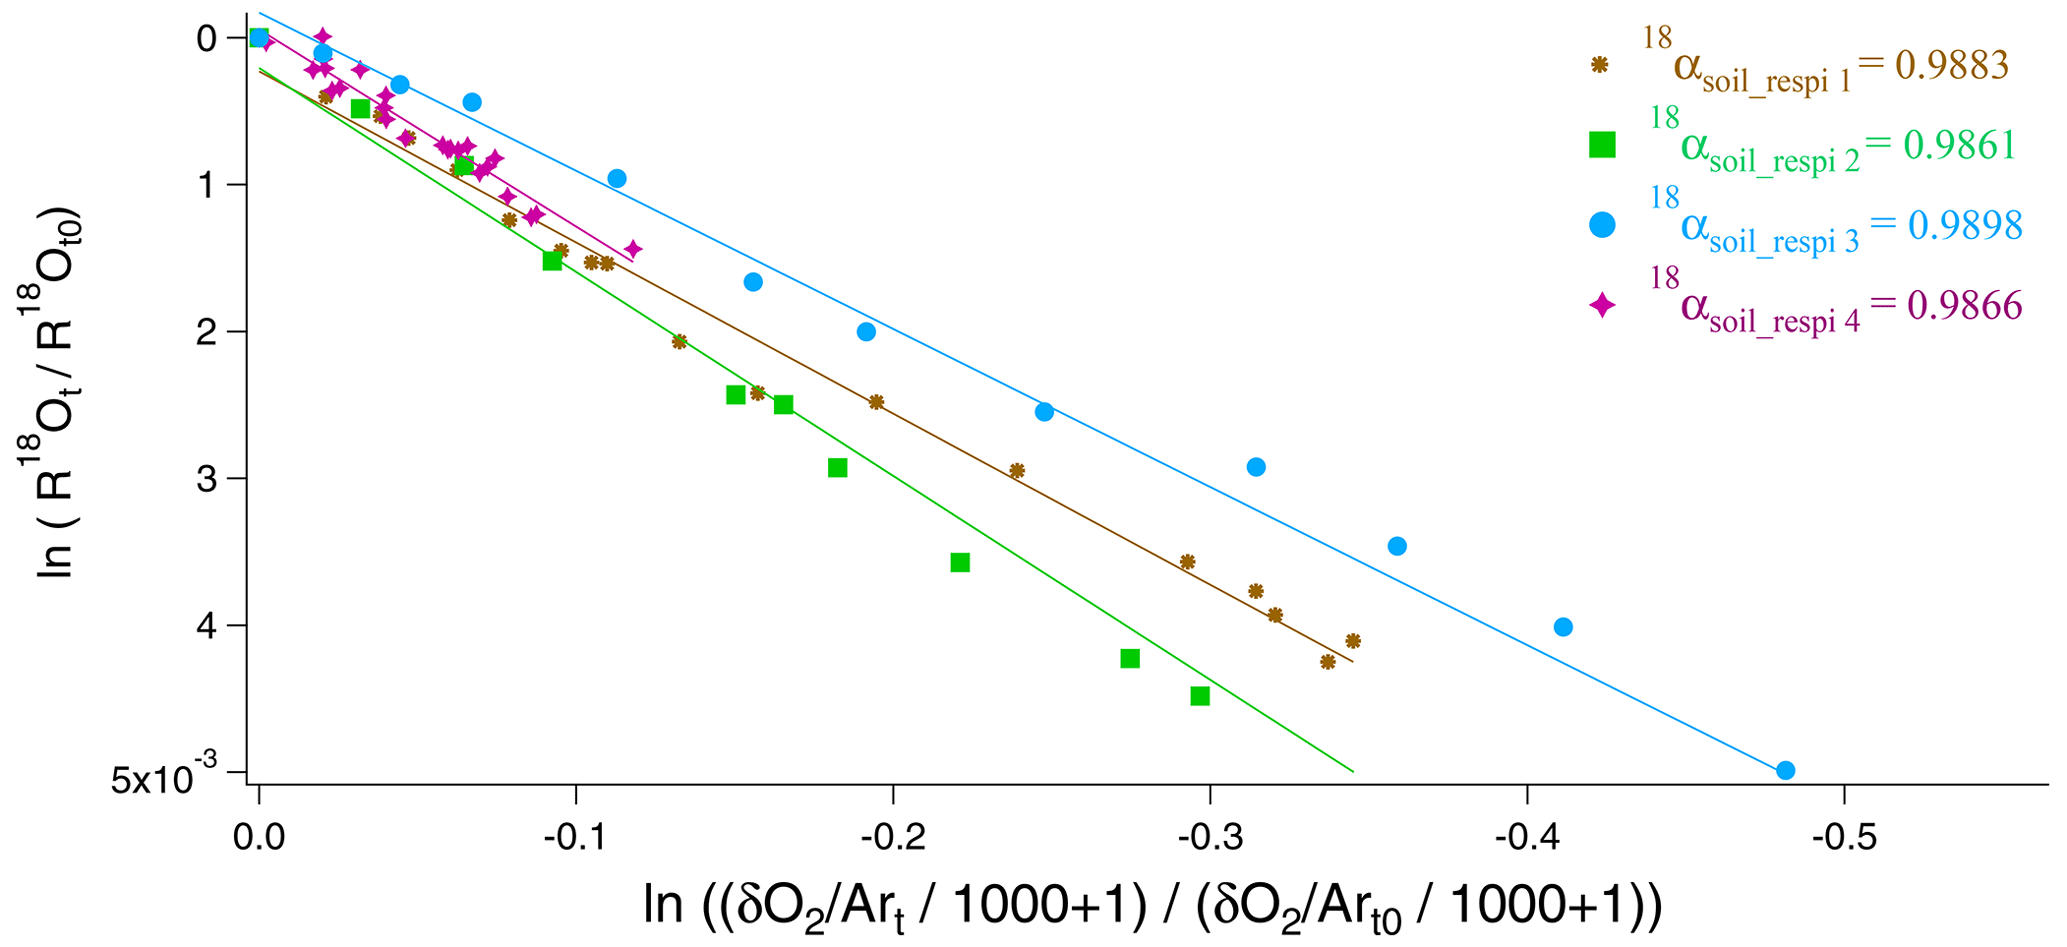
Figure 3Determination of fractionation factors in the four respiration sequences. 18αsoil_respi 1 (brown), 18αsoil_respi 2 (green), 18αsoil_respi 3 (blue), and 18αsoil_respi 4 (purple) are, respectively, respiratory fractionation factors associated with sequences 1 to 4.
Using the results of the four sequences, we determined the values for the mean isotopic discrimination 18εsoil_respi ( ‰), the mean isotopic discrimination 17εsoil_respi ( ‰), and the average θsoil_respi (0.5164 ± 0.0005).
3.2 Photosynthesis and dark respiration
3.2.1 Experimental data
During the night periods, when only respiration occurred, we observed a decrease in O2 concentration by 1 % within 3 d and a δ18O increase by 1 ‰ during the same period (Fig. 4). The evolution was qualitatively similar to that of soil respiration experiments with higher fluxes. We observed the same trends for the evolution of during the night periods as for the respiration experiment. During light periods, there was a marked decrease in δ18O (2 ‰) and a marked increase in the flux of oxygen released (1 %) during 1 d. We observed the same trends for the evolution of during the night periods as for the respiration experiment.
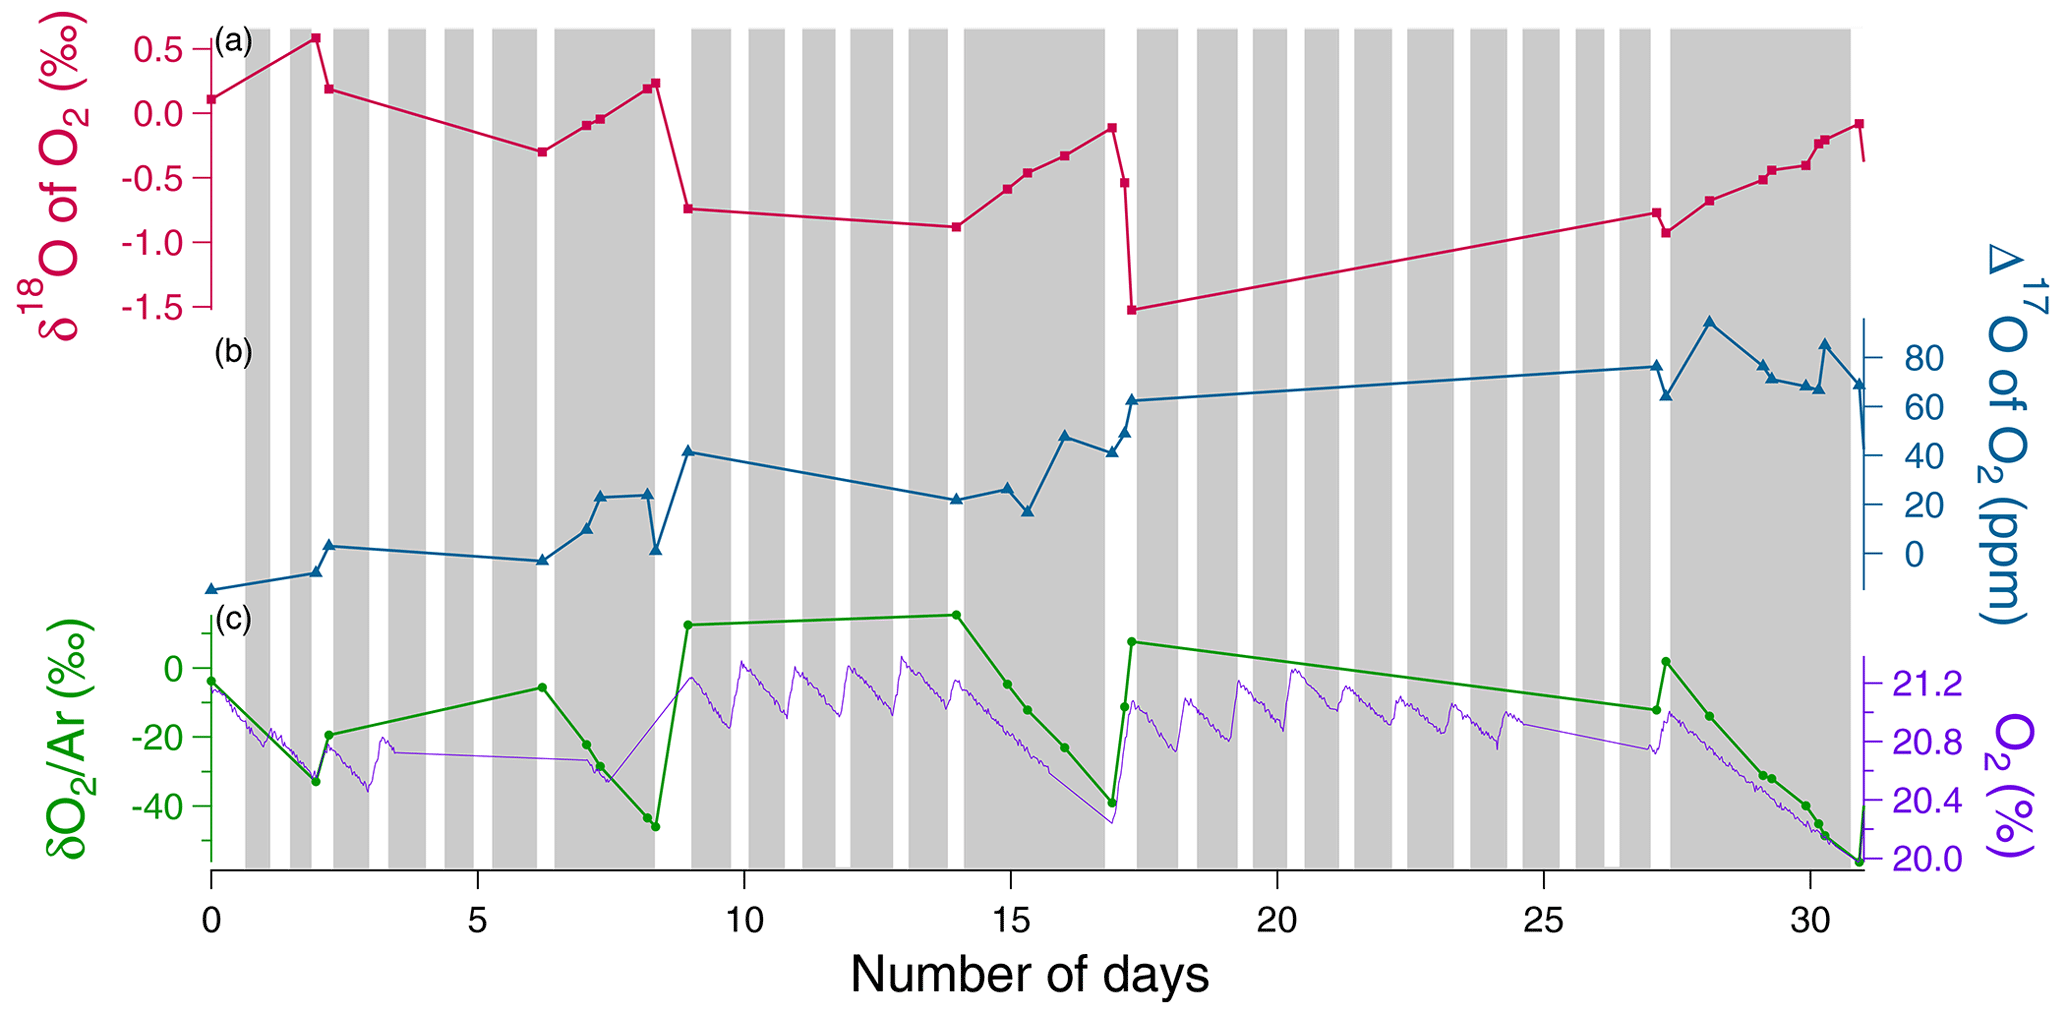
Figure 4Example of the evolution of the different concentrations and isotopic ratios in the sequence 1 of photosynthesis and dark respiration experiment in the closed chamber over 31 d (day 0 is the beginning of the sequence). Grey rectangles correspond to night periods and white rectangles to light periods. (a) δ18O of O2 (red) variations. (b) Δ17O of O2 variations (blue). (c) Dioxygen concentration (purple) from the optical sensor and variations (green) measured by IRMS.
The Mann–Kendall test (95 %) showed a significative increasing trend of the Δ17O of O2 over sequences 1 and 2 (Fig. S3) (≃ 100 ppm in 31 d for sequence 1, ≃ 100 ppm in 40 d for sequence 2), while no significant increase of Δ17O of O2 is observed over sequence 3 (Fig. S3).
3.2.2 Fractionation factors
Dark respiration
The average of the isotopic discrimination for dark respiration 18εdark_respi and 17εdark_respi were calculated over the nine night periods, and we obtained values of, respectively, ‰ and ‰. The average of θdark_respi during the experiment was equal to 0.5124 ± 0.0084 (details in Table S6).
The dark respiration of this experiment includes respiration of both soil and leaves. Because soil respiration fractionation factor has been determined above, it is possible to estimate here the fractionation factor for the dark leaf respiration, and we consider that respiration rate during dark and light periods do not vary:
with Fdark_leaf_respi the flux of leaf respiration during the night, fsoil_respi the fraction of soil respiration during night periods (), and fdark_leaf_respi the fraction of dark leaf respiration during night periods ().
The isotopic discriminations 18εdark_leaf_respi and 17εdark_leaf_respi were, respectively, equal to ‰ and ‰. The average of θdark_leaf_respi was equal to 0.5089±0.0777. The standard deviations (1σ) were calculated by a Monte Carlo method from the individual uncertainties of the 18αdark_respi, 18αsoil_respi, Fsoil_respi, and Fdark_respi.
Photosynthesis
In order to calculate an average value for the fractionation factor associated with photosynthesis from Eq. (19), we first calculated the averages of the flux of the O2 consuming processes and of the fractionation factors associated with each sequence: 〈Ftotal_respi〉 and 〈18αtotal_respi〉. We also calculated the net O2 flux during light periods, , as the linear regression, aN, of with time. a 18R is also obtained as a linear regression of 18R with time over each light period. Our data support our assumption that the regime was stationary over time and evolved linearly over time, which is why we were able to do linear regressions.
The results of the eight individual αphotosynthesis values are given in Table S10. The value of isotopic fractionation associated with the light period of period 1 of sequence 1 appeared clearly out of range. Following the Dixon's outlier detection test (Dixon, 1960), this value was considered an anomaly (likelihood >99 %) and was removed from further analysis.
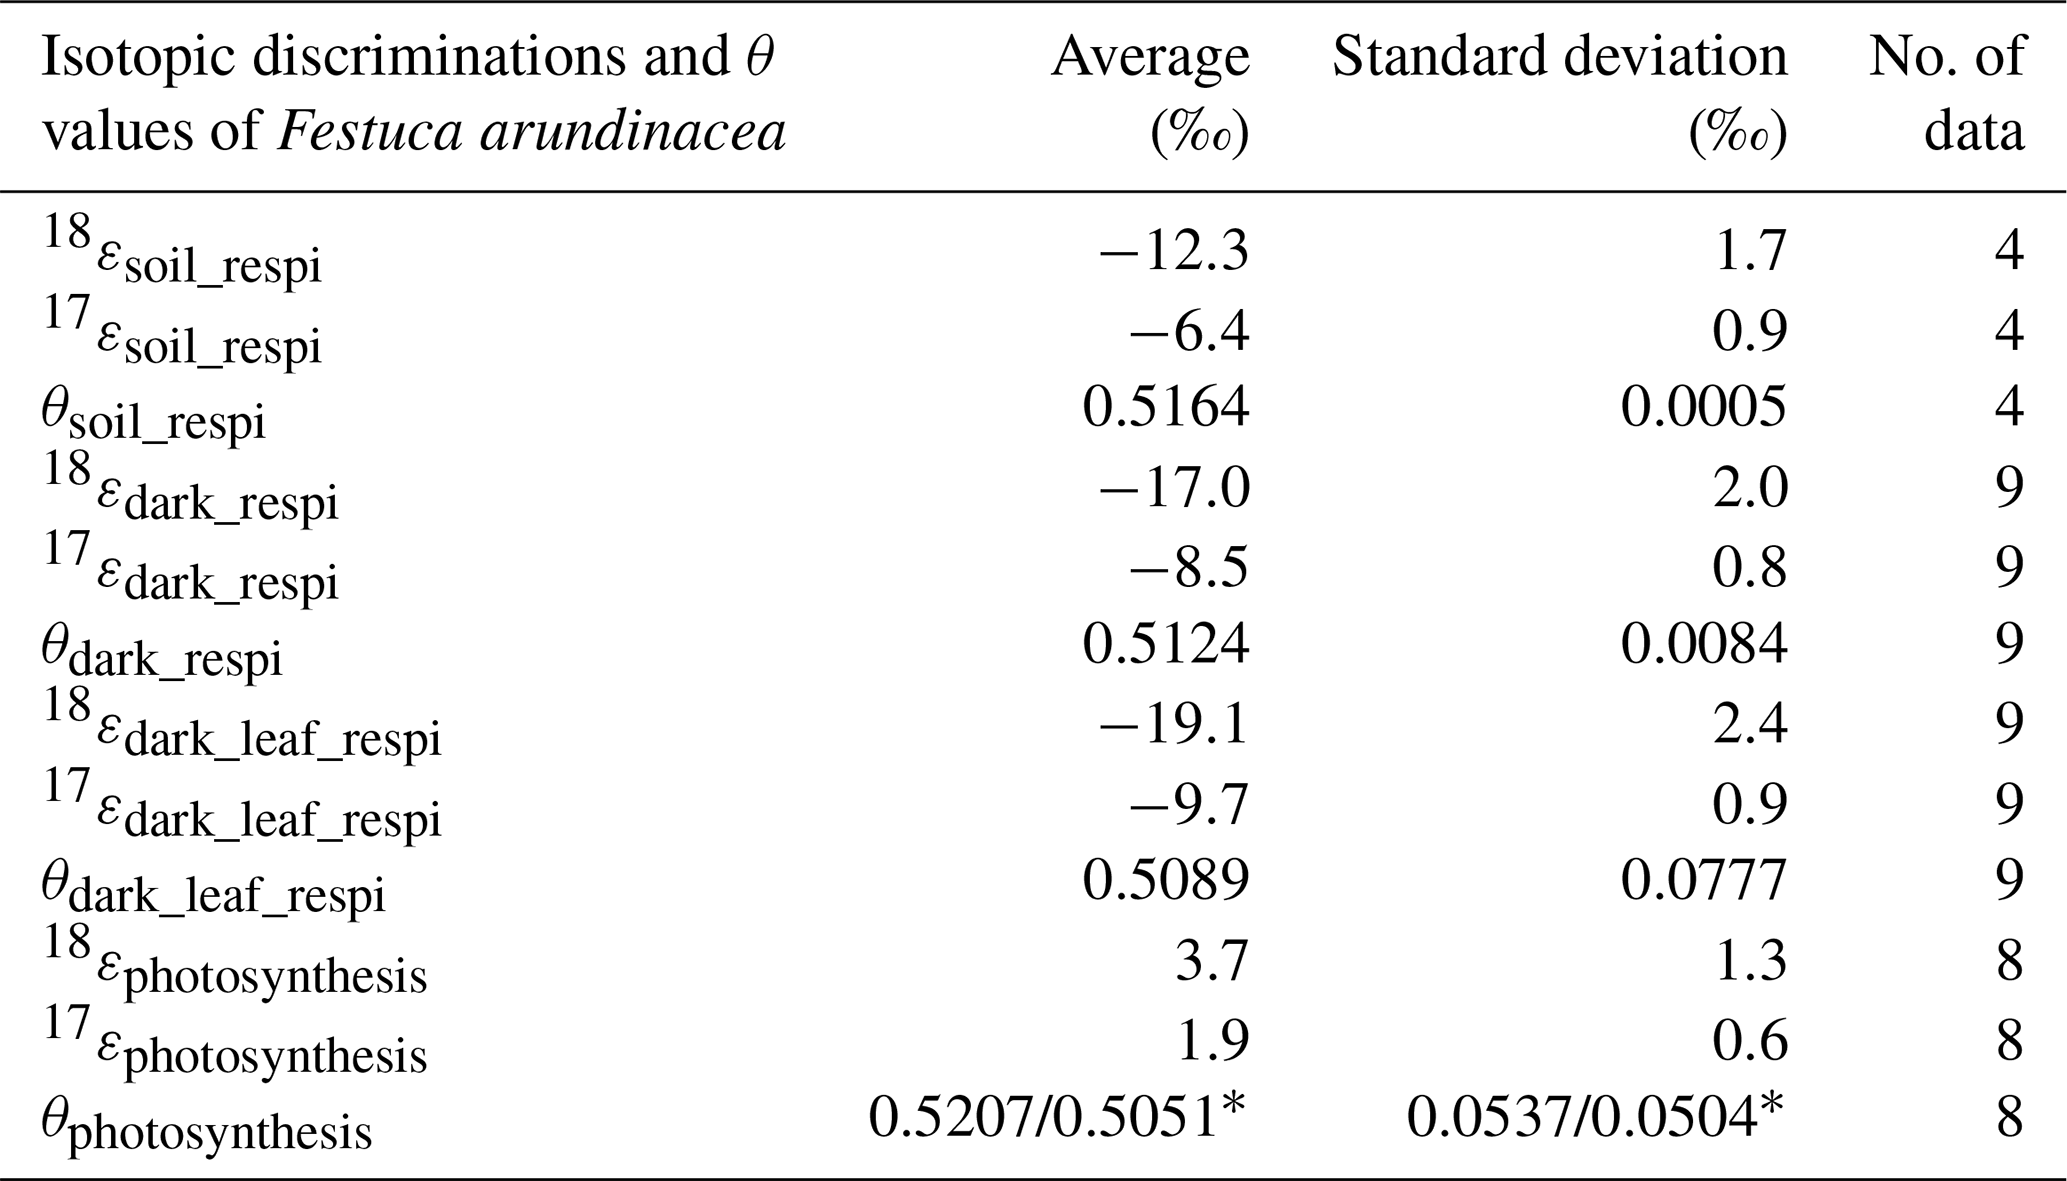
We finally estimated the values of 18εphotosynthesis and 17εphotosynthesis as ‰ and ‰, respectively. The average of θphotosynthesis was equal to 0.5207±0.0537, a value which depends on the value taken for the δ17O value of atmospheric O2 vs. VSMOW (Sharp and Wostbrock, 2021), see Table 2.
Table 2Summary of the mean values of the isotopic discriminations and θ values for Festuca arundinacea of all sequences of (1) the soil respiration experiment and of (2) the respiration and photosynthesis experiment and the number of data on which they were calculated (* is the value for θphotosynthesis that depends on the determination of the δ17O of atmospheric O2 vs. δ17O of VSMOW). We provide here the two different possible estimates using either 12.03 ‰ (Luz and Barkan, 2011) or 12.08 ‰ (Barkan and Luz, 2005): value determined with δ17O = 12.03 ‰value determined with δ17O = 12.08 ‰.
We performed different sensitivity tests (Sects. S1 and S2 in the Supplement). Sensitivity test 1 (Table S4) quantifies the influence of vanishing flux of dark leaf respiration during the day. This test shows that the assumption of similar flux of dark leaf respiration during the night, and light periods did not influence much the values of photosynthesis fractionation factors. It results in an additional uncertainty of 0.0006 and 0.0005 for the values of 18αphotosynthesis and 17αphotosynthesis.
Sensitivity tests 2 (Tables S7, S8 and S9) were performed on values of the O2 flux and associated fractionation factors for photorespiration and the Mehler reaction. They resulted in additional uncertainties of 0.0007 and 0.0005 for the values of 18αphotosynthesis and 17αphotosynthesis (Table S10).
Sensitivity tests 3 concerned the possible evolution of the isotopic composition of leaf water over the course of an experiment. The comparison of the δ18O of irrigation water and soil water at the end of the experiment shows a possible increase up to 2 ‰ (Table S3). We thus estimate that our values of leaf water δ18O measured at the end of the experiment may be overestimated by 1 ‰ compared to the mean value of leaf water δ18O during the course of the experiment. Taking this possible effect into account would lead to a fractionation factor for photosynthesis higher by 1 ‰ compared to the presented one of 3.7±1.3 ‰, hence a higher isotopic discrimination associated with photosynthesis.
Finally, we evaluated by a Monte Carlo calculation how the different uncertainties listed in the three sensitivity tests described above influence the final uncertainty on the photosynthesis isotopic discrimination. We found a final standard deviations (1σ) equal to 0.3 ‰ for 18εphotosynthesis and 0.15 ‰ for 17εphotosynthesis.
4.1 Δ17O of O2
The Δ17O of O2 is equal to 0 by definition for atmospheric air, and hence it should be equal to zero at the beginning of each experiment. The observed change during an experiment can only be driven by biological processes because the interaction with stratosphere is not possible in the closed chambers.
During the soil respiration experimental run, the Δ17O of O2 was constant. This directly reflects the θsoil_respi value of 0.5164±0.0005 (Table 2) because Δ17O of O2 is defined with a slope of 0.516 between ln (1+δ17O) and ln (1+δ18O) (Eq. 1). This result is in good agreement and within the uncertainties given by Helman et al. (2005) with the γ value of 0.5174 (equivalent to a θ of 0.515±0.0003) obtained with respiration experiments on several microorganisms.
During the experiment involving both oxygen uptake and photosynthesis, the Δ17O of O2 has a globally increasing trend with values reaching about 100 ppm after 1 month. Such behaviour is expected and was already observed by Luz et al. (1999), with Δ17O of O2 values reaching 150 ppm after a 200 d experiment within a closed terrarium. This increase cannot be explained by respiration because respiration does not modify Δ17O of O2. It can be explained by photosynthesis producing oxygen with a Δ17O of O2 different from the atmospheric one. Previous analyses have shown that the Δ17O of H2O of VSMOW (close to mean oceanic water) expressed vs. isotopic composition of atmospheric O2 has a value between 134 to 223 ppm (using a definition of Δ17O of H2O = ) (Sharp and Wostbrock, 2021). Within the water cycle, the slopes of ln (1+δ17O) vs. ln (1+δ18O) for the meteoric, evaporation, and evapotranspiration lines are larger than 0.516 (Meijer and Li, 1998 Landais et al., 2006) so that Δ17O of water consumed by the plants during photosynthesis should be slightly lower than the Δ17O of VSMOW expressed vs. isotopic composition of atmospheric O2 but still higher than the Δ17O of atmospheric O2. Photosynthesis can thus explain the Δ17O of O2 increase in the closed chamber.
4.2 Fractionation factors associated with δ18O of O2 and implications for the Dole effect
The isotopic discrimination ‰ for the soil respiration experiments is comparable to the average terrestrial soil respiration isotopic discrimination found by Angert et al. (2001) of −12 ‰. Still, among the diversity of soils studied by Angert et al. (2001), the soils showing the 18ε values closest to our values are clay soil ( ‰) and sandy soil ( ‰). Soil respiration isotopic discriminations are less strong than isotopic discrimination due to dark respiration alone (−18 ‰, Bender et al., 1994). These lower values for soil respiration isotopic discrimination are due to the roles of root diffusion in the soil (Angert et al., 2001). The soils studied by Angert et al. (2001) are, however, different from our soil, which was enriched in organic matter. Further experiments are then needed to understand the variability in 18ε associated with soil respiration.
The isotopic discrimination for dark leaf respiration, ‰ is associated with a large uncertainty and would benefit from additional experiments with a higher sampling and measurement rate. Still, even if it was obtained on different organisms and experimental set-ups, this value is in agreement with the values for isotopic discrimination for dark respiration determined by Helman et al. (2005) on bacteria from the Lake Kinneret ( ‰) and Synechocystis ( ‰ and −19.5 ‰) and Guy et al. (1989, 1992) on Phaeodactylum tricornutum and on terrestrial plants (−17 ‰ to −19 ‰ for COX respiration).
The average 18εphotosynthesis is ‰ for Festuca arundinacea species, which goes against the classical assumption that terrestrial photosynthesis does not fractionate (Vinogradov et al., 1959; Guy et al., 1993; Helman et al., 2005; Luz and Barkan, 2005). Vinogradov explains that the low photosynthetic isotopic discrimination that can occur is due to contamination by atmospheric O2 or by respiration. Guy et al. (1993) corroborate this idea by finding a photosynthetic isotopic discrimination of 0.3 ‰ in cyanobacteria (Anacystis nidulans) and diatoms (Phaeodactylum tricornutum) that they consider negligible. Luz and Barkan (2005) in their study on Philodendron, consider that there is no photosynthetic isotopic discrimination. Our value suggests that there is a terrestrial photosynthetic isotopic discrimination, and the value found for Festuca arundinacea is slightly smaller than the photosynthetic isotopic discrimination in the marine environment ‰ found by Eisenstadt et al. (2010). More specifically, Eisenstadt et al. (2010) determined several photosynthetic isotopic discrimination values depending on the phytoplankton studied (Phaeodactylum tricornutum: 4.5 ‰, Nannochloropsis sp.: 3 ‰, Emiliania huxleyi: 5.5 ‰, and Chlamydomonas reinhardtii: 7 ‰). One of the conclusions given by Eisenstadt et al. (2010) is that eukaryotic organisms enrich their produced oxygen more in 18O than the prokaryotic organisms. Our conclusion based on experiments performed with the Festuca arundinacea species is in agreement with these conclusions.
Our experiments were performed at the scale of the plants, which is different to previous studies performed at the scale of the chloroplast (e.g. Guy et al., 1993) where no evidence of oxygen fractionation has been found. We can thus not exclude that this fractionation attributed here to photosynthesis is due to oxygen-consuming processes not taken into account in our approach. Our main goal however is to interpret the global δ18O of atmospheric O2 using the fractionation observed at the scale of the plants. As a consequence, we believe that if there is a light-dependent oxygen fractionation process that we did not identify in our approach, it will also be present at the global scale. It should thus be taken into account in our future interpretation of the Dole effect. We thus keep our estimate of the photosynthesis 18O discrimination described above but name it as an effective photosynthesis 18O discrimination at the scale of the plants because the details of the processes at play is not fully elucidated.
Finally, we should however note that we tested only one species. Additional experiments with different plants are needed to check if the positive effective fractionation factor should be applied for global Dole effect calculation. Still, this positive effective 18O discriminations during photosynthesis suggests that the terrestrial Dole effect may be higher than currently assumed and challenge the assumption that terrestrial and oceanic Dole effects have the same values (Luz and Barkan, 2011).
Using a simplified analogue of the terrestrial biosphere in a closed chamber, we found that the fractionation factors of soil respiration and dark leaf respiration at the biological chamber level agree with the previous estimates derived from studies at microorganism level. This is an important confirmatory step for the fractionation factors previously used to estimate the global Dole effect. More importantly, we document for the first time a significant effective 18O discrimination at the scale of the plant during terrestrial photosynthesis with the Festuca arundinacea species (+3.7 ± 1.3 ‰). If confirmed by future studies, this can have a substantial impact on the calculation of the Dole effect, with important consequences for our estimates of the past global primary production.
Our study showed the usefulness of closed chamber systems to quantify the fractionation factors associated with biological processes in the oxygen cycle at the plant level. The main limitation of our present study was the low sampling rate during our experiments which hampers the precision of the determined fractionation factors. Future work should use this validated set-up to multiply such experiments to improve the precision of fractionation factors and to explore the variability of fractionation factors for different plants and hence different metabolisms. A good application would be to study the difference between C3 and C4 plants, because C4 plants do not photorespire. C4 plants, adapted to dry environments, have their own strategy and make very little photorespiration through specialised cells. This allows them to produce their own energy in an optimal way without the waste produced by photorespiration.
All individual fractionation factors for each experiment are given in the Supplement.
The supplement related to this article is available online at: https://doi.org/10.5194/bg-20-1047-2023-supplement.
AL and CPi designed the project. CPi, JS, and SD carried out experiments at ECOTRON of Montpellier and FP, CPa, RJ, AD, and OJ at LSCE. CPa, NP, and AL analysed the data. CPa and AL prepared the paper with contributions from NP, CPi, JS, and AM.
The contact author has declared that none of the authors has any competing interests.
Publisher’s note: Copernicus Publications remains neutral with regard to jurisdictional claims in published maps and institutional affiliations.
The research leading to these results has received funding from the European Research Council under the European Union H2020 Programme (H2020/20192024)/ERC grant agreement no. 817493 (ERC ICORDA) and ANR HUMI17. The authors acknowledge the scientific and technical support of PANOPLY (Plateforme ANalytique géOsciences Paris-sacLaY), Paris-Saclay University, France. This study benefited from the CNRS resources allocated to the French ECOTRONS Research Infrastructure, from the Occitanie Region and FEDER investments as well as from the state allocation “Investissement d'Avenir” AnaEE-France ANR-11-INBS-0001. We would also like to thank Abdelaziz Faez and Olivier Ravel from ECOTRON of Montpellier for their help, Anne Alexandre from CEREGE at Aix-en-Provence and Emeritus Prof. Phil Ineson from University of York.
This research has been supported by the H2020 European Research Council (grant no. 817493).
This paper was edited by Aninda Mazumdar and reviewed by two anonymous referees.
Alexandre, A., Landais, A., Vallet-Coulomb, C., Piel, C., Devidal, S., Pauchet, S., Sonzogni, C., Couapel, M., Pasturel, M., Cornuault, P., Xin, J., Mazur, J.-C., Prié, F., Bentaleb, I., Webb, E., Chalié, F., and Roy, J.: The triple oxygen isotope composition of phytoliths as a proxy of continental atmospheric humidity: insights from climate chamber and climate transect calibrations, Biogeosciences, 15, 3223–3241, https://doi.org/10.5194/bg-15-3223-2018, 2018.
Angert, A., Luz, B., and Yakir, D.: Fractionation of oxygen isotopes by respiration and diffusion in soils and its implications for the isotopic composition of atmospheric O2, Global Biogeochem. Cy., 15, 871–880, https://doi.org/10.1029/2000GB001371, 2001.
Angert, A., Barkan, E., Barnett, B., Brugnoli, E., Davidson, E. A., Fessenden, J., Maneepong, S., Panapitukkul,N., Randerson, J. T., Savage, K., Yakir, D., and Luz, B.: Contribution of soil respiration in tropical, temperate, and boreal forests to the 18O enrichment of atmospheric O2, Global Biogeochem. Cy., 17, 1089, https://doi.org/10.1029/2003GB002056, 2003.
Barkan, E. and Luz, B.: High precision measurements of and of O2 and ratio in air, Rapid Commun. Mass Sp., 17, 2809–2814, https://doi.org/10.1002/rcm.1267, 2003.
Barkan, E. and Luz, B.: High precision measurements of and ratios in H2O, Rapid Commun. Mass Sp., 19, 3737–3742, https://doi.org/10.1002/rcm.2250, 2005.
Bauwe, H., Hagemann, M., and Fernie, A. R.: Photorespiration: players, partners and origin, Trends Plant Sci., 6, 330–336, https://doi.org/10.1016/j.tplants.2010.03.006 , 2010.
Bendall, D. S. and Bonner Jr., W. D.: Cyanide-insensitive Respiration in Plant Mitochondria, Plant Physiol., 47, 236–245, https://doi.org/10.1104/pp.47.2.236, 1971.
Bender, M., Sowers, T., Dickson, M-L., Orchardo, J., Grootes, P., Mayewski, P. A., and Meese, D. A.: Climate correlations between Greenland and Antarctica during the past 100,000 years, Nature, 372, 663–666, https://doi.org/10.1038/372663a0, 1994.
Blunier, T., Barnett, B., Bender, M. L., and Hendricks, M. B.: Biological oxygen productivity during the last 60,000 years from triple oxygen isotope measurements, Global Biogeochem. Cy., 16, 3–4, https://doi.org/10.1029/2001GB001460, 2002.
Blunier, T., Bender, M. L., Barnett, B., and von Fischer, J. C.: Planetary fertility during the past 400 ka based on the triple isotope composition of O2 in trapped gases from the Vostok ice core, Clim. Past, 8, 1509–1526, https://doi.org/10.5194/cp-8-1509-2012, 2012.
Brandon, M., Landais, A., Duchamp-Alphonse, S., Favre, V., Schmitz, L., Abrial, H., Prié, F., Extier, T., and Blunier, T.: Exceptionally high biosphere productivity at the beginning of Marine Isotopic Stage 11, Nat. Commun., 11, 1–10, https://doi.org/10.1038/s41467-020-15739-2, 2020.
Dansgaard, W.: Stable isotopes in precipitation, Tellus, 16, 436–468, 1974.
Dixon, W. J.: Simplified estimation from censored normal sample, Ann. Math. Stat., 21, 488–506, https://doi.org/10.1214/aoms/1177705900, 1960.
Dole, M.: The Relative Atomic Weight of Oxygen in Water and in Air A Discussion of the Atmospheric Distribution of the Oxygen Isotopes and of the Chemical Standard of Atomic Weights, J. Chem. Phys., 4, 268, https://doi.org/10.1063/1.1749834, 1936.
Dole, M. and Jenks, G.: Isotopic composition of photosynthetic oxygen, Science, 100, 409, https://doi.org/10.1126/science.100.2601.409, 1944.
Dongman, G., Nürnberg, H. W., Förstel, H., and Wagener, K.: On the enrichment of HO in the leaves of transpiring plants, Radiat. Environ. Bioph., 11, 41–52, https://doi.org/10.1007/BF01323099, 1974.
Dreyfus, G. B., Parrenin, F., Lemieux-Dudon, B., Durand, G., Masson-Delmotte, V., Jouzel, J., Barnola, J.-M., Panno, L., Spahni, R., Tisserand, A., Siegenthaler, U., and Leuenberger, M.: Anomalous flow below 2700 m in the EPICA Dome C ice core detected using δ18O of atmospheric oxygen measurements, Clim. Past, 3, 341–353, https://doi.org/10.5194/cp-3-341-2007, 2007.
Eisenstadt, D., Barkan, E., Luz, B., and Kaplan, A.: Enrichment of oxygen heavy isotopes during photosynthesis in phytoplankton, Photosynth. Res., 103, 97–103, https://doi.org/10.1007/s11120-009-9518-z, 2010.
Extier, T., Landais, A., Bréant, C., Prié, F., Bazin, L., Dreyfus, G., Roche, D. M., and Leuenberger, M.: On the use of δ18Oatm for ice core dating, Quaternary Sci. Rev., 185, 244–257, https://doi.org/10.1016/j.quascirev.2018.02.008, 2018.
Guy, R. D., Berry, J. A., Fogel, M. L., and Hoering, T. C.: Differential fractionation of oxygen isotopes by cyanide‐resistant and cyanide sensitive respiration in plants, Planta, 177, 483–491, https://doi.org/10.1007/BF00392616, 1989.
Guy, R. D., Berry, J. A., Fogel, M. L., Turpin, D. H., and Weger, H. G.: Fractionation of the stable isotopes of oxygen during respiration by plants: The basis of a new technique to estimate partitioning to the alternative path, Plant Respiration. Molecular, Biochemical and Physiological Aspects, SPB Academic Publishing, The Hague, the Netherlands, 443–453, 1992.
Guy, R. D., Fogel, M. L., and Berry, J. A.: Photosynthetic fractionation of the stable isotopes of oxygen and carbon, Plant Physiol., 101, 37–47, https://doi.org/10.1104/pp.101.1.37, 1993.
Helman, Y., Barkan, E., Eisenstadt, D., Luz, B., and Kaplan, A.: Fractionation of the three stables oxygen isotopes by oxygen-producing and oxygen-consuming reactions in photosynthetic organisms, Plant Physiol., 138, 2292–2298, https://doi.org/10.1104/pp.105.063768, 2005.
Hillaire-Marcel, C., Kim, S.-T., Landais, A., Ghosh, P., Assonov., S., Lécuyer, C., Blanchard, M., Meijer, H. A. J., and Steen-Larsen, H.: A stable isotope toolbox for water and inorganic carbon cycle studies, Nat. Rev. Earth Environ., 2, 699–719, https://doi.org/10.1038/s43017-021-00209-0 , 2021.
Hoffmann, G., Cuntz, M., Weber, C., Ciais, P., Friedlingstein, P., Heimann, M., Jouzel, J., Kaduk, J., Maier Reimer, E., Seibt, U., and Six, K.: A model of the Earth's Dole effect, Global Biogeochem. Cy., 18, 1–15, https://doi.org/10.1029/2003GB002059, 2004.
Keenan, T. F., Migliavacca, M., Papale, D., Baldocchi, D., Reichstein, M., Torn, M., and Wutzler, T.: Widespread inhibition of daytime ecosystem respiration, Nat. Ecol. Evol., 3, 407–415, https://doi.org/10.1038/s41559-019-0809-2, 2019.
Landais, A., Barkan, E., Yakir, D., and Luz, B.: The triple isotopic composition of oxygen in leaf water, Geochim. Cosmochim. Ac., 70, 4105–4115, https://doi.org/10.1016/j.gca.2006.06.1545, 2006.
Landais, A., Lathiere, J., Barkan, E., and Luz, B.: Reconsidering the change in global biosphere productivity between the Last Glacial Maximum and present day from the triple oxygen isotopic composition of air trapped in ice cores, Global Biogeochem. Cy., 21, GB1025, https://doi.org/10.1029/2006GB002739, 2007.
Landais, A., Dreyfus, G., Capron, E., Masson-Delmotte, V., Sanchez-Goñi, M. F., Desprat, S., Hoffmann, G., Jouzel, J., Leuenberger, M., and Johnsen, S.: What drives the orbital and millennial variations of δ18Oatm?, Quaternary Sci. Rev., 29, 235–246, https://doi.org/10.1016/j.quascirev.2009.07.005, 2010.
Luz, B. and Barkan, E.: The isotopic ratios and in molecular oxygen and their significance in biogeochemistry, Geochim. Cosmochim. Ac., 69, 1099–1110, https://doi.org/10.1016/j.gca.2004.09.001, 2005.
Luz, B. and Barkan, E.: The isotopic composition of atmospheric oxygen, Global Biogeochem. Cy., 25, GB3001, https://doi.org/10.1029/2010GB003883, 2011.
Luz, B., Barkan, E., Bender, M. L., Thiemens, M. H., and Boering, K. A.: Triple-isotope composition of atmospheric oxygen as a tracer of biosphere productivity, Nature, 400, 547–550, https://doi.org/10.1038/22987, 1999.
Malaizé, B., Paillard, D., Jouzel, J., and Raynaud, D.: The Dole effect over the Last two glacial-interglacial cycles, J. Geophys. Res., 104, 14199–14208, https://doi.org/10.1029/1999JD900116, 1999.
Mehler, A.: Studies on reactions of illuminated chloroplasts: I. Mechanism of the reduction of oxygen and other hill reagents, Arch. Biochem. Biophys., 33, 65–77, 1951.
Meijer, H. A. J. and Li, W. J.: The use of electrolysis for accurate δ17O and δ18O Isotope Measurements in Water, Isot. Environ. Healt. S., 34, 349–369, https://doi.org/10.1080/10256019808234072, 1998.
Milcu, A., Allan, E., Roscher, C., Jenkins, T., Meyer, S. T., Flynn, D., Bessler, H., Buscot, F., Engels, C., Gubsch, M., König, S., Lipowsky, A., Loranger, J., Renker, C., Scherber, C., Schmid, B., Thébault, E., Wubet, T., Weisser, W. W., Scheu, S., and Eisenhauer, N.: Functionally and phylogenetically diverse plant communities key to soil biota, Ecology, 94, 1878–1885, https://doi.org/10.1890/12-1936.1, 2013.
Pack, A., Höweling, A., Hezel, D. C., Stefanak, M. T., Beck, A.-K., Peters, S. T. M., Sengupta, S., Herwartz, D., and Folco, L.: Tracing the oxygen isotope composition of the upper Earth's atmosphere using cosmic spherules, Nat. Commun, 8, 1502, https://doi.org/10.1038/ncomms15702, 2017.
Reutenauer, C., Landais, A., Blunier, T., Bréant, C., Kageyama, M., Woillez, M.-N., Risi, C., Mariotti, V., and Braconnot, P.: Quantifying molecular oxygen isotope variations during a Heinrich stadial, Clim. Past, 11, 1527–1551, https://doi.org/10.5194/cp-11-1527-2015, 2015.
Ribas-Carbo, M., Berry, J. A., Yakir, D., Giles, L., Robinson, S. A., Lennon, A. M., and Siedow, J. N.: Electron Partitioning between the Cytochrome and Alternative Pathways in Plant Mitochondria, Plant Physiol., 109, 829–837, https://doi.org/10.1104/pp.109.3.829, 1995.
Seltzer, A. M., Severinghaus, J. P., Andraski, B. J., and Stonestrom, D. A.: Steady state fractionation of heavy noble gas isotopes in a deep unsaturated zone, Water Resour. Res., 53, 2716–2732, https://doi.org/10.1002/2016WR019655, 2017.
Severinghaus, J. P., Beaudette, R., Headly, M. A., Taylor, K., and Brook, E. J.: Oxygen-18 of O2 records the impact of abrupt climate change on the terrestrial biosphere, Science, 324, 1431–1434, https://doi.org/10.1126/science.1169473, 2009.
Shackleton, N. J.: The 100,000-Year Ice-Age Cycle Identified and Found to Lag Temperature, Carbon Dioxide, and Orbital Eccentricity, Science, 289, 1897–1902, https://doi.org/10.1126/science.289.5486.1897, 2000.
Sharkey, T. D., Badger, M. R., von Caemmerer, S., and Andrews, T. J.: High Temperature Inhibition of Photosynthesis Requires Rubisco Activase for Reversibility, Trends Plant Sci., 2465–2468, https://doi.org/10.1007/978-94-011-3953-3_577, 1998.
Sharp, Z. D. and Wostbrock, J. A. G.: Standardization for the Triple Oxygen Isotope System: Waters, Silicates, Carbonates, Air, and Sulfates, Rev. Mineral. Geochem., 86, 179–196, https://doi.org/10.2138/rmg.2021.86.05, 2021.
Stevens, C. L. R., Schultz, D., Van Baalen, C., and Parker, P. L.: Oxygen isotope fractionation during photosynthesis in a blue-green and a greed alga, Plant Physiol., 56, 126–129, https://doi.org/10.1104/pp.56.1.126, 1975.
Stolper, D. A., Fischer, W. W., and Bender, M. L.: Effects of temperature and carbon source on the isotopic fractionations associated with O2 respiration for and ratios in E. coli, Geochim. Cosmochim. Ac., 240, 152–172, https://doi.org/10.1016/j.gca.2018.07.039, 2018.
Tcherkez, G. and Farquhar, G. D.: On the isotope effect associated with photosynthetic O2 production, Funct. Plant Biol., 34, 1049–1052, https://doi.org/10.1071/FP07168, 2007.
Tcherkez, G., Gauthier, P., Buckley, T. N., Bush, F. A., Barbour, M. M., Bruhn, D., Heskel, M. A., Gong, X. Y., Crous, K. Y., Griifin, K., Way, D., Turnbull, M., Adams, M. A., Atkin, O. K., Farquhar, G. D., and Cornic, G.: Leaf day respiration: low CO2 flux but high significance for metabolism and carbon balance, New Phytol., 216, 986–1001, https://doi.org/10.1111/nph.14816, 2017.
Vinogradov, A. P., Kutyurin, V. M., and Zadorozhnyi, I. K.: Isotope fractionation of atmospheric oxygen, Geochem. Int., 3, 241–253, 1959.
Wang, Y., Cheng, H., Lawrence Edwards, R., Kong, X., Shao, X., Chen, S., Wu, J., Jiang, X., Wang, X., and An, Z.: Millenial- and orbital-scale changes in the East Asian monsoon over the past 224,000 years, Nature, 451, 1090–1093, https://doi.org/10.1038/nature06692, 2008.
Wostbrock, A. G. J. and Sharp, Z. D.: Triple Oxygen Isotopes in Silica–Water and Carbonate–Water Systems, Rev. Mineral. Geochem., 86, 367–400, https://doi.org/10.2138/rmg.2021.86.11, 2021.
Yeung, L. Y., Hayles, J. A., Hu, H., Ash, J. L., and Sun, T.: Scale distortion from pressure baselines as a source of inaccuracy in triple-isotope measurements, Rapid Commun. Mass Sp., 32, 1811–1821, https://doi.org/10.1002/rcm.8247, 2018.