the Creative Commons Attribution 4.0 License.
the Creative Commons Attribution 4.0 License.
 | 24 Mar 2023
Environmental drivers of spatio-temporal dynamics in floodplain vegetation: grasslands as habitat for megafauna in Bardia National Park (Nepal)
Jitse Bijlmakers
Jasper Griffioen
Derek Karssenberg
Disturbance-dependent grasslands, often associated with hydromorphological and fire dynamics, are threatened, especially in subtropical climates. In the Nepalese and Indian Terai Arc Landscape at the foot of the Himalayas, natural and cultural grasslands serve a viable role for greater one-horned rhinoceros (Rhinoceros unicornis) and for grazers that form prey of the Royal Bengal tiger (Panthera tigris). The grasslands are vulnerable to encroachment of forest. We aimed to establish the effects of environmental drivers, in particular river discharge, river channel dynamics, precipitation and forest fires, on the spatio-temporal dynamics of these grasslands. The study area is the floodplain of the eastern branch of the Karnali River and adjacent western part of Bardia National Park. We created annual time series (1993–2019) of land cover with the use of field data, remotely sensed LANDSAT imagery and a supervised classification model. Additionally, we analysed the pattern of grassland patches and aerial photographs of 1964. Between 1964 and 2019, grassland patches decreased in abundance and size due to encroachment of forest. Outside the floodplain, conversion of grassland to bare substrate coincides with extreme precipitation events. Within the floodplain, conversion of grassland to bare substrate correlates with the magnitude of the annual peak discharge of the bifurcated Karnali River. Since 2009, however, this correlation is absent due to a shift of the main discharge channel to the western branch of the Karnali River. Consequently, alluvial tall grasslands (Saccharum spontaneum dominant) have vastly expanded between 2009 and 2019. Because the hydromorphological processes in the floodplain have become more static, other sources of disturbances – local flooding of ephemeral streams, anthropogenic maintenance, grazing and fires – are more paramount to prevent encroachment of grasslands. Altogether, our findings underscore that a change in the environmental drivers impact the surface area and heterogeneity of grassland patches in the landscape, which can lead to cascading effects for the grassland-dependent megafauna.
- Article
(12811 KB) - Full-text XML
-
Supplement
(792 KB) - BibTeX
- EndNote


Grasslands occur in diverse environmental conditions that can be dry, wet, hot, cold, productive, barren, dynamic and static (Brown and Makings, 2014). Their global areal extent has decreased by 40 % since the Industrial Era (White et al., 2000) due to cultivation, urbanization and increased forest growth, causing loss of biodiversity (White et al., 2000; Veldman et al., 2015). Grasslands are home to most of the extant mammalian megafauna on Earth and provide food for herbivores, which in turn sustain their predators. This is for example the case in the African (sub)tropical grasslands and in the mountainous and colder grassland habitats in Mongolia and Nepal. Here, grassland-dependent blue sheep (Pseudois nayaur), Siberian ibex (Capra sibirica) and Tibetan argali (Ovis ammon) serve as principle prey species of the snow leopard (Panthera unica) and Himalayan wolf (Canis lupus chanco) (Oli, 1996; Lyngdoh et al., 2014; Chetri et al., 2017; Rovero et al., 2020; Filla et al., 2021). At the foot of mountain ranges, warmer and wetter conditions are present due to lower altitudes and orographic lift of seasonal moist winds, causing the constraints for forest growth to be lifted (Staver et al., 2011; Hirota et al., 2011). The relationship between prey, predator and grassland habitat is also present in these regions more suited for forest growth: grassland patches in forests at the foot of mountainous regions in South Asia sustain Royal Bengal tigers (Panthera tigris) and their prey. This is for example the case in the Western Ghats, southern India (Sankaran, 2009), in the Duars, eastern India and Bhutan, and in the Terai Arc Landscape (TAL), a subtropical belt at the foot of the Indian and Nepalese Himalayas (Harihar et al., 2014, Irengbam et al., 2017). The TAL has also seen a reduction of grassland in protected areas (DNPWC, 2016).
Grasslands in the TAL can broadly be subdivided into (1) natural alluvial tall grassland, located near active and in abandoned river channels, and (2) a mosaic of short grassland (phantas) and mixed tall grassland, located further away from the river channels. The alluvial tall grasslands serve as essential habitat for the greater one-horned rhino (Rhinoceros unicornis) and hog deer (Hyelaphus porcinus) (Jnawali and Wegge, 2000; Odden et al., 2005; Pradhan et al., 2008; Thapa et al., 2013; DNPWC and DFSC, 2018), and their numbers would be greatly affected if changes occur in composition and areal extent of these grasslands (Peet, 1997; Odden et al., 2005). Tiger density is highest near grasslands and the short grasslands in particular provide nutritious feeding grounds for chital deer (Axis axis), their most important prey (DNPWC and DFSC, 2018). In addition to the surface area, the spatial pattern of grassland in the landscape is of importance: habitat heterogeneity is positively correlated with the abundance and habitat preference of chital deer in Chitwan National Park (Nepal) (Bhattarai and Kindlmann, 2012).
A number of grasslands in the TAL are considered to be maintained via physical disturbances that prevent succession to mature vegetational stages (Seidensticker, 1976; Dinerstein, 1979a; Lehmkuhl, 1989, 1994; Peet et al., 1999b). In general, the pattern of vegetation is regulated by autogenic and allogenic factors (Tilman, 1988), of which the latter are either environmental or anthropogenic. Allogenically, the community dynamics can be controlled via disturbances, of which the intensity and spatial extent have been identified as principal factors (Turner et al., 1998). The natural disturbances recorded in the TAL include hydromorphological processes, fires, climatic variables (precipitation, temperature, droughts) and herbivory, whereas the anthropogenic disturbances include cutting of grasses and trees for maintenance and resource collection, clearance by fires, livestock grazing, and, in the past, cultivation and creation of settlements (Seidensticker, 1976; Dinerstein, 1979a; Lehmkuhl, 1989, 1994). Changes in disturbance regimes impact other disturbance regimes (Van Langevelde et al., 2003; Trauernicht et al., 2013; Orem and Pelletier, 2015), the vegetation pattern and thus the ecosystem as a whole (Parr et al., 2012). Conversion of disturbance-dependent grassland to forest can occur within several years when changes occur in rainfall, fire or herbivory (Bond, 2008). In Bardia National Park (BNP), a conservation area in the TAL located near the Karnali megafan in western Nepal, grasslands have been declining due to encroachment of forest (Peet et al., 1999a; Jnawali and Wegge, 2000; Odden, 2007). From a hydrological perspective, there are indications that a major change occurred during the monsoon in 2009 (Sinclair et al., 2017): near the apex of the highly dynamic braided river system of the Karnali River, the dominant discharge channel relocated from its eastern branch (the Geruwa River that borders BNP) to the western branch (Kauriala River). The susceptibility of land cover to changes in disturbance regimes not only holds for the grasslands in the TAL but also for other ecosystems where climate is conducive to forest growth. In the Brazilian Pantanal, where similar grasslands are found at the foot of the Brazilian Highlands, extreme hydrologic conditions have been explicitly identified with remote sensing as a driving factor of the pattern of vegetation communities (Arieira et al., 2011). The Taquari megafan in the Pantanal experienced a shift in hydrological conditions due to an avulsion, increasing susceptibility to deforestation and fire (Louzada et al., 2020).
Wide-ranging progress has been made in understanding the drivers of vegetation dynamics through space and time (Hupp and Osterkamp, 1996; Lorenz et al., 1997; Turner et al., 1998; Corenblit et al., 2007; Vesipa et al., 2017). The composition and spatial distribution of riparian vegetation communities are heavily influenced by flood frequency, duration, intensity (Hupp and Osterkamp, 1996; Poff et al., 1997) and timing (Newbold and Mountford, 1997). Consequences of high discharges for vegetation can be physical damage and uprooting, anoxia due to prolonged inundation and burial by fresh alluvium. Low discharges affect vegetation with drought stress when the ground water table becomes too deep. These processes are integrated in concepts such as “fluvial biogeomorphic succession”, describing the reciprocal interactions between fluvial landforms and vegetation (Gunderson, 2002; Corenblit et al., 2007), “flood pulse concept”, describing lateral connectivity and recognizing that flow and its variability are the main drivers of ecological processes in floodplains (FPs, Junk et al., 1989), and “shifting-mosaic steady state” for vegetation, which specifies the proportion of distinct successional land cover in floodplains (Arscott et al., 2002; Kollmann et al., 1999). Additionally, fire dynamics (Flannigan and Wotton, 2001; Hoetzel et al., 2013; Iglesias et al., 2014), herbivory (Owen-Smith, 1988; Van Langevelde et al., 2003; Allred et al., 2011) and anthropogenic interferences (Wang et al., 2015) have been studied. The interrelations of environmental drivers are complex (Lehmann et al., 2014), and there is not yet a complete understanding. It is, therefore, of interest to study vegetation and its drivers at a high temporal resolution over a long time span and in its historic context. Literature in this domain is particularly limited to a small number of geographic regions (Dufour et al., 2019), and the subtropical grasslands in conservation areas in the TAL such as BNP are underrepresented. It is especially vital to understand the functioning of such a valuable ecosystem in relation to possible changes in drivers (such as the indicated redistribution of discharge in 2009) in order to provide insight for nature management strategies.
A promising method for studying land cover dynamics and its drivers is the use of Earth observation techniques, which enable diachronic analysis (Lallias-Tacon et al., 2017; Dufour et al., 2019; Harezlak et al., 2020; Solins et al., 2017; Basumatary et al., 2021; Louzada et al., 2020; Van Iersel, 2020; Corenblit et al., 2010; Dufour et al., 2015). Vegetation in and near floodplains can be mapped at the following scales and characteristics: type (Alaibakhsh et al., 2017), species composition (Rapinel et al., 2019; Plakman et al., 2020), physiology (Wagner-Lücker et al., 2013) and structure (Straatsma and Baptist, 2008; Jalonen et al., 2015). Regionally, remote sensing has been successfully used to monitor similar grasslands (Sarma et al, 2008; Biswas, 2010; Thapa, 2011), fires (Takahata et al., 2010; Ghimire et al., 2014) and channel migration of the Karnali River (Rakhal et al., 2021).
We aim to quantify spatio-temporal land cover change and establish relationships with the environmental drivers with focus on the ecologically important grasslands. We address both grasslands within the floodplain of the Geruwa River (the eastern branch of the Karnali River) and the grassland patches further away. Specifically, we give answers to the following sub-questions: (a) what is the spatio-temporal pattern of land cover, (b) what is the spatio-temporal variation in environmental drivers during the last 3 decades, and (c) what are the effects of environmental drivers on land cover change and what are possible mechanisms that explain these effects? We do so by mapping the historic development including recent annual dynamics of land cover with the use of field and remotely sensed data (LANDSAT). We then relate the land cover dynamics to abrupt changes in hydrological, meteorological and forest fire variables. The hypothesis is that between 1964 and 2019 a transition occurred from grasslands to later successional stages. The discharge distribution during peak discharges at the upstream bifurcation of the Karnali River would be a relevant driver for the vegetation pattern and associated habitats of megafauna.
2.1 Bardia National Park and Karnali River
Bardia National Park is located in the southwest of Nepal (Fig. 1) and was established as conservation area on 8 March 1976. The study area (135 km2 of the now in total 968 km2 of BNP) is delimited by (1) the Siwalik Hills in the north, where ephemeral streams originate that are tributaries to the Karnali River, (2) a buffer zone and settlements in the southeast, and (3) the Geruwa Branch of the Karnali River in the west, which is a highly dynamic braided river system (Sinclair et al., 2017) located on the Karnali megafan (USAID, 2018). The Karnali River rises from Mt. Kailash on the Tibetan Plateau as one of the three biggest rivers draining Nepal. A few kilometres south of the Siwalik Hills near the town of Chisapani (Fig. 1), the Karnali River bifurcates into the Geruwa River (eastern branch) and Kauriala River (western branch), joining together in India as a tributary to the Ganges River. The subtropical climate in the region encompasses the monsoon, cool and dry post-monsoon, and a hot and dry pre-monsoon (USAID, 2018). Temperatures reach a maximum of 45 ∘C in the hot season and fall to 10 ∘C in January (Bolton, 1976). The mean annual precipitation is 1560 mm (DHM, 2017).
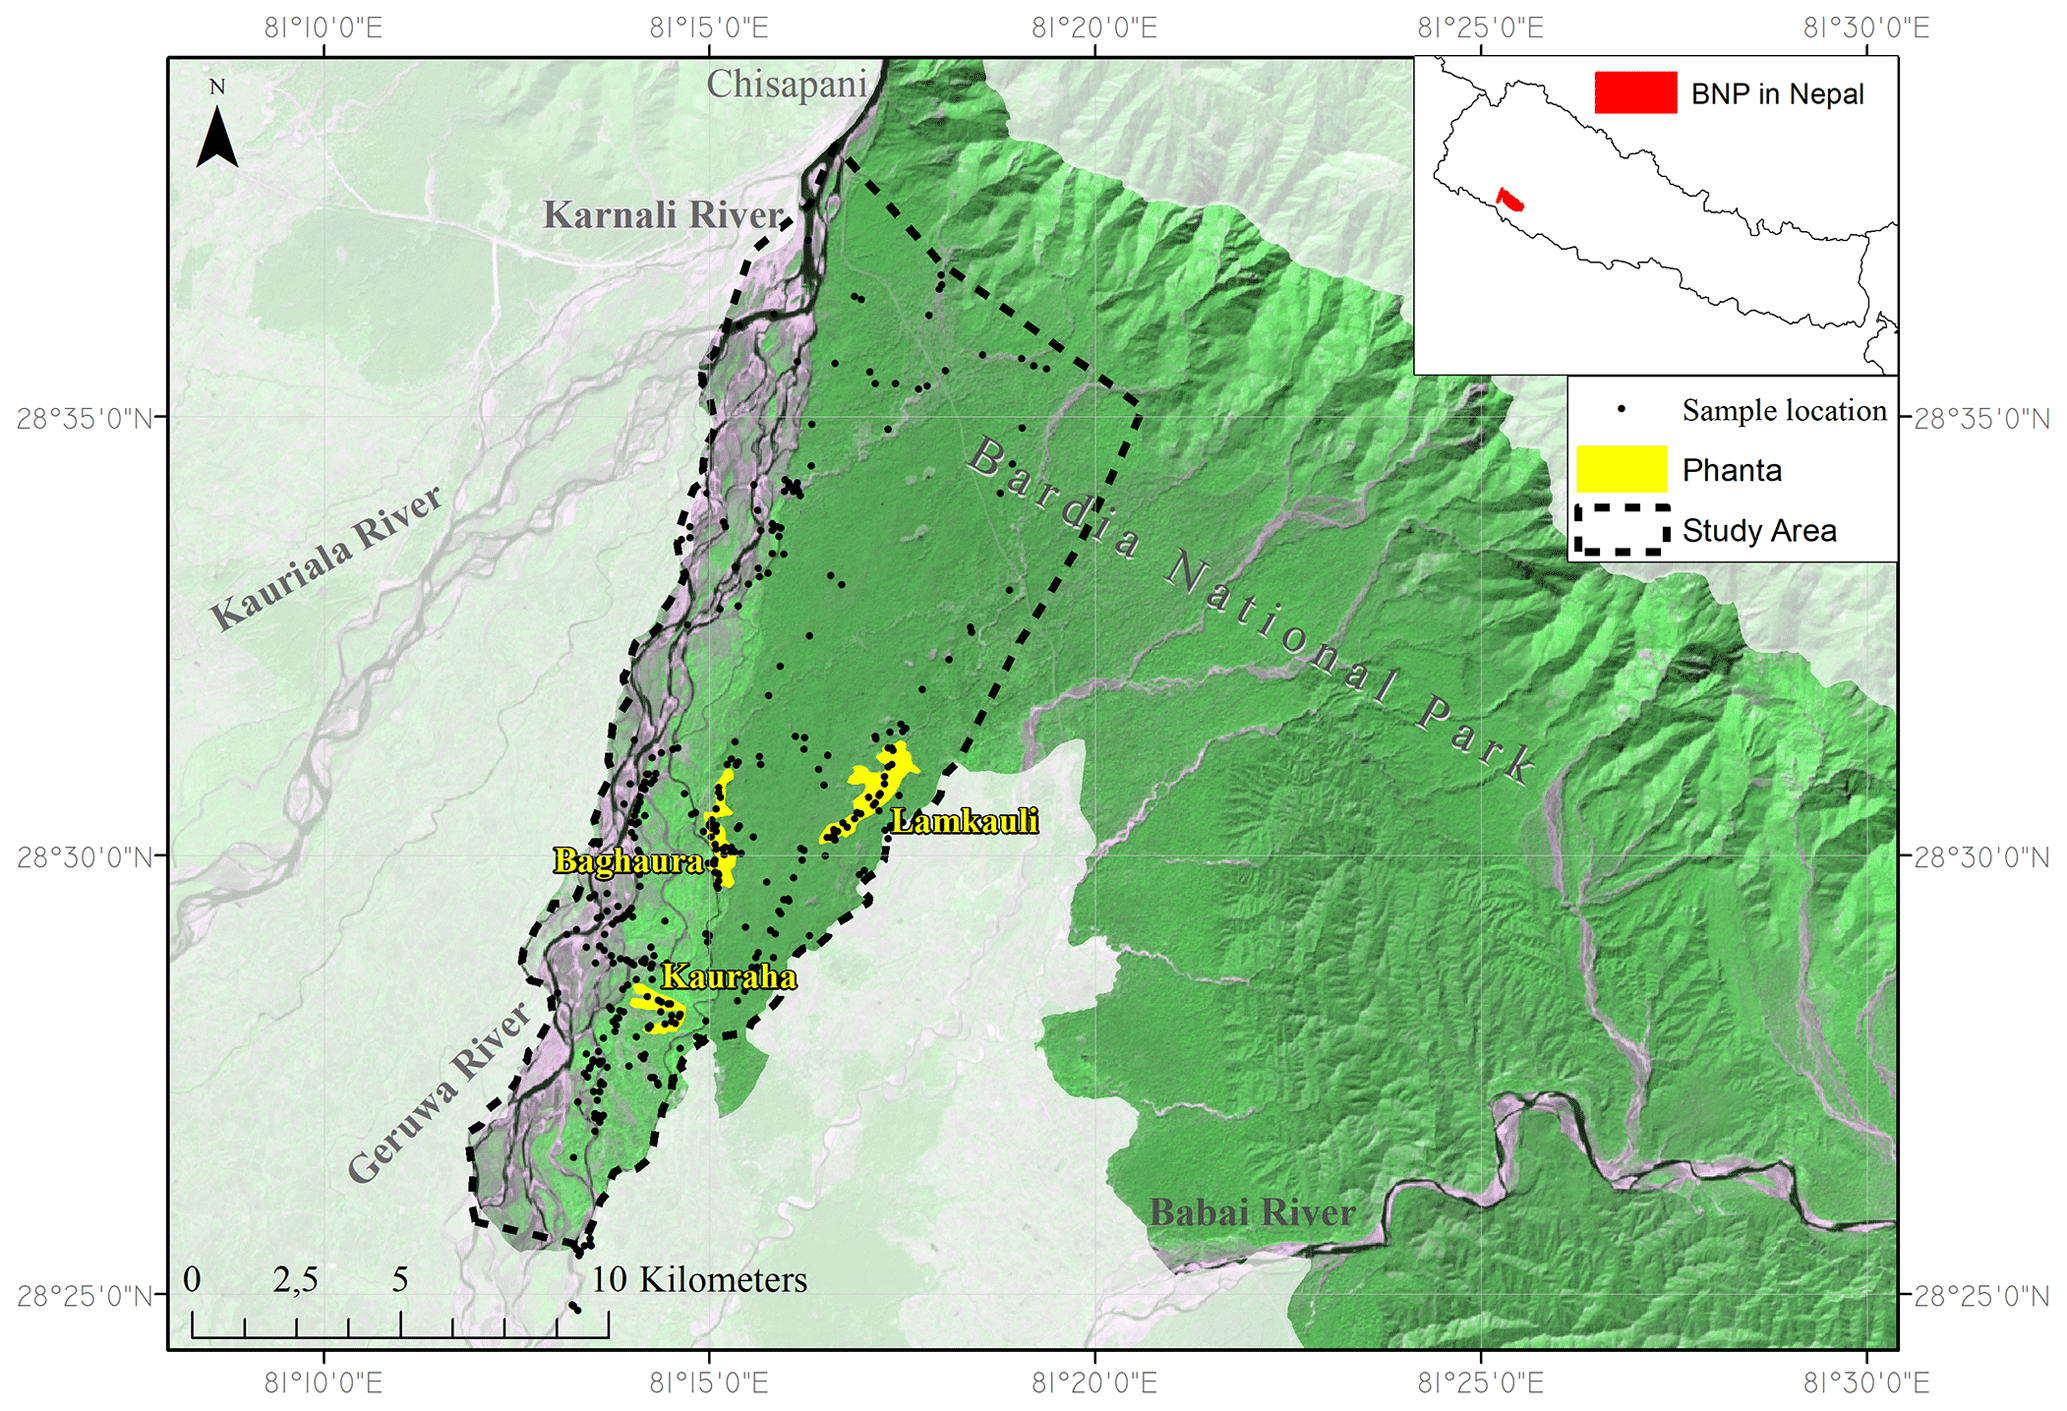
Figure 1Delineation of Bardia National Park (dark green) and the study area (red) in and near the floodplain of the Karnali River. The megafan of the Karnali River lies between the two branches (the Kauriala and the Geruwa River) at the west side of Bardia National Park. This is a false colour composite (RGB = 656 of LANDSAT 8 imagery, 2020).
2.2 Drivers of grasslands in the Terai Arc Landscape and Bardia NP
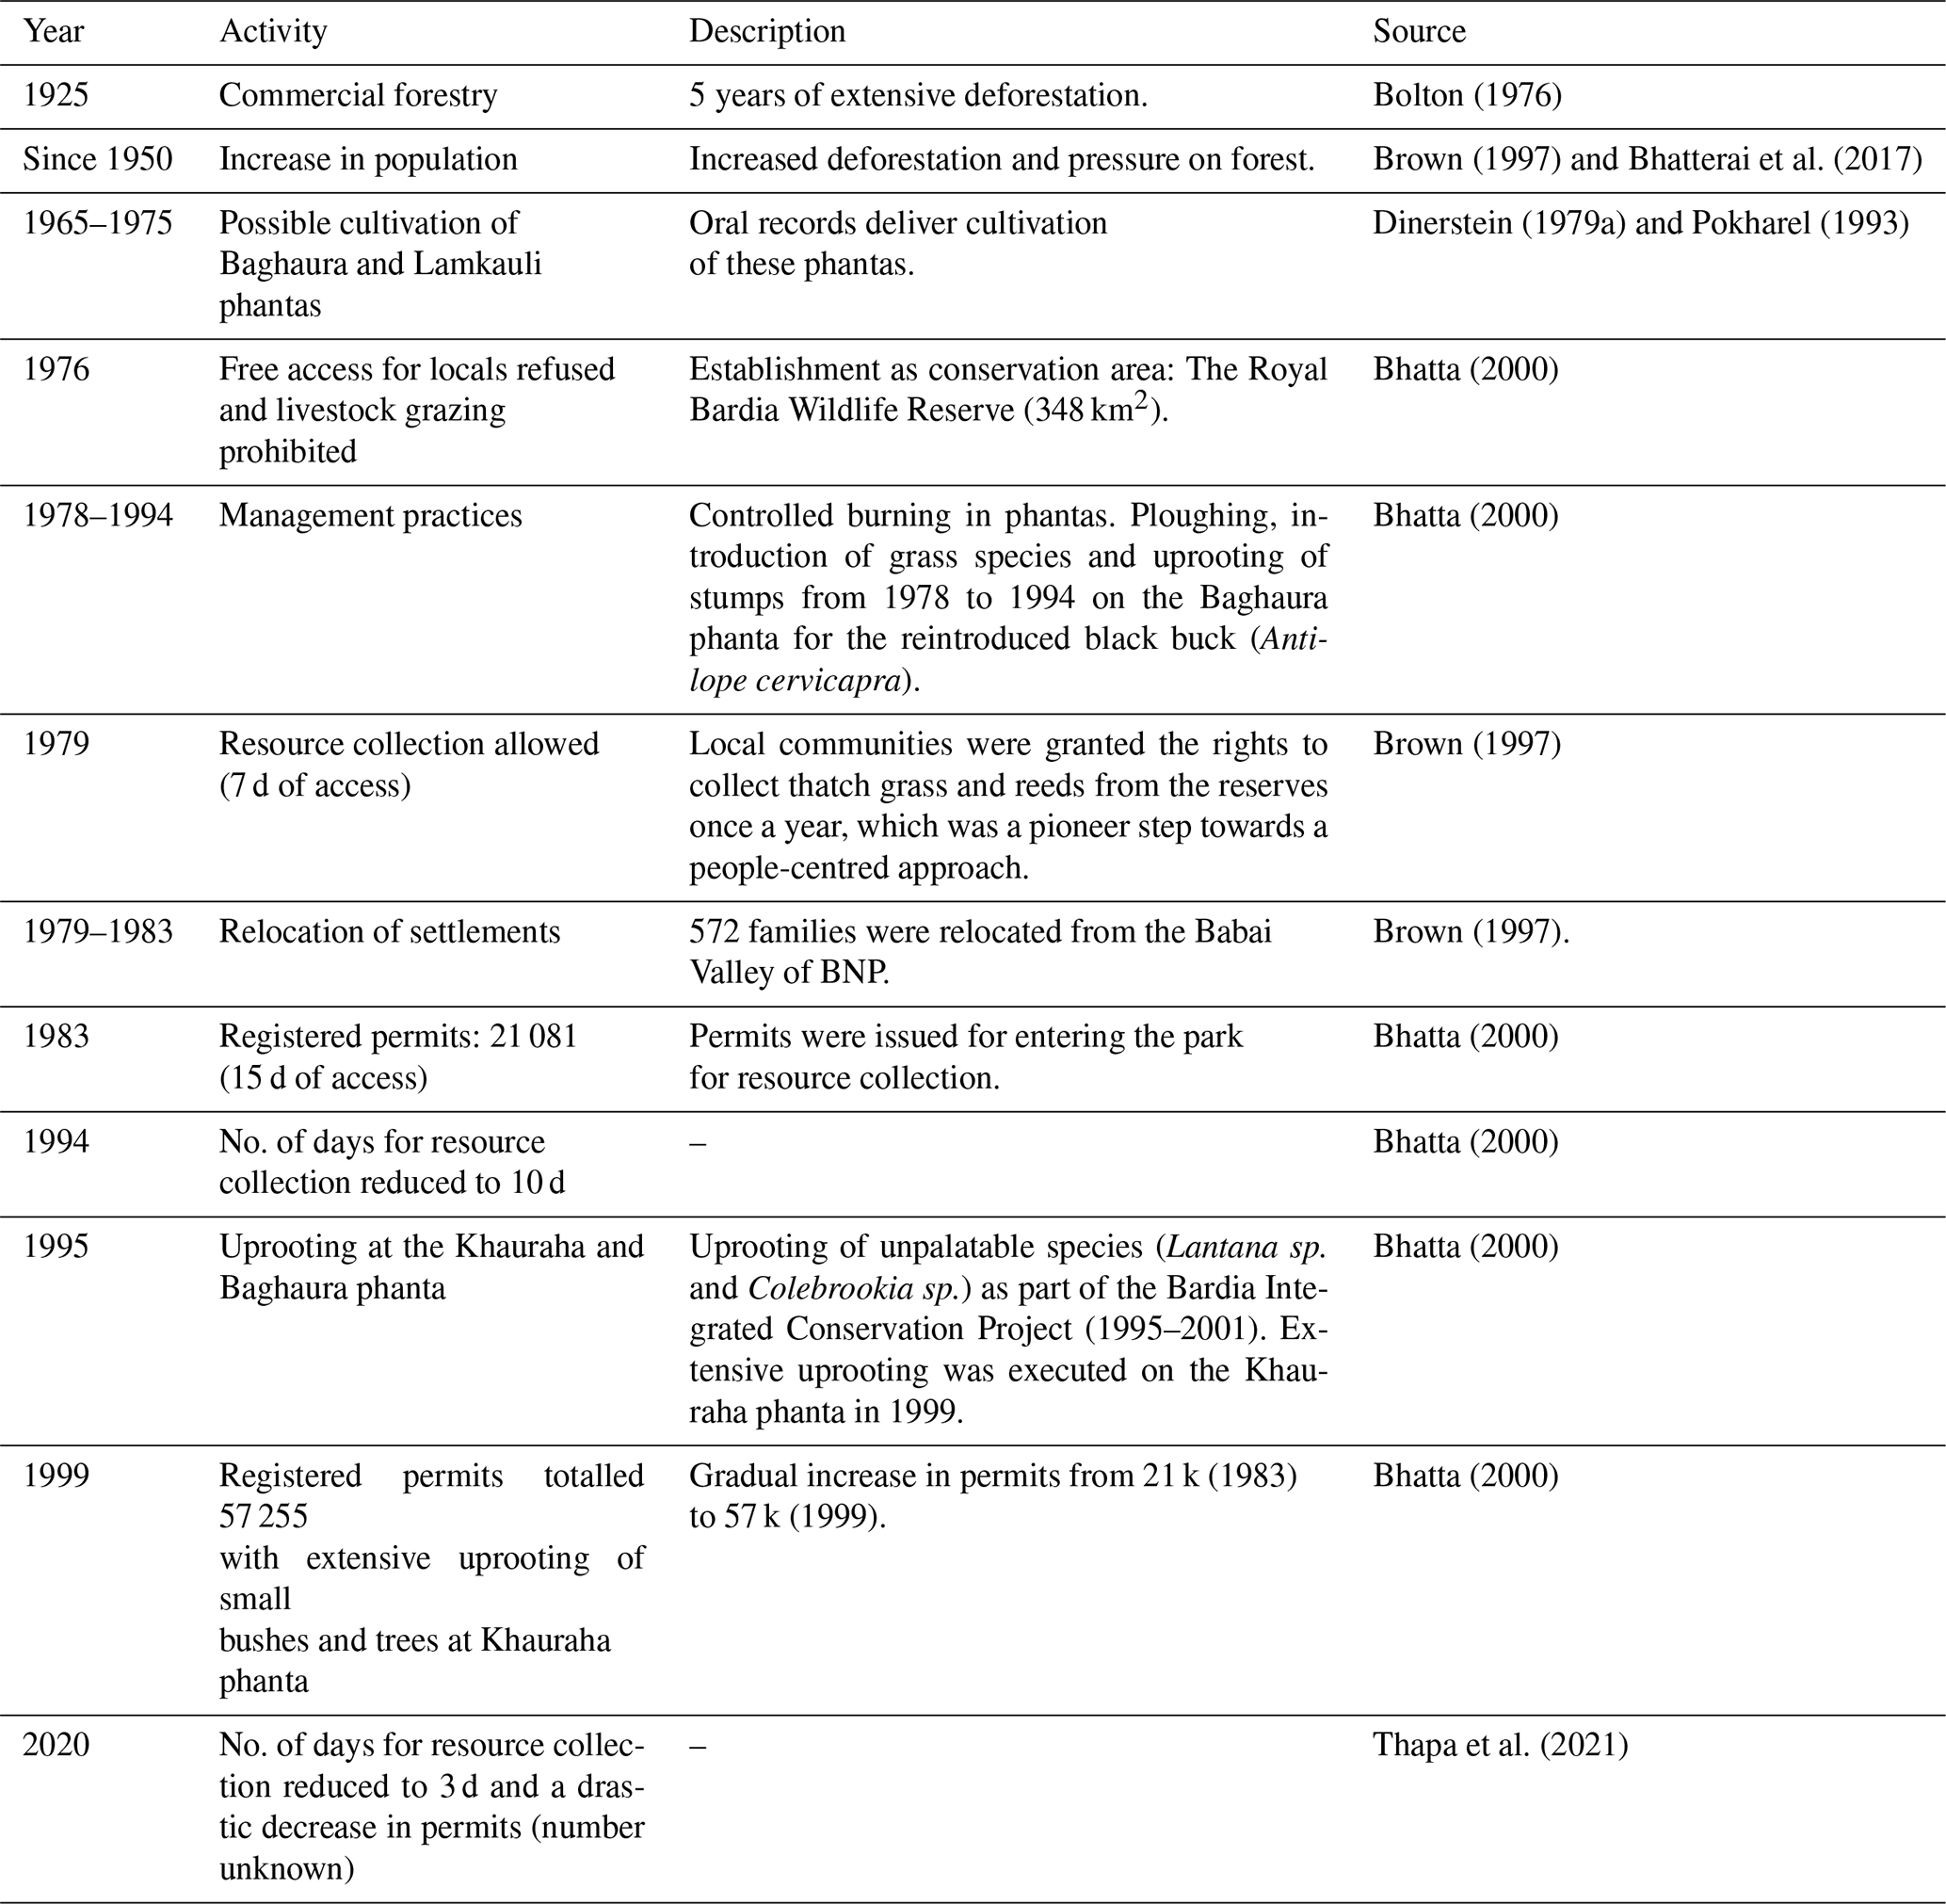
Drivers in the form of physical disturbances vary in type, temporal components (frequency, duration, and timing), their spatial component (location, extent) and their intensity (White, 1985; Turner et al., 1998). In the TAL, both natural and anthropogenic disturbances are regarded as important drivers for grasslands in shaping the spatial and temporal patterns of vegetation. In BNP, fluvial processes are regarded as being important at the landscape level. Flooding of the Karnali River and associated clearance of vegetation, together with deposition of fresh alluvium, have been observed (Seidensticker, 1976; Dinerstein, 1979a; Lehmkuhl, 1989, 1994; Peet et al., 1999b). Fires occur in BNP on a yearly basis and can be natural as well as anthropogenic. Forest fires occur most frequently in the Sal forest (Shorea robusta dominated) and in the months April and May (Ghimire et al., 2014). The phantas are annually set on fire by park staff (Dinerstein, 1979b; Peet, 1997). Appendix A provides an overview from the literature of the activities by locals and park staff (see also Bhatta, 2000; Thing et al., 2017). After establishment as a conservation area in 1976, free access for locals, who extensively relied on BNP for resources, was refused. Later on, active habitat management was initiated on grasslands to compensate for the decreased disturbances. Permits that allow resource collection are needed for locals to enter the park for a certain number of days. Since 1983, the days of access and the number of permits issued increased until 1994 and 1999, respectively, and hereafter decreased drastically (Bolton, 1976; Bhatta, 2000). Whether the amount of permits in a given year and the days of access are proportional to the amount of removed biomass is not known (Bhatta, 2000). Before and around 1976, extensive grazing was recorded by cattle and wild ungulates in the southwest of the study area. The very short grazing lawns that are present in BNP are a result from patch-selective grazing by ungulates after cutting or burning (Thapa et al., 2021). Large herbivores can strongly influence the pattern and community structure of vegetation (Owen-Smith, 1988; Dinerstein, 1992). In the park, Asian elephant (Elephas maximus) (Ram and Acharya, 2020; Shrestha and Shrestha, 2021) and greater one-horned rhinoceros (rhino census in 2021) were virtually absent, but their numbers increased to 113 and 38 in 2021, respectively. Ungulates have been censused a number of times in BNP (Dinerstein, 1980; Wegge and Storaas, 2009; Dhakal et al., 2014; Karki et al., 2016; Kral et al., 2017; DNPWC and DFSC, 2018, 2022). Some uncertainty is present around the numbers of ungulates, which have been debated in the literature (van Lunenburg et al., 2017; Wegge et al., 2019). In BNP, the recorded densities of chital deer (the most abundant mid-sized grazer) are 53.99 (standard error, SE, 10.29) (Dhakal et al., 2014), 29.3 (SE 4.3) (Karki et al., 2016), 56.44 (SE 5.75) (DNPWC and DFSC, 2018) and 44.05 (SE 6.3) (DNPWC and DFSC, 2022).
2.3 Vegetation types and successional stages
Dinerstein (1979a) described six major vegetation types in the park, later modified into seven types (Jnawali and Wegge, 1993; Pokheral, 1993): alluvial tall grasslands (Saccharum spontaneum dominant), mixed tall grasslands (wooded grasslands), short grasslands (<2 m, previously cultivated fields or “phantas”), khair–sissoo forest, moist riverine forest, mixed hardwood forest and Sal forest. More detailed grassland associations are clarified in Appendix B (Lehmkuhl, 1989, 1994; Peet et al., 1999a; Dinerstein, 1979a). The alluvial tall grasslands, which can be up to 4 m in height, consist of pioneer species that quickly cover bare alluvium after disturbance events. With no disturbances present, the line of succession is from alluvial tall grasslands via khair–sissoo forest to other riverine forest types, mixed hardwood forest or the climax Sal forest. Khair–sissoo forest is prevalent along the river courses and on floodplain islands in the Terai due to its ability to withstand floods. Sal forest consists of predominantly Shorea robusta trees that are fire resistant and is the most dominant tree species in BNP. Disturbances prevent succession of alluvial grasslands to forest, turning them into mixed tall grasslands. If disturbances continue, short (<2 m) and open grasslands may appear (locally called “phantas”), and their location is often more distal from stream channels (Dinerstein, 1979a; Lehmkuhl, 2000). A number of these grasslands are considered to owe their existence to human interferences, such as the Lamkauli, Baghaura and Khauraha phantas (Fig. 1) (Pokheral, 1993; Dinerstein, 1979b; Peet et al., 1999a). The largest phantas present are Lamkauli, Baghaura and Khauraha (Fig. 1). Nowadays, the phantas are predominantly vegetated with Imperator cylindrica, Vitiveria zizanioides and Desmostachyia bipinnata (Peet et al., 1999b). Within the mosaic of short and mixed tall grasslands, very short grazing lawns are present (Thapa et al., 2021). In the mixed tall grasslands (>2 m) the Narenga porphyrocoma and Erianthus ravennae species are abundant and these grasslands are considered to lie on a continuum with the short grasslands (Peet et al., 1999b).
3.1 Outline of approach
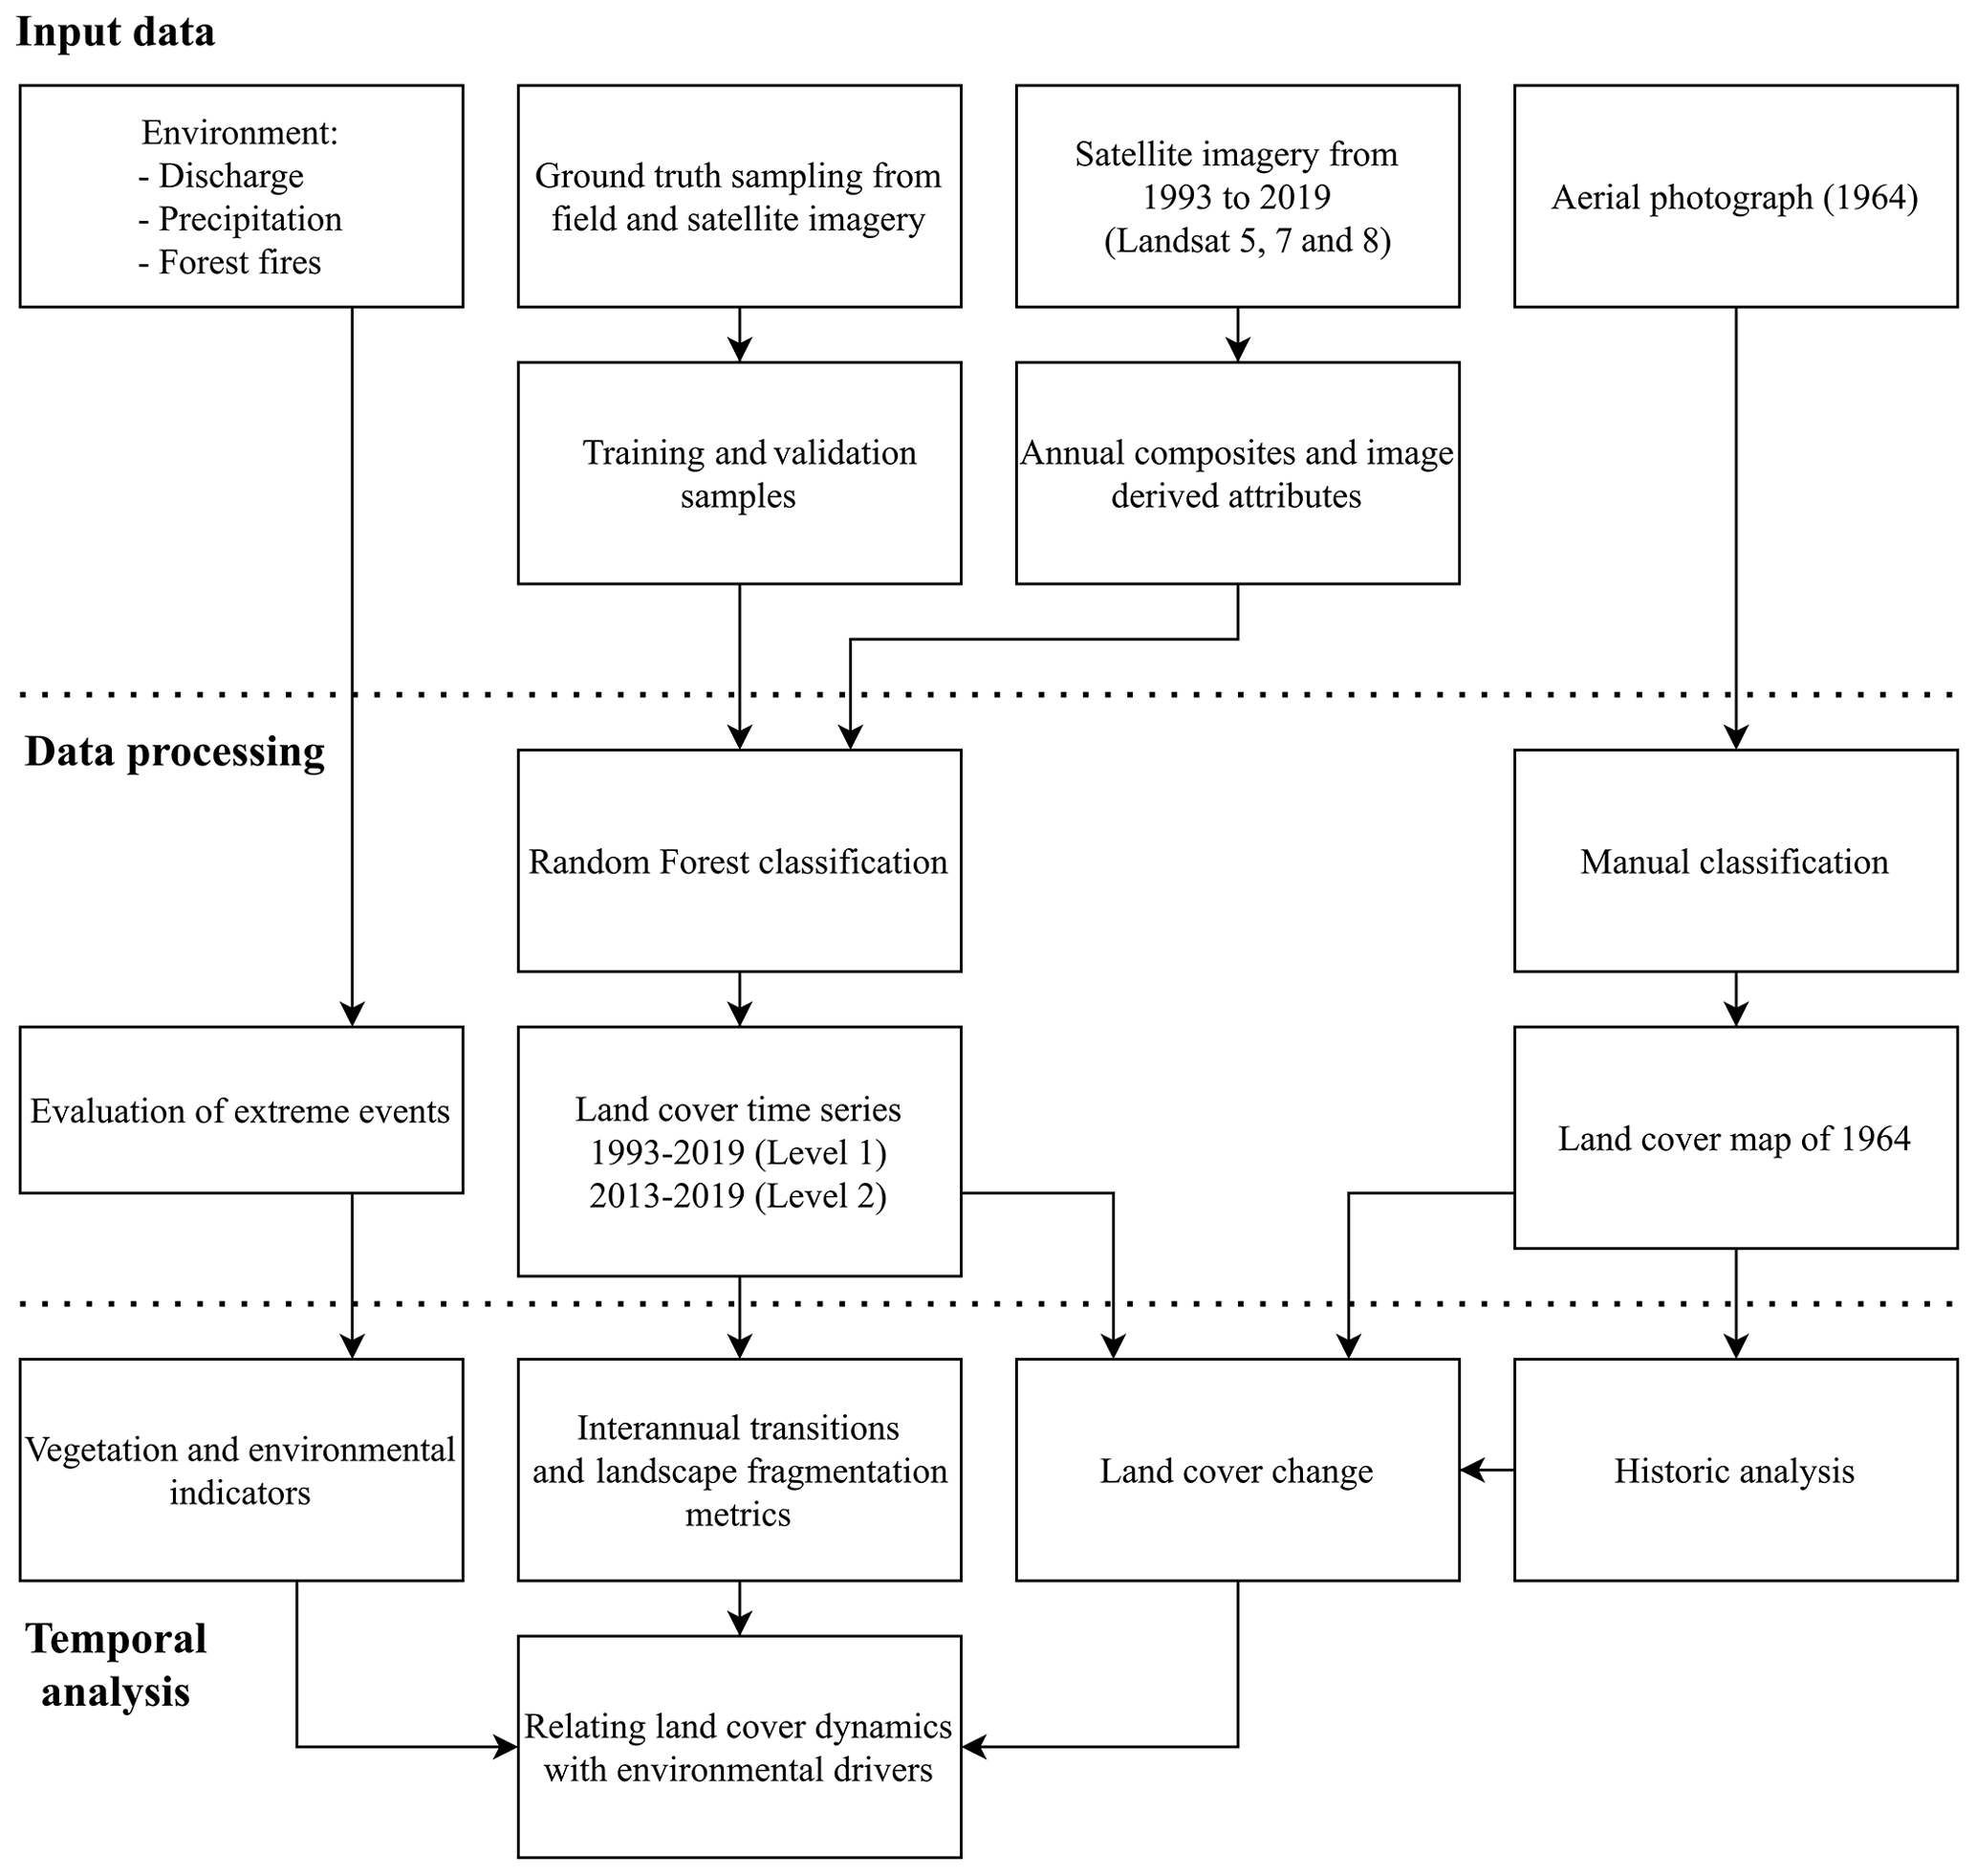
Figure 2 provides a flow chart of the methodology. We used topographic maps (1927, 1984) and aerial imagery of 1964 to assess the historic development of vegetation in the park and used LANDSAT imagery for reconstruction of annual land cover maps between 1993 and 2019. During the post-monsoon of 2019, BNP was visited to collect ground truth data of vegetation types. This dataset was used for supervised classification of land cover using a random forest model. From this time series, the areal extent, transitions and pattern of land cover were calculated. These results were related to environmental variables (precipitation, discharge, fire occurrences) to provide insight into the dynamics of land cover and the response to variation in environmental variables.
3.2 Satellite imagery and aerial photographs
To establish a time series of yearly land cover, we selected imagery of the Surface Reflectance dataset (Tier 1) of the LANDSAT 5, 7 and 8 satellites between 1993 and 2019. This imagery has a resolution of 30 m, and the full pre-processing of the images is elaborated in Appendix B. The composites of 1995, 1997 and 2006 were not classified. Too few images of sufficient quality were available for 1995 and 1997, and a too large number of erroneous pixel values in the image composite was observed for 2006, caused by the LANDSAT 7 Scan-line error. For each year we calculated Normalized Difference Vegetation Index (NDVI) (Rouse et al., 1974; Rock et al., 1986; Myneni et al., 1995; Beeri et al., 2007), Normalized Difference Drought Index (NDDI) (Gu et al., 2007; Biswas, 2010) and tasselled cap transformations (Crist and Cicone, 1984). We also included seasonal information by forming seasonal composites and a harmonic trend analysis of NDVI. In addition, aerial photographs from 1964 were obtained from the Forest Research and Training Centre, Ministry of Forests and Environment, Kathmandu. The individual photographs were combined, and a point cloud was generated, followed by an orthomosaic with a resolution of 2–3 m (Fig. S1). The resulting orthomosaic was resampled to a resolution of 30 m to enable comparison with the annual land cover time series.
Table 1Datasets of the environmental drivers (a, b) and land cover dynamics (c), the derived metrics, and their time span.
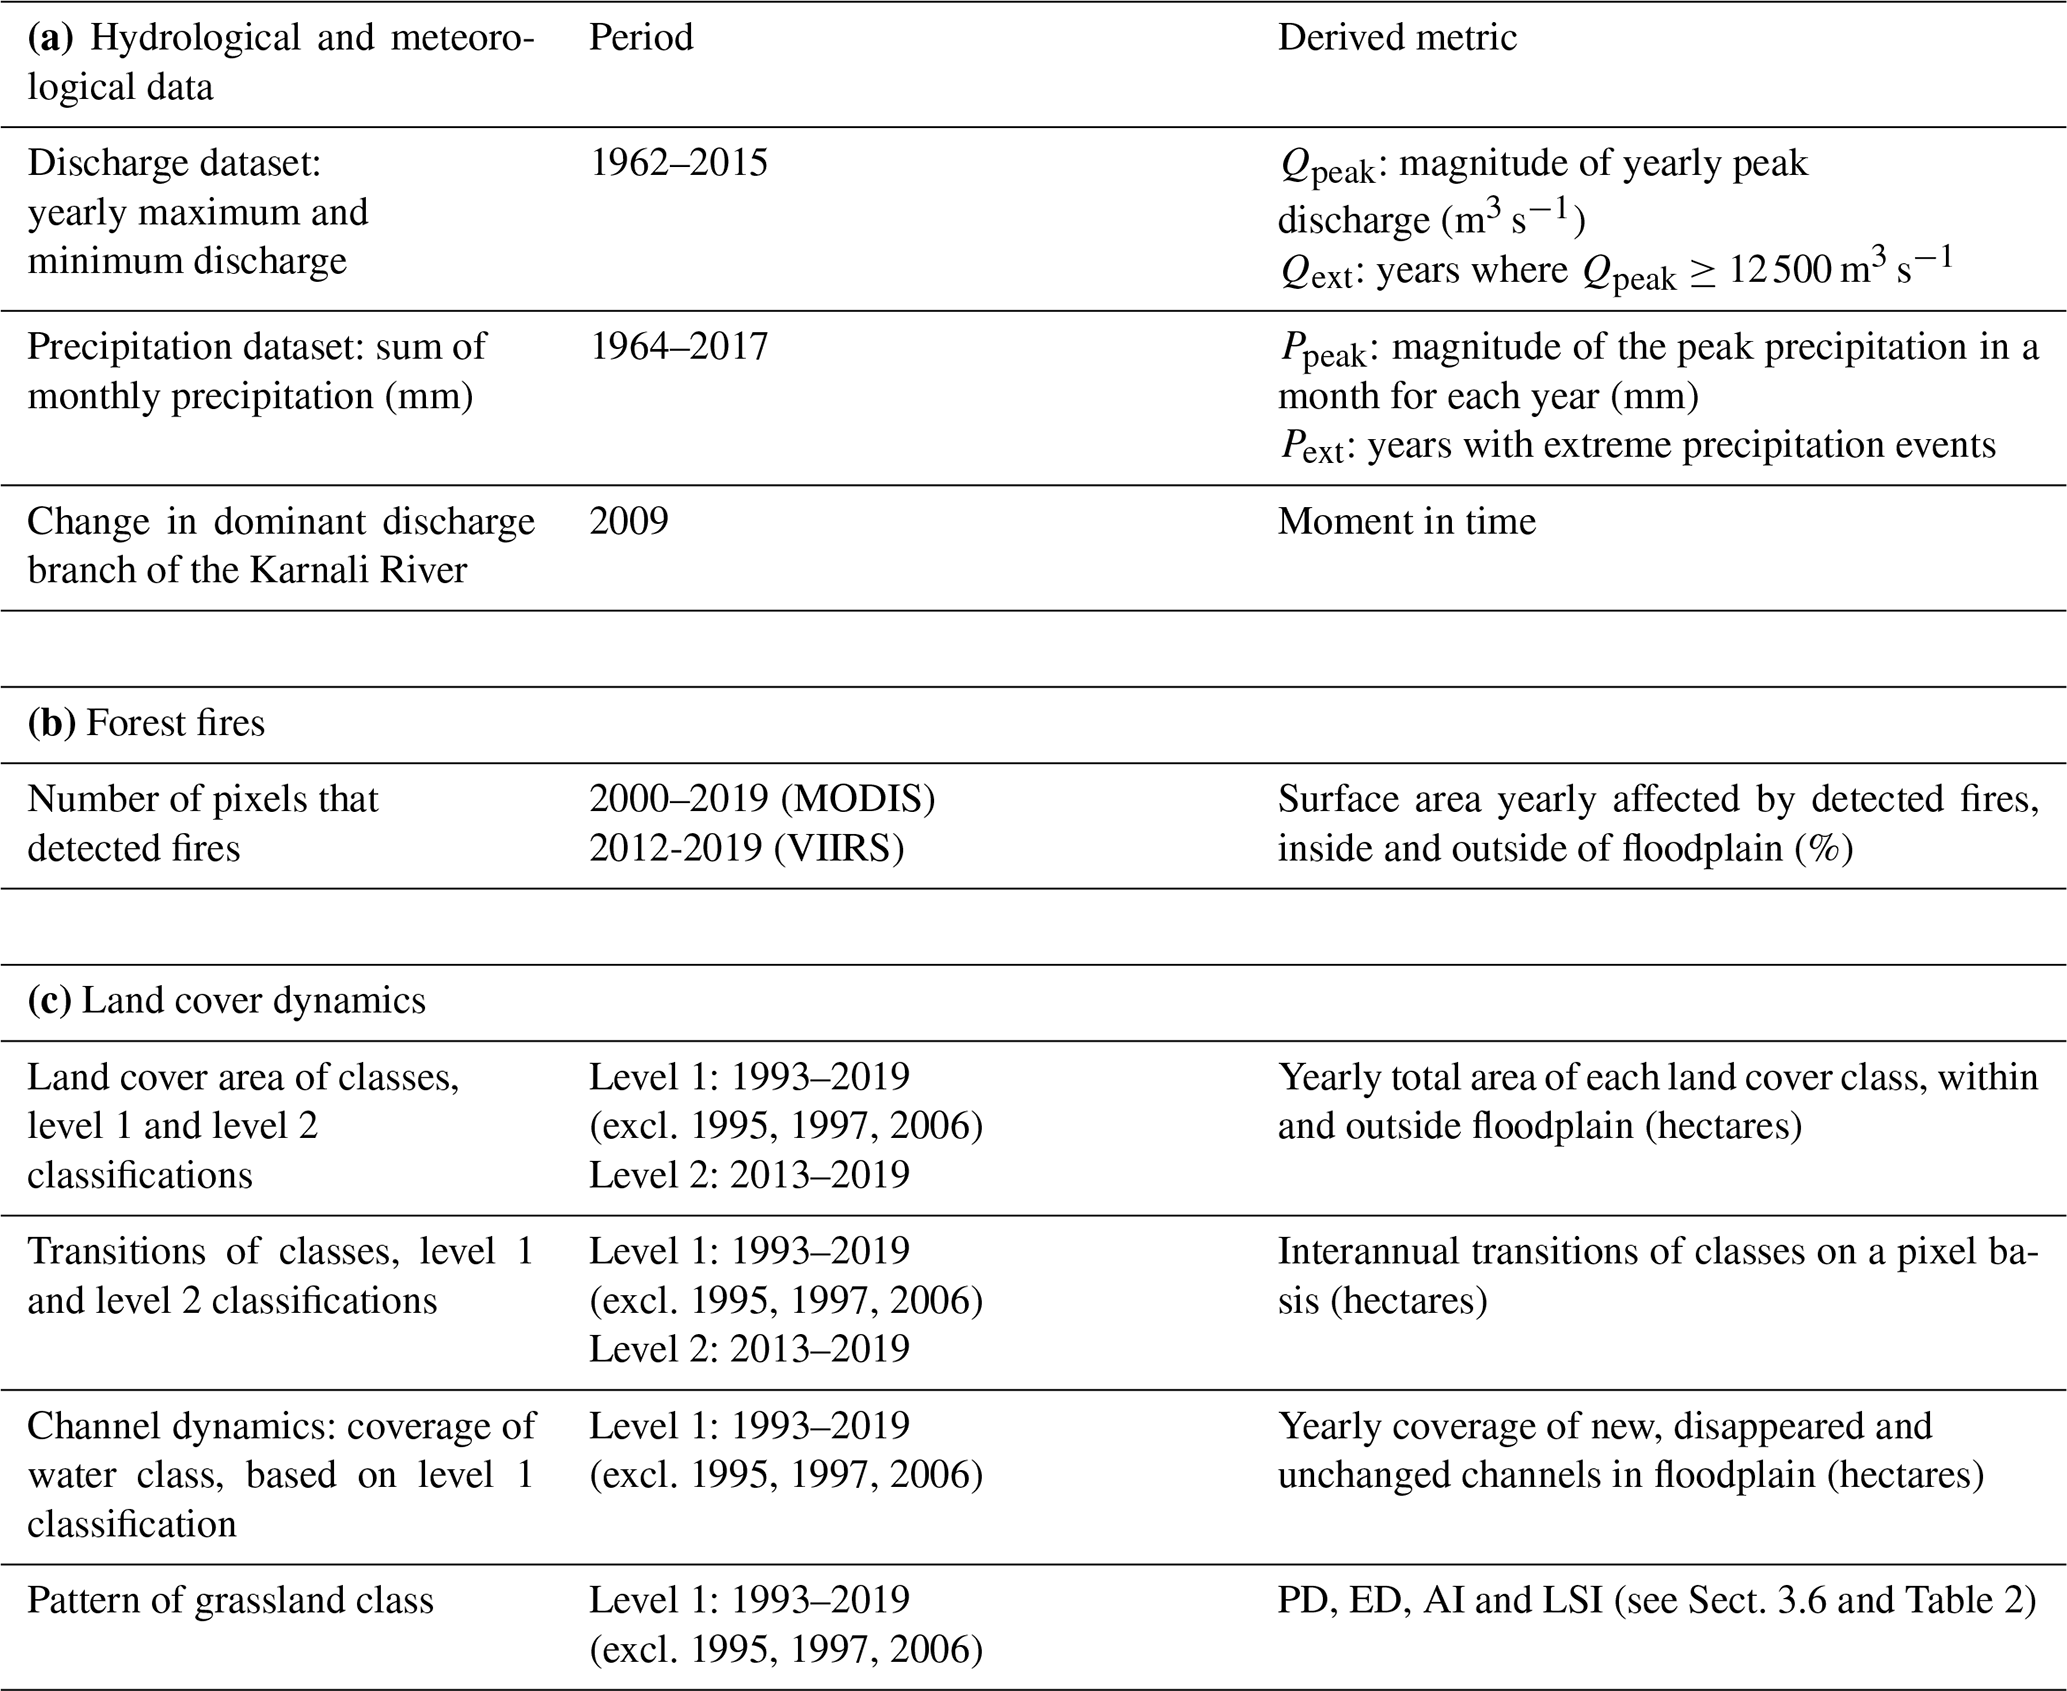
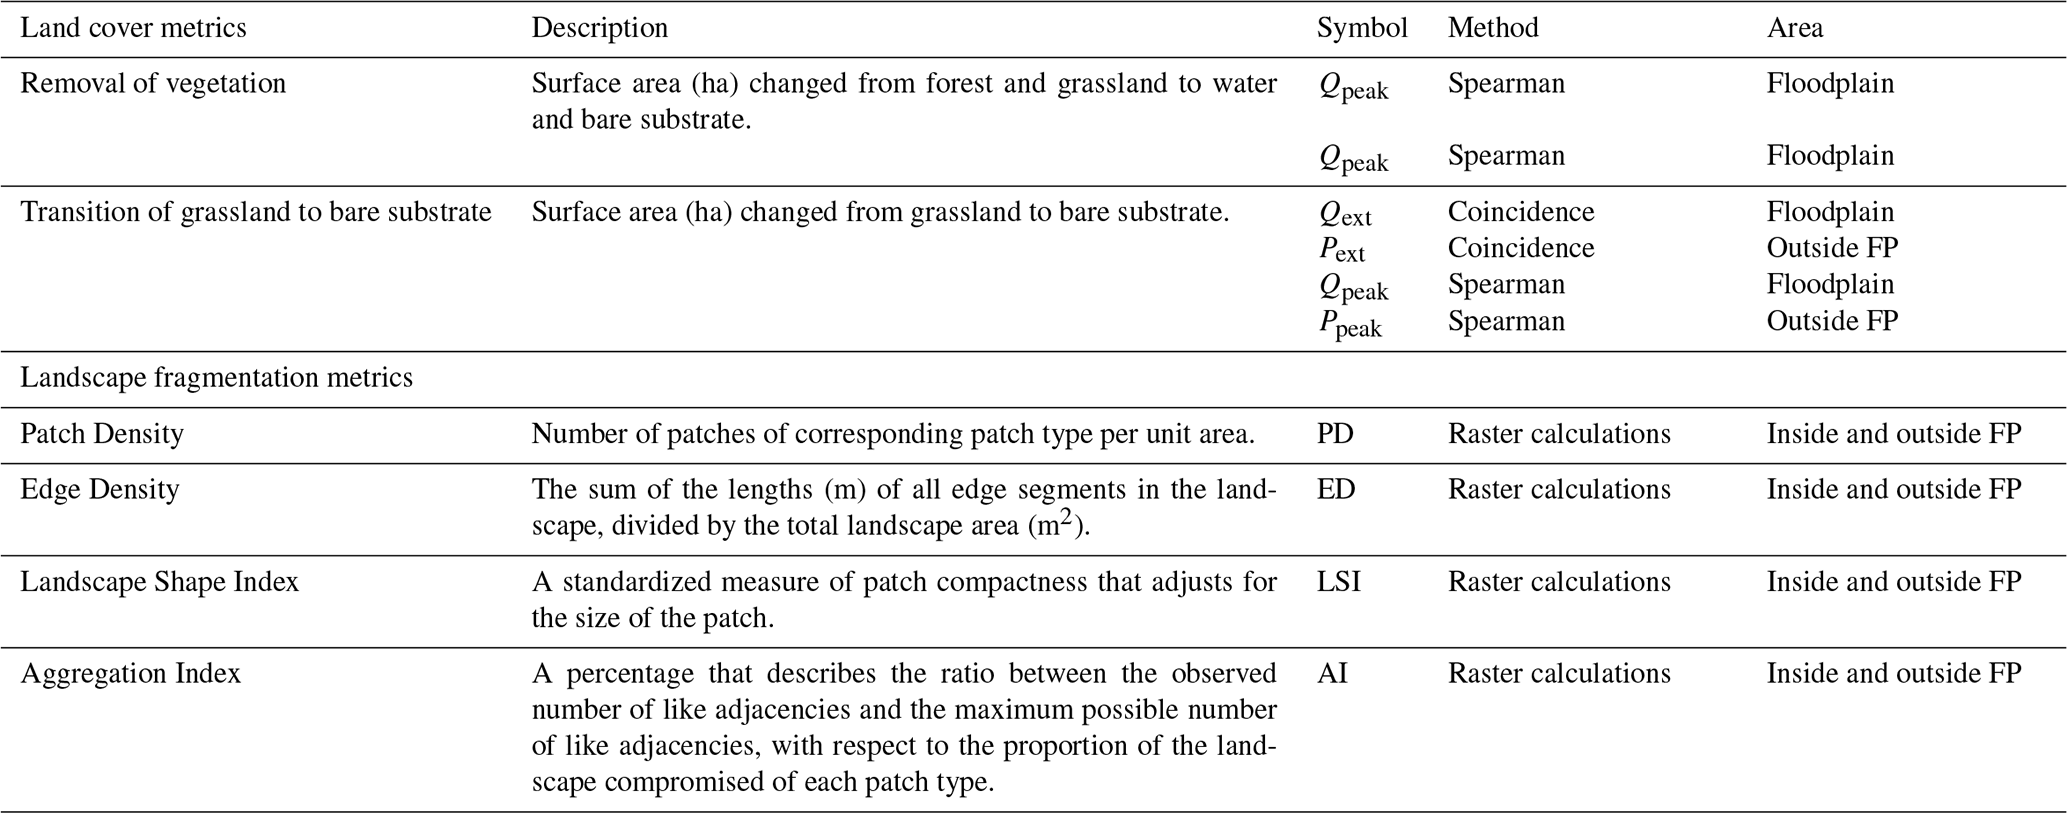
Table 2The metrics that are used for establishing effects of drivers on land cover dynamics, including the method and the part of the study area that is considered, and fragmentation metrics used for quantification of the grassland pattern (McGarigal and Marks, 1995; McGarigal et al., 2002; Plexida et al., 2014). The lower half of the table is partly adapted from Sertel et al. (2018).
3.3 Field data
Vegetation types were classified according to two schemes based on vegetation assemblages in BNP (Appendix C) (Dinerstein, 1979b; Jnawali and Wegge, 1993; Peet et al., 1999a) and remote sensing studies in similar environments (Dinerstein, 1979a; Sharma, 1999; Sarma et al., 2008; Biswas, 2010; Arieira et al., 2011; Thapa, 2011; Biswas et al., 2014). The first land cover series (level 1) contains four classes (water, bare substrate, grassland and forest) and spans from 1993 to 2019. The second series (level 2) uses solely LANDSAT 8 imagery (2013–2019). The eight classes consist of water, bare substrate, alluvial tall grasslands, short grasslands, mixed tall grassland, shrubland, riverine forest and Sal forest (Appendix C). The height and cover of vegetation, together with the dominant species present, were used to assign the vegetation types (Appendix D). These criteria enable discrimination between riverine grassland and non-riverine grasslands in the TAL (Biswas et al., 2014). For short grasslands the height criterion of <2 m is used. Shrublands (<5 m) entail no distinct vegetation assemblage recorded in BNP but were used in the TAL by Biswas (2010) and Sarma et al. (2008) and provided useful successional information on the impact of disturbances in Canada (Hermosilla et al., 2018).
3.4 Classification and validation
The random forest model (Breiman, 2001) was used for classification, considering its earlier successful use in mapping of vegetation in and near floodplains (Belgiu and Drãgu, 2016; Van Iersel et al., 2018; Harezlak et al., 2020). Two time series of land cover maps (level 1 and level 2) were created, and the aerial photographs from 1964 were classified manually (level 1) (Fig. S1). For 2019, the classification model was trained on the image composites of 2019 with 70 % of the field samples, and the other 30 % were used for validation. An error matrix was constructed for accuracy assessment and the user's and producer's accuracy was calculated (FAO, 2016). For classifying earlier years, all field samples were used to train a classification model on the two seasonal image composites of 2019 and image-derived attributes. The trained model for 2019 is transferable through time (Gómez et al., 2016). Pixels of each LANDSAT were then labelled with the most voted class for these pixels (Pal, 2005; Lawrence et al., 2006). To validate earlier years in the level 1 time series, additional validation samples (106) were collected with publicly available imagery via Google Earth for the available years (2000, 2010, 2011 and 2018). The imagery was not detailed enough for delineation of the level 2 classes. A grid was created digitally with a distance of 1200 m between sample locations outside the floodplain and 600 m inside the floodplain.
3.5 Environmental drivers
3.5.1 Meteorologic and hydrologic data
Hydrologic and meteorologic datasets of the Karnali River were obtained from the Department of Hydrology and Meteorology office in Kathmandu. The datasets include the yearly maximum and minimum discharges, daily discharges, and monthly precipitation. These data were measured at the Chisapani weather station north of the bifurcation and used to calculate hydrologic metrics (Table 1). Discharge has not been measured for the separate Karnali branches. Based on the dataset of 54 years of yearly peak discharges (Qpeak), extreme discharges (Qext) with ≥ 5-year recurrence times (≥ 12 500 m3 s−1) were identified using the Gumbel distribution (Gumbel, 1958). It has been postulated that discharges with these recurrences cause major changes in the river courses in the Gangetic Plain (Thorne et al., 1993). The extreme precipitation events (Pext) were identified by considering the peak rainfall months for each year (Ppeak). The switch of the dominant discharge branch of the Karnali River system at the megafan was identified (Sinclair et al., 2017; Dingle et al., 2020b). The position of the water-filled channels during the dry period was extracted from the annual land cover maps (Table 1). We performed change detection of these water-filled channels by considering the land cover maps of time steps t and t+1, where t is 1 year. The results include newly covered area by water, disappeared water area and unchanged channels.
3.5.2 Forest fires
A forest fire dataset from 2000 to 2019 was obtained from NASA's Fire Information for Resource Management System (FIRMS). The dataset contains detections of fire derived from sensors on satellites (MODIS and VIIRS). Pixels that detected fire are flagged and attributes such as the brightness, confidence of occurrence and time of day are added. The number of pixels that were flagged with presence of a fire were selected for each calendar year, and we interpreted this number as the area that burned. This enables identification of years with high forest fire activity. It should be noted that this method results in an overestimation of the area that actually burned. The coarse resolutions (1 km for MODIS, 375 m for VIIRS) limit information on the exact extent of the fire. When a fire occurs at the border of two pixels, the two separate pixels are flagged, doubling its detected area. Also, when two fires occur at the same time on a spatial scale that is smaller than the resolution of the imagery, they are flagged as a single detection. The metric of forest fires was expressed as the percentage of area that is affected by fires for both the area within and outside the floodplain. For these two zones, the surface area is corrected for the areal extent of water and bare substrate.
3.6 Analysis of land cover dynamics
From the level 1 time series, two metrics were derived representing land cover dynamics (Table 2). Firstly, interannual transitions between land cover classes were calculated on a pixel basis with yearly time steps (Mas and Vega, 2012). In total, 16 combinations were calculated for the level 1 classification, with 64 combinations calculated for the level 2 classification. From these combinations we identified “removal of vegetation”, which is the transition from forest and grassland towards bare substrate and water, and the “transition of grassland to bare substrate” (Table 2). Secondly, the land cover dynamics were characterized by their pattern with landscape fragmentation metrics. These metrics enable quantification of spatial patterns through time (McGarigal and Marks, 1995; McGarigal et al., 2002; Plexida et al., 2014) and have been used for similar ecosystems in the Terai (Biswas, 2010; Thapa, 2011). We then identified years where extremes in environmental drivers (Qext and Pext) coincide with large interannual transitions of grassland to bare substrate (Table 2). This was substantiated with statistical tests (Spearman tests in scatterplots) between the time series of annual extremes of environmental drivers (Qpeak, Ppeak) and the interannual transitions of land cover (Table 2).
The spatio-temporal dynamics of the 27-year land cover series are first presented alongside the historic analysis of land cover in 1927, 1964 and 1984. Hereafter, the datasets on environmental drivers are presented and coupled to the yearly spatial extent of land cover classes and transitions from grassland to bare substrate.
4.1 Spatio-temporal land cover dynamics in BNP
4.1.1 Land cover maps
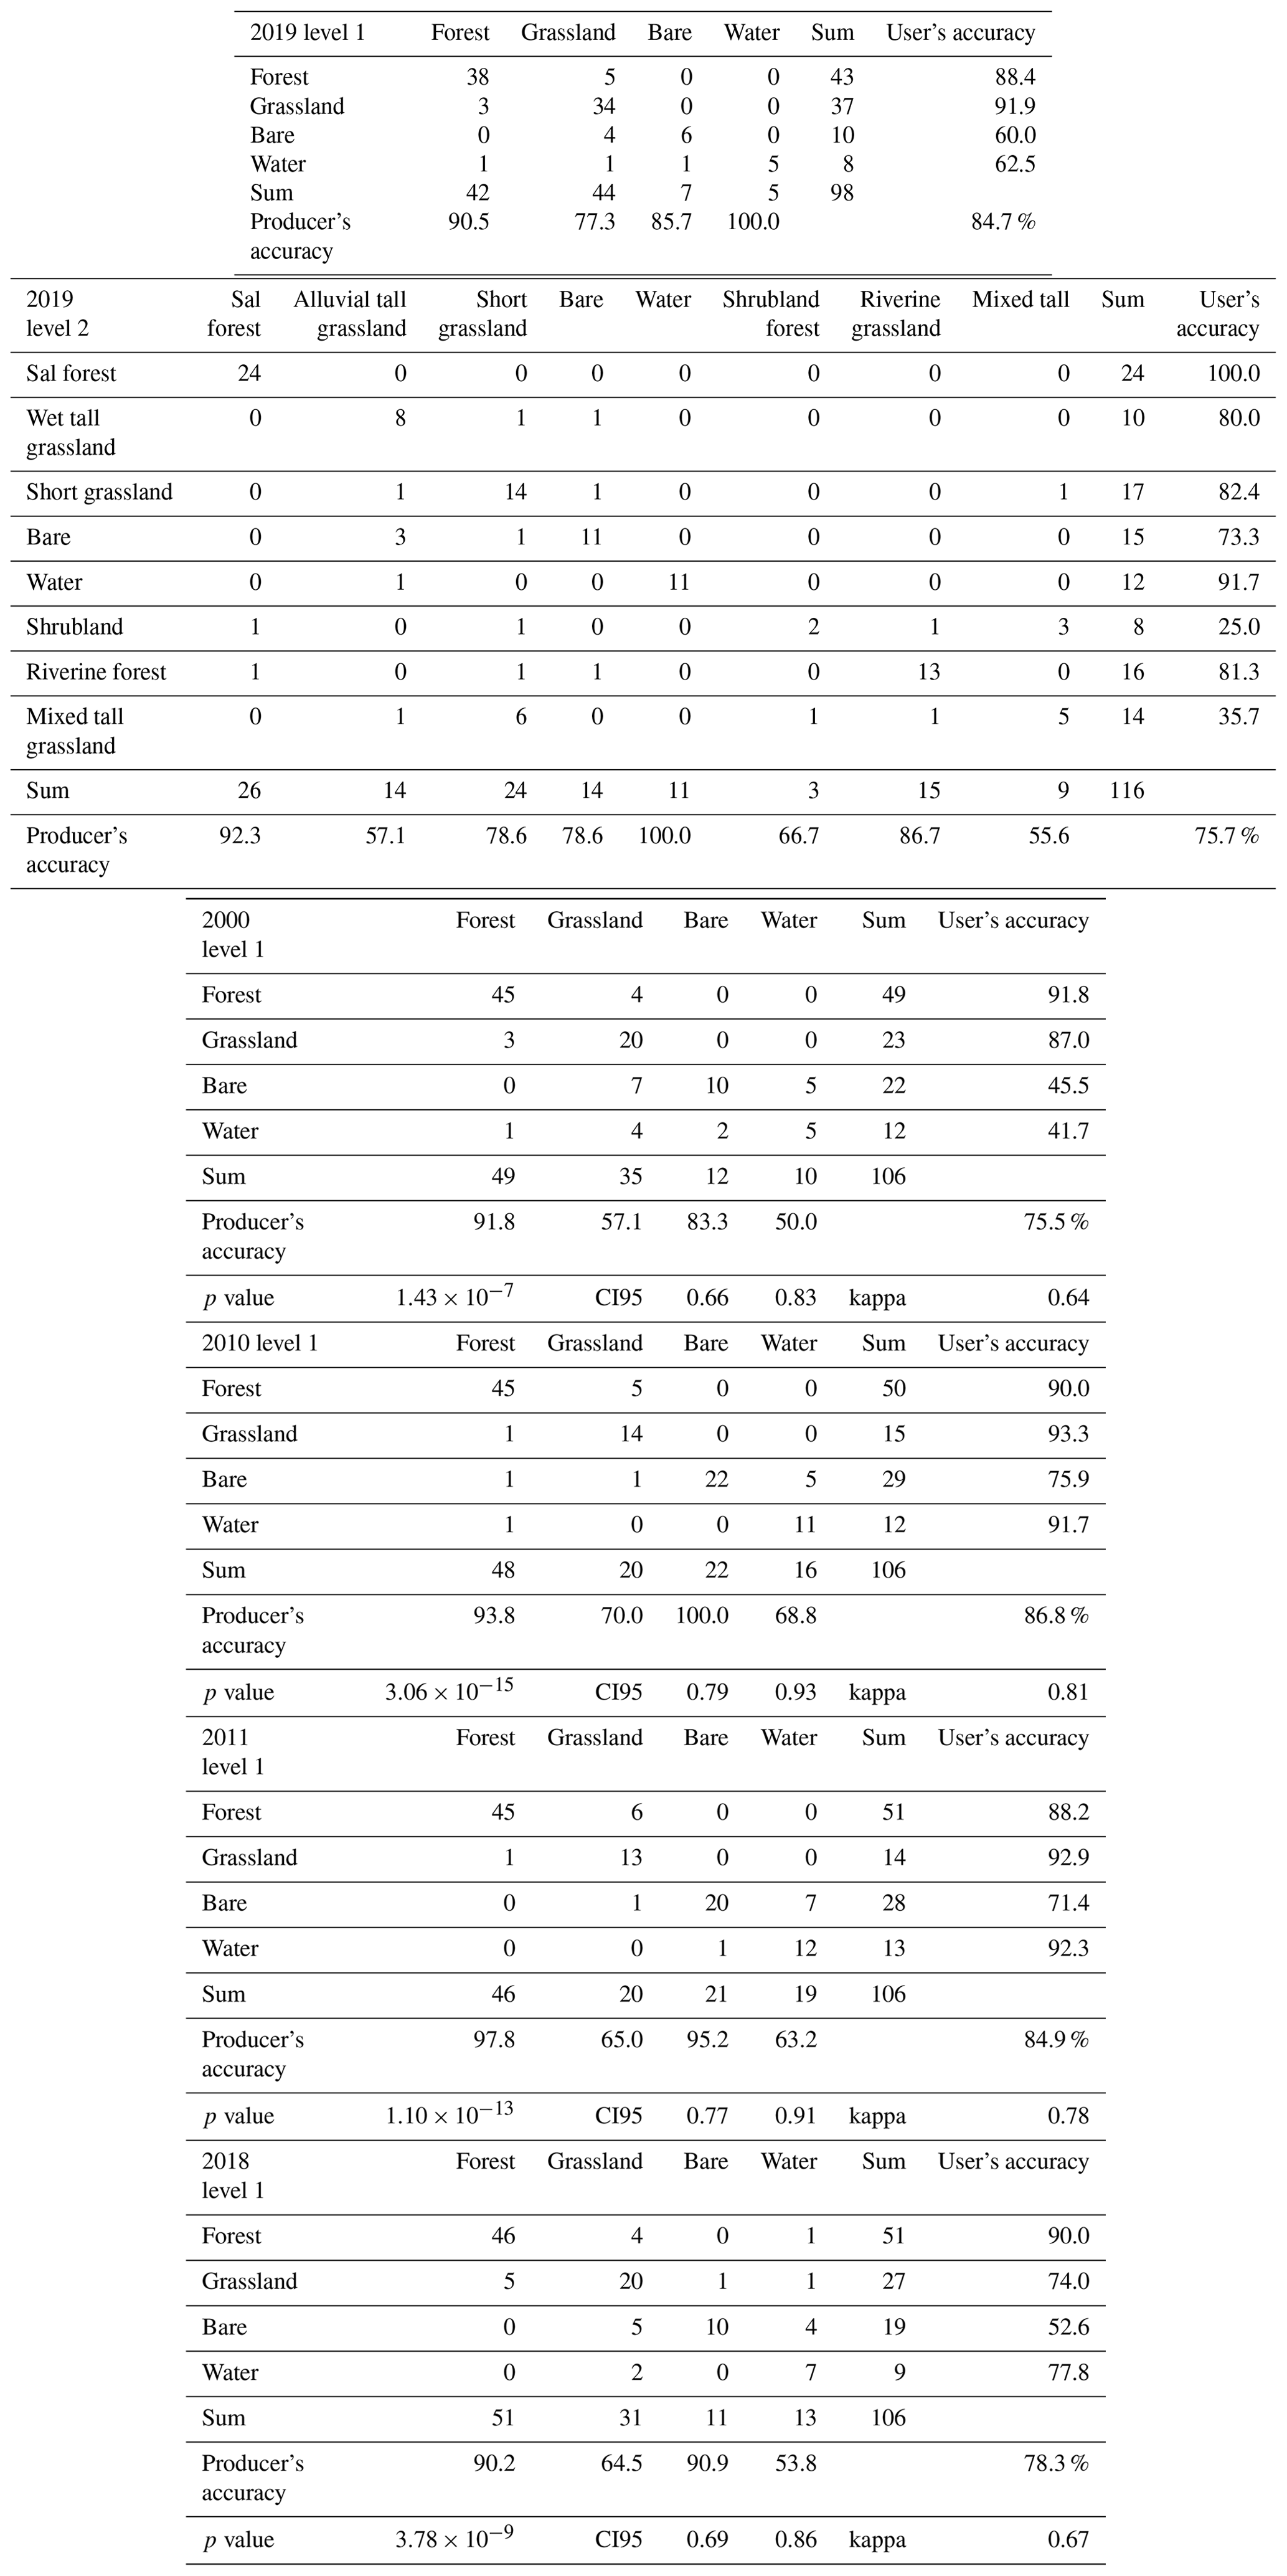
For the reference year 2019, the overall accuracies are 84.7 % for the level 1 classification and 75.7 % for the level 2 classification (Appendix E). The classes of mixed tall grassland and shrubland underperform for the level 2 classification. For the level 1 classification, the calculated accuracies were 75.5 % (2000), 86.8 % (2010), 84.9 % (2011) and 78.3 % (2018) (Appendix E). Classes that underperform are bare substrate for the user's accuracy and water and grassland for the producer's accuracy.
A significant change in land cover (deforestation) around BNP can be seen when comparing the topographic maps of 1927 and 1984, particularly at the area between the Kauriala and Geruwa Rivers (Supplement S2). A number of grassland patches observed between 1993 and 2019 can be traced back to 1964 (Fig. 3f). However, grasslands have shrunk in size and surrounding smaller patches completely disappeared (Fig. 3f). The Baghaura, Lamkauli and Khauraha phantas are part of the remaining grasslands and consist of short and mixed tall grasslands (Fig. 3). The Lamkauli grassland can also be observed on the topographic map of 1927 as the village, settlement or grassland of Lathwa. No signs of a village or agricultural fields are observed on the 1964 imagery, in line with the record that the Baghaura and Lamkauli phantas were cultivated after 1965 (Pokheral, 1993; Brown, 1997).
When traversing the study area from west to east, the classes encountered most abundantly are, in turn, bare substrate, alluvial tall grasslands, short and mixed tall grasslands, shrubland, riverine forest, and lastly Sal forest (Fig. 3d and e). Shrubland is located close to the perennial streams and the national highway that crosses the park from Chisapani to the eastern border of the study area. Sal forest forms a sharp boundary with other vegetation types, coinciding with a difference in elevation that decreases southwards (Fig. A2). Alluvial tall grasslands are dominant in and close to the active river channels and ephemeral streams, whereas shorter grasslands and mixed tall grasslands are located more distal from the active channel belt (Fig. 3d and e). The active stream channels of the Geruwa River migrated westwards between 1964 and 2019 (Fig. 3a and b). Migration of individual channels is also observed, for example the change in the dominant discharge branch in the northwest (Fig. 3a, b and c) and the abandonment a river channel southwest of the Baghaura phanta at 28.49∘ N, 81.24∘ E. This channel transitioned from an active river channel in 1964 (Fig. 3a) to grassland in 2000 (Fig. 3b) and to forest in 2019 (Fig. 3c). Between 1993 and 2019, grasslands and low-flow river channels have covered practically the entire active channel belt at least once, highlighting the dynamic nature of the braided river system (Fig. 3g). This indicates that the larger part of the riverine forest located in and close to the stream channels is not older than 27 years. Compared to alluvial tall grassland along the Geruwa River and ephemeral streams, the more distal short and mixed tall grasslands are present for a larger time span (Fig. 3h).
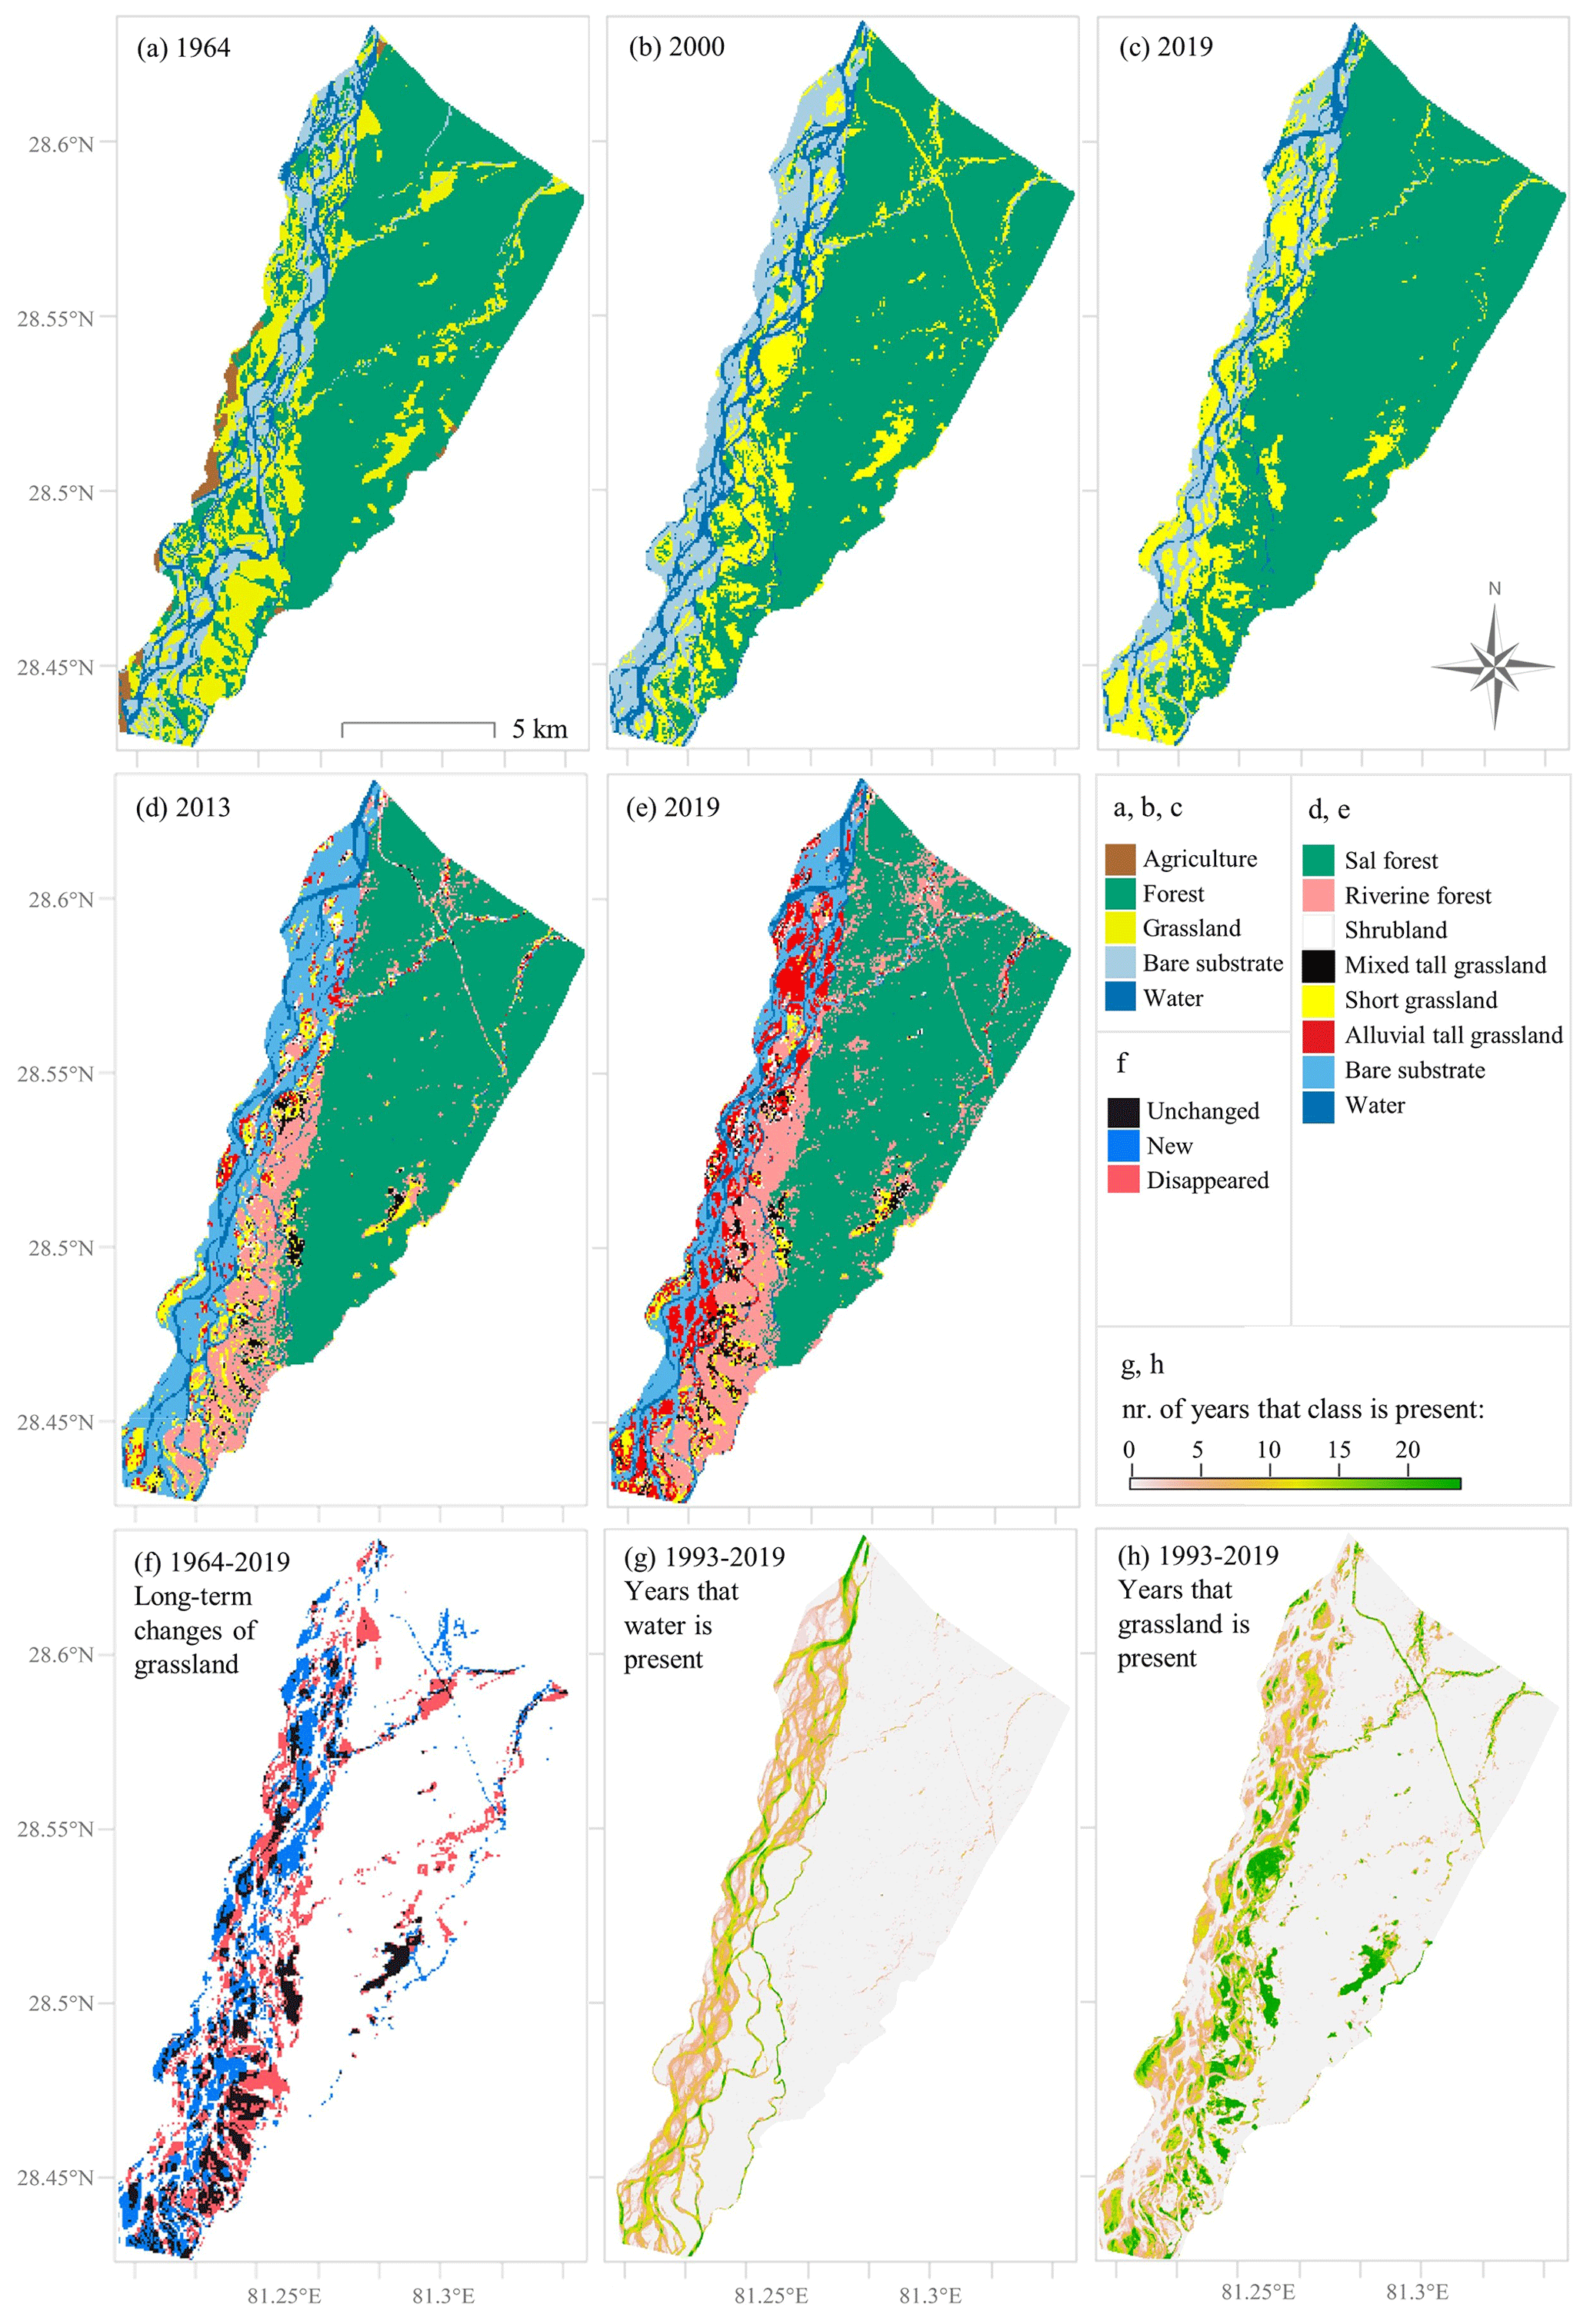
Figure 3Overview of land cover maps. (a) The manual delineation of land cover classes from the aerial photograph composite of 1964, (b, c) the level 1 dataset, (d, e) the level 2 dataset, (f) the grasslands that are present in 1964 and during 2017–2019 and where they appeared and disappeared, (g, h) and the number of years in total that water and grassland were present during the time period 1993–2019 (calculated from level 1 dataset). The full series of land cover maps is presented in Fig. A3.
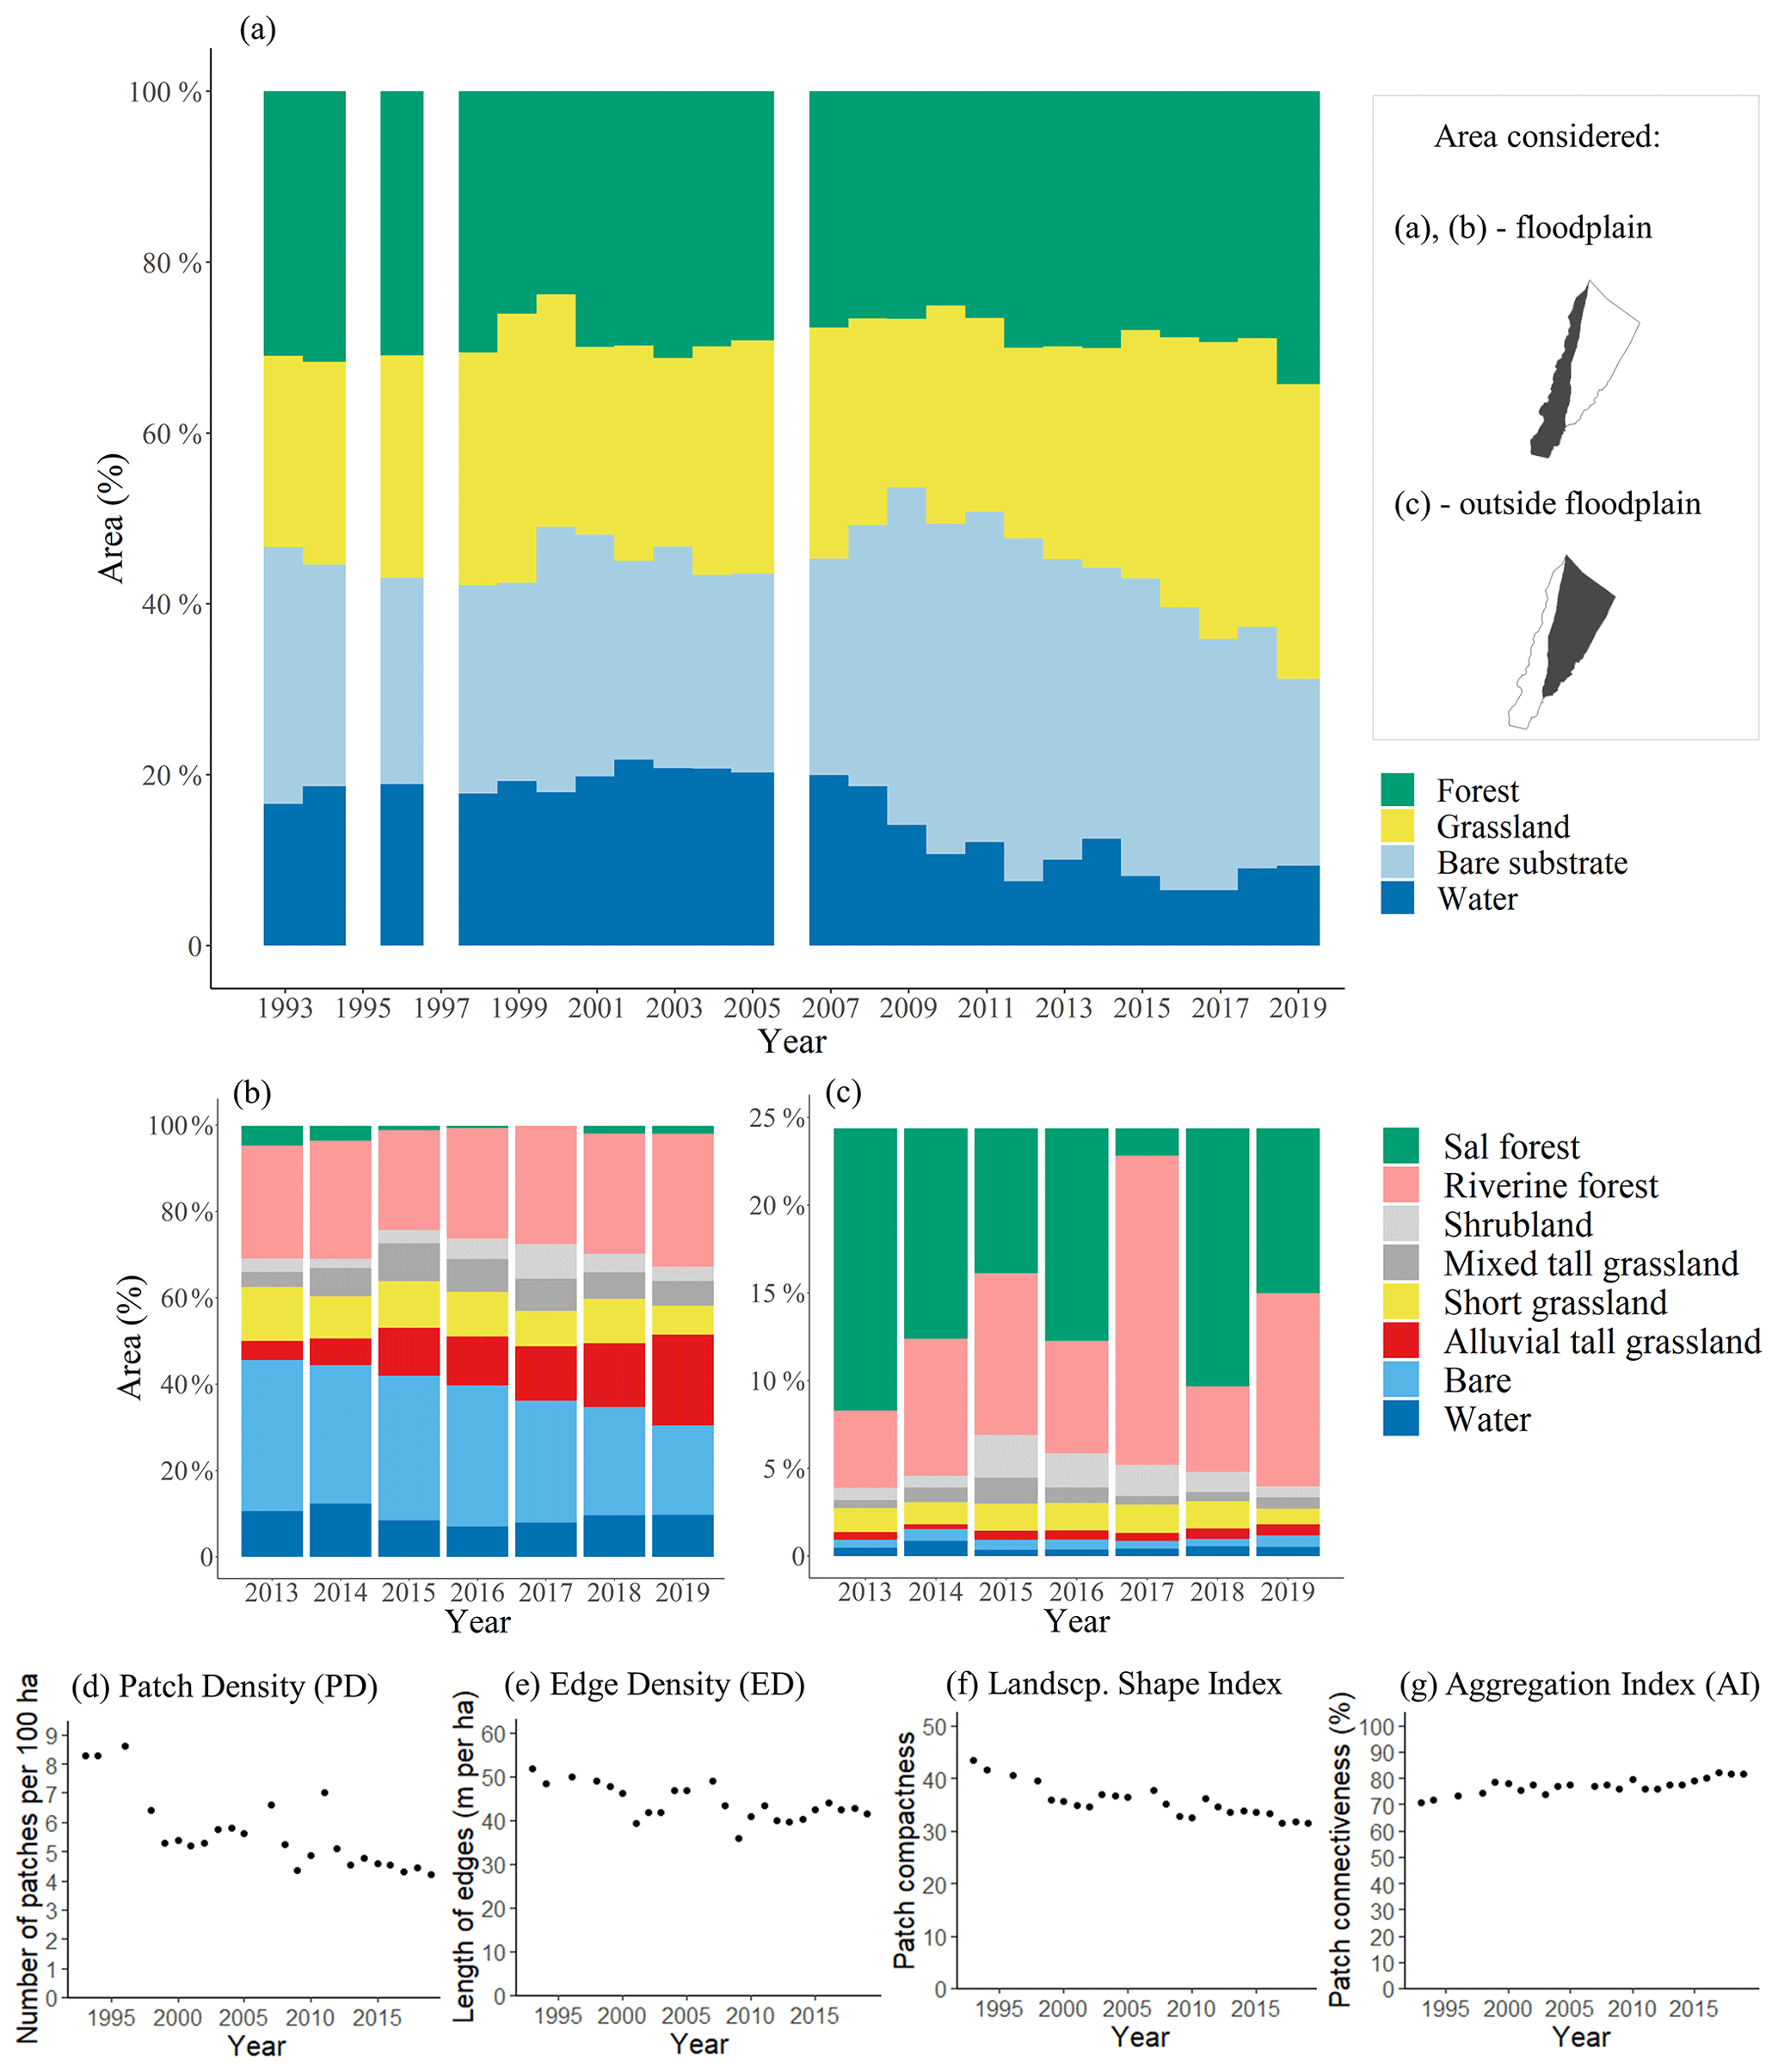
Figure 4The temporal changes in land cover classes and pattern from the (a) level 1 dataset and (b, c) level 2 dataset. White columns represent years with no data. Water can be interpreted as average water cover during the dry season. Note that a maximum of 25 % was set in (c) for the surface area outside the floodplain for visualization purposes; the remaining 75 % of the area consists solely of Sal forest. (d, e, f, g) Landscape fragmentation metrics (Table 2) through time for the grassland class in the floodplain, derived from the level 1 dataset.
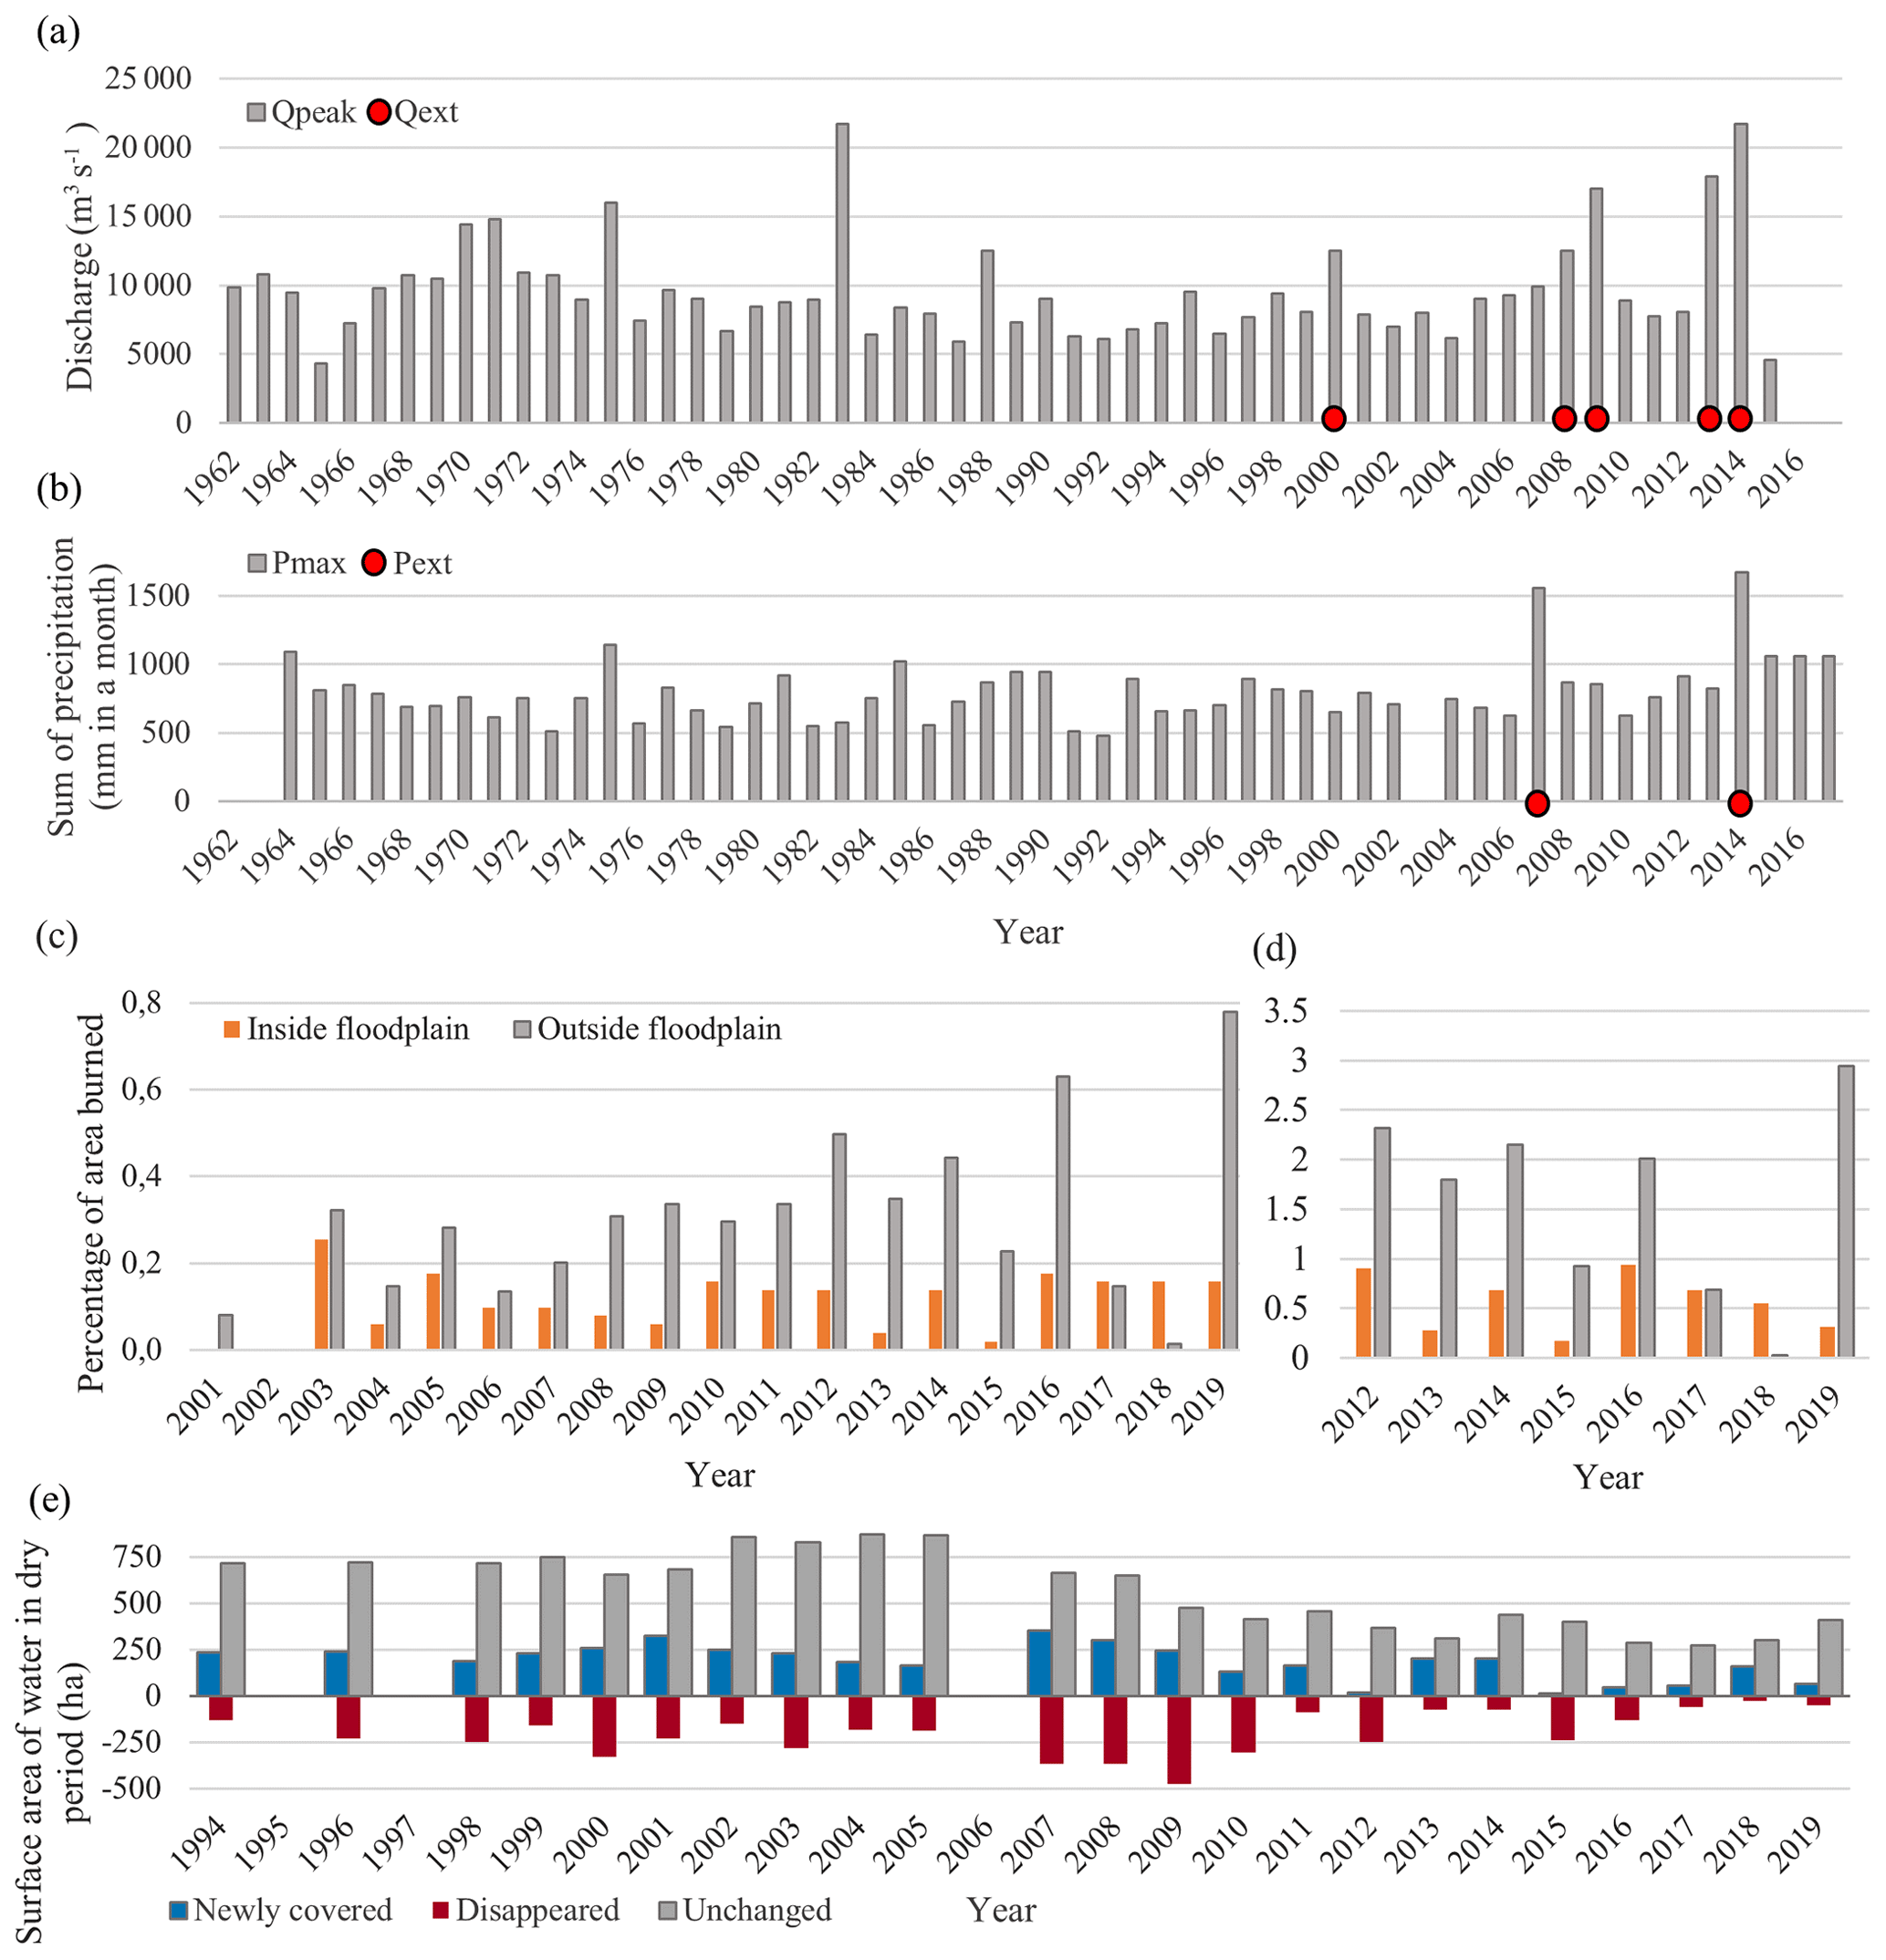
Figure 5Environmental drivers. (a) Yearly maximum peak discharge (Qpeak) and identified extremes (Qext) are shown for the discharge dataset. (b) For each year the month with the most precipitation (Pmax) is shown, along with the identified extreme years (Pext). (c, d) Surface area affected by fires in and outside the floodplain as detected from the MODIS (c) and VIIRS (d) datasets, respectively. (e) Change in surface area (hectares) covered by channels for each year compared to previous year, where newly covered means area covered by new channels, disappeared means area abandoned by channels, and unchanged means area covered by channels in the current year and previous year.
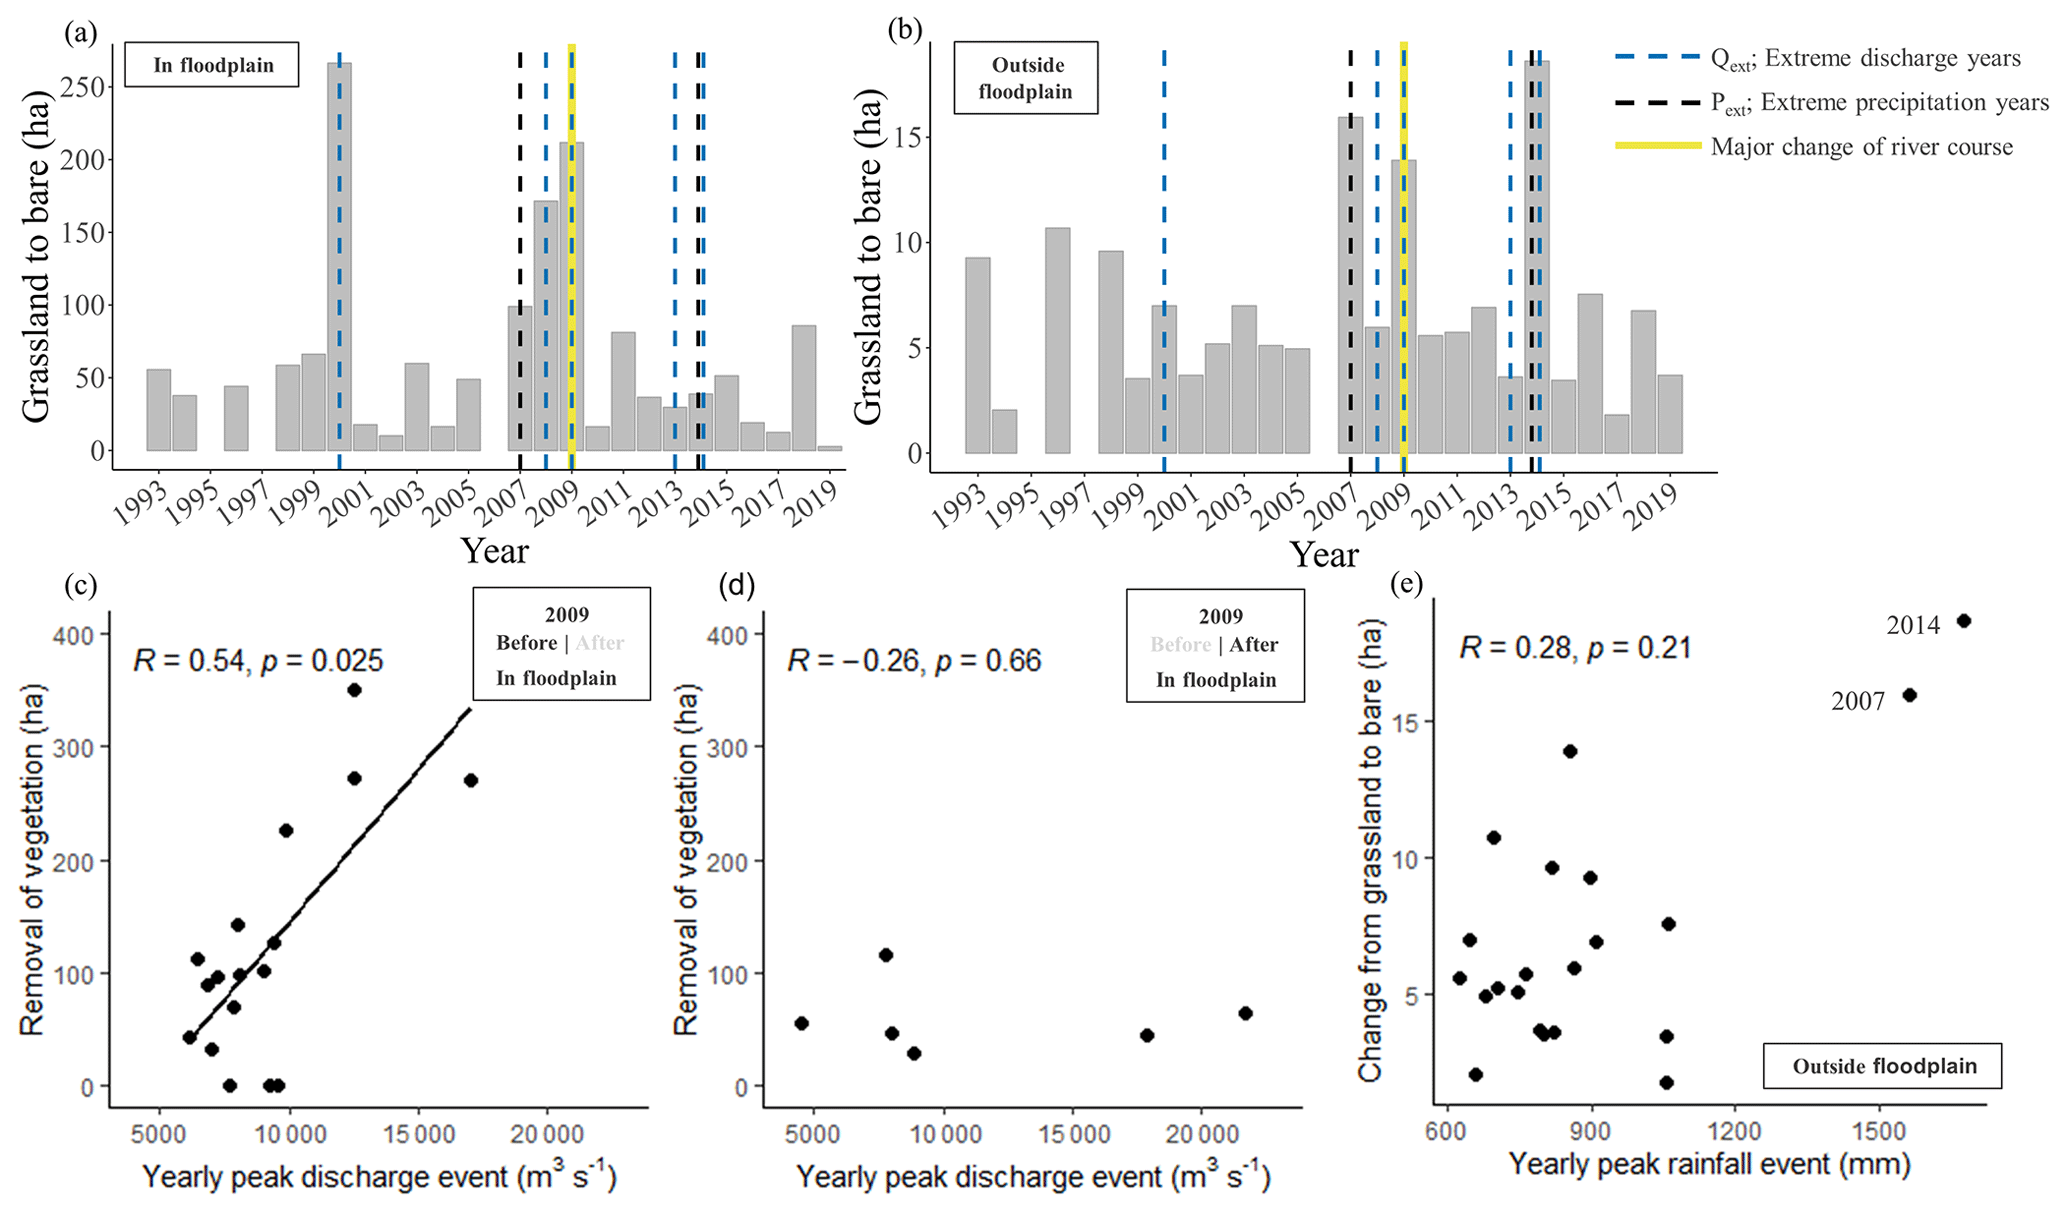
Figure 6Environmental variables related to land cover dynamics derived from the level 1 classification series. (a, b) Annual transitions from grassland to bare substrate in hectares (orange bars) and years that experienced extreme discharge events (>12 500 m3 s−1) and peak precipitation events within the floodplain (a) and outside the floodplain (b). Panels (c), (d) and (e) show correlation tests of environmental and land cover variables. Panels (c) and (d) show the annual removal of vegetation (the transition of Sal forest and grassland towards water and bare substrate) as related to the magnitude of yearly peak discharge before the channel relocation (c) and after the channel relocation (d). Panel (e) shows the yearly peak rainfall events (millimetres in a month) and the transition of grassland to bare substrate. Note the difference in scale on the y axes.
4.1.2 Land cover dynamics 1993–2019
Within the floodplain, succession and retrogression are observed in the level 1 classification (Fig. 4a) from which three periods can be distinguished: 1993–1999, 2001–2008 and 2010–2019. These periods are characterized by a gradual decline in the areal extent of bare substrate and an increase in vegetation, particularly grassland. The three periods are separated by years wherein the surface area of bare substrate increased considerably as compared to the year before (2000, 2008 and 2009). In the first period, grassland is in an increasing trend until 1998. In this period, water covers on average 18 % of the floodplain, amounting to 932 ha. In the second period (2001–2008), the area covered by water (low-flow channels) was slightly larger (1020 ha on average), while forest gradually decreased and grasslands saw an increase. In the third period (2010–2019), the area of bare substrate and water decreased to the lowest value since 1993. Bare substrate decreased gradually, whereas the coverage of water halved more abruptly to 478 ha on average (−53 %) as compared to the second period (2001–2008). The level 2 classification confirms the expansion of vegetation (Fig. 4b). This expansion is most evident in the floodplain where the surface area of alluvial tall grassland increased from 280 to 1185 ha. The short grasses and mixed tall grasslands do not show such a trend. A notable decline in forest is observed in 2015, both on the floodplain (Fig. 4b, to grassland) and outside of the floodplain (Fig. 4c). The grassland pattern shows a decrease in heterogeneity in the landscape: the number of patches decreased (patch density, PD, Fig. 4d), the length of the edges of grassland with other classes decreased (edge density, ED, Fig. 4e), the patches have become more compact (landscape shape index, LSI, Fig. 4f) and the patches have become more connected to each other (aggregation index, AI, Fig. 4g).
4.2 Environmental drivers
The discharge regime of the Karnali near Chisapani is characterized from 1993–2015 by a large seasonal variation, with a mean discharge of 1389 m3 s−1, a minimum of 173 m3 s−1 and a maximum of 21 700 m3 s−1 in August 2014. The median is 678 m3 s−1. Extreme discharges of the Karnali River can be up to 3 times the yearly average peak discharge. The monthly precipitation dataset shows a similar monsoonal variation, with a mean monthly rainfall of 196 mm and a maximum of 1673 mm, a minimum of 0 mm and a median of 40 mm. For the studied period of 1993–2019, Fig. 5a shows the extreme peak discharges (Qext) with a recurrence time of more than 5 years as calculated with the Gumbel distribution, and it also displays the periods with extreme precipitation (Pext in Fig. 5b). An overview of the daily discharge measurements is shown in Fig. A4. The peak discharges of the daily and yearly dataset do not have the exact same values but are in statistical correspondence with each other. We based our analysis on the yearly discharge dataset. A set of 2 months with extreme conditions were identified in 2007 and 2014, of which the second-largest event, with 1560 mm for the monthly maximum (in 2007), is 47 % larger than the third-largest event (Fig. 5b). On an annual basis, the highest cumulative precipitation was recorded for the same years: in 2007 and 2014 with 3293 and 3390 mm, respectively.
Forest fires were most abundant in the study area in the years 2012, 2014, 2016 and 2019 based on both the MODIS and VIIRS detection datasets (Fig. 5c and d). As of 2012 and onwards, the variance in the yearly affected area by fires in the floodplain increased: the maximum surface area affected increased and alternated with years wherein the surface area affected was very low. The channel dynamics were quantified by comparing the annual location of the stream channels in the dry period. The newly covered surface area of channels has decreased considerably after 2009 as compared to the years before 2009 (Fig. 5e). Most changes in surface area took place in the years 2007, 2008 and 2009, whereafter the average absolute area that changed decreased.
4.3 Relating environmental drivers to land cover dynamics
For the years 2000, 2008 and 2009, when extreme peak discharges occurred, a response in vegetation is observed in the floodplain in the form of increased transitions from grassland to bare substrate (Fig. 6a). These increased transitions are not observed for 2013 and 2014, while in these years the recorded peak discharges were higher than in 2000, 2008 and 2009. The major change of the river course occurred in 2009, when the dominant discharge branch relocated from the Geruwa River (in our study area) to the Kauriala River. The extreme discharges in 2009 most likely have markedly changed the channel geometry, with a decrease in retrogression events after its relocation. This is also supported by the results of areal development of land cover (Fig. 4): before the channel relocation, the area of bare substrate only increases in the years that experienced extreme discharges and surprisingly not after the channel relocation in 2013 and 2014. Outside the floodplain (Fig. 6b) and close to ephemeral streams the large transitions of grassland to bare substrate in 2007 and 2014 coincide with years that experienced extreme precipitation events. These transitions occurred mostly near the ephemeral streams on a much smaller scale (20 times) as compared to the floodplain of the Karnali River.
For yearly peak discharges, a significant (p<0.05) positive correlation is present between the maximum discharge in a year and the areal change from grassland to bare substrate within the floodplain in the period between 1993 and 2009 (Fig. 6c). This is not the case for 2010–2019 (p>0.05), where the high peak discharges of 2013 and 2014 experience no increased transitions from grassland to bare substrate compared to years with average peak discharges (Fig. 6d). Outside of the floodplain, extreme rainfall events and grassland to bare substrate transitions show no correlation (p>0.05), but the extreme precipitation months of 2007 and 2014 coincide with the highest transitions from grassland to bare (labelled in Fig. 6e).
We analysed the spatio-temporal dynamics of land cover in Bardia National Park and the effects of environmental drivers and variation therein on these dynamics. The results are discussed and compared to similar ecosystems at the foot of mountain ranges. As land cover acts as a biophysical indicator of the state of an ecosystem (Henderson-Sellers and Pitman, 1992; Meyer and Turner, 1992; Hansen and Loveland, 2012), the implications for BNP and possible cascading consequences for the ecosystem and nature management are also considered.
5.1 Evaluation of obtained accuracies and limitations
The observed temporal trends in land cover echo natural trajectories of succession, apart from the rapid forest recovery observed in the years 1999–2000 and the unrealistic fluctuations in riverine and Sal forest for the level 2 classification. The accuracies are similar to contemporary studies (Hermosilla et al., 2018; Harezlak et al., 2020; Van Iersel, 2020). Therefore, we argue that the series of land cover maps are of sufficient accuracy (76 %–87 % for level 1, 75 % for level 2) to draw conclusions on the general trends in land cover dynamics in the Geruwa River floodplain and adjacent part of Bardia National Park. The decreased surface area of grasslands is in accordance with observations in previous studies (Peet et al., 1999b; Jnawali and Wegge, 2000; Odden and Wegge, 2005; Neupane et al., 2020). Between 1976 and 1997, Odden (2007) recorded a decrease in grassland (−8 %) in the southwest of the study area. Between 1990 and 2013, Neupane et al. (2020) recorded a decrease in the surface area of grasslands from 31 % of the total surface area in BNP to 17 % (−45 %). In this study we recorded a decrease of −35 % between 1964 and 1996. The differences in numbers could be due to (1) the studies differing in terms of the time span studied, (2) the studies differing in terms of the area studied, (3) the studied years being in different phases of the biogeomorphologic cycle (Corenblit et al., 2007), causing the areal extent of floodplain grasslands to differ greatly prior to or after a flood (this cycle is also reflected in our results; Fig. 4), or (4) the methods differing in their approach to constructing land cover maps. Uncertainties in our results could originate from the classification models used, the input data (field samples and satellite image composites), validation data (collected in the field and with Google Earth), the change detection algorithm and the datasets of the environmental drivers.
5.2 Land cover dynamics from 1964 to 2019
The deforestation outside BNP is in line with the general observation that the TAL experienced high rates of deforestation in the previous century, but in contrast with the encroachment of forest within BNP in the past decades. The total areal extent of grassland was higher in 1964 (2614 ha) than in 2019 (2114 ha). Our interpretation is that short grasslands were proportionally more abundant in 1964 than in 2019 and vice versa for the alluvial tall grasslands, which expanded to 1184 ha in 2019 (Dinerstein, 1979b). Dinerstein (1979b) recorded that vegetation west and southwest of the Baghaura phanta was grassland with dispersed trees in 1976, which is in line with our findings for 1964. In 2019, this location is almost entirely covered by riverine forest (Fig. 3a and e). This is also the case for the Mansuri phanta, north of the Lamkauli phanta, which was a grassland up to 1976 but has converted to forest due to succession (Fig. 3f) (Bhatta, 2000).
The period between 1993 and 2019 shows gradual successional changes and years with abrupt retrogression events. A decrease in the heterogeneity of the grassland pattern is observed from 1993 to 2019 because grassland patches decreased in size and abundance and became more rounded and compacted. Riverine forest is observed in both the Karnali floodplain as well as along ephemeral streams. Bolton (1976) recorded the latter as an “undescribed riverine forest type”. Bare substrate is quickly colonized by early successional tall grassland. Concurrently, a portion of these grasslands transition towards the later successional grasslands and forests but at a slower rate. Lehmkuhl (1989) pointed out these different rates of succession for vegetation in Chitwan National Park. It is of interest to which extent the alluvial grasslands and riverine forest eventually expand, as in the last decade their combined area shows an increasing trend.
5.3 Environmental drivers
5.3.1 Hydrologic and meteorological drivers
The large discharge and precipitation fluctuations are associated with the monsoonal climate at the foot of mountain ranges (USAID, 2018) and alluvial megafans (Leier et al., 2005) such as the Karnali megafan and Kosi megafan. In 2014, the extreme precipitation in BNP and extreme discharge of the Karnali River coincided. Extensive loss of landmass and destruction of houses was recorded (Sinclair et al., 2017), and extreme flooding was also recorded in the nearby Babai River in BNP (Chhetri et al., 2020). During the peak discharge in 1983, second to the discharge in 2014 in magnitude, extreme flooding resulted in coverage of the Baghaura phanta with sediment (Bhatta, 2000). Between 1993 and 2019, we observed no conversion from grassland to bare substrate on this phanta. The active stream channels of the Geruwa River migrated westwards, which was also recorded by Rahhal et al. (2021).
For 2009 there are indications that a major redistribution of discharge occurred at the apex of the Karnali megafan. Dingle et al. (2020a) suggested, based on LANDSAT imagery, that the western branch was already dominant in 2001. This is not reflected in the results of the annual land cover time series of this study, which show a relocation of the main discharge in 2009. In addition, the rate of channel migration declined since 2009, and the water coverage in the Geruwa River decreased in the dry period (−53 %). In contrast, Rakhal et al. (2021) found an increase in long-term channel migration in the eastern branch of the Karnali River between 1977 and 2013. The cause for the discrepancy can possibly be found in the time span studied: the last decade (2010–2019) was not fully assessed by Rakhal et al. (2021) and the large-scale channel migrations in 2008 and 2009 could dominate the signal. During low discharges, the current distribution of discharge is considered to be about 80 % for the Kauriala River and 20 % for the Geruwa River (Sinclair et al., 2017; Dingle et al., 2020a). During peak flow of monsoonal discharges, the distribution is thought to be higher in the Kauriala River (55 %–65 %) (Dingle et al., 2017, 2020a). Timescales associated with avulsions at the apex of the Karnali megafan are estimated to be between ∼ 400 and 7000 years, (Dingle et al., 2020b), suggesting that the new discharge situation at the apex could hold for centuries. It is estimated that a discharge of 23 500 to 31 500 m3 s−1 is required to entrain the coarse gravel near the apex of the Karnali megafan (Dingle et al., 2020b). This is higher than the discharge measured in 2009 (17 000 m3 s−1) that caused the channel relocation. Altogether, indications are very strong that a major change in channel geometry, and consequently a redistribution of discharge, indeed occurred, resulting in more static hydromorphological processes in the Geruwa River. If erosion and sedimentation rates decrease, rejuvenation of the floodplain also decreases (Gunderson, 2002; Corenblit et al., 2007). The extreme peak discharges are not the sole hydrological driver for vegetation (Pickett et al., 1987; Corenblit et al., 2007). For example, prolonged inundation is common in a number of conservation areas in the TAL that are more characterized as wetland complexes, such as in Chitwan National Park (Dinerstein, 1979a). Our interpretation is that prolonged inundation is less of an important driver in BNP than in Chitwan National Park.
5.3.2 Forest fires, anthropogenic disturbances and herbivory
The variance of area affected by forest fires between years increased: the surface area affected (predominantly outside the floodplain) was large in the years 2012, 2014, 2016 and 2019, with increasing maxima. Ghimire et al. (2014) found that the surface area that burned increased after 2008, an increase that we observed since 2012. Ghimire et al. (2014) suggested changing climatic conditions as an explanation. To gain insight into the effect of anthropogenic activities, we interpreted the anthropogenic disturbances in relative terms, based on the days of access for locals, the yearly amount of permits issued for resource collection and what is known from literature on management activities (Appendix A) (Bolton, 1976; Brown, 1998; Bhatta, 2000; Bhattarai et al., 2017; Thapa et al., 2021). Anthropogenic disturbances by locals have strongly diminished since the establishment as a protected area in 1976, thereafter increasing towards the passing of the millennium, again followed by a considerable decrease (Bolton, 1976; Dinerstein, 1979b; Brown, 1997; Bhatta, 2000; Thapa et al., 2021). lease change to Persistent presence of (grazed) short grassland is still observed on the western bank of the Geruwa River, as confirmed by field observations on that location (Fig. A5). Maintenance by park staff also seem to have increased towards the passing of the millennium (Bhatta, 2000) and was extensive in recent years.
Herbivory affects land cover in a more gradual way than the pulse disturbances considered in this study, and therefore we do not attribute this driver to the abrupt vegetational changes. Over the long term, interpretation of grazing pressure on the vegetation pattern is hindered by uncertainty around the development of numbers of livestock and wild herbivores before and after the establishment of the conservation area. In 1975, biomass of livestock was 15–17 times higher (47 959 kg km−2) than biomass of wild ungulates in 1977 (2842–3120 kg km−2) in the southwestern part of the study area (Dinerstein, 1980). Between 1976 and 1999, grazing by livestock decreased, and ungulates are thought to have seen a 4-fold increase in numbers (Wegge and Storaas, 2009). It is of interest whether wild herbivores could have compensated for the decline in grazing pressure by livestock, on which no consensus exists in the literature (Karki et al., 2016; van Lunenburg et al., 2017; Wegge et al., 2019).
5.4 The effects of drivers on land cover dynamics
For the period before 2009, the results show a correlation between the transitions of grassland to bare substrate and the magnitude of yearly peak discharge. This relation is absent after 2009, although in 2013 and 2014 the peak discharges were of a higher magnitude than in 2009. This indicates that the impact of hydromorphological disturbances on vegetation in the floodplains of the Geruwa River decreased considerably during extreme discharges of the Karnali River. The absence of retrogression events during extreme discharges of the Karnali River in 2013 and 2014 contrasts with our hypothesis that in Bardia National Park extreme discharges of the Karnali River always cause a removal of vegetation, followed by a period of regrowth. The reduced hydromorphological dynamics favour transition to later successional stages of vegetation in the floodplain (Corenblit et al., 2007). This is in accordance with our observed expansions of alluvial tall grasslands and to a lesser extent that of riverine forest after 2009. The two most extreme precipitation events coincide with the largest transitions from grassland to bare substrate in the area outside of the floodplain along the ephemeral streams. Only during extreme precipitation events the magnitude of erosion and sedimentation processes seem large enough to convert vegetation to bare land because no correlation was found between the yearly maxima of precipitation and the retrogression of grassland. On the spatial and temporal scale of this study, no signal was detected between the transitions of land cover classes and years with extensive forest fires. We interpret the forest fires to not be a principal factor that converts forest towards grassland, which was also suggested by Lehmkuhl (2000). However, fires do play an important role in maintaining grassland (Peet et al., 1999b; Bhatta, 2000; Lehmkuhl, 2000).
Altogether, we attribute the decrease in surface area and abundance of grassland patches first to the reduced anthropogenic disturbances by locals since the establishment as protected area in 1976 and second to the westward migration of channels in the Geruwa River that is followed by succession to later successional stages in the abandoned channels of the Geruwa River. The contrasting recent expansion of alluvial tall grasslands is attributed to a decline in hydromorphological dynamics in the Geruwa floodplain. Phantas such as Lamkauli, Baghaura and Khauraha experienced significantly less encroachment than surrounding smaller patches. In addition, a number of grasslands in the south of the study area have become more distinct in the land cover maps in recent years. This is attributed to removal of trees in the grassland patches because of maintenance practices (Fig. A3). These practices predominantly seem to focus on these phantas and less so on the smaller surrounding patches. This is attributed to anthropogenic maintenance practices that are predominantly executed on these phantas, in contrast with the surrounding smaller grassland patches. If the grasslands would have been left unmanaged, encroachment of the forest would have been more severe.
5.5 Global comparison
Disturbance-dependent grasslands, especially those located in high rainfall regions, are threatened by indigenous forest expansion, which has been recorded in Australia, Africa, India, North America and South America (Puyravaud et al., 2003; Banfai and Bowman, 2006; Silva et al., 2008; Wigley et al., 2009). Grasslands in the Nepalese TAL can be added to this list. The redistribution of discharge through the two branches is thought to have had a profound impact on land cover. A comparison is made to parable conservation areas near lowland alluvial megafans. In the Pantanal (Brazil), extreme hydrologic conditions are explicitly analysed as a driving force in the pattern of vegetation communities (Arieira et al., 2011). The Taquari megafan in the Pantanal experienced a shift in environmental drivers due to an avulsion, increasing susceptibility to deforestation and fire (Louzada et al., 2020). At the foot of the Himalayas in northeastern India, extensive vegetational changes towards dryer vegetation types occurred after shifts in river courses in Jaldapara Wildlife Sanctuary (Biswas et al., 2014) and in Manas National Park (Sarma et al., 2008). In Jaldapara Wildlife Sanctuary, floods in 1968 caused a relocation of the Torsa River. This is regarded as one of the primary drivers that caused a transition of grassland towards woodland (Biswas et al., 2014). For the Manas National Park, Sarma et al. (2008) stated that after the relocation of the river, the change of grassland to forest could have been partly prevented by more active management of the grasslands
These analogous scenarios demonstrate the possible consequences for BNP, namely a change in the (relative) dominance of environmental drivers and possibly a shift towards dryer vegetation types and an increased susceptibility to droughts and fires. Without increased disturbances from another driver, for example anthropogenic disturbances, one could expect that a proportion of the now extensive alluvial tall grassland will transition to a more homogenic (riverine) forest, especially considering the decreasing trend in the heterogeneity of grassland in the landscape. This evokes questions as to the degree that humans should intervene in a (semi-)natural system. The importance of “human-dependent” habitat is also interesting in the light of how grasslands are described in the literature. Classically, grasslands are seen as a transitional land cover from a successional point of view (Clements, 1916), while recent studies highlight the importance to subdivide grasslands from a conservation perspective (Buisson et al., 2019; Bond and Parr, 2010) into old-growth (or ancient) grasslands (Bond, 2008; Veldman et al., 2015) and cultural (or derived) grasslands. The old-growth grasslands are considered to harbour a higher biodiversity and endemism when compared to the cultural grasslands. In contrast to this subdivision for conservation goals, subtropical grasslands in the TAL that are remnant of anthropogenic occupation and cultivation (the phantas) serve an important ecosystem role for tiger conservation goals in Bardia National Park by sustaining prey populations.
5.6 From the perspective of megafauna
Migrating channels at the apex of the Karnali megafan and associated redistribution of discharge are connected to the land cover distribution in the western part of BNP and with it the habitat of threatened megafaunal species. With the recent ongoing increase in grassland near the Geruwa River, the spatial extent of favourable habitat for species that depend on alluvial tall grasslands, such as greater one-horned rhinoceros and hog deer (Jnawali and Wegge, 2000; Odden et al., 2005; Pradhan et al., 2008), increased, but the natural mechanism that maintains these early successional tall grasses has reduced in strength. In Chitwan, habitat heterogeneity was positively correlated with the abundance and habitat preference of prey species of tigers (Bhattarai and Kindlmann, 2012). Moe and Wegge (1994) suggested that a high density of ungulates in BNP is possible due to the fine mosaic pattern of habitats in the Karnali floodplain. However, heterogeneity of grasslands in BNP shows a decreasing trend. This could be unfavourable for chital deer and tigers, although their numbers suggest otherwise. Tiger population showed the largest increase in BNP among the conservation areas in Nepal (DNPWC and DFSC, 2022), particularly due to conservational efforts.
5.7 Future research
In the next few decades, changes in the environmental drivers are projected due to (among other reasons) changing climatic conditions. Precipitation, temperature and mean annual discharge are projected to increase in the Karnali River basin, except for during the post-monsoon, when smaller amounts of precipitation and discharge could be expected (Dahal et al., 2020; Rakhal et al., 2021). The combination of Earth observation with time series of environmental drivers adds to the understanding of spatio-temporal dynamics of land cover and proves to be useful for monitoring with minimal monetary costs. With future technological advances in mind, the algorithm could be improved upon (e.g. Hermosilla et al., 2018; Van Iersel, 2020) to enable detailed analysis of vegetation dynamics on the community or species level, including invasive species (Bhatta et al., 2020). In addition, further research into the drivers and their changing relative dominance will aid conservational efforts and management decisions in BNP and similar nature reserves where disturbance-dependent grasslands are under threat from forest intrusion.
We aimed to quantify the spatio-temporal land cover change and establish relationships with the environmental drivers. This was done in Bardia National Park (BNP), located along the highly dynamic Karnali River at the foot of the Himalayas in a climate that is conducive to forest growth. We focussed on disturbance-dependent grasslands that are vulnerable to encroachment. Grasslands in the floodplain of the Geruwa branch of the Karnali River and the adjacent part of BNP were more abundant and were located more eastwards in 1964 than between 1993 and 2019. Between 1993 and 2019, grasslands showed a steady decline in heterogeneity, pinpointing the decrease in size and abundance of the patches. The more recent ongoing increase in surface area of grasslands can be attributed to expansion of alluvial tall grasslands in the floodplain. The maximum surface area affected by forest fires increased, but at the same time the affected surface area became more variable between years. Since 2009, the Geruwa branch of the Karnali River was partially abandoned. Before 2009, the magnitude of discharge events shows a correlation with transitions from grassland to bare substrate. This correlation is not present anymore after 2009, and no increased transitions are observed for 2013 and 2014, while the recorded peak discharges were of a higher magnitude in these years. In addition, the channel dynamics of the eastern branch of the Karnali River have decreased since 2009. Hence, we confirm our hypothesis that from 1964 to 2019 a shift occurred from grasslands to riverine and Sal forest. This shift is predominantly attributed to a westward shift of the active stream channels of the Geruwa River and the establishment of the conservation area in 1976 with its associated reduced anthropogenic disturbances by locals. The more recent expansion of alluvial tall grasslands is attributed to the redistribution of discharge in 2009 of the Karnali River. In 2019, land cover in the floodplain was more favourable for faunal species that depend on alluvial tall grasslands such as hog deer (Hyelaphus porcinus) and greater one-horned rhinoceros (Rhinoceros unicornis), although the mechanism to maintain these grasslands reduced in strength. For faunal species that benefit from a heterogenic vegetation pattern, land cover is thought to have become less favourable between 1964 and 2019 as the heterogeneity and surface area of the grassland patches decreased. Because hydromorphological processes in the floodplain have become more static, other agents of disturbances are more paramount to prevent encroachment of grasslands.
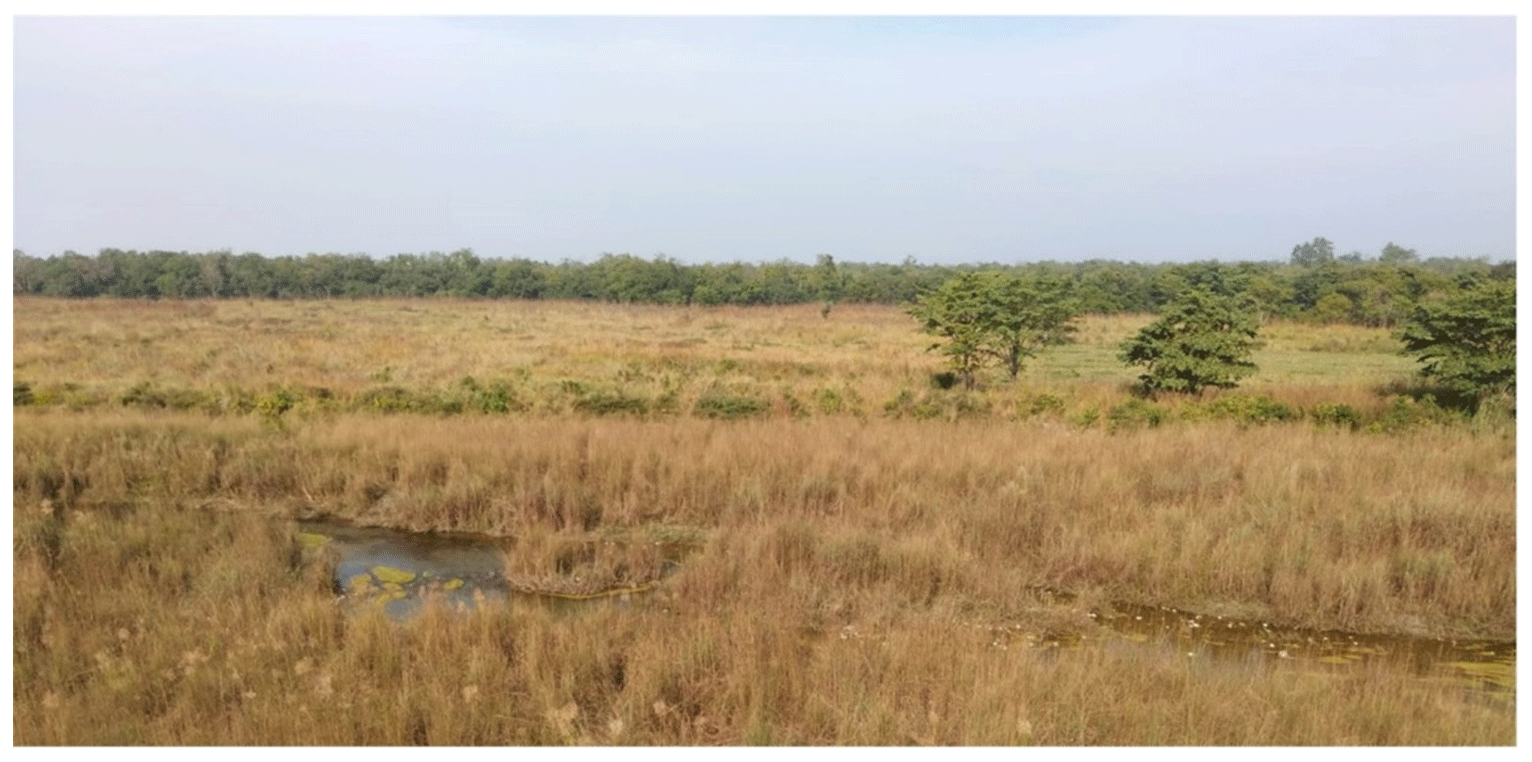
Figure A1View from the tower (Bagh Machan). As entering these grasslands is not recommended, this view is used to assign ground truth locations for short grassland (patch on right-hand side), alluvial tall grassland (in front, Saccharum spontaneum dominated), and mixed tall grasslands and riverine forest in the background. The location is northwest from the Khauraha phanta. Ground truthing was done in combination with satellite imagery to obtain the exact coordinates. The photograph was taken by the authors.
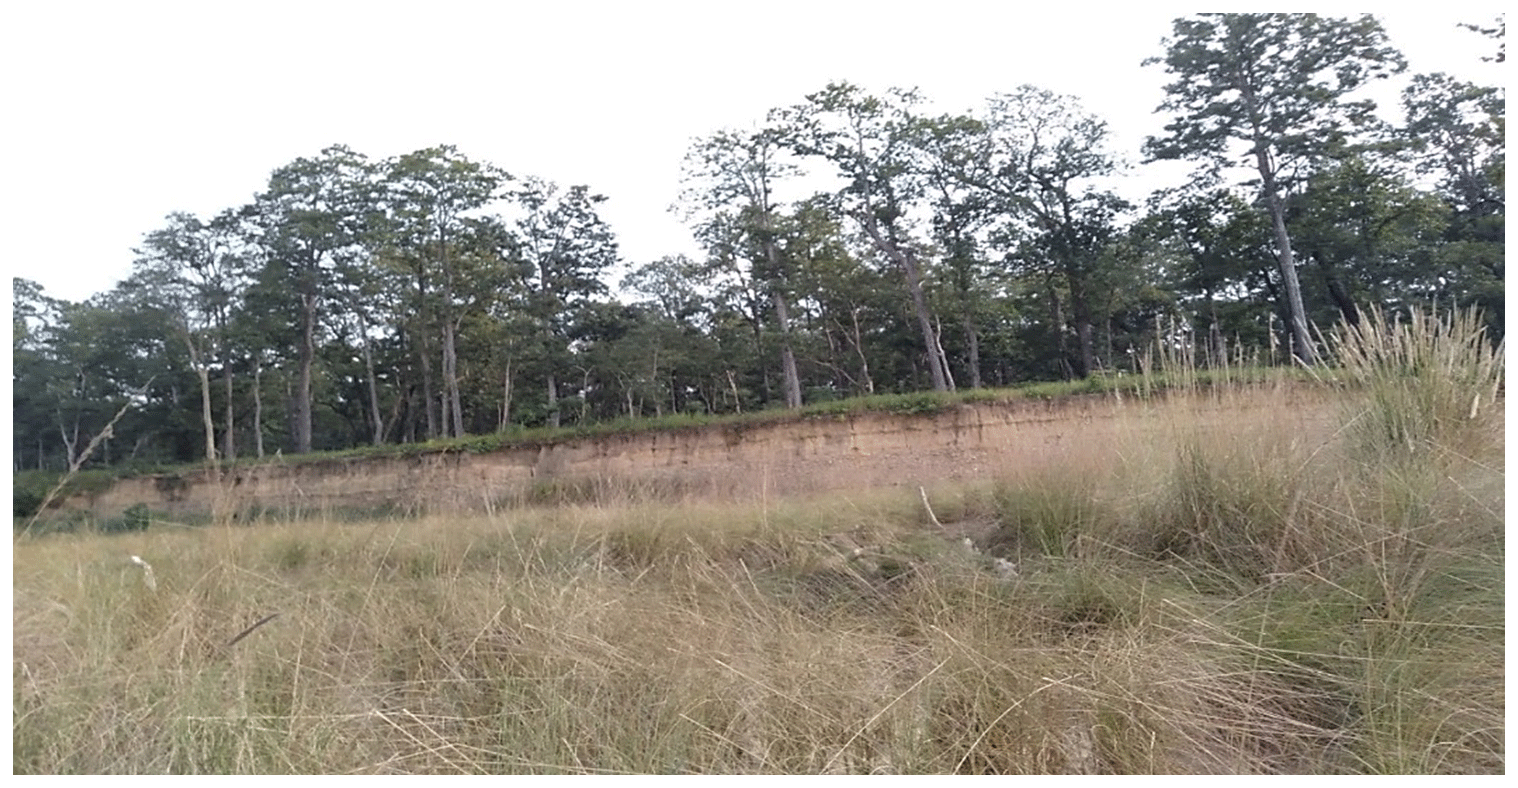
Figure A2Photograph of an incision of the Karnali River. In the outcrop a loamy layer is positioned on top of a more sandy layer containing rounded pebbles, cobbles and boulders. Sal forest can be seen on top of the cliff. On the right-hand side of the image tall grasses grow amongst the grasses classified in this study as short grassland. The cliff marks the spatial extent of fluvial disturbances of the Karnali River. The difference in elevation is largest in the north of the study area and gradually decreases southwards along the interface of riverine and Sal forest. The photograph was taken by the authors.
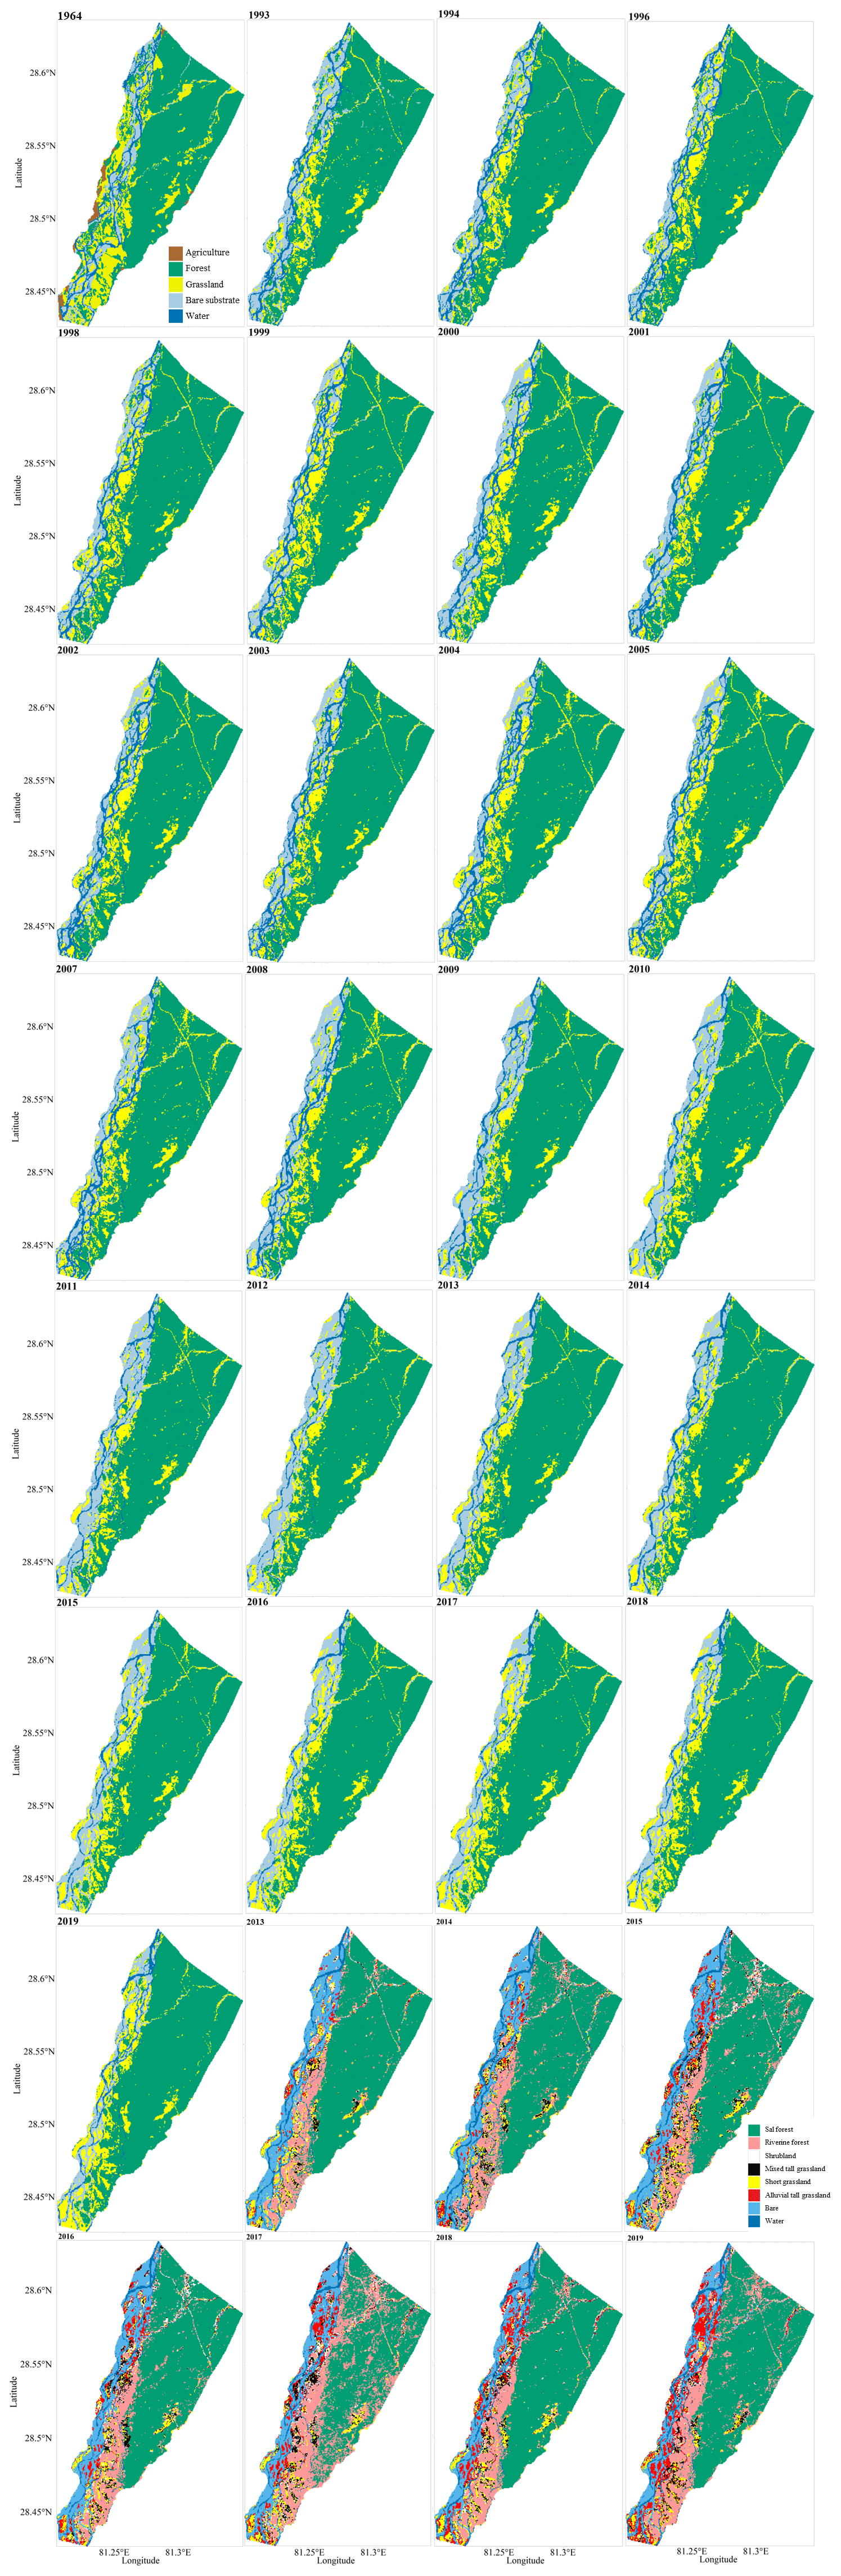
Figure A3Land cover maps of the level 1 and level 2 series.
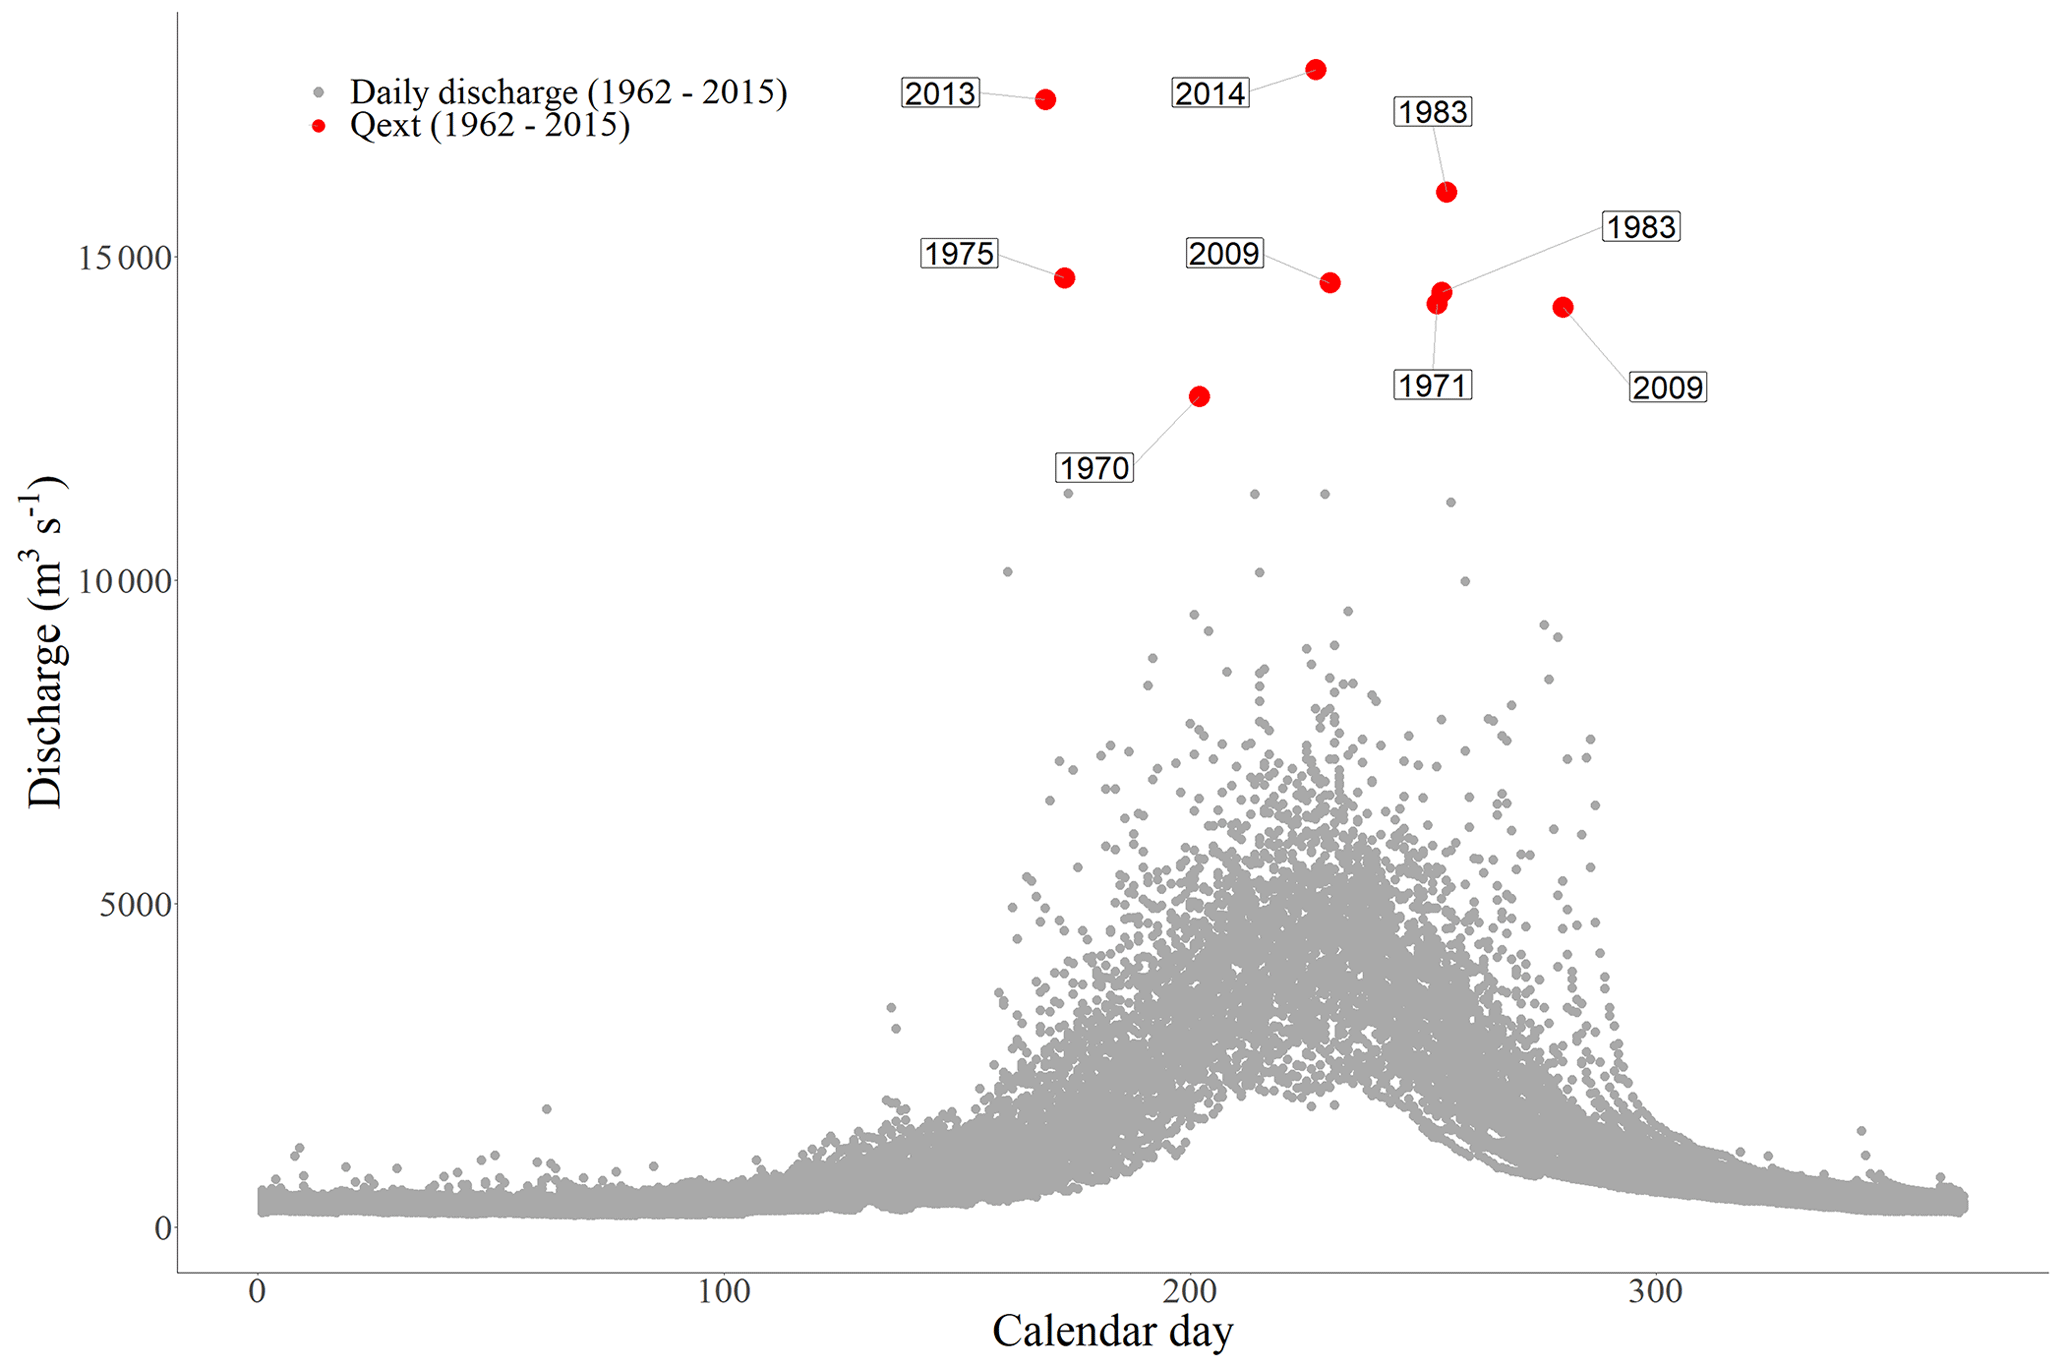
Figure A4Hydrological year showing the daily discharge measurements and their calendar day. Red dots represent the identified extreme discharges (Qext) that are higher than 12 500 m3 s−1.
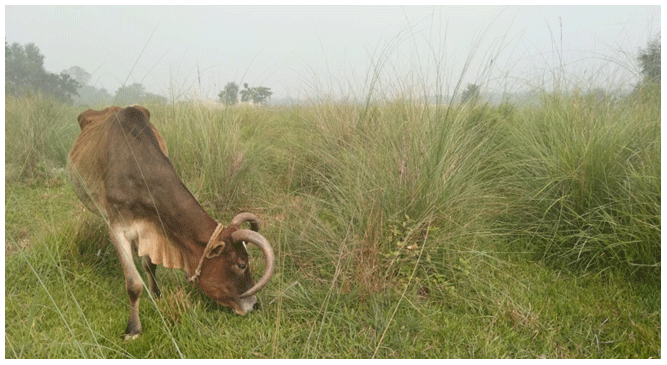
Figure A5Grazing of cattle on the western bank of the Geruwa River at the southwestern border of study area. This image demonstrates the grazing pressure herbivores pose on the vegetation pattern at the border of the park both at present and in earlier times within the park when cattle grazing was allowed. The photograph was taken by the authors.
Table A1Overview of anthropogenic activities in BNP as recorded in the literature.
To establish an annual time series of land cover, we selected imagery of the Surface Reflectance dataset (Tier 1) of the LANDSAT 5, 7 and 8 satellites between 1993 and 2019. This dataset of imagery is corrected for variation in the energy source (e.g. sun angle) and atmospheric effects (e.g. aerosol scattering and thin clouds) and is therefore best suited to use for diachronic analysis (Zanter, 2019; Young et al., 2017). We accounted for the differences in sensors by using coefficients (Roy et al., 2016) to correct LANDSAT OLI imagery to LANDSAT 7 ETM+ imagery. The incorporation of seasonal information improves the classification results, especially if height data are absent, as the spectral signatures of the separate classes are more distinct due to phenological differences of vegetation throughout the year (Van Iersel et al., 2016; Kelley et al., 2018). For each year, two separate collections of images were selected based on the day of the year (between 240–366 of the post-monsoon and 1–150 of the subsequent pre-monsoon). In addition, images were selected based on cloud cover (<50 %) and quality (>9) and a geometric RMSE (root-mean-square error) of <10 m, and we performed cloud masking using the Fmask algorithm (Zhu et al., 2015). To enhance the available spectral information, NDVI (Rouse et al., 1974; Rock et al., 1986; Myneni et al., 1995; Beeri et al., 2007), NDDI (Gu et al., 2007) and tasselled cap transformations (Crist and Cicone, 1984) were calculated, which have been shown to improve classification results of vegetation (Price et al., 2002; Biswas, 2010). From each seasonal selection the images were combined into a composite image by taking the median value of each seasonal collection. In addition, for each year a separate annual collection of images was created, which was used to calculate the seasonal variation in the NDVI metric with a harmonic trend for each pixel in terms of magnitude and timing of the annual change. This was added as an indicator for the supervised classification model. To minimize noise caused by clouds, artefacts and the LANDSAT 7 scan-line error, we repeated the seasonal selection of imagery five times for each year with slightly different selection dates. After classification, the modus of the resulting five land cover maps was taken to obtain the most prevailing classification for each pixel for each year. The composites of 1995, 1997 and 2006 were not classified. Too many clouds were present for 1995 and 1997, and a too large number of erroneous pixel values in the image composite was observed for 2006, caused by the LANDSAT 7 scan-line error. We used the Google Earth Engine (Gorelick et al., 2017), earlier applied for mapping changes in floodplain ecosystems (Harezlak et al., 2020; Zurqani et al., 2018; Donchyts et al., 2016; Van Iersel, 2020), for selecting, processing and classifying LANDSAT imagery, whereas RStudio was used for post-classification analysis.
Table C1Grouping of vegetation types. Vegetation assemblages present in Bardia National Park and their associated vegetation classes as used in the level 2 classification model in this study. Grass assemblages are from Peet et al. (1999a). Forest assemblages are from Dinerstein (1979a) and a modification of data from Jnawali and Wegge (1993) and Pokheral (1993).
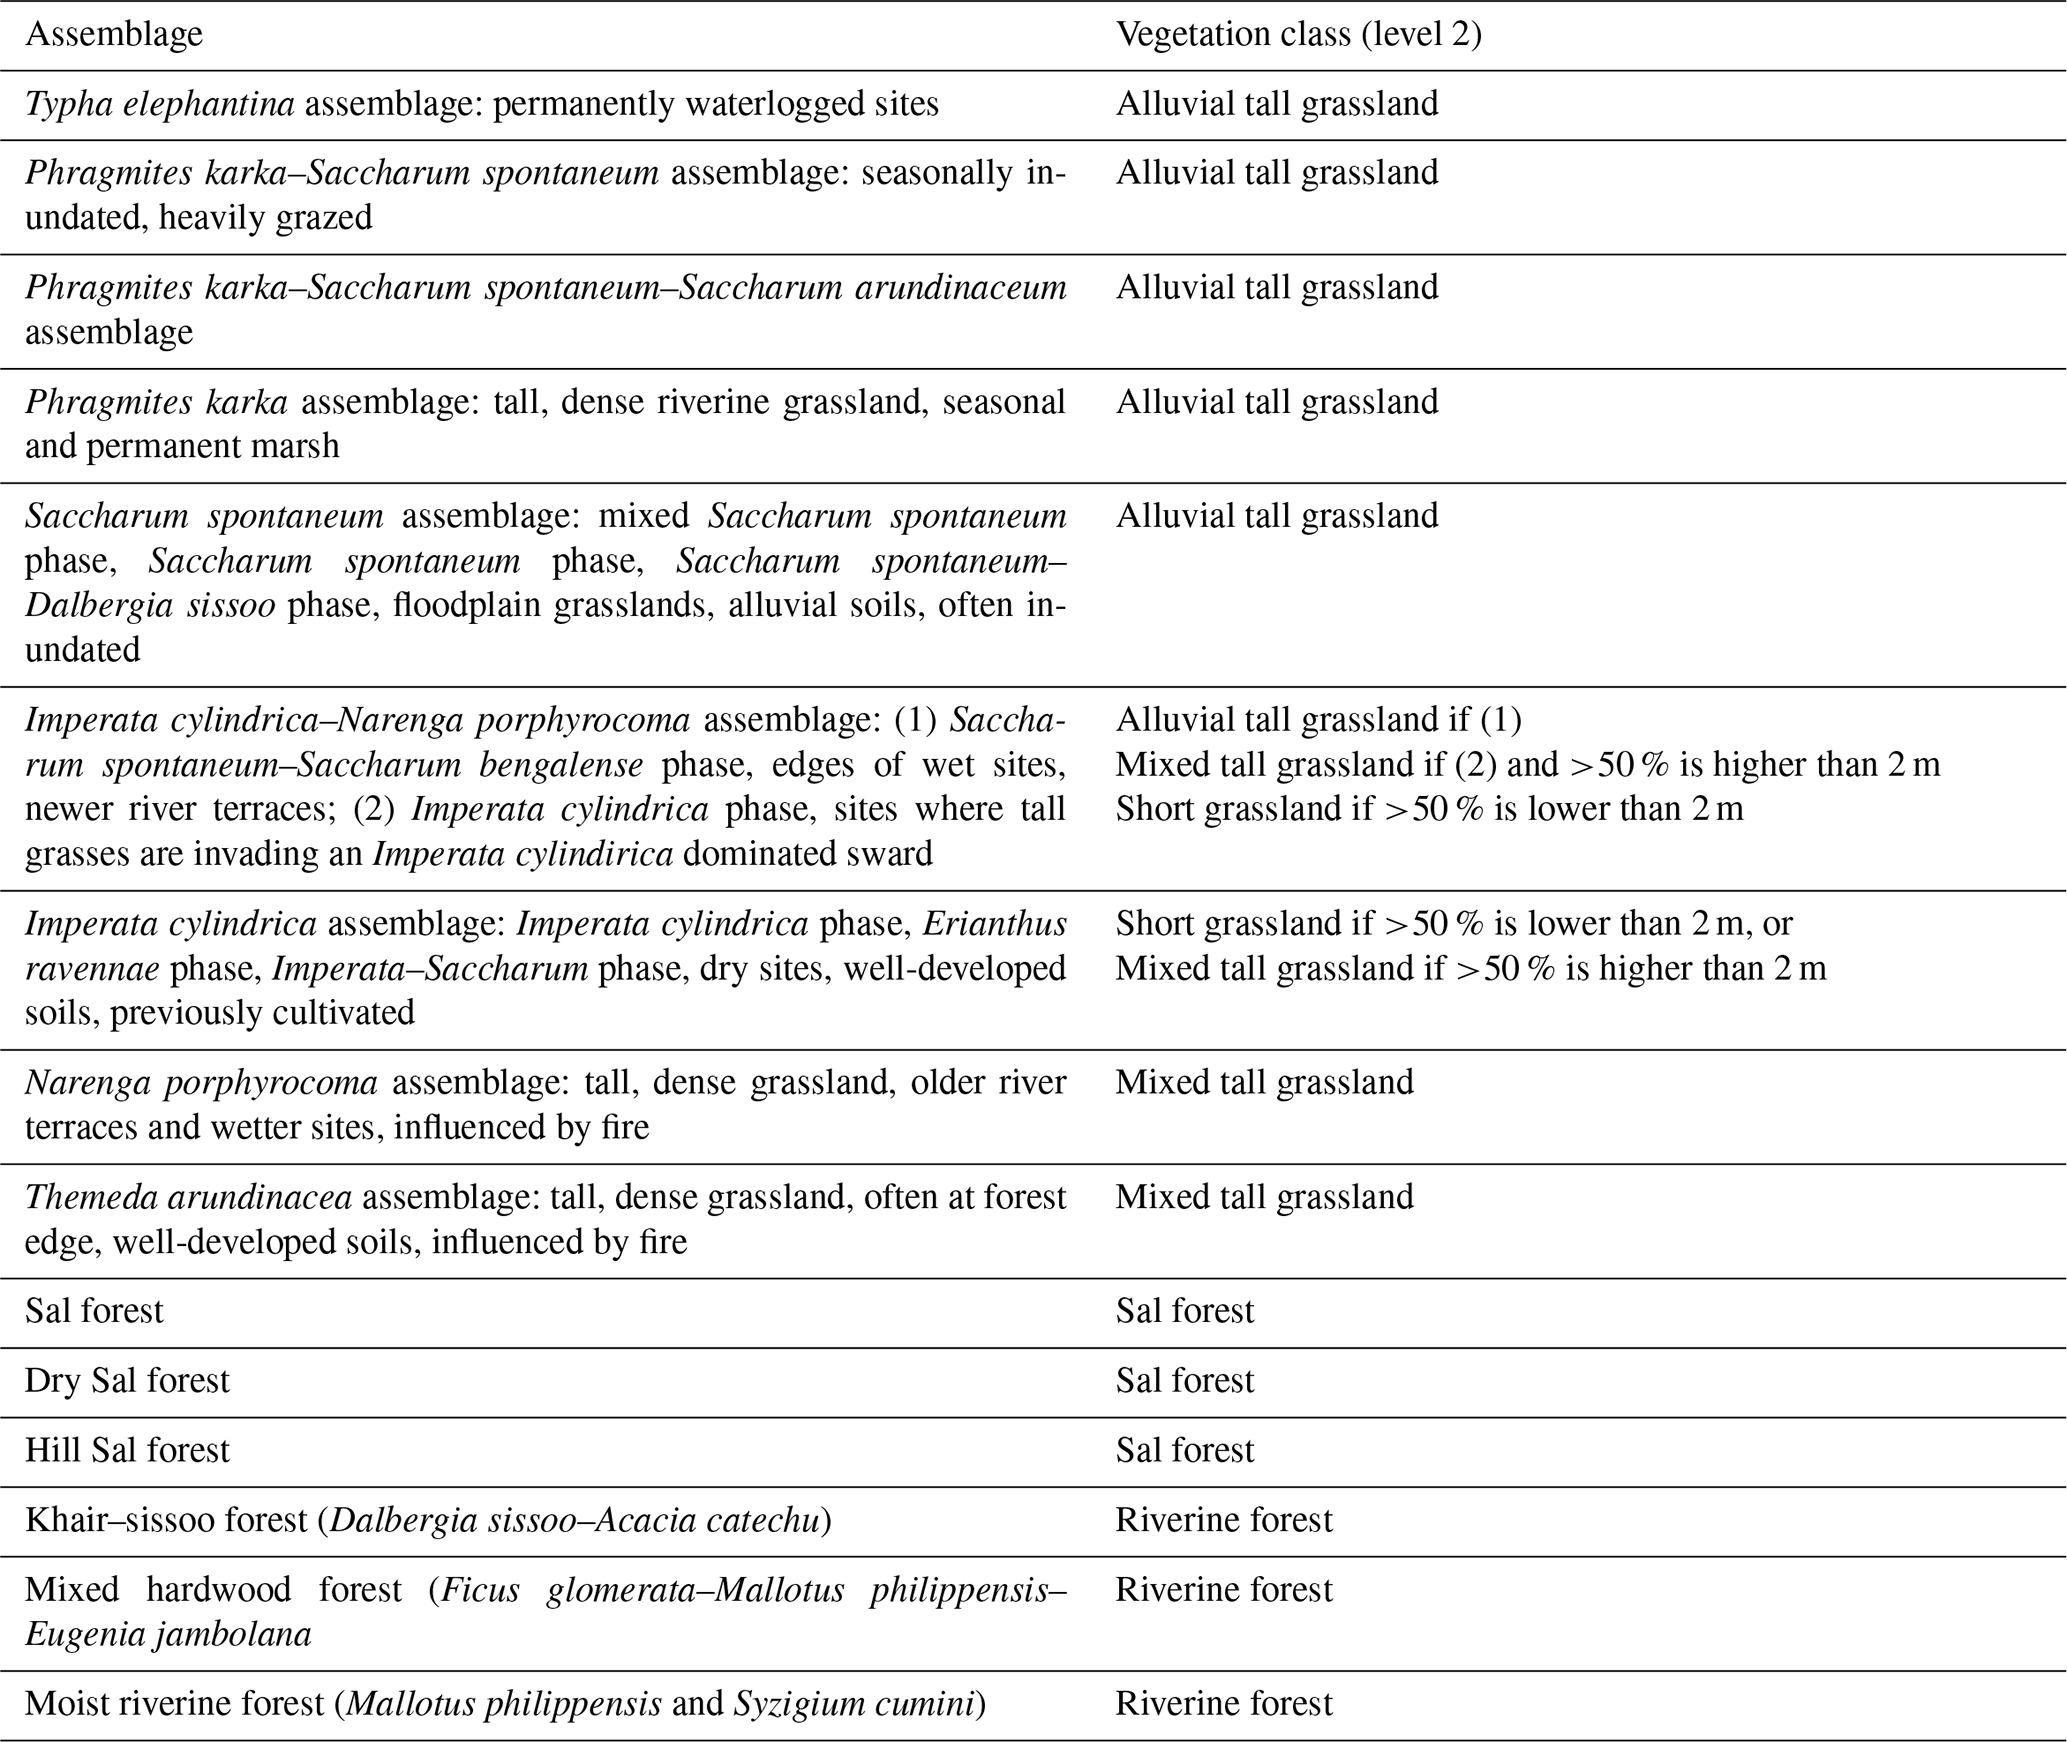
Table D1Dominant species per vegetation type used for assigning classes. Cover and height are used for further discrimination of classes.
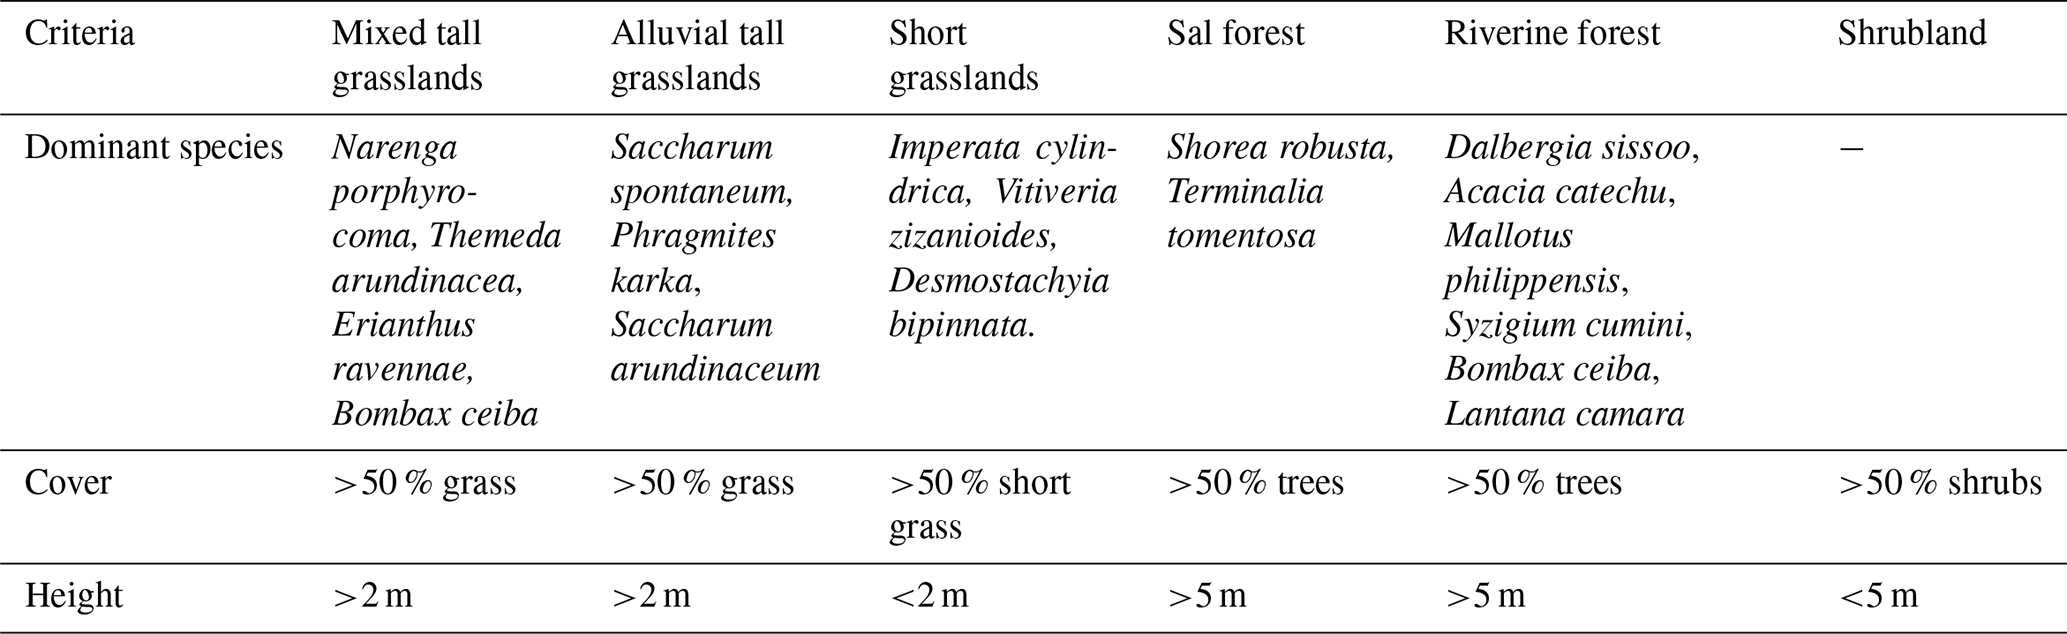
Table E1Confusion matrices of the level 1 and level 2 classifications for 2019, as calculated with 30 % of the ground truth data and confusion matrices for 2000, 2010, 2011 and 2018 based on a separate validation set (106 samples).
Data are available via the contact author by sending an email to Jitse Bijlmakers (jitsebijl@xs4all.nl).
Supplement S1 is a composite of aerial photographs of 1964, Supplement S2 shows topographic maps and Supplement S3 provides the image availability of LANDSAT. The supplement related to this article is available online at: https://doi.org/10.5194/bg-20-1113-2023-supplement.
JB designed the methodology, carried out fieldwork and analysis, wrote the original draft and took part in the review and editing process. DK performed supervision, structured the methodology and took part in the review and editing process. JG provided conceptualization, arranged the project, performed supervision and took part in the review and editing process.
The contact author has declared that none of the authors has any competing interests.
Publisher's note: Copernicus Publications remains neutral with regard to jurisdictional claims in published maps and institutional affiliations.
The authors are grateful to officers of the government of Nepal, particularly Dipesh Kumar Sharma, Assistant Research Officer at the Forest Research and Training Centre, Ministry of Forests and Environment, Nepal, for helping with the acquirement of the aerial imagery and topographic maps. We thank the people from NTNC for their great help and support during fieldwork. We acknowledge the use of data from NASA's Fire Information for Resource Management System (FIRMS) (https://earthdata.nasa.gov/firms, last access: 1 March 2020), part of NASA's Earth Observing System Data and Information System (EOSDIS). We thank the reviewers for their valuable comments on the preprint of the paper.
This paper was edited by Steven Bouillon and reviewed by Romullo Louzada and one anonymous referee.
Alaibakhsh, M., Emelyanova, I., Barron, O., Sims, N., Khiadani, M., and Mohyeddin, A.: Delineation of riparian vegetation from Landsat multi-temporal imagery using PCA, Hydrol. Process., 31, 800–810, 2017.
Allred, B. W., Fuhlendorf, S. D., Engle, D. M., and Elmore, R. D.: Ungulate preference for burned patches reveals strength of fire-grazing interaction, Ecol. Evol., 1, 132–144, https://doi.org/10.1002/ece3.12, 2011.
Arieira, J., Karssenberg, D., de Jong, S. M., Addink, E. A., Couto, E. G., Nunes da Cunha, C., and Skøien, J. O.: Integrating field sampling, geostatistics and remote sensing to map wetland vegetation in the Pantanal, Brazil, Biogeosciences, 8, 667–686, https://doi.org/10.5194/bg-8-667-2011, 2011.
Arscott, D. B., Tockner, K., Van Der Nat, D., and Ward, J. V.: Aquatic habitat dynamics along a braided alpine river ecosystem (Tagliamento River, Northeast Italy), Ecosystem, 5, 802–814, https://doi.org/10.1007/s10021-002-0192-7, 2002.
Banfai, D. S. and Bowman, D. M. J. S.: Forty years of lowland monsoon rainforest expansion in Kakadu National Park, Northern Australia, Biol. Conserv., 131, 553–565, https://doi.org/10.1016/j.biocon.2006.03.002, 2006.
Basumatary, H., Devi, H. S., Borah, S. B., and Das, A. K.: Land cover dynamics and their driving factors in a protected floodplain ecosystem, River Res. Appl., 37, 627–643, https://doi.org/10.1002/rra.3775, 2021.
Beeri, O., Phillips, R., Hendrickson, J., Frank, A. B., and Kronberg, S.: Estimating forage quantity and quality using aerial hyperspectral imagery for northern mixed-grass prairie, Remote Sens. Environ., 110, 216–225, https://doi.org/10.1016/j.rse.2007.02.027, 2007.
Belgiu, M. and Drăgu, L.: Random forest in remote sensing: A review of applications and future directions, ISPRS Journal of Photogrammetry and Remote Sensing, Vol. 114, 24–31, ISSN: 0924-2716, https://doi.org/10.1016/j.isprsjprs.2016.01.011, 2016.
Bhatta, S., Joshi, L. R., and Shrestha, B. B.: Distribution and impact of invasive alien plant species in Bardia National Park, western Nepal, Environ. Conserv., 47, 197–205, https://doi.org/10.1017/S0376892920000223, 2020.
Bhatta, S. R.: Status paper of Royal Bardia National Park, Grassl. Ecol. Manag. Prot. areas Nepal, Kathmandu ICIMOD, 122–127, 2000.
Bhattarai, B. P. and Kindlmann, P.: Habitat heterogeneity as the key determinant of the abundance and habitat preference of prey species of tiger in the Chitwan National Park, Nepal, Acta Theriol. (Warsz), 57, 89–97, https://doi.org/10.1007/s13364-011-0047-8, 2012.
Bhattarai, B. R., Wright, W., Poudel, B. S., Aryal, A., Yadav, B. P., and Wagle, R.: Shifting paradigms for Nepal's protected areas: history, challenges and relationships, J. Mt. Sci., 14, 964–979, https://doi.org/10.1007/s11629-016-3980-9, 2017.
Biswas, T.: A spatio-temporal analysis of landscape change within the Eastern Terai, India: linking grassland and forest loss to change in river course and land use, PhD thesis, Utah State University, 2010.
Biswas, T., Ramsey, R. D., Bissonette, J. A., and Symanzik, J.: Integration of two spectral indices to monitor loss of moist grasslands within the Jaldapara Wildlife Sanctuary, India, Int. J. Remote Sens., 35, 1038–1063, https://doi.org/10.1080/01431161.2013.875631, 2014.
Bolton, M.: Royal Karnali Wildlife Reserve Management Plan, National P., FAO/UNDP, Rome, 70 pp., 1976.
Bond, W. J.: What limits trees in C4 grasslands and savannas?, Annu. Rev. Ecol. Evol. Syst., 39, 641–659, https://doi.org/10.1146/annurev.ecolsys.39.110707.173411, 2008.
Bond, W. J. and Parr, C. L.: Beyond the forest edge: Ecology, diversity and conservation of the grassy biomes, Biol. Conserv., 143, 2395–2404, https://doi.org/10.1016/j.biocon.2009.12.012, 2010.
Breiman, L.: Random forests, Mach. Learn., 45, 5–32, https://doi.org/10.1023/A:1010933404324, 2001.
Brown, D. E. and Makings, E.: A guide to North American grasslands, University of Arizona for the Boyce Thompson Southwestern Arboretum, Desert Plants, 29, 1–160, 2014.
Brown, K.: Plain tales from the grasslands: extraction, value and utilization of biomass in Royal BardiaNational Park, Nepal, Biodivers. Conserv., 6, 59–74, 1997.
Brown, K.: The political ecology of biodiversity, conservation and development in Nepal's Terai: Confused meanings, means and ends, Ecol. Econ., 24, 73–87, 1998.
Buisson, E., Le Stradic, S., Silveira, F. A. O., Durigan, G., Overbeck, G. E., Fidelis, A., Fernandes, G. W., Bond, W. J., Hermann, J. M., Mahy, G., Alvarado, S. T., Zaloumis, N. P., and Veldman, J. W.: Resilience and restoration of tropical and subtropical grasslands, savannas, and grassy woodlands, Biol. Rev., 94, 590–609, https://doi.org/10.1111/brv.12470, 2019.
Chetri, M., Odden, M., and Wegge, P.: Snow leopard and Himalayan wolf: Food habits and prey selection in the central Himalayas, Nepal, PLoS One, 12, e0170549, https://doi.org/10.1371/journal.pone.0170549, 2017.
Chhetri, T. B., Dhital, Y. P., Tandong, Y., Devkota, L. P., and Dawadi, B.: Observations of heavy rainfall and extreme flood events over Banke-Bardiya districts of Nepal in 2016–2017, Prog. Disaster Sci., 6, 100074, https://doi.org/10.1016/j.pdisas.2020.100074, 2020.
Clements, F. E.: Plant succession; an analysis of the development of vegetation, Plant succession; an analysis of the development of vegetation, Carnegie Institution of Washington, 1–512, https://doi.org/10.5962/bhl.title.56234, 1916.
Corenblit, D., Tabacchi, E., Steiger, J., and Gurnell, A. M.: Reciprocal interactions and adjustments between fluvial landforms and vegetation dynamics in river corridors: A review of complementary approaches, Earth-Sci. Rev., 84, 56–86, https://doi.org/10.1016/j.earscirev.2007.05.004, 2007.
Corenblit, D., Steiger, J., and Tabacchi, E.: Biogeomorphologic succession dynamics in a Mediterranean river system, Ecography, 33, 1136–1148, https://doi.org/10.1111/j.1600-0587.2010.05894.x, 2010.
Crist, E. P. and Cicone, R. C.: Application of the Tasseled Cap concept to simulated Thematic Mapper data, Photogramm. Eng. Remote Sens., 50, 343–352, 1984.
Dahal, P., Shrestha, M. L., Panthi, J., and Pradhananga, D.: Modeling the future impacts of climate change on water availability in the Karnali River Basin of Nepal Himalaya, Environ. Res., 185, 109430, https://doi.org/10.1016/j.envres.2020.109430, 2020.
Dhakal, M., Karki, M., Jnawali, S. R., Subedi, N., Pradhan, N. M. B., Malla, S., Lamichhane, B. R., Pokheral, C. P., Thapa, G. J., and Oglethorpe, J.: Status of tigers and prey in Nepal, Dep. Natl. Park. Wildl. Conserv. Kathmandu, Nepal, 2014.
DHM: Observed climate trend analysis of Nepal in the districts and physiographic regions of Nepal (1971–2014), Department of Hydrology and Meteorology, Government of Nepal, Kathmandu, 2017.
Dinerstein, E.: An ecological survey of the royal Karnali-Bardia Wildlife Reserve, Nepal, Part I: Vegetation, modifying factors, and successional relationships, Biol. Conserv., 15, 127–150, https://doi.org/10.1016/0006-3207(79)90030-2, 1979a.
Dinerstein, E.: An ecological survey of the royal Karnali-Bardia Wildlife Reserve, Nepal, Part II: Habitat/Animal Interactions, Biol. Conserv., 15, 127–150, https://doi.org/10.1016/0006-3207(79)90030-2, 1979b.
Dinerstein, E.: An ecological survey of the Royal Karnali-Bardia Wildlife Reserve, Nepal, Part III: Ungulate populations, Biol. Conserv., 18, 5–37, https://doi.org/10.1016/0006-3207(80)90063-4, 1980.
Dinerstein, E.: Effects of Rhinoceros unicornis on Riverine Forest Structure in Lowland Nepal, Ecology, 73, 701–704, 1992.
Dingle, E., Attal, M., and Sinclair, H. D.: Abrasion-set limits on Himalayan gravel flux, Nature, 544, 471–474, https://doi.org/10.1038/nature22039, 2017.
Dingle, E. H., Creed, M. J., Sinclair, H. D., Gautam, D., Gourmelen, N., Borthwick, A. G. L., and Attal, M.: Dynamic flood topographies in the Terai region of Nepal, Earth Surf. Process. Land., 45, 3092–3102, https://doi.org/10.1002/esp.4953, 2020a.
Dingle, E. H., Sinclair, H. D., Venditti, J. G., Attal, M., Kinnaird, T. C., Creed, M., Quick, L., Nittrouer, J. A., and Gautam, D.: Sediment dynamics across gravel-sand transitions: Implications for river stability and floodplain recycling, Geology, 48, 468–472, https://doi.org/10.1130/G46909.1, 2020b.
DNPWC and DFSC: Status of Tigers and Prey in Nepal, Department of National Parks and Wildlife Conservation & Department of Forests and Soil Conservation, Ministry of Forests and Environment, 2018.
DNPWC and DFSC: Status of Tigers and Prey in Nepal. Department of National Parks and Wildlife Conservation & Department of Forests and Soil Conservation, Ministry of Forests and Environment, 2022.
Donchyts, G., Baart, F., Winsemius, H., Gorelick, N., Kwadijk, J., and Van De Giesen, N.: Earth's surface water change over the past 30 years, Nature Climate Change, Nature, 6, 810–813, https://doi.org/10.1038/nclimate3111, 2016.
Dufour, S., Rinaldi, M., Piégay, H., and Michalon, A.: How do river dynamics and human influences affect the landscape pattern of fluvial corridors? Lessons from the Magra River, Central-Northern Italy, Landsc. Urban Plan., 134, 107–118, https://doi.org/10.1016/j.landurbplan.2014.10.007, 2015.
Dufour, S., Rodríguez-González, P. M., and Laslier, M.: Tracing the scientific trajectory of riparian vegetation studies: Main topics, approaches and needs in a globally changing world, Sci. Total Environ., 653, 1168–1185, https://doi.org/10.1016/j.scitotenv.2018.10.383, 2019.
DNPWC: Grassland habitat mapping in Chitwan National Park, Department of National Parks and Wildlife Conservation, Chitwan National Park Office, Kasara, Chitwan, Nepal, 2016.
FAO: Map accuracy assessment and area estimation: a practical guide, National forest Monitoring Assessment Working Paper, No. 46, Food and Agriculture Organization of the United Nations, Rome, 2016.
Filla, M., Lama, R. P., Ghale, T. R., Signer, J., Filla, T., Aryal, R. R., Heurich, M., Waltert, M., Balkenhol, N., and Khorozyan, I.: In the shadows of snow leopards and the Himalayas: density and habitat selection of blue sheep in Manang, Nepal, Ecol. Evol., 11, 108–122, https://doi.org/10.1002/ece3.6959, 2021.
Flannigan, M. D. and Wotton, B. M.: Climate, weather, and area burned, in: Forest Fires, Elsevier, 351–373, https://doi.org/10.1016/b978-012386660-8/50012-x, 2001.
Ghimire, B., Bhujel, K., and Rijal, K.: Fire hazard zonation of Bardia National Park, Nepal: A disaster preparedness approach, Nepal J. Environ. Sci., 2, 27–33, https://doi.org/10.3126/njes.v2i0.22738, 2014.
Gómez, C., White, J. C., and Wulder, M. A.: Optical remotely sensed time series data for land cover classification: A review, ISPRS J. Photogramm. Remote Sens., 116, 55–72, https://doi.org/10.1016/j.isprsjprs.2016.03.008, 2016.
Gorelick, N., Hancher, M., Dixon, M., Ilyushchenko, S., Thau, D., and Moore, R.: Google Earth Engine: Planetary-scale geospatial analysis for everyone, Remote Sens. Environ., 202, 18–27, https://doi.org/10.1016/j.rse.2017.06.031, 2017.
Gu, Y., Brown, J. F., Verdin, J. P., and Wardlow, B.: A five-year analysis of MODIS NDVI and NDWI for grassland drought assessment over the central Great Plains of the United States, Geophys. Res. Lett., 34, https://doi.org/10.1029/2006GL029127, 2007.
Gumbel, E. J.: Statistics of extremes, Columbia university press, 1958.
Gunderson, L. H.: Panarchy: understanding transformations in human and natural systems, Island press, 2002.
Hansen, M. C. and Loveland, T. R.: A review of large area monitoring of land cover change using Landsat data, Remote Sens. Environ., 122, 66–74, https://doi.org/10.1016/j.rse.2011.08.024, 2012.
Harezlak, V., Geerling, G. W., Rogers, C. K., Penning, W. E., Augustijn, D. C. M., and Hulscher, S. J. M. H.: Revealing 35 years of land cover dynamics in floodplains of trained lowland rivers using satellite data, River Res. Appl., 36, 1213–1221, https://doi.org/10.1002/rra.3633, 2020.
Harihar, A., Pandav, B., and MacMillan, D. C.: Identifying realistic recovery targets and conservation actions for tigers in a human-dominated landscape using spatially explicit densities of wild prey and their determinants, Divers. Distrib., 20, 567–578, https://doi.org/10.1111/ddi.12174, 2014.
Henderson-Sellers, A. and Pitman, A. J.: Land-surface schemes for future climate models: specification, aggregation, and heterogeneity, J. Geophys. Res., 97, 2687–2696, https://doi.org/10.1029/91JD01697, 1992.
Hermosilla, T., Wulder, M. A., White, J. C., Coops, N. C., and Hobart, G. W.: Disturbance-Informed Annual Land Cover Classification Maps of Canada's Forested Ecosystems for a 29-Year Landsat Time Series, Can. J. Remote Sens., 44, 67–87, https://doi.org/10.1080/07038992.2018.1437719, 2018.
Hirota, M., Holmgren, M., Van Nes, E. H., and Scheffer, M.: Global resilience of tropical forest and savanna to critical transitions, New Ser., 334, 232–235, 2011.
Hoetzel, S., Dupont, L., Schefuß, E., Rommerskirchen, F., and Wefer, G.: The role of fire in Miocene to Pliocene C4 grassland and ecosystem evolution, Nat. Geosci., 6, 1027–1030, https://doi.org/10.1038/ngeo1984, 2013.
Hupp, C. R. and Osterkamp, W. R.: Riparian vegetation and fluvial geomorphic processes, Geomorphology, 14, 277–295, https://doi.org/10.1016/0169-555X(95)00042-4, 1996.
Iglesias, V., Whitlock, C., Markgraf, V., and Bianchi, M. M.: Postglacial history of the Patagonian forest/steppe ecotone (41–43∘ S), Quaternary Sci. Rev., 94, 120–135, https://doi.org/10.1016/j.quascirev.2014.04.014, 2014.
Irengbam, M., Dobriyal, P., Hussain, S. A., and Badola, R.: Balancing conservation and development in Nandhaur Wildlife Sanctuary, Uttarakhand, India, Curr. Sci. India, 112, 1187–1196, 2017.
Jalonen, J., Järvelä, J., Virtanen, J. P., Vaaja, M., Kurkela, M., and Hyyppä, H.: Determining characteristic vegetation areas by terrestrial laser scanning for floodplain flow modeling, Water, 7, 420–437, https://doi.org/10.3390/w7020420, 2015.
Jnawali, S. R. and Wegge, P. W.: Space and habitat use by a small re-introduced population of greater one – horned rhinoceros in RBNP – a preliminary report, 1993.
Jnawali, S. R. and Wegge, P. W.: Importance of tall grasslands in megaherbivore conservation, in: Grassland ecology and management in protected areas of Nepal, Proceedings of a Workshop, Royal Bardia National Park, Thakurdwara, Bardia, Nepal, 15–19 March, 1999, Vol. 2, Terai protected areas, 84–91, 2000.
Junk, W. J., Bayley, P. B., and Sparks, R. E.: The flood pulse concept in river-floodplain systems, Can. Spec. Publ. Fish. Aquat. Sci., 106, 110–127, 1989.
Karki, J. B., Jhala, Y. V., Pandav, B., Jnawali, S. R., Shrestha, R., Thapa, K., Thapa, G., Pradhan, N. M. B., Lamichane, B. R., and Barber-Meyer, S. M.: Estimating tiger and its prey abundance in Bardia National Park, Nepal, Banko Janakari, 26, 60–69, https://doi.org/10.3126/banko.v26i1.15503, 2016.
Kelley, L. C., Pitcher, L., and Bacon, C.: Using google earth engine to map complex shade-grown coffee landscapes in northern Nicaragua, Remote Sens., 10, 952, https://doi.org/10.3390/rs10060952, 2018.
Kollmann, J., Vieli, M., Edwards, P. J., Tockner, K., and Ward, J. V.: Interactions between vegetation development and island formation in the Alpine river Tagliamento, Appl. Veg. Sci., 2, 25–36, https://doi.org/10.2307/1478878, 1999.
Kral, M. J. C., Van Lunenburg, M., and Van Alphen, J. J. M.: The spatial distribution of ungulates and primates across the vegetation gradient in Bardiya National Park, West Nepal, Asian J. Conserv. Biol., 6, 38–44, 2017.
Lallias-Tacon, S., Liébault, F., and Piégay, H.: Use of airborne LiDAR and historical aerial photos for characterising the history of braided river floodplain morphology and vegetation responses, Catena, 149, 742–759, https://doi.org/10.1016/j.catena.2016.07.038, 2017.
Lawrence, R. L., Wood, S. D., and Sheley, R. L.: Mapping invasive plants using hyperspectral imagery and Breiman Cutler classifications (RandomForest), Remote Sens. Environ., 100, 356–362, https://doi.org/10.1016/j.rse.2005.10.014, 2006.
Lehmann, C. E. R., Anderson, T. M., Sankaran, M., Higgins, S. I., Archibald, S., Hoffmann, W. A., Hanan, N. P., Williams, R. J., Fensham, R. J., Felfili, J., Hutley, L. B., Ratnam, J., San Jose, J., Montes, R., Franklin, D., Russell-Smith, J., Ryan, C. M., Durigan, G., Hiernaux, P., Haidar, R., Bowman, D. M. J. S., and Bond, W. J.: Savanna vegetation-fire-climate relationships differ among continents, Science, 343, 548–552, https://doi.org/10.1126/science.1247355, 2014.
Lehmkuhl, J. F.: The ecology of south-Asian tall-grass communities, PhD dissertation, University of Washington, Seattle, WA, 1989.
Lehmkuhl, J. F.: A classification of subtropical riverine grassland and forest in Chitwan National Park, Nepal, 111, 29–43, https://doi.org/10.1007/BF00045575, 1994.
Lehmkuhl, J. F.: The organisation and human use of Terai riverine grasslands in the Royal Chitwan National Park, Nepal, Grassl. Ecol. Manag. Prot. areas Nepal. Proc. a Work, R. Bardia Natl. Park, Thakurdwara, Bardia, Nepal, 15–19 March, 1999, Vol. 2, Terai Prot. areas, 37–49, 2000.
Leier, A. L., DeCelles, P. G., and Pelletier, J. D.: Mountains, monsoons, and megafans, Geology, 33, 289–292, https://doi.org/10.1130/G21228.1, 2005.
Lorenz, C. M., Dijk, G. M. Van, Hattum, A. G. M. Van, and Cofino, W. P.: Concepts in river ecology: implications for indicator development, Regul. Rivers Res. Manag., 13, 501–516, https://doi.org/10.1002/(SICI)1099-1646(199711/12)13:6<501::AID-RRR479>3.0.CO;2-1, 1997.
Louzada, R. O., Bergier, I., and Assine, M. L.: Landscape changes in avulsive river systems: Case study of Taquari River on Brazilian Pantanal wetlands, Sci. Total Environ., 723, 138067, https://doi.org/10.1016/j.scitotenv.2020.138067, 2020.
Lyngdoh, S., Shrotriya, S., Goyal, S. P., Clements, H., Hayward, M. W., and Habib, B.: Prey preferences of the snow leopard (Panthera uncia): Regional diet specificity holds global significance for conservation, PLoS One, 9, 2, https://doi.org/10.1371/journal.pone.0088349, 2014.
Mas, J. F. and Vega, E.: Assessing yearly transition probability matrix for land use/land cover dynamics, Accuracy 2012 – Proc. 10th Int. Symp. Spat. Accuracy Assess. Nat. Resour. Environ. Sci., 345–350, 2012.
McGarigal, K., Cushman, S. A., and Ene, E.: FRAGSTATS: Spatial pattern analysis program for categorical maps, Computer software program produced by the authors at the University of Massachusetts, Amherst, http://www.umass.edu/landeco/research/fragstats/fragstats.html (last access: 15 April 2020), 2002.
McGarigal, K. and Marks, B. J.: FRAGSTATS: spatial pattern analysis program for quantifying landscape structure, General Technical Report – US Department of Agriculture, Forest Service, 128 pp., 1995.
Meyer, W. B. and Turner, B. L.: Human population growth and global land-use/cover change, Annu. Rev. Ecol. Syst., 23, 39–61, 1992.
Moe, S. R. and Wegge, P.: Spacing behaviour and habitat use of axis deer (Axis axis) in lowland Nepal, Can. J. Zool., 72, 1735–1744, https://doi.org/10.1139/z94-234, 1994.
Myneni, R. B., Hall, F. G., Sellers, P. J., and Marshak, A. L.: Interpretation of spectral vegetation indexes, IEEE Trans. Geosci. Remote Sens., 33, 481–486, https://doi.org/10.1109/36.377948, 1995.
Neupane, D., Kwon, Y., Risch, T. S., and Johnson, R. L.: Changes in habitat suitability over a two decade period before and after Asian elephant recolonization, Glob. Ecol. Conserv., 22, e01023, https://doi.org/10.1016/j.gecco.2020.e01023, 2020.
Newbold, C. and Mountford, O.: Water level requirements of wetland plants and animals, Engl. Nat. Freshw. Ser., 5, 1997.
Odden, M.: Tigers, leopards and their prey in Bardia National Park, Nepal. PhD thesis, Norwegian University of Life Sciences, https://doi.org/10.13140/RG.2.2.29496.75527, 2007.
Odden, M. and Wegge, P.: Spacing and activity patterns of leopards Panthera pardus in the Royal Bardia National Park, Nepal, Wildlife Biol., 11, 145–152, https://doi.org/10.2981/0909-63962005.
Odden, M., Wegge, P., and Storaas, T.: Hog deer (Axis porcinus) need threatened tallgrass floodplains: A study of habitat selection in lowland Nepal, Anim. Conserv., 8, 99–104, https://doi.org/10.1017/S1367943004001854, 2005.
Oli, M. K.: Seasonal patterns in habitat use of blue sheep Pseudois nayaur (Artiodactyla, Bovidae) in Nepal, Mammalia, 60, 187–193, https://doi.org/10.1515/mamm.1996.60.2.187, 1996.
Orem, C. A. and Pelletier, J. D.: Quantifying the time scale of elevated geomorphic response following wildfires using multi-temporal LiDAR data: An example from the Las Conchas fire, Jemez Mountains, New Mexico, 232, 224–238, https://doi.org/10.1016/j.geomorph.2015.01.006, 2015.
Owen-Smith, R. N.: Megaherbivores: the influence of very large body size on ecology, Cambridge university press, 1988.
Pal, M.: Random forest classifier for remote sensing classification, Int. J. Remote Sens., 26, 217–222, https://doi.org/10.1080/01431160412331269698, 2005.
Parr, C. L., Gray, E. F., and Bond, W. J.: Cascading biodiversity and functional consequences of a global change-induced biome switch, Divers. Distrib., 18, 493–503, https://doi.org/10.1111/j.1472-4642.2012.00882.x, 2012.
Peet, N. B.: Biodiversity and the management of tall grassland in Nepal, PhD thesis, University of East Anglia, 1997.
Peet, N. B., Watkinson, A. R., Bell, D. J., and Kattel, B. J.: Plant diversity in the threatened sub-tropical grasslands of Nepal, Biol. Conserv., 88, 193–206, https://doi.org/10.1016/S0006-3207(98)00104-9, 1999a.
Peet, N. B., Watkinson, A. R., Bell, D. J., and Sharma, U. R.: The conservation management of Imperata cylindrica grassland in Nepal with fire and cutting: An experimental approach, J. Appl. Ecol., 36, 374–387, https://doi.org/10.1046/j.1365-2664.1999.00405.x, 1999b.
Pickett, S. T. A., Collins, S. L., and Armesto, J. J.: A hierarchical consideration of causes and mechanisms of succession, in: Theory and models in vegetation science, Springer, 109–114, 1987.
Plakman, V., Janssen, T., Brouwer, N., and Veraverbeke, S.: Mapping species at an individual-tree scale in a temperate forest, using Sentinel-2 images, airborne laser scanning data, and random forest classification, Remote Sens., 12, 1–25, https://doi.org/10.3390/rs12223710, 2020.
Plexida, S. G., Sfougaris, A. I., Ispikoudis, I. P., and Papanastasis, V. P.: Selecting landscape metrics as indicators of spatial heterogeneity-A comparison among Greek landscapes, Int. J. Appl. Earth Obs. Geoinf., 26, 26–35, https://doi.org/10.1016/j.jag.2013.05.001, 2014.
Poff, N. L., Allan, J. D., Bain, M. B., Karr, J. R., Prestegaard, K. L., Richter, B. D., Sparks, R. E., and Stromberg, J. C.: The natural flow regime, Bioscience, 47, 769–784, 1997.
Pokheral, S. K.: Floristic composition, biomass production, and biomass harvest in the grasslands of the Royal Bardia National Park, Bardia, Nepal, MS thesis, Agric. Univ. Norw., 1993.
Pradhan, N. M. B., Wegge, P., Moe, S. R., and Shrestha, A. K.: Feeding ecology of two endangered sympatric megaherbivores: Asian elephant Elephas maximus and greater one-horned rhinoceros Rhinoceros unicornis in lowland Nepal, Wildlife Biol., 14, 147–154, https://doi.org/10.2981/0909-6396(2008)14[147:FEOTES]2.0.CO;2, 2008.
Price, K. P., Guo, X., and Stiles, J. M.: Optimal landsat TM band combinations and vegetation indices for discrimination of six grassland types in eastern Kansas, Int. J. Remote Sens., 23, 5031–5042, https://doi.org/10.1080/01431160210121764, 2002.
Puyravaud, J. P., Dufour, C., and Aravajy, S.: Rain forest expansion mediated by successional proc esses in vegetation thickets in the Western Ghats of India, J. Biogeogr., 30, 1067–1080, https://doi.org/10.1046/j.1365 2699.2003.00882.x, 2003.
Rakhal, B., Adhikari, T. R., Sharma, S., and Ghimire, G. R.: Assessment of channel shifting of Karnali Megafan in Nepal using remote sensing and GIS, Ann. GIS, 27, 177–188, https://doi.org/10.1080/19475683.2021.1871950, 2021.
Ram, A. K. and Acharya, H.: Status distribution and habitat use by Asian elephants in Nepal. A Compendium of Conservation Bulletin, Kathmandu: Department of National Parks and Wildlife Conservation, 155–160, 2020.
Rapinel, S., Mony, C., Lecoq, L., Clément, B., Thomas, A., and Hubert-Moy, L.: Evaluation of Sentinel-2 time-series for mapping floodplain grassland plant communities, Remote Sens. Environ., 223, 115–129, https://doi.org/10.1016/j.rse.2019.01.018, 2019.
Rock, B. N., Vogelmann, J. E., Williams, D. L., Vogelmann, A. F., and Hoshizaki, T.: Remote Detection of Forest Damage, Bioscience, 36, 439–445, https://doi.org/10.2307/1310339, 1986.
Rouse, J. W., Hass, R. H., Schell, J. A., and Deering, D. W.: Monitoring vegetation systems in the Great Plains with ERTS, NASA Spec. Publ., 351, 309, 1974.
Rovero, F., Augugliaro, C., Havmoller, R. W., Groff, C., Zimmermann, F., Oberosler, V., and Tenan, S.: Co-occurrence of snow leopard Panthera uncia, Siberian ibex Capra sibirica and livestock: Potential relationships and effects, Oryx, 54, 118–124, https://doi.org/10.1017/S0030605317001685, 2020.
Roy, D. P., Kovalskyy, V., Zhang, H. K., Vermote, E. F., Yan, L., Kumar, S. S., and Egorov, A.: Characterization of Landsat-7 to Landsat-8 reflective wavelength and normalized difference vegetation index continuity, Remote Sens. Environ., 185, 57–70, https://doi.org/10.1016/j.rse.2015.12.024, 2016.
Sankaran, M.: Diversity patterns in savanna grassland communities: Implications for conservation strategies in a biodiversity hotspot, Biodivers. Conserv., 18, 1099–1115, https://doi.org/10.1007/s10531-008-9519-9, 2009.
Sarma, P. K., Lahkar, B. P., Ghosh, S., Rabha, A., Das, J. P., Nath, N. K., Dey, S., and Brahma, N.: Land-use and land-cover change and future implication analysis in Manas National Park, India using multi-temporal satellite data, Curr. Sci., 95, 223–227, 2008.
Seidensticker, J.: Ungulate populations in Chitawan Valley, Nepal, Biol. Conserv., 10, 183–210, https://doi.org/10.1016/0006-3207(76)90034-3, 1976.
Sertel, E., Topaloğlu, R. H., Şallı, B., Algan, I. Y., and Aksu, G. A.: Comparison of landscape metrics for three different level land cover/land use maps, ISPRS Int. J. Geo-Information, 7, 408, https://doi.org/10.3390/ijgi7100408, 2018.
Sharma, B. K.: Wildlife habitat mapping by using Geographic Information Systems (GIS) in the Karnali floodplain of Royal Bardia National Park in lowland Nepal, MS thesis, Norwegian University of Life Sciences, 1999.
Shrestha, S. and Shrestha, J.: Asian elephants and their status in Nepal: a review, J. Agric. Nat. Resour., 4, 227–237, https://doi.org/10.3126/janr.v4i2.33828, 2021.
Silva, L. C. R., Sternberg, L., Haridasan, M., Hoffmann, W. A., Miralles-Wilhelm, F., and Franco, A. C.: Expansion of gallery forests into central Brazilian savannas, Glob. Chang. Biol., 14, 2108–2118, https://doi.org/10.1111/j.1365-2486.2008.01637.x, 2008.
Sinclair, H. D., Brown, S., Adhikari, B. R., Attal, M., Borthwick, A., Budimir, M., Creed, M., Dingle, E. H., Dugar, S., Gautam, D., Gourmelen, N., Mudd, S. M., Neupane, S., Pedreschi, R., Ruwanpura, K. N., Sharma, J., Sneddon, A., and Uprety, M.: Improving understanding of flooding and resilience in the Terai, Nepal, 1–5, 2017.
Solins, J. P., Thorne, J. H., and Cadenasso, M. L.: Riparian canopy expansion in an urban landscape: Multiple drivers of vegetation change along headwater streams near Sacramento, California, https://doi.org/10.1016/j.landurbplan.2017.12.005, 2017.
Staver, A. C., Archibald, S., and Levin, S. A.: The global extent and determinants of savanna and forest as alternative biome states, Science, 334, 230–232, https://doi.org/10.1126/science.1210465, 2011.
Straatsma, M. W. and Baptist, M. J.: Floodplain roughness parameterization using airborne laser scanning and spectral remote sensing, Remote Sens. Environ., 112, 1062–1080, https://doi.org/10.1016/j.rse.2007.07.012, 2008.
Takahata, C., Amin, R., Sarma, P., Banerjee, G., Oliver, W., and Fa, J. E.: Remotely-sensed active fire data for protected area management: Eight-year patterns in the Manas National Park, India, Environ. Manage., 45, 414–423, https://doi.org/10.1007/s00267-009-9411-8, 2010.
Thapa, K., Nepal, S., Thapa, G., Bhatta, S. R., and Wikramanayake, E.: Past, present and future conservation of the greater one-horned rhinoceros Rhinoceros unicornis in Nepal, Oryx, 47, 345–351, https://doi.org/10.1017/S0030605311001670, 2013.
Thapa, S. K., de Jong, J. F., Subedi, N., Hof, A. R., Corradini, G., Basnet, S., and Prins, H. H. T.: Forage quality in grazing lawns and tall grasslands in the subtropical region of Nepal and implications for wild herbivores, Glob. Ecol. Conserv., 30, e01747, https://doi.org/10.1016/j.gecco.2021.e01747, 2021.
Thapa, T. B.: Habitat Suitability Evaluation for Leopard (Panthera pardus) Using Remote Sensing and GIS in and Around Chitwan National Park, Nepal, PhD thesis, Saurashtra University, 2011.
Thing, S. J., Jones, R., and Jones, C. B.: The Politics of Conservation: Sonaha, Riverscape in the Bardia National Park and Buffer Zone, Nepal, Conserv. Soc., 15, 292–303, https://doi.org/10.4103/cs.cs_15_2, 2017.
Thorne, C. R., Russell, A. P. G., and Alam, M. K.: Planform pattern and channel evolution of the Brahmaputra River, Bangladesh, Geol. Soc. Spec. Publ., 75, 257–276, https://doi.org/10.1144/GSL.SP.1993.075.01.16, 1993.
Tilman, D.: Plant strategies and the dynamics and structure of plant communities Princeton, New Jersey Princet. Univ. Press, 26–28, 1988.
Trauernicht, C., Murphy, B. P., Tangalin, N., and Bowman, D. M. J. S.: Cultural legacies, fire ecology, and environmental change in the Stone Country of Arnhem Land and Kakadu National Park, Australia, Ecol. Evol., 3, 286–297, https://doi.org/10.1002/ece3.460, 2013.
Turner, M. G., Baker, W. L., Peterson, C. J., and Peet, R. K.: Factors influencing succession: Lessons from large, infrequent natural disturbances, Ecosystems, 1, 511–523, https://doi.org/10.1007/s100219900047, 1998.
USAID: Lower Karnali Watershed Health Report, 1–23, 2018.
Van Iersel, W. K.: A bird's-eye view on river floodplains: Mapping and monitoring land cover with remote sensing, PhD thesis, Utrecht University, 2020.
Van Iersel, W. K., Addink, E. A., Straatsma, M. W., and Middelkoop, H.: River floodplain vegetation classification using multi-temporal high-resolution colour infrared UAV imagery, 2–5, https://doi.org/10.3990/2.423, 2016.
Van Iersel, W. K., Straatsma, M., Addink, E., and Middelkoop, H.: Monitoring height and greenness of non-woody floodplain vegetation with UAV time series, ISPRS J. Photogramm. Remote Sens., 141, 112–123, https://doi.org/10.1016/j.isprsjprs.2018.04.011, 2018.
Van Langevelde, F., Van De Vijver, C. A. D. M., Kumar, L., Van De Koppel, J., De Ridder, N., Van Andel, J., Skidmore, A. K., Hearne, J. W., Stroosnijder, L., Bond, W. J., Prins, H. H. T., and Rietkerk, M.: Effects of fire and herbivory on the stability of savanna ecosystems, Ecology, 84, 337–350, 2003.
van Lunenburg, M., Kral, M. J. C., and van Alphen, J. J. M.: Decreased ungulate density in Bardiya National Park, West Nepal, and the implications for increasing tiger populations, A comment on Thapa et al. (2015), Ethol. Ecol. Evol., 29, 304–309, https://doi.org/10.1080/03949370.2016.1145147, 2017.
Veldman, J. W., Buisson, E., Durigan, G., Fernandes, G. W., Le Stradic, S., Mahy, G., Negreiros, D., Overbeck, G. E., Veldman, R. G., Zaloumis, N. P., Putz, F. E., and Bond, W. J.: Toward an old-growth concept for grasslands, savannas, and woodlands, Front. Ecol. Environ., 13, 154–162, https://doi.org/10.1890/140270, 2015.
Vesipa, R., Camporeale, C., and Ridolfi, L.: Effect of river flow fluctuations on riparian vegetation dynamics: Processes and models, Adv. Water Resour., 110, 29–50, https://doi.org/10.1016/j.advwatres.2017.09.028, 2017.
Wagner-Lücker, I., Lanz, E., Förster, M., Janauer, G. A., and Reiter, K.: Knowledge-based framework for delineation and classification of ephemeral plant communities in riverine landscapes to support EC Habitat Directive assessment, Ecol. Inform., 14, 44–47, https://doi.org/10.1016/j.ecoinf.2012.11.003, 2013.
Wang, J., Wang, K., Zhang, M., and Zhang, C.: Impacts of climate change and human activities on vegetation cover in hilly southern China, Ecol. Eng., 81, 451–461, https://doi.org/10.1016/j.ecoleng.2015.04.022, 2015.
Wegge, P. and Storaas, T.: Sampling tiger ungulate prey by the distance method: Lessons learned in Bardia National Park, Nepal, Anim. Conserv., 12, 78–84, https://doi.org/10.1111/j.1469-1795.2008.00230.x, 2009.
Wegge, P., Odden, M., and Storaas, T.: No decline in ungulate prey for tigers in Bardia National Park in Nepal: comments on van Lunenburg et al. (2017) and Kral et al. (2017), Ethol. Ecol. Evol., 31, 394–398, https://doi.org/10.1080/03949370.2019.1609094, 2019.
White, P. S.: Natural disturbance and patch dynamics: an introduction, Nat. Disturb. Patch Dyn., 3–13, 1985.
White, R. P., Murray, S., Rohweder, M., Prince, S. D., and Thompson, K. M.: Grassland ecosystems, World Resources Institute Washington, DC, USA, 2000.
Wigley, B. J., Cramer, M. D., and Bond, W. J.: Sapling survival in a frequently burnt savanna: Mobilisation of carbon reserves in Acacia karroo, Plant Ecol., 203, 1–11, https://doi.org/10.1007/s11258-008-9495-x, 2009.
Young, N. E., Anderson, R. S., Chignell, S. M., Vorster, A. G., Lawrence, R., and Evangelista, P. H.: A survival guide to Landsat preprocessing, Ecology, 98, 920–932, https://doi.org/10.1002/ecy.1730, 2017.
Zanter, K.: Landsat Collection 1 Level 1 Product Definition. United States Geological Survey, United States Geological Survey, 26 pp., 2019.
Zhu, Z., Wang, S., and Woodcock, C. E.: Improvement and expansion of the Fmask algorithm: Cloud, cloud shadow, and snow detection for Landsats 4–7, 8, and Sentinel 2 images, Remote Sens. Environ., 159, 269–277, https://doi.org/10.1016/j.rse.2014.12.014, 2015.
Zurqani, H. A., Post, C. J., Mikhailova, E. A., Schlautman, M. A., and Sharp, J. L.: Geospatial analysis of land use change in the Savannah River Basin using Google Earth Engine, Int. J. Appl. Earth Obs. Geoinf., 69, 175–185, https://doi.org/10.1016/j.jag.2017.12.006, 2018.
- Abstract
- Introduction
- Study area
- Data and methods
- Results
- Discussion
- Conclusions
- Appendix A: Supporting figures
- Appendix B: Pre-processing of imagery
- Appendix C: Grouping of vegetation types
- Appendix D: Criteria for classification
- Appendix E: Error matrices
- Data availability
- Author contributions
- Competing interests
- Disclaimer
- Acknowledgements
- Review statement
- References
- Supplement