the Creative Commons Attribution 4.0 License.
the Creative Commons Attribution 4.0 License.
 | 30 Mar 2023
Meteorological history of low-forest-greenness events in Europe in 2002–2022
Mauro Hermann
Matthias Röthlisberger
Arthur Gessler
Andreas Rigling
Cornelius Senf
Thomas Wohlgemuth
Heini Wernli
Forest dieback in Europe has recently intensified and has become more extensive. This dieback is strongly influenced by meteorological variations of temperature, T2m, and precipitation, P, and can be monitored with forest greenness. This study quantitatively investigates the 3-year meteorological history preceding events of reduced forest greenness in Europe's temperate and Mediterranean biome with a systematic approach. A specific focus lies in the timing of unusually persistent and unusually strong anomalies of T2m and P, as well as their relation to synoptic weather systems. A pragmatic approach based on remote sensing observations of the normalized difference vegetation index (NDVI) serves to identify low-forest-NDVI events at the 50 km scale in Europe in June to August 2002–2022. We quantify the impact of the hottest summer on record in Europe in 2022, which, according to our criteria, negatively affected 37 % of temperate and Mediterranean forest regions, and thereby reduced forest greenness more extensively than any other summer in 2002–2022.
The low-NDVI events occurred in particularly dry and hot summers, but their meteorological histories also featured significant anomalies further in the past, with clear differences between the temperate and Mediterranean biome. A key feature is the anomalous accumulation of dry periods (i.e., periods with a P deficit) over the preceding 26 and 34 months in the temperate and Mediterranean biome, respectively. In the temperate biome only, T2m was anomalously persistent during almost the same 26-month period and featured distinctive peaks late in the past three growing seasons. While anomalously strong hot–dry conditions were characteristic of temperate low-NDVI events already in the previous summer, we find hardly any other systematic meteorological precursor in the Mediterranean prior to the event year. The identified dry periods went along with reduced cyclone activity in the Mediterranean and positive anticyclone frequency in the temperate biome. The occurrence of these two weather systems is locally more nuanced, showing, e.g., consistently increased and decreased cyclone frequency over western and northern Europe, respectively, in all event summers. Finally, the systematic meteorological histories are useful to test whether locally observed meteorological impacts, e.g., structural overshoot, systematically influenced the investigated events. In summary, systematic investigations of the multi-annual meteorological history provided clear evidence of how surface weather and synoptic-scale weather systems over up to 3 years can negatively impact European forest greenness. The observation of the record-extensive low-NDVI event in the summer of 2022 underlines that understanding the forest–meteorology interaction is of particular relevance for forest dieback in a changing climate.
- Article
(11636 KB) - Full-text XML
- BibTeX
- EndNote


European forest ecosystems have typically been in balance with their climatic environment and are, thus, largely adapted and acclimated to meteorological variability on a larger scale. This balance is increasingly disturbed by anthropogenic climate change (Seidl et al., 2017; McDowell et al., 2020). As a consequence, the exposure and vulnerability of European forests to climatic disturbances have increased in the recent 2 decades, and forests have been affected on up to the continental scale (Seidl et al., 2014; Bastos et al., 2020b). On that scale, drought has been a key driver of excess forest mortality in Europe (Senf et al., 2020). In addition to meteorological drought, i.e., reduced precipitation, high temperatures enhance the atmospheric water demand and, thus, water loss from the vegetated surface by evapotranspiration (Yuan et al., 2019; Grossiord et al., 2020). Heat waves (Meehl and Tebaldi, 2004; IPCC, 2021), meteorological droughts (Trenberth et al., 2014; IPCC, 2021), and compound hot droughts (Allen et al., 2015) are expected to intensify future forest dieback (Brodribb et al., 2020). Such meteorological conditions, for example during 2003 and 2018, led to stem dehydration (Salomón et al., 2022), reduced forest growth (Ciais et al., 2005; Trotsiuk et al., 2020), hydraulic failure (Schuldt et al., 2020), and ultimately increased tree mortality in Europe (Allen et al., 2010; Hansen et al., 2013).
Although some forest ecosystems are adapted to low water availability in summer, e.g., in the summer-dry Mediterranean, or throughout the year, e.g., in dry inner-Alpine regions, extended and more frequent hot droughts will strongly affect their dynamics including growth and survival (Rigling et al., 2013; Tague et al., 2019; Ogaya et al., 2020). In this context, forest greenness as measured by satellites is an effective measure related to forest vitality to monitor the recent forest dieback in Europe (Orth et al., 2016; Buras et al., 2020, 2021).
While forests can endure short-term weather extremes (e.g., an individual multi-day heat wave), they are more susceptible to longer-term extreme conditions. Particularly harmful long-term extremes include persisting or sequentially occurring droughts, whereby additional negative legacy effects are mediated through reduced tree resilience (Anderegg et al., 2015, 2020; Bose et al., 2020). However, drought legacy effects have also been suggested to provide acclimation to following droughts (Gessler et al., 2020). Furthermore, a stormy winter followed by a hot–dry growing season allows bark beetles to spread out and attack damaged and dying trees (Temperli et al., 2013; Biedermann et al., 2019; Jakoby et al., 2019). Additionally, persisting heat and/or precipitation deficits can – given fuel availability – trigger forest fires year-round, occurring most intensely in the Mediterranean (Turco et al., 2017). In strongly fuel-limited regions, however, forest fires can in the long run negatively feed back on fire activity (Pausas and Ribeiro, 2013). Lastly, beneficial conditions in the past can exert a negative legacy on forest vitality in following dry periods through soil moisture depletion and structural overshoot, i.e., an excessive canopy buildup relative to average climatic conditions (Bastos et al., 2020a; Zhang et al., 2021). These examples highlight that in addition to the (co-)occurrence, magnitude, and duration of heat and drought, the position of such meteorological precursors in the longer-term history likely modulates their impact on forest greenness.
In the context of interaction and legacy effects, the point in time when such meteorological precursors are relevant to forest greenness is intensively discussed in the literature. Meteorological impact has often been investigated by considering the mean over the current growing season (e.g., Hlásny et al., 2017; Seftigen et al., 2018; Seidl et al., 2020). Senf et al. (2020) revealed that hot–dry conditions are particularly harmful for canopy mortality in March to July. Neumann et al. (2017) identified warm summer temperatures and high variability in seasonal precipitation as meteorological drivers of tree mortality. In a drought-prone region, forest drought stress was about equally determined by temperature in summer and the previous autumn and precipitation during the cold season (Williams et al., 2013). More generally, drought-induced partial or complete tree mortality shows a threshold behavior (Brodribb et al., 2020; Senf et al., 2020); however, water stress is not equally harmful at all times. Especially outside or at the bounds of the growing season there are complicating factors such as growth compensation, soil moisture coupling, and snowmelt (e.g., Harpold et al., 2015; Bastos et al., 2020a).
The meteorological processes that are relevant for low-forest-greenness cover a wide range of timescales. Longer-term meteorological extremes are of particular interest; however, they are typically composed of multiple shorter-term anomalies, which are not necessarily extreme at their respective timescale (Röthlisberger et al., 2020). On the timescale of about 3–10 d atmospheric blocking can induce surface heat waves and suppress precipitation by large-scale subsidence and high solar insolation (Pfahl and Wernli, 2012a; Zschenderlein et al., 2019). On somewhat longer timescales, recurrent and quasi-stationary Rossby wave patterns may also lead to co-occurring hot and dry conditions (Wolf et al., 2018; Röthlisberger and Martius, 2019; Ali et al., 2021). In central Europe, summer heat waves can also arise from weak synoptic forcing, which, in combination with a Scandinavian blocking, allowed for widespread hot–dry conditions in 2018 (Spensberger et al., 2020). During heat waves with no or reduced precipitation, the soil moisture–atmosphere coupling exacerbates the near-surface warming over drying soils (Fischer et al., 2007; Seneviratne et al., 2010). Accordingly, and especially in the Mediterranean, an extremely hot summer is more likely in years of a winter and/or spring precipitation deficit (Russo et al., 2019). As Europe hardly experiences drought over a longer (multi-annual) timescale (Schubert et al., 2016), seasonal meteorology, which is strongly linked to weather system dynamics, is of particular interest for forest greenness, and, therefore, in the focus of the present study.
Despite great progress in understanding the eco-hydraulic mechanisms linking drought to events of reduced forest greenness (Brodribb et al., 2020), a systematic analysis of the meteorological history of such events is still lacking. The purpose of this study is to systematically document and characterize significant aspects of these meteorological histories in Europe's temperate and Mediterranean forests. Specifically, this study seeks to identify meteorological precursors over the 3 years prior to reduced forest greenness in Europe. Hereby “precursors” are features in the meteorological histories that occur at a statistically significantly higher rate preceding reduced forest greenness events than in climatology and that are shared among many events. We focus on the evolution of 90 d moving average 2 m temperature (T2m90 d) and precipitation (P90 d) as key variables and quantitatively address the following research questions: (1) when and how did T2m90 d and P90 d deviate significantly from climatology during the meteorological history of low-forest-greenness events in Europe? (2) Which anomalies in weather system frequencies went along with the meteorological precursors identified in (1)? To identify low-forest-greenness events, generally characteristic of low-productivity crown defoliating and tree mortality (Buras et al., 2021), we use persistently low values of the normalized difference vegetation index (NDVI) in the summer of 2002–2022 (Sects. 2.2 and 2.3). Based on a sub-sampling of the resulting low-NDVI events in combination with a bootstrapping test, we then identify meteorological precursors along their meteorological history and further investigate the spatial variation of weather system frequencies in Sect. 3. Finally, we critically discuss our results and the limitations of our analyses in Sect. 4.
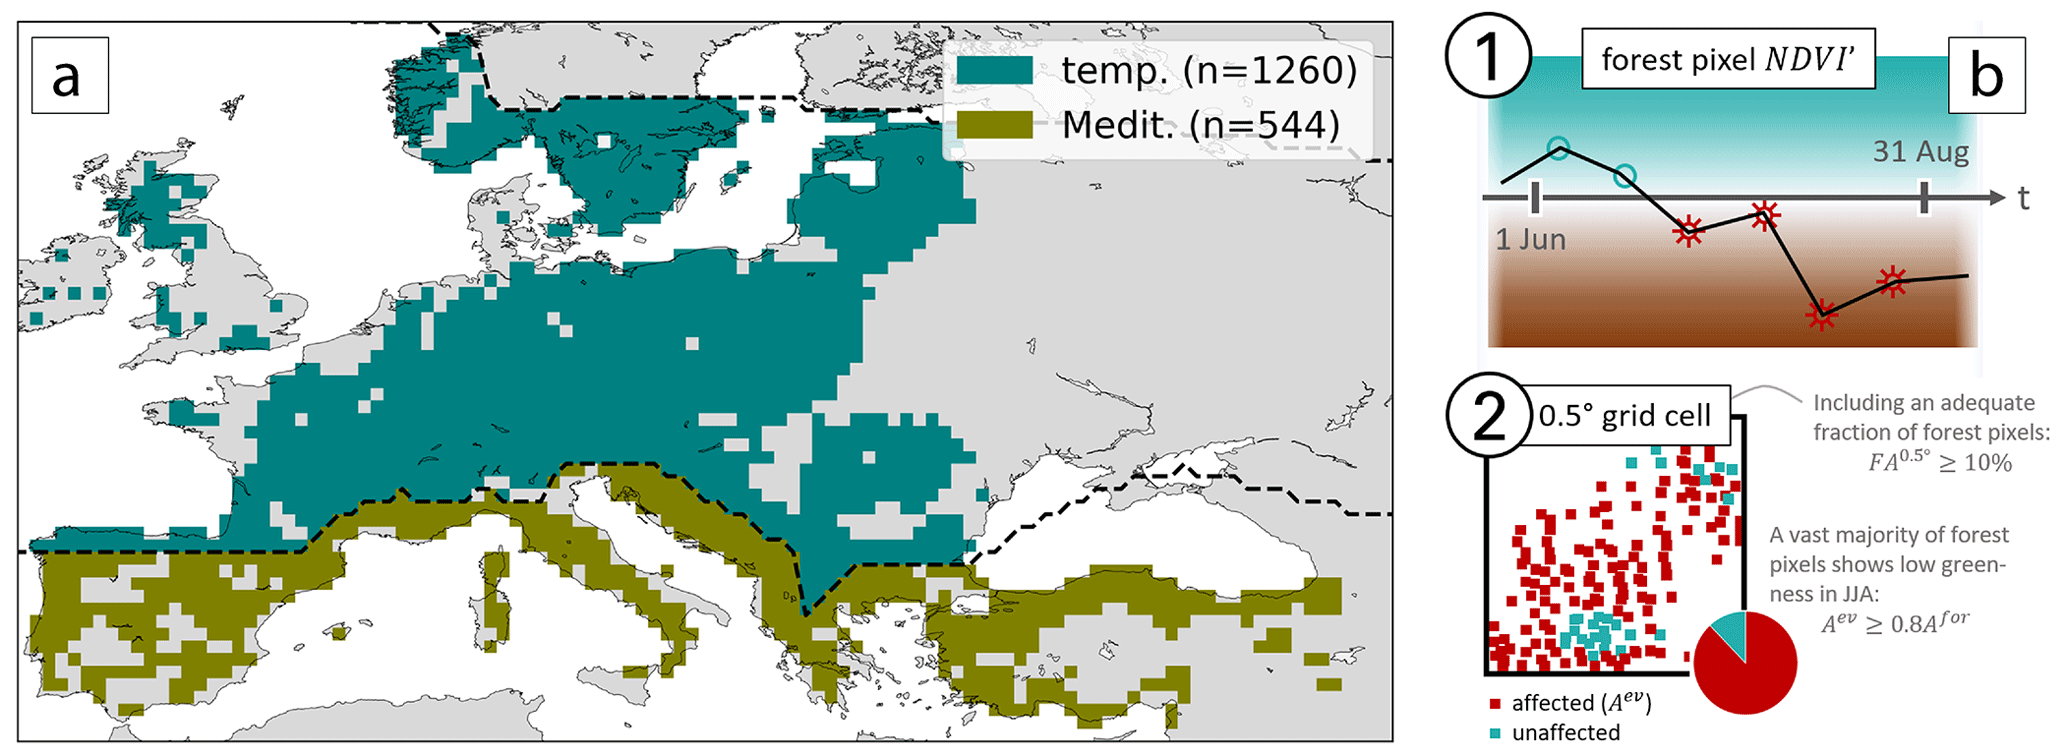
Figure 1(a) Forest grid cells (FA0.5≥10 %) in the study domain, separated into temperate and Mediterranean forests by the dashed black line. The boreal biome is cropped by the second dashed line in the northeast of the domain. (b) An example of the identification of low-NDVI grid cells, where (1) forest pixels are flagged if at least four out of six time steps show negative NDVI′, and (2) forest grid cells are flagged if more than 80 % of the forest pixels within are flagged (details provided in the text).
We differentiate broadly between the temperate and Mediterranean biome according to Schultz (2005) in the domain extending from 10∘ W to 45∘ E and 35 to 65∘ N, excluding all boreal forests (Fig. 1a).
2.1 Forest cover data
Land surface cover observations are available from the Corine Land Cover (CLC) data set from the Copernicus Land Monitoring Service at 100 m horizontal resolution from the year 2012 (Büttner et al., 2004). For comparison with the other data sets introduced below, we first interpolate the surface cover to 250 m resolution by nearest-neighbor interpolation. Following that, we mask all pixels except forest land cover classes (coniferous, broad-leaved, and mixed forest) to retain only forest pixels. We then coarse-grain fractional forest area to grid cells, which is the spatial resolution of the meteorological data set used here (ERA5; see below), hereafter denoted as FA0.5. For our analysis we only consider grid cells with a significant fraction of forest cover, defined here as FA %, and hereafter refer to these grid cells as “forest grid cells”. According to this definition, there are 1260 and 544 forest grid cells in the temperate and Mediterranean biome, respectively (Fig. 1a).
2.2 Normalized difference vegetation index
We use the 16-day normalized difference vegetation index (NDVI) at ∼250 m horizontal resolution from March 2002 to August 2022 from NASA MODIS Terra (Didan, 2015). As mentioned in Sect. 2.1, we only use NDVI at forest pixels according to CLC in order to minimize noise from other land cover types. The NDVI is based on the red (RED) and near-infrared (NIR) spectral irradiance:
The greener a forest pixel is, the closer its NDVI is to +1 (Tucker, 1979). The NDVI serves as a measure of vegetation greenness and has previously been used to assess drought impact on ecosystems (Anyamba and Tucker, 2012; Orth et al., 2016; Buras et al., 2020). The Application for Extracting and Exploring Analysis Ready Samples (AppEEARS; https://appeears.earthdatacloud.nasa.gov, last access: 26 July 2022) additionally provides MODIS pixel quality. In addition to masking non-forest land cover, we mask NDVI values that are of poor quality due to snow and clouds and only retain NDVI values with good and marginal quality according to MODIS pixel quality. The resulting NDVI time series contain missing values, which we linearly interpolate from neighboring time steps as in Buras et al. (2021). Finally, we perform a linear detrending of the entire time series as in Buras et al. (2020) due to a detected greening trend (Bastos et al., 2017).
After this post-processing, at every pixel j at time step t in year n we consider NDVI anomalies (NDVI) from the median in June–August (JJA). To later compare anomalies at different pixels, we standardize the anomalies by the local interquartile range IQRj(NDVI):
The climatological median and IQRj(NDVI) are both calculated from all 126 NDVI anomalies in JJA 2002–2022.
2.3 Identification of low-NDVI grid cells
The aim of the approach presented here is to identify persistently low NDVI in JJA at the relatively large 0.5∘ scale of the meteorological reanalysis data, i.e., widespread low NDVI. In essence, the approach (1) considers all forest pixels j within a forest grid cell J and flags them if at least four out of the six NDVI′ values in JJA are negative and (2) identifies an event at forest grid cell J (i.e., a grid cell with at least 10 % forest cover) if at least 80 % of forest pixels inside J are flagged (Fig. 1b). Our identification scheme thus features three tuning parameters: (1) the FAmin, (2) the minimum count of negative NDVI′ per JJA at the pixel level (), and (3) the fraction of affected forest pixels per forest grid cell. An extensive sensitivity analysis to reasonable variations in these parameters is presented in Appendix A. Hereafter we detail the technical implementation of the approach.
In the first step (1 in Fig. 1b), we count the number of negative NDVI values for the six 16 d values during JJA in year n (cn,ev). At every forest pixel j, an event flag evj,n is determined according to the following criterion:
In the second step (2 in Fig. 1b), the total area of forest pixels with ev in J () has to be at least 80 % of the total forest pixel area in J () – for which we use the term minimum affected ratio ARmin=80 % hereafter:
Lastly, for the identified low-NDVI grid cells, we calculate a measure of event intensity as the average of JJA minimum NDVI over all flagged forest pixels (ev), hereafter termed NDVI. Subscripts are omitted whenever possible without loss of clarity.
The resulting low-NDVI grid cells (EV) are tested for their sensitivity to the three threshold parameters ARmin, FAmin, and in Appendix A. Our choice of ARmin=80 % and FAmin=10 % was guided by compromising between sufficient low-NDVI grid cells for statistical evaluation and reasonable peculiarity of the low-NDVI events, which represent a form of extreme event. Furthermore, the main results of this study demonstrate a very low sensitivity to variation in these two threshold parameters, similarly to a reduction in . A substantial change of the identified low-NDVI grid cells results only when increasing to 5, i.e., almost uninterruptedly negative NDVI in JJA. While these most extreme events would be worth studying, a robust statistical evaluation thereof would not be possible as the number of low-NDVI grid cells diminishes drastically (by almost a factor of 10).
2.4 ERA5 reanalysis data
Atmospheric fields are used from ERA5 reanalysis from the European Centre for Medium-Range Weather Forecasts (ECMWF; Hersbach et al., 2020) available hourly on 137 vertical levels and on a regular grid with 0.5° horizontal resolution.
2.4.1 Normalized meteorological 90 d anomalies
Our analyses focus on 90 d moving average values of 2 m temperature (T2m90 d), total precipitation (P90 d), cyclone frequency (f90 d(C)), and anticyclone frequency (f90 d(A)). The standard ERA5 variables T2m90 d and P90 d can directly be averaged, while cyclones and anticyclones are first identified from hourly sea-level pressure (SLP) fields. These two most central weather systems are of interest to the low-NDVI events' meteorological history, as they not only determine vertical and horizontal atmospheric transport of heat, momentum, and moisture but also are of great importance to the temperature and humidity structure of the atmosphere. Cyclones (anticyclones) are identified according to Wernli and Schwierz (2006) and Sprenger et al. (2017) as objects of low (high) SLP and are, hence, identified from the outermost closed SLP isoline around local SLP minima (maxima). From these hourly object masks we then calculate weather system frequencies over 90 d, i.e., f90 d(C) and f90 d(A). For all four variables, we calculate 90 d mean values as a right-aligned moving average. Each 90 d mean value, therefore, is labeled by the time step of the last value that contributes to the average. Leap days are discarded from the analysis to maintain consistency in each calendar day's climatology and the length of the meteorological histories. The climatologies of the four variables cover 90 d moving averages from 1 September 2001 to 31 August 2022.
Based on these 90 d mean values, we compute normalized anomalies at every forest grid cell for variables X=T2m90 d, P90 d, f90 d(C), and f90 d(A) as follows:
where X′ denotes the normalized anomaly, and and σX denote the climatological seasonal mean and standard deviation in the considered 21 years, respectively, i.e., are calculated over 21 values. Note that the normalization of X anomalies is used merely for scaling with local variability. The scaling enables the spatiotemporal comparison of these anomalies and is not used to estimate the anomalies' return period or likelihood.
For better interpretability of individual meteorological histories, we express f90 d(C) and f90 d(A) also as anomalies relative to the climatological mean. These relative anomalies are calculated as follows, e.g.,
2.4.2 Significance assessment
We conduct a bootstrapping test to identify statistically significant meteorological precursors that are shared among the low-NDVI grid cells. The details of how the test is conducted are described in Appendix B. Broadly, the bootstrapping produces 1000 synthetic samples of meteorological histories with a sample size equal to the number of low-NDVI grid cells under consideration. These samples correspond to many realizations of meteorological histories that are expected in the climatological reference period of 2002–2022 and are used to construct the null distributions for our statistical tests. We test the following null hypothesis H0,EV at different time lags Δt prior to the event time tev with a significance level of α=5 %:
-
H0,EV. The meteorological history at tev−Δt is equal to a randomly sampled meteorological history.
We use different test statistics (with corresponding null distributions) to investigate different aspects of the meteorological history under consideration. These statistics are the sample mean , , , and and the fraction of Δt that is on average covered by warm () and dry periods (). Moreover, our statistical procedure is designed to retain the spatial correlation of the original meteorological fields (for details see Appendix B). In the bootstrapping test, p values are estimated from the percentiles of the 1000 reference values. Values of the meteorological history under consideration that lie outside the range of the 1000 corresponding synthetic values of the reference meteorological histories receive a p value of 0 (Röthlisberger et al., 2016). We reject the above null hypothesis if an observed value lies outside the 2.5th to 97.5th percentile of the null distribution (defined by the 1000 values obtained from the bootstrapping). That is, we reject the null hypothesis at the 5 % significance level. At time lags Δt when the meteorological history of the low-NDVI grid cells lies outside the confidence interval, H0,EV is rejected.
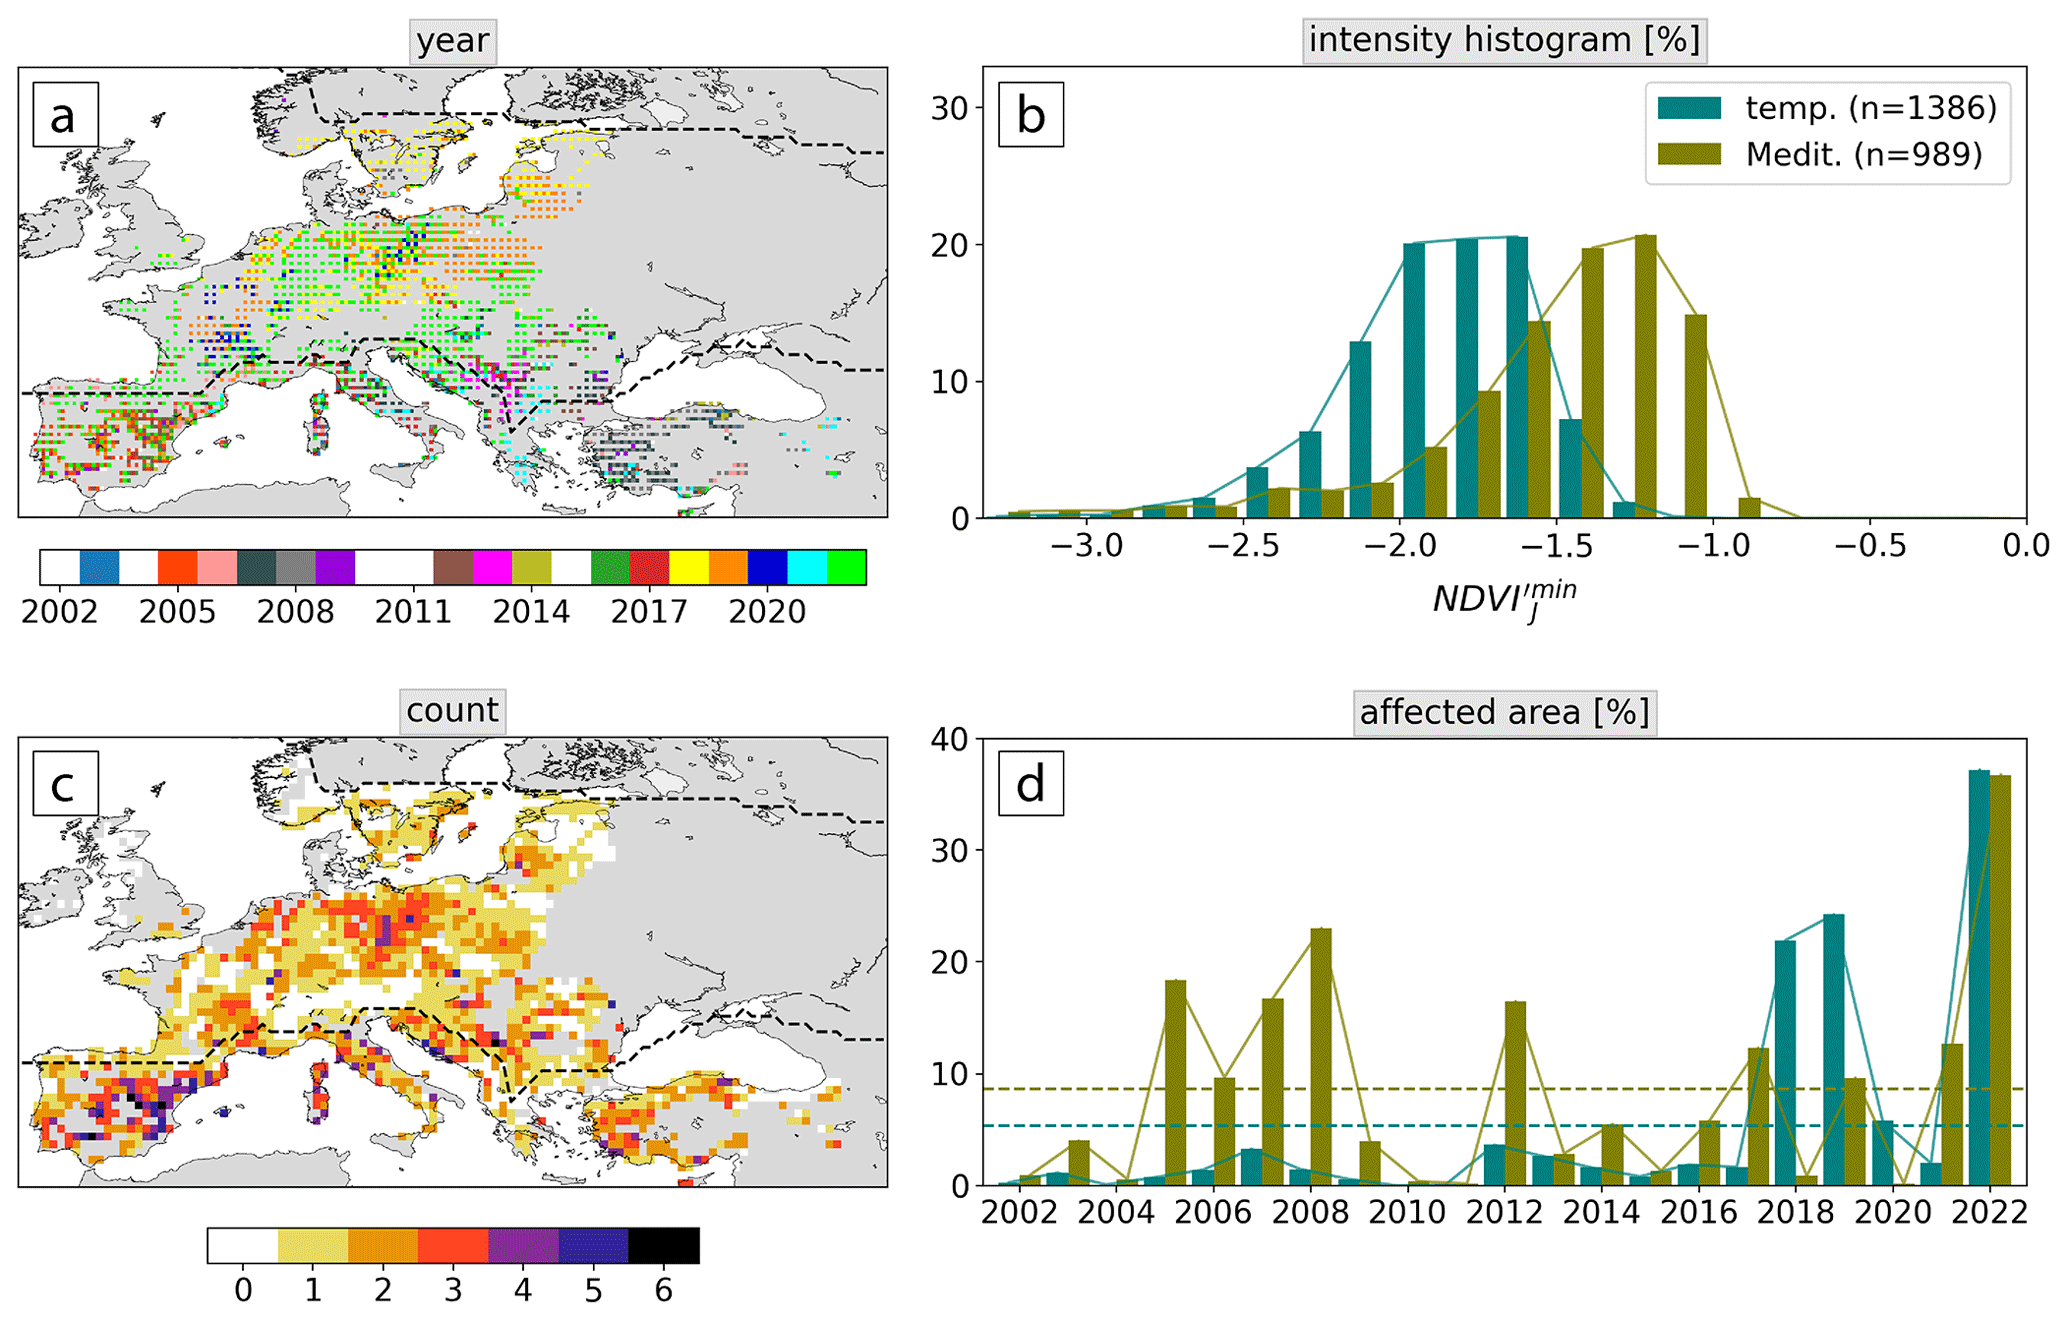
Figure 2Maps of (a) years with a low-NDVI event (Appendix C) and (c) total number of events. (b) Histogram of event intensity as measured by NDVI in the two biomes and (d) time series of the biome-integrated area of low-NDVI grid cells relative to all forest grid cells (in %). Years with few low-NDVI grid cells are shown in white in (a). In (a) each grid cell is split into four parts, showing the event year of up to the four most intense events. Dashed lines in (d) show the average over all years. Dashed lines in (a) and (c) delineate the temperate and Mediterranean biome.
3.1 Low-NDVI events in JJA 2002–2022
Low-NDVI events covered substantial parts of both biomes in JJA 2002–2022 and were by far the most frequent in 2022 (Fig. 2a, d; Appendix C). In the temperate biome, the years with most low-NDVI grid cells – in descending order – were 2022, 2019, 2018, and 2020 (Fig. 2a, d). It is noteworthy that these 4 years all lie in the last 5 years of the study period. In 2022, 37 % of temperate forests were affected by the low-NDVI event, which far exceeded the previous record years 2019 and 2018 by 13 % and 15 %, respectively (Fig. 2d). The top years in terms of affected forest grid cells in the Mediterranean biome were 2022, 2008, 2005, and 2007, again sorted by decreasing area affected. Low-NDVI grid cells were on average almost twice as frequent in the Mediterranean biome (9 % yr−1) compared to the temperate biome (5 % yr−1; Fig. 2d). Lastly, most low-NDVI events in each biome go along with increased disturbance area as measured by forest canopy mortality according to Appendix D; Senf and Seidl, 2021a). More specifically, in the overlap period of the two data sets, most low-NDVI grid cells are among the top four and five ranks regarding the disturbance area in temperate and Mediterranean forests, respectively.
Mediterranean forests faced more but typically less intense events, as measured by the grid-cell-wide average of summer minimum NDVI′ (Fig. 2b, Sect. 2.3). NDVI was usually between −1 and −2, whereas it was about 0.5 lower for temperate forests. Hotspot regions with three or more events during the 21 years were northeastern Germany, the Balkans, and large parts of the Mediterranean biome (Fig. 2c). In the latter, we find many low-NDVI grid cells in Spain in 2005, in Turkey in 2007 and 2008, in Italy in 2017, and in 2022 in the northern Mediterranean (Appendix C). Central Europe was largely affected in the past 5 years, while the 2018–2019 events extended further to Scandinavia and the Baltic, and 2020 and 2022 also affected parts of southern France and eastern Europe, respectively. Note that 26 % of the forest regions in the study domain never experienced an event in JJA 2002–2022 (Fig. 2c). These grid cells are in northeastern Europe or in mountainous regions including the Alps, the Carpathians, the southern Dinaric Alps, and the Pontic Mountains.
3.2 Examples of meteorological histories
Low-NDVI events affected different forest regions all over Europe with varying intensity, each with its own meteorological history. We first present three examples of low-NDVI events that affected regions in Spain in 2005 (SPA05), in the Balkans in 2013 (BAL13), and in France in 2022 (FRA22; Fig. 3). First, these examples illustrate that the low-NDVI events identified in this study did not necessarily feature a very low-NDVI, i.e., a strong magnitude of negative NDVI′. For example, some grid cells of the SPA05 region were identified as low-NDVI grid cells with NDVI just above −1, while others with NDVI in northern Spain were not identified (Fig. 3a, d). In fact, this is an expected behavior of our identification scheme, as low-NDVI grid cells are meant to indicate that a very large fraction of forest pixels in that grid cell experienced persistently low NDVI (Sect. 2.3). In many cases, however, event intensity as a JJA-integrated quantity was increased at low-NDVI grid cells, compared to their event-unaffected surrounding, illustrated in the example of France in 2022 (Fig. 3c, f). Lastly, another interesting case (not shown) occurred in 2014 in Slovenia, where an ice storm in the previous winter caused a few low-NDVI grid cells (Appendix C; Buras et al., 2021; Senf and Seidl, 2021c).
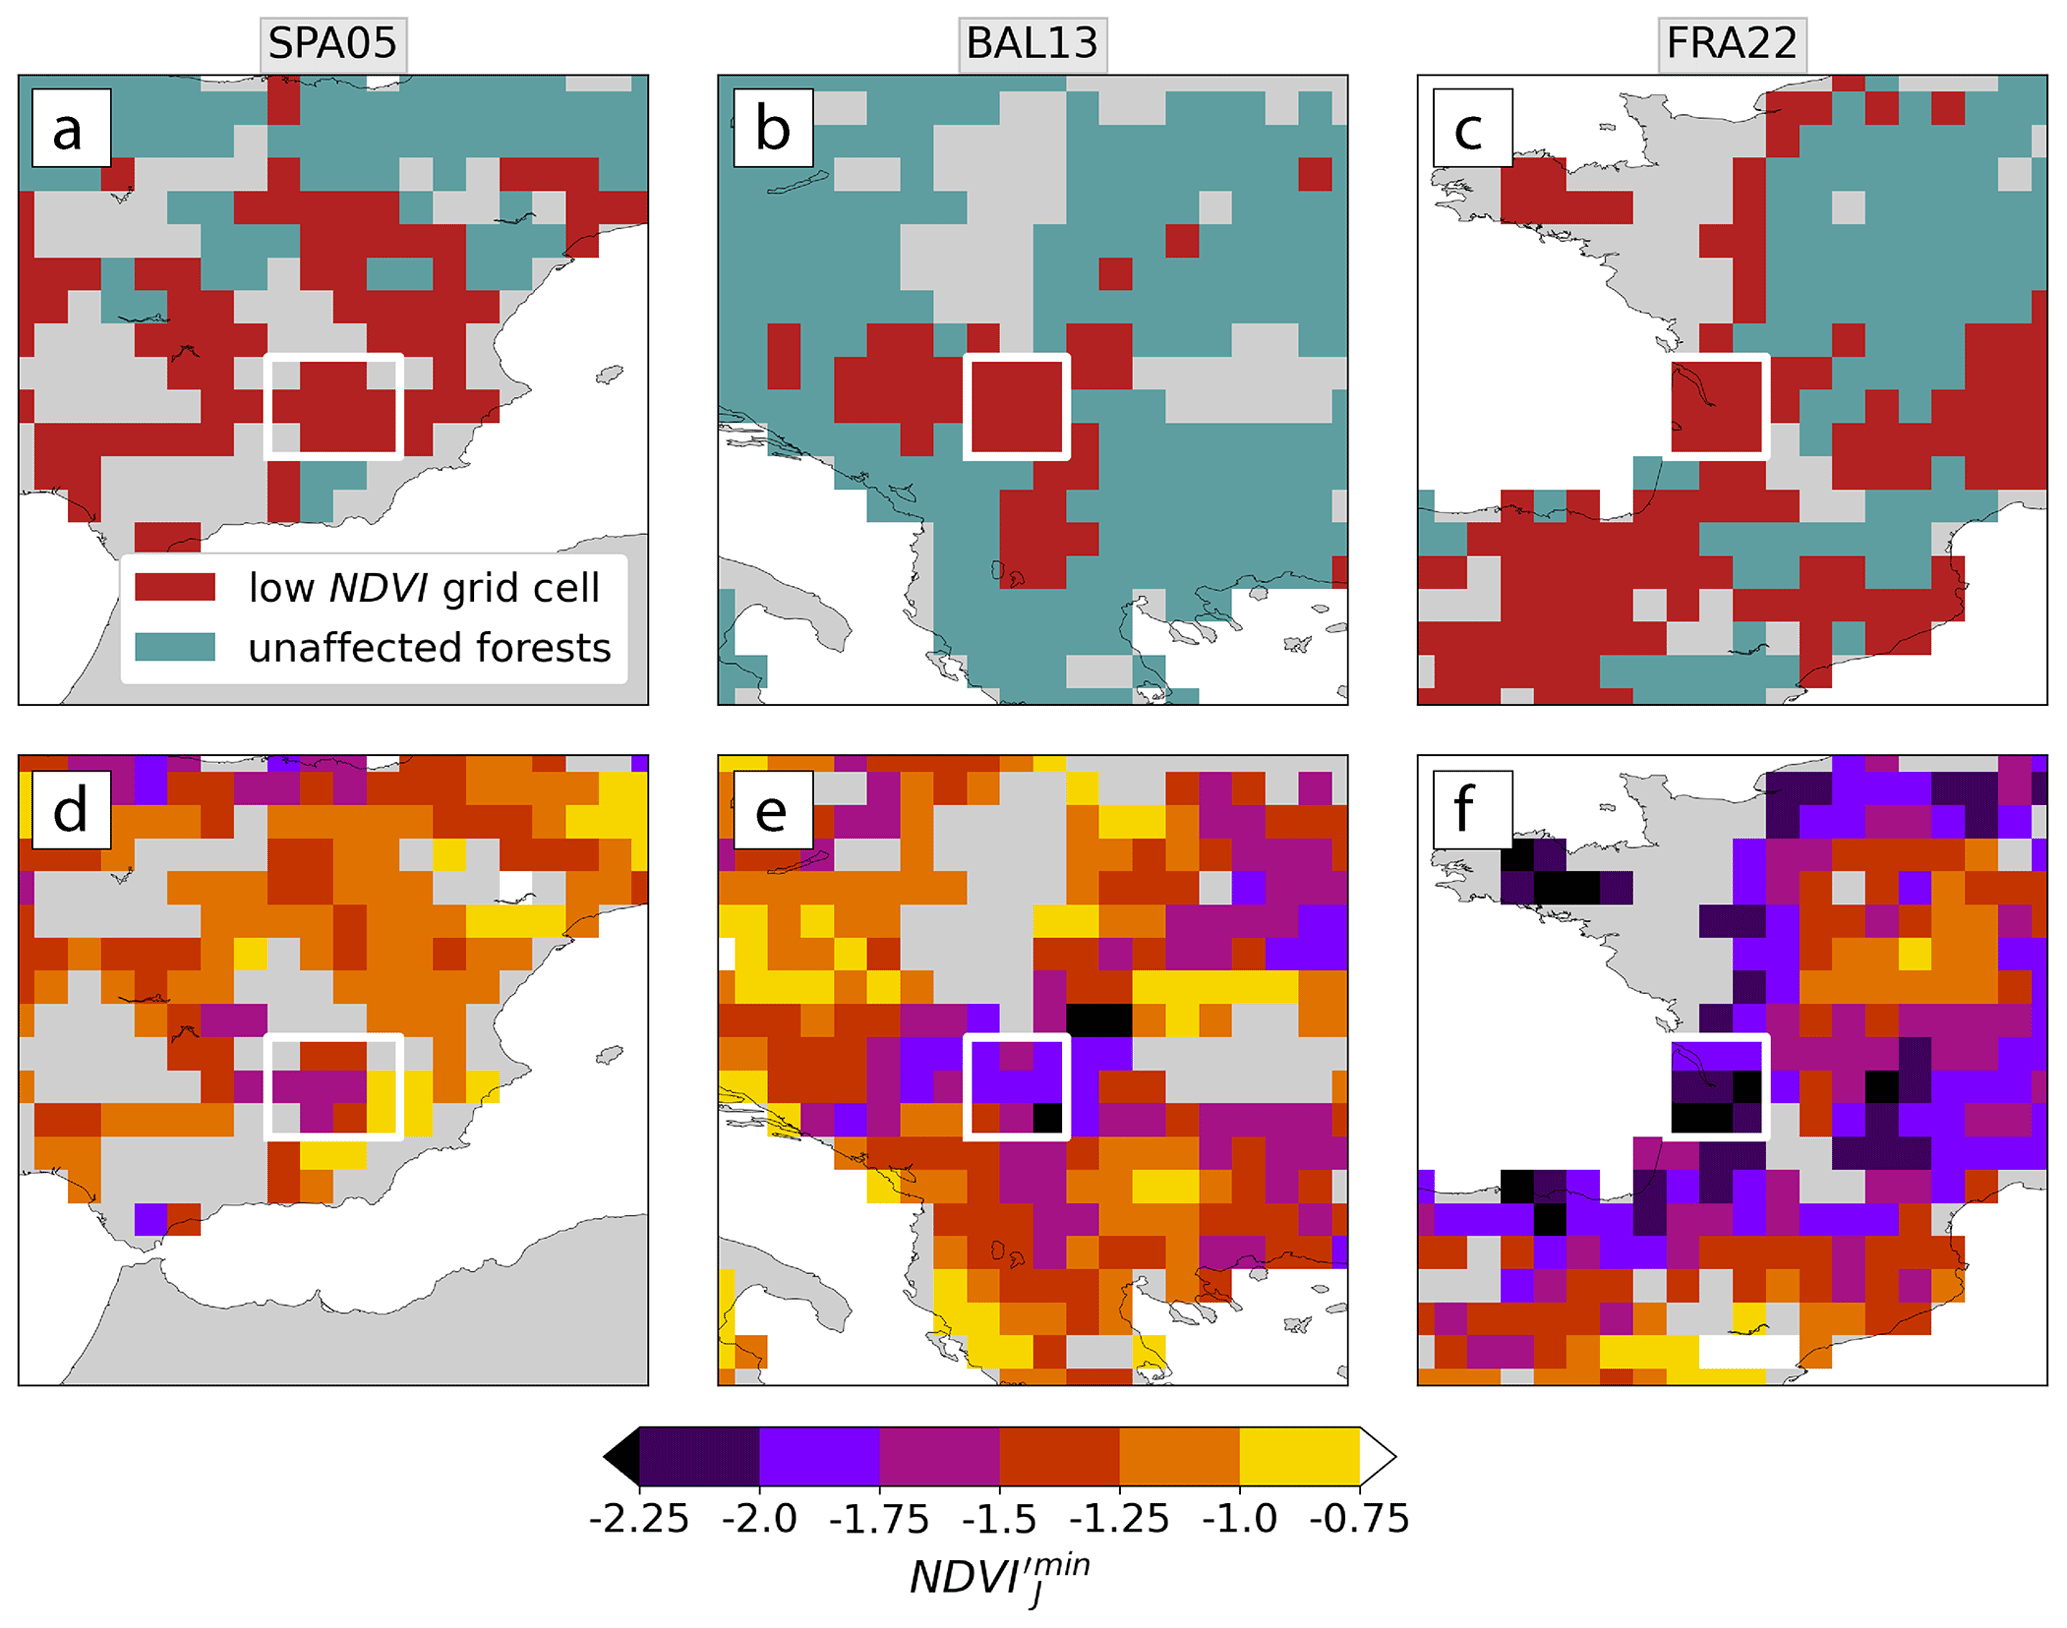
Figure 3(a–c) Low-NDVI grid cells and (d–f) the event intensity measured by NDVI in (a, d) Spain in 2005, (b, e) the Balkans in 2013, and (c, f) France in 2022. The focus regions of SPA05, BAL13, and FRA22 are framed with white boxes.
We now introduce the concept of a 3-year meteorological history prior to low-NDVI events for these three examples. For SPA05, the meteorological history was characterized by a shift from a precipitation surplus during SON-21m to JJA-12m to a precipitation deficit during the year prior to the low-NDVI event (Fig. 4a). Note that seasons MAM, SON, and DJF refer to the periods March–May, September–November, and December–February, respectively, and that we here use a notation for seasons (e.g., SON-21m) that indicates their negative time lag to the events (i.e., SON-21m is the autumn 21 months prior to the low-NDVI event summer, termed JJA-ev). While the cyclone frequency was more than doubled during the former wet period, the period with negative featured almost no cyclones at all. The relative cyclone frequency anomaly was most negative (−50 % to −100 %) in the climatological cyclone season from SON to MAM (Fig. 4a). For example in early MAM-3m, coincided with of close to −75 %. The meteorological history of SPA05 further featured strong cold spells in MAM-15m to JJA-12m and in DJF-6m to MAM-3m with as low as −2.6 (Fig. 4b). Warm periods occurred in JJA-ev and DJF-18m and coincided with an increased frequency of anticyclones, i.e., positive . In the second example, BAL13, the magnitude of negative , was also a dominant feature of the meteorological history with even more distinctive persistence over the 3 years (Fig. 4c). Similarly to SPA05, a precipitation deficit was often related to negative with some exceptions, e.g., in SON-9m. JJA-12m was characterized by the largest of all examples and did not coincide with substantial changes in or (Fig. 4c, d). Despite continuously positive from JJA-12m to JJA-ev, the meteorological conditions became less dry and less hot than in JJA-12m, when, interestingly, the BAL13 region was mostly unaffected by low-NDVI events (Appendix C). The most recent event FRA22 had again a different meteorological history. It stands out with anomalously high over the 6 months preceding the event that was related to negative over considerable portions of that period (Fig. 4f). Moreover, during most of these 6 months was only slightly negative and strongly positive when going further back in the meteorological history, e.g., in JJA-12m (+2.6; Fig. 4e). One last noteworthy disparity of FRA22 compared to BAL13 is that JJA-12m was persistently colder alongside negative .
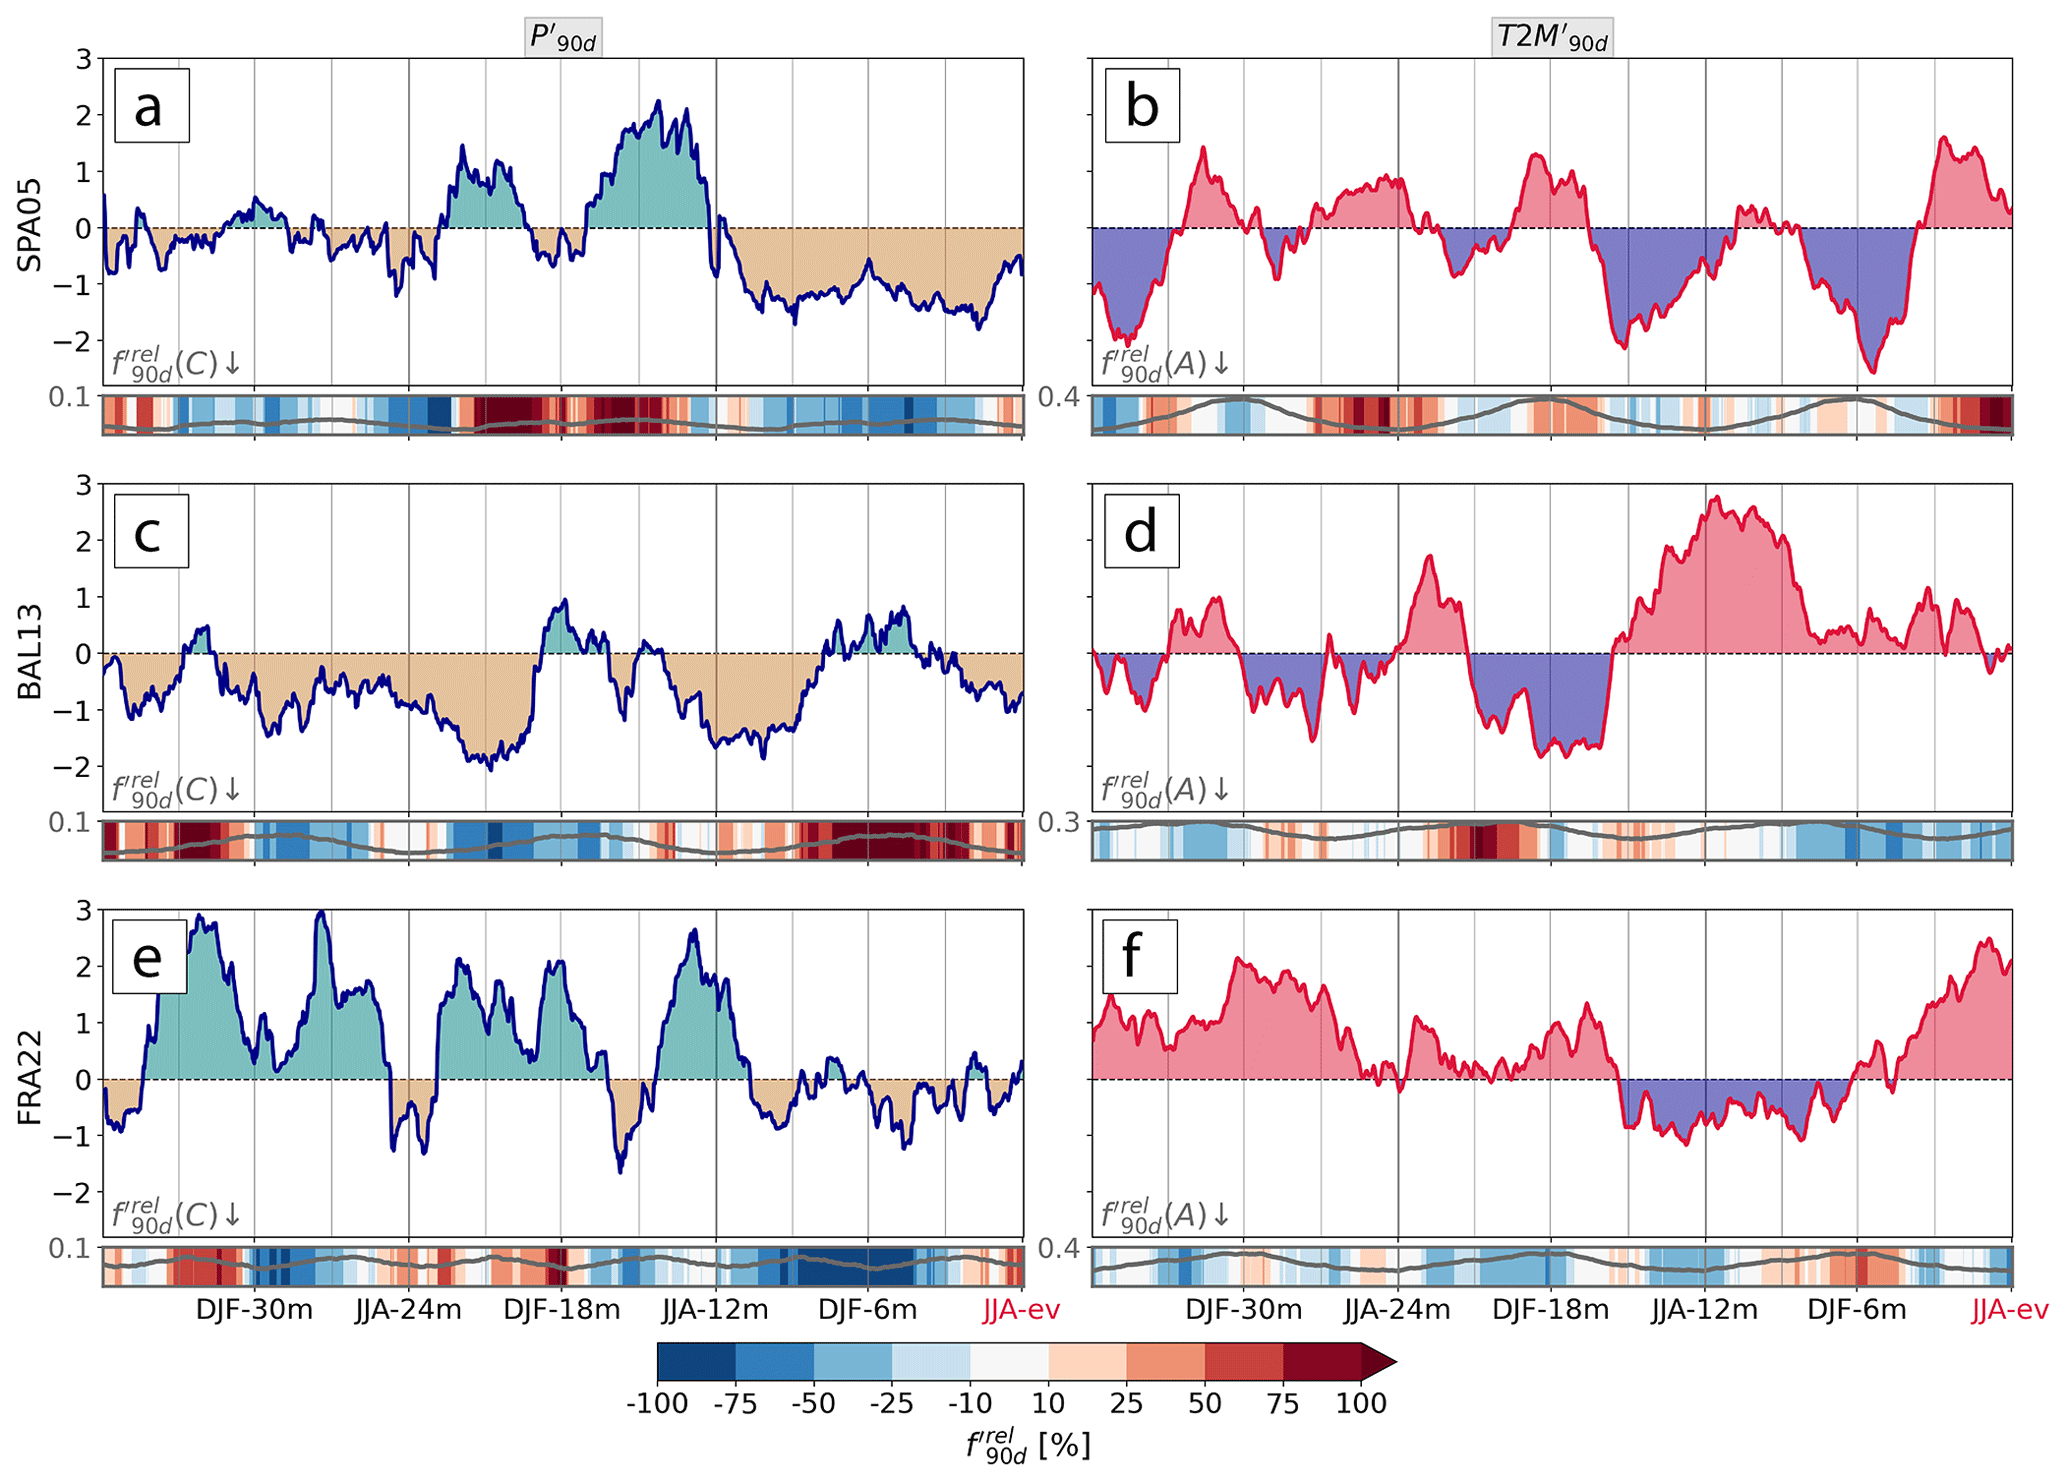
Figure 4The 3-year evolution of (a, c, e) and (b, d, f) leading up to low-NDVI events in (a, b) Spain in 2005, (c, d) the Balkans in 2013, and (e, f) France in 2022. The relative anomaly of (a, c, e) cyclone frequency and of (b, d, f) anticyclone frequency is shaded, and their climatological mean is shown as a grey line in the heatmap panels.
While they are illustrative, these exemplary meteorological histories of SPA05, BAL13, and FRA22 reveal great variability and clearly do not allow us to draw any causal inferences about how certain aspects of these histories alter the likelihood of low-NDVI events. The events' meteorological histories share certain characteristics, but clear disparities also emerge, for example, in JJA-ev or in the last year before the event. In the next section we thus systematically analyze the meteorological history of all identified low-NDVI events and use our sub-sampling and bootstrapping procedure to identify statistically significant meteorological precursors to these events. Again recall that these precursors are features of the low-NDVI events' meteorological histories that were significantly more frequent than during any random meteorological history in the climatology.
3.3 Systematic meteorological precursors of low-NDVI events
The previous two sections have illustrated that (i) low-NDVI events were unequally distributed over the study period – especially in temperate forests – and (ii) a more systematic analysis of meteorological histories is needed to assess their relevance for the low-NDVI grid cells. To account for the uneven distribution of events across years, we investigate the average meteorological history of a random sub-sample of low-NDVI grid cells in the temperate and Mediterranean biome separately. The sub-sample includes a maximum of 10 randomly selected low-NDVI grid cells per year. Given the 21-year-long study period, there is a maximum of 210 contributing low-NDVI grid cells. For years with fewer than or exactly 10 low-NDVI grid cells, all events of the respective year contribute to the sub-sample. The resulting average meteorological history of the temperate and Mediterranean biome is a mean over 170 and 164 low-NDVI grid cells, respectively (see Appendix A). Due to the randomness involved in the sub-sampling, we repeat the procedure nsamp=10 times to create a variety of average meteorological histories that account for the variability in years when many low-NDVI grid cells were identified. Our bootstrapping test (significance level α=5 %) is then applied to the anomalies of the averaged meteorological histories to identify statistically significant meteorological precursors of the low-NDVI events in 2002–2022 (Sect. 2.4.2). In the first part of this section, we analyze the magnitude of , , , and during the 3 years leading to low-NDVI events – similarly to Fig. 4. Second, we investigate the persistence of dry () and hot () meteorological anomalies.
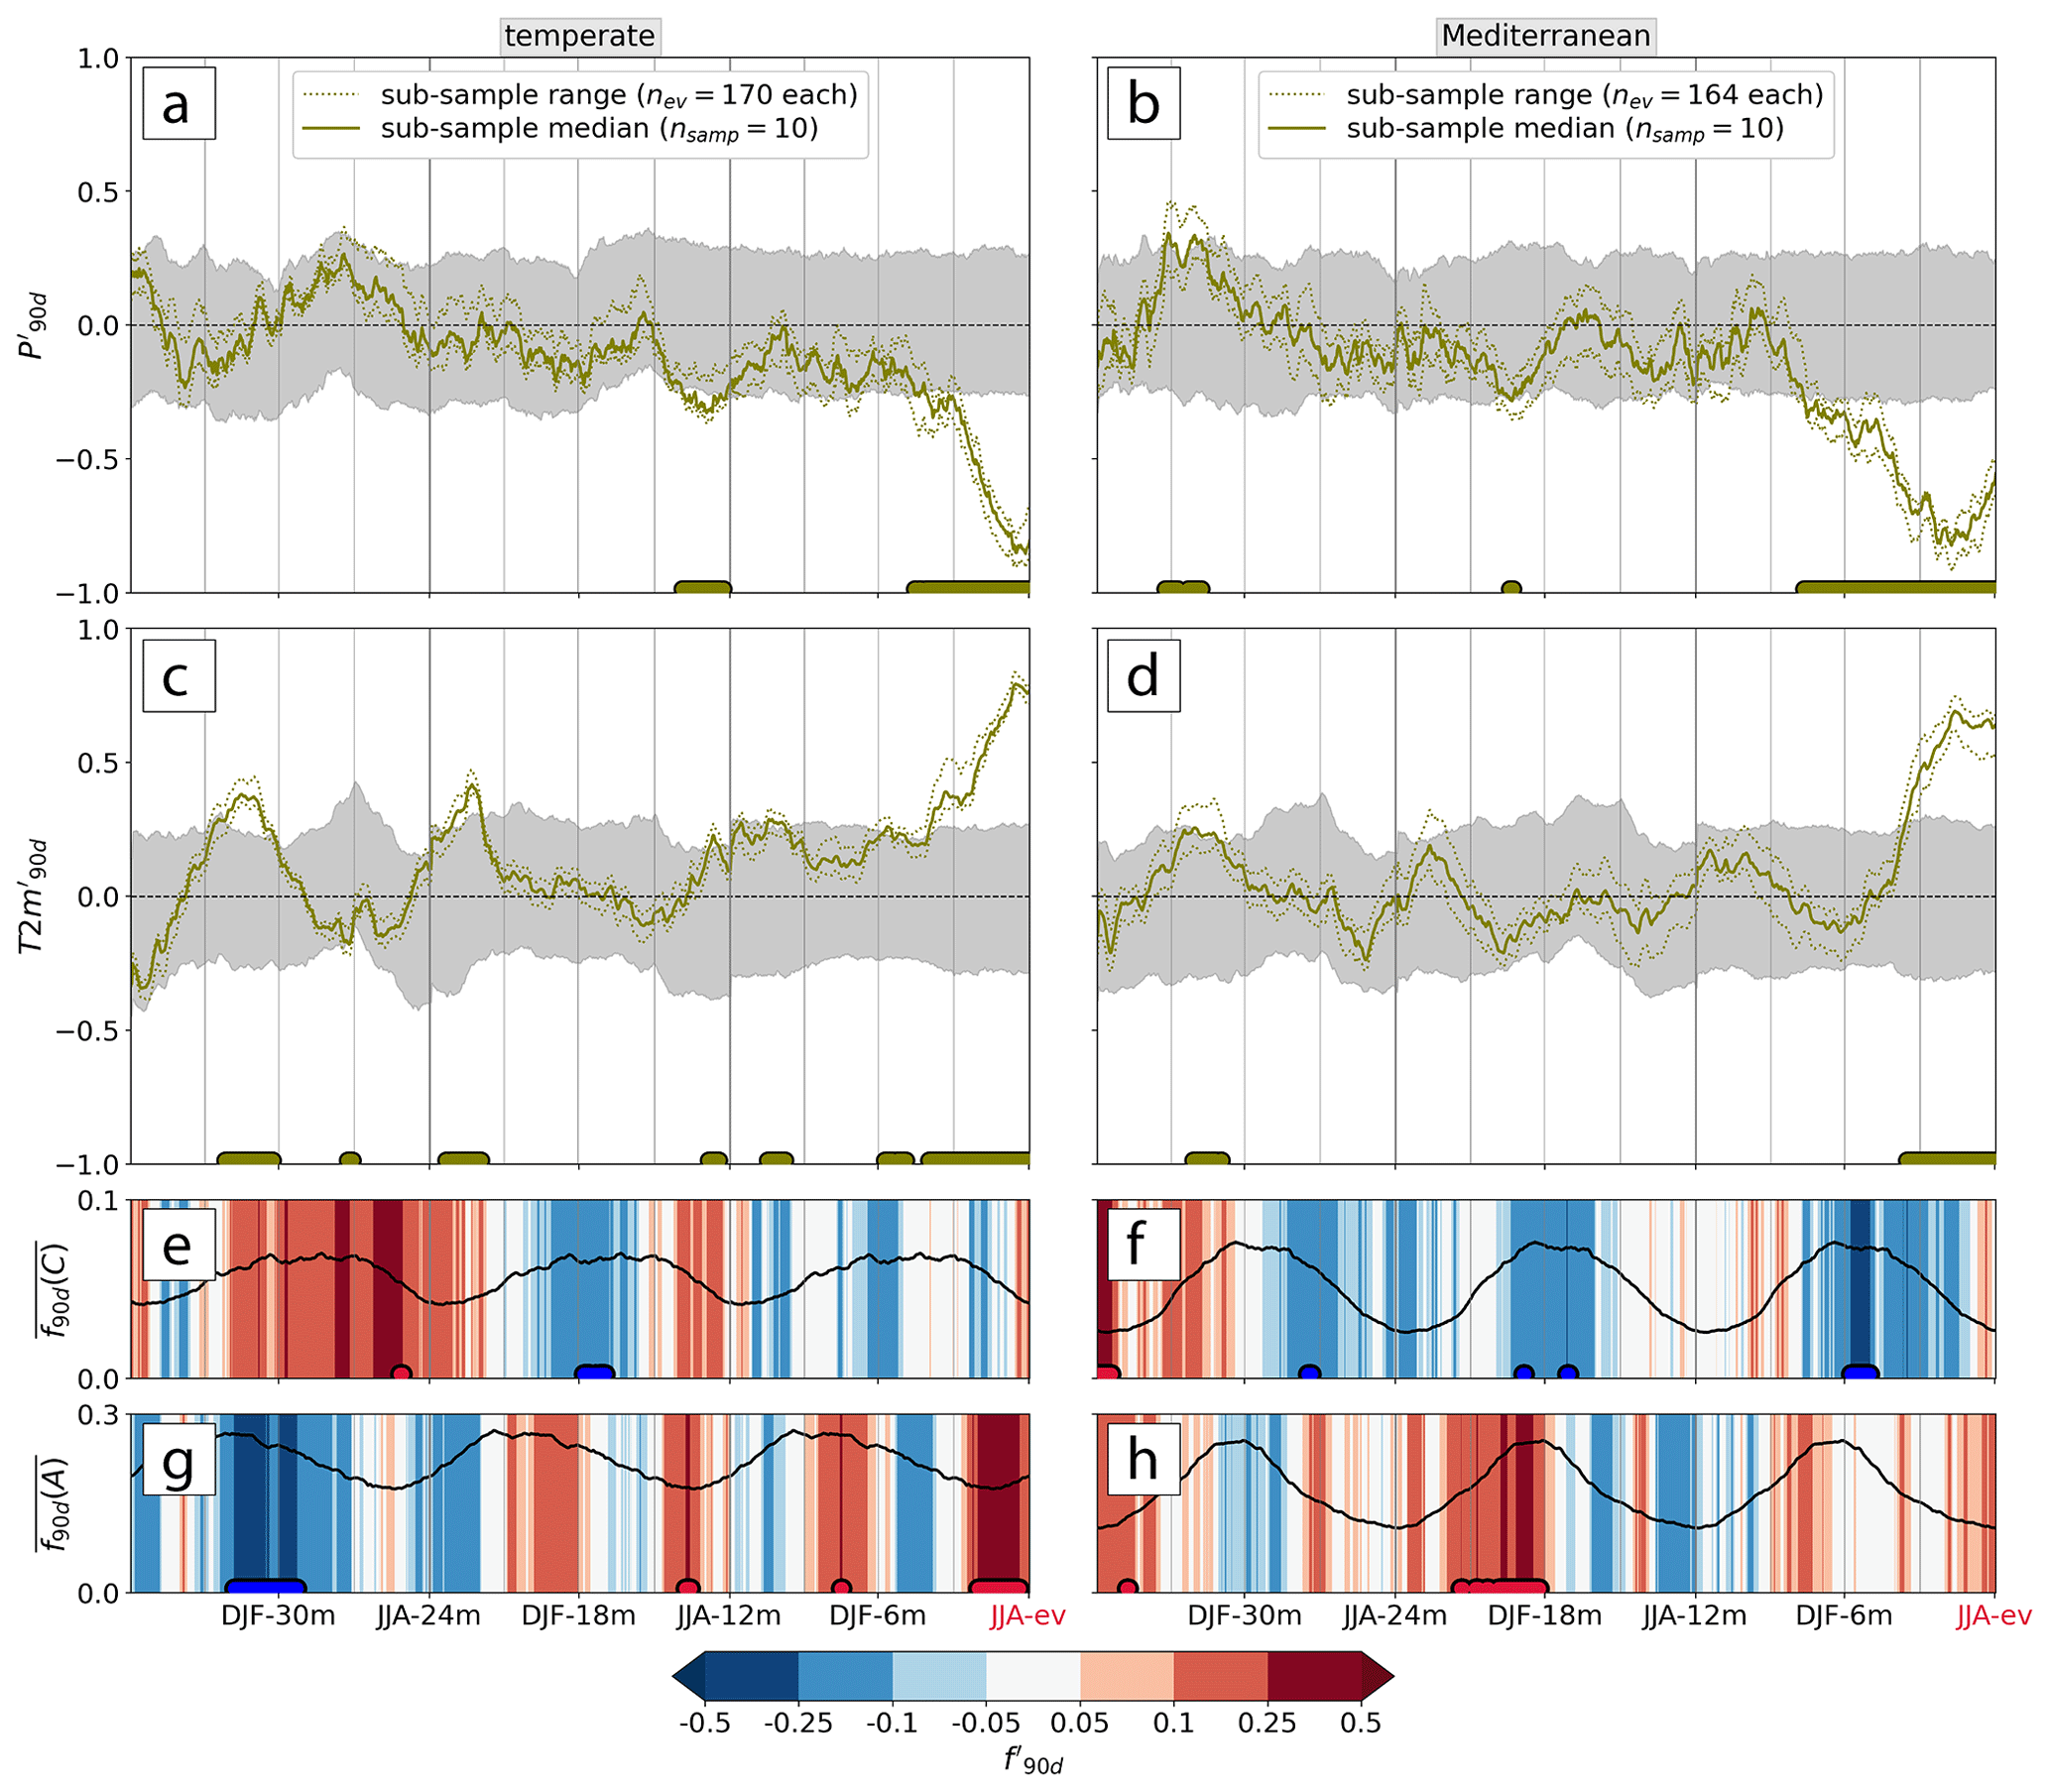
Figure 5Average 3-year evolution of (a, c) and (b, d) at low-NDVI grid cells (olive lines). The range spanned by the nsamp=10 sub-samples (of nev low-NDVI grid cells each) is dotted, and their median is solid. The confidence interval (CI), i.e., the 2.5th–97.5th percentile of the reference climatology, is shaded in grey (see Sect. 2.4.2). The normalized (e, f) cyclone and (g, h) anticyclone frequency anomalies and , respectively, as median over the 10 samples, are shaded in colors. The 90 d climatology of the weather system frequencies is displayed as a solid line. Plots apply to events in the (a, c, e, g) temperate and (b, d, f, h) Mediterranean biome. Statistically significant median values outside the 95 % CI are marked by colored dots at the bottom of each panel.
3.3.1 Magnitude of meteorological anomalies
The most remarkable meteorological precursors of low-NDVI events in the temperate biome are significantly negative and positive during the 4 months preceding the events (bold lines in Fig. 5a, c). Note that the 90 d anomaly 4 months prior to the event represents the conditions during the 6 to 4 months prior to JJA-ev; i.e., the time instances denoted here and in the following mark the end of the anomalous time periods. Furthermore, the meteorological history of low-NDVI events in temperate forests showed significantly reduced in JJA-12m (Fig. 5a). In between JJA-12m and JJA-ev, remained mostly negative but not with a statistically significant magnitude. Similarly to , also for significant signals along the meteorological history were always of the same sign (positive in the case of ). Further warm peaks occurred in MAM-3m, SON-9m, JJA-12m, SON-21m, and DJF-30m (Fig. 5c). Many of the highlighted periods when the magnitude of meteorological conditions was unusual coincided with larger spread of the 10 low-NDVI grid cell sub-samples. For example, in JJA-12m ranged between −0.2 and −0.4, indicating that the years with many low-NDVI grid cells (e.g., 2022, 2019, and 2018) showed increased variability at that point in time (Fig. 5a). That is, some NDVI grid cells showed a stronger, and others a weaker or no, precipitation deficit in JJA-12m, respectively.
In Mediterranean forests, the magnitude of hot and dry anomalies in JJA-ev was comparable to that in temperate forests, with the difference that significantly negative emerged already 8 months before low-NDVI events during DJF-6m (Fig. 5b, d). One more dry period in DJF-18m was significantly different from climatology, as was a wet and warm anomaly in DJF-30m (Fig. 5b). Apart from the few mentioned anomalies, the meteorological anomalies further back than three seasons (before SON-9m) were within the variability expected from the climatology. Similarly to temperate forests, the uncertainty induced by the random sub-sampling is larger when anomalies were of greater magnitude. This applies in particular to the anomalies preceding the low-NDVI events by more than 1 year.
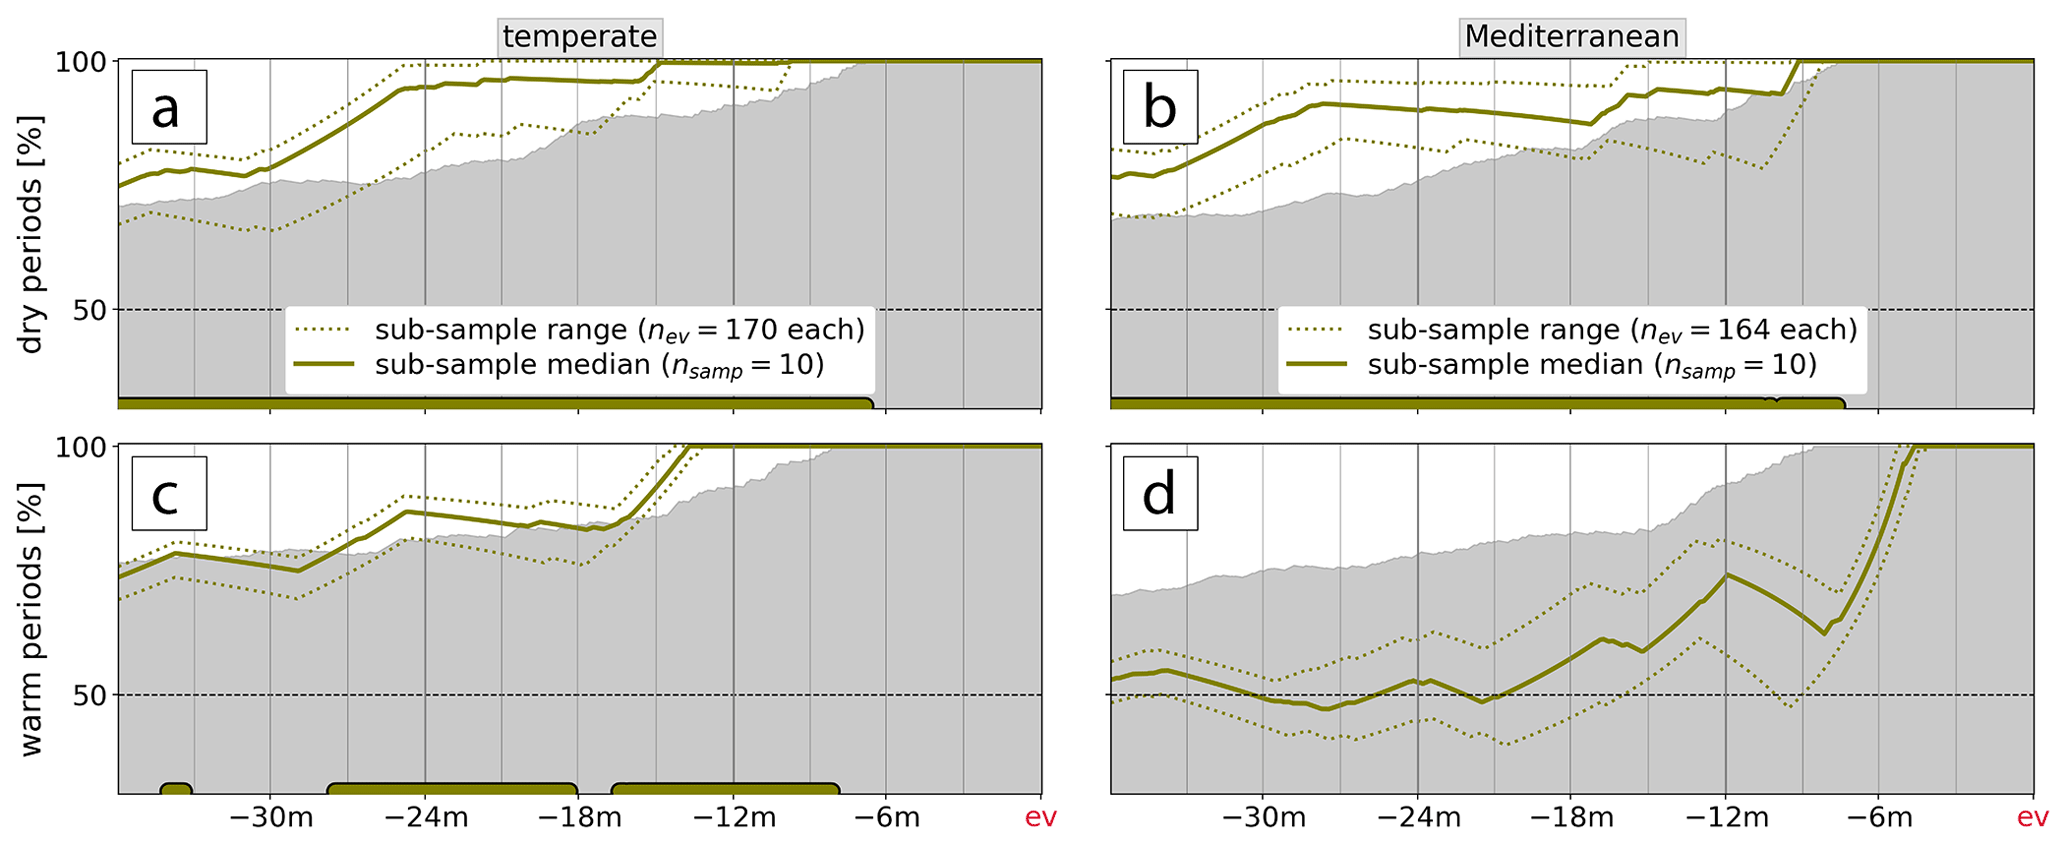
Figure 6The average fraction of the integration period with a (a, c) dry () and (b, d) warm period () for decreasing integration period Δt prior to low-NDVI events. The range spanned by the nsamp=10 sub-samples (of nev low-NDVI grid cells per biome) is dotted, and their median is solid. The grey shading displays the 95 % confidence interval (CI) of the reference climatology. Statistically significant median values outside the 95 % CI are marked by colored dots at the bottom of each panel.
Most of the highlighted anomalies in surface meteorology went along with significant anomalies in the occurrence frequency of weather systems (Fig. 5e–h). Note that we here explore the median history of and , i.e., of normalized anomalies that are comparable across space and time and not of and as in Sect. 3.2, which are more meaningful in a local context (Sect. 2.4). In the temperate biome, the hot–dry conditions leading up to JJA-ev related to a concurrent positive (Fig. 5g). Already in JJA-12m, negative went along with significantly increased f90 d(A). These positive anomalies thereby occurred in the season when anticyclones are climatologically the least frequent. Further back in time, negative in MAM-15m had no direct connection to anomalies in surface meteorology and the DJF-30m warm anomaly related to persistently negative . In the Mediterranean biome, there were four periods of significantly negative : two of them, in DJF-18m and during the 8-month long dry period before the event, coincided with (Fig. 5f). Note that these were during periods when cyclones are climatologically the most frequent. Moreover, in the drier-than-usual DJF-18m, was persistently positive (Fig. 5h). To summarize, significant changes in weather system frequencies often occurred simultaneously with the time periods when the magnitude of and was identified as meteorological precursors of low-NDVI grid cells.
The systematic assessment of meteorological histories across all low-NDVI grid cells in 2002–2022 has revealed several meteorological precursors of low-NDVI events in temperate and Mediterranean forests. In addition to the mere magnitude of and , some of these anomalies have co-occurred with a significantly altered frequency of cyclones and/or anticyclones. At the biome scale, anticyclones went along with locally drier conditions across all low-NDVI grid cells, e.g., in JJA-ev and in JJA-12m (temperate) and in DJF-18m (Mediterranean). Further, the lack of cyclones in the Mediterranean in their climatological peak season was linked to significantly reduced . Figure 5 reveals that some and signals were not significantly unusual in their magnitude; however, they seem to have been of unusual persistence. For example, warm anomalies in temperate forests were hardly ever interrupted during the entire meteorological history (Fig. 5c). Therefore, we next analyze the persistence of dry and warm anomalies.
3.3.2 Persistence of dry and warm periods
The previous section pointed to not necessarily intense but unusually persistent dry and warm periods, which we investigate in more detail in Fig. 6. To do so we take the data displayed in Fig. 5 and compute the fraction of positive and negative and , respectively, from a single 90 d average to 3 years prior to the low-NDVI events. This is done, again, for the 10 sub-samples individually, for which we calculate a median time series. Moreover, analogously to Fig. 5, we contrast the respective fractions to values expected under the null hypothesis H0,EV that the fraction of dry/warm periods preceding the low-NDVI events (i.e., during Δt) was not different from a randomly sampled meteorological history (grey shading in Fig. 6; Sect. 2.4.2).
In the temperate biome, when going back more than 8 months prior to low-NDVI events, the persistence of warm and dry anomalies was each a statistically significant meteorological precursor to low-NDVI grid cells in 2002–2022 (Fig. 6a, c). While and prior to this period were only briefly of significant magnitude (Fig. 5a, c), their persistence was unusually farther back along the meteorological history. When considering 2 years before events, dry periods accounted for 82 %–99 % of that time period, where the range is spanned by the 10 random sub-samples, which is significantly more than the climatological expectation (Fig. 6a). Similarly, the persistence of warm anomalies during 81 %–90 % of the preceding 2 years was significantly anomalous (Fig. 6c) for 9 out of the 10 sub-sample meteorological histories (not shown). When considering all 10 sub-samples separately, we find that the persistence of dry periods and warm periods was significantly different from climatology at least over 26 and 25 months prior to low-NDVI events, respectively. This is also the integration period when these two meteorological precursors were most distinct – i.e., when H0,EV is most clearly rejected. So an accumulation of both warm and dry periods over the approximately 2 previous years comprised peculiarities of events in the temperate biome.
In the Mediterranean biome, warm periods were more frequent than usual but not significantly so compared to the reference climatology (Fig. 6d), which is an interesting contrast to the temperate biome. None of the 10 sub-samples indicate that positive values were unusually persistent for any Δt during the meteorological history. Similarly to the temperate biome, dry periods accumulate to a highly unusual degree when going back more than 8 months (Fig. 6b). The lowest p value is reached 28 months prior to events, when dry periods persisted over 81 %–95 % of the time afterwards. Again considering each of the 10 sub-samples individually, we conclude that the persistence of dry periods was increased over at least 34 months preceding low-NDVI events, which is longer than for low-NDVI events in temperate forests. In contrast, the persistence of warm conditions does not emerge as a significant precursor to low-NDVI events in the Mediterranean.

Figure 7The consistency in the sign of (a, c) and (b, d) for all forest grid cells with at least two low-NDVI events in 2002–2022. Maps are shown for the last day of (a, b) JJA-ev and (c, d) MAM-3m. Stippling indicates that the absolute average over all anomalies of the same sign is at least 25 %. Two-dimensional Gaussian-smoothed (2σ) climatological weather system frequencies are shown in beige contours.
3.4 Spatial patterns of weather system anomalies
Additionally to the biome-wide averages shown in Fig. 5e–h, anomalies in weather system frequencies exert some typical spatial patterns along the meteorological history, which we illustrate in the example of the past year prior to JJA-ev. Based on our set of low-NDVI grid cells, we identify common patterns in the anomalies of weather system frequencies in the grid cells' meteorological history. Note, however, that the robustness of such an analysis is inherently low at the local scale due to the rarity of low-NDVI events (Sect. 3.1). Figure 7 shows the consistency in the sign of and for the 90 d periods of approximately JJA-ev (Fig. 7a, b) and MAM-3m (Fig. 7c, d), respectively, for all forest grid cells that experienced at least two low-NDVI events in 2002–2022. The results for DJF-6m and SON-9m are shown in Appendix E.
In the temperate biome, changes in weather system frequencies that were consistent among most or all low-NDVI events at one location occurred in 66 %–81 % and in 54 %–64 % of the considered forest grid cells in JJA-ev and MAM-3m, respectively. Most prominently, northeastern Europe showed a consistent increase of anticyclones and a decrease of cyclones in JJA-ev (Fig. 7a, b). Negative was consistent among all low-NDVI events at the southern edge of the storm track, i.e., south of the region of climatologically high (Fig. 7b). In MAM-3m, however, positive occurred simultaneously with positive in Germany and parts of northwestern Europe. Positive in northern Europe was prevalent not only in JJA-ev but also in MAM-3m (Fig. 7a), in DJF-6m, and partly in SON-9m (Fig. E1). In MAM-3m this signal further extended towards the Balkans (Fig. 7b). Southern France showed an opposite signal of increased cyclone frequency and negative in JJA-ev. Farther back in the meteorological history in DJF-6m and SON-9m, was negative for most or all of the low-NDVI events in 56 %–58 % of the considered forest grid cells (Fig. E2). To summarize, positive and negative were prominent features in northern Europe in the warm and cold season, respectively. Other regions, such as southern France, show interesting differences from this prominent signal.
The Mediterranean showed overall greater spatial coherence than its temperate counterpart. First of all, as with Germany in MAM-3m, the Iberian Peninsula was a region of generally increased weather system activity in JJA-ev. There was a dipole pattern of consistently positive in the west and a mostly to consistently positive in the east (Fig. 7a, b). This synoptic pattern fosters more frequent southerly advection. Note that the Iberian Peninsula was also a hotspot of low-NDVI events; i.e., results there were consistent among up to six events (Fig. 2c). The typical signal of positive and negative occurred in the central Mediterranean in JJA-ev and in most Mediterranean forest grid cells in MAM-3m (Fig. 7c, d) and in DJF-6m (Figs. E1 and E2). In these two seasons, only 5 % and 6 % of considered forest grid cells showed mostly or consistently positive . Also in SON-9m, cyclones were mostly less frequent than usual (Figs. E2). Thus, Mediterranean low-NDVI grid cells very often experienced negative in the past year of the meteorological history, consistent with the results in Fig. 5f. Low-NDVI events in the western Iberian Peninsula hotspot region, however, experienced the opposite change in cyclone frequency in JJA-ev, which might be a signal of intensified Iberian thermal lows (Santos et al., 2015).
4.1 Low-NDVI events
The low-NDVI grid cells identified in this study typically represented summers with a heat- and/or drought-induced loss of forest greenness (Anyamba and Tucker, 2012; Orth et al., 2016; Buras et al., 2020). Known drought and heat events were identified as low-NDVI events, e.g., the Iberian drought in 2005 (Gouveia et al., 2009), a 2-year-long drought in 2007–2008 in Turkey (Varol and Ertuğrul, 2016), the 2011–2013 drought in the Balkans (Cindrić et al., 2016), the hot summer of 2017 in Italy (Rita et al., 2020), and the central European hot drought in 2018 (Schuldt et al., 2020; Senf and Seidl, 2021b). Additionally, we identify 2022 as a record-breaking year of the most widespread low-NDVI events covering 37 % of the Mediterranean and temperate forest biome each. In 2022, Europe experienced its hottest JJA on record alongside dry soils (Copernicus Climate Change Service, 2022), and the largest carbon emissions from wildfires since 2007 were recorded (Copernicus Atmosphere Monitoring Service, 2022). Specifically, among the countries with most low-NDVI grid cells were also those that faced extreme anomalies in wildfire activity: the burned area in Romania, Germany, France, Spain, and Croatia was 11, 10, 7, 4, and 3 times larger in 2022, respectively, than the 2006–2021 average (EFFIS, 2022). First observations of early leaf senescence as in 2018 are mentioned by Kittl (2022). The regions spared by the low-NDVI event in 2022 – mainly Scandinavia, parts of France, and a belt from the Austrian Alps to the Baltic - were the only regions that showed a surplus in surface soil moisture compared to 1991–2020 conditions (Copernicus Climate Change Service, 2022). Our approach to identify low-NDVI events, therefore, identifies not only events due to heat and drought but also events due to positively interacting disturbances such as fire and insect outbreaks. Finally, however, there was at least one example of a drought-unrelated low-NDVI event, namely an ice storm that hit Slovenia in February 2014 (Senf and Seidl, 2021c; Buras et al., 2021). Consequently, we cannot rule out that other disturbances that were not necessarily linked to heat or drought, e.g., also late frost (Bascietto et al., 2018; Vitasse et al., 2019), have impacted some of the low-NDVI grid cells.
As our approach identifies persistent and widespread NDVI losses, more localized and potentially more extreme reductions in forest greenness are often not captured (Appendix C), e.g., logging in France in 2009 (Senf and Seidl, 2021a) or low NDVI following the winter windstorm Gudrun in southern Sweden in 2005 (Buras et al., 2021). Interestingly, the hot drought in 2003 also hardly led to low-NDVI grid cells in Europe. The NDVI reduction in that summer was most prominent for grassland and crops but less so for forests (Buras et al., 2020). Forests are capable of resisting a temporally limited drought much better than grassland, as they can respond with reduced evapotranspiration and increased water-use efficiency (Wolf et al., 2013). Note, however, that grassland typically recovers better after long-lasting droughts than forests (Stuart-Haëntjens et al., 2018). The only forest regions that were affected by a low-NDVI event in 2003 are in southern France and Italy, where strongest growth reductions in forests were observed (Ciais et al., 2005). Our results, therefore, suggest that – compared to the events since 2018 – the impact of the 2003 drought on forest greenness was generally limited and scattered in space.
4.2 Meteorological histories and their inter-biome differences
The purpose of systematically analyzing meteorological histories of low-NDVI events was to identify statistically significant meteorological precursors to these events. Hereby, it should be noted that this statistical analysis alone does not allow us to infer causation between the precursors and the low-NDVI events but identifies unusual co-occurrence of these precursors and the low-NDVI events. The causation surmised in our interpretation of these precursors below is inferred from the large body of process-focused literature we cite. We neither identify a universally valid meteorological history leading to low-NDVI events nor establish hitherto unknown causal links between seasonal timescale meteorology and low-NDVI events. Rather, the value of our approach is that we can systematically examine which aspects of the meteorological history stand out from the noise and variability that are invariably present across the large set of meteorological histories (e.g., Fig. 4) identified here.
The case study of low-NDVI grid cells in Spain in 2005 (SPA05) is one example that illustrates this value of our approach (Sect. 3.2). The meteorological history of SPA05 showed a precipitation surplus in the previous spring and summer, which was not a significant meteorological precursor to low-NDVI events in the Mediterranean in general (Sect. 3.3.1). A preceding surplus in precipitation in a water-limited region such as Spain could cause structural overshoot, i.e., the buildup of large crowns with high water demand, which was suggested to worsen the following drought impact (Zhang et al., 2021). Long-term irrigation experiments at dry sites revealed reduced tree growth over several years as a response to ceasing irrigation (Rigling et al., 2003; Feichtinger et al., 2014). Furthermore, short-term irrigation causes more pronounced responses in tree growth than long-term irrigation, while both potentially increase the sensitivity to drought in the following years indirectly via increased leaf area and tree height (Feichtinger et al., 2015). So while there is strong evidence for lagged responses to a previous precipitation surplus due to structural overshoot, our approach shows that this process does not translate to a systematic meteorological precursor at the biome scale in the Mediterranean.
The most striking meteorological precursors of low-NDVI grid cells were the persistence of a precipitation deficit (both biomes) and of positive temperature anomalies (temperate biome) over at least 2 years. Continuously dry conditions reached farther back in the Mediterranean than in temperate forests, which might be an important difference due to year-round growth of widespread evergreen tree species in the Mediterranean (Camarero et al., 2021). Also, these conditions play an important role for forest fires, which likely aggravated the meteorological impact on NDVI indirectly (Nagel et al., 2017; Turco et al., 2017). The identified extremely unusual accumulation of warm periods over around 25 months prior to events in the temperate biome points to its indirect effects on insect populations and fire, as well as to the joint amplification of drought impacts (Seidl et al., 2017; Sommerfeld et al., 2018; Seidl et al., 2020; Forzieri et al., 2021). Also, because the significantly pronounced warm periods occurred in the (late) growing season of all 3 preceding years, continuously increased temperatures might have worsened the impact of the event-concurrent hot drought through structural overshoot and soil moisture depletion (Bastos et al., 2020a; Zhang et al., 2021). This 4-month-long hot drought in JJA-ev was of significant magnitude for both meteorological anomalies in the studied low-NDVI grid cells. In the Mediterranean, a large precipitation deficit preceded positive by another 4 months, which could follow from the fact that winter and/or spring drought in southern Europe increases the likelihood of a hot JJA through an enhanced soil moisture–atmosphere feedback (Seneviratne et al., 2010; Russo et al., 2019). More generally and in both biomes, the emergence of an unusually strong 90 d precipitation deficit already in spring can be particularly damaging (Senf et al., 2020; Bigler and Vitasse, 2021; Bose et al., 2021).
Apart from the accumulation of dry periods reaching far back in time in both biomes, primarily temperate forests show meteorological precursors that occurred more than 1 year in the past. Significantly reduced P90 d and increased T2m90 d occurred during the previous JJA, which points towards drought legacy effects (Anderegg et al., 2015). This legacy might not always be reflected in NDVI (Kannenberg et al., 2019); however, it can indirectly affect future forest vitality via reduced tree resilience (Bose et al., 2020). Moreover, the succession of drought in consecutive summers is particularly harmful for temperate forests, while Mediterranean forests show a decreased sensitivity to the second drought (Anderegg et al., 2020). To summarize, the systematic meteorological histories of low-NDVI events and differences between the two biomes can be linked to much of the current mechanistic understanding of forest vitality in the two bioclimatic regions.
4.3 The role of weather systems
Our results highlight that the timing and positioning of weather systems are crucially determining their impact on surface meteorology relevant for low-NDVI grid cells. At the biome scale, the at least 34-month-long dry period in the Mediterranean is accompanied by reduced 90 d cyclone frequency, mostly so in DJF and MAM when cyclones are climatologically most frequent (Wernli and Schwierz, 2006). Cyclones are the main contributor to cold-season precipitation in these forest regions (Rüdisühli et al., 2020) and also to extreme precipitation (Pfahl and Wernli, 2012b). Other water-limited forest regions show a similar sensitivity to cold-season precipitation and, therefore, to the precipitation-causing weather phenomenon (Williams et al., 2013). More frequent anticyclones were typical in JJA-ev and MAM-3m and relate to an upper-level subtropical ridge extending into the Mediterranean – a known driver of heat extremes in southern Europe (Sousa et al., 2018; Zschenderlein et al., 2019). Over the western Iberian Peninsula in JJA-ev, specifically, more frequent cyclones likely occurred as Iberian thermal lows that favor summer heat extremes through increased diabatic heating over the continent (Santos et al., 2015). Thus, reduced cyclone activity all along the meteorological history of the Mediterranean low-NDVI events appears to have been the main contributor to the hot–dry meteorological precursors – with the exception of Iberian thermal lows in JJA.
In temperate forests, the JJA-ev and JJA-12m hot–dry conditions were both accompanied by more frequent anticyclones, especially in regions at the southern edge of the storm track. The accompanying reduction in cyclone frequency in northern Europe corresponds to a northward shift of the jet stream, which can lead to reduced forest greenness in these regions (Messori et al., 2022). More frequent anticyclones, on the other hand, often relate to an upper-level blocking that causes heat and precipitation suppression in central to northern Europe (Pfahl and Wernli, 2012a; Zschenderlein et al., 2019). A few regions in western Europe show an opposite signal, i.e., reduced anticyclone frequency in JJA-ev. This relates to the fact that summer precipitation there frequently occurs within high-pressure systems (Rüdisühli et al., 2020). In these cases, convective precipitation occurs in the moist and unstable inflow west of the anticyclone center (Mohr et al., 2020). So while in JJA a European-centered anticyclone can favor low-NDVI grid cells in northern Europe, it might be unfavorable for low-NDVI grid cells in western Europe. All in all, these considerations highlight the importance of weather systems and the necessity of considering their spatiotemporally varying impact on surface meteorology, also when interested in events of substantial forest impact.
4.4 Caveats
The two main caveats of this study are (i) the event aggregation to the comparably large scale and (ii) the relatively short data record. The former implies that our analyses can account neither for species-specific drought responses (Scherrer et al., 2011; Vanoni et al., 2016) nor for the multidimensional nature of tree mortality (Allen et al., 2015; Etzold et al., 2016; Schuldt et al., 2020). The link between drought, drought response, and tree mortality is mediated by site, stand, and tree properties (Etzold et al., 2019; Vitasse et al., 2019; Frei et al., 2022) and can further be shaped by tree species diversity within a forest (Grossiord et al., 2014), its microclimate (Buras et al., 2018), and legacies of changing environmental conditions due to, e.g., past forest management (Thom et al., 2018). This aggregation, however, is a central element of this study, as we aimed to investigate the link of synoptic atmospheric variability with variability in forest NDVI, which both act on very different spatial scales. The event identification is, therefore, targeted to identify only spatially coherent losses of forest NDVI, which are meaningful to aggregate to the larger scale. Also, the sub-sampling of the identified low-NDVI grid cells ascertains that our results do not highlight meteorological precursors that are unique to very few events or regions. Nevertheless, the results of this study should be confronted with more specific and local impact assessments.
The main consequence of the relatively short data record is that the normalization of meteorological anomalies suffers from significant sampling uncertainty, which renders any comparison over space and time rather difficult. The normalized and then do not necessarily represent the actual site-level temperature and precipitation values, and their interpretation requires care (Zang et al., 2020). This specifically applies when comparing the meteorological history of the temperate with the Mediterranean biome, respectively, as the latter climatologically receives little precipitation during summer (Schultz, 2005). The normalization, however, is a way to use basic meteorological variables that can readily be interpreted and linked to weather system dynamics, which is of great importance to the novelty of this study.
This study identified specific aspects of the meteorological history (the 3-year evolution of 90 d temperature, , and precipitation anomalies, ), which are systematically shared characteristics of events of persistently low summer forest greenness at the 50 km scale in Europe in 2002–2022. Forest greenness as measured by the NDVI is also used as an early warning mechanism of forest dieback (Buras et al., 2021). First and foremost, in the temperate and Mediterranean biome the regions with low-NDVI events in 2022 exceeded the previous record summers 2018 (temperate) and 2008 (Mediterranean) by far with regard to spatial extent. In the hottest summer in Europe on record, 37 % of both forest biomes were affected by persistently low NDVI, which is about +13 % more than during the previous records. In contrast, our approach classifies the impact of the hot–dry summer of 2003 on forests as very limited and, if so, scattered in space.
The approach used in this study identifies and quantifies those meteorological features that preceded many of the events in the same way and reveals considerable inter-biome differences. The persistence of dry periods was significantly increased over at least 26 and 34 months prior to low-NDVI events in the temperate and Mediterranean biome, respectively. In contrast, the persistence of hot periods was only significantly increased (at least for 25 months preceding the events) in the temperate biome but not the Mediterranean biome. Closer to the event summer, negative and positive were significantly anomalous in magnitude. In the temperate biome, both anomalies acquired statistically significant magnitudes in spring, 4 months before the low-NDVI event. In the Mediterranean biome, negative arose another 4 months earlier, i.e., 8 months prior to low summer NDVI. Note that a single value that was anomalous, e.g., 8 months prior to the low summer NDVI, denotes an anomaly that refers to a 90 d period, i.e., to the 8 to 10 months prior to the event. Lastly, the systematic meteorological histories are able to verify whether meteorologically related processes from local observations apply to an entire biome. We discuss structural overshoot (Zhang et al., 2021), which plausibly systematically affects low-NDVI events in the temperate biome through warmer or extended growing seasons. In contrast, structural overshoot due to more precipitation in the previous year is highly plausible for a case study in the water-limited Mediterranean, which, however, does not translate to the biome scale.
Finally, we provide clear evidence on the spatially varying impact of synoptic-scale weather systems on the important meteorological precursors. At the biome scale, the prominent dry periods are often caused by a significantly reduced cyclone frequency in the Mediterranean biome and by increased anticyclone frequency in the temperate biome. This effect can, however, differ at a local scale, depending on which weather system is locally relevant for precipitation. For instance, western Europe often receives summer precipitation from convective cells in anticyclones, and thus, hot–dry conditions in the event summer go along with reduced anticyclone frequency.
The important differences between the meteorological histories impacting temperate and Mediterranean forests as identified in this study provide a better understanding of European forests' response to multi-seasonal meteorology. Moreover, we, for the first time, quantify and assess the impact of the extremely hot summer of 2022 and compare it with that of the preceding 20 years. Finally, the presented systematic investigations bridge the gap between forest dynamics and atmospheric dynamics, and, thereby, constitute progress in how expected forest dieback can be linked to changing meteorological and climatic conditions under global warming.
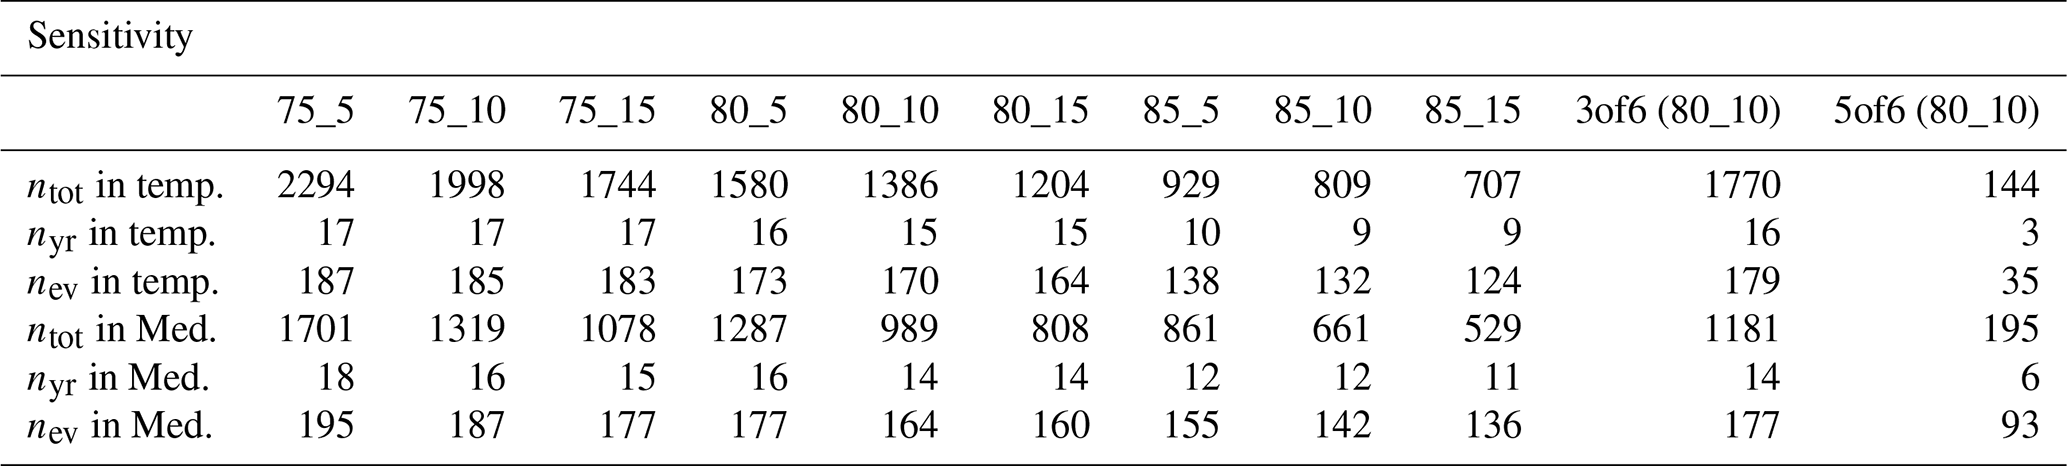
The event identification is based on three threshold parameters, namely the minimum affected ratio ARmin=80 %, the minimum forest area FAmin=10 %, and the minimum number of time steps in JJA with negative NDVI (Sect. 2.3). Parameter ARmin refers to the fraction of forest pixels that has to show persistently negative NDVI per grid cell for that grid cell to be identified as a low-NDVI grid cell. Persistently here is defined via a lower threshold for cn,ev, where the latter refers to the number of time steps out of a total of six in JJA that show negative NDVI. Lastly, FAmin sets a minimum forest cover per grid cell to filter out those with only very few forest NDVI pixels. We vary ARmin and FAmin by ±5 % and test different combinations thereof. We vary by ±1 only for the setup “80_10” used in the study (ARmin=80 %, FAmin=10 %), as the identification scheme depends strongly on this parameter. Table A1 shows the number of events (ntot), the number of years with at least 10 low-NDVI grid cells in 2002–2022 (nyr), and also the number of events per sub-sample (nev) that results from varying the threshold parameters. Large nyr is important to the sub-sampling of the low-NDVI grid cells, which is used to retrieve more systematic results, and would optimally be as close to the total years of 21 as possible. The ntot is particularly strongly reduced when increasing ARmin to 85 %, resulting in nyr≤10. Aiming to optimize nyr by using looser thresholds, however, would misconceive a typical characteristic of extreme events such as low-NDVI events, namely that they occur concentrated in individual years and not in others. So looser thresholds have the disadvantage of reducing the peculiarity of low-NDVI grid cells. This is illustrated by the increase in ntot when reducing ARmin from 80 % to 75 %. While reducing in the study setup (80_10) from 4 to 3 has only minor effects, ntot and consequently nyr and nev are drastically reduced when increasing to 5 (Table A1). For example, in the temperate biome, only 3 years would contribute at least 10 low-NDVI grid cells if was used. So while the number of events is not very sensitive to reductions in , increasing would make a systematic assessment impossible.
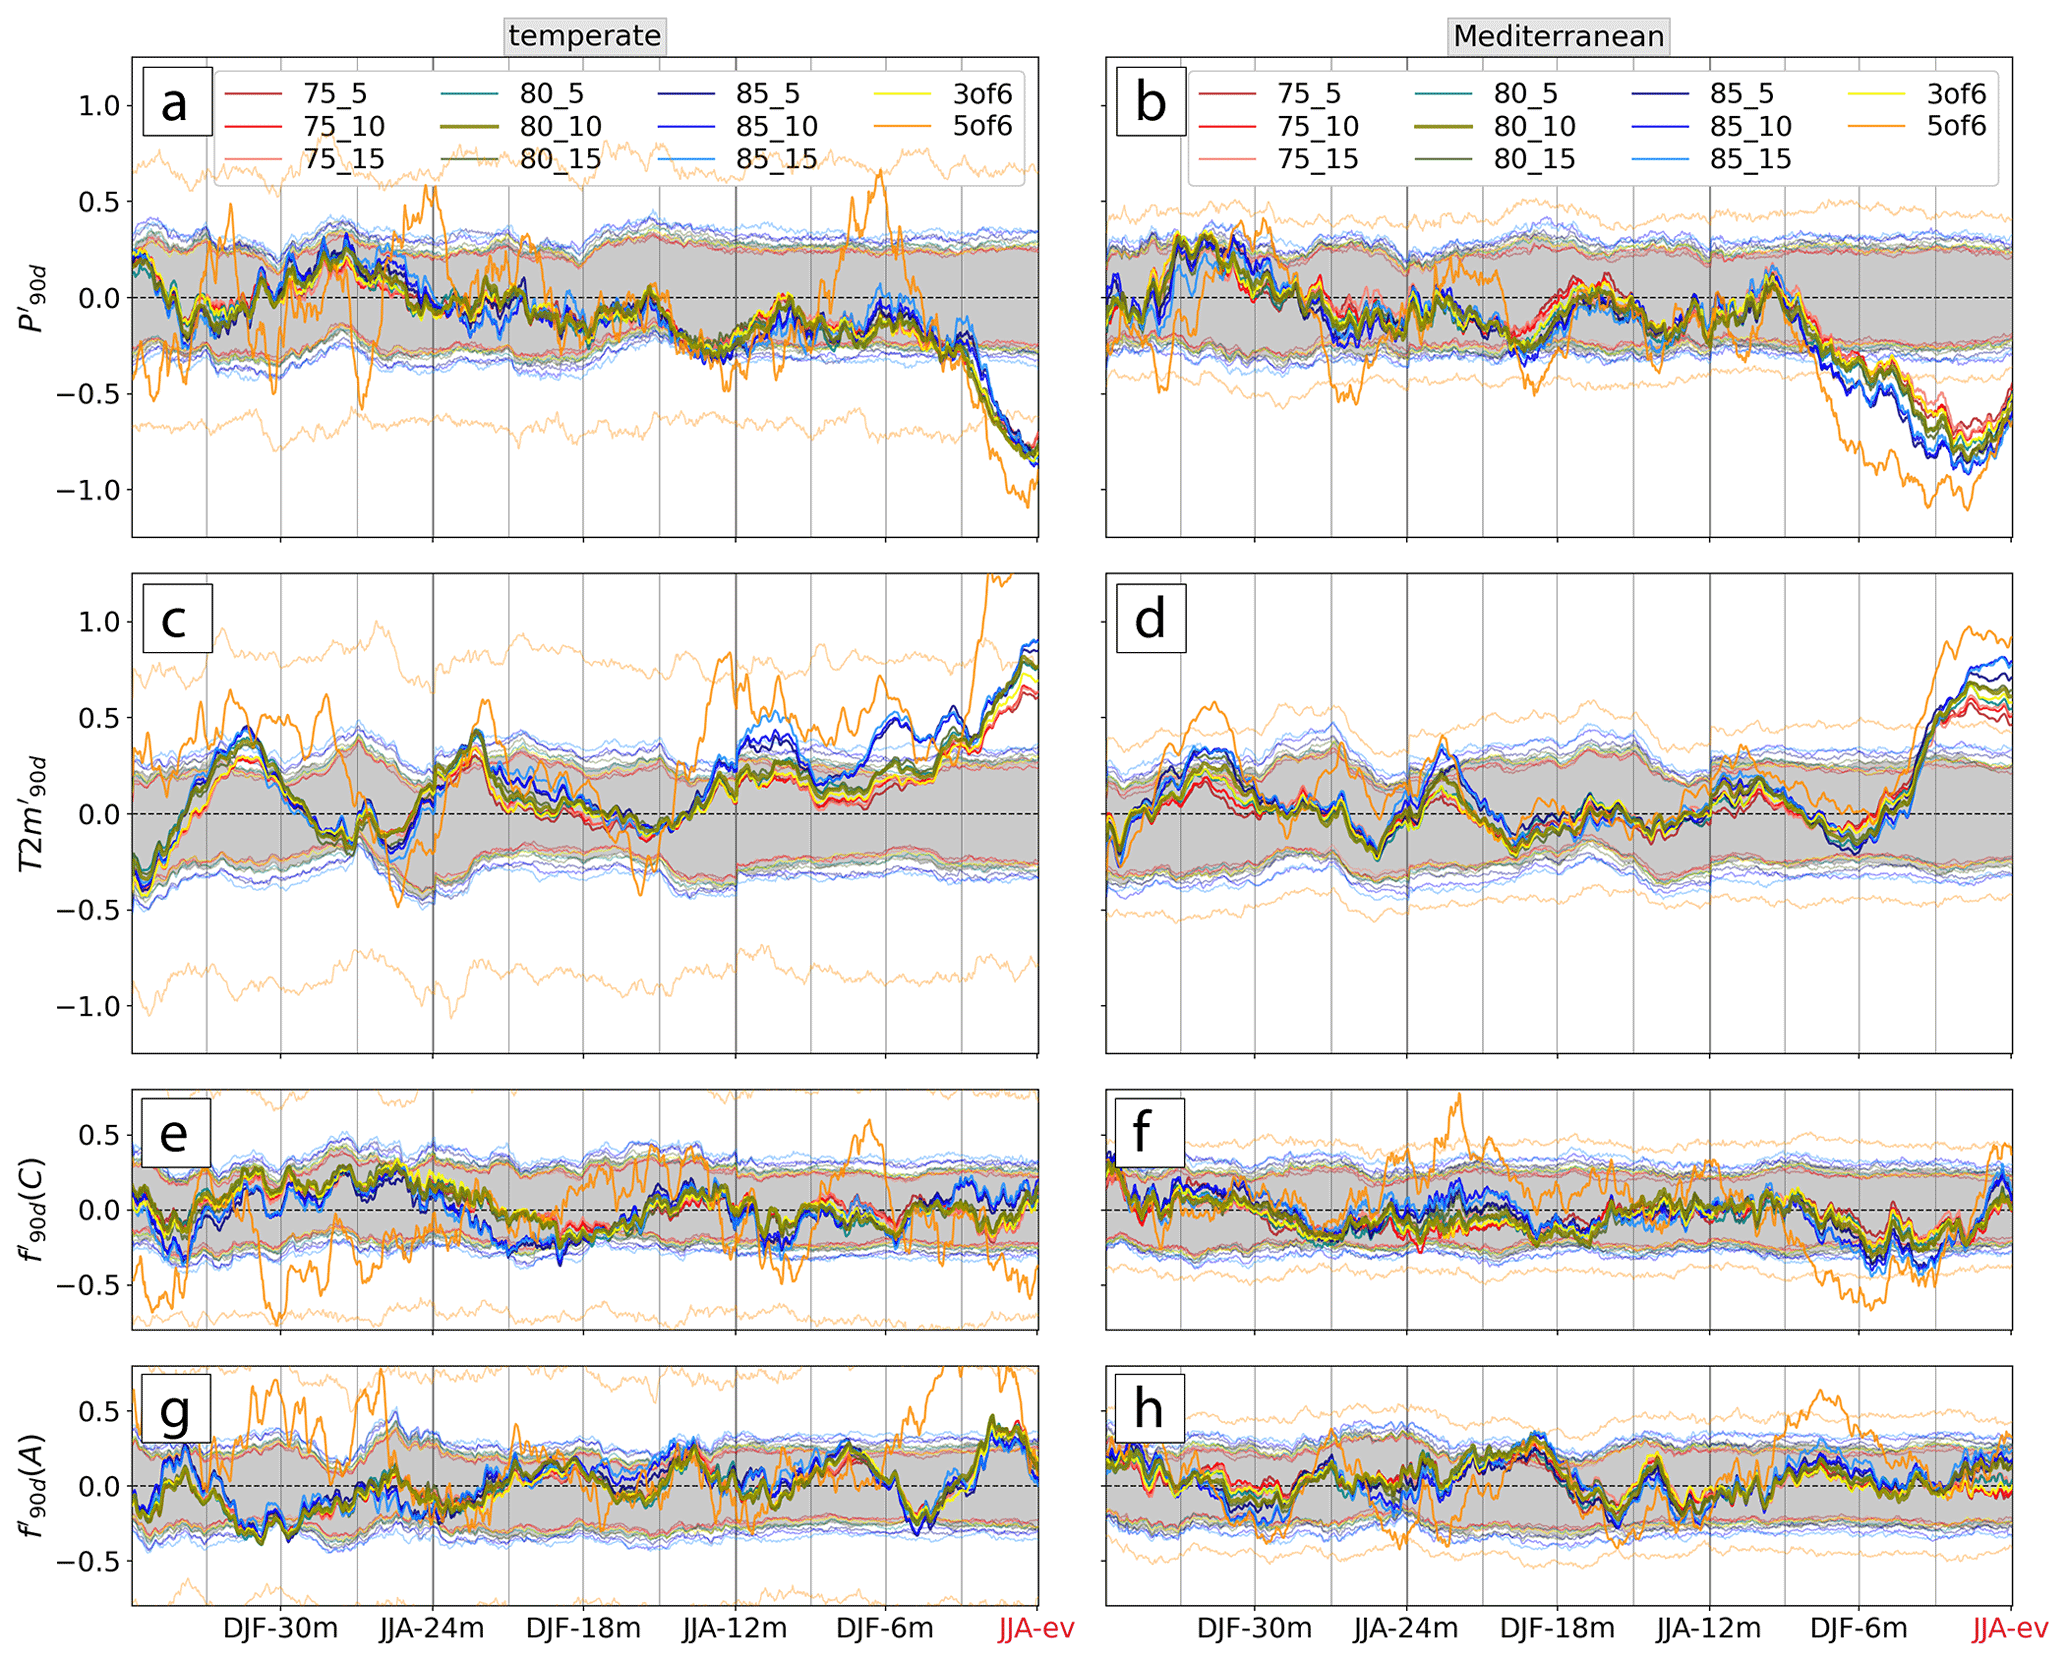
Figure A1The same as Fig. 5 but for different combinations of ARmin, FAmin, and . The thicker olive line and the shaded grey 95 % confidence interval (CI) correspond to the median setup shown in the study (Fig. 5). The other thick lines show the meteorological histories of the other combinations of threshold parameters, and the corresponding CI is shown with thin lines of the same color. The normalized 90 d mean (a, b) precipitation, (c, d) temperature, (e, f) cyclone frequency, and (g, h) anticyclone frequency anomalies and , respectively, are shown as line plots. The legend indicates the combination of threshold parameters used as in Table A1.
Table A1Number of events (ntot), number of years with at least 10 low-NDVI grid cells (nyr), and number of events per sub-sample (nev) in the temperate and Mediterranean biome for different combinations of threshold parameters. The column title indicates the setup with and different ARmin and FAmin combinations separated by an underscore – except for the last two columns. These denote tuning the threshold parameter to 3 and 5, while ARmin=80 % and FAmin=10 %.
The sensitivity of the main result to these two parameters is illustrated in the example of Fig. 5 (Fig. A1). As in the original Fig. 5, we perform a random sub-sampling of up to 10 low-NDVI grid cells per year for each biome and compute an average meteorological history from the resulting samples (Sect. 3.3). This sub-sampling is done 10 times for each biome, and Fig. A1 shows the median of these 10 equivalent average meteorological histories for each of the 11 combinations of ARmin, FAmin, and listed in Table A1. The sub-sampling for each combination of the two threshold parameters is of course dependent on the identified low-NDVI grid cells and, therefore, dependent on ntot and nyr (Table A1).
Figure A1 overall highlights low sensitivity of various aspects of the meteorological history to the two threshold parameters. First, the number of events per sub-sample and thus per average meteorological history nev differs for every setup of threshold parameters depending on variations in ntot. Consequently, setups with more events per sample (loose thresholds) lead to smaller magnitudes of the averaged meteorological anomalies, and, hence, also a more narrow confidence interval than a setup with fewer events per sample (stricter thresholds). The comparison here, therefore, focuses mostly on aspects such as the timing and evolution of significant anomalies instead of their exact magnitude. The statistically significant anomalies highlighted in our study, e.g., negative in JJA-12m and JJA-ev and positive that emerged in MAM-3m in temperate forests, would also result from other parameter setups (Fig. A1a, c). Especially the timing when meteorological anomalies were significantly different from climatology is consistent within almost all 11 setups. Some of the highlighted anomalies persisted longer and emerged more clearly when using stricter thresholds, e.g., ARmin=85 % and FAmin=15 %. Positive followed JJA-12m into SON-9m, and also the warm period prior to JJA-ev reached farther into the past (Fig. A1c). With that setup, also the negative in MAM-3m prior to low-NDVI events in the Mediterranean biome was more distinct than for the setup used. With stricter parameter setups, however, nev is unfavorably reduced, as the number of years contributing the maximum of 10 low-NDVI events (nyr) is greatly reduced (Table A1). This is strongly pronounced when using the setup “5of6”, for which, e.g., in the temperate biome, only 3 years (2018, 2019, and 2022) contribute substantially to the average meteorological history shown in Fig. A1. Considering the numbers in Table A1 this setup can clearly not provide a meaningful evaluation of low-NDVI events over the study period. Apart from that setup, any larger deviations between the results from the different parameter setups typically occur within the respective confidence intervals – e.g., in JJA-ev – and are, hence, not highlighted in the analysis and interpretation of Fig. 5. To summarize, the sensitivity analysis supports the chosen setup with ARmin=80 %, FAmin=10 %, and and generally demonstrates low sensitivity of the main results to reasonable variations in the three parameters.
In the bootstrapping test we want to test the null hypothesis H0,EV that a given aspect X of the meteorological history at tev−Δt of low-NDVI events is equal to that of any random meteorological history. For X we use the meteorological fields of , , , and , as well as the fraction of Δt where and , respectively, covering 1999–2022 and the study domain (Fig. 1a). The fields are used here for the period 1999–2022, in order to compute 3-year meteorological histories for all low-NDVI events in 2002–2022. Figure B1 illustrates the procedure of retrieving event mean meteorological histories, as well as the way the bootstrapping is constructed.
First, the sub-sampling of all low-NDVI grid cells results in an event set EVS of low-NDVI grid cells that can be represented as a three-dimensional binary event mask, which is equal to 1 at every low-NDVI grid cell (Fig. B1a). Further, for every X we retrieve an nev×ndt matrix – i.e., one with a time series with daily time steps for every of the nev selected low-NDVI grid cells – by extracting the fields of X where EVS equals 1. The average time series of X for one sample results from taking the mean along the first dimension of this matrix, as shown in Fig. 5. For the bootstrapping test, we generate 1000 synthetic event sets (EVSr) by randomly shuffling the 21 annual masks of EVS 1000 times (Fig. B1b). This shuffling process is best visualized by shuffling a deck of cards, whereby each card corresponds to the binary nlat×nlong event mask of a specific year. Specifically, when constructing the random event set with number r we assign a randomly selected year to all low-NDVI grid cells occurring in year yi and then repeat the process for all remaining years. Hereby, the random years are chosen such that each year occurs once in every EVSr. Consequently, each reference event set contains the same number of low-NDVI grid cells as EVS but in a different year–location combination. Afterwards, the synthetic meteorological histories are generated by first retrieving Xr from extracting X fields for EVSr, i.e., using the shuffled deck of annual binary event masks. Then, the resulting matrix is averaged along its second dimension to retrieve a set of 1000 synthetic event mean time series for every Xr. We, thereby, create 1000 meteorological histories that are equally plausible in the climatological reference period without the prerequisite of a following low NDVI.
We then compare event mean time series of X of low-NDVI grid cells to the 1000 synthetic event mean time series of Xr. Values of X outside the range of Xr receive a p value of 0 (Röthlisberger et al., 2016). The remaining p values are estimated from the percentiles of the 1000×ndt synthetic matrix along its first dimension. At the significance level of α=5 %, H0,EV is rejected at time lags Δt if the event value of X is outside the 95 % confidence interval, i.e., outside the 2.5th–97.5th percentile range, of the 1000 reference values of Xr. Note that the shuffling of years is done prior to extracting the spatial fields of X from the ERA5 data set. This has – in contrast to a random sampling of all forest grid cells – the convenient effect that spatial correlation in these meteorological variables is retained. Thus, synthetic meteorological histories of Xr are constructed from a data set with exactly the same spatial correlation as the original data sets of X.
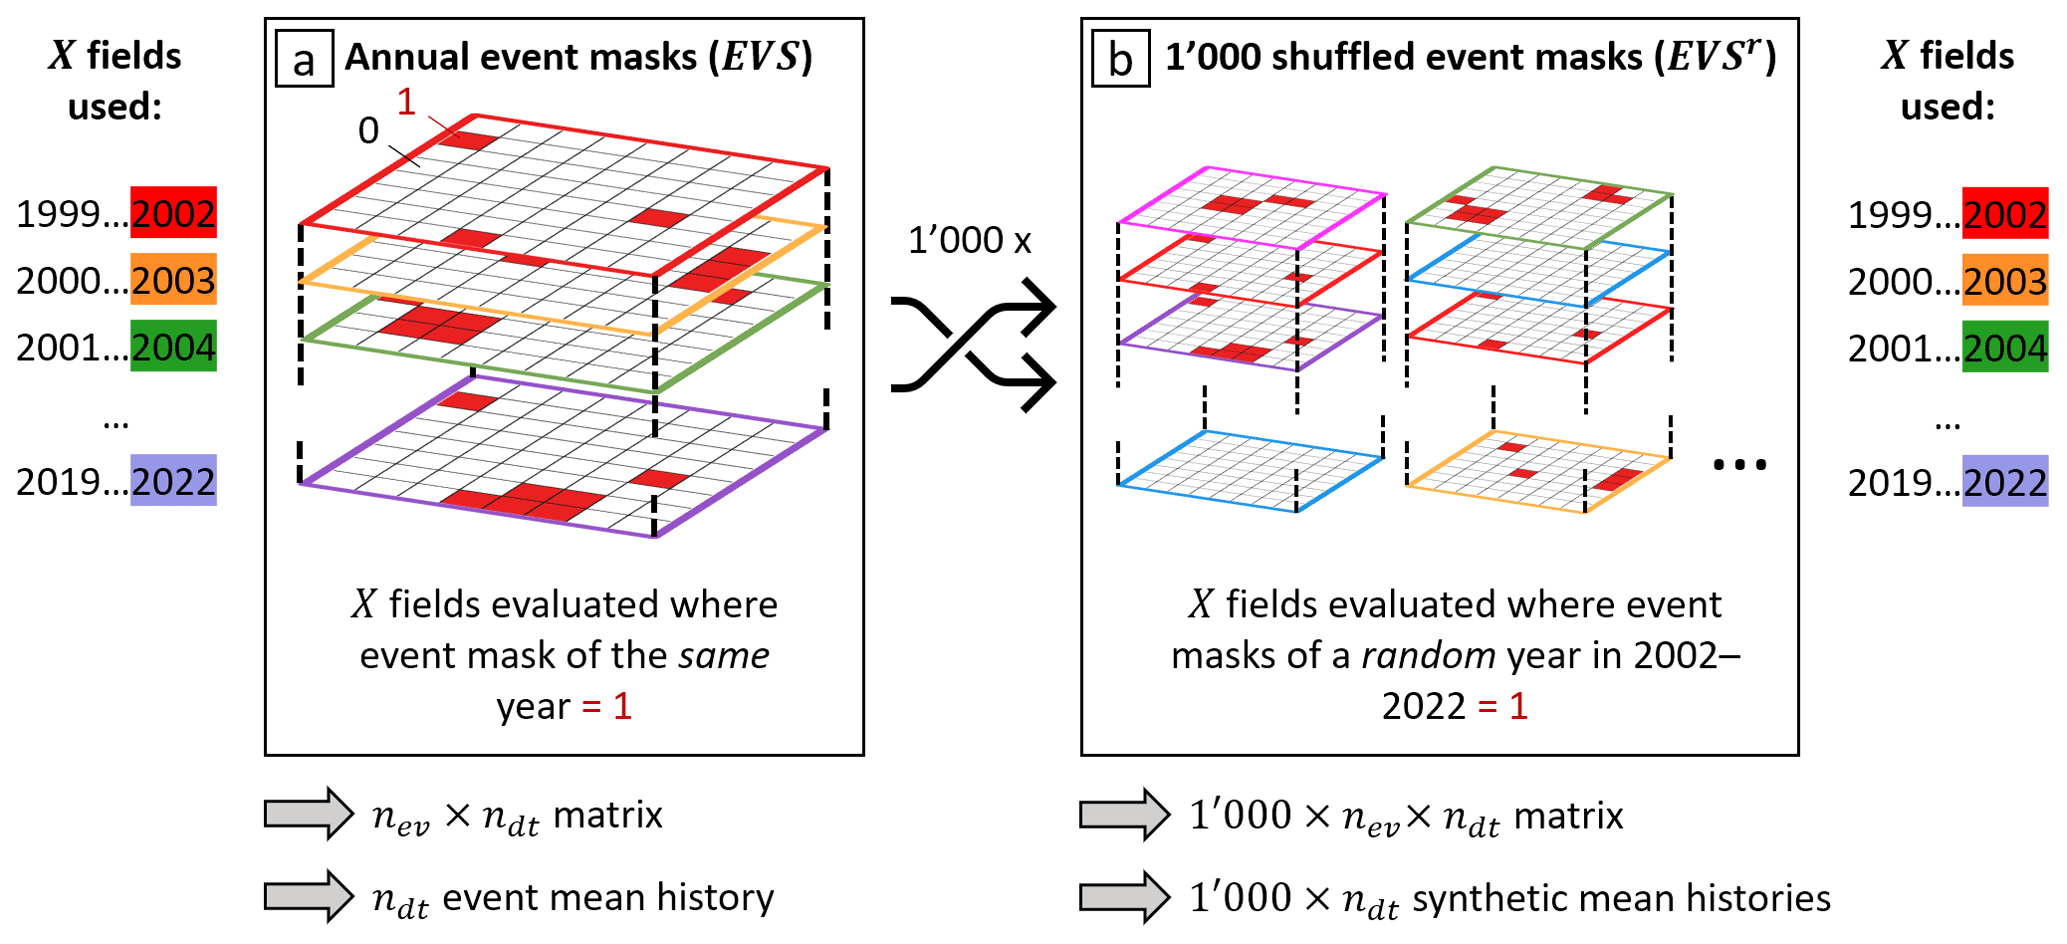
Figure B1Schematic of the construction of the event mean meteorological histories (a) of event set EVS and (b) of their synthetic analogues EVSr used for the bootstrapping test. The rows on the side show the order in which fields of X are used to extract the time series for EVS and each EVSr. The annual binary event masks of EVS in (a) are colored according to the year of occurrence. The shuffled EVSr sets have a different order of these masks; however, they use the X fields in the same order as EVS.
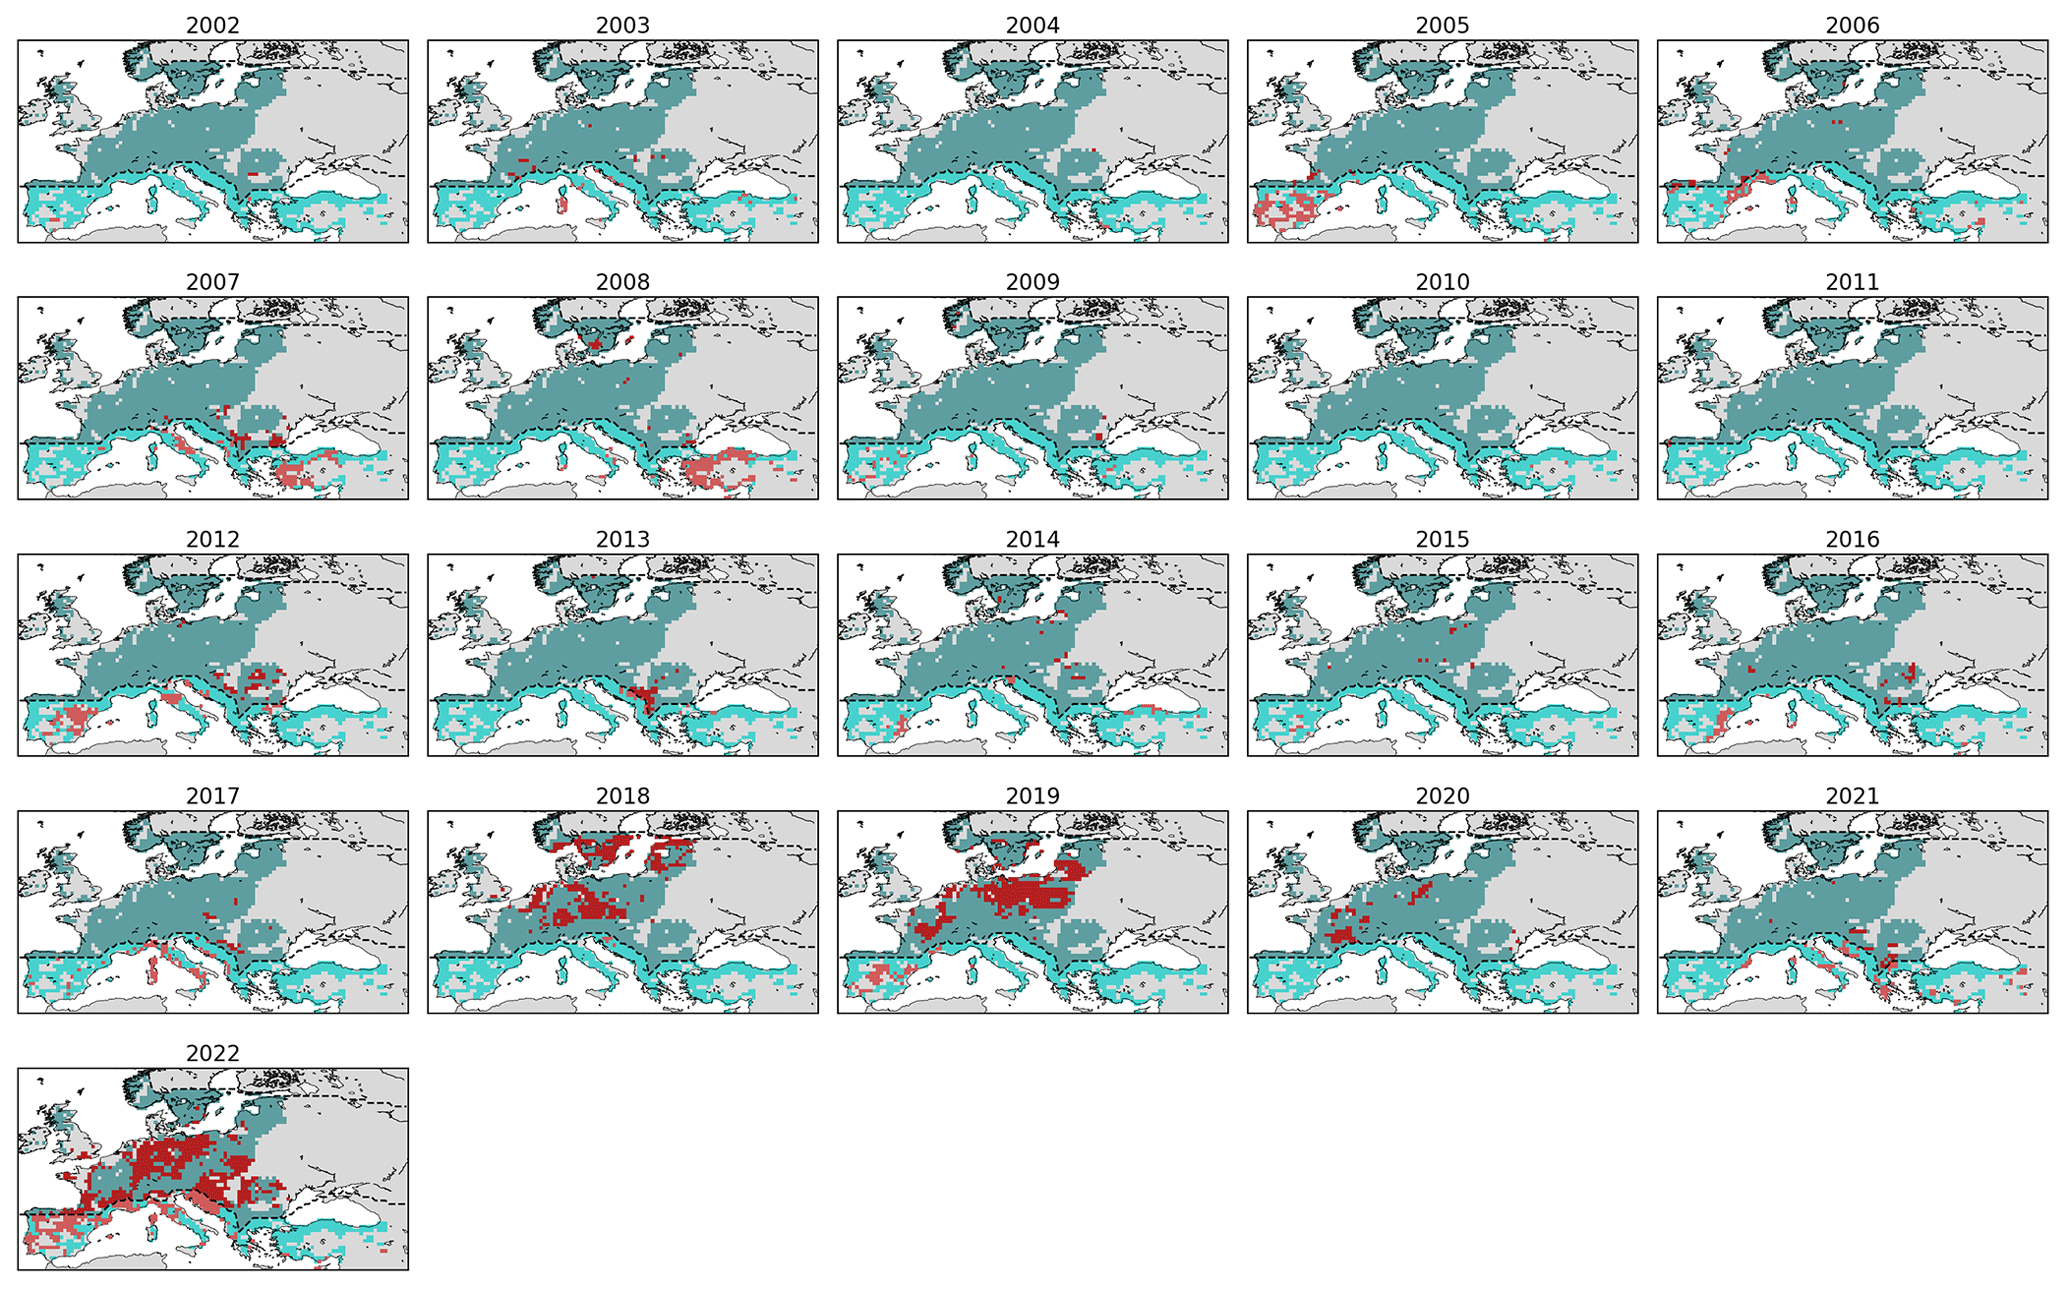
Figure C1Low-NDVI grid cells in 2002–2022 (red) in forest grid cells of the temperate (turquoise) and Mediterranean biome (cyan). The dashed lines delineate the two biomes.
We provide a brief and qualitative comparison of our set of low-NDVI grid cells with the independent disturbance data set of Senf and Seidl (2021a). The comparison is useful to put the identified low-NDVI events into perspective regarding existing knowledge on forest disturbances.
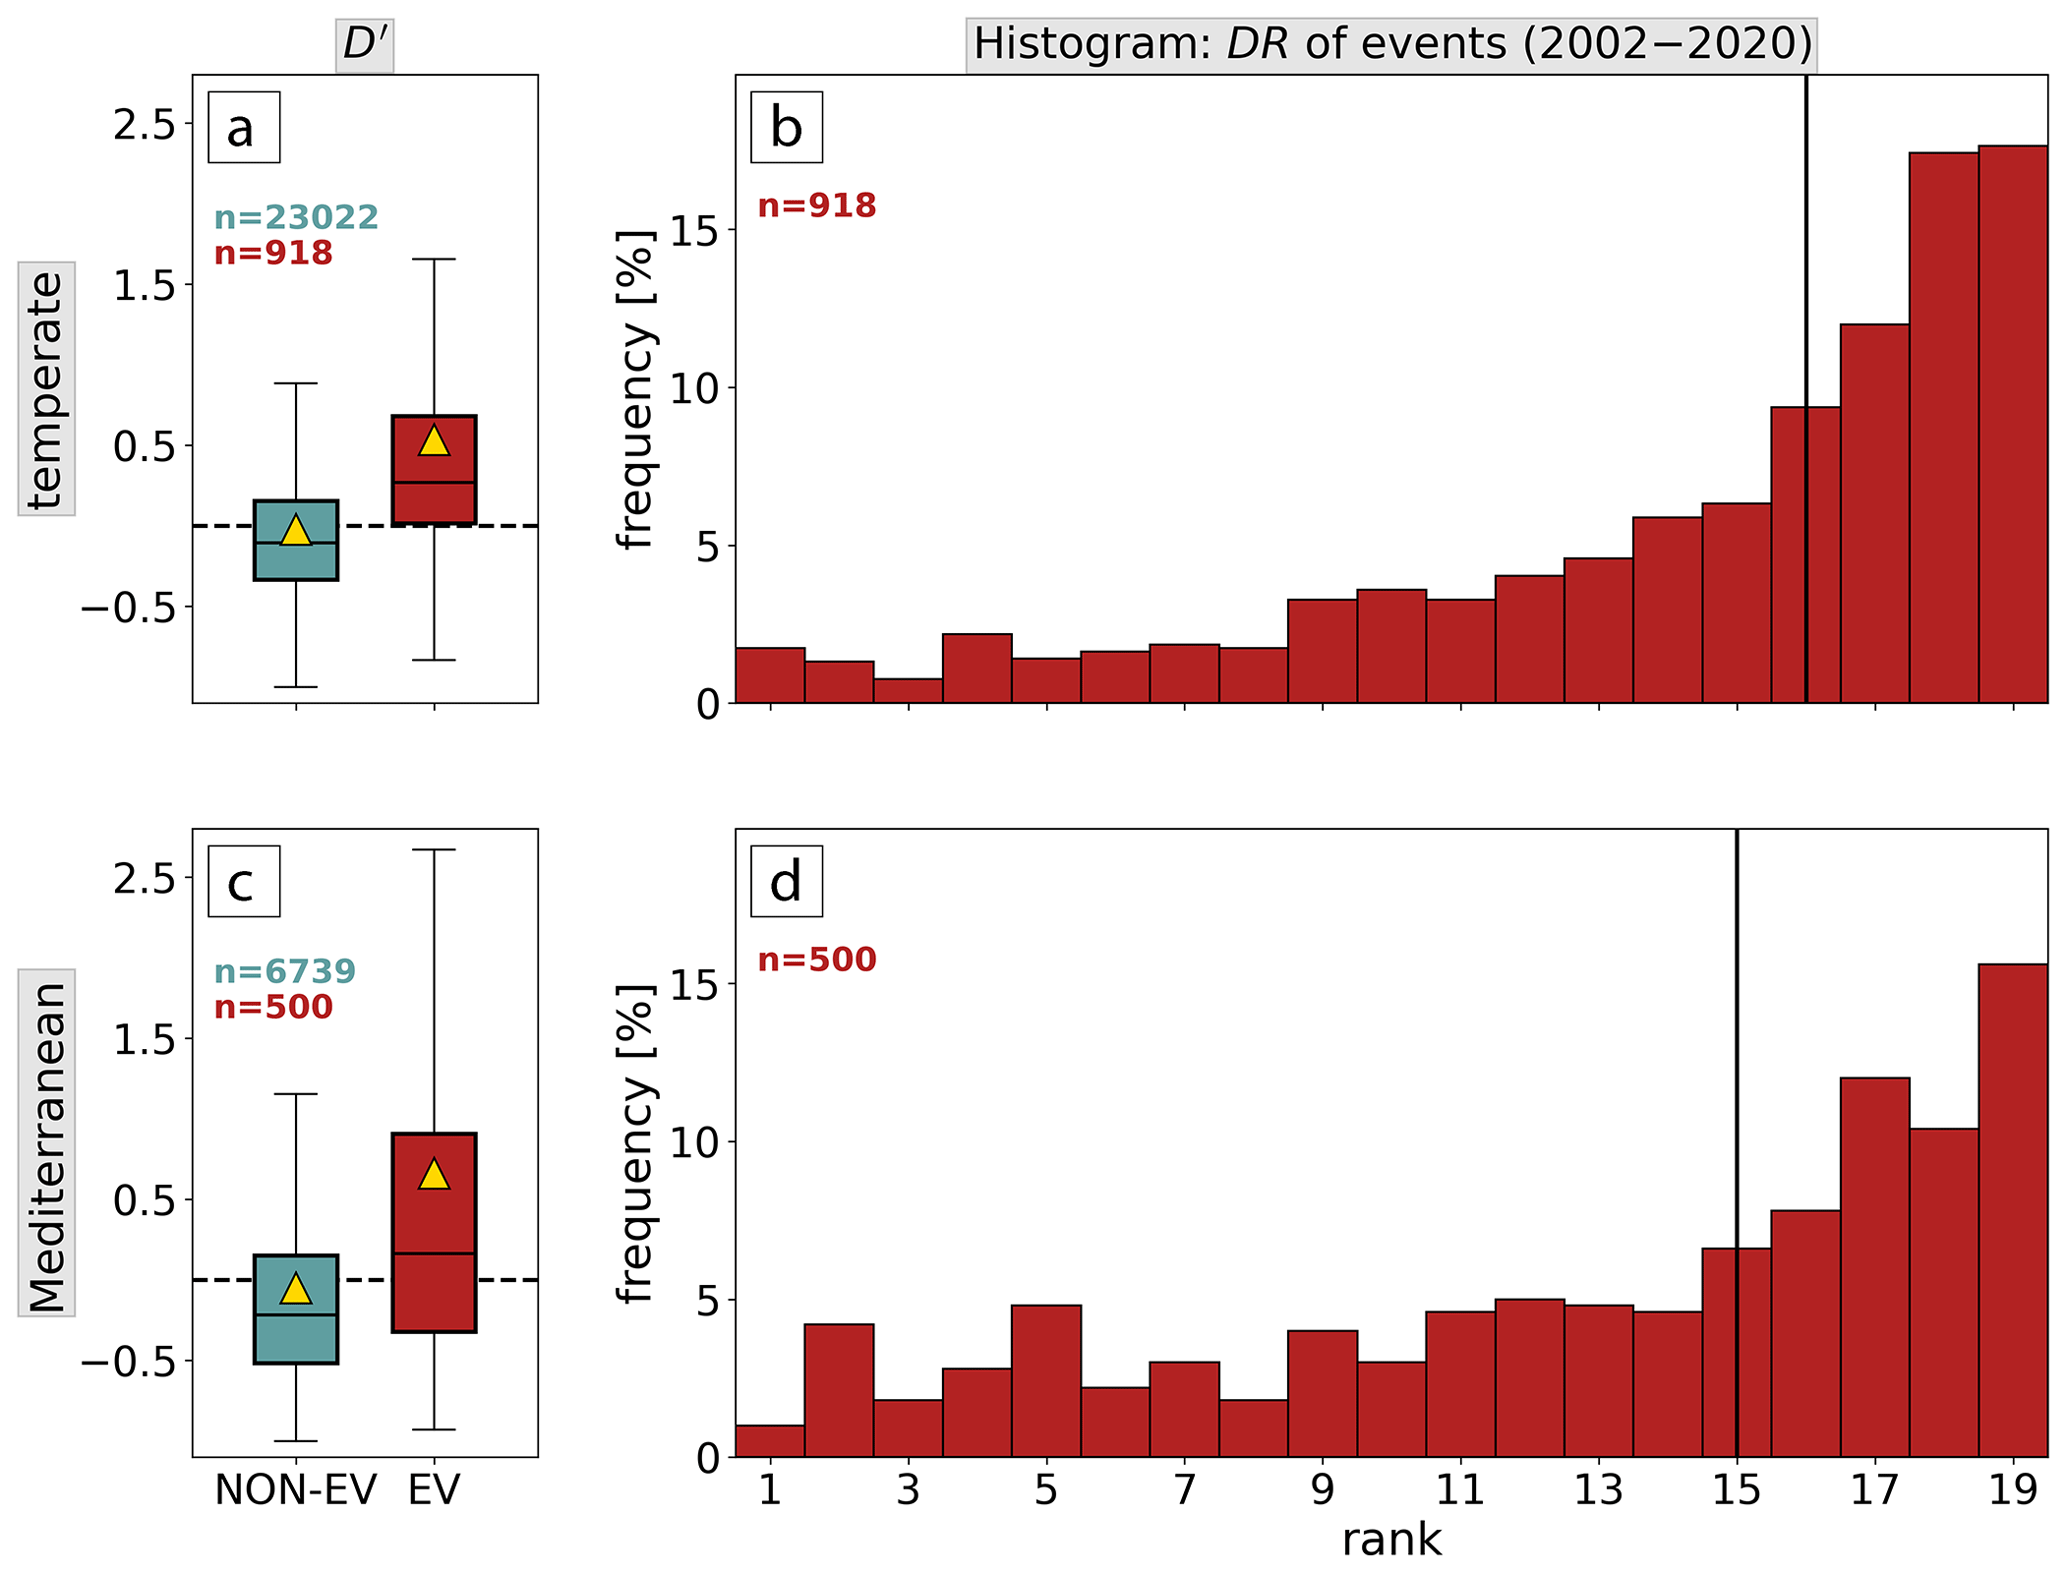
Figure D1Event comparison for (a, b) the temperate and (c, d) the Mediterranean biome in the period 2002–2020. (a, c) Boxplots of the disturbance anomaly D′ of low-NDVI grid cells (red) and non-event grid cells (turquoise). The distribution mean is shown by a yellow triangle; outliers are omitted. (b, d) Histograms of ranks 1–19 of disturbance area DR of low-NDVI grid cells in 2002–2020. The median is shown by the vertical line.
D1 Forest disturbance data set
We use the forest disturbance data set by Senf and Seidl (2021a) with an original resolution of 30 m. It is based on a time series segmentation approach called LandTrendr (Kennedy et al., 2010) and identifies tree canopy mortality in 1986–2020. The approach uses two spectral bands (shortwave infrared I and II) and two spectral indices (tasseled cap wetness and normalized burn ratio) from Tier 1 Landsat 4, 5, 7, and 8 images in June–September. For more details see Senf and Seidl (2021a). From this data set we use the annual disturbance area DJ,n, which is aggregated for every forest grid cell. We only use years and grid cells that overlap with our study period and forest grid cells as identified in Sect. 2.1. Our event data set overlaps with the disturbance data set in the time period of 2002–2020 at 91 % of forest grid cells, as D does not cover Turkey. Consequently, 66 % and 51 % of all low-NDVI grid cells in the temperate and Mediterranean biome are compared to the disturbance data set. More specifically, we use two measures of D – the disturbance anomaly D′ and the rank of D among the 19 annual values DRJ,n in 2002–2020:
at forest grid cell J in year n, with denoting the climatological mean disturbance area in 2002–2020. When referring to low-NDVI grid cells in the following, we thereby only address those that spatially overlap with D data in 2002–2020.
D2 Qualitative comparison
In 70 % of all low-NDVI grid cells the disturbance area D is larger than on average in 2002–2020 – more often in the temperate (76 %) than in the Mediterranean biome (59 %; Fig. D1a, c). The median disturbed area increases by +27 % and +16 % during low-NDVI events in the temperate and Mediterranean biome, respectively. Furthermore, non-events typically go along with negative D′ in the temperate (61 % of non-events) and the Mediterranean biome (66 %). Figure D1b and d additionally show the disturbance area rank, DR, from 1 (smallest D in 2002–2020) to 19 (largest D). With 1–6 events per affected forest grid cell (Fig. 2c) a low-NDVI grid cell would go along with DR 14–19 if the event years were equal to the years of the largest disturbed area. The majority of low-NDVI grid cells indeed covers ranks 16–19 and 15–19 in the temperate and Mediterranean biome, respectively. We conclude that low-NDVI grid cells tend to go along with more forest disturbances, i.e., enhanced canopy mortality, and rank among the largest forest disturbances at forest grid cells.
The following Figs. E1 and E2 show the spatial pattern of weather system anomalies. For all forest grid cells with at least two low-NDVI events in 2002–2022, we show how many of these events were linked to positive or negative anomalies in . Additionally, we calculate the average anomaly over all events that had the same sign of the anomaly and highlight those with mean changes of at least 25 %. For each season of the past year, from JJA-ev backward to SON-9m, we use the value of on the last day of the season, which is approximately equal to the seasonal average over the 3 preceding months.
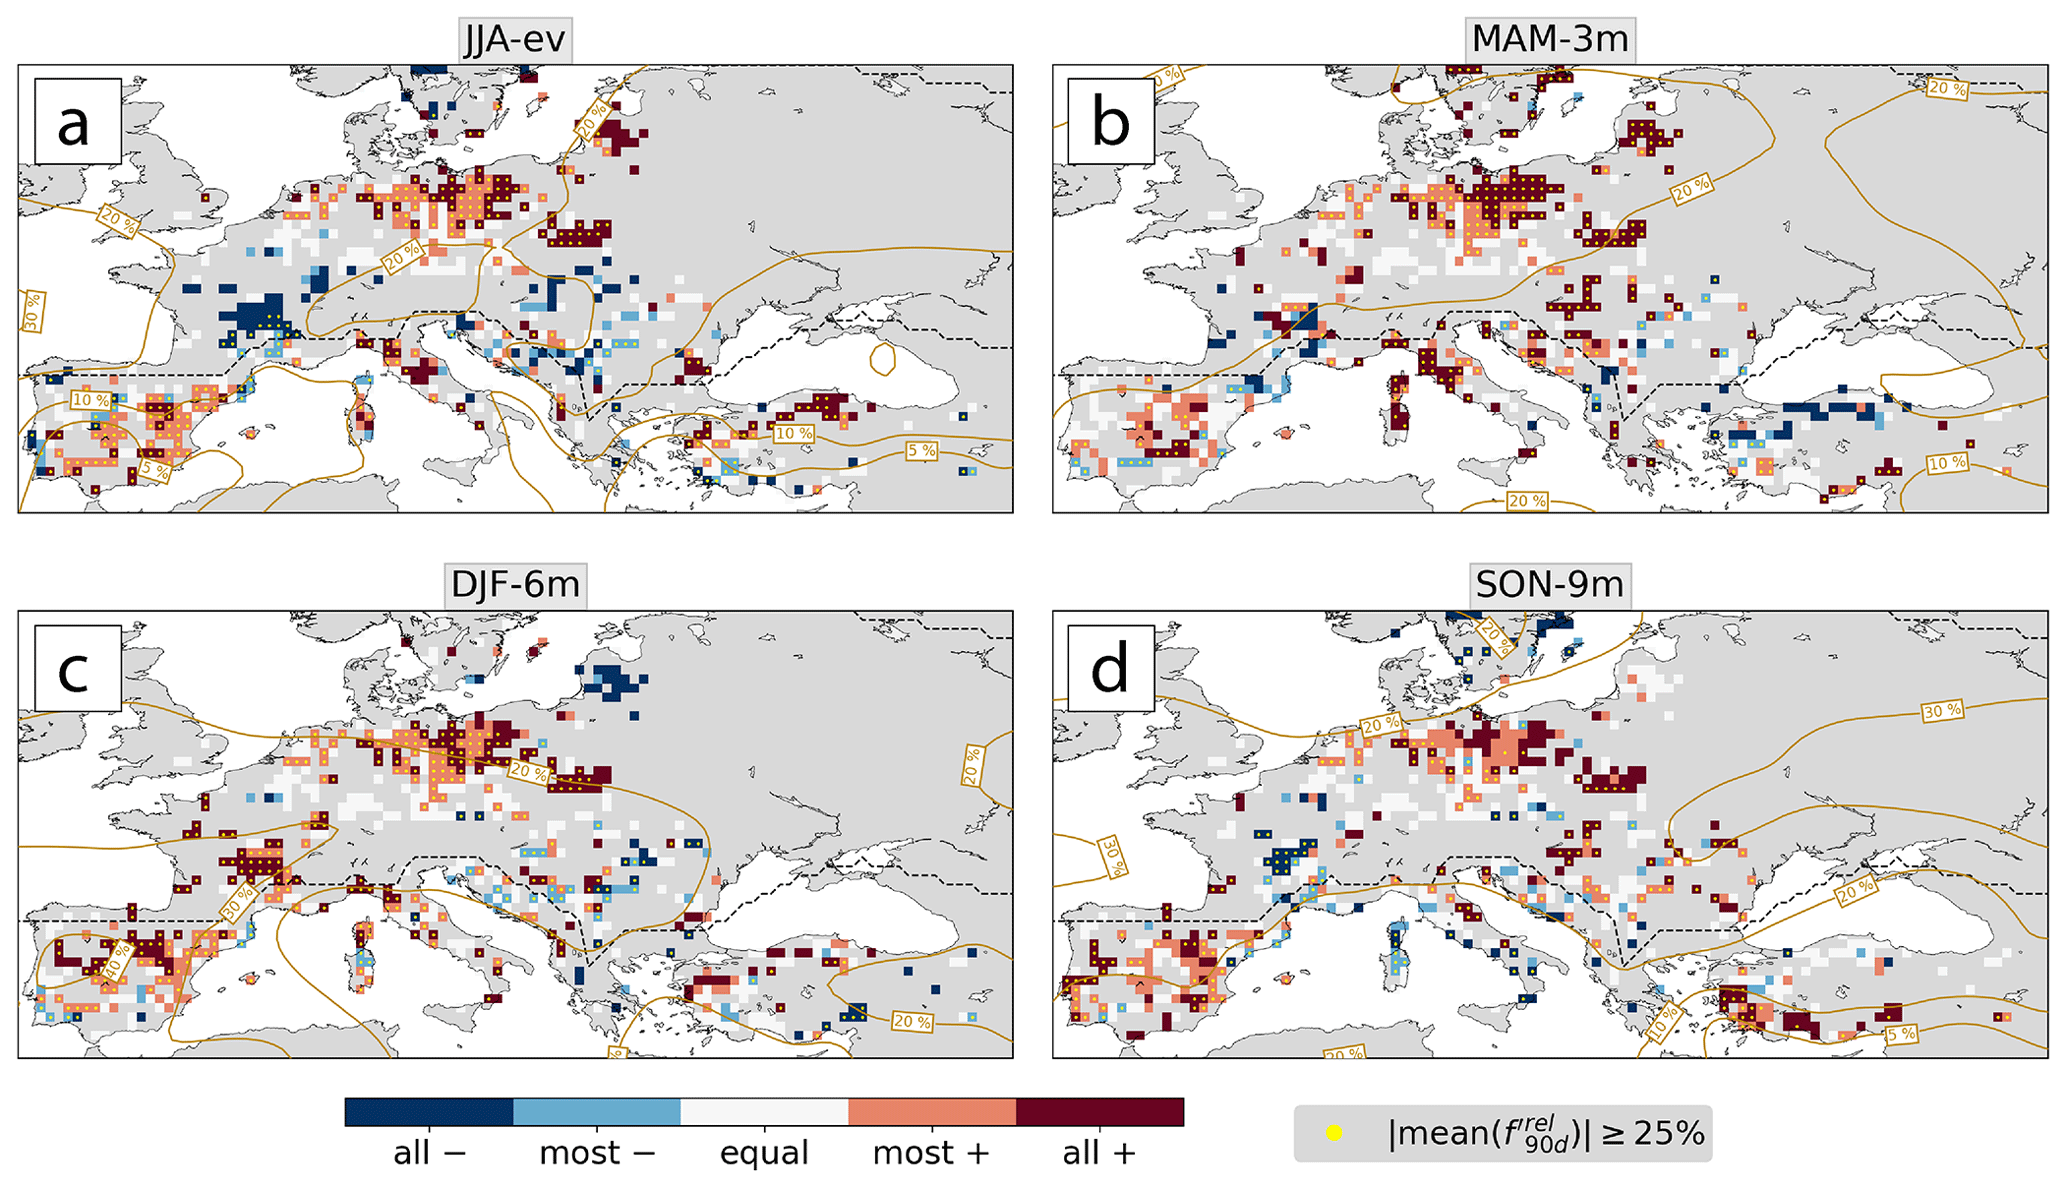
Figure E1The same as Fig. 7 but for the relative anticyclone frequency anomaly in (a) JJA-ev, (b) MAM-3m, (a, c) DJF-6m, and (d) SON-9m.
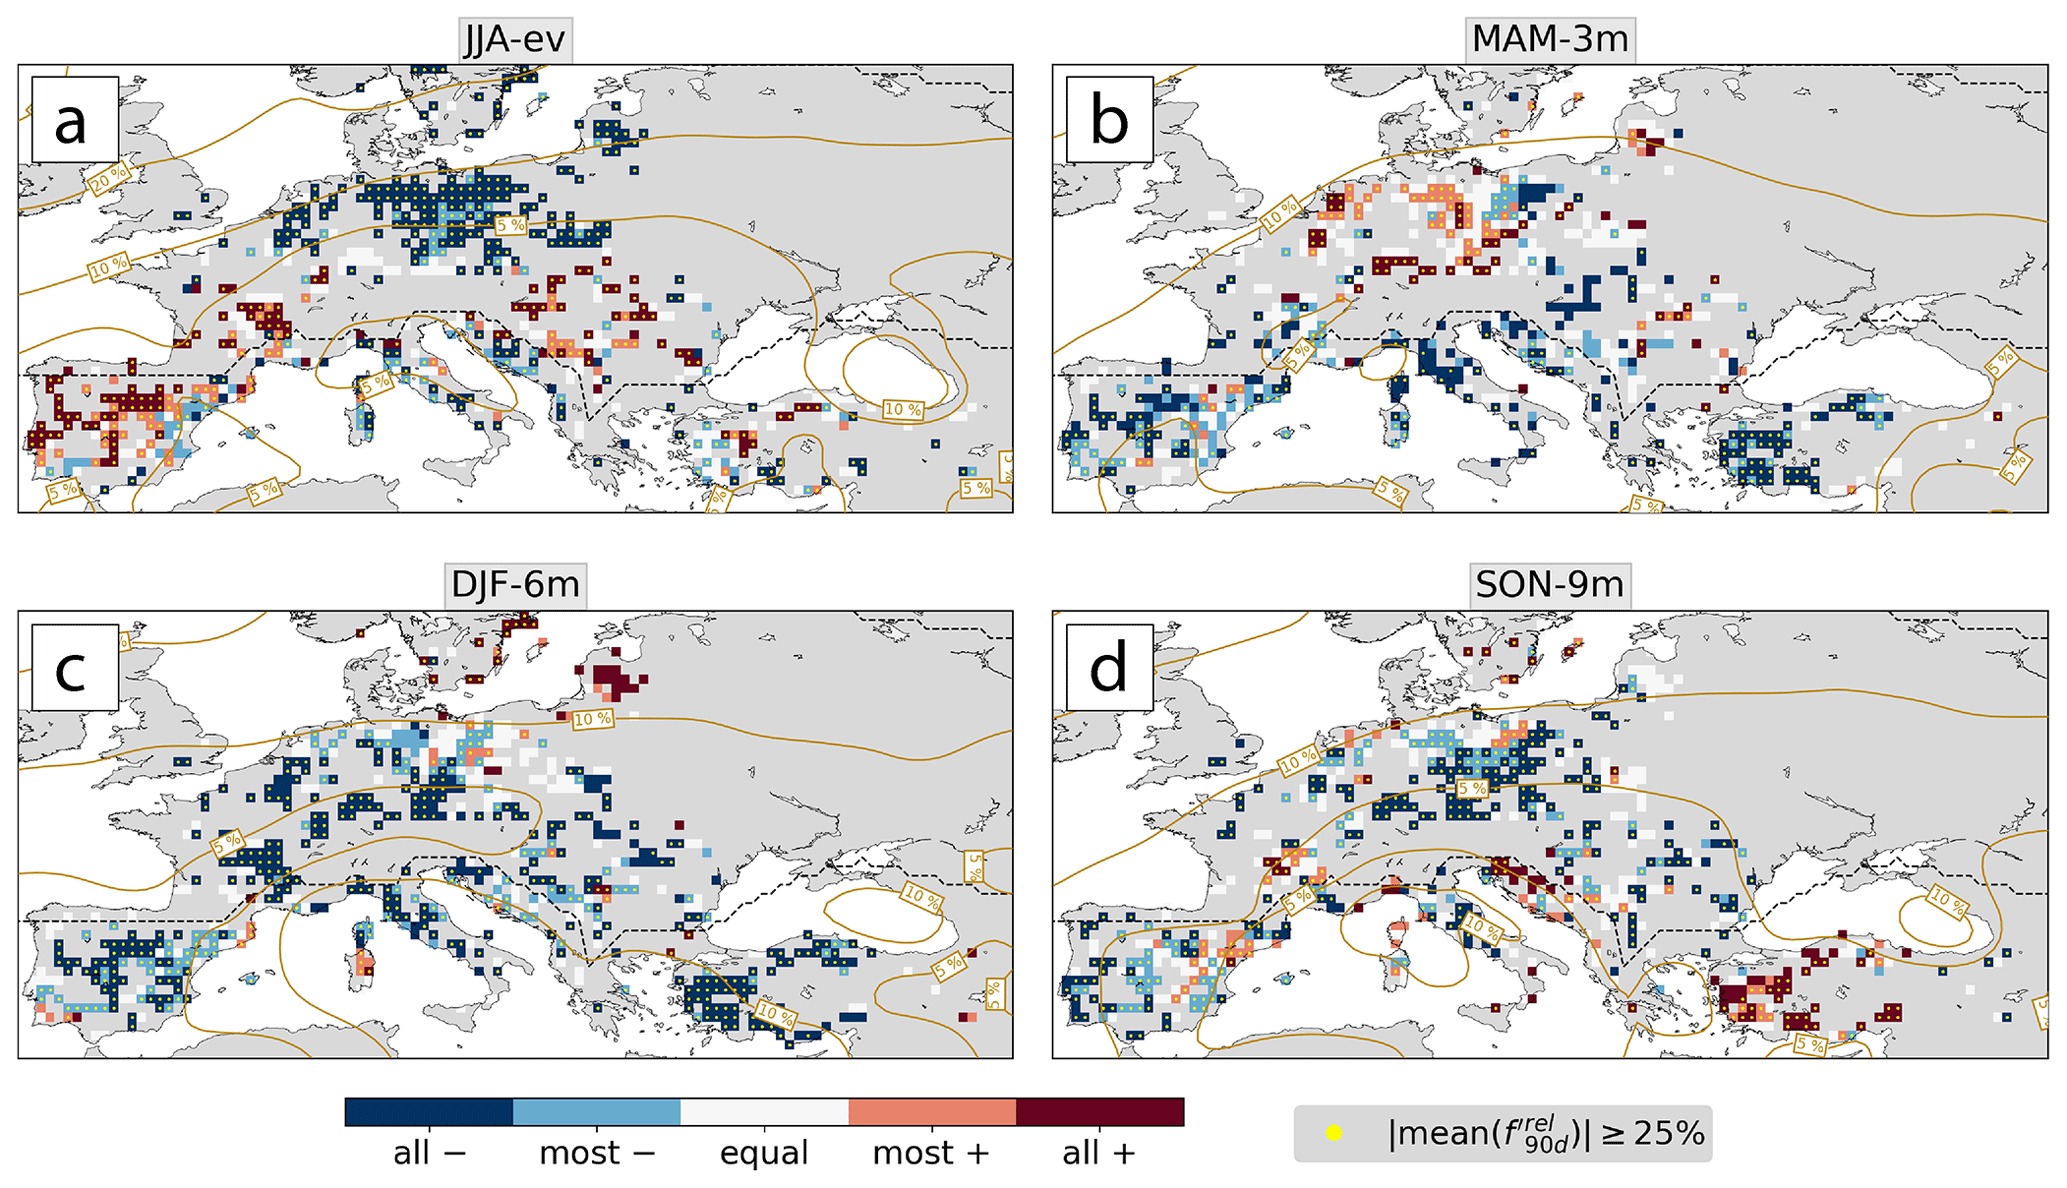
Figure E2The same as Fig. 7 but for the relative cyclone frequency anomaly in (a) JJA-ev, (b) MAM-3m, (c) DJF-6m, and (d) SON-9m.
We uploaded the low-NDVI events in JJA 2002–2022 as identified in this study to the ETH Research Collection (https://doi.org/20.500.11850/505559, Hermann, 2022). The data sets used in this study are freely available, namely 16-day NDVI data from the NASA Application for Extracting and Exploring Analysis Ready Samples (AppEEARS; https://appeears.earthdatacloud.nasa.gov), global forest cover area by Büttner et al. (2004) (https://land.copernicus.eu/pan-european/corine-land-cover), and atmospheric fields of ERA5 from the ECMWF (https://cds.climate.copernicus.eu/cdsapp##!/dataset/reanalysis-era5-pressure-levels?tab=form, Copernicus Climate Change Service, 2018). In Appendix D, we use the updated version 1.1 of forest disturbance data (Senf and Seidl, 2021a) and aggregate the data to the ERA5 grid. Version 1.0 is available at https://doi.org/10.5281/zenodo.3925446 (Senf, 2020). All other data and code are available upon request.
MH performed most of the analyses and wrote a first version of the manuscript in close exchange with MR and HW. CS contributed processed data to the study. All authors contributed to the design of the study, the interpretation of the results, and the writing.
The contact author has declared that none of the authors has any competing interests.
Publisher’s note: Copernicus Publications remains neutral with regard to jurisdictional claims in published maps and institutional affiliations.
We acknowledge the NASA Application for Extracting and Exploring Analysis Ready Samples (AppEEARS), the European Centre for Medium-Range Weather Forecasts (ECMWF), and Copernicus EU for providing all the essential data sets for this study. Mauro Hermann is grateful to Benjamin Stocker and Ana Bastos for fruitful discussions. Finally, we thank the two anonymous reviewers for constructive comments on previous versions of the manuscript, as well as the associate editor Trevor Keenan.
This research has been supported by the H2020 European Research Council (grant no. 787652).
This paper was edited by Trevor Keenan and reviewed by two anonymous referees.
Ali, S. M., Martius, O., and Röthlisberger, M.: Recurrent Rossby wave packets modulate the persistence of dry and wet spells across the globe, Geophys. Res. Lett., 48, e2020GL091452, https://doi.org/10.1029/2020GL091452, 2021. a
Allen, C. D., Macalady, A. K., Chenchouni, H., Bachelet, D., McDowell, N., Vennetier, M., Kitzberger, T., Rigling, A., Breshears, D. D., Hogg, E. T., Gonzalez, P., Fensham, R., Zhang, Z., Castro, J., Demidova, N., Lim, J.-H., Allard, G., Running, S. W., Semerci, A., and Cobb, N.: A global overview of drought and heat-induced tree mortality reveals emerging climate change risks for forests, For. Ecol. Manag., 259, 660–684, https://doi.org/10.1016/j.foreco.2009.09.001, 2010. a
Allen, C. D., Breshears, D. D., and McDowell, N. G.: On underestimation of global vulnerability to tree mortality and forest die-off from hotter drought in the Anthropocene, Ecosphere, 6, 129, https://doi.org/10.1890/ES15-00203.1, 2015. a, b
Anderegg, W. R. L., Schwalm, C., Biondi, F., Camarero, J. J., Koch, G., Litvak, M., Ogle, K., Shaw, J. D., Shevliakova, E., Williams, A. P., Wolf, A., Ziaco, E., and Pacala, S.: Pervasive drought legacies in forest ecosystems and their implications for carbon cycle models, Science, 349, 528–532, https://doi.org/10.1126/science.aab1833, 2015. a, b
Anderegg, W. R. L., Trugman, A. T., Badgley, G., Konings, A. G., and Shaw, J.: Divergent forest sensitivity to repeated extreme droughts, Nat. Clim. Change, 10, 1091–1095, https://doi.org/10.1038/s41558-020-00919-1, 2020. a, b
Anyamba, A. and Tucker, C. J.: Historical perspective of AVHRR NDVI and vegetation drought monitoring, in: Remote Sensing of Drought: Innovative Monitoring Approaches, edited by: Wardlow, B. D., Anderson, M. C., and Verdin, J. P., CRC Press/Taylor & Francis, Boca Raton, Florida, USA, 23–50, 2012. a, b
Bascietto, M., Bajocco, S., Mazzenga, F., and Matteucci, G.: Assessing spring frost effects on beech forests in Central Apennines from remotely-sensed data, Agr. Forest Meteorol., 248, 240–250, https://doi.org/10.1016/j.agrformet.2017.10.007, 2018. a
Bastos, A., Ciais, P., Park, T., Zscheischler, J., Yue, C., Barichivich, J., Myneni, R. B., Peng, S., Piao, S., and Zhu, Z.: Was the extreme Northern Hemisphere greening in 2015 predictable?, Environ. Res. Lett., 12, 044016, https://doi.org/10.1088/1748-9326/aa67b5, 2017. a
Bastos, A., Ciais, P., Friedlingstein, P., Sitch, S., Pongratz, J., Fan, L., Wigneron, J. P., Weber, U., Reichstein, M., Fu, Z., Anthoni, P., Arneth, A., Haverd, V., Jain, A. K., Joetzjer, E., Knauer, J., Lienert, S., Loughran, T., McGuire, P. C., Tian, H., Viovy, N., and Zaehle, S.: Direct and seasonal legacy effects of the 2018 heat wave and drought on European ecosystem productivity, Sci. Adv., 6, eaba2724, https://doi.org/10.1126/sciadv.aba2724, 2020a. a, b, c
Bastos, A., Fu, Z., Ciais, P., Friedlingstein, P., Sitch, S., Pongratz, J., Weber, U., Reichstein, M., Anthoni, P., Arneth, A., Haverd, V., Jain, A., Joetzjer, E., Knauer, J., Lienert, S., Loughran, T., McGuire, P. C., Obermeier, W., Padrón, R. S., Shi, H., Tian, H., Viovy, N., and Zaehle, S.: Impacts of extreme summers on European ecosystems: a comparative analysis of 2003, 2010 and 2018, Philos. T. Roy. Soc. B, 375, 20190507, https://doi.org/10.1098/rstb.2019.0507, 2020b. a
Biedermann, P. H., Müller, J., Grégoire, J.-C., Gruppe, A., Hagge, J., Hammerbacher, A., Hofstetter, R. W., Kandasamy, D., Kolarik, M., Kostovcik, M., Krokene, P., Sallé, A., Six, D. L., Turrini, T., Vanderpool, D., Wingfield, M. J., and Bässler, C.: Bark beetle population dynamics in the Anthropocene: challenges and solutions, Trends Ecol. Evol., 34, 914–924, https://doi.org/10.1016/j.tree.2019.06.002, 2019. a
Bigler, C. and Vitasse, Y.: Premature leaf discoloration of European deciduous trees is caused by drought and heat in late spring and cold spells in early fall, Agr. Forest Meteorol., 307, 108492, https://doi.org/10.1016/j.agrformet.2021.108492, 2021. a
Bose, A. K., Gessler, A., Bolte, A., Bottero, A., Buras, A., Cailleret, M., Camarero, J. J., Haeni, M., Hereş, A., Hevia, A., Lévesque, M., Linares, J. C., Martinez‐Vilalta, J., Matías, L., Menzel, A., Sánchez‐Salguero, R., Saurer, M., Vennetier, M., Ziche, D., and Rigling, A.: Growth and resilience responses of Scots pine to extreme droughts across Europe depend on predrought growth conditions, Glob. Chang. Biol., 26, 4521–4537, https://doi.org/10.1111/gcb.15153, 2020. a, b
Bose, A. K., Scherrer, D., Camarero, J. J., Ziche, D., Babst, F., Bigler, C., Bolte, A., Dorado-Liñán, I., Etzold, S., Fonti, P., Forrester, D. I., Gavinet, J., Gazol, A., de Andrés, E. G., Karger, D. N., Lebourgeois, F., Lévesque, M., Martínez-Sancho, E., Menzel, A., Neuwirth, B., Nicolas, M., Sanders, T. G., Scharnweber, T., Schröder, J., Zweifel, R., Gessler, A., and Rigling, A.: Climate sensitivity and drought seasonality determine post-drought growth recovery of Quercus petraea and Quercus robur in Europe, Sci. Total Environ., 784, 147222, https://doi.org/10.1016/j.scitotenv.2021.147222, 2021. a
Brodribb, T. J., Powers, J., Cochard, H., and Choat, B.: Hanging by a thread? Forests and drought, Science, 368, 261–266, https://doi.org/10.1126/science.aat7631, 2020. a, b, c
Buras, A., Schunk, C., Zeiträg, C., Herrmann, C., Kaiser, L., Lemme, H., Straub, C., Taeger, S., Gößwein, S., Klemmt, H.-J., and Menzel, A.: Are Scots pine forest edges particularly prone to drought-induced mortality?, Environ. Res. Lett., 13, 025001, https://doi.org/10.1088/1748-9326/aaa0b4, 2018. a
Buras, A., Rammig, A., and Zang, C. S.: Quantifying impacts of the 2018 drought on European ecosystems in comparison to 2003, Biogeosciences, 17, 1655–1672, https://doi.org/10.5194/bg-17-1655-2020, 2020. a, b, c, d, e
Buras, A., Rammig, A., and Zang, C. S.: The European Forest Condition Monitor: using remotely sensed forest greenness to identify hot spots of forest decline, Front. Plant Sci., 12, 2355, https://doi.org/10.3389/fpls.2021.689220, 2021. a, b, c, d, e, f, g
, Büttner, G., Feranec, J., Jaffrain, G., Mari, L., Maucha, G., and Soukup, T.: The CORINE Land Cover 2000 project, EARSeL eProceedings, 3, 331–346, 2004. a, b
Camarero, J. J., Álvaro Rubio-Cuadrado, and Gazol, A.: Climate windows of intra-annual growth and post-drought recovery in Mediterranean trees, Agr. Forest Meteorol., 308–309, 108606, https://doi.org/10.1016/j.agrformet.2021.108606, 2021. a
Ciais, P., Reichstein, M., Viovy, N., Granier, A., Ogée, J., Allard, V., Aubinet, M., Buchmann, N., Bernhofer, C., Carrara, A., Chevallier, F., Noblet, N. D., Friend, A. D., Friedlingstein, P., Grünwald, T., Heinesch, B., Keronen, P., Knohl, A., Krinner, G., Loustau, D., Manca, G., Matteucci, G., Miglietta, F., Ourcival, J. M., Papale, D., Pilegaard, K., Rambal, S., Seufert, G., Soussana, J. F., Sanz, M. J., Schulze, E. D., Vesala, T., and Valentini, R.: Europe-wide reduction in primary productivity caused by the heat and drought in 2003, Nature, 437, 529–533, https://doi.org/10.1038/nature03972, 2005. a, b
Cindrić, K., Prtenjak, M. T., Herceg-Bulić, I., Mihajlović, D., and Pasarić, Z.: Analysis of the extraordinary 2011/2012 drought in Croatia, Theor. Appl. Climatol., 123, 503–522, https://doi.org/10.1007/s00704-014-1368-8, 2016. a
Copernicus Atmosphere Monitoring Service: Europe’s summer wildfire emissions highest in 15 years, https://atmosphere.copernicus.eu/europes-summer-wildfire-emissions-highest-15-years, last access: 21 October 2022. a
Copernicus Climate Change Service: Copernicus: Summer 2022 Europe’s hottest on record, https://climate.copernicus.eu/copernicus-summer-2022-europes-hottest-record, last access: at 10 October 2022. a, b
Copernicus Climate Change Service, Climate Data Store: ERA5 hourly data on pressure levels from 1940 to present, [data set], https://cds.climate.copernicus.eu/cdsapp##!/dataset/reanalysis-era5-pressure-levels?tab=form (last access: 27 November 2022), 2018. a
Didan, K.: MOD13Q1 MODIS/Terra Vegetation Indices 16-Day L3 Global 250m SIN Grid V006, https://doi.org/10.5067/MODIS/MOD13Q1.006, 2015. a
EFFIS: EFFIS Estimates for European Union, https://effis.jrc.ec.europa.eu/apps/effis.statistics/estimates, last access: 21 October 2022. a
Etzold, S., Wunder, J., Braun, S., Rohner, B., Bigler, C., Abegg, M., and Rigling, A.: Mortalität von Waldbäumen: Ursache und Trends, in: Wald im Klimawandel. Grundlagen für Adaptationsstrategien, edited by: Pluess, A. R., Augustin, S., and Brang, P., Haupt Verlag, Bern, Stuttgart, Wien, 177–197, 2016. a
Etzold, S., Ziemińska, K., Rohner, B., Bottero, A., Bose, A. K., Ruehr, N. K., Zingg, A., and Rigling, A.: One century of forest monitoring data in Switzerland reveals species- and site-specific trends of climate-induced tree mortality, Front. Plant Sci., 10, 307, https://doi.org/10.3389/fpls.2019.00307, 2019. a
Feichtinger, L. M., Eilmann, B., Buchmann, N., and Rigling, A.: Growth adjustments of conifers to drought and to century-long irrigation, For. Ecol. Manage., 334, 96–105, https://doi.org/10.1016/j.foreco.2014.08.008, 2014. a
Feichtinger, L. M., Eilmann, B., Buchmann, N., and Rigling, A.: Trait-specific responses of Scots pine to irrigation on a short vs long time scale, Tree Physiol., 35, 160–171, https://doi.org/10.1093/treephys/tpu114, 2015. a
Fischer, E. M., Seneviratne, S. I., Vidale, P. L., Lüthi, D., and Schär, C.: Soil moisture-atmosphere interactions during the 2003 European summer heat wave, J. Climate, 20, 5081–5099, https://doi.org/10.1175/JCLI4288.1, 2007. a
Forzieri, G., Girardello, M., Ceccherini, G., Spinoni, J., Feyen, L., Hartmann, H., Beck, P. S. A., Camps-Valls, G., Chirici, G., Mauri, A., and Cescatti, A.: Emergent vulnerability to climate-driven disturbances in European forests, Nat. Commun., 12, 1081, https://doi.org/10.1038/s41467-021-21399-7, 2021. a
Frei, E. R., Gossner, M. M., Vitasse, Y., Queloz, V., Dubach, V., Gessler, A., Ginzler, C., Hagedorn, F., Meusburger, K., Moor, M., Vives, E. S., Rigling, A., Uitentuis, I., von Arx, G., and Wohlgemuth, T.: European beech dieback after premature leaf senescence during the 2018 drought in northern Switzerland, Plant Biol., 24, 1132–1145, https://doi.org/10.1111/plb.13467, 2022. a
Gessler, A., Bottero, A., Marshall, J., and Arend, M.: The way back: recovery of trees from drought and its implication for acclimation, New Phytol., 228, 1704–1709, https://doi.org/10.1111/nph.16703, 2020. a
Gouveia, C., Trigo, R. M., and DaCamara, C. C.: Drought and vegetation stress monitoring in Portugal using satellite data, Nat. Hazards Earth Syst. Sci., 9, 185–195, https://doi.org/10.5194/nhess-9-185-2009, 2009. a
Grossiord, C., Granier, A., Ratcliffe, S., Bouriaud, O., Bruelheide, H., Checko, E., Forrester, D. I., Dawud, S. M., Finer, L., Pollastrini, M., Scherer-Lorenzen, M., Valladares, F., Bonal, D., and Gessler, A.: Tree diversity does not always improve resistance of forest ecosystems to drought, P. Natl. Acad. Sci. USA, 111, 14812–14815, https://doi.org/10.1073/pnas.1411970111, 2014. a
Grossiord, C., Buckley, T. N., Cernusak, L. A., Novick, K. A., Poulter, B., Siegwolf, R. T., Sperry, J. S., and McDowell, N. G.: Plant responses to rising vapor pressure deficit, New Phytol., 226, 1550–1566, https://doi.org/10.1111/nph.16485, 2020. a
Hansen, M. C., Potapov, P. V., Moore, R., Hancher, M., Turubanova, S. A., Tyukavina, A., Thau, D., Stehman, S. V., Goetz, S. J., Loveland, T. R., Kommareddy, A., Egorov, A., Chini, L., Justice, C. O., and Townshend, J. R. G.: High-resolution global maps of 21st-century forest cover change, Science, 342, 850–853, https://doi.org/10.1126/science.1244693, 2013. a
Harpold, A. A., Molotch, N. P., Musselman, K. N., Bales, R. C., Kirchner, P. B., Litvak, M., and Brooks, P. D.: Soil moisture response to snowmelt timing in mixed-conifer subalpine forests, Hydrol. Process., 29, 2782–2798, https://doi.org/10.1002/hyp.10400, 2015. a
Hersbach, H., Bell, B., Berrisford, P., Hirahara, S., Horányi, A., Muñoz-Sabater, J., Nicolas, J., Peubey, C., Radu, R., Schepers, D., Simmons, A., Soci, C., Abdalla, S., Abellan, X., Balsamo, G., Bechtold, P., Biavati, G., Bidlot, J., Bonavita, M., Chiara, G. D., Dahlgren, P., Dee, D., Diamantakis, M., Dragani, R., Flemming, J., Forbes, R., Fuentes, M., Geer, A., Haimberger, L., Healy, S., Hogan, R. J., Hólm, E., Janisková, M., Keeley, S., Laloyaux, P., Lopez, P., Lupu, C., Radnoti, G., de Rosnay, P., Rozum, I., Vamborg, F., Villaume, S., and Thépaut, J. N.: The ERA5 global reanalysis, Q. J. Roy. Meteor. Soc., 146, 1999–2049, https://doi.org/10.1002/qj.3803, 2020. a
Hermann, M.: Normalized difference vegetation index (NDVI) based low forest greenness events in Europe in 2002–2022 (1.0), [data set], https://doi.org/20.500.11850/505559, 2022. a
Hlásny, T., Trombik, J., Bošeľa, M., Merganič, J., Marušák, R., Šebeň, V., Štěpánek, P., Kubišta, J., and Trnka, M.: Climatic drivers of forest productivity in Central Europe, Agr. Forest Meteorol., 234, 258–273, https://doi.org/10.1016/j.agrformet.2016.12.024, 2017. a
IPCC: Climate Change 2021: The Physical Science Basis. Contribution of Working Group I to the Sixth Assessment Report of the Intergovernmental Panel on Climate Change, in: Climate Change 2021, edited by Masson-Delmotte, V., Zhai, P., Pirani, A., Connors, S. L., Péan, C., Berger, S., Caud, N., Chen, Y., Goldfarb, L., Gomis, M. I., Huang, M., Leitzell, K., Lonnoy, E., Matthews, J. B. R., Maycock, T. K., Waterfield, T., Yelekçi, O., Yu, R., and Zhou, B., Cambridge University Press, https://doi.org/10.1017/9781009157896, 2021. a, b
Jakoby, O., Lischke, H., and Wermelinger, B.: Climate change alters elevational phenology patterns of the European spruce bark beetle (Ips typographus), Glob. Chang. Biol., 25, 4048–4063, https://doi.org/10.1111/gcb.14766, 2019. a
Kannenberg, S. A., Novick, K. A., Alexander, M. R., Maxwell, J. T., Moore, D. J. P., Phillips, R. P., and Anderegg, W. R. L.: Linking drought legacy effects across scales: From leaves to tree rings to ecosystems, Glob. Chang. Biol., 25, 2978–2992, https://doi.org/10.1111/gcb.14710, 2019. a
Kennedy, R. E., Yang, Z., and Cohen, W. B.: Detecting trends in forest disturbance and recovery using yearly Landsat time series: 1. LandTrendr – Temporal segmentation algorithms, Remote Sens. Environ., 114, 2897–2910, https://doi.org/10.1016/j.rse.2010.07.008, 2010. a
Kittl, B.: Drought 2018: Beech trees with early discoloured foliage tend to die in subsequent years, https://www.wsl.ch/en/newsseiten/2022/09/drought-2018-beech-trees-with-early-discoloured-foliage-tend-to-die-in-subsequent-years.html, last access: 25 October 2022. a
McDowell, N. G., Allen, C. D., Anderson-Teixeira, K., Aukema, B. H., Bond-Lamberty, B., Chini, L., Clark, J. S., Dietze, M., Grossiord, C., Hanbury-Brown, A., Hurtt, G. C., Jackson, R. B., Johnson, D. J., Kueppers, L., Lichstein, J. W., Ogle, K., Poulter, B., Pugh, T. A. M., Seidl, R., Turner, M. G., Uriarte, M., Walker, A. P., and Xu, C.: Pervasive shifts in forest dynamics in a changing world, Science, 368, eaaz9463, https://doi.org/10.1126/science.aaz9463, 2020. a
Meehl, G. A. and Tebaldi, C.: More intense, more frequent, and longer lasting heat waves in the 21st century, Science, 305, 994–997, https://doi.org/10.1126/science.1098704, 2004. a
Messori, G., Wu, M., Vico, G., and Galfi, V. M.: Atmospheric jet stream variability reflects vegetation activity in Europe, Agr. Forest Meteorol., 322, 109008, https://doi.org/10.1016/j.agrformet.2022.109008, 2022. a
Mohr, S., Wilhelm, J., Wandel, J., Kunz, M., Portmann, R., Punge, H. J., Schmidberger, M., Quinting, J. F., and Grams, C. M.: The role of large-scale dynamics in an exceptional sequence of severe thunderstorms in Europe May–June 2018, Weather Clim. Dynam., 1, 325–348, https://doi.org/10.5194/wcd-1-325-2020, 2020. a
Nagel, T. A., Mikac, S., Dolinar, M., Klopcic, M., Keren, S., Svoboda, M., Diaci, J., Boncina, A., and Paulic, V.: The natural disturbance regime in forests of the Dinaric Mountains: A synthesis of evidence, For. Ecol. Manag., 388, 29–42, https://doi.org/10.1016/j.foreco.2016.07.047, 2017. a
Neumann, M., Mues, V., Moreno, A., Hasenauer, H., and Seidl, R.: Climate variability drives recent tree mortality in Europe, Glob. Chang. Biol., 23, 4788–4797, https://doi.org/10.1111/gcb.13724, 2017. a
Ogaya, R., Liu, D., Barbeta, A., and Peñuelas, J.: Stem mortality and forest dieback in a 20-years experimental drought in a Mediterranean Holm Oak forest, Front. For. Glob., 2, 89, https://doi.org/10.3389/ffgc.2019.00089, 2020. a
Orth, R., Zscheischler, J., and Seneviratne, S. I.: Record dry summer in 2015 challenges precipitation projections in Central Europe, Sci. Rep., 6, 28334, 28334, https://doi.org/10.1038/srep28334, 2016. a, b, c
Pausas, J. G. and Ribeiro, E.: The global fire-productivity relationship, Glob. Ecol. Biogeogr., 22, 728–736, https://doi.org/10.1111/geb.12043, 2013. a
Pfahl, S. and Wernli, H.: Quantifying the relevance of atmospheric blocking for co-located temperature extremes in the Northern Hemisphere on (sub-)daily time scales, Geophys. Res. Lett., 39, L12807, https://doi.org/10.1029/2012GL052261, 2012a. a, b
Pfahl, S. and Wernli, H.: Quantifying the relevance of cyclones for precipitation extremes, J. Climate, 25, 6770–6780, https://doi.org/10.1175/JCLI-D-11-00705.1, 2012b. a
Rigling, A., Brühlhart, H., Bräker, O. U., Forster, T., and Schweingruber, F. H.: Effects of irrigation on diameter growth and vertical resin duct production in Pinus sylvestris L. on dry sites in the central Alps, Switzerland, For. Ecol. Manag., 175, 285–296, https://doi.org/10.1016/S0378-1127(02)00136-6, 2003. a
Rigling, A., Bigler, C., Eilmann, B., Feldmeyer-Christe, E., Gimmi, U., Ginzler, C., Graf, U., Mayer, P., Vacchiano, G., Weber, P., Wohlgemuth, T., Zweifel, R., and Dobbertin, M.: Driving factors of a vegetation shift from Scots pine to pubescent oak in dry Alpine forests, Glob. Chang. Biol., 19, 229–240, https://doi.org/10.1111/gcb.12038, 2013. a
Rita, A., Camarero, J. J., Nolè, A., Borghetti, M., Brunetti, M., Pergola, N., Serio, C., Vicente‐Serrano, S. M., Tramutoli, V., and Ripullone, F.: The impact of drought spells on forests depends on site conditions: The case of 2017 summer heat wave in southern Europe, Glob. Chang. Biol., 26, 851–863, https://doi.org/10.1111/gcb.14825, 2020. a
Russo, A., Gouveia, C. M., Dutra, E., Soares, P. M. M., and Trigo, R. M.: The synergy between drought and extremely hot summers in the Mediterranean, Environ. Res. Lett., 14, 014011, https://doi.org/10.1088/1748-9326/aaf09e, 2019. a, b
Röthlisberger, M. and Martius, O.: Quantifying the local effect of Northern Hemisphere atmospheric blocks on the persistence of summer hot and dry spells, Geophys. Res. Lett., 46, 10101–10111, https://doi.org/10.1029/2019GL083745, 2019. a
Röthlisberger, M., Pfahl, S., and Martius, O.: Regional-scale jet waviness modulates the occurrence of midlatitude weather extremes, Geophys. Res. Lett., 43, 10989–10997, https://doi.org/10.1002/2016GL070944, 2016. a, b
Röthlisberger, M., Sprenger, M., Flaounas, E., Beyerle, U., and Wernli, H.: The substructure of extremely hot summers in the Northern Hemisphere, Weather Clim. Dynam., 1, 45–62, https://doi.org/10.5194/wcd-1-45-2020, 2020. a
Rüdisühli, S., Sprenger, M., Leutwyler, D., Schär, C., and Wernli, H.: Attribution of precipitation to cyclones and fronts over Europe in a kilometer-scale regional climate simulation, Weather Clim. Dynam., 1, 675–699, https://doi.org/10.5194/wcd-1-675-2020, 2020. a, b
Salomón, R. L., Peters, R. L., Zweifel, R., Sass-Klaassen, U. G. W., Stegehuis, A. I., Smiljanic, M., Poyatos, R., Babst, F., Cienciala, E., Fonti, P., Lerink, B. J. W., Lindner, M., Martinez-Vilalta, J., Mencuccini, M., Nabuurs, G.-J., van der Maaten, E., von Arx, G., Bär, A., Akhmetzyanov, L., Balanzategui, D., Bellan, M., Bendix, J., Berveiller, D., Blaženec, M., Čada, V., Carraro, V., Cecchini, S., Chan, T., Conedera, M., Delpierre, N., Delzon, S., Ľubica Ditmarová, Dolezal, J., Dufrêne, E., Edvardsson, J., Ehekircher, S., Forner, A., Frouz, J., Ganthaler, A., Gryc, V., Güney, A., Heinrich, I., Hentschel, R., Janda, P., Ježík, M., Kahle, H.-P., Knüsel, S., Krejza, J., Łukasz Kuberski, Kučera, J., Lebourgeois, F., Mikoláš, M., Matula, R., Mayr, S., Oberhuber, W., Obojes, N., Osborne, B., Paljakka, T., Plichta, R., Rabbel, I., Rathgeber, C. B. K., Salmon, Y., Saunders, M., Scharnweber, T., Sitková, Z., Stangler, D. F., Stereńczak, K., Stojanović, M., Střelcová, K., Světlík, J., Svoboda, M., Tobin, B., Trotsiuk, V., Urban, J., Valladares, F., Vavrčík, H., Vejpustková, M., Walthert, L., Wilmking, M., Zin, E., Zou, J., and Steppe, K.: The 2018 European heatwave led to stem dehydration but not to consistent growth reductions in forests, Nat. Commun., 13, 28, https://doi.org/10.1038/s41467-021-27579-9, 2022. a
Santos, J. A., Pfahl, S., Pinto, J. G., and Wernli, H.: Mechanisms underlying temperature extremes in Iberia: a Lagrangian perspective, Tellus A: Dyn. Meteorol., 67, 26 032, https://doi.org/10.3402/tellusa.v67.26032, 2015. a, b
Scherrer, D., Bader, M. K.-F., and Körner, C.: Drought-sensitivity ranking of deciduous tree species based on thermal imaging of forest canopies, Agr. Forest Meteorol., 151, 1632–1640, https://doi.org/10.1016/j.agrformet.2011.06.019, 2011. a
Schubert, S. D., Stewart, R. E., Wang, H., Barlow, M., Berbery, E. H., Cai, W., Hoerling, M. P., Kanikicharla, K. K., Koster, R. D., Lyon, B., Mariotti, A., Mechoso, C. R., Müller, O. V., Rodriguez-Fonseca, B., Seager, R., Seneviratne, S. I., Zhang, L., and Zhou, T.: Global meteorological drought: a synthesis of current understanding with a focus on SST drivers of precipitation deficits, J. Climate, 29, 3989–4019, https://doi.org/10.1175/JCLI-D-15-0452.1, 2016. a
Schuldt, B., Buras, A., Arend, M., Vitasse, Y., Beierkuhnlein, C., Damm, A., Gharun, M., Grams, T. E., Hauck, M., Hajek, P., Hartmann, H., Hiltbrunner, E., Hoch, G., Holloway-Phillips, M., Körner, C., Larysch, E., Lübbe, T., Nelson, D. B., Rammig, A., Rigling, A., Rose, L., Ruehr, N. K., Schumann, K., Weiser, F., Werner, C., Wohlgemuth, T., Zang, C. S., and Kahmen, A.: A first assessment of the impact of the extreme 2018 summer drought on Central European forests, Basic Appl. Ecol., 45, 86–103, https://doi.org/10.1016/j.baae.2020.04.003, 2020. a, b, c
Schultz, J.: The Ecozones of the World, Springer Berlin Heidelberg, https://doi.org/10.1007/3-540-28527-X, 2005. a, b
Seftigen, K., Frank, D. C., Björklund, J., Babst, F., and Poulter, B.: The climatic drivers of normalized difference vegetation index and tree‐ring‐based estimates of forest productivity are spatially coherent but temporally decoupled in Northern Hemispheric forests, Glob. Ecol. Biogeogr., 27, 1352–1365, https://doi.org/10.1111/geb.12802, 2018. a
Seidl, R., Schelhaas, M.-J., Rammer, W., and Verkerk, P. J.: Increasing forest disturbances in Europe and their impact on carbon storage, Nat. Clim. Change, 4, 806–810, https://doi.org/10.1038/nclimate2318, 2014. a
Seidl, R., Thom, D., Kautz, M., Martin-Benito, D., Peltoniemi, M., Vacchiano, G., Wild, J., Ascoli, D., Petr, M., Honkaniemi, J., Lexer, M. J., Trotsiuk, V., Mairota, P., Svoboda, M., Fabrika, M., Nagel, T. A., and Reyer, C. P. O.: Forest disturbances under climate change, Nat. Clim. Change, 7, 395–402, https://doi.org/10.1038/nclimate3303, 2017. a, b
Seidl, R., Honkaniemi, J., Aakala, T., Aleinikov, A., Angelstam, P., Bouchard, M., Boulanger, Y., Burton, P. J., Grandpré, L. D., Gauthier, S., Hansen, W. D., Jepsen, J. U., Jõgiste, K., Kneeshaw, D. D., Kuuluvainen, T., Lisitsyna, O., Makoto, K., Mori, A. S., Pureswaran, D. S., Shorohova, E., Shubnitsina, E., Taylor, A. R., Vladimirova, N., Vodde, F., and Senf, C.: Globally consistent climate sensitivity of natural disturbances across boreal and temperate forest ecosystems, Ecography, 43, 967–978, https://doi.org/10.1111/ecog.04995, 2020. a, b
Seneviratne, S. I., Corti, T., Davin, E. L., Hirschi, M., Jaeger, E. B., Lehner, I., Orlowsky, B., and Teuling, A. J.: Investigating soil moisture–climate interactions in a changing climate: A review, Earth-Sci. Rev., 99, 125–161, https://doi.org/10.1016/j.earscirev.2010.02.004, 2010. a, b
Senf, C.: Ccorneliussenf/MappingForestDisturbancesEurope 1.0 (1.0), Zenodo, [data set], https://doi.org/10.5281/zenodo.3925446, 2020. a
Senf, C. and Seidl, R.: Mapping the forest disturbance regimes of Europe, Nat. Sustain., 4, 63–70, https://doi.org/10.1038/s41893-020-00609-y, 2021a. a, b, c, d, e, f
Senf, C. and Seidl, R.: Persistent impacts of the 2018 drought on forest disturbance regimes in Europe, Biogeosciences, 18, 5223–5230, https://doi.org/10.5194/bg-18-5223-2021, 2021b. a
Senf, C. and Seidl, R.: Storm and fire disturbances in Europe: Distribution and trends, Glob. Chang. Biol., 27, 3605–3619, https://doi.org/10.1111/gcb.15679, 2021c. a, b
Senf, C., Buras, A., Zang, C. S., Rammig, A., and Seidl, R.: Excess forest mortality is consistently linked to drought across Europe, Nat. Commun., 11, 6200, https://doi.org/10.1038/s41467-020-19924-1, 2020. a, b, c, d
Sommerfeld, A., Senf, C., Buma, B., D’Amato, A. W., Després, T., Díaz-Hormazábal, I., Fraver, S., Frelich, L. E., Álvaro G. Gutiérrez, Hart, S. J., Harvey, B. J., He, H. S., Hlásny, T., Holz, A., Kitzberger, T., Kulakowski, D., Lindenmayer, D., Mori, A. S., Müller, J., Paritsis, J., Perry, G. L. W., Stephens, S. L., Svoboda, M., Turner, M. G., Veblen, T. T., and Seidl, R.: Patterns and drivers of recent disturbances across the temperate forest biome, Nat. Commun., 9, 4355, https://doi.org/10.1038/s41467-018-06788-9, 2018. a
Sousa, P. M., Trigo, R. M., Barriopedro, D., Soares, P. M. M., and Santos, J. A.: European temperature responses to blocking and ridge regional patterns, Clim. Dynam., 50, 457–477, https://doi.org/10.1007/s00382-017-3620-2, 2018. a
Spensberger, C., Madonna, E., Boettcher, M., Grams, C. M., Papritz, L., Quinting, J. F., Röthlisberger, M., Sprenger, M., and Zschenderlein, P.: Dynamics of concurrent and sequential Central European and Scandinavian heatwaves, Q. J. Roy. Meteor. Soc., 146, 2998–3013, https://doi.org/10.1002/qj.3822, 2020. a
Sprenger, M., Fragkoulidis, G., Binder, H., Croci-Maspoli, M., Graf, P., Grams, C. M., Knippertz, P., Madonna, E., Schemm, S., Škerlak, B., and Wernli, H.: Global Climatologies of Eulerian and Lagrangian Flow Features based on ERA-Interim, B. Am. Meteorol. Soc., 98, 1739–1748, https://doi.org/10.1175/BAMS-D-15-00299.1, 2017. a
Stuart-Haëntjens, E., Boeck, H. J. D., Lemoine, N. P., Mänd, P., Kröel-Dulay, G., Schmidt, I. K., Jentsch, A., Stampfli, A., Anderegg, W. R., Bahn, M., Kreyling, J., Wohlgemuth, T., Lloret, F., Classen, A. T., Gough, C. M., and Smith, M. D.: Mean annual precipitation predicts primary production resistance and resilience to extreme drought, Sci. Total Environ., 636, 360–366, https://doi.org/10.1016/j.scitotenv.2018.04.290, 2018. a
Tague, C. L., Moritz, M., and Hanan, E.: The changing water cycle: The eco‐hydrologic impacts of forest density reduction in Mediterranean (seasonally dry) regions, WIREs Water, 6, e1350, https://doi.org/10.1002/wat2.1350, 2019. a
Temperli, C., Bugmann, H., and Elkin, C.: Cross-scale interactions among bark beetles, climate change, and wind disturbances: a landscape modeling approach, Ecol. Monogr., 83, 383–402, https://doi.org/10.1890/12-1503.1, 2013. a
Thom, D., Rammer, W., Garstenauer, R., and Seidl, R.: Legacies of past land use have a stronger effect on forest carbon exchange than future climate change in a temperate forest landscape, Biogeosciences, 15, 5699–5713, https://doi.org/10.5194/bg-15-5699-2018, 2018. a
Trenberth, K. E., Dai, A., van der Schrier, G., Jones, P. D., Barichivich, J., Briffa, K. R., and Sheffield, J.: Global warming and changes in drought, Nat. Clim. Change, 4, 17–22, https://doi.org/10.1038/nclimate2067, 2014. a
Trotsiuk, V., Hartig, F., Cailleret, M., Babst, F., Forrester, D. I., Baltensweiler, A., Buchmann, N., Bugmann, H., Gessler, A., Gharun, M., Minunno, F., Rigling, A., Rohner, B., Stillhard, J., Thürig, E., Waldner, P., Ferretti, M., Eugster, W., and Schaub, M.: Assessing the response of forest productivity to climate extremes in Switzerland using model–data fusion, Glob. Chang. Biol., 26, 2463–2476, https://doi.org/10.1111/gcb.15011, 2020. a
Tucker, C. J.: Red and photographic infrared linear combinations for monitoring vegetation, Remote Sens. Environ., 8, 127–150, https://doi.org/10.1016/0034-4257(79)90013-0, 1979. a
Turco, M., von Hardenberg, J., AghaKouchak, A., Llasat, M. C., Provenzale, A., and Trigo, R. M.: On the key role of droughts in the dynamics of summer fires in Mediterranean Europe, Sci. Rep., 7, 81, https://doi.org/10.1038/s41598-017-00116-9, 2017. a, b
Vanoni, M., Bugmann, H., Nötzli, M., and Bigler, C.: Quantifying the effects of drought on abrupt growth decreases of major tree species in Switzerland, Ecol. Evol., 6, 3555–3570, https://doi.org/10.1002/ece3.2146, 2016. a
Varol, T. and Ertuğrul, M.: Analysis of the forest fires in the Antalya region of Turkey using the Keetch–Byram drought index, J. For. Res., 27, 811–819, https://doi.org/10.1007/s11676-016-0235-0, 2016. a
Vitasse, Y., Bottero, A., Cailleret, M., Bigler, C., Fonti, P., Gessler, A., Lévesque, M., Rohner, B., Weber, P., Rigling, A., and Wohlgemuth, T.: Contrasting resistance and resilience to extreme drought and late spring frost in five major European tree species, Glob. Chang. Biol., 25, 3781–3792, https://doi.org/10.1111/gcb.14803, 2019. a, b
Wernli, H. and Schwierz, C.: Surface Cyclones in the ERA-40 Dataset (1958–2001). Part I: Novel Identification Method and Global Climatology, J. Atmos. Sci., 63, 2486–2507, https://doi.org/10.1175/JAS3766.1, 2006. a, b
Williams, A. P., Allen, C. D., Macalady, A. K., Griffin, D., Woodhouse, C. A., Meko, D. M., Swetnam, T. W., Rauscher, S. A., Seager, R., Grissino-Mayer, H. D., Dean, J. S., Cook, E. R., Gangodagamage, C., Cai, M., and McDowell, N. G.: Temperature as a potent driver of regional forest drought stress and tree mortality, Nat. Clim. Change, 3, 292–297, https://doi.org/10.1038/nclimate1693, 2013. a, b
Wolf, G., Brayshaw, D. J., Klingaman, N. P., and Czaja, A.: Quasi‐stationary waves and their impact on European weather and extreme events, Q. J. Roy. Meteor. Soc., 144, 2431–2448, https://doi.org/10.1002/qj.3310, 2018. a
Wolf, S., Eugster, W., Ammann, C., Häni, M., Zielis, S., Hiller, R., Stieger, J., Imer, D., Merbold, L., and Buchmann, N.: Contrasting response of grassland versus forest carbon and water fluxes to spring drought in Switzerland, Environ. Res. Lett., 8, 035007, https://doi.org/10.1088/1748-9326/8/3/035007, 2013. a
Yuan, W., Zheng, Y., Piao, S., Ciais, P., Lombardozzi, D., Wang, Y., Ryu, Y., Chen, G., Dong, W., Hu, Z., Jain, A. K., Jiang, C., Kato, E., Li, S., Lienert, S., Liu, S., Nabel, J. E., Qin, Z., Quine, T., Sitch, S., Smith, W. K., Wang, F., Wu, C., Xiao, Z., and Yang, S.: Increased atmospheric vapor pressure deficit reduces global vegetation growth, Sci. Adv., 5, eaax1396, https://doi.org/10.1126/sciadv.aax1396, 2019. a
Zang, C. S., Buras, A., Esquivel‐Muelbert, A., Jump, A. S., Rigling, A., and Rammig, A.: Standardized drought indices in ecological research: Why one size does not fit all, Glob. Chang. Biol., 26, 322–324, https://doi.org/10.1111/gcb.14809, 2020. a
Zhang, Y., Keenan, T. F., and Zhou, S.: Exacerbated drought impacts on global ecosystems due to structural overshoot, Nat. Ecol. Evol., 5, 1490–1498, https://doi.org/10.1038/s41559-021-01551-8, 2021. a, b, c, d
Zschenderlein, P., Fink, A. H., Pfahl, S., and Wernli, H.: Processes determining heat waves across different European climates, Q. J. Roy. Meteor. Soc., 145, 2973–2989, https://doi.org/10.1002/qj.3599, 2019. a, b, c
- Abstract
- Introduction
- Data and methods
- Results
- Discussion
- Conclusions
- Appendix A: Sensitivity to threshold parameters
- Appendix B: Bootstrapping tests
- Appendix C: Maps of low-NDVI grid cells
- Appendix D: Low-NDVI events and forest disturbance
- Appendix E: Weather system anomalies
- Code and data availability
- Author contributions
- Competing interests
- Disclaimer
- Acknowledgements
- Financial support
- Review statement
- References