the Creative Commons Attribution 4.0 License.
the Creative Commons Attribution 4.0 License.
 | 27 Mar 2023
Methane emissions from Arctic landscapes during 2000–2015: an analysis with land and lake biogeochemistry models
Xiangyu Liu
Wetlands and freshwater bodies (mainly lakes) are the largest natural sources of the greenhouse gas CH4 to the atmosphere. Great efforts have been made to quantify these source emissions and their uncertainties. Previous research suggests that there might be significant uncertainties coming from “double accounting” emissions from freshwater bodies and wetlands. Here we quantify the methane emissions from both land and freshwater bodies in the pan-Arctic with two process-based biogeochemistry models by minimizing the double accounting at the landscape scale. Two non-overlapping dynamic areal change datasets are used to drive the models. We estimate that the total methane emissions from the pan-Arctic are 36.46 ± 1.02 Tg CH4 yr−1 during 2000–2015, of which wetlands and freshwater bodies are 21.69 ± 0.59 Tg CH4 yr−1 and 14.76 ± 0.44 Tg CH4 yr−1, respectively. Our estimation narrows the difference between previous bottom-up (53.9 Tg CH4 yr−1) and top-down (29 Tg CH4 yr−1) estimates. Our correlation analysis shows that air temperature is the most important driver for methane emissions of inland water systems. Wetland emissions are also significantly affected by vapor pressure, while lake emissions are more influenced by precipitation and landscape areal changes. Sensitivity tests indicate that pan-Arctic lake CH4 emissions were highly influenced by air temperature but less by lake sediment carbon increase.
- Article
(1808 KB) - Full-text XML
- BibTeX
- EndNote


Atmospheric methane (CH4) is one of the major greenhouse gases, which contributes to about 20 % of the warming effect, second only to carbon dioxide (CO2). Atmospheric methane concentrations have risen 2.5 times since the beginning of the industrial age (Hamdan and Wickland, 2016). However, its 100-year global warming potential is around 28 times higher than CO2 (27.2 in non-fossil origin and 29.8 in fossil origin; Intergovernmental Panel on Climate Change (IPCC), 2021). Previous studies have suggested that inland water systems (wetlands and freshwater bodies) are the single largest natural source of the greenhouse gas CH4 (Saunois et al., 2020), both of which have been found to increase under changing climate. Wetland CH4 emissions are the largest natural source in the global CH4 budget, contributing to 60 %–80 % of natural CH4 emissions, equivalent to roughly one-third of total natural and anthropogenic emissions (Quiquet et al., 2015; Hopcroft et al., 2017). Under the Representative Concentration Pathway (RCP) 2.6 scenario, climate-change-induced increases in boreal wetland extent and temperature-driven increases in tropical CH4 emissions will dominate anthropogenic CH4 emissions by 38 % to 56 % toward the end of the 21st century (Zhang et al., 2017).
Likewise, lakes are the second largest CH4 source of all inland water emissions after wetlands (Kyzivat et al., 2022), accounting for approximately 30 % of biogenic methane emissions (Guo et al., 2020). They are especially common in high latitudes and account for about 10 % of the boreal landscape (Guo et al., 2020). This high coverage of lakes, especially the extensive shallow seasonally ice-covered ones in sub-Arctic landscapes, has been considered as a major source of atmospheric methane in northern high latitudes (Bastviken et al., 2011; West et al., 2016). Unlike wetlands, shallow lakes have the highest methane emission potential in the cold season which dominate the spring methane release in the pan-Arctic area (Jammet et al., 2015); since the ice layer in winter prevents methane from being oxidized by the atmospheric oxygen and from being released to the atmosphere, methane accumulated during the winter can be released in a large pulse during the spring ice melt (Phelps et al., 1998; Guo et al., 2020). In addition, due to the considerable total lake area and the substantial shallow lakes in the area of 40–70∘ N, this region was also found to be the dominant contributor (∼ 30 %) of global lake diffusive CH4 emissions (Li et al., 2020). However, in comparison with land methane emission studies, less work has been done on studying lake CH4 emissions through process-based modeling (Saunois et al., 2020), especially for the pan-Arctic region.
To date, although great efforts have been made to quantify the uncertainties of global wetland and lake methane emissions separately (Liu et al., 2020; Guo et al., 2021), there are still significant differences between the estimates of the Arctic CH4 natural sources using the bottom-up method which aggregated lakes, wetlands, and coastal waters as CH4 sources (32–112 Tg CH4 yr−1; McGuire et al., 2009; Saunois et al., 2020) and the top-down method which determines the emissions based on the spatial and temporal variability of atmospheric CH4 concentration measurements (15–50 Tg CH4 yr−1; Arctic Monitoring and Assessment Programme (AMAP), 2015). In those studies, there are potential double accounting issues for certain areas of wetlands and lakes using low-resolution wetland and lake distribution data (Thornton et al., 2016). Specifically, some small lakes and ponds might have been considered as lakes using lake models, while wetland modeling might have also treated those as wetlands, therefore being accounted for twice in the regional methane emission estimation.
Here we use two process-based biogeochemical models, the terrestrial ecosystem model–methane dynamics module (TEM-MDM; Liu et al., 2020) and the Arctic lake biogeochemistry model (ALBM; Guo et al., 2020), along with two dynamic area datasets for both wetland (Wetland Area and Dynamics for Methane Modeling (WAD2M) version 2.0; Zhang et al., 2022) and lake (global lake area, climate, and population (GLCP); Meyer et al., 2020) ecosystems which cover the inland water systems throughout the landscape without overlap, to quantify the methane emissions considering the impact of the landscape changes in both land ecosystems and freshwater bodies in the study region for the period 2000–2015.
2.1 Model description
The terrestrial ecosystem model (TEM) is a process-based biogeochemistry model which considers carbon, nitrogen, water, and heat processes in terrestrial ecosystems and was originally used to simulate ecosystem carbon and nitrogen dynamics (Melillo et al., 1993; Zhuang et al., 2001, 2002, 2003, 2004, 2007, 2013). The model considers important freeze–thaw processes and explicitly integrates soil thermodynamics in permafrost and non-permafrost region biogeochemical processes. It is also coupled with a complex hydrological module that enables the modeling of soil moisture profiles and water table depths in upland and wetland ecosystems. Zhuang et al. (2004) also developed a methane dynamics module (MDM), which was integrated into TEM to estimate CH4 emissions from northern high-latitude regions and further revised and extrapolated to the global scale to quantify soil methane consumption (Zhuang et al., 2013). Recently, Liu et al. (2020) revised the model to the version we used in this study by taking into account several more detailed land methane cycling processes, including various types of wetlands in different regions based on plant functional types, the impact of above-soil surface water on methane transport, and cumulative vertical methane concentrations in soil, such that it can give a more precise methane estimate on the global scale.
The Arctic lake biogeochemistry model (ALBM) is a 1-D process-based climate-sensitive lake biogeochemical model originally developed for simulating CH4 production, oxidation, and emission in Arctic lakes (Tan et al., 2015; Tan and Zhuang, 2015a, b) and later revised to predict both thermal and carbon dynamics of aquatic ecosystems in boreal lakes (Tan et al., 2017; Guo et al., 2020), and it was then successfully applied to temperate lakes (Tan et al., 2018; Guseva et al., 2020). Recently, the ALBM is also shown to be capable of simulating global lake thermal dynamics (Guo et al., 2021). The model consists of several modules, including those for the water–sediment thermal circulation, conceptualized as the water thermal module (WTM) and the sediment thermal module (STM), and those for the gas diffusive and ebullition transportation, conceptualized as the bubble transport module (BTM) and the dissolved gas transport module (GTM) (Tan et al., 2015). The model also covers the radiative transfer processes and the water–sediment biogeochemistry, including the terrestrial ecosystems' organic carbon loading, the microbial and photochemical organic carbon degradation, the photosynthesis for inorganic carbon fixation, and phytoplankton biomass loss through respiration for further simulation of CO2 dynamics. The ability of ALBM to simulate and represent the thawing and freezing cycles of sediments in thermokarst lakes and the organic carbon inputs induced by thermokarst activities, the degradation of dissolved organic carbon through photochemical mineralization, and the mobilization and mineralization of labile organic carbon in the deep sediments of yedoma lakes is crucial for understanding the carbon dynamics in Arctic lakes, which makes it a better choice for simulating Arctic lake methane emission than other lake models that are usually lacking these processes (Tan et al., 2017).
2.2 Input data
Here we use two global dynamic area changing datasets for both wetland and lake ecosystems. For wetlands, the Wetland Area and Dynamics for Methane Modeling (WAD2M) version 2.0 was used as the TEM-MDM model input as transient wetland inundation fraction data. The dataset following the same processing method as version 1.0 (Zhang et al., 2021), which was used for quantifying the global methane budget for 2000–2017 (Saunois et al., 2020) but included a few updates on the static inventories applied in WAD2M and used the same monthly SWAMPS version 3.2 (Jensen and McDonald, 2019), was provided for the Global Carbon Project wetland CH4 (GCP-CH4) model intercomparison. Compared to the previous one, the new version applied the Global River Width from Landsat (GRWL) database (https://zenodo.org/record/1297434, last access: 20 October 2022; Allen and Pavelsky, 2018) and HydroLAKES (https://www.hydrosheds.org/images/inpages/HydroLAKES_TechDoc_v10.pdf, last access: 20 October 2022; Messager et al., 2016) instead of the Joint Research Center global surface water (GSW) dataset (Pekel et al., 2016) to remove inland freshwater systems, defined as lakes, ponds, and rivers, and the time period was extended to 2000–2020. Land cover data, which are used to assign parameters to each grid cell, followed Liu et al. (2020), from which vegetation type distribution is from Melillo et al. (1993) and soil texture is from Zhuang et al. (2003).
For lake simulation, we used the global lake area, climate, and population dataset (GLCP; Meyer et al., 2020) as the dynamic input for ALBM model. Using the HydroLAKES database version 1.0 for the locations and numbers of lakes, the GLCP contains over 1.4 million lakes of at least 10 ha in surface area, with annual surface area (identified as permanent or seasonal water) from 1995 to 2015, paired with annual basin-level temperature, precipitation, and population values. HydroLAKES is a global database of all lakes with a surface area of at least 10 ha based on inventories using geo-statistical approaches. GLCP directly uses HydroLAKES to determine the lake locations and numbers, and HydroLAKES is also the dataset WAD2M used to remove inland freshwater bodies; thus, the combination of these two datasets (GLCP and WAD2M 2.0) covers the inland water systems throughout the landscape and will not overlap with each other. Hence, using these two dynamic datasets will minimize the double accounting problem, which refers to some lakes and ponds being accounted for twice in both regional lake and wetland methane emission estimations at the landscape scale (Thornton et al., 2016). We further classified the lakes into four types based on their location and permafrost thawing type in the pan-Arctic area (above 45∘ N), including yedoma thermokarst lakes (yedoma/YDM), non-yedoma thermokarst lakes (thermokarst/TMK), non-thermo-boreal lakes (boreal/BRL), and temperate lakes (temperate/TMP). From these, yedoma and thermokarst lakes are classified based on a circumpolar yedoma map (Jens et al., 2022) and arctic circumpolar distribution and soil carbon of thermokarst landscapes (Olefeldt et al., 2016a, b), and non-thermo boreal lakes and temperate lakes were defined based on whether their location is above 60∘ N. At the end, a total of 1 248 478 lakes were simulated, including 101 852 yedoma lakes, 249 434 non-yedoma-thermokarst lakes, 390 687 non-thermo-boreal lakes, and 506 505 temperate lakes. Because the time period is different for these two datasets (2000–2020 for WAD2M and 1995–2015 for GLCP), we chose the overlap years of 2000–2015 as our simulation time period.
For the climate forcing data, we used GSWP3-W5E5 and 20CRv3-ERA5 datasets (gswp3-w5e5_obsclim_global_daily and 20crv3-era5_obsclim_hurs_global_daily, https://data.isimip.org/10.48364/ISIMIP.982724, last access: 10 January 2023; Lange et al., 2022): both are factual climate input daily datasets with a resolution of 0.5∘ × 0.5∘ globally provided by the Inter-Sectoral Impact Model Intercomparison Project (ISIMIP). These forcing data were used for both models to ensure that no additional uncertainties are introduced. Air temperature, surface pressure, wind speed at 10 m, relative humidity, precipitation, snowfall, downward shortwave radiation, and downward longwave radiation were used in the ALBM model as input forcing. For the TEM-MDM model simulation, we only used air temperature, relative humidity, precipitation, and downward shortwave radiation, where air temperature and relative humidity were used to calculate the vapor pressure as another input.
2.3 Model parameters
The model parameters are derived from previous studies, both of which did the parameter calibration and validation on a global scale (Liu et al., 2020; Guo et al., 2021). For TEM-MDM, 15 key parameters involved in wetland methane oxidation and production processes were calibrated and validated at the site level (15 sites for calibration and 14 sites for validation) using the shuffled complex evolution approach (SCE-UA). Other information, such as vegetation type, soil texture, and wetland type, were also set based on site observations. For ALBM, 58 freshwater lakes of varying shapes, locations, climates, and landscapes were used for the calibration of nine lake sediment property-related parameters. The calibration process used the Sobol sequence sampling method to generate a perturbed parameter ensemble (PPE) of 10 000 samples from the parameter space, and then the Monte Carlo method was applied to simulate this PPE for each lake. Six years of the observation data from each lake were used for calibration, and the rest were used for validation.
2.4 Simulation protocols
Model simulations followed different protocols for different models. In the wetland simulation (using TEM-MDM), the terrestrial ecosystem model 5.0 (TEM5) was first run in the same simulation area and time period to get the net primary production (NPP) and leaf area index (LAI); the outputs were then fed to TEM-MDM as input to calculate methane emissions. For the TEM5 simulation, we first did the spinup run 10 times with 40 years per spin before the transient simulation to let the model reach a steady state using the first 40-year (1901–1940) input data; the 120 years (1901–2020) transient simulation was run in TEM-MDM, while the first 100 years simulation was used as spin up. For lake simulation using ALBM, as discussed in Sect. 2.2, the lakes were classified into four types based on their location and permafrost thawing type. We further grouped each type of lake based on their surface area (<1, 1–10, >10 km2) and depth (<3, >3 m) and whether they are in the same 0.5∘ × 0.5∘ pixel, so that lakes in the same groups will be driven by the same meteorology input data. Different types of lakes used different parameter sets derived from calibration. For all the simulations, a spinup period of 10 years was run first.
2.5 Sensitivity test
Sensitivity tests were conducted for lake emission simulations in three aspects. According to the previous studies, under the shared socioeconomic pathway (SSP) 5-8.5 scenario, temperature will increase roughly by 4–6 ∘C (IPCC, 2021; Huang et al., 2022) and precipitation exhibits an increasing trend at a rate of 10.28 mm per decade in the Northern Hemisphere, corresponding to a ∼ 13 %–18 % increase by the end of the 21st century (Chen and Frauenfeld, 2014; Du et al., 2022). Therefore, we rerun the simulation by (1) increasing the daily temperature by 5 ∘C; (2) increasing the daily precipitation by 15 %, where both rain and snowfall were considered; and (3) adding additional 15 % carbon into lake sediments to simulate the influence of permafrost thawing due to global warming. For temperature and precipitation, we directly modified them at the data input step. For lake sediment carbon, we assumed that the additional carbon transferred straight from old organic matter in thawing permafrost (old organic carbon pool) to new organic matter at the water–sediment interface (young organic carbon pool) and changed it by altering the labile carbon density (Clabile) (Tan et al., 2015). Because the old organic carbon pool may only contribute to CH4 production in the permafrost thaw bulb under yedoma and thermokarst lakes, we just altered the corresponding Clabile.
3.1 Temporal dynamics of methane emissions at the landscape scale
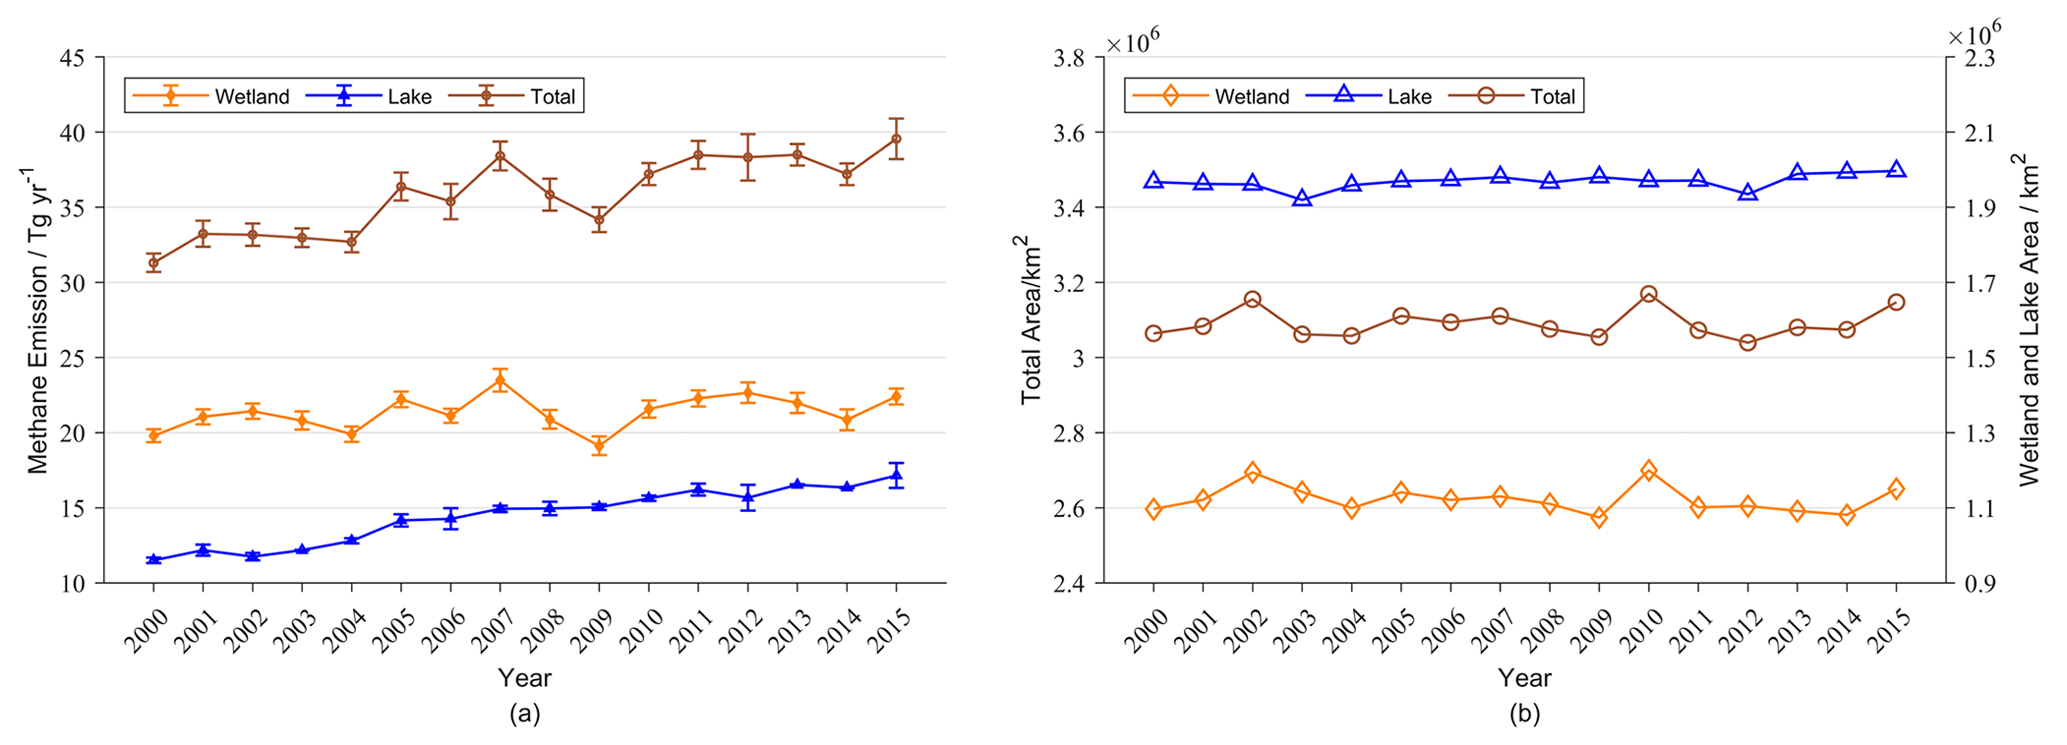
The ALBM model simulation driven with the GLCP dataset indicates that the methane emission from lakes in the pan-Arctic region ranges from 11.88 ± 0.18 Tg CH4 yr−1 in the year 2000 to 18.20 ± 0.31 Tg CH4 yr−1 in the year 2015 with a mean value of 14.76 ± 0.44 Tg CH4 yr−1. For different types of lakes, we estimate 6.41 ± 0.05 Tg CH4 yr−1 for temperate lakes, 3.07 ± 0.09 Tg CH4 yr−1 for boreal lakes, 2.36 ± 0.28 Tg CH4 yr−1 for thermokarst lakes, and 2.92 ± 0.07 Tg CH4 yr−1 for yedoma lakes, respectively. The TEM-MDM model driven with WAD2M 2.0 inundation data estimates land ecosystem net emissions of 21.69 ± 0.59 Tg CH4 yr−1, ranging from 19.44 ± 0.63 in 2009 to 23.87 ± 0.76 in 2007. Combining the two model simulations along with two dynamic area change datasets, we estimate that the total annual methane emission from inland water systems in the region of 45∘ N north during 2000–2015 is 36.46 ± 1.02 Tg CH4 yr−1, with the lowest value of 31.91 ± 0.61 Tg CH4 yr−1 in the year 2000 and the highest value of 41.09 ± 1.35 Tg CH4 yr−1 in 2015 (Fig. 1a).
Figure 1b shows the landscape change over the 2000–2015 period. From this, the wetland area was calculated using inundation fraction data and the lake area was directly derived from the GLCP dataset. The total annual average area of the inland water system in the study region is 3 090 690 ± 38 203 km2 (mean ± standard deviation), with a minimum value of 3 039 565 km2 in 2003 and a maximum of 3 169 494 km2 in 2015. The total wetland area is 1 122 493 ± 36 303 km2 ranging from 1 074 079 km2 (2009) to 1 199 428 km2 (2010). For lakes, the total area ranges from 1 919 652 km2 in 2003 to 1 996 625 km2 (1 968 197 ± 19 708 km2).
3.2 Spatial variations of landscape-level methane emissions
Spatial wetland and lake methane emissions are shown in Fig. 2a and b separately. The West Siberia Lowland and the Hudson Bay Lowland were two strong sources. There are many sporadic high emission sources in wet tundra and small wetlands in boreal forest regions and river and coastal floodplains. Although a majority of lakes are located in the northern Hudson Bay area, they all have low emissions at around 1 g CH4 m−2 yr−1, compared to which, lakes near Mackenzie River delta of Canada and the Hudson Bay Lowland area have a relatively higher emission at 50 g CH4 m−2 yr−1, as well as lakes in northern Europe such as Sweden, Finland, and the northwest corner of Russia (around Lake Onega). Figure 2c shows the methane emission for inland water systems in the pan-Arctic area: it is worth noting that the average emissions of the lake are usually higher than the emission of the wetlands around the lake, indicating that lakes emit more methane than wetlands in same the region under the same conditions.

Figure 2Spatial distribution of average annual methane emissions (g CH4 m−2 yr−1) from (a) wetlands, (b) lakes, and (c) total inland water systems in the pan-Arctic region.
3.3 Correlation and sensitivity analysis results
The relationship between annual methane emissions from inland water systems and climate drivers and landscape areal change are shown in Fig. 3. The studied climate drivers include vapor pressure (relative humidity), precipitation, temperature, and shortwave radiation. For areal changes, wetlands and lakes are shown separately. We also did a correlation analysis between annual methane emissions and these drivers. The results are shown in Table 1. Temperature and vapor pressure have a very similar trend and fit well with wetland emissions, with a high correlation of 0.80 and 0.88, which are the only two that have a P value less than 0.01. The precipitation captured the upward and downward trends of wetland emissions, with a relatively high and statistically significant correlation of 0.56. Compared to this, the shortwave radiation and areal change have lower correlations with wetland emissions. For lake emissions, Fig. 3 shows that temperature captured the most upward and downward trends, followed by shortwave radiation and precipitation, with statistically significant correlations of 0.54, 0.47, and 0.45, respectively. Although the annual average vapor pressure shares a similar annual trend with temperature and lake methane emissions, the correlation analysis is relatively low. In addition, the methane emissions from lakes (0.56) are more sensitive to landscape areal changes than to wetlands changes (0.27 with no statistical significance).
Table 1Correlations between annual methane emissions and climate drivers and landscape changes.
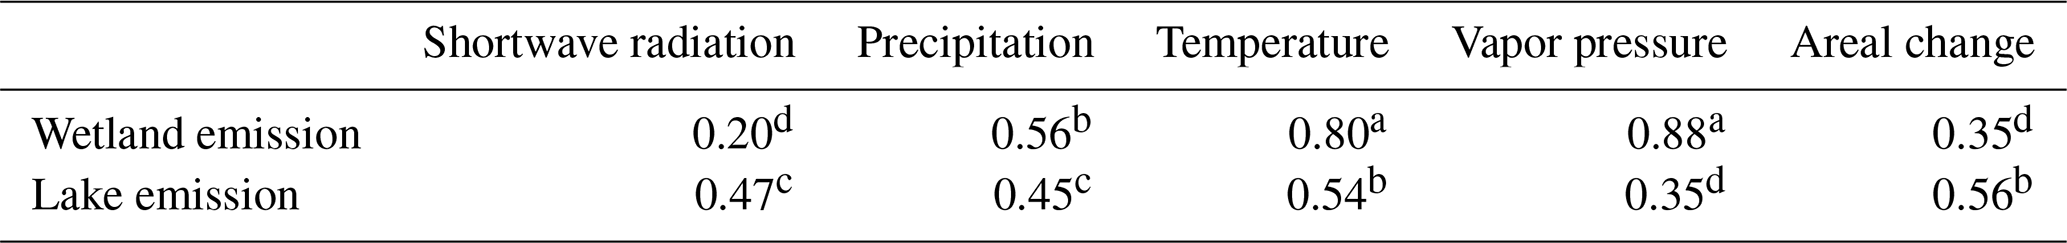
a P value less than 0.01. b P value less than 0.05. c P-value less than 0.1. d P value greater than 0.1.
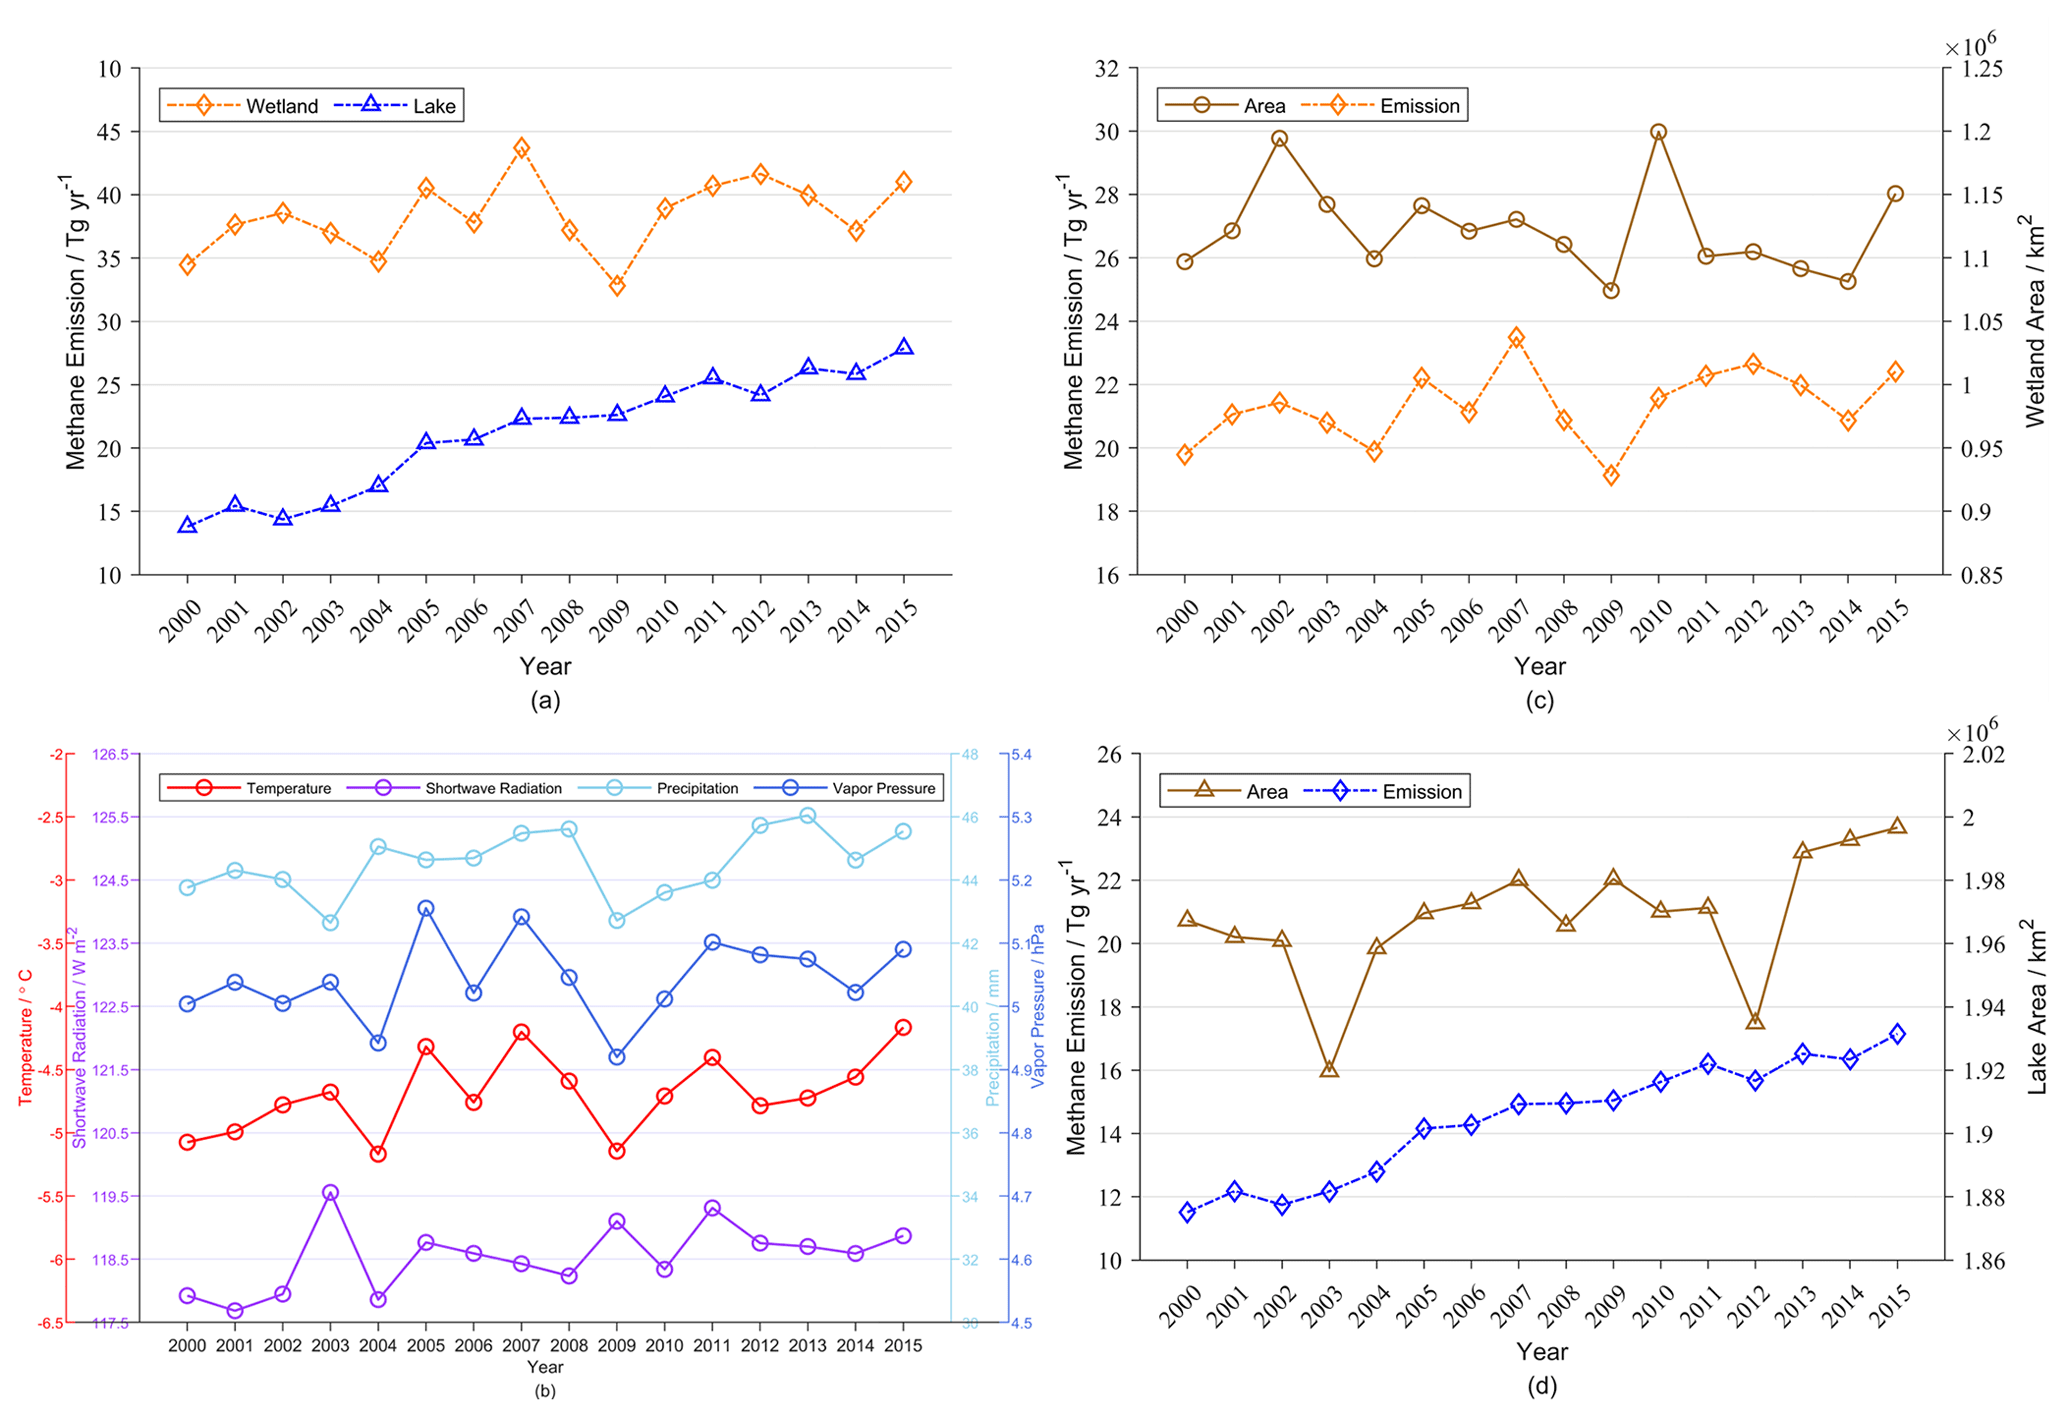
Figure 3Relationships between methane emissions from inland water systems and key drivers: (a) methane emissions, (b) four climate drivers, methane emission with (c) wetland area, and (d) lake area changes.
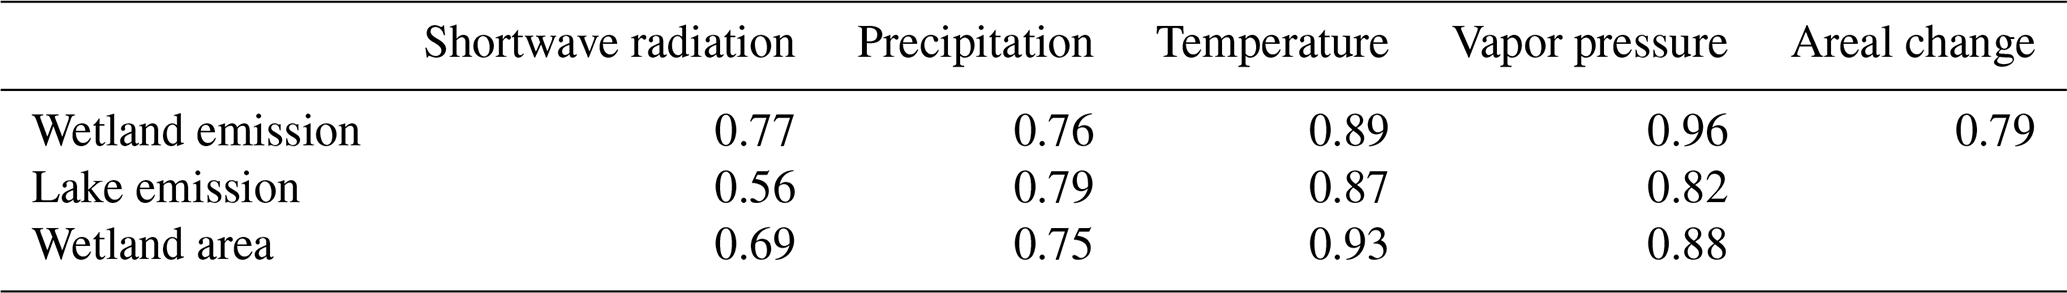
Considering that annual average values are not capable of capturing the seasonal/monthly relationship, we then did another correlation analysis using monthly data. From this, monthly wetland and lake emissions, four climate drivers, and wetland inundation data were used, while monthly lake area data are not available (Table 2). Each correlation in the table has a P value lower than 0.01, which means they are all statistically significant. For vapor pressure, just like the high correlation with wetland emissions in interannual trends (Table 1), the monthly correlation is still the highest among the five factors (0.96). The second highest correlation with wetland emissions is also temperature (0.89), followed by wetland area, shortwave radiation, and precipitation. Although the interannual variation of shortwave radiation does not fully coincide with wetland emissions (Fig. 3) and they seem to have a low and statistically meaningless correlation, their monthly correlation still has a relatively high value of 0.77. In terms of the correlation of lake methane emissions, temperature has the highest value of 0.87, followed by relative humidity (vapor pressure) and precipitation. We also did a correlation analysis between wetland area and climate drivers, and we found that temperature and vapor pressure are the climatic factors that have the greatest impact on wetland landscape areal changes.
Table 2Correlation between monthly methane emission and climate drivers and landscape changes.
Different types of lakes have various sensitivities to increasing temperature, precipitation, and additional lake sediment carbon (Fig. 4 and Table 3). Lake methane emission from above 45∘ N is more sensitive to temperature changes than to precipitation or the lake sediment carbon pool. When temperature increases by 5 ∘C, lake emissions increase by 19 %, where thermokarst lakes are influenced the most (28.5 %) and yedoma lakes are influenced the least (7.35 %). Precipitation has low impacts on lake CH4 emissions. The overall lake emissions only increase by 0.19 % when the precipitation increased by 15 %. Thermokarst lakes remain relatively most sensitive to changes in precipitation (0.82), while the other three types of lakes were all insensitive. For additional sediment carbon added due to permafrost thaw, only thermokarst and yedoma lakes were impacted, with an increase of 15 % carbon leading to a similar increase for both types of lakes (20.85 % and 18.98 %), resulting in an overall CH4 emission increase by 6.85 %.
Table 3Average increase for four types of lakes (temperate (TMP), boreal (BRL), thermokarst (TMK), and yedoma (YDM)), and total CH4 emissions in 16-year period due to changes in temperature, precipitation, and lake sediment carbon.
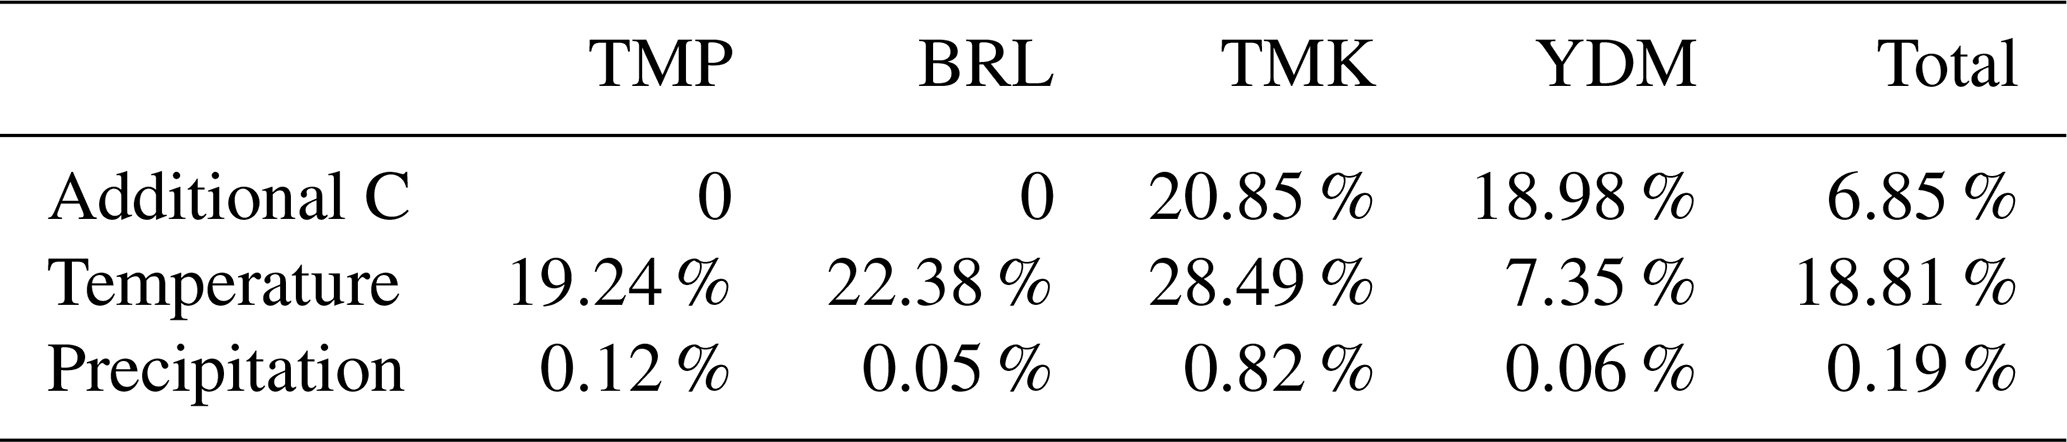
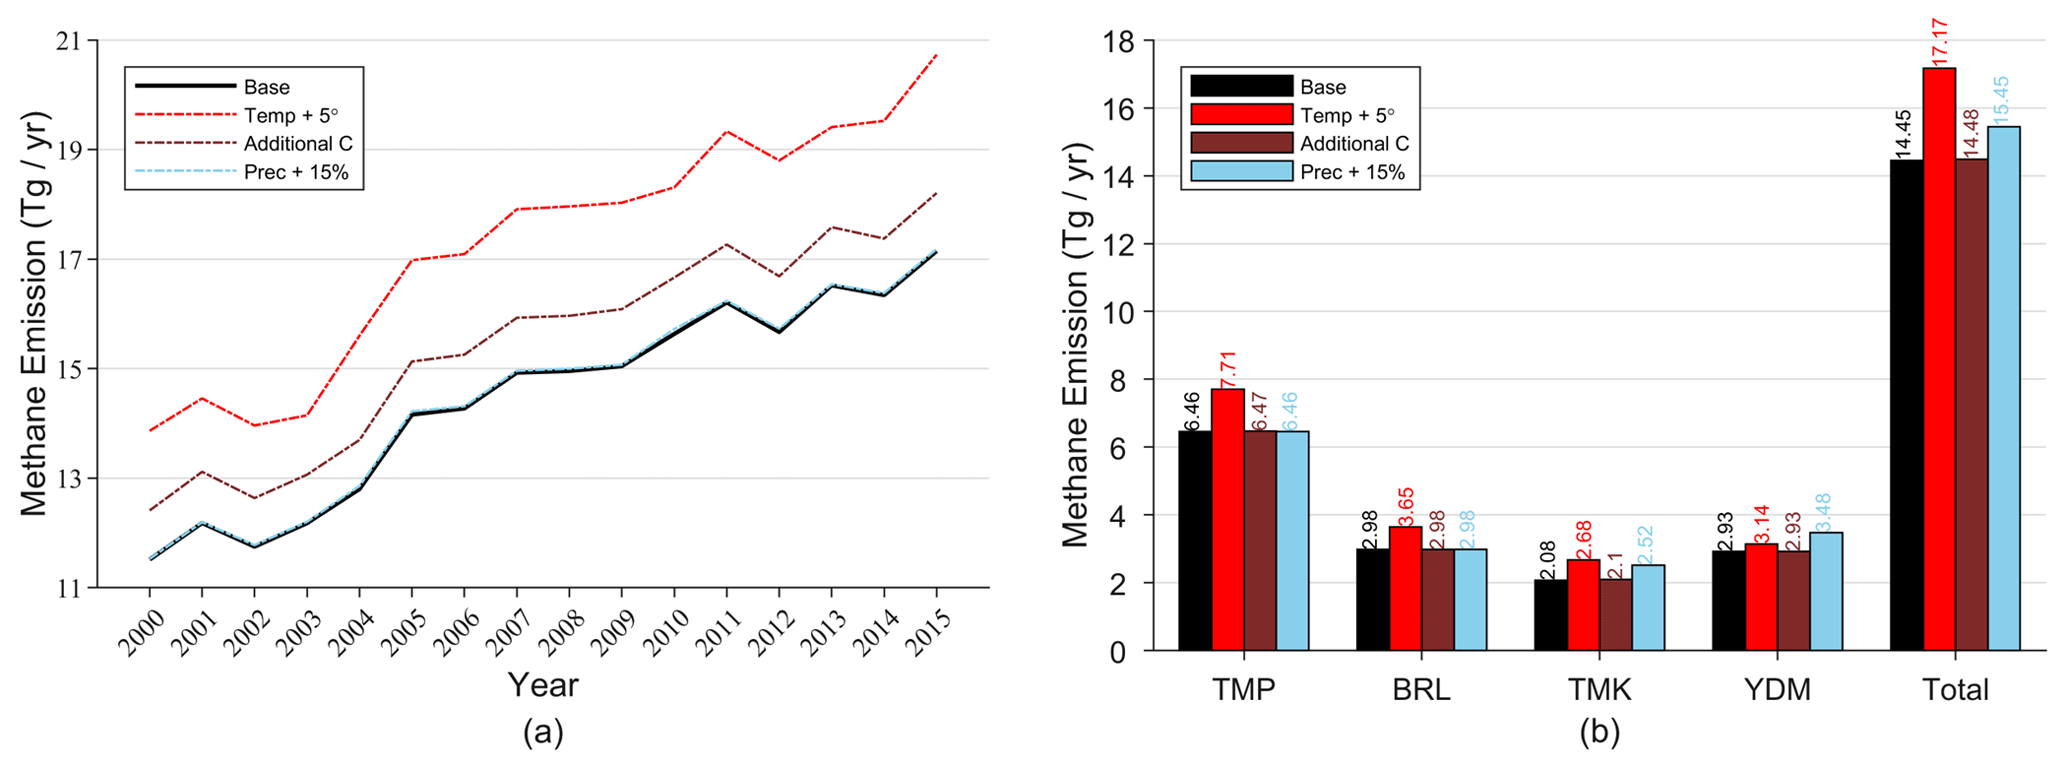
Figure 4Sensitivity test for increasing temperature by 5 ∘C, increasing precipitation by 15 %, and adding additional 15 % carbon into lake sediments (a). Average value of each type of lakes including temperate (TMP), boreal (BRL), thermokarst (TMK), and yedoma (YDM) (b).
4.1 Annual methane emissions from the landscape
From previous studies, Wik et al. (2016) estimated 16.5 Tg CH4 yr−1 emissions from lakes and ponds north of 50∘ N, while Bastviken et al. (2011) estimated 13.4 for inland waters (lakes, reservoirs, streams, and rivers) >54∘ N, both of which are estimated using measurement data combined with inventories. Based on a new spatially explicit dataset of lakes >50∘ N, which includes not only all lakes with area greater than 0.1 km2 but also 6.5 million smaller lakes (0.02–0.1 km2), Matthews et al. (2020) estimated that emissions are 13.8–17.7 Tg CH4 yr−1. Using a process-based model (bLake4Me, a previous version of the ALBM model), Tan and Zhuang (2015a) estimated 11.86 Tg CH4 yr−1 in the 2005–2008, ranging from 7.1 to 17.3 Tg CH4 yr−1 for north of 60∘ N. After this study, a coupled model of bLake4Me and a thermokarst lake-evolution model was used to estimate a total methane emission of 11.3 ± 2.1 Tg CH4 yr−1 from lakes >60∘ N in the year 2006 (Tan and Zhuang, 2015b). Compared to these estimates, our lake simulation results fall in a reasonable range.
For emissions from northern high latitude wetlands, Chen et al. (2015) estimated 36.1 ± 6.7 Tg CH4 yr−1 during 1997–2006 for the same pan-Arctic wetlands (north of 45∘ N) using an enhanced variable infiltration capacity (VIC) model linked with the Walter and Heimann (2000) wetland CH4 emissions model. Zhang et al. (2017) used a bottom-up approach with the LPJ-wsl model, estimating methane emissions of 23.4 ± 0.76 Tg CH4 yr−1 from wetlands >50∘ N over the period 1980–2000. Poulter et al. (2017) used an ensemble of biogeochemical models constrained with remote sensing surface inundation and inventory-based wetland area data (SWAMPS-GLWD; a previous version of WAD2M used in this study), estimating that the boreal wetland emitted 44 ± 19 Tg CH4 yr−1 in 2012. Using TEM-MDM, but combined with different transient wetland inundation area fraction datasets, Liu et al. (2020) estimated the emissions are 38.90 Tg CH4 yr−1 from the region 45–90∘ N. Our estimates are at the lower end of these records. We attribute this to the change in inundation area data. The larger lake extent in GRWL & HydroLAKES compared to the GSW dataset leads to downward-revised wetland area in WAD2M version 2.0 versus version 1.0. The revision in version 2.0 slightly reduced vegetated wetland extent in the mid-latitudes especially for the region 45–70∘ N, which is the portion with the most methane emissions in our study area. That could explain the gap between our results and the previous ones. In addition, compared to other model simulations that were also involved in the same project (Global Carbon Project wetland CH4; GCP-CH4) where 16 models give an annual average CH4 emission of 28.8 ± 11.8 Tg CH4 yr−1 from northern wetlands >45∘ N in 2000–2020, our simulation result of 21.69 ± 0.59 CH4 Tg yr−1 lies in a reasonable range.
Besides biogeochemistry modeling approaches, atmospheric chemistry transport and inversion models have also been used to constrain the methane emission quantification from pan-Arctic wetlands and lakes. Bruhwiler et al. (2014) developed an assimilation system for atmospheric CH4 and simulated the annual emissions from the wetland over the northern high latitudes (53–90∘ N) of about 23 Tg CH4 yr−1. Tan et al. (2016) used a nested-grid high-resolution inverse model estimating methane emissions from north of 60∘ N in the range of 11.9–28.5 Tg CH4 yr−1, of which wetlands and lakes accounted for 5.5–14.2 and 2.4–14.2 Tg CH4 yr−1, respectively.
Table 4Comparison with previous studies of different methods. The average values are estimated by weighting the area.
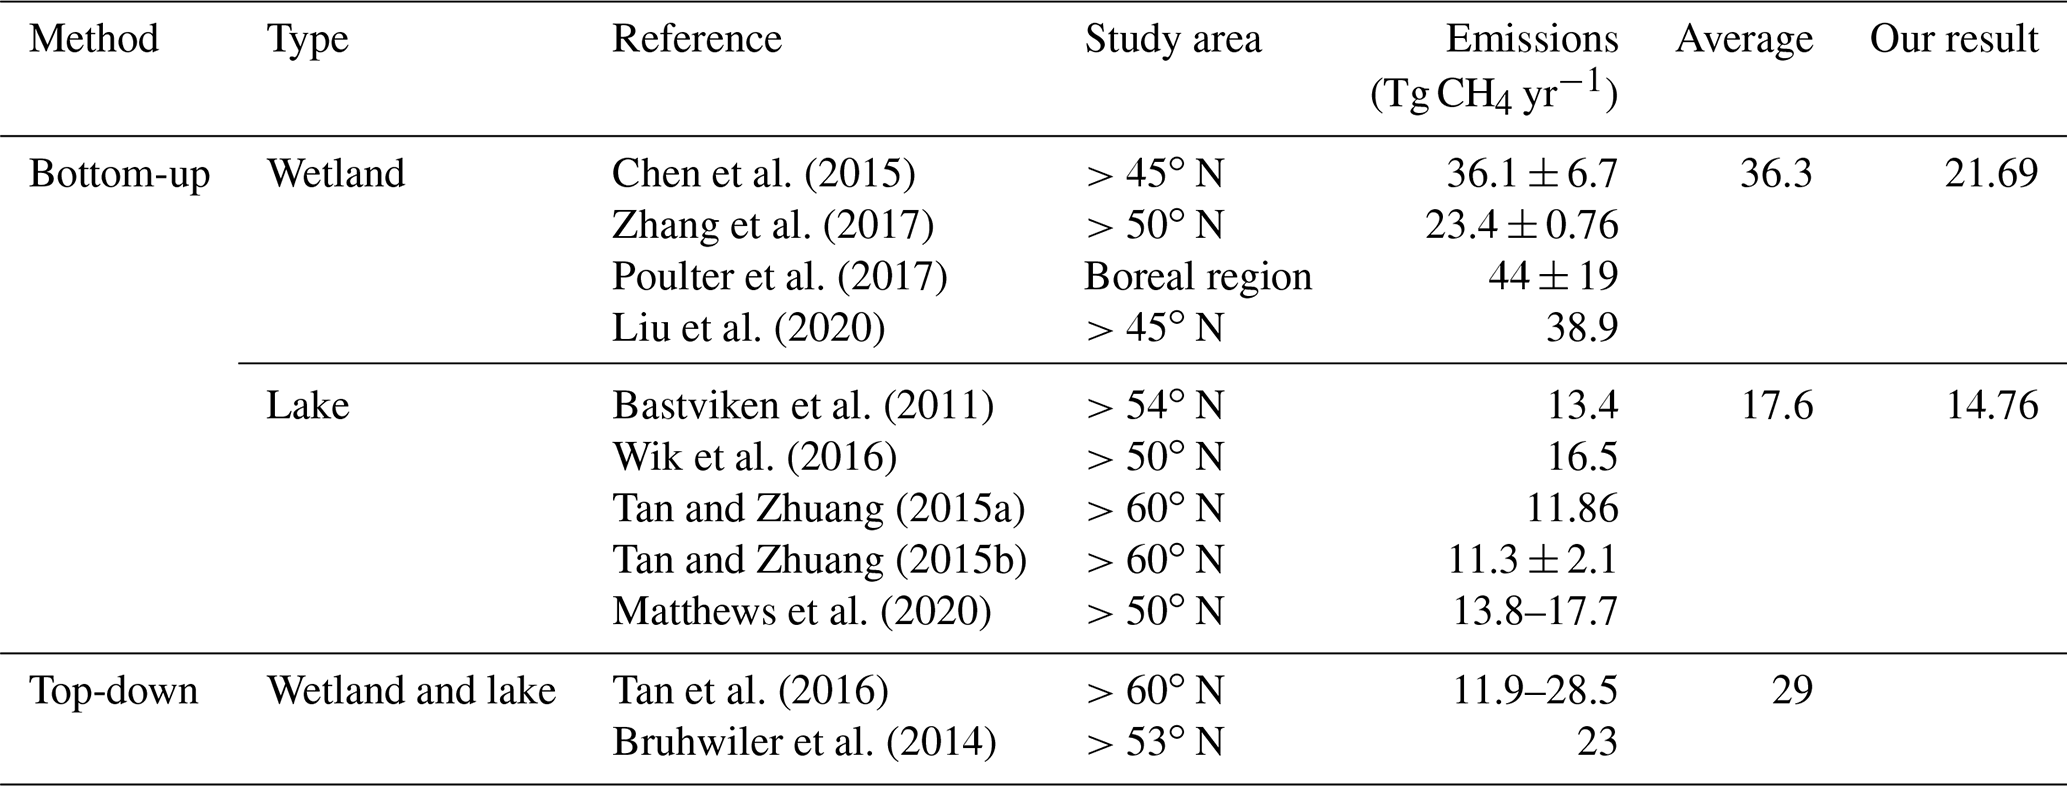
Our simulation shows that methane emissions from inland water systems in the pan-Arctic are 36.46 ± 1.02 Tg CH4 yr−1, which are in the middle of bottom-up estimates of 53.9 Tg CH4 yr−1 and top-down estimates of 29 Tg CH4 yr−1 from previous studies (Table 4). Our bottom-up model estimates are much lower than the previous bottom-up estimates and closer to the previous top-down estimates. We attribute this to using two non-overlap dynamic areal change datasets to minimize the double accounting problem raised by Thornton et al. (2016).
4.2 Climate drivers and sensitivity analysis
Since the climate variables often co-vary over time, some of them could be confounders during the correlation analysis. Thus, the correlation analysis may not reflect the “true” sensitivity of methane fluxes to a single climate variable (Table 2). A partial correlation analysis is then conducted to eliminate the covariate effects between climate drivers for better analyzing correlation between each individual variable and methane emissions. We first noticed that interannual average vapor pressure and temperature have a relatively high correlation (Fig. 3b), with a value of 0.84 and 0.96 (both P values are much less than 0.01) for annual and monthly data, respectively. This is to be expected, since the vapor pressure is greatly affected by temperature and even it is calculated from temperature and relative humidity data. We also found that while the correlation between annual temperature and radiation is not strong (0.40 with a P value over 0.1), the correlation is strong at a monthly time step (0.81 with a P value much less than 0.01): this may explain the relatively high correlation between monthly shortwave radiation and methane emissions. In addition, precipitation is greatly affected by vapor pressure and temperature, and there is a strong correlation between them (0.83 for vapor pressure and 0.77 for temperature). Hence, our partial correlation analysis aims to examine the interannual and seasonal relationship between methane emissions and (1) vapor pressure and shortwave radiation after removing the thermal effect of temperature ( and ), (2) temperature independent of radiation (), and (3) precipitation eliminating the impact of temperature and vapor pressure () (Table 5).
Table 5Partial correlations for shortwave radiation-eliminating temperature (), vapor pressure independent of temperature (), temperature independent of radiation (), and precipitation eliminating temperature and vapor pressure ().
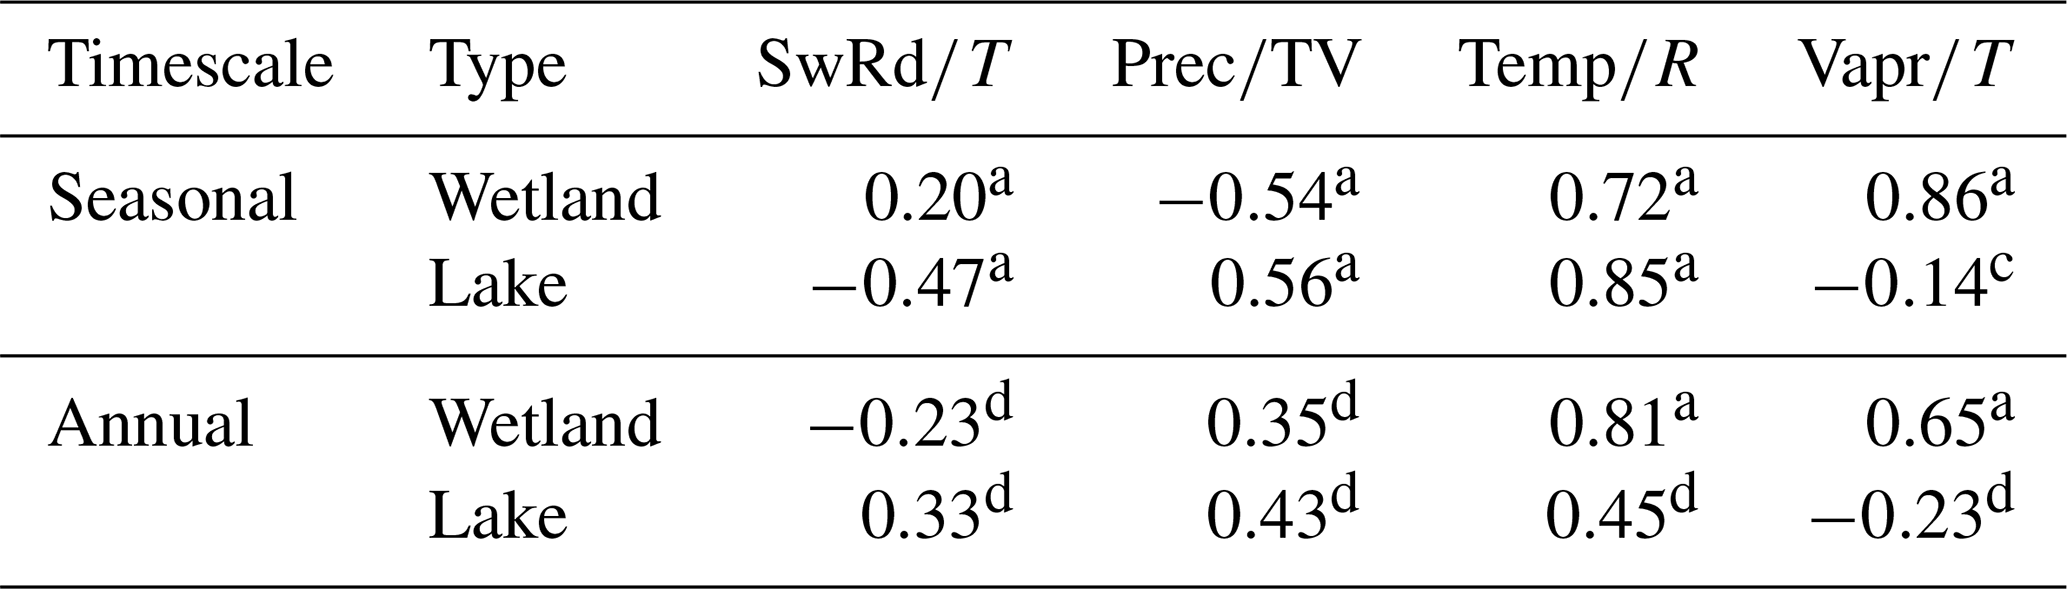
a P value less than 0.01. b P value less than 0.05. c P value less than 0.1. d P value greater than 0.1.
Although temperature and vapor pressure still are the most important drivers to the annual seasonal wetland methane emissions, vapor pressure independent of the thermal effect is no longer the main driver of lake methane emissions. For seasonal wetland emissions, vapor pressure has the highest coefficient and temperature has the second highest one. Consistent with our previous correlation analysis, high vapor pressure may limit the stomatal opening and reduce evapotranspiration, thus increasing soil moisture which could stimulate methane production (Zhuang et al., 2003). Other studies also indicated that the impact of wet–dry cycles on regional methane emissions is evident (e.g., Watts et al., 2014). When it comes to annual trends, temperature tends to have a higher influence on wetland methane emissions, indicating that wetlands are more sensitive to temperature in the long term rather than vapor pressure. For lake emissions, vapor pressure has less impact when eliminating temperature, showing that their high correlation is mostly induced by the thermal effect. In our model, lake methane emission is mainly through two processes: methane ebullition and diffusion (Tan et al., 2015, 2017). High vapor pressure would suppress water methane diffusion, but the influence is relatively small compared to overall emissions. Shortwave radiation with the temperature effect removed has a much smaller effect on seasonal emissions, indicating the high correlation of radiation is caused by the heating effect of radiation and the high sensitivity of temperature in our model. We believe the results of partial correlation analysis capture the relationship between inland water systems' methane emissions and climate drivers.
The sensitivity analysis suggests that a 5 ∘C increase in temperature increases pan-Arctic lake methane emissions by 20 %. Compared to previous studies, Guo et al. (2020) estimated a 40 % lake methane emission increase for the same study area by the end of the 21st century, in the scenario that the temperature increases around 7.5 ∘C. Sepulveda-Jauregui et al. (2018) showed that for sub-Arctic oligotrophic lakes, increasing lake water temperature by 2 ∘C leads to a net increase in CH4 emissions by 47 %–56 %. However, their work did not consider the ice cover season of high-latitude lakes, from which the methane fluxes can be blocked by a thick layer of ice for several months each year and then oxidized in the water column. In addition, the relatively low response of yedoma lakes (∼ 7 %) to the increasing temperature could be explained by the fact that their mobilized labile carbon is usually in deep sediments (Tan and Zhuang, 2015a), which means that the influence of the warming air temperature will take much longer to enhance methane production in the lake sediment. In contrast, when we directly increase the labile carbon density (Clabile) at the water–sediment interface, the methane emission of yedoma lakes increased much higher (∼ 19 %), while the thermokarst lakes were affected less (∼ 20 %) compared to its response to temperature change (∼ 28 %). For precipitation, although it was set in the model to bring the load of allochthonous carbon to the lake (Tan et al., 2017), increasing it by 15 % only makes a negligible impact on methane emission. A plausible explanation is that the lakes are relatively saturated with extraneous carbon in sediments, so any increase brought by the additional precipitation tends to have small influences.
4.3 Uncertainty analysis and future works
Although our simulation results more accurately estimate methane emissions from inland water systems in the pan-Arctic by avoiding the double accounting problem, some uncertainty sources in this study still exist. First, despite the use of two non-overlapping landscape change maps to avoid the uncertainty caused by double accounting, the precision of the two maps remains to be examined. The HydroLAKES database used in the GLCP and WAD2M datasets only contains lakes and reservoirs with an area greater than 0.1 km2 (Messager et al., 2016), which means that lakes and ponds smaller than 0.1 km2 are either not considered or misclassified as wetlands. Those small lakes and ponds cover in total about 1×10⁶ km2 which equals more than half the area of Alaska (Verpoorter et al., 2014). Also, some previous studies have found higher methane fluxes in small and shallow lakes (Holgerson and Raymond, 2016; Sasaki et al., 2016), and lakes appear to emit more methane than wetlands, implying that lake methane emissions may still be underestimated. Secondly, during the simulation, although we classified the lakes based on their sediment type, size, and depth, we still assumed all the same types of lakes to be homogeneous which were assigned to the same set of parameters. Nevertheless, lakes are highly heterogeneous across the globe (Guo et al., 2021), especially for those big lakes, such that regional lake simulation may introduce a high uncertainty.
Furthermore, recent studies have found that groundwater discharge could be an important pathway as lateral CH4 inputs to Arctic lakes that links CH4 production in thawing permafrost to atmospheric emissions via lakes (Olid et al., 2022). Jammet et al. (2015) also confirmed that spring is a crucial period for methane dynamics in sub-Arctic shallow lakes while large methane emissions were observed during the spring thaw. These two important processes were not considered in our process-based ALBM model. Similarly, compared to other model results in GCP-CH4 projects, our TEM-MDM modeled wetland CH4 emissions are relatively low in subzero temperature months, while a field study found that substantial emissions occur during the “zero curtain” period, when subsurface soil temperatures are poised near 0 ∘C (Zona et al., 2016). Therefore, our next step will be modifying the TEM-MDM and ALBM models by taking those important processes into consideration. In addition, higher resolution maps of dynamic wetland inundation and lake landscape changes are highly needed.
By using two dynamic areal change datasets combined with process-based terrestrial and lake biogeochemical models, we are among the first to quantify methane emissions from both land and aquatic inland water systems, i.e., wetlands and freshwater bodies in the pan-Arctic, which avoids the uncertainty caused by area double accounting. Our simulations indicate that the total methane emissions from pan-Arctic inland water system are 36.46 ± 1.02 Tg CH4 yr−1 during 2000–2015, of which wetlands and lakes were 21.69 ± 0.59 Tg yr−1 and 14.76 ± 0.44 Tg yr−1, respectively. Our estimation narrows the difference between previous estimates using bottom-up and top-down methods. In the pan-Arctic, wetland methane emissions are most affected by vapor pressure, followed by temperature, while lake emissions are more sensitive to temperature than to precipitation and landscape areal change. Furthermore, the methane emissions from lakes are more sensitive to annual landscape areal changes than from wetlands. The West Siberia Lowland and the Hudson Bay Lowland were the two strong sources of wetlands, and lakes have higher emissions around the Mackenzie River delta of Canada and the Hudson Bay Lowland area. In addition, lakes emit more methane than wetlands under the same condition. Although the lack of understanding of the underlying methane cycle mechanisms in the lake makes the response of CH4 emissions from Arctic lakes to climate change highly uncertain, our sensitivity test using the process-based ALBM model does indicate that pan-Arctic lake CH4 emissions are more influenced by increasing temperature compared to lake sediment carbon increase.
The data used to reproduce the figures, codes, model, and samples of the running directory can be accessed via the Purdue University Research Repository: https://doi.org/10.4231/SJC1-9F83 (Zhuang and Liu, 2022) and https://doi.org/10.4231/67YG-V518 (Zhuang and Guo, 2023).
QZ designed the study. XL conducted the model simulation and analysis. XL and QZ wrote the paper.
The contact author has declared that neither of the authors has any competing interests.
Publisher's note: Copernicus Publications remains neutral with regard to jurisdictional claims in published maps and institutional affiliations.
This study is supported through a projected funded to Qianlai Zhuang by NASA and a project from the United States Geological Survey. We acknowledge the Rosen High Performance Computing Center at Purdue for computing support. We also acknowledge the World Climate Research Programme's Working Group on Coupled Modeling Intercomparison Project CMIP5, and we thank the climate modeling groups for producing and making available their model output.
This research has been supported by the US Geological Survey (grant no. G17AC00276) and the National Aeronautics and Space Administration (grant no. NNX17AK20G).
This paper was edited by Paul Stoy and reviewed by two anonymous referees.
Allen, G. H. and Pavelsky, T. M.: Global extent of rivers and streams, Science, 361, 585–588, https://doi.org/10.1126/science.aat0636, 2018.
AMAP: AMAP Assessment 2015: Human Health in the Arctic, Arctic Monitoring and Assessment Programme (AMAP), Oslo, Norway, https://doi.org/10.3402/ijch.v75.33949, 2015.
Bastviken, D., Tranvik, L. J., Downing, J. A., Crill, P. M., and Enrich-Prast, A.: Freshwater Methane Emissions Offset the Continental Carbon Sink, Science, 331, 50–50, https://doi.org/10.1126/science.1196808, 2011.
Bruhwiler, L., Dlugokencky, E., Masarie, K., Ishizawa, M., Andrews, A., Miller, J., Sweeney, C., Tans, P., and Worthy, D.: CarbonTracker-CH4: an assimilation system for estimating emissions of atmospheric methane, Atmos. Chem. Phys., 14, 8269–8293, https://doi.org/10.5194/acp-14-8269-2014, 2014.
Chen, L. and Frauenfeld, O. W.: A comprehensive evaluation of precipitation simulations over China based on CMIP5 multimodel ensemble projections, J. Geophys. Res.-Atmos., 119, 5767–5786, https://doi.org/10.1002/2013JD021190, 2014.
Chen, X., Bohn, T. J., and Lettenmaier, D. P.: Model estimates of climate controls on pan-Arctic wetland methane emissions, Biogeosciences, 12, 6259–6277, https://doi.org/10.5194/bg-12-6259-2015, 2015.
Du, Y., Wang, D., Zhu, J., Wang, D., Qi, X., and Cai, J.: Comprehensive assessment of CMIP5 and CMIP6 models in simulating and projecting precipitation over the global land, Int. J. Climatol., 42, 6859–6875, https://doi.org/10.1002/joc.7616, 2022.
Guo, M., Zhuang, Q., Tan, Z., Shurpali, N., Juutinen, S., Kortelainen, P., and Martikainen, P. J.: Rising methane emissions from boreal lakes due to increasing ice-free days, Environ. Res. Lett., 15, 64008, https://doi.org/10.1088/1748-9326/ab8254, 2020.
Guo, M., Zhuang, Q., Yao, H., Golub, M., Leung, L. R., Pierson, D., and Tan, Z.: Validation and Sensitivity Analysis of a 1-D Lake Model Across Global Lakes, J. Geophys. Res.-Atmos., 126, e2020JD033417, https://doi.org/10.1029/2020JD033417, 2021.
Guseva, S., Bleninger, T., Jöhnk, K., Polli, B. A., Tan, Z., Thiery, W., Zhuang, Q., Rusak, J. A., Yao, H., Lorke, A., and Stepanenko, V.: Multimodel simulation of vertical gas transfer in a temperate lake, Hydrol. Earth Syst. Sci., 24, 697–715, https://doi.org/10.5194/hess-24-697-2020, 2020.
Hamdan, L. J. and Wickland, K. P.: Methane emissions from oceans, coasts, and freshwater habitats: New perspectives and feedbacks on climate, Limnol. Oceanogr., 61, S3–S12, https://doi.org/10.1002/lno.10449, 2016.
Holgerson, M. A. and Raymond, P. A.: Large contribution to inland water CO2 and CH4 emissions from very small ponds, Nat. Geosci., 9, 222–226, https://doi.org/10.1038/ngeo2654, 2016.
Hopcroft, P. O., Valdes, P. J., O'Connor, F. M., Kaplan, J. O., and Beerling, D. J.: Understanding the glacial methane cycle, Nat. Commun., 8, 14383, https://doi.org/10.1038/ncomms14383, 2017.
Huang, J., Li, Q., and Song, Z.: Historical global land surface air apparent temperature and its future changes based on CMIP6 projections, Sci. Total Environ., 816, 151656, https://doi.org/10.1016/j.scitotenv.2021.151656, 2022.
IPCC: Summary for Policymakers, in: Climate Change 2021: The Physical Science Basis. Contribution of Working Group I to the Sixth Assessment Report of the Intergovernmental Panel on Climate Change, edited by: Masson-Delmotte, V., Zhai, P., Pirani, A., Connors, S. L., Péan, C., Berger, S., Caud, N., Chen, Y., Goldfarb, L., Gomis, M. I., Huang, M., Leitzell, K., Lonnoy, E., Matthews, J. B. R., Maycock, T. K., Waterfield, T., Yelekçi, O., Yu, R., and Zhou, B., Cambridge University Press, https://doi.org/10.1017/9781009157896.001, 2021.
Jammet, M., Crill, P., Dengel, S., and Friborg, T.: Large methane emissions from a subarctic lake during spring thaw: Mechanisms and landscape significance, J. Geophys. Res.-Biogeo., 120, 2015JG003137, https://doi.org/10.1002/2015JG003137, 2015.
Jens, S., Sebastian, L., Lutz, S., Alexander, N. F., Daniel, F., Duane, G. F., Matthias, F., Frank, G., Mikhail, N. G., Jennifer, W. H., Gustaf, H., Loeka, L. J., Mikhail, Z. J., Alexander, L. K., Viktor, K., Gleb, K., Anatoly, V. S., Elizaveta, R., Yuri, S., Christine, S., Valentin, S., Irina, S., Mathias, U., Sergey, L. V., Alexandra, V., Katey, M. W. A., Sebastian, W., Nikita, S. Z., and Guido, G.: Database of Ice-Rich Yedoma Permafrost Version 2 (IRYP v2), PANGAEA [data set], https://doi.org/10.1594/PANGAEA.940078, 2022.
Jensen, K. and McDonald, K.: Surface Water Microwave Product Series Version 3: A Near-Real Time and 25-Year Historical Global Inundated Area Fraction Time Series From Active and Passive Microwave Remote Sensing, IEEE Geosci. Remote S., 16, 1402–1406, https://doi.org/10.1109/LGRS.2019.2898779, 2019.
Kyzivat, E. D., Smith, L. C., Garcia-Tigreros, F., Huang, C., Wang, C., Langhorst, T., Fayne, J. V. Harlan, M. E., Ishitsuka, Y. Feng, D., Dolan, W., Pitcher, L. H., Wickland, K. P., Dornblaser, M. M., Striegl, R. G., Pavelsky, T. M., Butman, D. E., and Gleason, C. J.: The importance of lake emergent aquatic vegetation for estimating Arctic-boreal methane emissions, J. Geophys. Res.-Biogeo., 127, 2021JG006635, https://doi.org/10.1029/2021JG006635, 2022.
Lange, S., Mengel, M., Treu, S., and Büchner, M.: ISIMIP3a atmospheric climate input data (v1.0), ISIMIP Repository [data set], https://doi.org/10.48364/ISIMIP.982724, 2022.
Li, M., Peng, C., Zhu, Q., Zhou, X., Yang, G., Song, X., and Zhang, K.: The significant contribution of lake depth in regulating global lake diffusive methane emissions, Water Res., 172, 115465, https://doi.org/10.1016/j.watres.2020.115465, 2020.
Liu, L., Zhuang, Q., Oh, Y., Shurpali, N. J., Kim, S., and Poulter, B.: Uncertainty Quantification of Global Net Methane Emissions from Terrestrial Ecosystems Using a Mechanistically Based Biogeochemistry Model, J. Geophys. Res.-Biogeo., 125, e2019JG005428, https://doi.org/10.1029/2019JG005428, 2020.
Matthews, E., Johnson, M. S., Genovese, V., Du, J., and Bastviken, D.: Methane emission from high latitude lakes: methane-centric lake classification and satellite-driven annual cycle of emissions, Sci. Rep., 10, 12465, https://doi.org/10.1038/s41598-020-68246-1, 2020.
McGuire, A. D., Anderson, L. G., Christensen, T. R., Dallimore, S., Guo, L., Hayes, D. J., Heimann, M., Lorenson, T. D., Macdonald, R. W., and Roulet, N.: Sensitivity of the carbon cycle in the Arctic to climate change, Ecol. Monogr., 79, 523–555, 2009.
Melillo, J. M., McGuire, A. D., Kicklighter, D. W., Moore, B., Vorosmarty, C. J., and Schloss, A. L.: Global climate change and terrestrial net primary production, Nature, 363, 234–240, 1993.
Messager, M. L., Lehner, B., Grill, G., Nedeva, I., and Schmitt, O.: Estimating the volume and age of water stored in global lakes using a geo-statistical approach, Nat. Commun., 7, 13603, https://doi.org/10.1038/ncomms13603, 2016.
Meyer, M. F., Labou, S. G., Cramer, A. N., Brousil, M. R., and Luff, B. T.: The global lake area, climate, and population dataset, Sci. Data, 7, 174, https://doi.org/10.1038/s41597-020-0517-4, 2020.
Olefeldt, D., Goswami, S., Grosse, G., Hayes, D. J., Hugelius, G., Kuhry, P., Sannel, B., Schuur, E. A. G., and Turetsky, M. R.: Arctic Circumpolar Distribution and Soil Carbon of Thermokarst Landscapes, ORNL DAAC, Oak Ridge, Tennessee, USA [data set], https://doi.org/10.3334/ORNLDAAC/1332, 2016a.
Olefeldt, D., Goswami, S., Grosse, G., and Hayes, D.: Circumpolar distribution and carbon storage of thermokarst landscapes, Nature, 7, 13043, https://doi.org/10.1038/ncomms13043, 2016b.
Olid, C., Rodellas, V., Rocher-Ros, G., Garcia-Orellana, J., Diego-Feliu, M., Alorda-Kleinglass, A., Bastviken D., and Karlsson, J.: Groundwater discharge as a driver of methane emissions from Arctic lakes, Nat. Commun., 13, 3667, https://doi.org/10.1038/s41467-022-31219-1, 2022.
Pekel, J.-F., Cottam, A., Gorelick, N., and Belward, A. S.: High-resolution mapping of global surface water and its long-term changes, Nature, 540, 418–422, https://doi.org/10.1038/nature20584, 2016.
Phelps, A. R., Peterson, K. M., and Jeffries, M. O.: Methane efflux from high-latitude lakes during spring ice melt, J. Geophys. Res.-Atmos., 103, 29029–29036, 1998.
Poulter, B., Bousquet, P., Canadell, J. G., Ciais, P., Peregon, A., Marielle Saunois, Arora, V. K., Beerling, D. J., Brovkin, V., Jones, C. D., Joos, F., Nicola Gedney, Ito, A., Kleinen, T., Koven, C. D., McDonald, K., Melton, J. R., Peng, C., Shushi Peng, Prigent, C., Schroeder, R., Riley, W. J., Saito, M., Spahni, R., Tian, H., Lyla Taylor, Viovy, N., Wilton, D., Wiltshire, A., Xu, X., Zhang, B., Zhang, Z., and Zhu, Q.: Global wetland contribution to 2000–2012 atmospheric methane growth rate dynamics, Environ. Res. Lett., 12, 094013, https://doi.org/10.1088/1748-9326/aa8391, 2017.
Quiquet, A., Archibald, A. T., Friend, A. D., Chappellaz, J., Levine, J. G., Stone, E. J., Telford, P. J., and Pyle, J. A.: The relative importance of methane sources and sinks over the Last Interglacial period and into the last glaciation, Quaternary Sci. Rev., 112, 1–16, 2015.
Sasaki, M., Kim, Y.-W., Uchida, M., and Utsumi, M.: Diffusive summer methane flux from lakes to the atmosphere in the Alaskan arctic zone, Polar Sci., 10, 303–311, 2016.
Saunois, M., Stavert, A. R., Poulter, B., Bousquet, P., Canadell, J. G., Jackson, R. B., Raymond, P. A., Dlugokencky, E. J., Houweling, S., Patra, P. K., Ciais, P., Arora, V. K., Bastviken, D., Bergamaschi, P., Blake, D. R., Brailsford, G., Bruhwiler, L., Carlson, K. M., Carrol, M., Castaldi, S., Chandra, N., Crevoisier, C., Crill, P. M., Covey, K., Curry, C. L., Etiope, G., Frankenberg, C., Gedney, N., Hegglin, M. I., Höglund-Isaksson, L., Hugelius, G., Ishizawa, M., Ito, A., Janssens-Maenhout, G., Jensen, K. M., Joos, F., Kleinen, T., Krummel, P. B., Langenfelds, R. L., Laruelle, G. G., Liu, L., Machida, T., Maksyutov, S., McDonald, K. C., McNorton, J., Miller, P. A., Melton, J. R., Morino, I., Müller, J., Murguia-Flores, F., Naik, V., Niwa, Y., Noce, S., O'Doherty, S., Parker, R. J., Peng, C., Peng, S., Peters, G. P., Prigent, C., Prinn, R., Ramonet, M., Regnier, P., Riley, W. J., Rosentreter, J. A., Segers, A., Simpson, I. J., Shi, H., Smith, S. J., Steele, L. P., Thornton, B. F., Tian, H., Tohjima, Y., Tubiello, F. N., Tsuruta, A., Viovy, N., Voulgarakis, A., Weber, T. S., van Weele, M., van der Werf, G. R., Weiss, R. F., Worthy, D., Wunch, D., Yin, Y., Yoshida, Y., Zhang, W., Zhang, Z., Zhao, Y., Zheng, B., Zhu, Q., Zhu, Q., and Zhuang, Q.: The Global Methane Budget 2000–2017, Earth Syst. Sci. Data, 12, 1561–1623, https://doi.org/10.5194/essd-12-1561-2020, 2020.
Sepulveda-Jauregui, A., Hoyos-Santillan, J., Martinez-Cruz, K., Walter Anthony, K. M., Casper, P., Belmonte-Izquierdo, Y., and Thalasso, F.: Eutrophication exacerbates the impact of climate warming on lake methane emission, Sci. Total Environ., 636, 411–419, https://doi.org/10.1016/j.scitotenv.2018.04.283, 2018.
Tan, Z. and Zhuang, Q.: Arctic lakes are continuous methane sources to the atmosphere under warming conditions, Environ. Res. Lett., 10, 054016, https://doi.org/10.1088/1748-9326/10/5/054016, 2015a.
Tan, Z. and Zhuang, Q.: Methane emissions from pan-Arctic lakes during the 21st century: An analysis with process-based models of lake evolution and biogeochemistry, J. Geophys. Res.-Biogeo., 120, 2641–2653, https://doi.org/10.1002/2015JG003184, 2015b.
Tan, Z., Zhuang, Q., and Walter Anthony, K. M.: Modeling methane emissions from arctic lakes: model development and site-level study, J. Adv. Model. Earth Sy., 7, 459–483, https://doi.org/10.1002/2014MS000344, 2015.
Tan, Z., Zhuang, Q., Henze, D. K., Frankenberg, C., Dlugokencky, E., Sweeney, C., Turner, A. J., Sasakawa, M., and Machida, T.: Inverse modeling of pan-Arctic methane emissions at high spatial resolution: what can we learn from assimilating satellite retrievals and using different process-based wetland and lake biogeochemical models?, Atmos. Chem. Phys., 16, 12649–12666, https://doi.org/10.5194/acp-16-12649-2016, 2016.
Tan, Z., Zhuang, Q., Shurpali, N. J., Marushchak, M. E., Biasi, C., Eugster, W., and Walter Anthony, K.: Modeling CO2 emissions from Arctic lakes: Model development and site-level study, J. Adv. Model. Earth Sys., 9, 2190–2213, https://doi.org/10.1002/2017MS001028, 2017.
Tan, Z., Yao, H., and Zhuang, Q.: A Small Temperate Lake in the 21st Century: Dynamics of Water Temperature, Ice Phenology, Dissolved Oxygen, and Chlorophyll a, Water Resour. Res., 54, 4681–4699, 2018.
Thornton, B. F., Wik, M., and Crill, P. M.: Double-counting challenges the accuracy of high-latitude methane inventories, Geophys. Res. Lett., 43, 12569–12577, https://doi.org/10.1002/2016GL071772, 2016.
Verpoorter, C., Kutser, T., Seekell, D. A., and Tranvik, L. J.: A global inventory of lakes based on high-resolution satellite imagery, Geophys. Res. Lett., 41, 6396–6402, https://doi.org/10.1002/2014GL060641, 2014.
Walter, B. P. and Heimann, M.: A process-based, climate-sensitive model to derive methane emissions from natural wetlands: Application to five wetland sites, sensitivity to model parameters, and climate, Global Biogeochem. Cy., 14, 745–765, https://doi.org/10.1029/1999GB001204, 2000.
Watts, J. D., Kimball, J. S., Bartsch, A., and McDonald, K. C.: Surface water inundation in the boreal-Arctic: potential impacts on regional methane emissions, Environ. Res. Lett., 9, 075001, https://doi.org/10.1088/1748-9326/9/7/075001, 2014.
West, W. E., Creamer, K. P., and Jones, S. E.: Productivity and depth regulate lake contributions to atmospheric methane: Lake productivity fuels methane emissions, Limnol. Oceanogr., 61, S51–S61, https://doi.org/10.1002/lno.10247, 2016.
Wik, M., Varner, R. K., Anthony, K. W., MacIntyre, S., and Bastviken, D.: Climate-sensitive northern lakes and ponds are critical components of methane release, Nat. Geosci., 9, 99–105, https://doi.org/10.1038/ngeo2578, 2016.
Zhang, Z., Zimmermann, N. E., Stenke, A., Li, X., Hodson, E. L., Zhu, G., Huang, C., and Poulter, B.: Emerging role of wetland methane emissions in driving 21st century climate change, P. Natl. Acad. Sci. USA, 14, 9647–9652, https://doi.org/10.1073/pnas.1618765114, 2017.
Zhang, Z., Fluet-Chouinard, E., Jensen, K., McDonald, K., Hugelius, G., Gumbricht, T., Carroll, M., Prigent, C., Bartsch, A., and Poulter, B.: Development of the global dataset of Wetland Area and Dynamics for Methane Modeling (WAD2M), Earth Syst. Sci. Data, 13, 2001–2023, https://doi.org/10.5194/essd-13-2001-2021, 2021.
Zhang, Z., Poulter, B., Melton, J. R., Riley, W. J., Beerling, D. J., Ciais, P., Gedney, N., Gustafson, A., Hopcroft, P. O., Ito, A., and Jain, A. K.: Global Methane Budget 2000–2020: Wetland model synthesis, in: Fall Meeting 2022, December 2022, Chicago, AGU, https://agu.confex.com/agu/fm22/meetingapp.cgi/Paper/1179170 (last access: 23 March 2023), 2022.
Zhuang, Q. and Guo, M.: A process-based biogeochemistry model and analysis for current and future global lake methane emissions, Purdue University Research Repository [code], https://doi.org/10.4231/67YG-V518, 2023.
Zhuang, Q. and Liu, X.: Methane emissions from Arctic landscapes during 2000-2015: An analysis with land and lake biogeochemistry models, Purdue University Research Repository [data set], https://doi.org/10.4231/SJC1-9F83, 2022.
Zhuang, Q., Romanovsky, V. E., and McGuire, A. D.: Incorporation of a permafrost model into a large-scale ecosystem model: Evaluation of temporal and spatial scaling issues in simulating soil thermal dynamics, J. Geophys. Res.-Atmos., 106, 33649–33670, 2001.
Zhuang, Q., McGuire, A. D., O'Neill, K. P., Harden, J. W., Romanovsky, V. E., and Yarie, J.: Modeling soil thermal and carbon dynamics of a fire chronosequence in interior Alaska, J. Geophys. Res.-Atmos., 108, 8147, https://doi.org/10.1029/2001JD001244, 2002.
Zhuang, Q., McGuire, A. D., Melillo, J. M., Clein, J. S., Dargaville, R. J., Kicklighter, D. W., Myneni, R. B., Dong, J., Romanovsky, V. E., Harden, J., and Hobbie, J. E.: Carbon cycling in extratropical terrestrial ecosystems of the Northern Hemisphere during the 20th century: a modeling analysis of the influences of soil thermal dynamics, Tellus B, 55, 751–776, 2003.
Zhuang, Q., Melillo, J. M., Kicklighter, D. W., Prinn, R. G., McGuire, A. D., Steudler, P. A., Felzer, B. S., and Hu, S.: Methane fluxes between terrestrial ecosystems and the atmosphere at northern high latitudes during the past century: A retrospective analysis with a process-based biogeochemistry model, Global Biogeochem. Cy., 18, GB3010, https://doi.org/10.1029/2004GB002239, 2004.
Zhuang, Q., Melillo, J. M., McGuire, A. D., Kicklighter, D. W., Prinn, R. G., Steudler, P. A., Felzer, B. S., and Hu, S.: Net emissions of CH4 and CO2 in Alaska: Implications for the region's greenhouse gas budget, Ecol. Appl., 17, 203–212, 2007.
Zhuang, Q., Chen, M., Xu, K., Tang, J., Saikawa, E., Lu, Y., Melillo, J. M., Prinn, R. G., and McGuire, A. D.: Response of global soil consumption of atmospheric methane to changes in atmospheric climate and nitrogen deposition, Global Biogeochem. Cy., 27, 650–663, https://doi.org/10.1002/gbc.20057, 2013.
Zona, D., Gioli, B., Commane, R., Lindaas, J., Wofsy, S. C., Miller, C. E., Dinardo, S. J., Dengel, S., Sweeney, C., Karion, A., Chang, R. Y.-W., Henderson, J. M., Murphy, P. C., Goodrich, J. P., Moreaux, V., Liljedahl, A., Watts, J. D., Kimball, J. S., Lipson, D. A., and Oechel, W. C.: Cold season emissions dominate the Arctic tundra methane budget, P. Natl. Acad. Sci. USA, 113, 40–45, https://doi.org/10.1073/pnas.1516017113, 2016.