the Creative Commons Attribution 4.0 License.
the Creative Commons Attribution 4.0 License.
 | 05 Apr 2023
Reallocation of elemental content and macromolecules in the coccolithophore Emiliania huxleyi to acclimate to climate change
Yong Zhang
Shuai Ma
Hanbing Chen
Jiabing Li
Zhengke Li
Kui Xu
Ruiping Huang
Hong Zhang
Yonghe Han
Global climate change leads to simultaneous changes in multiple environmental drivers in the marine realm. Although physiological characterization of coccolithophores has been studied under climate change, there is limited knowledge on the biochemical responses of this biogeochemically important phytoplankton group to changing multiple environmental drivers. Here, we investigate the interactive effects of reduced phosphorus availability (4 to 0.4 µmol L−1), elevated pCO2 concentrations (426 to 946 µatm), and increasing light intensity (40 to 300 µmol photons m−2 s−1) on elemental content and macromolecules of the cosmopolitan coccolithophore Emiliania huxleyi. Reduced phosphorus availability reduces particulate organic nitrogen (PON) and protein contents per cell under 40 µmol photons m−2 s−1 but not under 300 µmol photons m−2 s−1. Reduced phosphorus availability and elevated pCO2 concentrations act synergistically to increase particulate organic carbon (POC) and carbohydrate contents per cell under 300 µmol photons m−2 s−1 but not under 40 µmol photons m−2 s−1. Reduced phosphorus availability, elevated pCO2 concentrations, and increasing light intensity act synergistically to increase the allocation of POC to carbohydrates. Under elevated pCO2 concentrations and increasing light intensity, enhanced carbon fixation could increase carbon storage in the phosphorus-limited regions of the oceans where E. huxleyi dominates the phytoplankton assemblages. In each type of light intensity, elemental-carbon-to-phosphorus (C:P) and nitrogen-to-phosphorus (N:P) ratios decrease with increasing growth rate. These results suggest that coccolithophores could reallocate chemical elements and energy to synthesize macromolecules efficiently, which allows them to regulate their elemental content and growth rate to acclimate to changing environmental conditions.
- Article
(1535 KB) - Full-text XML
-
Supplement
(1044 KB) - BibTeX
- EndNote


The continuous increase in atmospheric CO2 levels, as a consequence of anthropogenic activities, leads to global and ocean warming, which in turn shoals the ocean upper mixed layer (UML), hinders upward transport of nutrients from deeper oceans to the UML, and increases light exposure to phytoplankton cells dwelling therein (Steinacher et al., 2010; Wang et al., 2015). The dissolution of CO2 in the oceans is causing a significant chemical shift toward higher CO2 and proton ([H+]) concentrations, a process defined as ocean acidification (OA; Caldeira and Wickett, 2003). Environmental changes in the UML will expose phytoplankton cells to physiological stress, and understanding the effects of changing multiple environmental drivers on the physiology and biochemistry of marine phytoplankton is important for projections of changes in the biogeochemical roles of phytoplankton in the future ocean (Gao et al., 2019).
Coccolithophores take up carbon dioxide (CO2) to produce particulate organic carbon (POC) via photosynthesis and use bicarbonate (HCO and calcium (Ca2+) to synthesize calcium carbonate plates (coccoliths, particulate inorganic carbon (PIC)) and release CO2 via calcification; they also play a critical role in the marine carbon cycle (Rost and Riebesell, 2004). The cosmopolitan coccolithophore Emiliania huxleyi typically forms extensive blooms that are easily detected by satellite remote sensing due to high light (HL) scattering caused by coccoliths (Terrats et al., 2020; He et al., 2022). Within E. huxleyi blooms in polar and subpolar oceans, dissolved nitrate and phosphate concentrations in surface seawater could be as low as 0.95 and 0.16 µmol L−1, respectively (Townsend et al., 1994); light intensity is higher than 300 µmol photons m−2 s−1 (Tyrrell and Merico, 2004); and the mean concentrations of seawater CO2 increased by 21.0 %–43.3 % which weakens the oceanic CO2 uptake from the atmosphere (Kondrik et al., 2018). Emiliania huxleyi is also the dominant phytoplankton species in the lower photic zone in the north-eastern Caribbean Sea (western Atlantic Ocean) (Jordan and Winter, 2000) and in the South Pacific Gyre where dissolved nitrate and phosphate concentrations are about 1.0 and 0.2 µmol L−1, respectively, and light intensity is lower than 20 µmol photons m−2 s−1 (Beaufort et al., 2008; Perrin et al., 2016). In the future ocean, numerous environmental factors will simultaneously change, and the extent of these changes may increase (Gao et al., 2019). To explore how E. huxleyi acclimates to simultaneous changes in macronutrient concentration, light intensity, and CO2 level, it is interesting to investigate their physiological and biochemical processes, which can also help to project the effect of coccolithophores on the ocean carbon cycle and ecological systems.
For more than a decade, research has shown that E. huxleyi cells developed several strategies to acclimate to reduced phosphorus availability, increasing light intensity, and ocean acidification (Leonardos and Geider, 2005; McKew et al., 2015; Wang et al., 2022). Interactive effects of phosphorus availability and light intensity have shown that under phosphorus-limited conditions, cells increased expression and the activity of alkaline phosphatase, and took up and used phosphorus efficiently under high light (HL) intensity, whereas they lowered the phosphorus uptake rate under low light (LL) intensity (Riegman et al., 2000; Perrin et al., 2016). In addition, the positive effect of reduced phosphorus availability on cellular POC and PIC contents of E. huxleyi was further enhanced by increasing light intensity due to high light-induced increases in CO2 and HCO uptake rates under low phosphate availability (Leonardos and Geider, 2005). The negative effect of reduced phosphorus availability on cellular particulate organic phosphorus (POP) content was partly compensated by the increased PO uptake rate under increasing light intensity (Perrin et al., 2016). On the other hand, several studies report that ocean acidification and reduced phosphorus availability acted synergistically to increase the cellular POC content, especially at high light intensity, and acted antagonistically to affect the cellular PIC content of E. huxleyi (Leonardos and Geider, 2005; Matthiessen et al., 2012; Zhang et al., 2020). In addition, ocean acidification normally amplified the positive effect of increasing light intensity on cellular POC content (Rokitta and Rost, 2012; Heidenreich et al., 2019). Due to the high proton-concentration-induced reduction in the HCO uptake rate, ocean acidification could weaken or counteract the positive effect of increasing light intensity on cellular PIC content (Rokitta and Rost, 2012; Kottmeier et al., 2016). Overall, while recent studies have focused on the physiological performance of E. huxleyi and their effects on marine biogeochemical cycling of carbon, little information is available about the biochemical response of E. huxleyi to reduced phosphorus availability, increasing light intensity, and ocean acidification.
The objective of this study is to investigate the combined effects of reduced phosphorus availability, increasing light intensity, and ocean acidification on cellular elemental contents, the carbon (C) : nitrogen (N) : phosphorus (P) ratio, and macromolecules of E. huxleyi and to analyse the effects of macromolecules on elemental contents. Under reduced phosphorus availability, increasing light intensity, and ocean acidification, we hypothesize that increased cellular POC content is more likely to be caused by increased carbohydrate content. In addition, we discuss the potential mechanisms for changing cellular PIC content in response to changed levels of phosphate, light, and CO2, which is important for projections of changes in coccolithophore biogeochemistry and ecology in the future ocean.
2.1 Experimental setup
The Emiliania huxleyi strain RCC1266 (morphotype A) was originally isolated from shelf waters around Ireland (49∘30′ N, 10∘30′ W) in 2007 and obtained from the Roscoff algal culture collection (Fig. S1 in the Supplement). Emiliania huxleyi was cultured under a 14 h : 10 h light : dark cycle (light period: 06:00 to 20:00 CST, China standard time) in a thermo-controlled incubator (MGC-400H, Shanghai Yiheng Scientific Instrument) at 20 ∘C in semicontinuous cultures. The artificial seawater (ASW) medium was prepared according to Berges et al. (2001) with a salinity of 33 psu, a boron concentration of 372 µmol L−1, the addition of 2350 µmol L−1 bicarbonate to achieve the total alkalinity (TA) of 2350 µmol L−1, and enrichment with 64 µmol L−1 NO, concentrations for trace metals and vitamins (Guillard and Ryther, 1962). The experiment was conducted in two parts (Fig. S2). The first part (Part 1) was performed at 40 µmol photons m−2 s−1 (low light intensity, LL), and the second one (Part 2) was at 300 µmol photons m−2 s−1 (high light intensity, HL). The LL intensity used here corresponds to the lower end of the irradiance range of the UML, and the HL intensity represents the irradiance in the surface ocean (Jin et al., 2016; Perrin et al., 2016). For each part of the experiment, dissolved inorganic phosphorus (DIP) concentration and ocean acidification were combined in a fully factorial design: high DIP concentration (4 µmol L−1) + low CO2 level (426 µatm, current CO2 level) (HP + LC, treatment 1 in LL and treatment 5 in HL), high DIP concentration (4 µmol L−1) + high CO2 level (946 µatm, future CO2 level) (HP + HC, treatment 2 in LL and treatment 6 in HL), low DIP concentration (0.43 µmol L−1) + low CO2 level (426 µatm) (LP + LC, treatment 3 in LL and treatment 7 in HL), and low DIP concentration (0.43 µmol L−1) + high CO2 level (946 µatm) (LP + HC, treatment 4 in LL and treatment 8 in HL). High DIP concentration is replete for the physical process of E. huxleyi, and at the end of the incubation, low DIP concentration limits the growth of E. huxleyi (see below). There were eight treatments in total and four biological replicates for each treatment (Fig. S2). In all cases, cell densities were lower than 78 000 cells mL−1, and the cells were acclimated to each treatment for at least eight generations before physiological and biochemical parameters were measured.
At LL intensity (Part 1), for the treatments of HP + LC and HP + HC, the ASW media were enriched with 4 µmol L−1 PO and aerated for 24 h at 20 ∘C with filter-sterilized (PTFE filter, 0.22 µm pore size, Nantong) air pumped from the room. The pHTotal (total scale) values of the media under both HP + LC and HP + HC treatments were about 8.04. The dry air was humidified with Milli-Q water prior to the aeration to minimize evaporation. Under the HP + HC treatment, the pHTotal values of the media were adjusted to 7.74 by stepwise additions of CO2-saturated seawater. For the treatments of LP + LC and LP + HC, the ASW media were enriched with 0.4 µmol L−1 PO and aerated for 24 h at 20 ∘C with filtered room air. Under the LP + HC treatment, the pHTotal values of the media were also adjusted to 7.74 as described above. The HP + LC, HP + HC, LP + LC and LP + HC seawater was then filtered (0.22 µm pore size, Polycap 75 AS, Whatman) and carefully pumped into autoclaved 50 mL (for TA measurements), 600 mL (for pre-experimental cultures), and 2350 mL (for experimental cultures) polycarbonate bottles (Nalgene) with no headspace to minimize gas exchange. The cells were inoculated to achieve an initial density of 5000 cells mL−1 in the HP + LC and HP + HC conditions, respectively, and cultured for 2 d then diluted to the initial density again. These processes were performed three times in 600 mL bottles for pre-experimental cultures at 40 µmol photons m−2 s−1 (LL) of photosynthetically active radiation (PAR; measured using a LI-190SA quantum sensor, Beijing Ligaotai Technology Co. Ltd.). In the main experimental cultures, the cells were transferred from 600 to 2350 mL bottles at the same time and cultured for another 2 d (Fig. S2b). Culture bottles were rotated 10 times until cells were mixed at 09:00, 13:00, and 19:00 CST. On the second day of the main experimental cultures, subsamples were taken for measurements of cell densities; pHTotal; TA; cellular contents of total particulate carbon (TPC); particulate organic carbon (POC), nitrogen (PON), and phosphorus (POP); carbohydrate; and protein. At the end of the cultures under the previous conditions, cell samples with an initial density of 5000 cells mL−1 were transferred from the HP + LC condition (treatment 1) to the LP + LC condition (treatment 3) and from the HP + HC condition (treatment 2) to the LP + HC condition (treatment 4) at LL intensity. The cells were acclimated to the LP + LC and LP + HC conditions for eight generations before subsamples were taken for measurements, which allows cells to have enough time periods to change growth rate against the low DIP concentration.
At HL intensity (Part 2), samples grown under the HP + LC and HP + HC conditions were transferred from 40 (LL) to 300 µmol photons m−2 s−1 (HL) of PAR with an initial cell density of 5000 cells mL−1. The cells were cultured under the HP + LC and HP + HC conditions for 2 d, respectively, and then diluted back to the initial cell density. These processes were performed three times in 600 mL bottles at HL intensity, and then the main experimental cultures were conducted in 2350 mL bottles. On the second day of the incubation, subsamples were taken for measurements of the parameters. After that, cell samples with an initial density of 5000 cells mL−1 were transferred from the HP + LC condition (treatment 5) to the LP + LC condition (treatment 7), and from the HP + HC condition (treatment 6) to the LP + HC condition (treatment 8). At HL intensity, cell samples were acclimated for at least eight generations in LP + LC and LP + HC conditions, respectively, before subsamples were taken for measurements.
2.2 Phosphate concentration and carbonate chemistry measurements
In the beginning and on the second day of the incubations, samples for determinations of phosphate concentration (20 mL), pHTotal value (20 mL), and total alkalinity (TA) (50 mL) were respectively filtered (PTFE filter, 0.22 µm pore size, Nantong) 7 h after the onset of the light period (at 13:00 CST). The dissolved inorganic phosphorus (DIP) concentration was measured using a spectrophotometer (SP-722, Shanghai Spectrum Instruments) following the phosphomolybdate method (Hansen and Koroleff, 1999). The bottle for pH measurement was filled from bottom to top with overflow and closed without a headspace. The pHTotal value was measured immediately at 20 ∘C using a pH meter which was corrected with a standard buffer of defined pH in seawater (Dickson, 1993). The TA samples were treated with a 10 µL saturated HgCl2 solution and stored in the dark at 4.0 ∘C, and TA was measured at 20 ∘C by potentiometric titration (AS-ALK1+, Apollo SciTech) according to Dickson et al. (2007). Carbonate chemistry parameters were estimated from TA and pHTotal using the CO2SYS program of Pierrot et al. (2006) with carbonic acid constants, K1 and K2, taken from Roy et al. (1993).
2.3 Cell density and elemental content measurements
Cell densities were monitored daily at 13:30 with 20 mL samples, and fresh media with the same DIP concentration and carbonate chemistry as in the initial treatment conditions were added as top-up. Cell densities were determined using a Multisizer™ 3 Coulter Counter (Beckman Coulter). Growth rates were calculated for each replicate according to the equation: , where N1 and N0 refer to the cell densities on the second day and in the beginning of the main experiment, respectively, and d is the growth period in days.
After mixing, samples for determinations of TPC (300 mL), POC and PON (300 mL), and POP (300 mL) were obtained by filtering them onto the GF/F filters (precombusted at 450 ∘C for 6 h) at the same time (14:00 CST) in each treatment. For POC and PON measurements, samples were fumed with HCl for 12 h to remove inorganic carbon. Samples of TPC, POC, and PON were dried at 60 ∘C for 12 h and analysed using an Elementar CHNS analyser (Vario EL cube, GmbH, Germany). Cellular particulate inorganic carbon (PIC) content was calculated as the difference between cellular TPC and POC contents (Fabry and Balch, 2010). To remove dissolved inorganic phosphorus from the GF/F filters, POP samples were rinsed three times with 0.17 mol L−1 Na2SO4. After that, 2 mL 0.017 mol L−1 MgSO4 solution was added onto filters, and POP samples were dried at 90 ∘C for 12 h and then combusted at 500 ∘C for 6 h to remove POC and digested by 0.2 mol L−1 HCl (Solórzano and Sharp, 1980). Phosphorus concentration was measured using a microplate reader (Thermo Fisher) following the ammonium molybdate method (Chen et al., 1956) using adenosine-5'-triphosphate disodium trihydrate as a standard.
2.4 Protein and carbohydrate measurements
Samples for determinations of protein (600 mL) and carbohydrate (600 mL) were respectively filtered onto polycarbonate filters (0.6 µm pore size, Nuclepore, Whatman) and onto precombusted GF/F filters at 14:30. Protein samples were extracted by bead milling (FastPrep Lysing Matrix D) in a 0.5 mL protein extraction buffer (lithium dodecyl sulfate, ethylene diamine tetraacetic acid, Tris, glycerol, and 4-(2-aminoethyl) benzenesulfonyl fluoride hydrochloride). Bead milling was performed four times for 1 min at 6.5 m s−1, and samples were placed on ice for 2 min between each round of bead milling to prevent degradation. The samples were then centrifuged at 10 000×g for 5 min (Centrifuge 5418 R, Eppendorf, Germany), and extracted protein in the supernatant was quantified using the BCA assay with bovine gamma globulin as a standard using a microplate reader (Ni et al., 2016). Carbohydrate samples were hydrolyzed with 12.00 mol L−1 H2SO4 in the dark for 1 h and diluted by Milli-Q water to a final H2SO4 concentration of 1.20 mol L−1. Then, samples were sonicated for 5 min, vortexed for 30 s, and boiled at 90 ∘C for 3 h (Pakulski and Benner, 1992). The extracted carbohydrate was determined by a phenol sulfuric reaction with D-glucose as standard (Masuko et al., 2005).
2.5 Data analysis
The percentages of carbon in carbohydrate and protein are 40 % and 53 %, respectively, and the percentage of nitrogen in protein is 16 % (Geider and LaRoche, 2002). A three-way analysis of variance (ANOVA) was used to determine the main effects of the DIP concentration, light intensity, and CO2 level, as well as their interactions on each variable. A Tukey post hoc test was performed to identify significant differences between two DIP concentrations, two light intensities, and two CO2 levels. A Shapiro–Wilk test was conducted to analyse the normality of residuals, and a Levene test was conducted graphically to test for homogeneity of variances. The significant difference between treatments was set at p<0.05. All data analyses were conducted using the statistical software R with the packages carData, lattice, and nlme (R version 3.5.0).
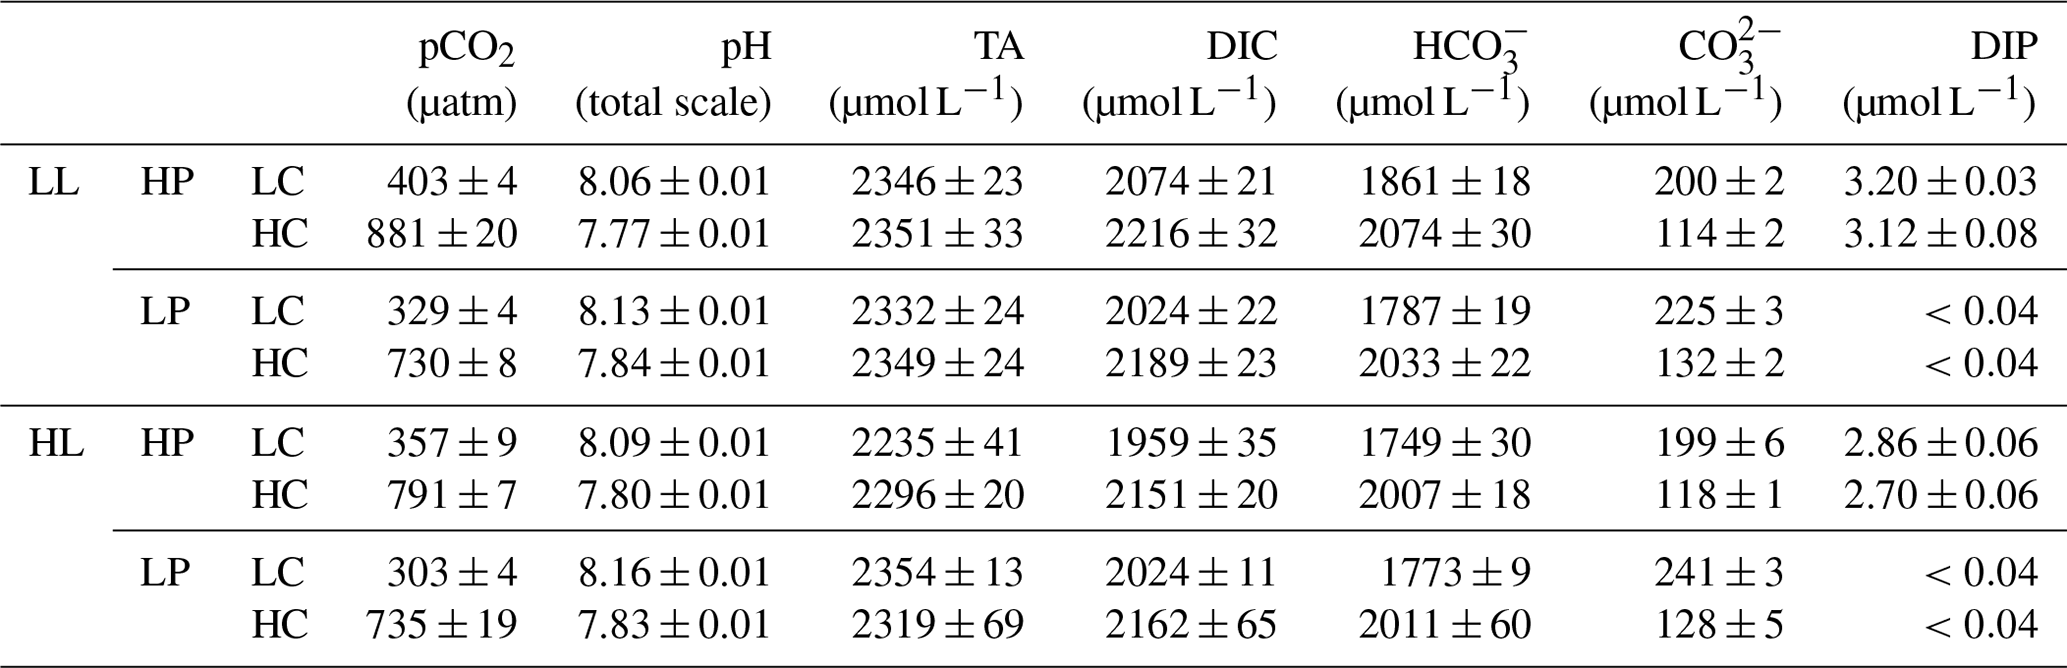
Table 1Carbonate chemistry parameters and dissolved inorganic phosphorus (DIP) concentration at the end of the incubation. The values are means ± standard deviation (SD) of four replicates. Respectively, LL and HL represent 40 and 300 µmol photons m−2 s−1 of photosynthetically active radiation (PAR), and HP and LP represent 4 and 0.43 µmol L−1 PO at the beginning of the incubations.
3.1 Dissolved inorganic phosphorus concentration and carbonate chemistry parameters
During the incubations, organismal activity significantly reduces dissolved inorganic phosphorus (DIP) concentrations (Table 1). Under high phosphorus (HP) treatment, DIP concentrations decrease by 20.32 % in low light (LL) and low CO2 (LC), by 22.32 % in LL and high CO2 (HC), by 27.66 % in high light (HL) and LC, and by 31.58 % in HL and HC. Under low phosphorus (LP) treatment, DIP concentrations decrease from 0.43 µmol L−1 at the beginning of the experiment to be lower than 0.04 µmol L−1 (the detection limit) at the end of the incubation in LL and LC conditions, in LL and HC conditions, in HL and LC conditions, and in HL and HC conditions.
During the incubations, at LL intensity, pHT values increase, on average, by 0.02 in HP + LC, by 0.03 in HP + HC, by 0.09 in LP + LC, and by 0.10 in LP + HC conditions (Table 1). At HL intensity, pHT values increase by 0.05 in HP + LC, by 0.06 in HP + HC, by 0.12 in LP + LC, and by 0.09 in LP + HC conditions. Correspondingly, at LL intensity, seawater CO2 concentrations decrease by 5.53 % in HP + LC, by 6.89 % in HP + HC, by 22.76 % in LP + LC, and by 22.77 % in LP + HC. At HL intensity, seawater CO2 concentrations decrease by 16.18 % in HP + LC, by 16.41 % in HP + HC, by 28.92 % in LP + LC, and by 22.30 % in LP + HC. Overall, organismal activity has larger effects on carbonate chemistry under the LP treatment than under the HP treatment.
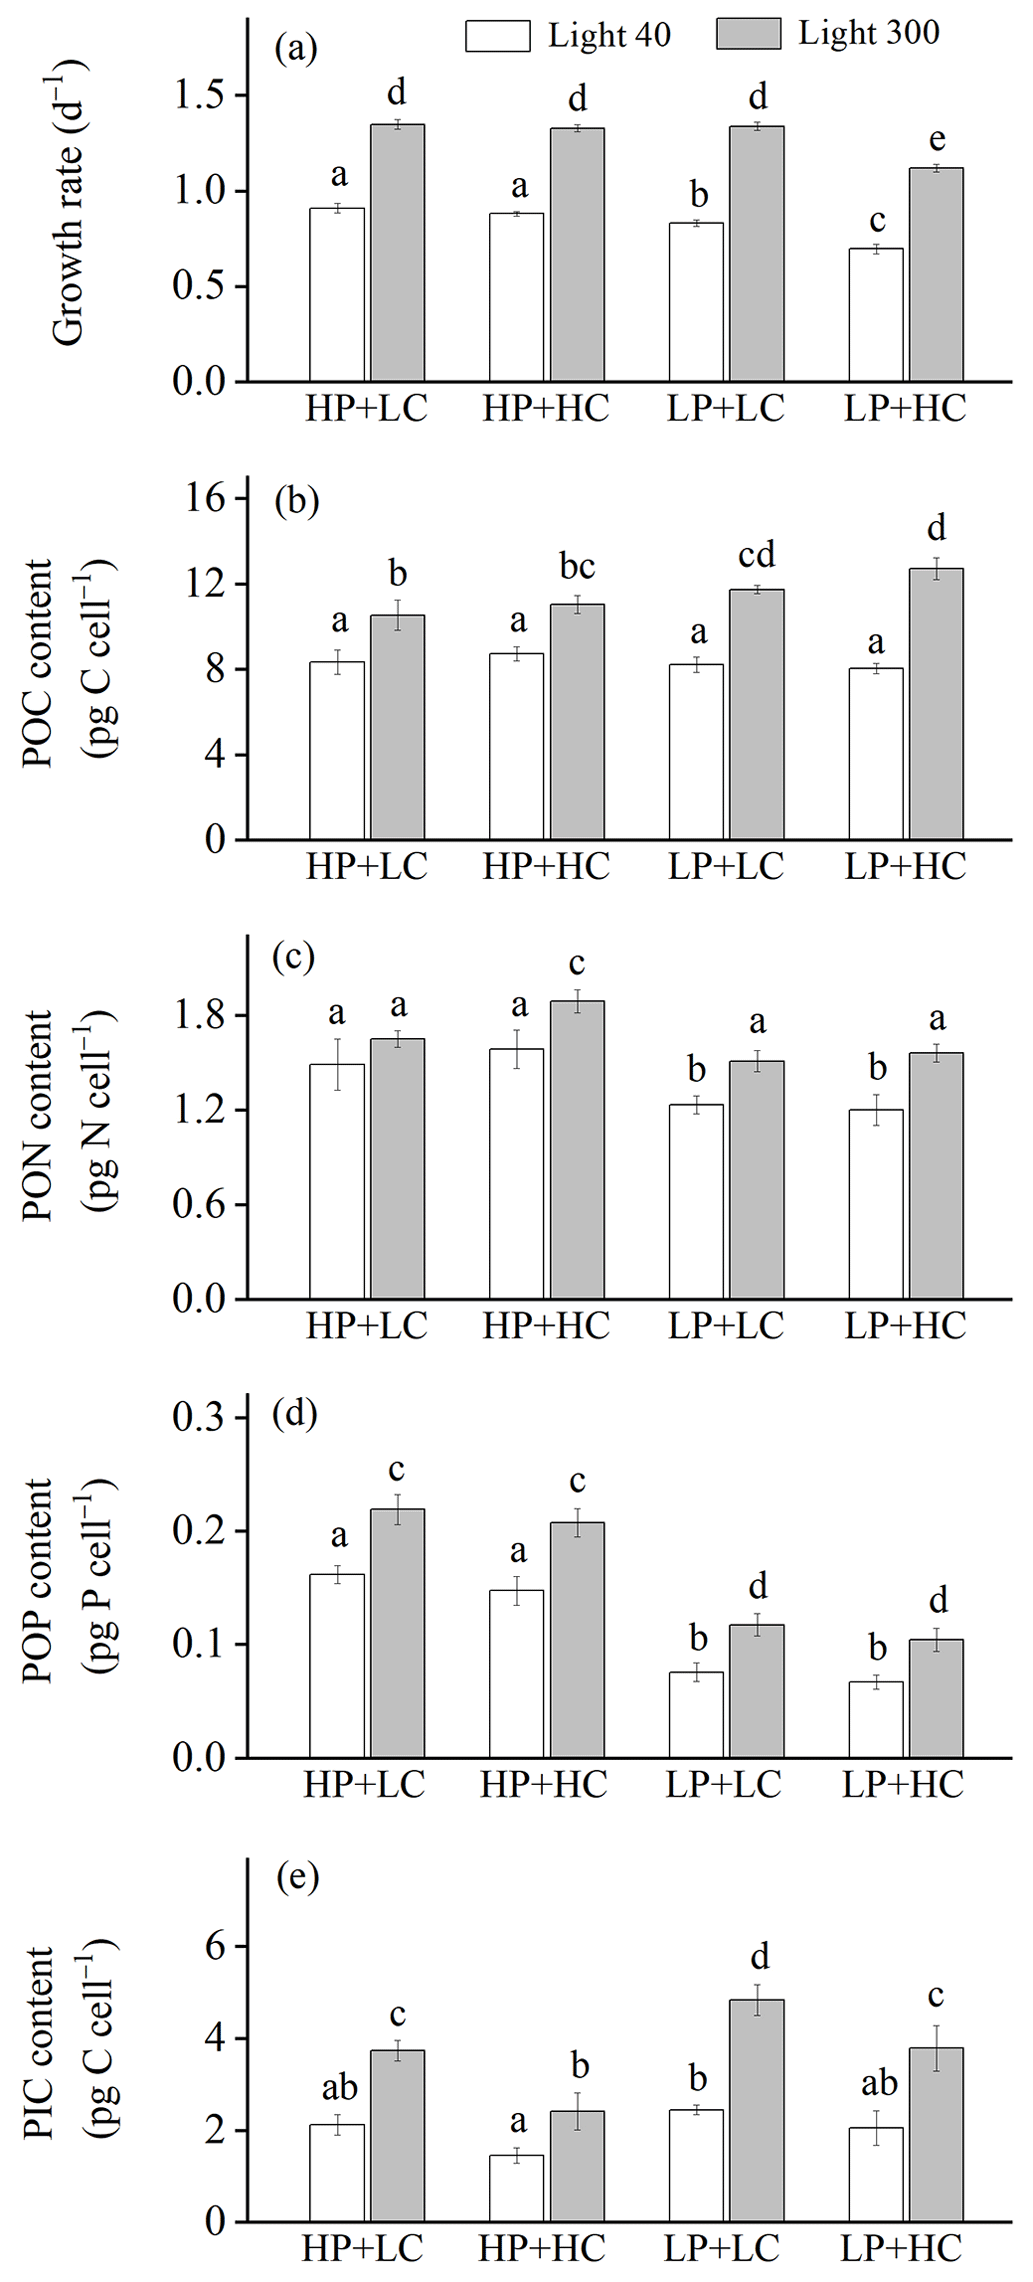
Figure 1Growth rate (a), cellular contents of particulate organic carbon (POC, b), nitrogen (PON, c), phosphorus (POP, d), and particulate inorganic carbon (PIC, e) of Emiliania huxleyi RCC1266 in the treatments of high phosphorus availability and low CO2 level (HP + LC), high phosphorus availability and high CO2 level (HP + HC), low phosphorus availability and low CO2 level (LP + LC), and low phosphorus availability and high CO2 level (LP + HC) under low light (empty, 40 µmol photons m−2 s−1) and high light (filled, 300 µmol photons m−2 s−1) intensities. Different letters represent significant differences in each parameter between treatments (p<0.05). The data represent the means and standard deviation of four independent cultures.
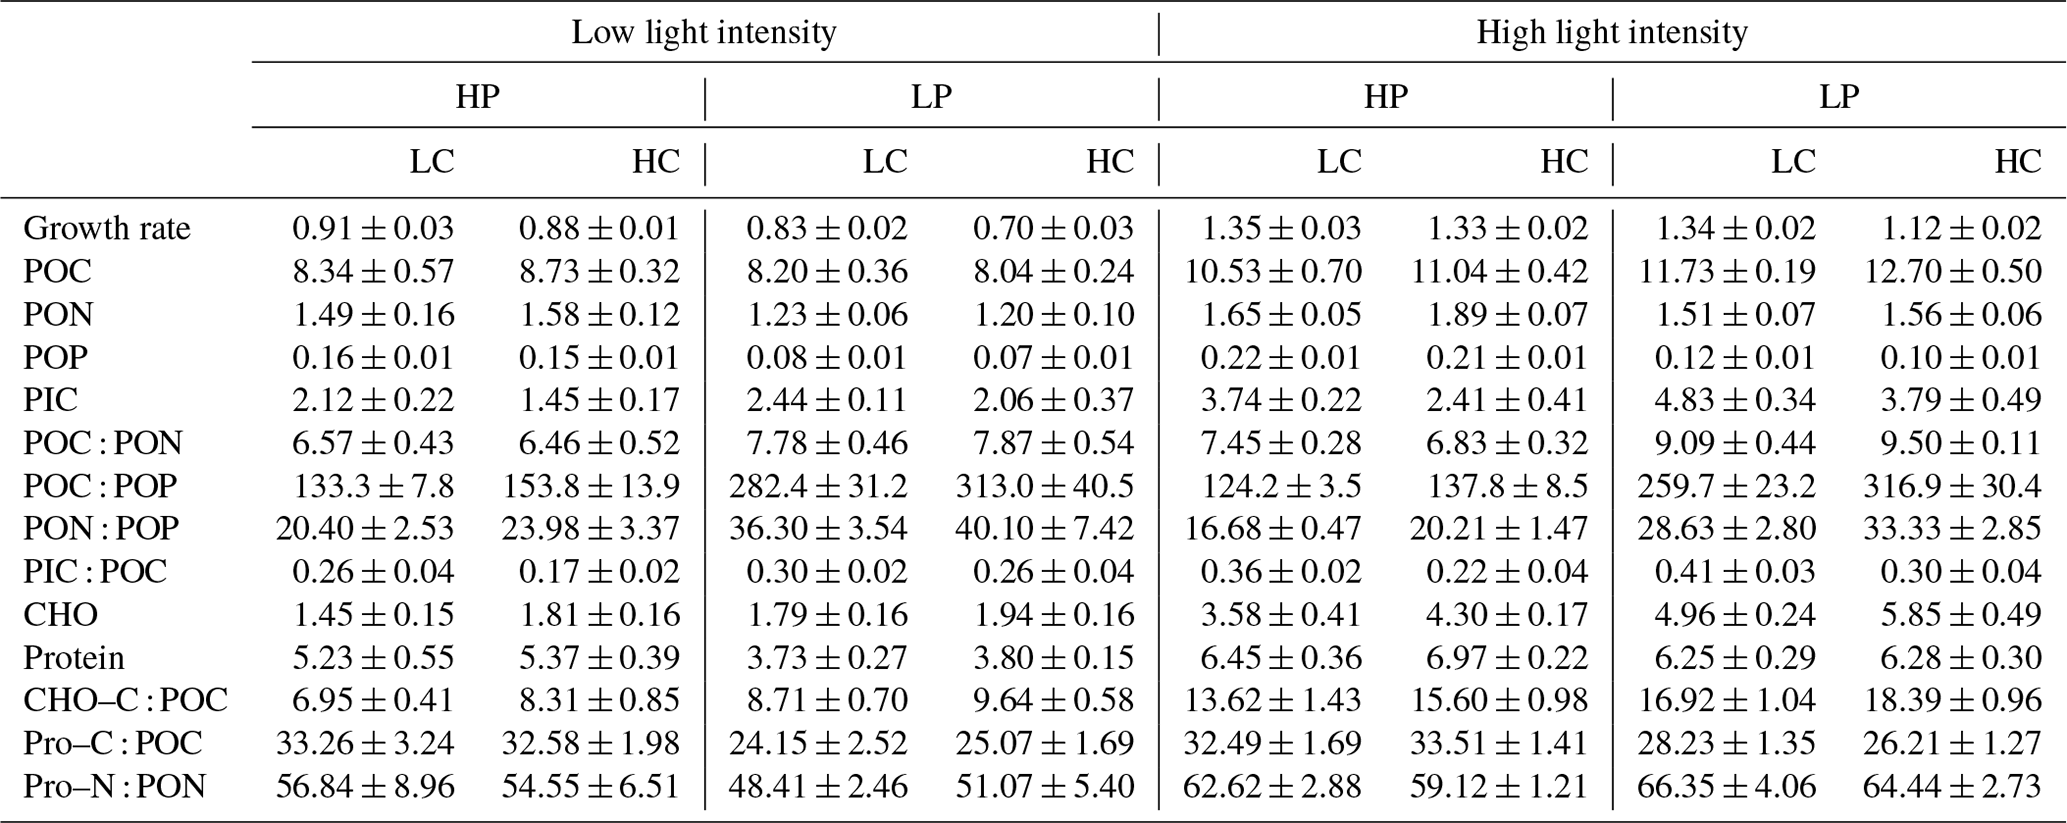
Table 2Growth rate (d−1); cellular contents of POC, PON, POP, PIC, carbohydrate (CHO), and protein (Pro) (pg cell−1); the ratios of POC : PON, POC : POP, PON : POP, and PIC : POC; the percentages of POC allocated to carbohydrate (CHO–C : POC) and protein (Pro–C : POC); and the percentage of PON allocated to protein (Pro–N : PON) (%). LC and HC represent low CO2 (426 µatm) and high CO2 (946 µatm) levels, respectively. Please see Table 1 for more detailed information.
3.2 Growth rate
The effect of increasing light intensity on growth rate is positive, which can be seen by comparing growth rate in the HL regimes with their paired LL regimes (Fig. 1a; Table 2), though the extent of the increase in growth rate depends on CO2 levels and phosphate availability. Compared to the LL intensity, growth rates at HL intensity increased by 48.48 % in HP + LC, by 50.87 % in HP + HC, by 60.86 % in LP + LC, and by 60.80 % in LP + HC (Tukey post hoc test, all values of p<0.01). The effect of increasing CO2 levels on the growth rate depends on light intensity and phosphate availability (Fig. 1a). Compared to the LC level, growth rates in the HC level decreased by 3.08 % in the LL and HP condition (p=0.48), by 16.13 % in the LL and LP condition (p<0.01), by 1.50 % in the HL and HP condition (p=0.68), and by 16.27 % in the HL and LP condition (p<0.01). The effect of reduced phosphorus availability on the growth rate is negative, and the extent of the reduction in growth rate depends on light intensity and CO2 levels (Fig. 1a). Compared to the HP availability, growth rates in LP availability decreased by 8.46 % in the LL and LC condition (p<0.01), by 20.81 % in the LL and HC condition (p<0.01), and by 15.63 % in HL and HC condition (p<0.01); they did not change significantly in the HL and LC condition (p=0.99). These results show that high CO2 levels and low phosphorus availability acted synergistically to reduce the growth rate of E. huxleyi, and increasing light intensity could partly counteract this response (Table S1 in the Supplement).
3.3 Cellular POC, PON, POP, and PIC contents
The effect of increasing light intensity on cellular POC content is positive, which was observed by comparing POC content in all the HL regimes with their paired LL regimes (Fig. 1b). The extent of the increase in POC content depends on CO2 levels and phosphate availability. Compared to the LL intensity, cellular POC contents at HL intensity increased by 27.15 % in HP + LC, by 26.51 % in HP + HC, by 43.24 % in LP + LC, and by 58.13 % in LP + HC conditions (Tukey post hoc test, all values of p<0.01). The effect of increasing CO2 levels on POC content is light- and phosphate-dependent; it can be seen by comparing POC content in the HC regimes with their paired LC regimes (Fig. 1b). At LL intensity, cellular POC contents are not significantly different between HP + LC, HP + HC, LP + LC, and LP + HC conditions (all values of p>0.1). At HL intensity, compared to LC level, cellular POC contents in the HC level increased by 5.12 % in the HP condition (p=0.74) and by 8.28 % in the LP condition (p=0.07). The effect of phosphate reduction on POC content is light- and CO2-dependent, which can be seen by comparing POC content in the LP regimes with that in their paired HP regimes (Fig. 1b). At LL intensity, cellular POC contents did not significantly differ between LP and HP availability. At HL intensity, compared to HP availability, cellular POC contents in LP availability increased by 11.80 % in the LC condition (p=0.02) and by 15.28 % in the HC condition (p<0.01). These results show that ocean acidification and reduced phosphorus availability acted synergistically to increase POC contents in the HL condition but not in the LL condition (Table S1).
The effect of increasing light intensity on cellular PON content depends on CO2 levels and phosphate availability (Fig. 1c). Compared to the LL intensity, cellular PON contents at HL intensity increased by 12.03 % in the HP + LC condition (p=0.27), by 19.54 % in the HP + HC condition (p<0.01), by 22.68 % in the LP + LC condition (p<0.01), and by 30.90 % in the LP + HC condition (p<0.01). The effect of increasing CO2 levels on PON content is light- and phosphate-dependent, which can be seen by comparing POC content in the HC regimes with their paired LC regimes (Fig. 1c). Compared to the LC level, cellular PON contents in the HC level did not change significantly in the LL + HP, LL + LP, and HL + LP conditions but increased by 14.68 % in the HL + HP condition (p=0.02). The effect of phosphate reduction on PON content is CO2- and light-dependent, which can be seen by comparing PON content in the LP regimes with that in their paired HP regimes (Fig. 1c). Compared to the HP availability, cellular PON contents in LP availability decreased by 16.59 % in the LL and LC condition (p=0.01), by 24.03 % in the LL + HC condition (p<0.01), by 8.35 % in the HL + LC condition (p=0.43), and by 17.32 % in the HL + HC condition (p<0.01). These results show that increasing light intensity compensated for the negative effect of phosphate reduction on PON content (Table S1).
The effect of increasing light intensity on POP content is positive and can be seen by comparing POP content in the HL regimes with their paired LL regimes, though the extent of the increase in POP content depends on CO2 levels and phosphate availability (Fig. 1d). Compared to the LL intensity, cellular POP contents at HL intensity increased by 35.79 % in HP + LC, by 41.70 % in HP + HC, by 57.22 % in LP + LC, and by 56.44 % in LP + HC conditions (Tukey post hoc test, all values of p<0.01). Ocean acidification did not change the POP contents significantly under all treatments used here (all values of p>0.53) (Fig. 1d). Reduced phosphorus availability significantly decreased the POP contents, which can be seen by comparing POP content in the LP regimes with their paired HP regimes, though the extent of the reduction in POP content depends on light intensity and CO2 levels (Fig. 1d). Compared to the HP availability, cellular POP contents in LP availability decreased by 52.96 % in the LL and LC condition, by 54.03 % in the LL + HC condition, by 46.11 % in the HL + LC condition, and by 49.51 % in the HL + HC condition (all values of p<0.01). These results show that reduced phosphorus availability had a larger effect on POP content than that of ocean acidification and increasing light intensity (Table S1).
The effect of increasing light intensity on PIC content is positive, which can be seen by comparing PIC content in the HL regimes with their paired LL regimes, though the extent of increase in PIC content depends on CO2 levels and phosphorus availability (Fig. 1e). Compared to the LL intensity, cellular PIC contents at HL intensity increased by 77.87 % in HP + LC, by 70.28 % in HP + HC, by 98.31 % in LP + LC, and by 90.68 % in LP + HC conditions (Tukey post hoc test, all values of p<0.01). The effect of increasing CO2 levels on PIC content is negative and can be seen by comparing PIC content in the HC regimes with those in their paired LC regimes (Fig. 1e). The extent of the reduction in PIC content depends on light intensity and phosphorus availability. Compared to the LC level, cellular PIC contents under ocean acidification decreased by 31.43 % in the LL and HP condition (p=0.09), by 16.00 % in the LL and LP condition (p=0.67), by 35.02 % in the HL and HP condition (p<0.01), and by 21.12 % in the HL and LP condition (p<0.01). The effect of phosphate reduction on PIC content is positive, which can be seen by comparing PIC content in the LP regimes with their paired HP regimes, though the extent of the increase in PIC content depends on light intensity and CO2 levels (Fig. 1e). Compared to the HP availability, cellular PIC contents in LP availability increased by 16.00 % in the LL and LC condition (p=0.83), by 41.26 % in the LL and HC condition (p=0.16), by 29.98 % in the HL and LC condition (p<0.01), and by 60.44 % in the HL and HC condition (p<0.01). These results show that high light intensity and low phosphorus availability acted synergistically to increase the PIC content, which counteracts the negative effect of ocean acidification on PIC content (Table S1).
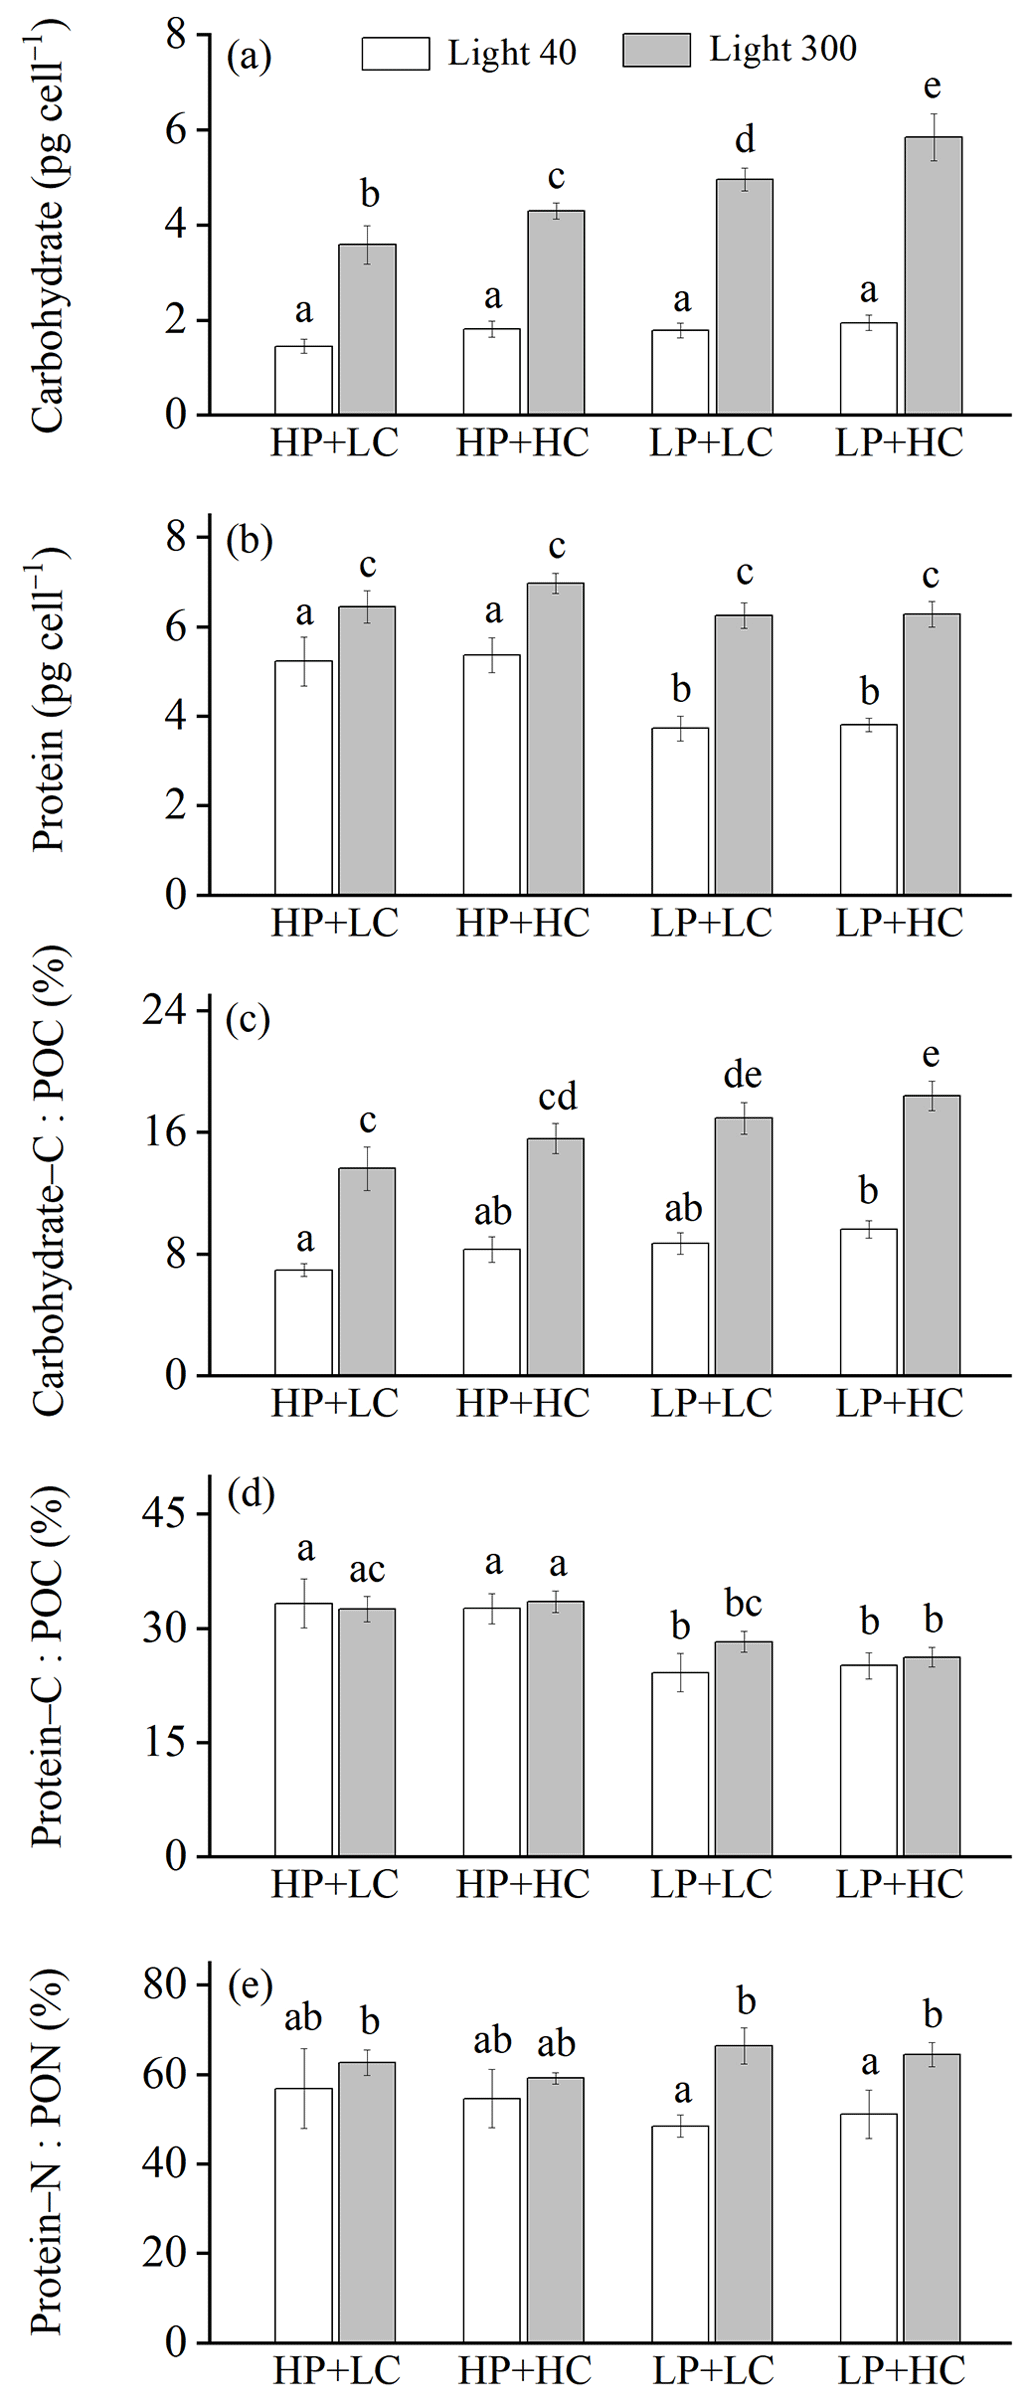
Figure 2Cellular contents of carbohydrate (a) and protein (b); the percentages of POC allocated to carbohydrate (c) and protein (d); and the percentage of PON allocated to protein (e) of E. huxleyi RCC1266 in the treatments of high phosphorus availability and low CO2 level (HP + LC), high phosphorus availability and high CO2 level (HP + HC), low phosphorus availability and low CO2 level (LP + LC), and low phosphorus availability and high CO2 level (LP + HC) under low light (empty) and high light (filled) intensities. Different letters represent significant differences in each parameter between treatments (p<0.05). The data represent the means and standard deviation of four independent cultures.
3.4 Carbohydrate and protein contents
The effect of increasing light intensity on carbohydrate content is positive and can be seen by comparing carbohydrate content in the HL regimes with their paired LL regimes, though the extent of the increase in carbohydrate depends on CO2 levels and phosphorus availability (Fig. 2a). Compared to the LL intensity, cellular carbohydrate contents at HL intensity increased by 148.81 % in the HP + LC condition, by 139.42 % in the HP + HC condition, by 179.12 % in the LP + LC condition, and by 204.42 % in the LP + HC condition (all values of p<0.01). The effect of increasing CO2 levels on carbohydrate content is light- and phosphate-dependent, which can be seen by comparing carbohydrate content in the HC regimes with their paired LC regimes (Fig. 2a). Compared to the LC level, cellular carbohydrate contents under ocean acidification did not change significantly under the LL condition and increased by 21.32 % in the HL and HP condition (p=0.02) and by 18.45 % in the HL and LP condition (p<0.01). The effect of phosphate reduction on carbohydrate content is light- and CO2-dependent and can be seen by comparing carbohydrate content in the LP regimes with their paired HP regimes (Fig. 2a). Compared to the HP availability, cellular carbohydrate contents in the LP availability did not change significantly in the LL and LC and LL and HC conditions (both p>0.65) but increased by 40.13 % in the HL and LC condition (p<0.01) and by 36.00 % in the HL and HC condition (p<0.01). These results show that increasing light intensity dominantly increased carbohydrate content, and ocean acidification and reduced phosphorus availability acted synergistically to increase carbohydrate contents under high light intensity (Table S1).
The effect of increasing light intensity on cellular protein content is positive, which can be seen by comparing protein content in the HL regimes with their paired LL regimes, though the extent of the increase in protein content depends on CO2 level and phosphorus availability (Fig. 2b). Compared to the LL intensity, cellular protein contents at the HL intensity increased by 24.76 % in the HP + LC condition, by 30.43 % in the HP + HC condition, by 68.09 % in the LP + LC condition, and by 65.39 % in the LP + HC condition (all values of p<0.01). The effect of increasing CO2 levels on protein content can be seen by comparing protein content in the HC regimes with their paired LC regimes (Fig. 2b). Compared to the LC level, cellular protein contents under ocean acidification did not change significantly in the LL and HP condition, in the LL and LP condition, in the HL and HP condition, and in the HL and LP condition (all values of p>0.09). The effect of phosphate reduction on protein content is light- and CO2-dependent, which can be seen by comparing protein content in the LP regimes with their paired HP regimes (Fig. 2b). Compared to the HP availability, cellular protein content in the LP availability decreased by 27.88 % in the LL and LC condition and by 28.80 % in the LL and HC condition (both p<0.01) but did not change significantly in the HL and LC condition and in the HL and HC condition (both p>0.11). These results show that high light intensity counteracted the negative effect of low phosphorus availability on protein content, and ocean acidification had less of an effect on protein content (Table S1).
3.5 Percentage of POC allocated to carbohydrate (carbohydrate–C : POC) and protein (protein–C : POC)
Increasing light intensity increased the percentage of POC allocated to carbohydrate (carbohydrate–C : POC), which can be seen by comparing carbohydrate–C : POC in the HL regimes with their paired LL regimes, though the extent of increase in carbohydrate–C : POC depends on CO2 levels and phosphorus availability (Fig. 2c). Compared to the LL intensity, carbohydrate–C : POC at the HL intensity increased by 95.60 % in the HP + LC condition, by 97.69 % in the HP + HC condition, by 95.05 % in the LP + LC condition, and by 83.37 % in the LP + HC condition (all values of p<0.01). The effect of increasing CO2 levels on carbohydrate–C : POC is light- and phosphate-dependent and can be seen by comparing carbohydrate–C : POC in the HC regimes with their paired LC regimes (Fig. 2c). Compared to the LC level, carbohydrate–C : POC under ocean acidification increased by 20.12 % in the LL and HP condition, by 11.42 % in the LL and LP condition, by 20.36 % in the HL and HP condition, and by 4.40 % in the HL and LP condition (all values of p>0.08). The effect of phosphate reduction on carbohydrate–C : POC is light- and CO2-dependent, which can be seen by comparing carbohydrate–C : POC in the LP regimes with that in their paired HP regimes (Fig. 2c). Compared to the HP availability, carbohydrate–C : POC in LP availability increased by 25.61 % in the LL and LC condition (p=0.16), by 17.37 % in the LL and HC condition (p=0.47), by 25.81 % in the HL and LC condition (p<0.01), and by 8.11 % in the HL and HC condition (p<0.05). These results show that increasing light intensity, ocean acidification, and reduced phosphorus availability acted synergistically to increase the percentage of POC allocated to carbohydrate (Table S1).
Increasing the light intensity did not significantly change the percentage of the POC allocated to protein (protein–C : POC) under the phosphorus availability and CO2 levels used here (Fig. 2d). Ocean acidification did not significantly affect the protein–C : POC in the LL and HP, LL and LP, HL and HP, and HL and LP conditions. The effect of phosphate reduction on protein–C : POC is light- and CO2-dependent, which can be seen by comparing the protein–C : POC in the LP regimes with their paired HP regimes (Fig. 2d). Compared to the HP availability, protein–C : POC in LP availability decreased by 27.39 % in the LL and LC condition (p<0.01), by 23.05 % in the LL and HC condition (p<0.01), by 12.81 % in the HL and LC condition (p=0.09), and by 21.77 % in the HL and HC condition (p<0.01). These results show that reduced phosphorus availability dominantly reduced the protein–C : POC, and the increasing light intensity and ocean acidification had less of an effect on protein–C : POC (Table S1). On the other hand, increasing light intensity, reduced phosphorus availability, and ocean acidification did not significantly change the percentage of PON allocated to protein (protein–N : PON) (Fig. 2e).
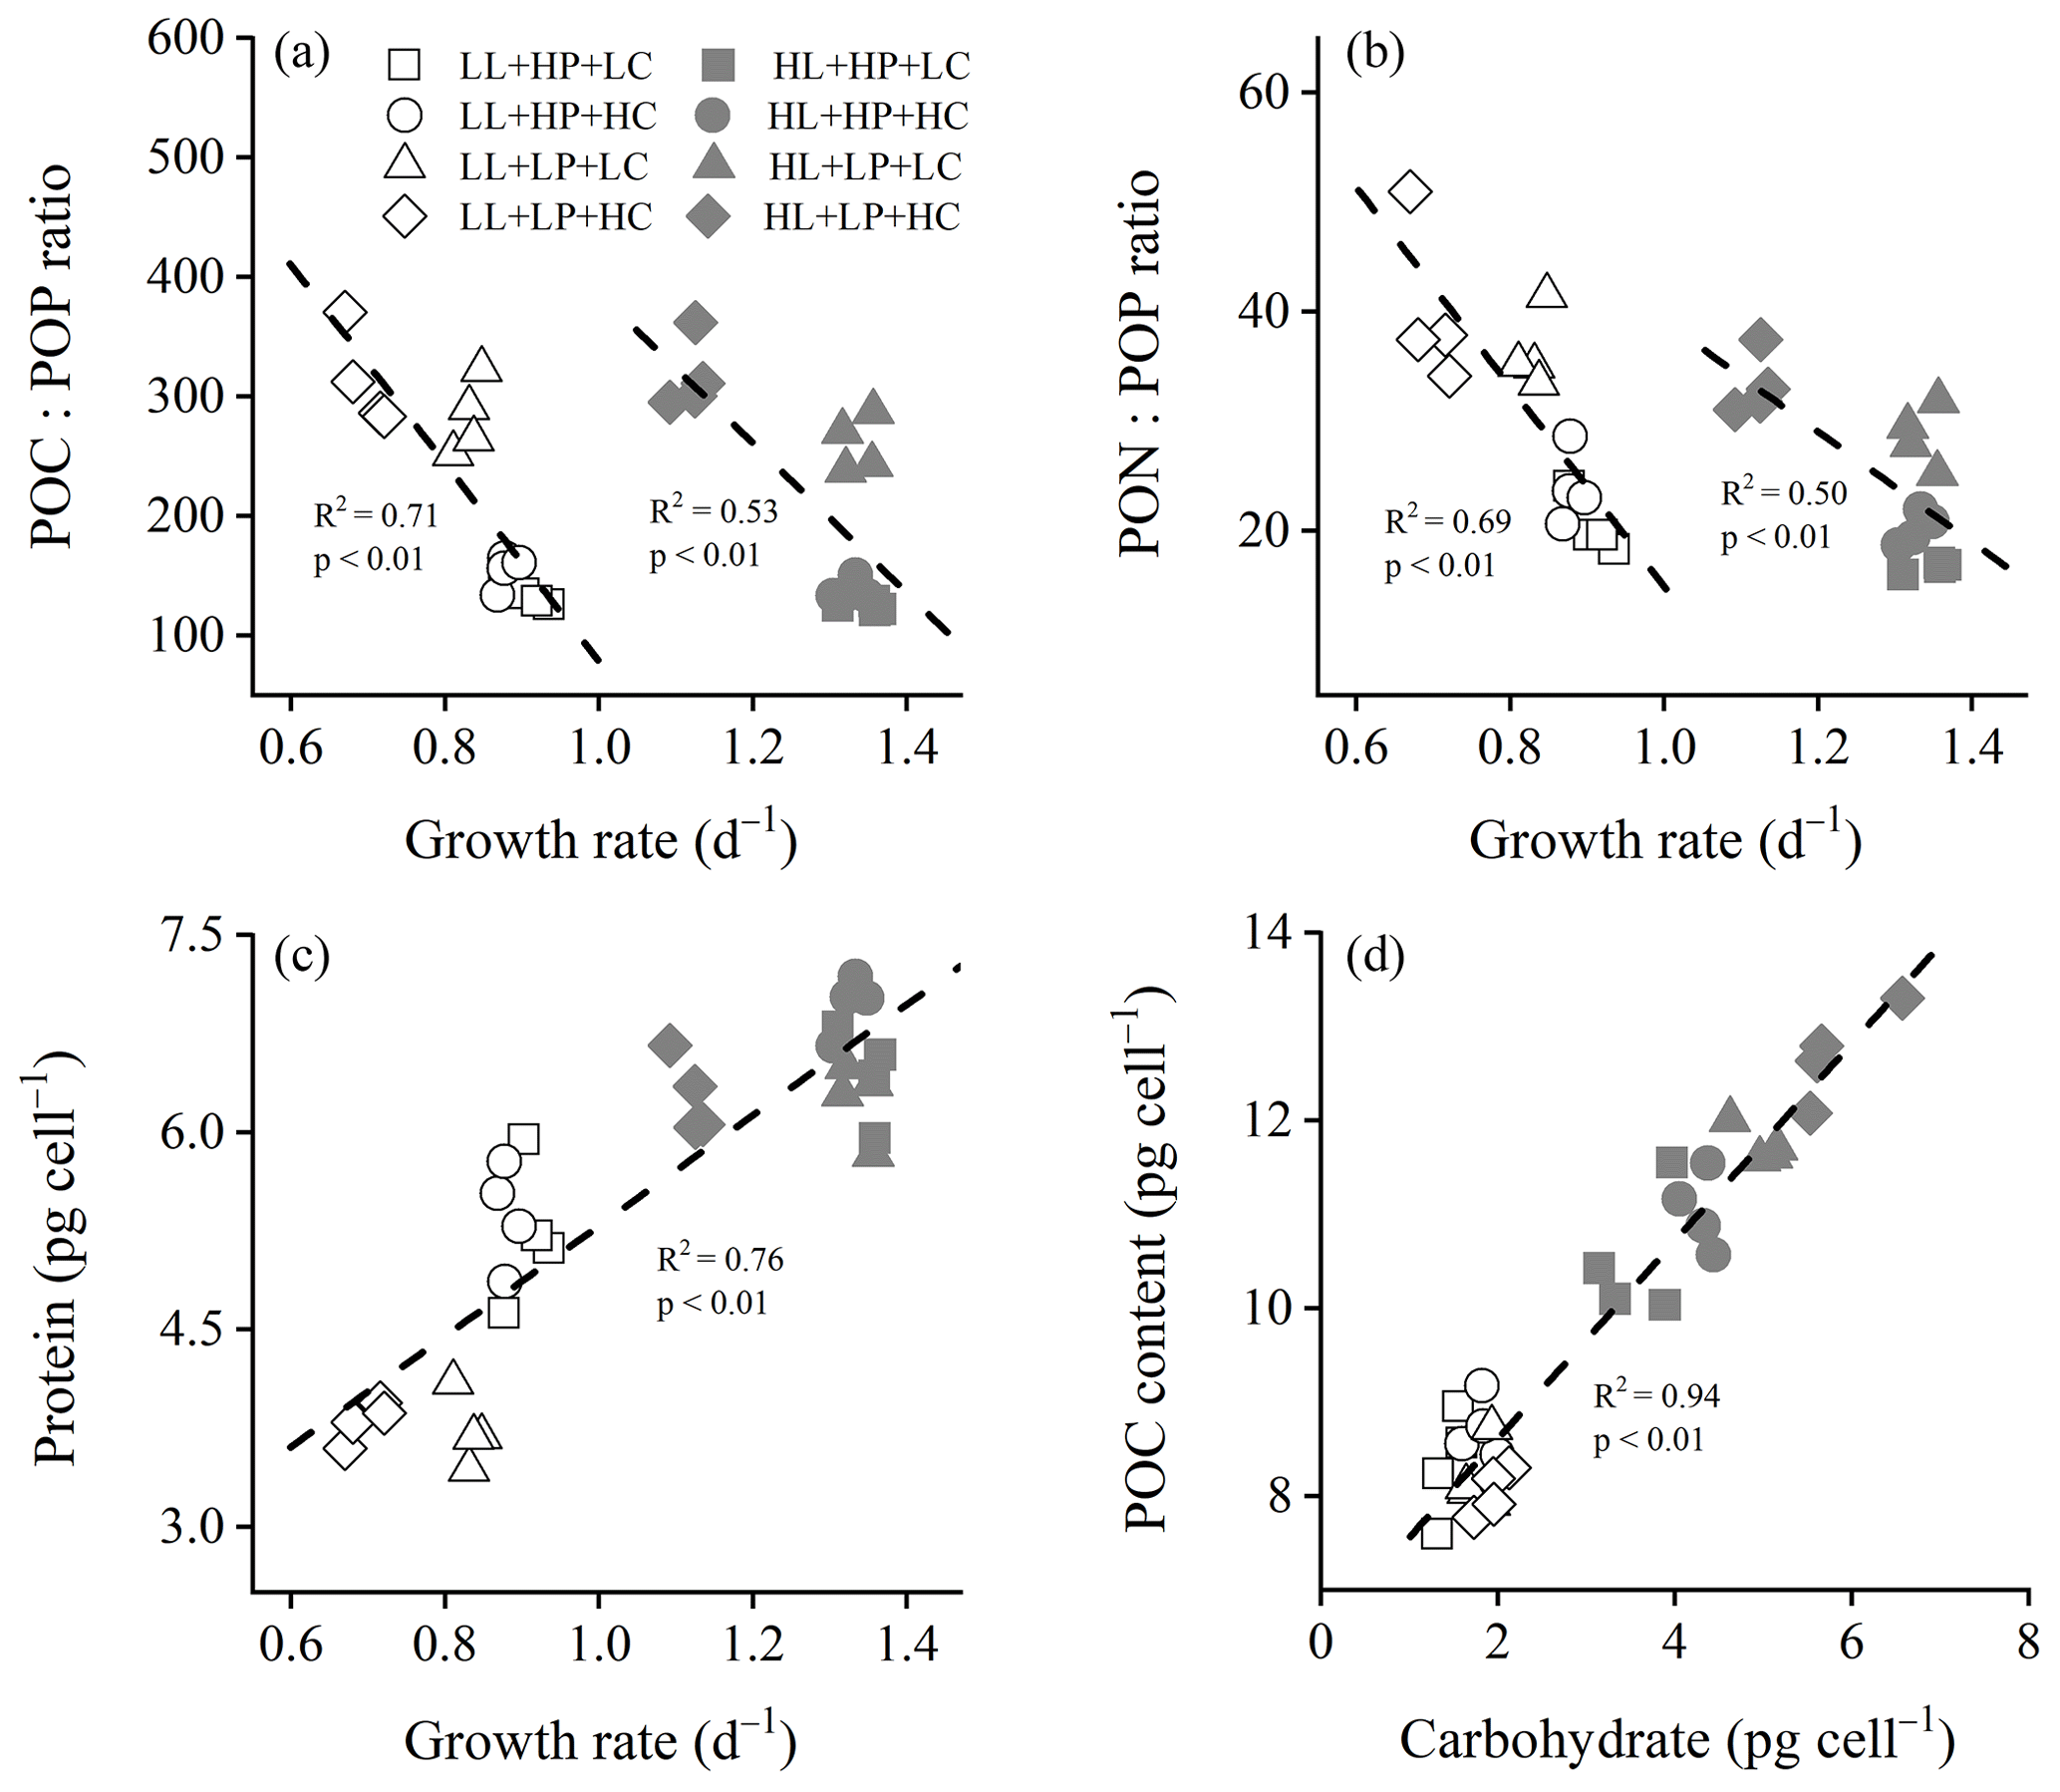
Figure 3Cellular POC : POP ratio (a), PON : POP ratio (b), and protein content (c) of E. huxleyi RCC1266 as a function of growth rate, and cellular POC content as a function of carbohydrate (d) in the treatments of high phosphorus availability and low CO2 level (HP + LC, □), high phosphorus availability and high CO2 level (HP + HC, ◦), low phosphorus availability and low CO2 level (LP + LC, △), and low phosphorus availability and high CO2 level (LP + HC, ◊) under low light (LL, empty) and high light (HL, filled) intensities. Each point indicates an individual replicate under each treatment.
3.6 Elemental stoichiometry and protein content as a function of growth rate
Reduced phosphorus availability increased the POC : PON ratio, and the extent of the increase was larger under the HL intensity than the LL intensity (Fig. S5a). At LL and HL intensities, both the POC : POP ratio and PON : POP ratio were linearly and negatively correlated with growth rates (Fig. 3a, b). In LL and HL conditions, the POC : POP ratio decreased linearly with increasing growth rate (R2=0.71, F=32.08, p<0.01 in LL condition; R2=0.53, F=14.63, p<0.01 in HL condition). Similarly, in LL and HL conditions, the PON : POP ratio decreased linearly with increasing growth rate (R2=0.69, F=29.23, p<0.01 in LL condition; R2=0.50, F=13.31, p<0.01 in HL condition). In all treatments, the protein content increased linearly with increasing growth rate (R2=0.76, F=151.14, p<0.01) (Fig. 3c), and the POC content increased linearly with increasing carbohydrate content (R2=0.94, F=435.10, p<0.01) (Fig. 3d).
Coccolithophores play a complex role in the marine carbon cycle through production and export of organic carbon to depth but also through the carbonate counter pump, and their responses to global climate change could have significant consequences for marine carbon cycling (Riebesell et al., 2017). The bloom-forming coccolithophore E. huxleyi, dominating the assemblages in seawater under limited phosphorus condition, is likely to be exposed to increasing light intensity and ocean acidification in the future ocean (Kubryakova et al., 2021). In this study, we observed that increasing light intensity compensates for the negative effects of low phosphorus availability on cellular protein and nitrogen contents (Figs. 1 and 2). Reduced phosphorus availability, increasing light intensity, and ocean acidification act synergistically to increase cellular contents of carbohydrate and POC and the allocation of POC to carbohydrate. These changes in E. huxleyi could provide vital information for evaluating the carbon cycle in marine ecosystems under global change.
Ribonucleic acid (RNA) is the main phosphorus-containing macromolecule within the cell (Geider and La Roche, 2002). Therefore, the reduced phosphorus availability dominantly reduces the RNA content (Fig. S6), which contributes to low POP contents (McKew et al., 2015) (Fig. 1d). In eukaryotic cells, ribosomal RNA (rRNA) constitutes about 80 % of the total RNA and is mainly used to create ribosome (Dyhrman, 2016). Thus, reduced RNA contents decrease the numbers of ribosome, which has the potential to decrease protein synthesis (Dyhrman, 2016; Rokitta et al., 2016). On the other hand, the separation of the regression line between the POC : POP ratio (or PON : POP ratio) and growth rate under low and high light intensities suggests different POP storage contents in E. huxleyi among different light intensities (Perrin et al., 2016). Low light intensity down-regulates the expression of genes related to nitrate reductase and nitrite reductase; it then reduces the nitrate uptake and assimilation efficiency of E. huxleyi and other phytoplankton species (Perrin et al., 2016; Lu et al., 2018), which exacerbates the negative effect of low phosphorus availability on protein synthesis and PON contents (Figs. 1c and 2b). Besides that, low light intensity significantly reduces the rates of RNA synthesis, carbohydrate synthesis, and cell division (Zhang et al., 2021), adding to the negative effect of low phosphorus availability on the growth rate of E. huxleyi (Fig. 1a). Under high light intensity and low CO2 level, reduced phosphorus availability did not change growth rate and protein content (Figs. 1a and 2b), which suggests that E. huxleyi might compensate for low phosphate-induced decreases in ribosome content by increasing protein synthesis efficiency under increasing light intensity (Reith and Cattolico, 1985). Under high light intensity and ocean acidification, reduced phosphorus availability did not significantly change cellular protein content while reducing the growth rate, which might indicate the lowered protein synthesis efficiency (McKew et al., 2015).
Several studies report that reduced phosphorus availability (0.4–0.5 µmol L−1) did not change growth rates significantly during the short-time (2 or 3 d) incubations under low CO2 level and high light intensity (Rokitta et al., 2016; Zhang et al., 2020; Wang et al., 2022). The reasons could be that E. huxleyi cells developed high affinity for phosphate, increased the uptake rate of phosphate (Wang et al., 2022), and could replace the phospholipid membrane with a non-phosphorus membrane during the short-time incubation of phosphorus limitation (Shemi et al., 2016). Our data showed that reduced phosphorus availability and ocean acidification acted synergistically to reduce the growth rate under both low and high light intensities (Fig. 1a). One of the reasons could be that low pH value under ocean acidification up-regulates the expressions of a series of genes involved in ribosome metabolism, such as genes of large subunit ribosomal protein L3, L38E, and L30E (RP-L3, RP-L38E, RP-L30E) and small subunit ribosomal protein S3E, S5E, and SAE (PR-S3E, PR-S5E, RP-SAE) in E. huxleyi (Wilson and Doudna Cate, 2012) (Fig. S7). Under ocean acidification, up-regulation of the expression of these genes has the potential to drive cells to allocate more phosphorus to synthesize ribosome and to reduce the allocation of phosphorus to DNA replication (Rokitta et al., 2011), which exacerbates the limitation of reduced phosphorus availability on the rate of cell division in E. huxleyi (Rouco et al., 2013). Under phosphorus-replete conditions, more phosphorus is reallocated to ribosome metabolism under ocean acidification which could facilitate nitrogen assimilation (Fig. 2b). Overall, under high light intensity, ocean acidification is likely to facilitate E. huxleyi cells to increase nitrogen content in phosphorus-replete conditions and to reduce the growth rate in phosphorus-limited conditions.
In this study, we found that low light intensity dominantly limits carbon assimilation of E. huxleyi and reduces the effects of phosphate availability and ocean acidification on cellular carbohydrate and POC contents (Figs. 1b and 2a). However, under high light intensity, E. huxleyi had high carbohydrate and POC contents while having low growth rates under reduced phosphorus availability and ocean acidification (Figs. 1a, b and 2a), which suggests that the carbon assimilation rate did not change significantly, while the cell division rate decreased (Matthiessen et al., 2012; Perrin et al., 2016). Furthermore, carbohydrate is a carbon- and energy-storing macromolecule, and protein is related to growth rate (Geider and La Roche, 2002). Under high light intensity, reduced phosphorus availability, and ocean acidification, E. huxleyi cells could synthesize more carbohydrate to store carbon and energy but did not increase protein content, which contributes to the large percentage of POC allocated to carbohydrate (Fig. 2c).
The physiological reasons for the reduced calcification rate under ocean acidification could be due to the high proton-concentration-induced reduction in the HCO uptake rate (Meyer and Riebesell, 2015; Kottmeier et al., 2016). The molecular mechanisms for low PIC content under ocean acidification may be due to down-regulation of a series of genes potentially involved in ion transport and pH regulation, such as genes of calcium and proton exchanger (CAX3), sodium and proton exchanger (NhaA2), and membrane-associated proton pump (PATP) (Mackinder et al., 2011; Lohbeck et al., 2014). On the other hand, increasing light intensity up-regulates a series of genes related to ion transport, such as the gene of CAX3, the gene of the Cl− and HCO exchanger, and genes of various subunits of a vacuolar H+–ATPase (V–ATPase) (Rokitta et al., 2011). Up-regulation of these genes in high light intensity has the potential to facilitate cells to take up HCO and Ca2+ and to pump proton outside the cells; this then leads to large PIC content of E. huxleyi (Kottmeier et al., 2016). Our data suggest that increasing light intensity counteracts the negative effect of ocean acidification on the cellular PIC content of E. huxleyi (Fig. 1e). These results are consistent with the findings of Feng et al. (2020), who reported that combinations of increasing light intensity and ocean acidification increase the expression of genes involved in calcium-binding proteins (CAM and GPA), which has the potential to increase the calcium influx into cells and then compensate for the effect of reduced HCO uptake rate on calcification. It is also suggested that increasing light intensity could cause cells to remove H+ faster, which neutralizes the effect of high proton concentration on calcification (Jin et al., 2017). On the other hand, reduced phosphorus availability extends the G1 phase of the cell cycle where calcification occurs, which prolongs the calcification time and then increases cellular PIC content (Müller et al., 2008). In addition, reduced phosphorus availability up-regulates expressions of genes of Ca2+ uptake, proton removal, and carbonic anhydrase and then increases coccolith production (Wang et al., 2022), which contribute to a larger PIC content and counteract the negative effect of ocean acidification on PIC contents (Borchard et al., 2011) (Fig. 1e). Furthermore, one of the reasons for larger PIC contents under reduced phosphorus availability and increasing light intensity conditions is likely due to larger and more numerous coccoliths (Gibbs et al., 2013; Perrin et al., 2016). Overall, responses of calcification of E. huxleyi to ocean climate change are more complex than previously thought (Meyer and Riebesell, 2015), and it is worth exploring the underlying mechanisms of calcification under changing multiple environmental drivers (Mackinder et al., 2011; Feng et al., 2020).
Cellular POP content of E. huxleyi generally decreased, and the POC : POP ratio and PON : POP ratio increased with reducing phosphorus availability (Leonardo and Geider, 2005; McKew et al., 2015). The negative correlations between the growth rate and POC : POP ratio or PON : POP ratio under each type of light intensity are consistent with the growth rate hypothesis (Fig. 3), which proposes that the growth rate increases with increasing RNA : protein ratio. Phosphorus in RNA accounts for a high percentage of total POP, whereas nitrogen in protein is the main form of PON (Zhang et al., 2021), and the growth rate hypothesis suggests that the growth rate could increase with decreasing POC : POP ratio or PON : POP ratio (Sterner and Elser, 2002). Our results suggest that E. huxleyi could reallocate chemical elements and energy to synthesize carbohydrate, protein, and RNA efficiently and then regulate its elemental stoichiometry and growth rate to acclimate to reduced phosphorus availability, ocean acidification, and increasing light intensity (Moreno and Martiny, 2018).
In the future ocean, large carbohydrate and POC contents, POC : PON ratio, and POC : POP ratio of coccolithophores indicate increases in carbon export to the deep ocean that may affect the efficiency of the biological carbon pump and the marine biogeochemical cycle of carbon (Meyer and Riebesell, 2015). In addition, increased cellular PIC content under phosphorus-limited conditions may have the potential to weaken CO2 uptake of the oceans in phosphorus-limited marine environments. In summary, responses of coccolithophores to climate change are likely to affect the marine carbon cycle in the future (Riebesell et al., 2017).
The data are available upon request to the corresponding author (yongzhang@fjnu.edu.cn).
The supplement related to this article is available online at: https://doi.org/10.5194/bg-20-1299-2023-supplement.
YZ (yongzhang@fjnu.edu.cn), ZL, and KX contributed to the design of the experiment. YZ (yongzhang@fjnu.edu.cn), YZ (qsx20211022@student.fjnu.edu.cn), SM, HC, and RH performed this experiment and biochemical analyses. YZ (yongzhang@fjnu.edu.cn) wrote the first draft of the paper. All authors contributed to the data analyses and editing of the paper.
The contact author has declared that none of the authors has any competing interests.
Publisher’s note: Copernicus Publications remains neutral with regard to jurisdictional claims in published maps and institutional affiliations.
We would like to thank Zoe V. Finkel for providing the Emiliania huxleyi RCC1266 strain, Vinitha Ebenezer for her helpful revision of the paper, and Peng Jin and two anonymous reviewers for their helpful suggestions which have helped us to improve the paper.
This research has been supported by the National Natural Science Foundation of China (grant nos. 41806129 and 32001180).
This paper was edited by Koji Suzuki and reviewed by three anonymous referees.
Beaufort, L., Couapel, M., Buchet, N., Claustre, H., and Goyet, C.: Calcite production by coccolithophores in the south east Pacific Ocean, Biogeosciences, 5, 1101–1117, https://doi.org/10.5194/bg-5-1101-2008, 2008.
Berges, J. A., Franklin, D. J., and Harrison, P. J.: Evolution of an artificial seawater medium: improvements in enriched seawater, artificial water over the past two decades, J. Phycol., 37, 1138–1145, https://doi.org/10.1046/j.1529-8817.2001.01052.x, 2001.
Borchard, C., Borges, A. V., Händel, N., and Engel, A.: Biogeochemical response of Emiliania huxleyi (PML B92/11) to elevated CO2 and temperature under phosphorus limitation: A chemostat study, J. Exp. Mar. Biol. Ecol., 410, 61–71, https://doi.org/10.1016/j.jembe.2011.10.004, 2011.
Caldeira, K. and Wickett, M. E.: Oceanography: anthropogenic carbon and ocean pH, Nature, 425, 365, https://doi.org/10.1038/425365a, 2003.
Chen, P., Toribara, T. T., and Warner, H.: Microdetermination of phosphorus, Anal. Chem., 28, 1756–1758, https://doi.org/10.1021/ac60068a036, 1956.
Dickson, A. G., Sabine, C. L., and Christian, J. R.: Guide to best practice for ocean CO2 measurements, PICES Special Publication, 3, 191 pp., 2007.
Dickson, A. G.: pH buffers for seawater media based on the total hydrogen ion concentration scale, Deep-Sea Res., 40, 107–118, https://doi.org/10.1016/0967-0637(93)90055-8, 1993.
Dyhrman, S. T.: Nutrients and their acquisition: phosphorus physiology in microalgae, in: The physiology of microalgae, edited by: Borowitzka, M. A., Beardall, J., and Raven, J. A., Springer, Heidelberg, 155–183, https://doi.org/10.1007/978-3-319-24945-2, 2016.
Fabry, V. J. and Balch, W. M.: Direct measurements of calcification rates in planktonic organisms, in: Guide to best practices for ocean acidification research and data reporting, edited by: Riebesell, U., Fabry, V. J., Hansson, L., and Gattuso, J. P., Luxembourg, Publications Office of the European Union, 201–212, https://doi.org/10.2777/66906, 2010.
Feng, Y. Y., Roleda, M. Y., Armstrong, E., Summerfield, T. C., Law, C. S., Hurd, C. L., and Boyd, P. W.: Effects of multiple drivers of ocean global change on the physiology and functional gene expression of the coccolithophore Emiliania huxleyi, Glob. Chang. Biol., 26, 5630–5645, https://doi.org/10.1111/GCB.15259, 2020.
Gao, K., Beardall, J., Häder, D. P., Hall-Spencer, J. M., Gao, G., and Hutchins, D. A.: Effects of ocean acidification on marine photosynthetic organisms under the concurrent influences of warming, UV radiation, and deoxygenation, Front. Mar. Sci., 6, 322, https://doi.org/10.3389/fmars.2019.00322, 2019.
Geider, R. J. and LaRoche, J.: Redfield revisited: variability of in marine microalgae and its biochemical basis, Eur. J. Phycol., 37, 1–17, https://doi.org/10.1017/S0967026201003456, 2002.
Gibbs, S. J., Poulton, A. J., Brown, P. R., Daniels, C. J., Hopkins, J., Young, J. R., Jones, H. L., Thiemann, G. J., O'Dea, S. A., and Newsam, C.: Species-specific growth response of coccolithophores to Palaeocene–Eocene environmental change, Nat. Geosci., 6, 218–222, https://doi.org/10.1038/ngeo1719, 2013.
Guillard, R. R. L. and Ryther, J. H.: Studies of marine planktonic diatoms. I. Cyclotella nana Hustedt and Detonula confervacea Cleve, Can. J. Microbiol., 8, 229–239, https://doi.org/10.1139/m62-029, 1962.
Hansen, H. P. and Koroleff, F.: Determination of nutrients, in: Methods of seawater analysis, edited by: Grasshoff, K., Kremling, K., and Ehrhardt, M., WILEY-VCH Publishers, ISBN 3-527-29589-5, 1999.
He, S., Le, C., He, J., and Liu, N.: Empirical algorithm for detecting coccolithophore blooms through satellite observation in the Barents Sea, Remote Sens. Environ., 270, 112886, https://doi.org/10.1016/j.res.2021.112886, 2022.
Heidenreich, E., Wördenweber, R., Kirschhöfer, F., Nusser, M., Friedrich, F., Fahl, K., Kruse, O., Rost, B., Franzreb, M., Brenner-Weiß, G., and Rokitta, S.: Ocean acidification has little effect on the biochemical composition of the coccolithophore Emiliania huxleyi, PLoS One, 14, e0218564, https://doi.org/10.1371/journal.pone.0218564, 2019.
Jin, P., Gao, G., Liu, X., Li, F., Tong, S., Ding, J., Zhong, Z., Liu, N., and Gao, K.: Contrasting photophysiological characteristics of phytoplankton assemblages in the Northern South China Sea, PLoS ONE, 11, e0153555, https://doi.org/10.1371/journal.pone.0153555, 2016.
Jin, P., Ding, J. C., Xing, T., Riebesell, U., and Gao, K. S.: High levels of solar radiation offset impacts of ocean acidification on calcifying and non-calcifying strains of Emiliania huxleyi, Mar. Ecol. Prog. Ser., 568, 47–58, https://doi.org/10.3354/meps12042, 2017.
Jordan, R. W. and Winter, A.: Assemblages of coccolithophorids and other living microplankton off the coast of Puerto Rico during January–May 1995, Mar. Micropaleontol., 39, 113–130, https://doi.org/10.1016/S0377-8398(00)00017-7, 2000.
Kondrik, D. V., Pozdnyakov, D. V., and Johannessen, O. M.: Satellite evidence that E. huxleyi phytoplankton blooms weaken marine carbon sinks, Geophys. Res. Lett., 45, e2017GL076240, https://doi.org/10.1002/2017GL076240, 2018.
Kottmeier, D. M., Rokitta, S. D., and Rost, B.: Acidification, not carbonation, is the major regulator of carbon fluxes in the coccolithophore Emiliania huxleyi, New Phytol., 211, 126–137, https://doi.org/10.1111/nph.13885, 2016.
Kubryakova, E. A., Kubryakov, A. A., and Mikaelyan, A. S.: Winter coccolithophore blooms in the Black Sea: Interannual variability and driving factors, J. Mar. Syst., 213, 103461, https://doi.org/10.1016/j.jmarsys.2020.103461, 2021.
Leonardos, K. and Geider, R. J.: Elevated atmospheric carbon dioxide increases organic carbon fixation by Emiliania huxleyi (haptophyta), under nutrient-limited high-light conditions, J. Phycol., 41, 1196–1203, https://doi.org/10.1111/j.1529-8817.2005.00152.x, 2005.
Lohbeck, K., Riebesell, U., and Reusch, T. B. H.: Gene expression changes in the coccolithophore Emiliania huxleyi after 500 generation of selection to ocean acidification, P. Roy. Soc. B-Bio., 281, 20140003, https://doi.org/10.1098/rspb.2014.0003, 2014.
Lu, Y., Wen, Z., Shi, D., Chen, M., Zhang, Y., Bonnet, S., Li, Y., Tian, J., and Kao, S.-J.: Effect of light on N2 fixation and net nitrogen release of Trichodesmium in a field study, Biogeosciences, 15, 1–12, https://doi.org/10.5194/bg-15-1-2018, 2018.
Mackinder, L., Wheeler, G., Schroeder, D., von Dassow, P., Riebesell, U., and Brownlee, C.: Expression of biomineralization-related ion transport genes in Emiliania huxleyi, Env. Microbiol., 13, 3250–3565, https://doi.org/10.1111/j.1462-2920.2011.02561.x, 2011.
Masuko, T., Minami, A., Iwasaki, N., Majima, T., Nishimura, S. I., and Lee, Y. C.: Carbohydrate analysis by a phenol-sulfuric acid method in microplate format, Anal. Biochem., 339, 69–72, https://doi.org/10.1016/j.ab.2004.12.001, 2005.
Matthiessen, B., Eggers, S. L., and Krug, S. A.: High nitrate to phosphorus regime attenuates negative effects of rising pCO2 on total population carbon accumulation, Biogeosciences, 9, 1195–1203, https://doi.org/10.5194/bg-9-1195-2012, 2012.
McKew, B. A., Metodieva, G., Raines, C. A., Metodiev, M. V., and Geider, R. J.: Acclimation of Emiliania huxleyi (1516) to nutrient limitation involves precise modification of the proteome to scavenge alternative sources of N and P, Environ. Microbiol., 17, 4050–4062, https://doi.org/10.1111/1462-2920.12957, 2015.
Meyer, J. and Riebesell, U.: Reviews and Syntheses: Responses of coccolithophores to ocean acidification: a meta-analysis, Biogeosciences, 12, 1671–1682, https://doi.org/10.5194/bg-12-1671-2015, 2015.
Moreno, A. R. and Martiny, A. C.: Ecological stoichiometry of ocean plankton, Ann. Rev. Mar. Sci., 10, 43–69, https://doi.org/10.1146/annurev-marine-121916-063126, 2018.
Müller, M. N., Antia, A. N., and LaRoche, J.: Influence of cell cycle phase on calcification in the coccolithophore Emiliania huxleyi, Limnol. Oceanogr., 53, 506–512, https://doi.org/10.4319/lo.2008.53.2.0506, 2008.
Ni, G., Zimbalatti, G., Murphy, C. D., Barnett, A. B., Arsenault, C. M., Li, G., Cockshutt, A. M., and Campbell, D. A.: Arctic Micromonas uses protein pools and non-photochemical quenching to cope with temperature restrictions on Photosystem II protein turnover, Photosynth. Res., 131, 203–220, https://doi.org/10.1007/s11120-016-0310-6, 2016.
Pakulski, J. D. and Benner, R.: An improved method for the hydrolysis and MBTH analysis of dissolved and particulate carbohydrates in seawater, Mar. Chem., 40, 143–160, https://doi.org/10.1016/0304-4203(92)90020-B, 1992.
Perrin, L., Probert, I., Langer, G., and Aloisi, G.: Growth of the coccolithophore Emiliania huxleyi in light- and nutrient-limited batch reactors: relevance for the BIOSOPE deep ecological niche of coccolithophores, Biogeosciences, 13, 5983–6001, https://doi.org/10.5194/bg-13-5983-2016, 2016.
Pierrot, D., Lewis, E., and Wallace, D. W. R.: MS Excel program developed for CO2 system calculations, ORNL/CDIAC-105, Carbon Dioxide Information Analysis Centre, Dr. Denis Pierrot, Oak Ridge National Laboratory, U.S., Department of Energy, https://doi.org/10.3334/CDIAC/otg.CO2SYS_XLS_CDIAC105a, 2006.
R version 3.5.0.: The R foundation for statistical computing platform, x86_64-w64-mingw32/x64, https://cran.r-project.org/bin/windows/base/old/3.5.0, (last access: 28 February 2020), 2018.
Reith, M. E. and Cattolico, R. A.: Chloroplast protein synthesis in the chromophytic alga Olisthodiscus luteus, Plant Physiol., 79, 231–236, https://doi.org/10.1104/pp.79.1.231, 1985.
Riebesell, U., Bach, L. T., Bellerby, R. G. J., Rafael Bermúdez Monsalve, J., Boxhammer, T., Czerny, J., Larsen, A., Ludwig, A., and Schulz, K. G.: Competitive fitness of a predominant pelagic calcifier impaired by ocean acidification, Nat. Geosci., 10, 19–24, https://doi.org/10.1038/NGEO2854, 2017.
Riegman, R., Stolte, W., Noordeloos, A. A. M., and Slezak, D.: Nutrient uptake and alkaline phosphatase (EC ) activity of Emiliania huxleyi (Prymnesiophyceae) during growth under N and P limitation in continuous cultures, J. Phycol., 36, 87–96, 2000.
Rokitta, S. D., von Dassow, P., Rost, B., and John, U.: P- and N-depletion trigger similar cellular responses to promote senescence in eukaryotic phytoplankton, Front. Mar. Sci., 3, 109, https://doi.org/10.3389/fmars.2016.00109, 2016
Rokitta, S. D. and Rost, B: Effects of CO2 and their modulation by light in the life-cycle stages of the coccolithophore Emiliania huxleyi, Limnol. Oceanogr., 57, 607–618, https://doi.org/10.4319/lo.2012.57.2.0607, 2012.
Rokitta, S. D., de Nooijer, L. J., Trimborn, S., de Vargas, C., Rost, B., and John, U.: Transcriptome analyses reveal differential gene expression patterns between the life-cycle stages of Emiliania huxleyi (haptophyta) and reflect specialization to different ecological niches, J. Phycol., 47, 829–838, https://doi.org/10.1016/S0924-9338(02)00624-7, 2011.
Rost, B. and Riebesell, U.: Coccolithophores and the biological pump: responses to environmental changes, in: Coccolithophores: from molecular biology to global impact, edited by: Thierstein, H. R. and Young, J. R., Springer, Berlin, 99–125, 2004.
Rouco, M., Branson, O., Lebrato, M., and Iglesias-Rodríguez, M.: The effect of nitrate and phosphate availability on Emiliania huxleyi (NZEH) physiology under different CO2 scenarios, Front. Microbiol., 4, 1–11, https://doi.org/10.3389/fmicb.2013.00155, 2013.
Roy, R. N., Roy, L. N., Vogel, K. M., Porter-Moore, C., Pearson, T., Good, C. E., Millero, F. J., and Campbell, D. C.: Thermodynamics of the dissociation of boric acid in seawater at S = 35 from 0 to 55 ∘C, Mar. Chem., 44, 243–248, https://doi.org/10.1016/0304-4203(93)90206-4, 1993.
Shemi, A., Schatz, D., Fredricks, H. F., Van Mooy, B. A. S., Porat, Z., and Vardi, A.: Phosphorus starvation induces membrane remodeling and recycling in Emiliania huxleyi, New Phytol., 211, 886–898, https://doi.org/10.1111/nph.13940, 2016.
Solórzano, L. and Sharp, J. H.: Determination of total dissolved phosphorus and particulate phosphorus in nature waters, Limnol. Oceanogr., 25, 754–758, https://doi.org/10.4319/lo.1980.25.4.0754, 1980.
Steinacher, M., Joos, F., Frölicher, T. L., Bopp, L., Cadule, P., Cocco, V., Doney, S. C., Gehlen, M., Lindsay, K., Moore, J. K., Schneider, B., and Segschneider, J.: Projected 21st century decrease in marine productivity: a multi-model analysis, Biogeosciences, 7, 979–1005, https://doi.org/10.5194/bg-7-979-2010, 2010.
Sterner, R. W. and Elser, J. J.: Ecological Stoichiometry: The Biology of Elements from Molecules to the Biosphere, Princeton University Press, Princeton, 2002.
Terrats, L., Claustre, H., Cornec, M., Mangin, A., and Neukermans, G.: Detection of coccolithophore blooms with BioGeoChemical-Argo floats, Geophys. Res. Lett., 47, e2020GL090559, https://doi.org/10.1029/2020GL090559, 2020.
Townsend, D. W., Keller, M. D., Holligan, P. M., Ackleson, S. G., and Balch, W. M.: Blooms of the coccolithophore Emiliania huxleyi with respect to hydrography in the Gulf of Maine, Cont. Shelf Res., 14, 979–1000, https://doi.org/10.1016/0278-4343(94)90060-4, 1994.
Tyrrell, T. and Merico, A.: Emiliania huxleyi: bloom observations and the conditions that induce them, in: Coccolithophores: from molecular biology to global impact, edited by: Thierstein, H. R. and Young, J. R., Springer, Berlin, 75–97, 2004.
Wang, C., Wang, J., Li, L., Wang, Y., and Lin, S.: P-limitation promotes carbon accumulation and sinking of Emiliania huxleyi through transcriptomic reprogramming, Front. Mar. Sci., 9, 860222, https://doi.org/10.3389/fmars.2022.860222, 2022.
Wang, G., Xie, S. P., Huang, R. X., and Chen, C.: Robust warming pattern of global subtropical oceans and its mechanism, J. Climate, 28, 8574–8584, https://doi.org/10.1175/jcli-d-14-00809.1, 2015.
Wilson, D. N. and Doudna Cate J. H.: The structure and function of the eukaryotic ribosome, CSH Perspect. Biol., 4, a011536, https://doi.org/10.1101/cshperspect.a011536, 2012.
Zhang, Y., Collins, S., and Gao, K.: Reduced growth with increased quotas of particulate organic and inorganic carbon in the coccolithophore Emiliania huxleyi under future ocean climate change conditions, Biogeosciences, 17, 6357–6375, https://doi.org/10.5194/bg-17-6357-2020, 2020.
Zhang, Y., Li, Z. K., Schulz, K. G., Hu, Y., Irwin, A. J., and Finkel, Z. V.: Growth-dependent changes in elemental stoichiometry and macromolecular allocation in the coccolithophore Emiliania huxleyi under different environmental conditions, Limnol. Oceanogr., 66, 2999–3009, https://doi.org/10.1002/lno.11854, 2021.