the Creative Commons Attribution 4.0 License.
the Creative Commons Attribution 4.0 License.
 | 14 Apr 2023
Role of formation and decay of seston organic matter in the fate of methylmercury within the water column of a eutrophic lake
Laura Balzer
Carluvy Baptista-Salazar
Sofi Jonsson
Harald Biester
Anoxic microniches in sinking particles in lakes have been identified as important water phase production zones of monomethylmercury (MeHg). However, the production and decay of MeHg during organic matter (OM) decomposition in the water column and its relation to the total Hg concentration in seston are poorly understood. We investigated total Hg and MeHg in relation to chemical changes in sinking seston and hydrochemical settings in a small and shallow (12 m deep) eutrophic lake during phytoplankton blooms from April to November 2019. The results show that MeHg proportions reach up to 22 % in seston in oxygen super saturation at the water surface and highest values (up to 26 %) at the oxic–suboxic redox boundary. MeHg concentrations were highest in May and November when algal biomass production was low and seston were dominated by zooplankton. Biodilution of MeHg concentrations could not be observed in the months of the highest algal biomass production; instead, MeHg and THg concentrations in seston were comparatively high. During suboxic OM decomposition and with decreasing redox potential (Mn and nitrate reduction), the concentration and proportion of MeHg in seston strongly decreased (<0.5 %), whereas total Hg concentrations show a 3.8- to 26-fold increase with water depth. Here, it remains unclear to which extent biodilution on the one hand and OM decomposition on the other alter the MeHg and THg concentration in seston. Changes in OM quality were most intense within or slightly below the redox transition zone (RTZ). The concentrations of MeHg and THg in seston from the RTZ were comparable to those found in the sediment trap material which integrated the changes in seston composition during the entire sampling period, suggesting that changes in the MeHg and THg content in the hypolimnion below the RTZ are comparatively small. Our study suggests that, in shallow eutrophic lakes, the water phase formation and decomposition of MeHg is intense and controlled by the decomposition of algal biomass and is, assumedly, largely disconnected from Hg methylation in sediments, similar to what has been observed in deep oligotrophic lakes.
- Article
(2270 KB) - Full-text XML
-
Supplement
(1590 KB) - BibTeX
- EndNote


Lakes are dynamic systems where methylmercury (MeHg) is produced and can become bioaccumulated in the food chain (Ravichandran, 2004). The methylation of inorganic divalent forms of mercury (Hg(II)) to MeHg is carried out by a variety of obligate anaerobic microorganisms (Peterson et al., 2020; Gilmour et al., 1992; Fleming et al., 2006; Gilmour et al., 2013) that decompose the organic matter (OM) produced mainly by primary productivity in the upper water column. Thus, lacustrine Hg methylation is, presumably, closely connected to the biological pump and related temporal and spatial changes in redox conditions and related Hg-methylating bacteria. Aquatic MeHg production has been previously investigated in sediments (Jensen and Jernelöv, 1969; Gilmour et al., 1992; Robinson and Tuovinen, 1984; Hammerschmidt et al., 2004; Hollweg et al., 2009; Sunderland et al., 2004; Bouchet et al., 2013) and more recently in the oxic and anoxic water column of marine (Topping and Davies, 1981; Soerensen et al., 2018; Cossa et al., 2011; Heimbürger et al., 2015; Ortiz et al., 2015; Wang et al., 2018) and freshwater systems (Eckley et al., 2005; Peterson et al., 2020; Gascón Díez et al., 2018; Watras and Bloom, 1994; Gallorini and Loizeau, 2022). Research conducted in marine systems in the 1980s (Topping and Davies, 1981) and in lake systems in the 1990s (Watras and Bloom, 1994) suggested that MeHg produced within the water column is similar to, or may even exceed, sedimentary MeHg production. Water-column-produced MeHg may increase MeHg exposure at the base of the aquatic food chain, which may explain the high MeHg levels observed at higher trophic levels (Heimbürger et al., 2015; Gallorini and Loizeau, 2021). Several studies indicate that maximum MeHg concentrations occur at the middle of the water column. The observed changes in water column MeHg concentrations were related to OM mineralization (Sunderland et al., 2009; Cossa et al., 2011, 1997; Heimbürger et al., 2010, 2015) below the oxic–anoxic boundary (Mauro et al., 2002) or along redox gradients in the water column (Peterson et al., 2020; Watras et al., 1995). Based on observations of water column MeHg formation under differing states of oxygen (O2) saturation, anoxic microniches have been proposed as important MeHg production sites in and around settling particles in both lacustrine and the marine water columns (Gascón Díez et al., 2016; Ortiz et al., 2015; Gallorini and Loizeau, 2022). However, MeHg formation in anoxic microniches has only been observed directly in marine particles (Ortiz et al., 2015; Gallorini and Loizeau, 2021). Regarding the abundance, chemical composition and microbial colonization, aggregates of settling particles formed in lakes (lake snow) do not differ significantly from those in marine waters (marine snow; Grossart and Simon, 1993). This implies that anoxic microniches should also be formed in lakes. A recent study by Gallorini and Loizeau (2022) shows MeHg formation in lake snow under oligotrophic and oxic conditions and increasing THg and MeHg concentrations in lake snow with depth. Most available studies on water column Hg methylation were carried out on oligotrophic or mesotrophic lakes. As water column MeHg formation is connected to redox conditions and the amount of decaying biomass, we hypothesize that it is particularly intensive in eutrophic lakes where OM turnover and the formation of redox gradients is pronounced. Although it has been shown that high plankton densities in lakes reduce Hg biomagnification (Chen and Folt, 2005), previous studies on Hg cycling in mesotrophic and eutrophic lakes have shown that high primary productivity enhances lacustrine Hg sedimentation due to algae scavenging water column Hg (Schütze et al., 2021; Biester et al., 2018). Liang et al. (2022) have recently shown that Hg scavenged or taken up by algae can experience species transformation, such as reduction or β–HgS formation under sunlit or dark conditions.
Degradation is most pronounced in recently produced OM (Higginson, 2009), which is primarily altered in the upper water column (Meyers and Eadie, 1993). Meyers and Eadie (1993) showed that OM at different water column depths is decomposed by different biogeochemical processes. Degradation rates decrease with depth, resulting in increasing amounts of refractory OM (Higginson, 2009). The temporal and spatial occurrences of lacustrine MeHg in settling particles and how it changes during OM decomposition throughout the water column are still poorly understood. Most studies are either based on laboratory analysis (Pickhardt and Fisher, 2007), studies using sediment traps (Gascón Díez et al., 2016) or analysis of bottom sediments (Zaferani et al., 2018). Moreover, most of these studies are based on singular sampling from only a few locations in the water column. These low-resolution sampling schemes limit our ability to decipher the temporally dependent and depth-dependent processes of MeHg formation or degradation in sinking seston.
In this study, we developed water column and seston (all particles >25 µm) depth profiles (at 1 m intervals) in a productive lake over 7 sampling days between April and November (2019). We investigated the formation and fate of MeHg during algal blooms and during the degradation of settling seston throughout the seasonal lake cycle. We hypothesize that the high algal biomass production in eutrophic lakes and related changes in water column redox conditions provide suitable conditions for MeHg scavenging or MeHg formation by or in seston. Moreover, we expect that the Hg speciation, concentrations and proportions in seston are altered through OM degradation in the water column and that, even in shallow eutrophic lakes, the water-column-produced MeHg pool is at least partly independent from sedimentary MeHg formation, similar to what has been shown for deep oligotrophic lakes.
2.1 Study site and sampling
Lake Ölper (105 m a.s.l.; 52∘28′80′′ N, 10∘51′20′′ E) is an artificial dimictic lake located in the city of Braunschweig, Germany. We used this lake as a natural laboratory, as it has no direct inflow and receives relatively low surface run off, which minimizes the external input of MeHg. Moreover, the lake is known to show negligible lateral currents, which may cause frequent mixing. The lake has an area of 0.158 km2 and is 10–13 m deep. It is mainly fed by rain and groundwater and receives input from the nearby Oker River during rare flood events only via a small trench (Galggraben). There were no flood events in 2019, and surface run off was minimal due to very arid conditions. The lake is surrounded by a park, and its catchment is flat and is smaller in area than the lake itself. The vegetation is dominated by willows. Ground elder and reeds are distributed heterogeneously around the lake (mostly present on the south bank). Water and seston samples were taken on 7 days between April and November 2019 using a clean stainless steel immersion pump (COMET COMBI 12–4T). The water column was sampled over the deepest (∼ 12 m) portion of the lake. Water samples were collected from the surface down to the sediment–water interface at 1 m intervals. Samples for chlorophyll a (Chl a) determination, following DIN 38409 – H 60 (Deutsches Institut für Normung, 2015), were stored in 0.5 and 2 L PE flasks that had been pre-rinsed and cleaned with acid. Samples intended for chemical analyses (i.e., THg, DOC, Mn, Fe and major ions) were vacuum filtered using <0.45 µm nylon filters and stored in 50 mL PE Falcon tubes.
Seston samples were collected by means of a plankton net with a 25 µm mesh and were placed into 100 mL acid-cleaned and pre-rinsed flasks. Surface seston samples were collected at 0.2 m depth by drawing the net behind the boat. Seston samples from deeper water layers (up to 4–12 m) were collected by pumping between 60 and 120 L through the plankton net (tubing was acid washed before sampling). Depending on the plankton abundance and distribution in the water column, sampled depths varied by day between 4 and 12 m but, in most cases, covered the upper 4–5 m (except in November, where only the upper 2 m were sampled). Additionally, the change in redox conditions between well-oxygenated and poorly oxygenated water also impacted the sampling depth. With the used method, it was not possible to gain sufficient material from deeper layers in the water column, as the amount of suspended matter below 4–5 m was, in most cases, very low. All seston samples were frozen immediately after sampling and subsequently freeze dried and homogenized with a glass pestle for further analyses (THg, MeHg and CNS).
Herein, we define seston as all particles suspended in the water column, including plankton (phytoplankton, zooplankton, bacterioplankton, pseudoplankton and paraplankton) and detritus (biogenous, terrigenous, aerogenous and anthropogenous detritus; Lenz, 1977), larger in size than 25 µm. This method does not distinguish between the two types of seston nor further between phyto- and zooplankton. Thus, our seston samples are a collection of varying compositions of plankton and detritus and their subgroups. This approach excluded the pico- and nano-sized seston fraction (<25 µm). We are aware that the smaller fraction is of importance within the microbial loop and would potentially extend our data. Pumping the water through the 25 µm net was the best method and was within the range of our possibilities, providing enough material for all solid analyses and allowing us, to the best of our abilities, a high sampling frequency (each water layer at a resolution of 1 m within a single day for several days a year). Ortiz et al. (2015) showed that anoxic microinches can be formed within aggregations as long as the particles are larger than 8 µm. Smaller particles (composed of individual particles, small phytoplankton and other microbes) do not provide ideal conditions for Hg methylation, as no anoxic microniches can occur (Ortiz et al., 2015). Thus, we are confident that seston >25 µm in size allow us to study the temporal and spatial occurrences of lacustrine MeHg in settling particles and how it changes during OM decomposition throughout the water column, to cover daily lake fluctuations like stratifications that may change from hours to weeks and to analyze if anoxic microniches may also be formed in shallow eutrophic lakes. Water temperature, electrical conductivity (EC), pH and O2 concentrations and saturation were measured in situ using handheld single-parameter probes.
Settling seston were collected in bulk over 141 d from early May to late September (06.05–24.09) by means of a sediment trap positioned at the deepest part of the lake approximately 1 m above the sediment–water interface (∼ 11 m depth) to obtain a sample which integrates the decomposition changes of seston over the entire sampling period. This material is assumed to largely reflect the composition of the uppermost sediment layer. The sediment trap consisted of two individual particle interceptor traps (PIT). Each trap had a collection area of 0.45 cm2 and was kept vertical in the water column by two buoys. Prior to deployment, each PIT was acid cleaned and pre-rinsed with lake water. In addition, a short sediment core (6 cm) was taken using a UWITEC gravity corer at the sediment trap position. Sampling material was frozen immediately after collection, freeze dried and then ground for further analyses (THg, MeHg and CNS).
2.2 Analyses of water samples
2.2.1 Total dissolved Hg
For total dissolved Hg analyses, filtered water samples were stabilized using a 0.5 % () ultrapure BrCl–HCl solution in order to convert all organic Hg compounds to inorganic Hg2+. THg was determined by means of cold-vapor atomic fluorescence spectrometry (CV-AFS; Mercur Analytik Jena AG, Germany) after Hg2+ was reduced with stannous chloride according to EPA method 1631. The quality of the measurements was controlled by the certified reference material ORMS 5 (elevated mercury in river water; NRC CNRC), with an Hg concentration of 26.2 ± 1.3 ng L−1. The mean recovery was 102.5 % (n=20), with a mean blank concentration of 0.9 ng L−1.
2.2.2 Iron and manganese
Dissolved iron (Fe) and manganese (Mn) concentrations were analyzed in the acidified water samples (1 % () bidistilled nitric acid (HNO3)) by means of inductively coupled plasma-optical emission spectrometry (ICP-OES, Varian 715 ES, Agilent Technologies Inc., USA).
The quality of the measurements was controlled by CRM SLRS-6 (river water), with an Fe concentration of 84.3 ± 3.6 µg L−1 and a Mn concentration of 2.12 ± 0.1 µg L−1. The mean recovery of the CRM (n=6) was 94.4 % for Fe and 112.1 % for Mn.
2.2.3 Dissolved organic carbon
DOC concentrations were determined after water samples were acidified with HCl to a pH value of 2 to remove carbonic acid and after thermocatalytic oxidation of the sample by means of a TOC Analyser (multi N/C 2100, Analytik Jena AG, Germany). Measurements of DOC were validated using CRMs (ION-96.4, TOC20 and NW-Ontario-12) with mean recoveries of 107.7 % (n=11), 95.3 % (n=17) and 97 % (n=9).
2.2.4 Nitrate and sulfate
Nitrate (NO) and sulfate (SO) were determined by means of ion exchange chromatography (761 Compact IC, Metrohm AG, Switzerland). The quality of the measurements was controlled by the CRM, Roth multi-element standard solution (NO = 24.997±0.064 mg L−1; SO = 30.049±0.070 mg L−1) and the IC multi-standard solution 02179 (Bernd Kraft) (NO = 1000 mg L−1; SO = 1000 mg L−1). Mean recoveries for the CRM Roth (n=20) were 97 % for NO and 96.7 % for SO, and for the CRM IC multi-standard solution 02179 (Bernd Kraft; n=3), they were 86 % for NO and 91.1 % for SO.
2.2.5 Chlorophyll a
Chl a was determined according to the German standard procedure DIN 38409 – H 60 (Deutsches Institut für Normung, 2015). Between 1 and 2 L of lake water were vacuum filtered using Whatman GF/F filters (Carl Roth GmbH + Co. KG, Germany). The filters were folded and homogenized, and the pigments were extracted immediately with 15 mL of 90 % ethanol (78 ∘C) in an opaque 50 mL Falcon tube and stored for 12–24 h in the dark at room temperature. These extracted pigments were clarified by filtration using membrane filters, and their concentration was measured by means of a UV-VIS spectrometer Lambda 25 (Perkin Elmer) at 750 and 665 nm against 90 % ethanol. The concentration was corrected for pheopigment by acidification of the sample with 0.3 Vol % 2 M HCl (Deutsches Institut für Normung, 2015).
2.3 Analyses of seston, sediment trap material and bottom sediments
Seston samples, sediment traps and core materials were freeze dried (LYOVAC GT 2-E). The dried seston samples were homogenized using a glass stick. Sediment traps and core samples were ground in a cleaned agate ball mill. All the solid samples were subjected to the same methods for the following analyses.
2.3.1 Total Hg
The THg content in all solid samples was analyzed by thermal decomposition followed by preconcentration of Hg on a gold trap and by means of atomic absorption spectrometry using a DMA-80 direct mercury analyzer (Milestone, Italy). For quality control, three standard reference materials with different matrices (apple leaves NIST-1515 (THg = 44 ng g−1), Chinese sediment NCS DC 73312 (THg = 40 ng g−1) and plankton material BCR-414 (THg = 276 µg g−1) were measured.
The mean recovery of the CRMs was 111.9 % for apple leaves (n=20), 93.6 % for Chinese sediment (n=24) and 107.7 % for plankton material (n=9).
2.3.2 Methylmercury
The extraction of MeHg from the seston samples was performed using a slightly altered procedure for biota samples suggested by the US Geological Survey's Mercury Research Laboratory (USGS Method 5 A-7; USGS-Mercury Research Laboratory, 2016). Samples were digested in 5 M nitric acid (instead of 4.5 M) for ∼15 h (instead of 8 h) until no visual residues could be observed to ensure complete digestion. Digested samples were buffered with sodium acetate at pH ∼ 4.9 and ethylated using sodium tetraethylborate (NaTEB). MeHg was analyzed using a purge-and-trap CV-AFS (Tekran 2700) methylmercury analyzer.
The quality of the measurements was controlled by three CRMs, TORT-2 lobster hepatopancreas (MeHg = 163.4 ng g−1), DOLT-5 dogfish liver (MeHg = 127.9 ng g−1) and SRM® 15566b oyster tissue (MeHg = 14.2 ng g−1). The mean recoveries for the CRMs were 83.11 % for TORT-2 (n=7), 108.33 % for DOLT-5 (n=6), and 103.6 % for SRM® 15566b-2 (n=7).
To extract MeHg from the sediment samples, between ∼ 0.5–1 g of material was weighed into new 50 mL Falcon tubes, and between 20–100 µL of an internal standard, an isotopically enriched Me200Hg standard with a concentration of 1.1 ng g−1, was added and then left to equilibrate for an hour. After equilibration, 10 mL KBr (1.4 M), 2 mL CuSO4 (2 M) and 10 mL dichloromethane (DCM – CH2Cl2) were added to each tube, which were then capped and left for 45 min. To extract MeHg, the samples were rotated at 85 RPM on a sample rotor for 45 min and then centrifuged for 5 min at 3000 RPM. MeHg was analyzed using a Tekran® Model 2700 Automated Methylmercury Analysis System connected to an inductively coupled plasma mass spectrometer (ICPMS; Thermo Fisher XSERIES 2). Prior to analysis, half the extracted sample was ethylated using sodium tetraethylborate (NaTEB) at pH 4.9 (using 225 µL of a 2 M acetate buffer). The certified reference material (ERM-CC580, estuarine sediment) analyzed was, on average, 110 % of the certified value (75 ± 4 ng g−1 – for a detailed description, please see the method section in the Supplement).
2.3.3 Carbon, nitrogen and sulfur
Total organic carbon (C), nitrogen (N) and sulfur (S) in all solid samples were measured by means of an elemental analyzer (EuroEA 3000, HEKAtech GmbH, Germany) that combusted 10–20 mg aliquots of each sample in a tin capsule calibrated with a sulfanilamide standard (C = 41.75±0.17 %; N = 16.26±0.22 %; S = 18.64±0.18 %) and BBOT (2.5-Bis(5-tert-butyl-benzoxazol-2-yl)thiophene); C = 72.52 %; N = 6.51 %; S = 7.44 %). All samples were decarbonated using 0.1 M HCL (hydrochloric acid) prior to analyses. The quality of the measurements was controlled by three CRMs, NIST 1515 apple leaves (N = 2.25±0.19 %), NCG DC 73030 Chinese soil (C = 0.617±0.044 %; S = 0.2±0.03 %), MOC soil standard (C = 3.19±0.07 %; N = 0.27±0.02 %; S = 0.043±0.005 %) and sulfanilamide (1 for every 10 analyses).
Mean recoveries for the CRMs in sulfanilamide (n=14) were 99.7 % for C, 98.8 % for N and 106.4 % for S; for the NIST 1515 apple leaves (n=4), they were 95.4 % for N; for the NCG DC 73030 Chinese soil (n=2), they were 97.9 % for C and 108.3 % for S; and for the MOC soil standard (n=4), they were 80 % for N, 99.9 % for C and 106.4 % for S. Average results for the CRMs in sulfanilamide (n=14) were 41.6±2.6 % for C, 16.1±1.2 % for N and ,18.5±1.5 % for S; for the NIST 1515 apple leaves (n=4), they were 2.1±7.3 % for N; for the NCG DC 73030 Chinese soil (n=2), they were 0.6±0.8 % for C and 0.22±1.15 % for S; and for the MOC soil standard (n=4), they were 3.19±0.89 % for C.
3.1 Changes in algal biomass production and redox conditions
Based on the Chl a, pH and O2 concentrations and saturations (Figs. 1 and S2 in the Supplement), the month of April and the months from June to September were defined as periods of high production of algal biomass, with Chl a concentrations between 29 µg L−1 in June and 95 µg L−1 in September (Fig. S2; 12 August Chl a no data), supersaturation of O2 with values between 115 % and 151 % (except at the 2 m depth in June, where the value was 66 %), and high pH values between 8.7 and 9.3 (except at the 2 m depth in June, which was 7.8). The highest pH values occurred in the upper 2 m of the water column (0–2 m) on 12 and 19 August and were 9 and 9.3, respectively (Fig. 1). May and November are defined as periods of low production of algal biomass. In May, the surface pH dropped from 9 to approximately 7.7, while O2 saturation dropped to between 80 % and 86.6 %. Chl a concentrations were 2.5 to 2.8 µg L−1, indicative of low production of algal biomass. The surface water pH dropped to 7.3 after mixing in November, when production of algal biomass was very low (Fig. 1; Chl a n.d.), with correspondingly low O2 saturation throughout the entire water column (mean: 28.8 %).
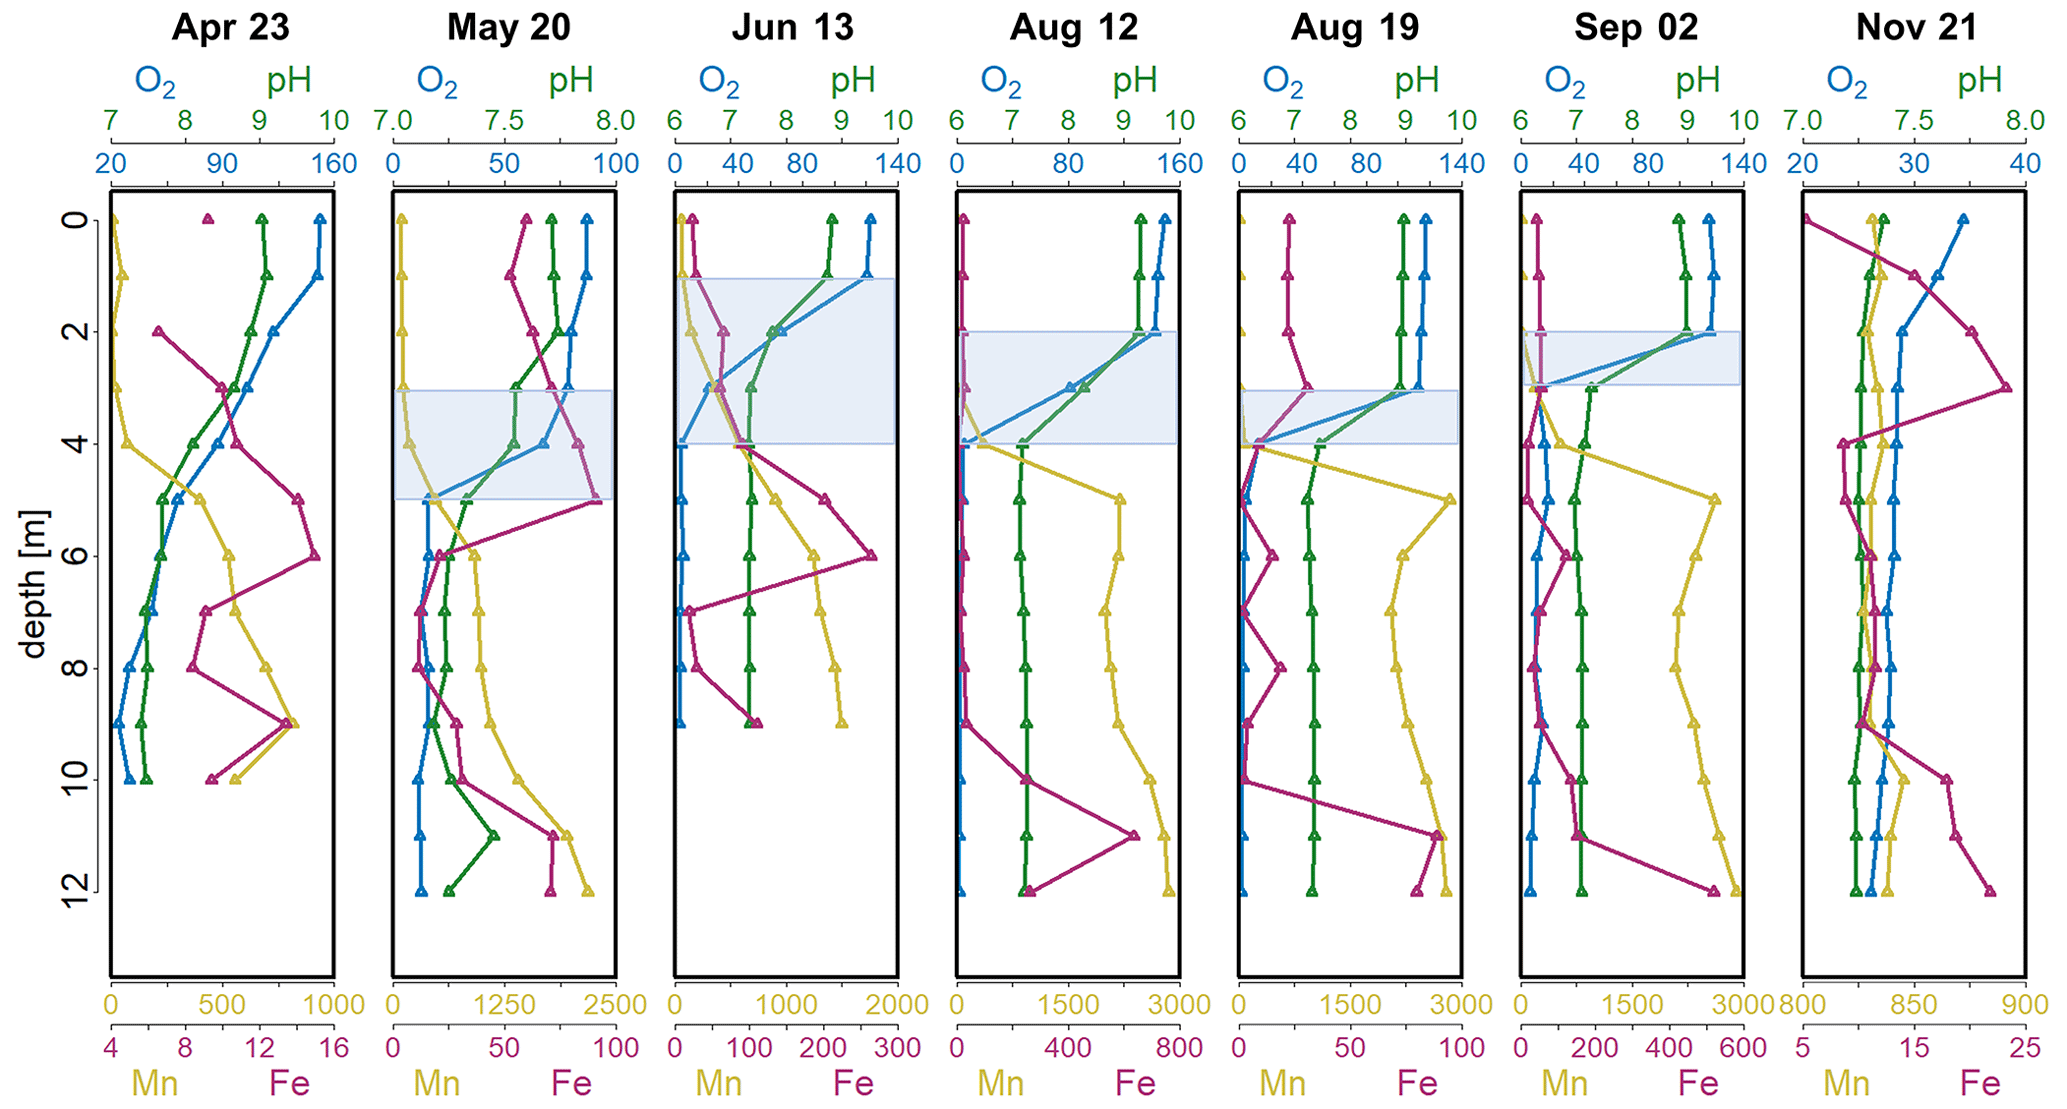
Figure 1Depth profiles of O2 saturation (%), pH and concentrations of dissolved Mn (µg L−1) and Fe (µg L−1) in the Lake Ölper water column from April to November 2019. The depth of the sharp decrease in O2 concentration and the start of Mn reduction (RTZ) are shown in each panel (shaded light blue). Note that each column has an individual scale to better illustrate changes with depth. Depth profiles with the same scale in all columns are shown in the Supplement (Fig. S1).
The decrease in pH and O2 saturation with depth indicates the zone where OM respiration and other oxidative processes begin to exceed primary production and where the onset of related changes in redox conditions occur. Bacteria use a fixed sequence of alternative electron acceptors for OM mineralization (O2 > NO ∼ Mnox > Feox > SO; Froelich et al., 1979). Thus, the progressive decay of sinking OM is indicated by the concentration profiles of O2, dissolved NO, dissolved Mn and Fe. Lake Ölper shows a clinograde seasonal depth profile of dissolved O2 from April to September, with a sharp oxycline that started to develop in May at a depth of approximately 4 m (Fig. 1). The oxycline occurs at variable depths within the first 4 m until September, when there is a decrease in O2 saturation to less than 10 % within 1–3 m. There is an increase in Mn concentrations in the zone where the sharp drop in O2 saturation occurs. This section of changing electron acceptors is hereafter defined as the redox transition zone (RTZ), where the transition from oxic to suboxic conditions occurs. The position (1–4.5 m) and thickness (1–3 m) of the RTZ changed throughout the sampling period and were controlled by the intensity of algal biomass production in the surface layer and its progressive decay during sinking. Mn reduction was first detected in April and then increased and ascended in the water column from May to September, whereas Fe reduction was only detectable below ∼ 8 m in May and below 9 m in August and September. After mixing in November, the Mn and Fe concentrations were generally low (Fig. 1). This indicates that, during the period of high algal biomass production, the amount of algal biomass and OM decay facilitated Mn and, to a lesser extent, Fe reduction (Fig. 1), whereas SO reduction was not observed during the entire sampling period (Fig. S3).
3.2 Decomposition of OM in the water column as indicated by ratios
Carbon-to-nitrogen ratios () in lake sediments or seston are commonly used to distinguish between autochthonous- and allochthonous-derived OM. The seston ratio in Lake Ölper showed a median of 6.4 (n=42; 4–8.3, excluding two outliers with values of 12.6 and 16.3 in bulk-sampled seston in August; Fig. 2), indicating plankton as the dominant OM source (Müller, 1977). However, for water column seston samples on individual days, relative changes in ratios in seston can be used as an indicator for OM degradation (Meyers and Lallier-Vergés, 1999). In the photic zone, ratios decreased slightly with depth, which may indicate selective C mineralization under oxic conditions and relative enrichment of N. Under suboxic conditions, ratios were lowest within the RTZ before they strongly increased again within or below the RTZ (Fig. 2), which may be induced by preferential decomposition of nitrogen-rich proteins resulting in a relative enrichment in C (though this was not observed in September). The decomposition of seston during vertical transport in the water column must be divided into zones of aerobic and anaerobic decay, as suggested by Oguz et al. (2000), with the transition zone (RTZ) in between. The sharp increase in the ratio within or just below the RTZ visible in June, August and, to a lesser extent, May marks the greatest change in the ratio along the water column, suggesting that microbial decomposition and the alteration of OM were more intense within and just below the RTZ compared to in the layers above. It is generally accepted that the ratio of planktonic OM increases steadily while decomposing and sinking down to the sediment (Gordon, 1971; Müller, 1977). Despite the relatively higher loss of N, both C and N strongly decreased within and below the RTZ in June, on 12 and 19 August, and in September, while S increased (Fig. 2). Samples collected below the RTZ in June, on 12 and 19 August, and in September, had C and N concentrations and ratios that were similar to those observed in the sediment trap material (Fig. 1) and the upper sedimentary layer (0–2 cm – C: 8.8 %; N: 0.7 %; S: 0.8 %; : 12.76). Thus, we assume that decomposition appeared to decrease further below the RTZ as OM became more refractory with decomposition. Similar to Lake Ölper, a maximum of OM decomposition beneath the bottom of the euphotic zone was reported by Saino and Hattori (1987). Such a thin layer with enhanced microbial activity is likely caused by changing redox acceptors and the aggregation of labile OM enriched by nutrients accumulating in areas with neutral buoyancy, which was likely induced by water column stratification during phytoplankton blooms (Schartup et al., 2015a). In April, the increase in decomposition-related ratios occurred continuously below 4 m when O2 saturation was still relatively high (see also the change in color of the seston from a light green to a darker green-brownish color at ∼ 6 m; Fig. S8). Here, no decomposition maximum, as indicated by a sharp change in the ratio, could be observed because the neutral buoyancy induced by water column stratification was not sufficiently developed. The ratios in seston indicate that degradation of OM generally occurs quickly within and just below the RTZ and probably more slowly below the RTZ. This may indicate that the influence of OM decomposition on MeHg and THg concentrations is strongest within and just below the RTZ.
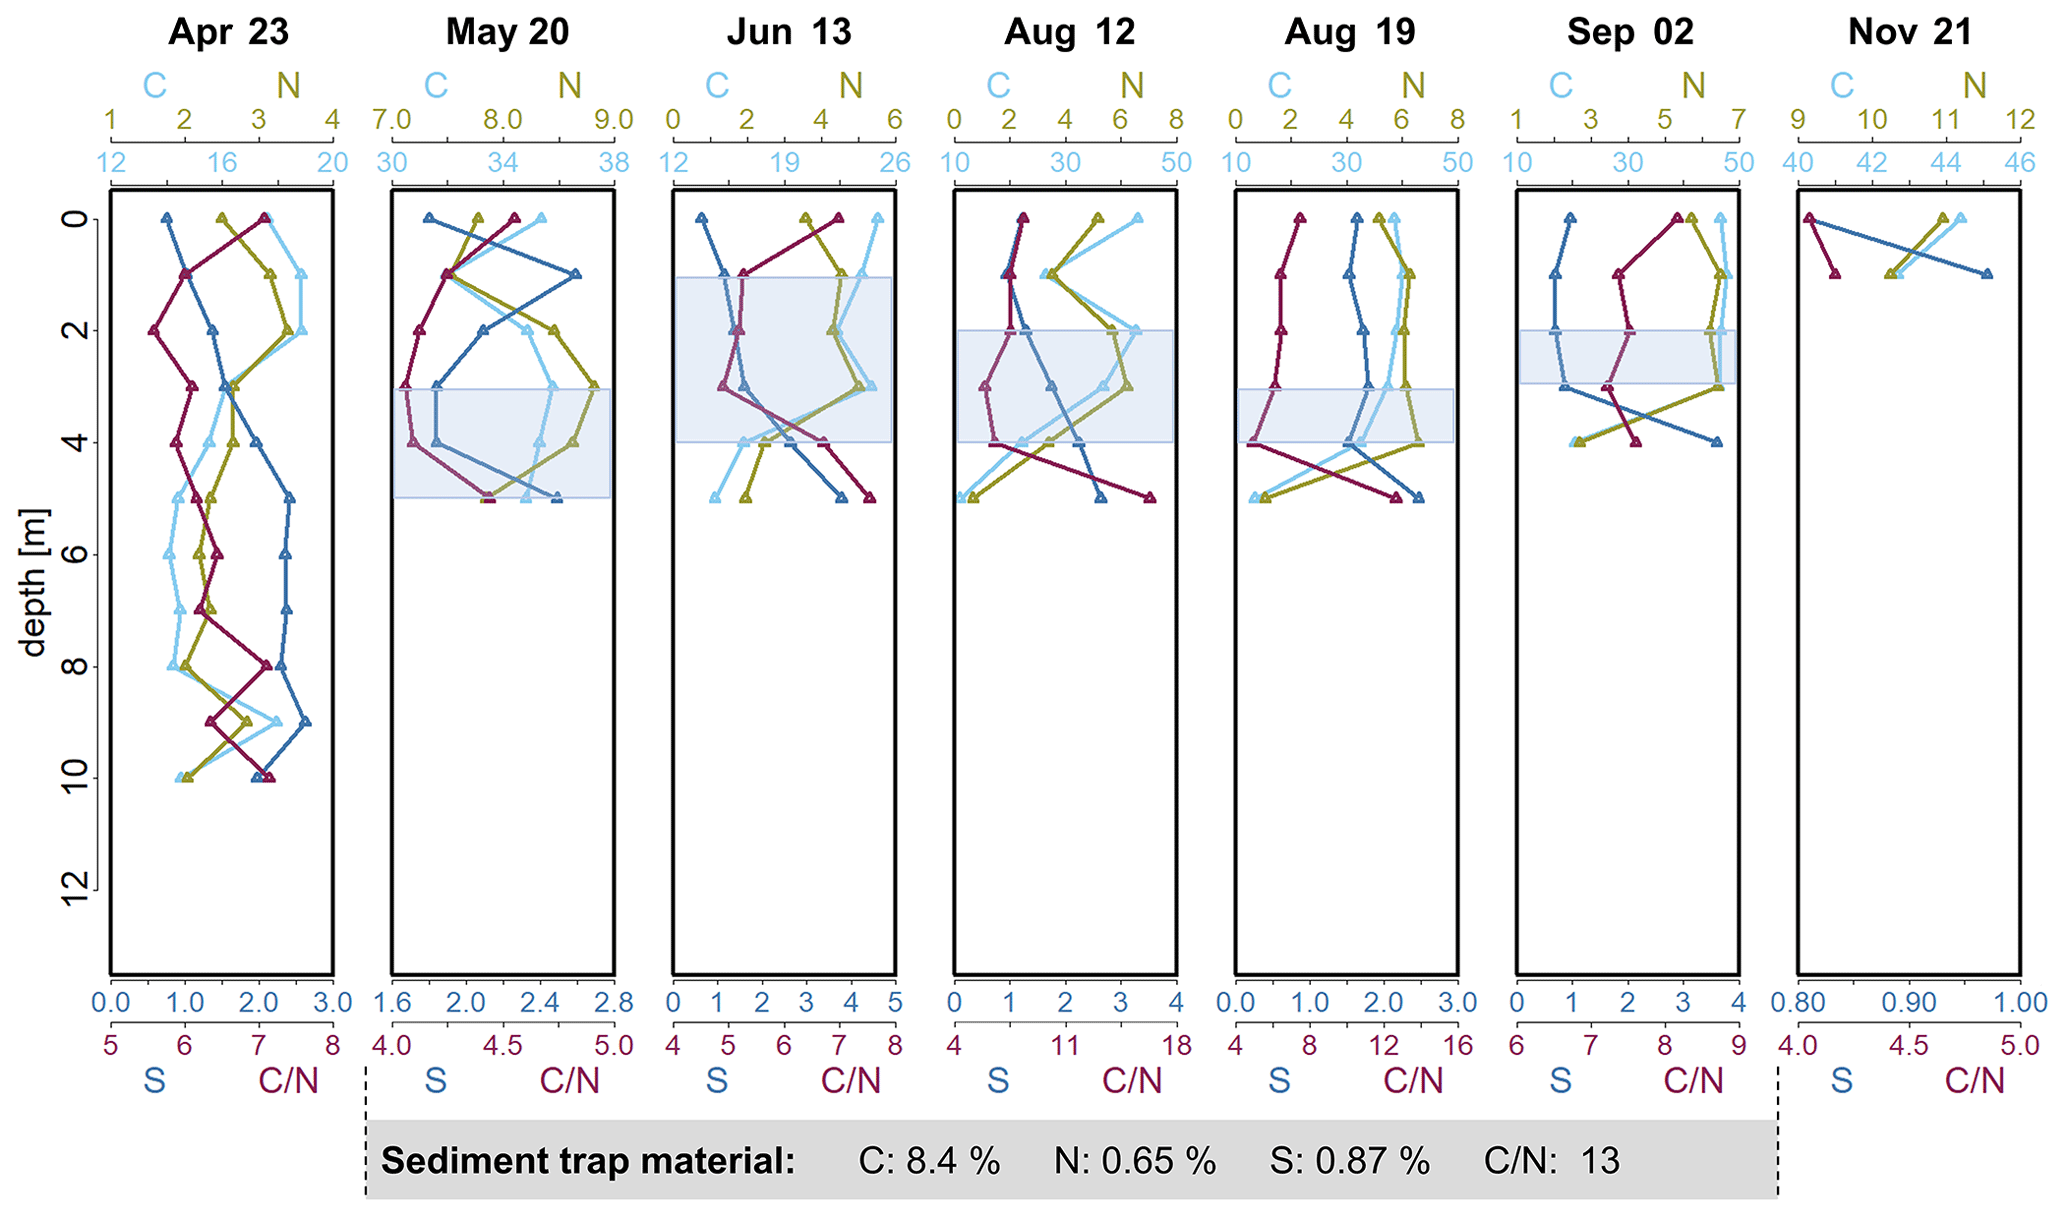
Figure 2Depth profiles of C (%), N (%) and S (%) concentrations and calculated ratio in the seston in Lake Ölper from April to November 2019. The depth of the sharp decrease in O2 concentration and the start of Mn reduction (RTZ) are shown in each panel (shaded light blue). Concentrations of C (%), N (%) and S (%) and the ratio of the sediment trap material collected during the 141 d between 6 May and 24 September are given in the gray box below. Note that each column has an individual scale to better illustrate changes with depth. Depth profiles with the same scale in all columns are shown in the Supplement (Fig. S4).
3.3 Spatial and temporal distributions of MeHg and THg
The seston MeHg concentration in the upper water layer (upper 2 m) was 1.6 to 2.8 ng g−1 in April and 32 to 48 ng g−1 in November (corresponding to 0.5 % and 2.0 % of MeHg of THg in April and 13 % and 18.6 % in November (MeHg-%)), respectively (Fig. 3). April, June, August and September, when algal biomass production was high, showed comparatively low MeHg concentrations (1.6–11.4 ng g−1) in the upper 2 m. Higher MeHg concentrations were found in May and November (15.6–48 ng g−1) when lower pH (<7.7) indicated low algal biomass production (Figs. 1, 3 and 4). Seston samples from the period of low algal biomass production (May and November) were likely dominated by zooplankton, as the samples from the upper water layers showed a significantly higher N content and thus lower ratios (N: 7.5 %–11 %; : 4.0–4.5) than seston from April, June, August and September (N: 2.5 %–6.5 %; : 5.2–8.3; Figs. 4 and S8). This would explain the comparatively higher MeHg in periods of low algal biomass production, as biomagnification from phytoplankton to zooplankton is known to increase MeHg concentrations (Wang et al., 2018).
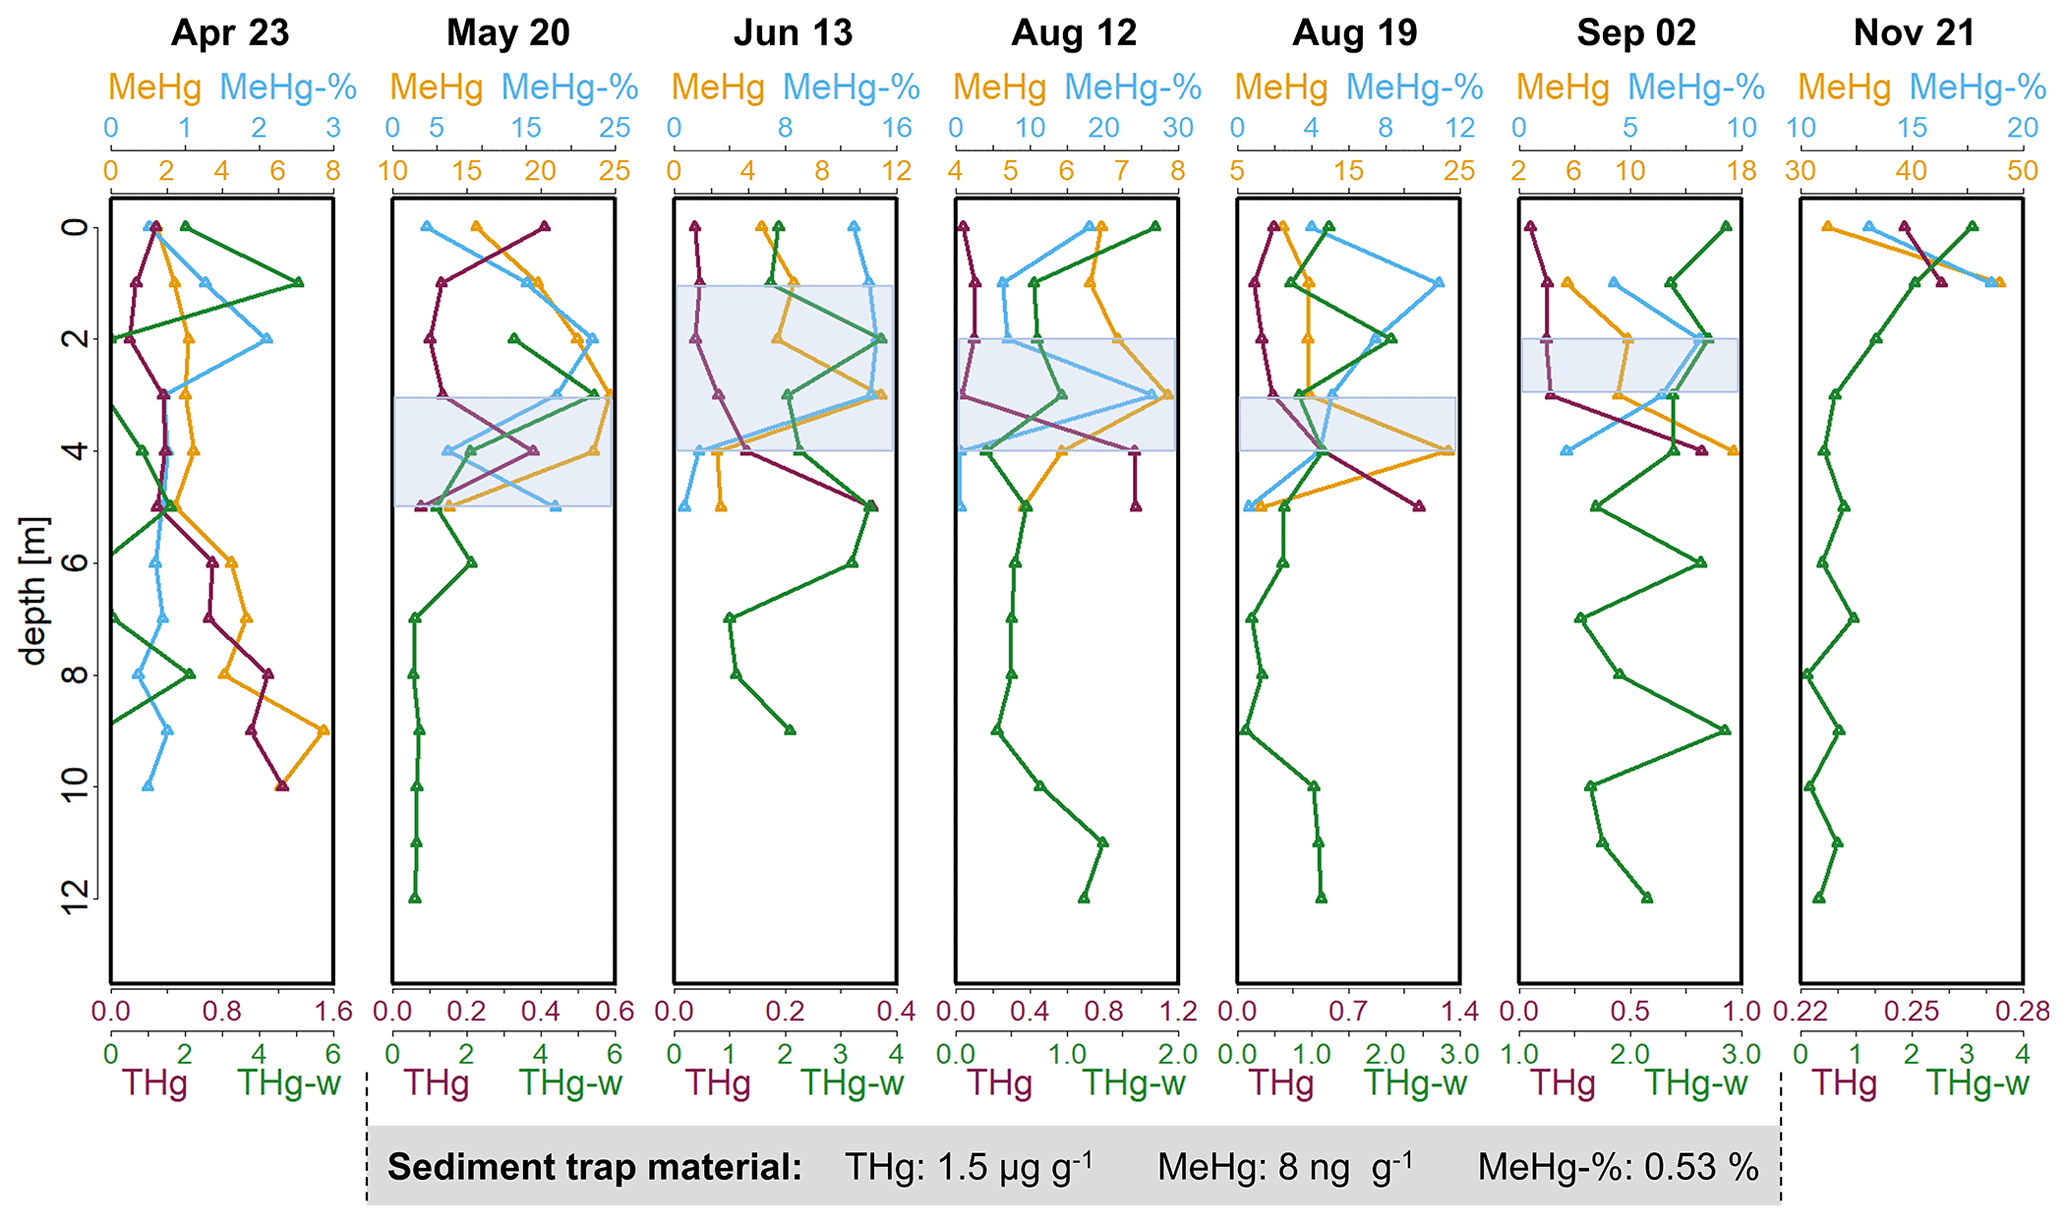
Figure 3Depth profiles of MeHg (ng g−1) concentrations, percentage of MeHg (%) of THg (MeHg-%), THg concentrations in seston (µg g−1) and dissolved THg (ng L−1) in the water column (THg-w) of Lake Ölper from April to November 2019. The depth of the sharp decrease in O2 concentration and the start of Mn reduction (RTZ) are shown in each panel (shaded light blue). Concentrations of THg (µg g−1), MeHg(ng g−1) and MeHg-% (%) of the sediment trap material collected over the 141 d between 6 May and 24 September are given in the gray box below. Note that each column has an individual scale to better illustrate changes with depth. Depth profiles with the same scale in all columns are shown in the Supplement (Fig. S5).
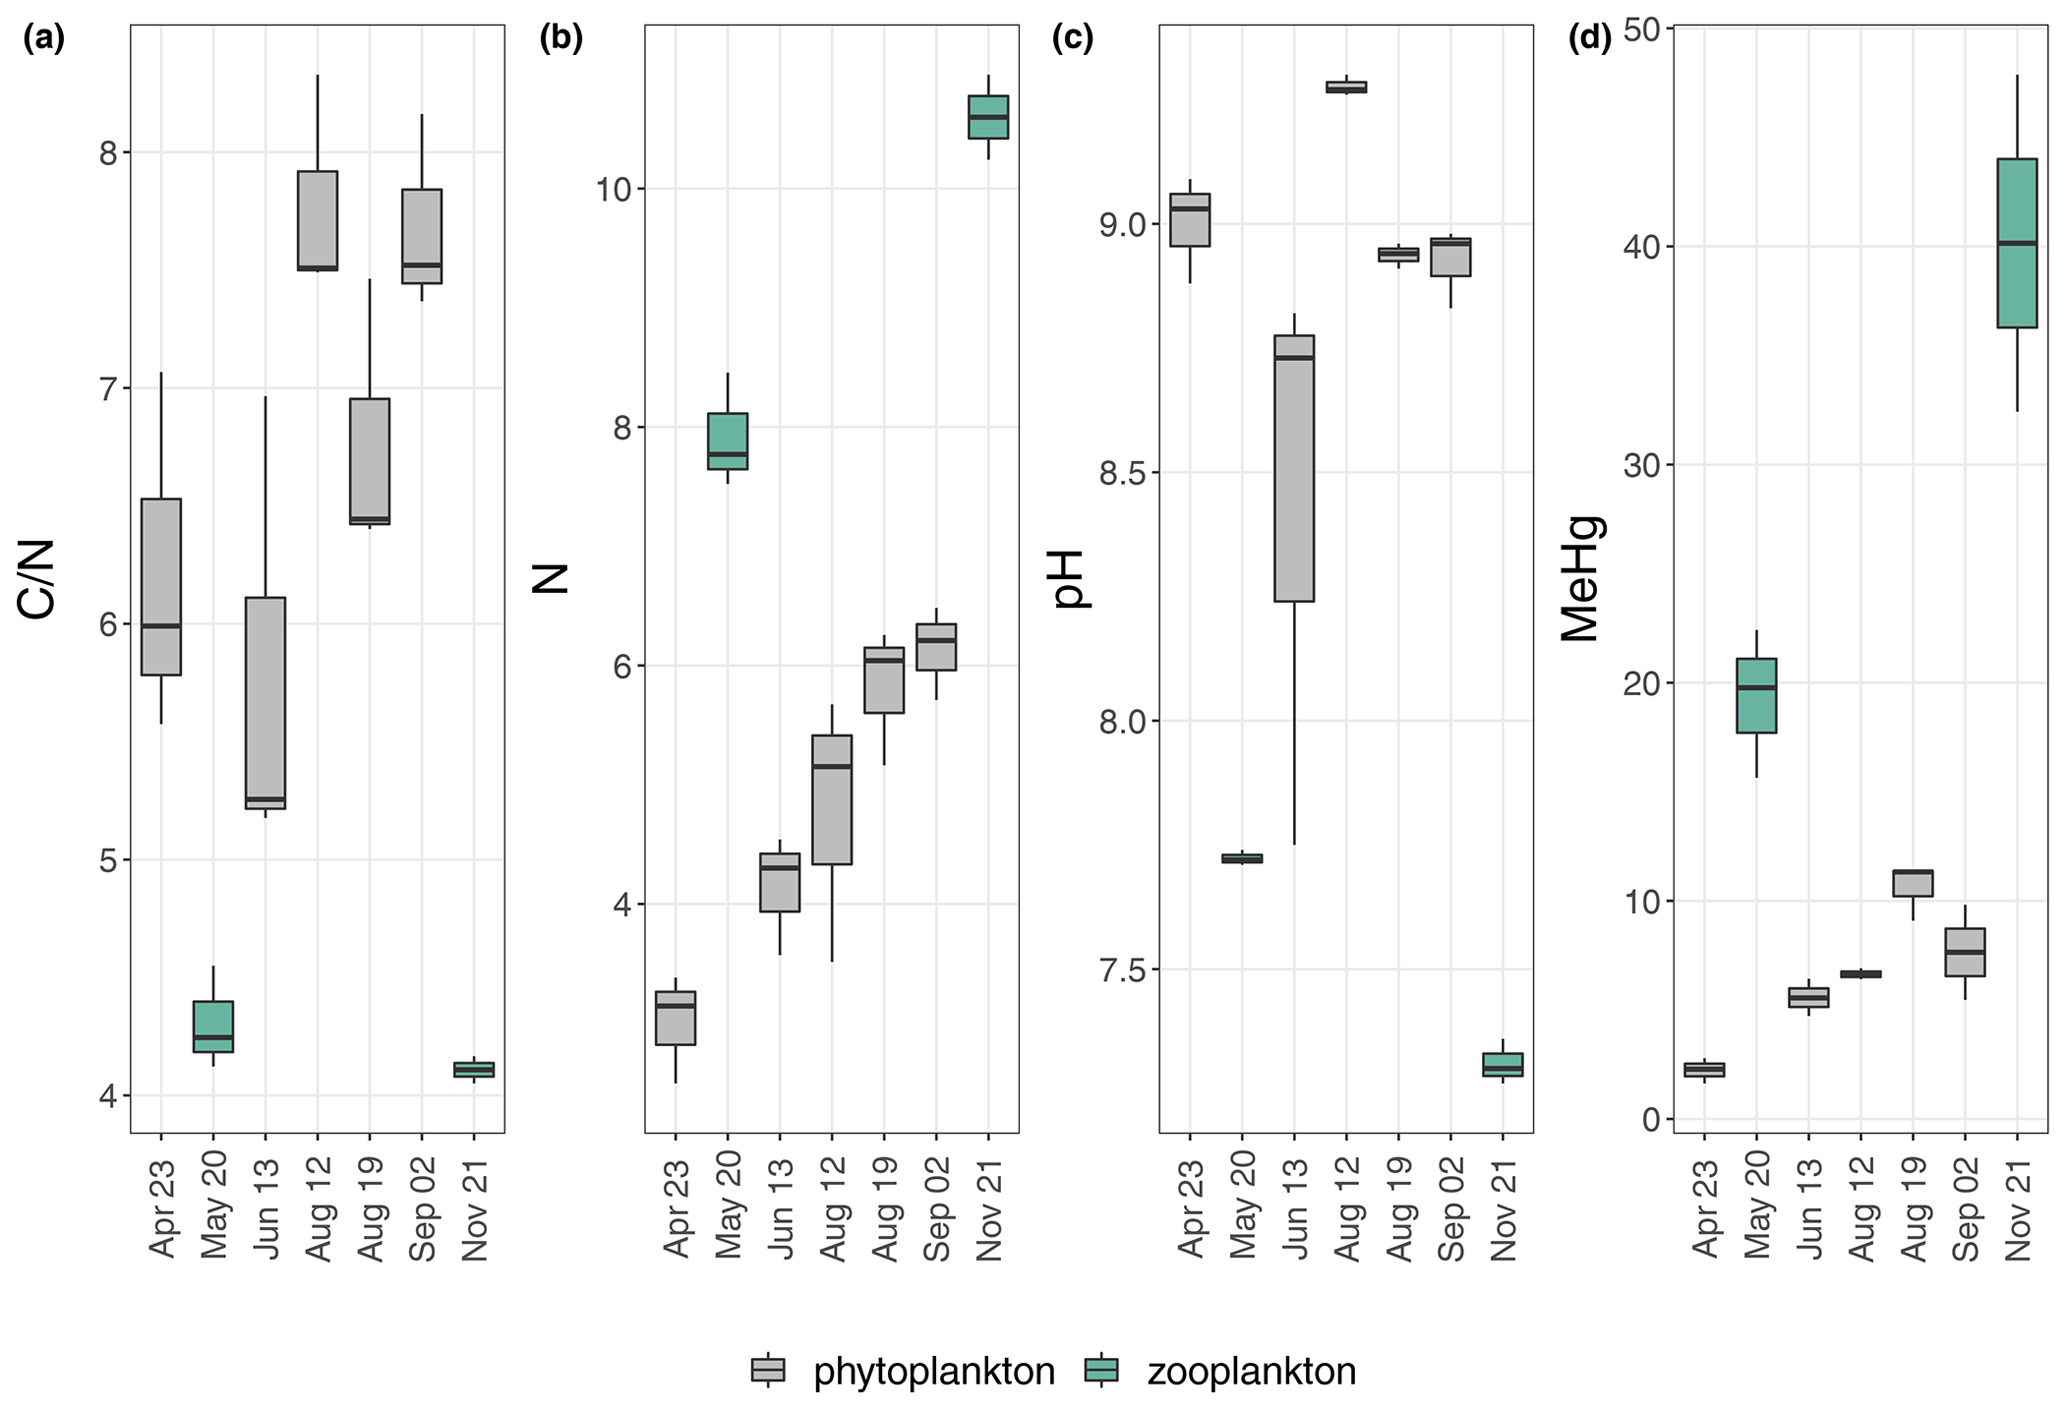
Figure 4 ratio (a), N concentration (%) (b), pH (c) and MeHg concentration (ng g−1) (d) of the individual sampling days from the upper 2 oxic meters (0; 1; 2 m). Colors indicate differences in plankton dominance; green symbolizes higher amounts of zooplankton; gray symbolizes higher amounts of phytoplankton. The relative dominance of zooplankton was estimated from visible inspection and from pH only.
It has been reported, mainly based on laboratory experiments, that MeHg concentrations in algae material are lower when algal biomass is high (biodilution; Chen and Folt, 2005; Pickhardt et al., 2002). However, biodilution seems to be of minor importance in Lake Ölper. In April, when no RTZ was established, MeHg concentrations showed a continuous increase with depth as O2 concentrations decreased and had a comparatively low maximum of 7.6 ng g−1 at 9 m depth (Fig. 3). Biodilution might explain the simultaneous increase in MeHg and THg concentrations and the decrease in algal biomass (Chl a) with depth here, where redox zonation was not pronounced throughout the entire water column (Fig. S2). However, we assume that the observed increase in MeHg and THg concentrations with depth in April are caused by mass loss in the sinking seston during decomposition and decreasing redox potential rather than by biodilution in the epilimnion. Furthermore, September has the highest algal biomass (indicated by the highest Chl a concentration) but does not have the lowest MeHg concentrations. In contrast, September has a higher MeHg concentration than April, June and 12 August. These high MeHg concentrations could not be explained by the abundance of high amounts of zooplankton, as relatively high ratios (compared to May and November) indicate that the seston here are dominated by algal OM. Similarly, algal biomass production (Chl a) is relatively lower in June and so are MeHg and THg concentrations. This positive relationship between algal biomass and MeHg and THg concentrations clearly indicates that biodilution could not explain the observed spatial and temporal variation in MeHg and THg concentrations in our lake.
During periods in which the RTZ was clearly defined, MeHg concentrations in seston showed a maximum within or directly below the RTZ that did not occur in April and November, when no RTZ was observed (Fig. 3). Thus, from May to September, MeHg concentrations showed a continuous increase from the lake's surface to the RTZ or the layer slightly below the RTZ, where the values peaked (Fig. 3). On those days where we were able to get sufficient material for analyses, MeHg concentrations decreased 1.3- to 4.4-fold, even though the water column became progressively anoxic. The high MeHg concentrations at the RTZ could be explained by settling seston that agglomerate with other particles to form larger aggregates within the RTZ (neutral buoyancy induced by water column stratification; Schartup et al., 2015a). Larger particles may form anoxic microniches, providing a thin vertical layer of high Hg methylation and biological activity, as suggested in other studies (Gascón Díez et al., 2016; Schartup et al., 2015a; Ortiz et al., 2015; Gallorini and Loizeau, 2022). It was shown in previous studies that anaerobic conditions can be formed in the center of marine snow, even if the aggregation contains photosynthetic active organisms (Alldredge and Cohen, 1987; Shanks and Reeder, 1993). We did not distinguish the relative contributions of plankton and abiotic particles in our seston samples. We suggest that the seston samples from the surface contain higher amounts of living plankton than samples from the RTZ and that the hypolimnion that contain higher amounts of dead detritus and abiotic particles as oxygen got depleted with depth. Anaerobic conditions are more likely to form the larger the particles and the less photosynthetically active the particles are (e.g., in the dark; Alldredge and Cohen, 1987). In April, when no RTZ and no stratification-induced neutral buoyancy were observed, the formation of aggregates and the development of anoxic MeHg microniches was unlikely. As mentioned above, the continuous increase in MeHg and THg concentrations with depth, as opposed to the pronounced middle water column maximum, is attributed to mass loss during decomposition of seston and to the fact that redox conditions became increasingly anoxic with depth (compare dissolved O2, Fe and Mn concentrations in Fig. 1). A similar observation of continuously increasing THg and MeHg concentrations with depth was reported by Gallorini and Loizeau (2022) in oligotrophic Lake Geneva, where O2 saturation throughout the entire water column is always above 20 %, comparable to the situation in Lake Ölper in April. However, we cannot exclude MeHg release from the sediment here.
There might be other explanations for the MeHg midwater maximum that we cannot completely exclude, but we assume those to be less important than the formation of MeHg in anoxic microniches. For example, MeHg might be transported by diffusion from other sources, such as bottom sediments or the littoral zone, into the RTZ. This appears to be less likely, as the depth profiles of O2, Fe, Mn, pH and EC, as well as DOC (Fig. S6) concentrations, indicate that mixing is minor during times of high algal biomass production. MeHg released from bottom sediments is known to be bound to DOM, as chloride concentrations in lakes are too low to be competitive. The DOC profiles (Fig. S6) clearly indicate that DOC release from the sediment occurs in May, August and September, as indicated by the increasing DOC concentrations found in the deepest water samples. However, the lowest DOC concentrations were found below the RTZ, which indicates that DOC is unlikely to be transported by diffusion from the sediment into and above the RTZ.
Even if MeHg is released from decaying OM in the uppermost sediment layers, it appears not to be distributed in the water column in times of RTZ formation. It may be released into the water column only during or shortly after the mixing of the lake (e.g., in April). However, DOC concentrations were even higher in the upper water layers compared to the DOC minimum in the hypolimnium, indicating DOC release from decomposing algae OM, which suggests MeHg formation in the water phase (labile-algae-derived DOM supports microbial MeHg formation in the water phase) rather than uptake of MeHg released from the sediments. Moreover, Hammerschmidt and Bowman (2012) suggested that there might be other methylators not yet identified that are able to methylate Hg even under oxic or suboxic conditions. Another explanation could be that the MeHg concentration maxima observed in the RTZ may lie within the habitat of herbivorous and predatory zooplankton that graze the algal biomass. Higher amounts of zooplankton would increase the MeHg concentration in our seston sample due to biomagnification from phytoplankton to zooplankton. However, the increase in N concentrations with depth was relatively small (between a 1.1- and 1.4-fold increase from the surface to the highest N concentration in the RTZ) compared to changes in N concentrations between individual sampling days (up to a 4.4-fold increase at the surface layer; Fig. 2). Thus, zooplankton occurrence appears to increase MeHg concentrations between individual sampling days, but the effect within individual depth profiles is likely minor and impacts the MeHg maxima in the RTZ only marginally. Thus, changes in N and C concentrations with depth are predominantly a result of OM decomposition.
The reasons for the high proportion of MeHg in the seston of the surface layer above the RTZ (up to 22 %) when O2 saturation was high is unknown. At high O2 concentrations in the surface layers, the flux of O2 into settling particles is assumed to be higher than the consumption of O2 inside the particle. The conditions in the RTZ in Lake Ölper are favorable for the formation of anoxic microniches, whereas at the surface layer, oxygen concentrations related to the photosynthetic activity of the plankton are assumedly too high and the size of the particles too small for the formation of anoxic microniches. One possible explanation is that, due to vertical mixing above the RTZ, MeHg produced in the RTZ may be transported to the surface layer, where it is taken up or adsorbed by phytoplankton (Kirk et al., 2008). This would explain the elevated MeHg-% even under supersaturated O2 concentrations in the surface layer.
We suggest that the MeHg midwater maximum in Lake Ölper results from enhanced microbial activity at strong redox gradients related to high biomass production in the surface layers and intense decomposition at layers with neutral buoyancy. The midwater maxima near the surface and the euphotic zone are likely to enhance MeHg exposure to the lacustrine food web.
3.4 Changes in ratios in seston along redox gradients
The median THg concentrations in the seston were 0.2 µg g−1 (0.03–1.2 µg g−1), with 0.13 µg g−1 above the RTZ and 0.36 µg g−1 within and below the RTZ (Fig. 3). In 5 out of 7 sampling days (excluding May and November), THg concentrations clearly increased from the surface to the deepest sampling point where sufficient material for the analyses could be obtained by factors of 3.8–26.4, with the highest increase occurring within or especially below the RTZ. Gallorini and Loizeau (2022) also observed a continuous increase of THg in sinking seston in a deep oligotrophic lake where no formation of an RTZ occurred. The greatest enrichment was observed in September, when THg concentrations were specifically low in seston from the surface layer. Due to the concentrations of dissolved Hg in the water column of Lake Ölper being relatively constant and low over time and throughout the lake, we conclude that water-phase Hg is unlikely to be the major source of Hg enrichment in sinking seston. Concomitant with the THg enrichment, C was depleted 1.2- to 3.9-fold, and N was depleted 1.2- to 7.7-fold. This loss of mass (loss of N and C) during OM decomposition indicates that THg is somewhat relatively enriched in seston as a result of mass loss.
As discussed in the previous section, the MeHg concentration showed a midwater maximum resulting from enhanced methylation at strong redox gradients (Fig. 3), which is different from the continuous increase in MeHg concentration with depth observed by Gallorini and Loizeau (2022) in Lake Geneva, where redox zonation was absent. We hypothesize that, above the midwater maximum, MeHg progressively accumulates in sinking seston from the water phase until it reaches the redox boundary, where it accumulates in areas where neutral buoyancy is induced by water column stratification. The decreasing MeHg concentration below the midwater maximum cannot be explained by decreasing MeHg production alone. Otherwise, we would expect a relative enrichment of MeHg in seston due to C loss, as observed for THg.
The varying MeHg concentrations in seston also cannot be explained by changing dissolved organic carbon (DOC) concentrations (r=0.03; p=0.84). However, recent studies have shown that fresh algae-derived dissolved organic matter (DOM) can enhance MeHg uptake (Schartup et al., 2015b). Due to the absence of continuous inflow, DOM in Lake Ölper is mainly produced in situ by seston decomposition, since the catchment influx is low. DOM may play a crucial role in MeHg uptake in oligotrophic lakes or lakes with high catchment runoff, but it does not appear to play a crucial role in Lake Ölper. Hence, there must have been a loss of MeHg from the seston within and below the RTZ, which reduces MeHg in the sinking seston. Although we did not determine demethylation rates directly, we conclude that OM decomposition in seston is accompanied by intense MeHg demethylation, during which Hg is released into the water or remains and is reabsorbed by seston in a different Hg form. The increase in THg concentrations in the seston within and below the RTZ supports the latter hypothesis.
It is unknown how Hg is bound in degraded OM. Although SO reduction was not observed in the water phase of Lake Ölper during the sampling period, it has been shown that microbial SO reduction, which produces sulfide, occurs in settling particles within oxygen-deficient zones and in microenvironments within the center of suspended particles (Raven et al., 2021; Shanks and Reeder, 1993). The sulfide produced may form insoluble complexes with Hg (Shanks and Reeder, 1993; Bianchi et al., 2018), such as Hg sulfides (HgS), meaning that Hg becomes less available for methylation (Zhang et al., 2012). Recently, Liang et al. (2022) have shown that sunlight facilitates the transformation of Hg in algal cells to less bioavailable species such as β–HgS and Hg–phytochelatins. Thus, as S concentrations in the sinking seston of Lake Ölper strongly increase, within and especially below the RTZ (Fig. 2), the formation of Hg sulfides appears likely.
3.5 THg and MeHg in sediment traps and the upper bottom sediment layers
Seston that settled in the sediment trap contained 1.5 µg g−1 THg and 7.8 ng g−1 (0.5 %) MeHg. The un-decomposed seston from the upper 2 m exceeded the MeHg concentration in the sediment trap material by a factor of 1.2 (median) and up to 3-fold in the RTZ. The uppermost layer of lake bottom sediment (0–2 cm) shows THg (2.2 µg g−1) and MeHg (5.86 ng g−1) concentrations comparable to those of the sediment trap material. However, with values of 39 ng g−1 (2–4 cm) and 26 ng g−1 (4–6 cm), the deeper sediment layers show higher MeHg concentrations at similar THg concentrations (2.06 and 1.96 µg g−1) than the trap material, which indicates that, in deeper sediment layers, there might be Hg methylation independent of the Hg methylation of the water column and/or fluxes to the water that are lower than methylation rates.
On the other hand, THg was up to 41 times higher in the sediment trap material than in seston recovered from the upper 2 m (0.04–0.4 µg g−1) and between 1.3 and 20 times higher than in the seston (0.08–1.2 µg g−1) sampled below the first 2 m. The MeHg and THg concentrations and proportions in the deepest seston samples indicate that, the closer to the sediment the seston was collected, the closer the chemical composition (C and N concentrations) and the ratio were to that of the surface sediments. In-trap mineralization may further increase the relative enrichment of THg and the loss of MeHg compared to seston at the water surface. Assuming a linear regression of OM fraction loss of −0.001864 per day, as calculated by Radbourne and Ryves (2020), the initial OM content in our sediment trap material may be reduced by 26.3 % after 141 d. This highlights the importance of water column OM decomposition in relation to MeHg cycling in lakes and the need for seston sampling at high spatial and temporal resolutions, since sediment traps do not represent all the potential variations in Hg and MeHg cycling in lakes. Hg scavenging and OM decomposition control which Hg species are transported from surface euphotic waters into deeper water and sediments, as well as the extent to which this occurs. Due to the absence of water mixing during summer stagnation, the decreasing MeHg concentration in seston below the RTZ and the comparable low MeHg concentration in the sediment trap material, MeHg derived from sediments is unlikely to be the major source of the MeHg in seston, specifically during periods of high production of algal mass. Thus, in this small eutrophic lake, the epilimnetic pathway is likely to be of greater importance for MeHg bioaccumulation in the trophic web than the MeHg benthic–hypolimnetic pathway. Additionally, even in this comparatively shallow lake, both MeHg pools appear to be largely disconnected, as suggested by Gallorini and Loizeau (2021) and Gallorini and Loizeau (2022) for deep oligotrophic lakes.
Our data derived from water and seston samples taken from eutrophic Lake Ölper over an 8-month period (April and November) indicate that algal biomass production and summer stratification strongly control MeHg concentration and proportions in seston within the oxic and suboxic water column. Biomagnification of MeHg was observed in May and November when algal mass production was low, and the seston appears to be dominated by zooplankton. MeHg biodilution during periods of high algal matter production could not be observed. In contrast, during periods of high algal matter production, Hg concentrations in seston were highest when algal biomass production was high and when ratios indicated a minor occurrence of zooplankton. NO and Mn reduction occurs around the RTZ, whereas Fe reduction was only detectable in the deepest water layers, and sulfate reduction, typical for Hg methylators, did not occur in the water phase. The intensity of algal biomass production, OM decomposition along redox gradients in the water column and the formation of anoxic microniches in seston appear to be major controls for MeHg and THg concentrations in seston. We further conclude that the decomposition of labile OM and the demethylation or loss of MeHg within the RTZ exert a stronger influence on MeHg concentration in seston transported to the sediment than MeHg formation under anoxic conditions below the RTZ. Water column MeHg formation and degradation in eutrophic lakes appears to be intense and fast. Although dissolved MeHg has not been measured, the distribution of DOC and dissolved Hg in the water column suggests that MeHg fluxes from the sediments are of minor importance in this eutrophic lake, specifically during periods of high algal biomass production. Our study suggests that, in shallow eutrophic lakes, the water-phase formation and decomposition of MeHg is intense and controlled by the decomposition of algal biomass and is assumedly largely disconnected from Hg methylation in sediments, similar to what has been observed in deep oligotrophic lakes.
The authors declare that all data supporting the findings of this study are available within the paper and its Supplement.
The supplement related to this article is available online at: https://doi.org/10.5194/bg-20-1459-2023-supplement.
LB and HB designed the study. LB, CBS and SJ carried out the laboratory work. LB carried out all sampling and data analyses. LB and HB wrote the paper, and all the authors edited and revised the paper.
The contact author has declared that none of the authors has any competing interests.
Publisher’s note: Copernicus Publications remains neutral with regard to jurisdictional claims in published maps and institutional affiliations.
We acknowledge the help of Marta Pérez Rodríguez, Lena Sept, Annika Prüßner and Katja Braun during the field work, and we acknowledge Petra Schmidt and Adelina Calean for their help in the sample preparation and laboratory analyses.
This open-access publication was funded by Technische Universität Braunschweig.
This paper was edited by Sebastian Naeher and reviewed by two anonymous referees.
Alldredge, A. L. and Cohen, Y.: Can microscale chemical patches persist in the sea? Microelectrode study of marine snow, fecal pellets, Science, 235, 689–691, https://doi.org/10.1126/science.235.4789.689, 1987.
Bianchi, D., Weber, T. S., Kiko, R., and Deutsch, C.: Global niche of marine anaerobic metabolisms expanded by particle microenvironments, Nat. Geosci., 11, 263–268, https://doi.org/10.1038/s41561-018-0081-0, 2018.
Biester, H., Pérez-Rodríguez, M., Gilfedder, B.-S., Martínez Cortizas, A., and Hermanns, Y.-M.: Solar irradiance and primary productivity controlled mercury accumulation in sediments of a remote lake in the Southern Hemisphere during the past 4000 years, Limnol. Oceanogr., 63, 540–549, https://doi.org/10.1002/lno.10647, 2018.
Bouchet, S., Amouroux, D., Rodriguez-Gonzalez, P., Tessier, E., Monperrus, M., Thouzeau, G., Clavier, J., Amice, E., Deborde, J., Bujan, S., Grall, J., and Anschutz, P.: MMHg production and export from intertidal sediments to the water column of a tidal lagoon (Arcachon Bay, France), Biogeochemistry, 114, 341–358, https://doi.org/10.1007/s10533-012-9815-z, 2013.
Chen, C. Y. and Folt, C. L.: High Plankton Densities Reduce Mercury Biomagnification, Environ. Sci. Technol., 39, 115–121, https://doi.org/10.1021/es0403007, 2005.
Cossa, D., Martin, J.-M., Takayanagi, K., and Sanjuan, J.: The distribution and cycling of mercury species in the western Mediterranean, Deep-Sea Res. Pt. II, 44, 721–740, https://doi.org/10.1016/S0967-0645(96)00097-5, 1997.
Cossa, D., Heimbürger, L.-E., Lannuzel, D., Rintoul, S. R., Butler, E. C., Bowie, A. R., Averty, B., Watson, R. J., and Remenyi, T.: Mercury in the Southern Ocean, Geochim. Cosmochim. Ac., 75, 4037–4052, https://doi.org/10.1016/j.gca.2011.05.001, 2011.
Deutsches Institut für Normung: DIN 38409-60: Deutsche Einheitsverfahren zur Wasser-, Abwasser- und Schlammuntersuchung – Summarische Wirkungs- und Stoffkenngrößen (Gruppe H) – Teil 60: Photometrische Bestimmung der Chlorophyll-a-Konzentration in Wasser (H 60), Beuth Verlag GmbH, 2015.
Eckley, C. S., Watras, C. J., Hintelmann, H., Morrison, K., Kent, A. D., and Regnell, O.: Mercury methylation in the hypolimnetic waters of lakes with and without connection to wetlands in northern Wisconsin, Can. J. Fish. Aquat. Sci., 62, 400–411, https://doi.org/10.1139/f04-205, 2005.
Fleming, E. J., Mack, E. E., Green, P. G., and Nelson, D. C.: Mercury methylation from unexpected sources: molybdate-inhibited freshwater sediments and an iron-reducing bacterium, Appl. Environ. Microb., 72, 457–464, https://doi.org/10.1128/AEM.72.1.457-464.2006, 2006.
Froelich, P. N., Klinkhammer, G. P., Bender, M. L., Luedtke, N. A., Heath, G. R., Cullen, D., Dauphin, P., Hammond, D., Hartman, B., and Maynard, V.: Early oxidation of organic matter in pelagic sediments of the eastern equatorial Atlantic: suboxic diagenesis, Geochim. Cosmochim. Ac., 43, 1075–1090, https://doi.org/10.1016/0016-7037(79)90095-4, 1979.
Gallorini, A. and Loizeau, J.-L.: Mercury methylation in oxic aquatic macro-environments: a review, J. Limnol., 80, https://doi.org/10.4081/jlimnol.2021.2007, 2021.
Gallorini, A. and Loizeau, J.-L.: Lake snow as a mercury methylation micro-environment in the oxic water column of a deep peri-alpine lake, Chemosphere, 299, 134306, https://doi.org/10.1016/j.chemosphere.2022.134306, 2022.
Gascón Díez, E., Loizeau, J.-L., Cosio, C., Bouchet, S., Adatte, T., Amouroux, D., and Bravo, A. G.: Role of Settling Particles on Mercury Methylation in the Oxic Water Column of Freshwater Systems, Environ. Sci. Technol., 50, 11672–11679, https://doi.org/10.1021/acs.est.6b03260, 2016.
Gascón Díez, E., Graham, N. D., and Loizeau, J.-L.: Total and methyl-mercury seasonal particulate fluxes in the water column of a large lake (Lake Geneva, Switzerland), Environ. Sci. Pollut. R. Int., 25, 21086–21096, https://doi.org/10.1007/s11356-018-2252-3, 2018.
Gilmour, C. C., Henry, E. A., and Mitchell, R.: Sulfate stimulation of mercury methylation in freshwater sediments, Environ. Sci. Technol., 26, 2281–2287, https://doi.org/10.1021/es00035a029, 1992.
Gilmour, C. C., Podar, M., Bullock, A. L., Graham, A. M., Brown, S. D., Somenahally, A. C., Johs, A., Hurt, R. A., Bailey, K. L., and Elias, D. A.: Mercury methylation by novel microorganisms from new environments, Environ. Sci. Technol., 47, 11810–11820, https://doi.org/10.1021/es403075t, 2013.
Gordon, D. C.: Distribution of particulate organic carbon and nitrogen at an oceanic station in the central Pacific, Deep-Sea Res. Oceanogr. Abstr., 18, 1127–1134, https://doi.org/10.1016/0011-7471(71)90098-2, 1971.
Grossart, H.-P. and Simon, M.: Limnetic macroscopic organic aggregates (lake snow): Occurrence, characteristics, and microbial dynamics in Lake Constance, Limnol. Oceanogr., 38, 532–546, https://doi.org/10.4319/lo.1993.38.3.0532, 1993.
Hammerschmidt, C. R. and Bowman, K. L.: Vertical methylmercury distribution in the subtropical North Pacific Ocean, Mar. Chem., 132–133, 77–82, https://doi.org/10.1016/j.marchem.2012.02.005, 2012.
Hammerschmidt, C. R., Fitzgerald, W. F., Lamborg, C. H., Balcom, P. H., and Visscher, P. T.: Biogeochemistry of methylmercury in sediments of Long Island Sound, Mar. Chem., 90, 31–52, https://doi.org/10.1016/j.marchem.2004.02.024, 2004.
Heimbürger, L.-E., Cossa, D., Marty, J.-C., Migon, C., Averty, B., Dufour, A., and Ras, J.: Methyl mercury distributions in relation to the presence of nano- and picophytoplankton in an oceanic water column (Ligurian Sea, North-western Mediterranean), Geochim. Cosmochim. Ac., 74, 5549–5559, https://doi.org/10.1016/j.gca.2010.06.036, 2010.
Heimbürger, L.-E., Sonke, J. E., Cossa, D., Point, D., Lagane, C., Laffont, L., Galfond, B. T., Nicolaus, M., Rabe, B., and van der Loeff, M. R.: Shallow methylmercury production in the marginal sea ice zone of the central Arctic Ocean, Sci. Rep., 5, 10318, https://doi.org/10.1038/srep10318, 2015.
Higginson, M. J.: Geochemical Proxies (Non-Isotopic), in: Encyclopedia of Paleoclimatology and Ancient Environments, edited by: Gornitz, V., Encyclopedia of Earth Sciences Series, Springer Netherlands, Dordrecht, 341–354, https://doi.org/10.1007/978-1-4020-4411-3_89, 2009.
Hollweg, T. A., Gilmour, C. C., and Mason, R. P.: Methylmercury production in sediments of Chesapeake Bay and the mid-Atlantic continental margin, Mar. Chem., 114, 86–101, https://doi.org/10.1016/j.marchem.2009.04.004, 2009.
Jensen, S. and Jernelöv, A.: Biological methylation of mercury in aquatic organisms, Nature, 223, 753–754, https://doi.org/10.1038/223753a0, 1969.
Kirk, J. L., St Louis, V. L., Hintelmann, H., Lehnherr, I., Else, B., and Poissant, L.: Methylated mercury species in marine waters of the Canadian high and sub Arctic, Environ. Sci. Technol., 42, 8367–8373, https://doi.org/10.1021/es801635m, 2008.
Lenz, J.: Seston and Its Main Components, in: Microbial Ecology of a Brackish Water Environment, edited by: Billings, W. D., Golley, F., Lange, O. L., Olson, J. S., and Rheinheimer, G., Ecological Studies, Springer Berlin Heidelberg, Berlin, Heidelberg, 37–60, https://doi.org/10.1007/978-3-642-66791-6_5, 1977.
Liang, X., Zhu, N., Johs, A., Chen, H., Pelletier, D. A., Zhang, L., Yin, X., Gao, Y., Zhao, J., and Gu, B.: Mercury Reduction, Uptake, and Species Transformation by Freshwater Alga Chlorella vulgaris under Sunlit and Dark Conditions, Environ. Sci. Technol., 56, 4961–4969, https://doi.org/10.1021/acs.est.1c06558, 2022.
Mauro, J. B. N., Guimarães, J. R. D., Hintelmann, H., Watras, C. J., Haack, E. A., and Coelho-Souza, S. A.: Mercury methylation in macrophytes, periphyton, and water – comparative studies with stable and radio-mercury additions, Anal. Bioanal. Chem., 374, 983–989, https://doi.org/10.1007/s00216-002-1534-1, 2002.
Meyers, P. A. and Eadie, B. J.: Sources, degradation and recycling of organic matter associated with sinking particles in Lake Michigan, Org. Geochem., 20, 47–56, https://doi.org/10.1016/0146-6380(93)90080-U, 1993.
Meyers, P. A. and Lallier-Vergés, E.: Lacustrine Sedimentary Organic Matter Records of Late Quaternary Paleoclimates, J. Paleolimnol., 21, 345–372, https://doi.org/10.1023/A:1008073732192, 1999.
Müller, P.: Ratios in Pacific deep-sea sediments: Effect of inorganic ammonium and organic nitrogen compounds sorbed by clays, Geochim. Cosmochim. Ac., 41, 765–776, https://doi.org/10.1016/0016-7037(77)90047-3, 1977.
Oguz, T., Ducklow, H. W., and Malanotte-Rizzoli, P.: Modeling distinct vertical biogeochemical structure of the Black Sea: Dynamical coupling of the oxic, suboxic, and anoxic layers, Global Biogeochem. Cy., 14, 1331–1352, https://doi.org/10.1029/1999GB001253, 2000.
Ortiz, V. L., Mason, R. P., and Ward, J. E.: An examination of the factors influencing mercury and methylmercury particulate distributions, methylation and demethylation rates in laboratory-generated marine snow, Mar. Chem., 177, 753–762, https://doi.org/10.1016/j.marchem.2015.07.006, 2015.
Peterson, B. D., McDaniel, E. A., Schmidt, A. G., Lepak, R. F., Janssen, S. E., Tran, P. Q., Marick, R. A., Ogorek, J. M., DeWild, J. F., Krabbenhoft, D. P., and McMahon, K. D.: Mercury Methylation Genes Identified across Diverse Anaerobic Microbial Guilds in a Eutrophic Sulfate-Enriched Lake, Environ. Sci. Technol., 54, 15840–15851, https://doi.org/10.1021/acs.est.0c05435, 2020.
Pickhardt, P. C. and Fisher, N. S.: Accumulation of inorganic and methylmercury by freshwater phytoplankton in two contrasting water bodies, Environ. Sci. Technol., 41, 125–131, https://doi.org/10.1021/es060966w, 2007.
Pickhardt, P. C., Folt, C. L., Chen, C. Y., Klaue, B., and Blum, J. D.: Algal blooms reduce the uptake of toxic methylmercury in freshwater food webs, P. Natl. Acad. Sci. USA, 99, 4419–4423, https://doi.org/10.1073/pnas.072531099, 2002.
Radbourne, A. D. and Ryves, D. B.: Experimental assessment and implications of long-term within-trap mineralization of seston in lake trapping studies, Limnol. Oceanogr. Meth., 18, 327–334, https://doi.org/10.1002/lom3.10369, 2020.
Raven, M. R., Keil, R. G., and Webb, S. M.: Microbial sulfate reduction and organic sulfur formation in sinking marine particles, Science, 371, 178–181, https://doi.org/10.1126/science.abc6035, 2021.
Ravichandran, M.: Interactions between mercury and dissolved organic matter – a review, Chemosphere, 55, 319–331, https://doi.org/10.1016/j.chemosphere.2003.11.011, 2004.
Robinson, J. B. and Tuovinen, O. H.: Mechanisms of microbial resistance and detoxification of mercury and organomercury compounds: physiological, biochemical, and genetic analyses, Microbiol. Rev., 48, 95–124, 1984.
Saino, T. and Hattori, A.: Geographical variation of the water column distrubution of suspended particulate organic nitrogen and its 15N natural abundance in the Pacific and its marginal seas, Deep-Sea Res. Pt. A, 34, 807–827, https://doi.org/10.1016/0198-0149(87)90038-0, 1987.
Schartup, A. T., Balcom, P. H., Soerensen, A. L., Gosnell, K. J., Calder, R. S. D., Mason, R. P., and Sunderland, E. M.: Freshwater discharges drive high levels of methylmercury in Arctic marine biota, P. Natl. Acad. Sci. USA, 112, 11789–11794, https://doi.org/10.1073/pnas.1505541112, 2015a.
Schartup, A. T., Ndu, U., Balcom, P. H., Mason, R. P., and Sunderland, E. M.: Contrasting effects of marine and terrestrially derived dissolved organic matter on mercury speciation and bioavailability in seawater, Environ. Sci. Technol., 49, 5965–5972, https://doi.org/10.1021/es506274x, 2015b.
Schütze, M., Gatz, P., Gilfedder, B.-S., and Biester, H.: Why productive lakes are larger mercury sedimentary sinks than oligotrophic brown water lakes, Limnol. Oceanogr., 66, 1316–1332, https://doi.org/10.1002/lno.11684, 2021.
Shanks, A. L. and Reeder, M. L.: Reducing microzones and sulfide production in marine snow, Mar. Ecol.-Prog. Ser., 96, 43–47, 1993.
Soerensen, A. L., Schartup, A. T., Skrobonja, A., Bouchet, S., Amouroux, D., Liem-Nguyen, V., and Björn, E.: Deciphering the Role of Water Column Redoxclines on Methylmercury Cycling Using Speciation Modeling and Observations From the Baltic Sea, Global Biogeochem. Cy., 32, 1498–1513, https://doi.org/10.1029/2018GB005942, 2018.
Sunderland, E. M., Gobas, F. A., Heyes, A., Branfireun, B. A., Bayer, A. K., Cranston, R. E., and Parsons, M. B.: Speciation and bioavailability of mercury in well-mixed estuarine sediments, Mar. Chem., 90, 91–105, https://doi.org/10.1016/j.marchem.2004.02.021, 2004.
Sunderland, E. M., Krabbenhoft, D. P., Moreau, J. W., Strode, S. A., and Landing, W. M.: Mercury sources, distribution, and bioavailability in the North Pacific Ocean: Insights from data and models, Global Biogeochem. Cy., 23, GB2010, https://doi.org/10.1029/2008GB003425, 2009.
Topping, G. and Davies, I. M.: Methylmercury production in the marine water column, Nature, 290, 243–244, https://doi.org/10.1038/290243a0, 1981.
USGS-Mercury Research Laboratory: Analysis of Methylmercury in Biota by Cold Vapor Atomic Fluorescence Detection with the Brooks-Rand “MERX” Automated Mercury Analytical System, 2016.
Wang, K., Munson, K. M., Beaupré-Laperrière, A., Mucci, A., Macdonald, R. W., and Wang, F.: Subsurface seawater methylmercury maximum explains biotic mercury concentrations in the Canadian Arctic, Sci. Rep., 8, 14465, https://doi.org/10.1038/s41598-018-32760-0, 2018.
Watras, C. J. and Bloom, N. S.: The Vertical Distribution of Mercury Species in Wisconsin Lakes: Accumulation in Plankton Layers, in: Mercury Pollution: Integration and Synthesis, edited by: Watras, C. J. and Huckabee, J. W., Lewis Chelsa, MI, 137–151, 1994.
Watras, C. J., Bloom, N. S., Claas, S. A., Morrison, K. A., Gilmour, C. C., and Craig, S. R.: Methylmercury production in the anoxic hypolimnion of a Dimictic Seepage Lake, Water Air Soil Pollut., 80, 735–745, https://doi.org/10.1007/BF01189725, 1995.
Zaferani, S., Pérez-Rodríguez, M., and Biester, H.: Diatom ooze – A large marine mercury sink, Science, 361, 797–800, https://doi.org/10.1126/science.aat2735, 2018.
Zhang, T., Kim, B., Levard, C., Reinsch, B. C., Lowry, G. V., Deshusses, M. A., and Hsu-Kim, H.: Methylation of mercury by bacteria exposed to dissolved, nanoparticulate, and microparticulate mercuric sulfides, Environ. Sci. Technol., 46, 6950–6958, https://doi.org/10.1021/es203181m, 2012.