the Creative Commons Attribution 4.0 License.
the Creative Commons Attribution 4.0 License.
 | 18 Apr 2023
Carbon emissions and radiative forcings from tundra wildfires in the Yukon–Kuskokwim River Delta, Alaska
Michael Moubarak
Seeta Sistla
Stefano Potter
Susan M. Natali
Brendan M. Rogers
Tundra environments are experiencing elevated levels of wildfire, and the frequency is expected to keep increasing due to rapid climate change in the Arctic. Tundra wildfires can release globally significant amounts of greenhouse gasses that influence the Earth's radiative balance. Here we develop a novel method for estimating carbon loss and the resulting radiative forcings of gaseous and aerosol emissions from the 2015 tundra wildfires in the Yukon–Kuskokwim Delta (YKD), Alaska. We paired burn depth measurements using two vegetative reference points that survived the fire event – Sphagnum fuscum and Dicranum spp. – with measurements of local organic matter and soil carbon properties to estimate total ecosystem organic matter and carbon loss. We used remotely sensed data on fire severity from Landsat 8 to scale our measured losses to the entire fire-affected area, with an estimated total loss of 2.04 Tg of organic matter and 0.91 Tg of carbon and an average loss of 3.76 kg m−2 of organic matter and 1.68 kg m−2 of carbon in the 2015 YKD wildfires. To demonstrate the impact of these fires on the Earth's radiation budget, we developed a simple but comprehensive framework to estimate the radiative forcing from Arctic wildfires. We synthesized existing research on the lifetime and radiative forcings of gaseous and aerosol emissions of CO2, N2O, CH4, O3 and its precursors, and fire aerosols. The model shows a net positive cumulative mean radiative forcing of 3.67 W m−2 using representative concentration pathway (RCP) 4.5 and 3.37 W m−2 using RCP 8.5 at 80 years post-fire, which was dominated by CO2 emissions. Our results highlight the climate impact of tundra wildfires, which positively reinforce climate warming and increased fire frequency through the radiative forcings of their gaseous emissions.
- Article
(9401 KB) - Full-text XML
- BibTeX
- EndNote


The Arctic region is characterized by permafrost soils with low rates of decomposition and high carbon content from millennia of positive net ecosystem production (NEP; Lindgren et al., 2018). As a result, there is more than twice as much carbon stored in permafrost soils as there is in the atmosphere, including roughly 1035±150 Pg of carbon in the top 3 m of soil (Schuur et al., 2015). Surface air temperatures in the Arctic have been increasing more than twice as fast as the global average since the mid-20th century (Cohen et al., 2018) and are expected to continue increasing with more variable precipitation, hence more frequently pairing hot and dry conditions (Hu et al., 2015). Changing environmental conditions will place some of this large carbon stock at risk of release into the atmosphere through increased biological activity and wildfire (Natali et al., 2019, 2015; Rocha and Shaver, 2011a; Hu et al., 2010).
Fires are an increasingly important component of tundra carbon cycling. Fires are becoming more frequent in Arctic systems due to increasing occurrences of hot and dry conditions coupled with more lightning ignitions (Chen et al., 2021; Bieniek et al., 2020; Veraverbeke et al., 2017b). For example, the 2007 Anaktuvuk River megafire on the North Slope of Alaska occurred during an especially hot and dry period and released an amount of carbon similar in magnitude to annual sequestration across the entire tundra biome (Mack et al., 2011). Continued and potentially accelerated rates of warming are expected to further increase the frequency of tundra wildfires, thereby releasing significant amounts of carbon and altering the net carbon balance of the tundra biome (Hu et al., 2015).
A recent body of literature indicates the potential to estimate wildfire carbon emissions in boreal forests by linking geospatial predictors, most prominently satellite-derived estimates of fire severity and extent, with in situ measurements of carbon loss (e.g., Dieleman et al., 2020; Walker et al., 2018b; Veraverbeke et al., 2015b; Rogers et al., 2014). Despite the increasing incidence of tundra wildfires, these studies have primarily focused on boreal forests, and few estimates are available for tundra (Mack et al., 2011). Whereas satellite-derived fire extent and severity are widely available, representative in situ measurements of tundra wildfires are not. In situ measurements of fire effects on tundra organic soils are challenging due to a lack of reference points (e.g., adventitious roots) that survive the fire, which are used to estimate pre-fire organic matter depth and content (Walker et al., 2018a; Rogers et al., 2014; Boby et al., 2010). Measurements of organic matter loss must also be region-specific because of differences in vegetation and soil properties (Walker et al., 2020c; Mack et al., 2011).
Although carbon loss estimates from Arctic wildfires are important for understanding the impacts of climate change on carbon budgets, radiative forcings from wildfire gaseous and aerosol emissions are needed to properly gauge the impact on the Earth's atmosphere and climate (Huang et al., 2016; Ward et al., 2012; Randerson et al., 2006). Radiative forcings from wildfires depend spatially on fire severity and atmospheric conditions and temporally on changing atmospheric background concentrations in the months, years, and decades following the fire (Huang et al., 2016; Joos et al., 2013). To date, radiative forcings from high-latitude wildfires have been estimated for particular boreal forests (Huang et al., 2016, O'Halloran et al., 2012; Randerson et al., 2006) and within global models (Ward et al., 2012) but not for tundra ecosystems.
Here we take a two-step approach to assess the impact of tundra wildfires on carbon budgets and climate. We first developed a method for measuring carbon loss in situ in tundra ecosystems, particularly for the 2015 fire season in the Yukon–Kuskokwim Delta, Alaska. We tested the agreement of multiple pre-fire reference points for estimating burn depth in the field and combined these estimates with laboratory-measured organic matter and carbon fractions to estimate emissions. We then used 30 m remotely sensed fire severity data (differenced normalized burn ratio or dNBR; Key and Benson, 2006) from Landsat 8 to scale our measurements to the entire fire area. Finally, we estimated the long-term radiative forcings of the fire season's gaseous and particulate emissions, including long-lived greenhouse gasses (GHGs), ozone, ozone precursors, and aerosols, using a variety of published algorithms and Arctic-specific parameters when available.
2.1 Study area
Field measurements were collected in the summer of 2019 in a burn scar from the 2015 fire season in the Yukon–Kuskokwim Delta (YKD), Alaska (Fig. 1). The burn scar we sampled was adjacent to an uninhabited but regularly accessed Arctic field research outpost in the YKD established in 2016. The base camp was situated at 61.2632∘ N, 163.2458∘ W, approximately 95 km northwest of Bethel, Alaska, accessible by float plane and helicopter. Sampling was done within about an 11 km radius of the base camp (Fig. 1c). Measurements from the field were scaled to all fire scars in the YKD that burned in 2015 (Fig. 1b). We used fire perimeters from the Alaska Large Fire Database (ALFD; Kasischke et al., 2002).
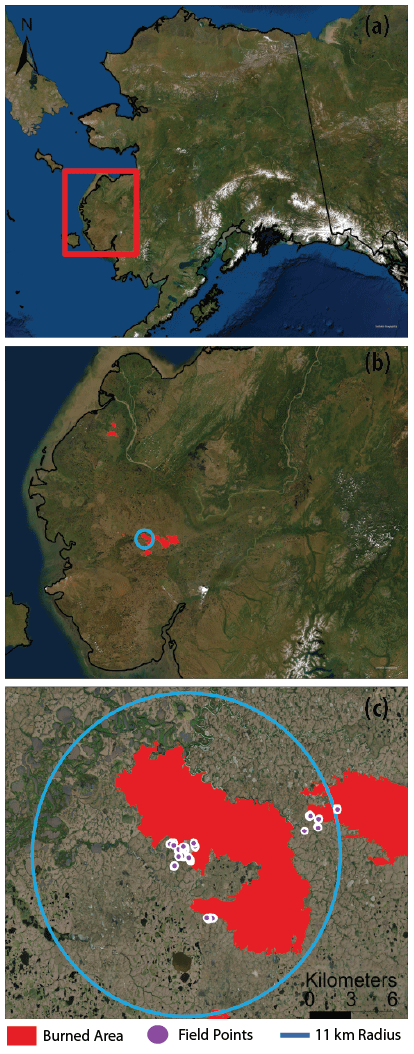
Figure 1(a) The location of the YKD within Alaska, (b) the areas of fires in 2015 within the YKD, and (c) the locations of our vegetative reference-point height transects in burned and unburned areas within about an 11 km radius from the base camp. Fire perimeters were derived from the Alaska Large Fire Database (Kasischke et al., 2002). Sources: Esri, DigitalGlobe, GeoEye, i-cubed, USDA FSA, USGS, AEX, Getmapping, Aerogrid, IGN, IGP, swisstopo, and the GIS user community.
The YKD contains tussock sedge, dwarf shrub, and lichen and moss tundra communities over ice-rich permafrost peat plateaus (Raynolds et al., 2005). These peat plateaus were the primary land component burned in the wildfires and were separated by fens, bogs, and open water. Within our sample area, lichen was the dominant vegetation type (Frost et al., 2020), shrubs were interspersed across the landscape, and tussocks were rare. Soil is predominantly organic (Jorgenson et al., 2000), which has accumulated over sand deposits from the Pleistocene period (Shaw, 1998).
2.2 Fire severity
Fire perimeters in the YKD in 2015 were extracted from the ALFD. We used a remotely sensed metric of fire severity from Landsat 8 Tier 1 surface reflectance imagery, dNBR (Eq. 1), which is based on the normalized burn ratio (NBR; Eq. 2; Key and Benson, 2006). Clouds, cloud shadows, and snow were masked from all images using the provided pixel quality attributes generated from the CFMASK algorithm (Foga et al., 2017). Imagery for this index was acquired as the mean Landsat 8 composite between 1 June and 31 August for 1 year pre- and 1 year post-fire and for all fire scars. All remotely sensed variables were extracted in Google Earth Engine (Gorelick et al., 2017).
where in Eq. (2) NIR is near-infrared (Band 5), and SWIR is shortwave infrared (Band 7). We compared dNBR from the YKD 2015 fire season to all fires in boreal and tundra Alaska to place the measured dNBR in context. Using fire records from the ALFD, dNBR was acquired for all available fire perimeters in Alaska. Differenced NBR was calculated in the same way as described before but with the exception that Landsat 4, 5, 7, and 8 were used in the pre- and post-fire composites. Due to differences in spectral bands, Landsat 8 was corrected to match Landsat 7 using a regression technique (Roy et al., 2016). The first fire year for which we acquired dNBR was 1989, and the most recent was 2019. Boreal and tundra extents were defined using the United States Environmental Protection Agency ecoregions, with tundra as level one class 2.0 and boreal as level one classes 3.0 and 6.0 (U.S. Environmental Protection Agency, 2010).
2.3 Vegetative marker height measurements
We measured the height of vegetative reference points above the surface in both unburned and burned areas. Three main dominant surface vegetative reference points were available: Sphagnum fuscum, Dicranum spp., and Eriophorum vaginatum (tussocks; similar to the methods of Mack et al., 2011). S. fuscum moss appeared in large mats. Dicranum moss appeared in small dense patches. All vegetative reference points were particularly conspicuous in burned areas, as they were elevated above the burned surface (Fig. 2). In the burned area, we measured the distance from the soil surface to the top of the living parts of the vegetative reference points, which we assumed to indicate full survival in the fire event. We did not measure dead remnants of vegetative reference points because we expect that these may not represent the actual pre-fire vegetation height.
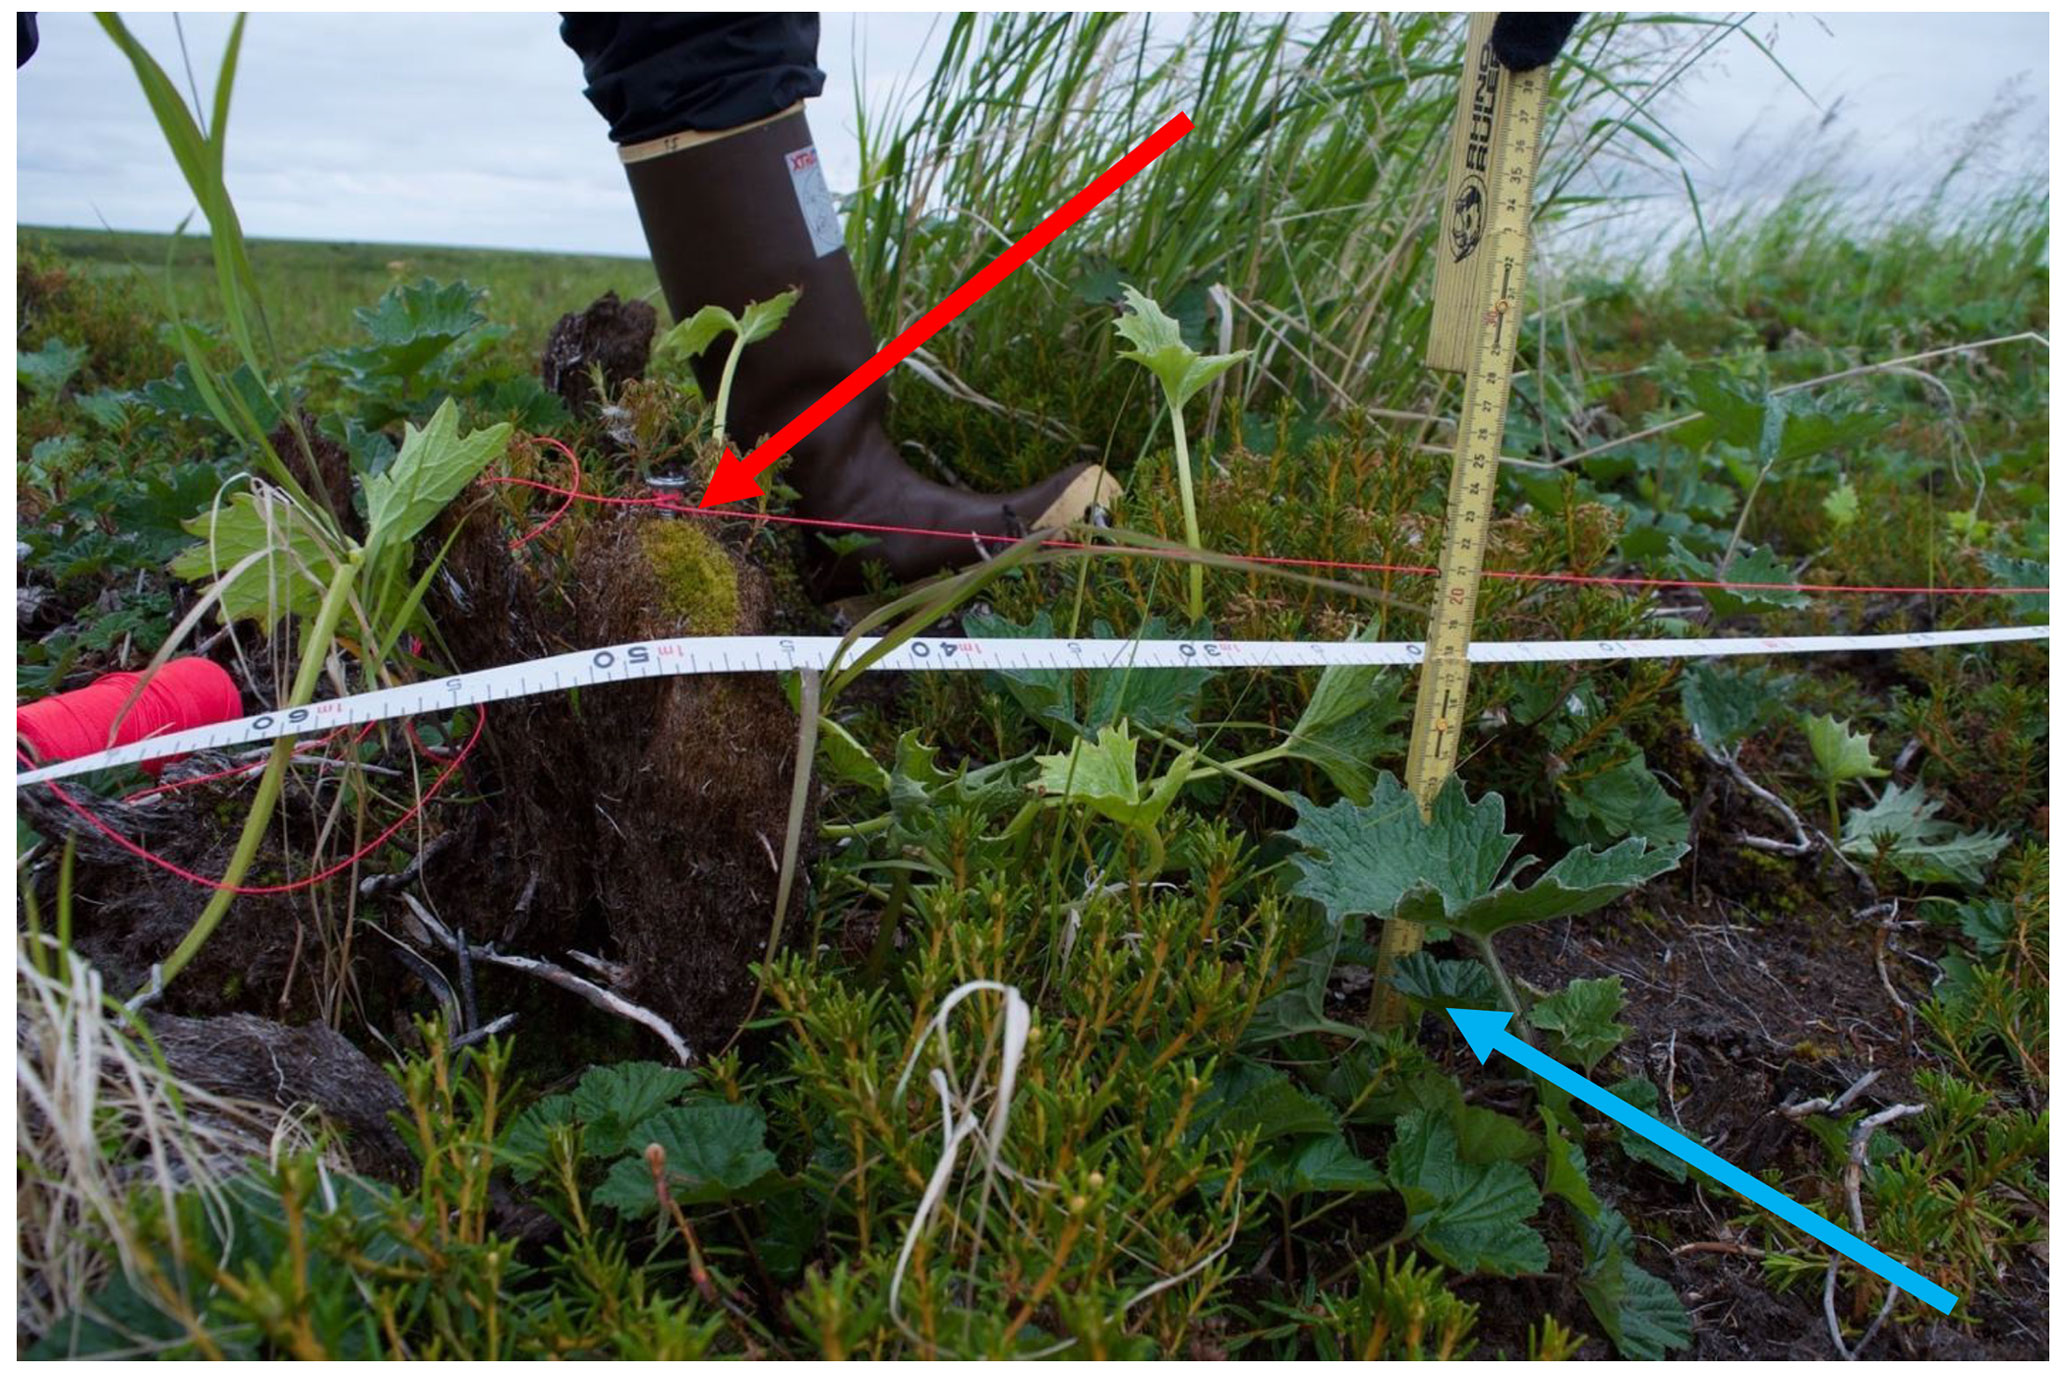
Figure 2An example burn depth measurement from the surviving top of a Dicranum spp. moss patch (red arrow; pink string) to the top of the soil (blue arrow) in a burned transect. Transect tape was used to measure the distance between the moss patches.
We measured the average height along a transect between two comparable reference points. At the highest-living point on each moss patch, or to the top of the corms at the base of a tussock, we inserted a nail (red arrow, Fig. 2). We ran a taut piece of string between the two nails (Fig. A1 in Appendix A). In between the edges of the moss patch or tussock pair (Fig. A1), we took height measurements vertically from the string to the ground, which was soil in the burned areas (blue arrow, Fig. 2) or a dense vegetative surface in the unburned areas (Fig. A2). In between the starting- and ending-point measurements on the transect we recorded height every 25 cm (Figs. A2 and A3). The starting and ending points were never greater than 50 cm from the nail. Latitude and longitude were recorded at all transects with an accuracy of 3 m (Fig. 1) for ground-truthing remotely sensed burn severity categories.
One potential source of error is post-fire subsidence between the vegetative reference-point pairs that may bias the relative height of a vegetative marker above the surface (Jones et al., 2015). We minimized this potential bias by maintaining transect lengths less than 4 m and predominantly 1 to 2 m in burned areas. We also visually assessed the area between each vegetative marker for signs of subsidence, including cracked soil or large elevation differences, and chose not to sample these areas. Measuring from the top of one vegetative marker to the top of another marker controlled for slopes and larger landscape elevation features because the string largely mimicked the angle of the landscape.
We selected transects for height measurements opportunistically in the burned and unburned areas. However, we tried to maximize spatial separation between transects and target visually identifiable areas of varying burn severity. We corrected for spatial autocorrelation biases between transect averages in our statistical analyses (see below). In unburned areas we maximized the number of transects measured for each vegetative reference point, Sphagnum (n=38), Dicranum (n=40), and Eriophorum (n=19).
Each burn depth measurement was associated with a dNBR value based on the 90 m pixel, the mean of underlying 30 m pixels, containing its centroid. Burn depth measurements that came from the lowest third, middle third, and upper third of dNBR values were considered to be in low-severity/unburned, moderate-severity, and high-severity areas, respectively, and a roughly even number of transects were sampled in each burn severity category for Sphagnum (n=56: high n=20, mod n=17, low/unburned n=19), Dicranum (n=54: high n=18, mod n=17, low/unburned n=19), and Eriophorum (n=24: high n=7, mod n=11, low/unburned n=6). Unburned patches of tundra were sometimes included in low-severity pixels within the burn scar, which is why these severity classes are combined.
2.4 Organic matter and carbon pool measurements
We calculated the total ecosystem organic matter and carbon pool sizes in unburned areas surrounding the fire scar. We took vegetation and soil samples together in cores using a hand drill and hollow metal drill bit that was 30 cm in length and 6 cm in diameter. Cores were extracted at three points (start, middle, and end) along transects between like vegetative reference points. We selected four sites of less than half a hectare surrounding areas where we took our unburned vegetative reference-point height measurements. These sites were selected opportunistically to ensure the presence of an appropriate number of each of the three vegetative reference points. In each site, we extracted cores from three transects per vegetative reference-point pair, which totaled 27 soil cores per site. In one site we found only two tussock pairs, so our total number of samples was 105. We chose unburned sites separated by at least 1 km to control for heterogeneity in local soil and vegetation characteristics.
We measured the height of the live vegetation layer and fibric soil horizons for each core. Vegetation layers and soil horizons were identified visually by soil density, texture, color, and identifiable plant parts. Each core was separated into vegetation and fibric soil layers that were homogenized, weighed, and subsampled in the field and subsequently stored frozen until analyzed. In the lab, each vegetation sample and approximately 15 g of each fibric sample were dried for 48 h at 60 ∘C and weighed to determine soil water content. We used the proportion of dry mass to wet mass to estimate the dry weight of the field sample, which was used to determine bulk density (g dry mass cm−3). Soil samples were combusted for 5 h at 450 ∘C to determine organic matter content and analyzed for percent carbon using an Elementar vario MAX CN analyzer at the Woodwell Climate Research Center, Falmouth, Massachusetts. We assumed the dry mass of the vegetation layer was fully organic matter. Using the average across all herbaceous plant organs, we assumed the carbon content of the vegetation layer was 43.04 % from Ma et al. (2018). To calculate organic matter and carbon pools (kg m−2) for each organic soil sample, we multiplied bulk density by the height of the layer and percent organic matter or percent carbon, respectively. These values were normalized for each sample to the average depth of the vegetation layer, which was 7 and 10 cm in the fibric horizon.
2.5 Calculating final estimates
We calculated organic matter combustion and carbon loss across the fire area using burn depth derived from the moss reference points. We excluded estimates derived from tussock measurements because our sample size of tussock-based measurements was substantially smaller than the moss vegetative reference points due to their infrequent occurrence in our study area (Frost et al., 2020). Moreover, burn depth estimates from tussocks correlated negatively with remotely sensed fire severity (Fig. A4). This negative correlation with fire severity may be attributable to mechanisms that are untestable with our sample size and study design, including altered burn dynamics in close proximity to tussocks. Future work could clarify the mechanism behind this discrepancy. Excluding tussock measurements required reassigning dNBR values evenly as before across only Dicranum (n=54: high n=18, mod n=18, low/unburned n=18) and Sphagnum (n=56: high n=20, mod n=18, low/unburned n=18) reference points. The highest dNBR values in the low-severity/unburned and moderate-severity categories became the threshold values for low-severity/unburned to moderate-severity and moderate-severity to high-severity burn, respectively. We split the fire area, based on these thresholds, into the three categories for burn severity. There was 13 001 ha of low-severity burn, potentially including unburned patches, 8516 ha of moderate-severity burn, and 32 637 ha of high-severity burn, which summed to 54 154 ha of total fire area (Fig. A5).
For final analysis of organic matter and carbon loss, we averaged the height of Sphagnum and Dicranum reference points in the unburned areas to determine one height for each reference point, since their respective heights were statistically different (p<0.001). Burn depth was calculated at each transect in the burned areas by subtracting the standard unburned height from the transect average height. We also averaged the dry organic matter and carbon pool within the vegetative layer and fibric horizon separately across Sphagnum and Dicranum reference points to determine one pool size for our sampling area. Average organic matter or carbon loss (kg m−2) was estimated as the product of the organic matter or carbon concentrations and depth of the vegetation and soil that burned at each burn depth transect. Average loss at each transect was the sum of loss from each horizon (see Fig. A6 for schematic of organic matter and carbon loss calculation per transect). For our final calculation of total dry organic matter and carbon loss, we averaged the organic matter and carbon lost across transects for Sphagnum and Dicranum reference points within each fire severity category. Over the landscape, total carbon or organic matter released was calculated by multiplying average carbon or organic matter loss for a given burn severity category by the total burned area for that category. Total carbon or organic matter released was then calculated as the sum from all three burn severity categories.
2.6 Radiocarbon
We used radiocarbon dating to confirm our burn depth measurements by comparing the radiocarbon age of Sphagnum macrofossils on the burned soil surface with the radiocarbon age of Sphagnum macrofossils at different depths of the unburned soil profile, similar to the methods of Mack et al. (2011). In the field we extracted one unburned core and three burned cores of the same dimensions as our primary soil cores, described above. We extracted a 1 cm thick subsample of the cores every 5 cm in depth and froze the samples in a sealed plastic bag until lab analysis. To construct an age profile, we analyzed unburned cores at depths of 5 to 20 cm for radiocarbon age. We assumed that a depth of 0 cm had carbon from the time of harvest in 2019. In the burned cores, we analyzed the 0 cm depth (i.e., surface) for radiocarbon.
In the lab, we visually identified Sphagnum branches in each of the subsamples being tested and rinsed them with deionized water. The branches were then dried for 48 h at 60 ∘C, and roughly 5 mg of dry branch matter per sample was sent to the W.M. Keck Carbon Cycle Accelerator Mass Spectrometry Laboratory at the University of California Irvine for the 14C content and δ13C. Results for 14C analysis are reported as the fraction modern, which is defined as the ratio of the sample's carbon isotope ratio to that of a standard (Reimer et al., 2004). Fraction modern values are calibrated to calendar years using OxCal online 4.4.1 (Ramsey, 2009), with the appropriate modern-era bomb curve taken from Hua et al. (2013). Due to the shape of the bomb curve, there are at least two possible calendar years in which the carbon in the sample was fixed. However, we did not use the oldest age for unburned samples with multiple calendar ages because the age of these samples must increase with depth (Walker et al., 2019; Mack et al., 2011), which is not supported when considering the oldest calendar ages. Furthermore, we were confident the burned samples were from the younger age because they were from visually shallow burn depths. We compared the calendar age of carbon at the burned soil surface to the age by depth profile taken from the unburned core.
2.7 Radiative forcing model
We created a temporally explicit model of radiative forcings for gaseous and aerosol emissions of tundra wildfires and used it to compute the radiative forcings per unit burned area. The radiative forcing model was driven using the average amount of organic matter lost across fire-wide burn severity classes and vegetative reference points. Computing the radiative forcing of gaseous and aerosol emissions has been done for boreal fires (e.g., Huang et al., 2016; O'Halloran et al., 2012; Randerson et al., 2006) but has yet to be applied to tundra systems. Our model included the long-lived GHG species CO2, CH4, and N2O, as well as short-lived climate forcers, tropospheric O3, O3 precursors, and aerosols. Ozone precursors include NOx, non-methanogenic volatile organic carbons (NMVOCs), and CO.
We first used emissions factors from Akagi et al. (2011) to calculate the mass of gaseous and aerosol emissions from our estimated organic matter losses. Emissions factors have not been previously defined for tundra burning. Given that boreal forest, whose definition for emission factors includes organic soils, peat, and woody vegetation, is likely the closest ecosystem type in terms of fuel properties to tundra in Akagi et al. (2011), we employed these emission factors. However, we note a possible overestimate of relative contribution from woody vegetation emissions in these numbers due to the relative lack of woody vegetation on the tundra landscape. Furthermore, concentrations of gasses released from combustion of the same biomass type vary based on the measurement technique, such as from differences in chemical mixing in ground-based field, airborne, and laboratory methods (Akagi et al., 2011). Since Akagi et al. (2011) provide estimates of each emissions factor based on a combination of values from previous studies, the emissions factors may capture uncertainty associated with the variable methods of these source studies.
Once we estimated the mass of each gaseous emission, we calculated the concentration of the gas remaining in the atmosphere and its radiative forcing each year after the fire season by synthesizing existing models and research on the lifetimes and radiative forcings of these gaseous emissions. Our calculations of radiative forcing were dependent on the future ambient concentration of GHGs in the atmosphere. As a result, we calculated the radiative forcings of gaseous emissions for three scenarios: historic, representative concentration pathway (RCP) 4.5, and RCP 8.5. The historic scenario assumes the ambient concentration of GHGs remains constant in the atmosphere after the fire year. Future atmospheric concentrations for each RCP were taken from Meinshausen et al. (2011). The radiative forcing for each gaseous emission per year was calculated separately and then summed across forcing agent. Since O3 precursors and aerosols had the most uncertain lifetimes and radiative forcings (Bond et al., 2011; Quinn et al., 2008), we calculated the total radiative forcing of the emissions with and without them. A flowchart of our general methodology for the entire radiative forcing calculation is presented in the Appendix (Fig. A7).
2.8 Methane and nitrous oxide
Our radiative forcing calculations for CH4 and N2O were based on Ward et al. (2012). For both gasses, we assumed a pulse emission and calculated the concentration remaining in each year after the fires using a simple box model with one outflow as shown in Eq. (3), where Co is the initial pulse concentration of the gas, t is the number of years after the fire event, and L is the lifetime of the gas. The initial pulse concentration of both gasses was calculated by converting the mass emitted to a volume as a molar fraction of the atmosphere:
We used the atmospheric lifetimes for both gasses reported in Myhre et al. (2013). However, we calculated a decreased lifetime of N2O using Eq. (4) from Ward et al. (2012), as its ambient concentration changed in future emissions scenarios, where Lo is the initial lifetime of N2O from Myhre et al. (2013), E is the ambient concentration of N2O in the year the fires burned, and Et is the ambient concentration of N2O in each year after the fire event based on the future emissions scenario (Meinshausen et al., 2011). We did not account for the effect of the changing atmospheric concentration on the lifetime of N2O due to the pulse emission itself. We then calculated the perturbation concentrations of CH4 and N2O in the atmosphere each year after the fire event as the sum of the remaining pulse emissions and the ambient concentrations and used Eqs. (5) and (6) from Ward et al. (2012) to estimate the radiative forcing of both gasses. The radiative forcing of the gas in each year was RF, M was the perturbation concentration of the gas whose radiative forcing was being calculated, and Mo and No were the ambient concentrations of both gasses depending on which gas's radiative forcing was being calculated:
2.9 Carbon dioxide
Carbon dioxide has a highly variable lifetime under different future emissions scenarios depending on the strength of ocean and land sinks. To account for this variation, we used impulse response functions (IRFs) from Joos et al. (2013), which represent the fraction of a pulse of CO2 remaining in the atmosphere in each year after the pulse for each scenario. For each year post-fire, we multiplied the relevant IRF function by the concentration of CO2 initially released to estimate the amount of CO2 remaining in the atmosphere. Similar to N2O and CH4, the initial concentration of CO2 was calculated by converting the mass emitted to a volume as a molar fraction of the atmosphere. The radiative forcing for CO2 was calculated using Eq. (7) taken from Myhre et al. (1998), where C is the perturbation concentration, and Co is the ambient concentration of the gas in each year:
2.10 Tropospheric ozone
Tropospheric O3 is created photochemically in the smoke plumes of wildfires by the combination of sunlight and O3 precursor gasses, and its creation can be expressed as a function of time and the amount of carbon monoxide released (Jaffe and Wigder, 2012). We used data compiled in Jaffe and Widger (2012), who provided a synthesis of O3 and its relationship with CO for fire plumes sampled in the Arctic at various times after a fire to calculate a mean plume lifetime and to derive a linear relation between plume age and the ratio of O3 to CO. Because the average plume age sampled was 5 d, we assumed O3 was created for 5 d after the fires. The concentration of O3 on each of those 5 d was calculated by multiplying the initial concentration of CO released from the fires, calculated by converting the mass emitted to a volume as a molar fraction of the atmosphere, by the ratio of O3 to CO we estimated for that day. After 5 d, we assumed no more O3 was created, and we calculated the remaining amount of O3 after day 5 using the box model approach from Eq. (3). The concentration of O3 on day 5 was Co, and L was the lifetime of O3 taken from Myhre et al. (2013). We converted the concentration of O3 to Dobson units (DUs) and converted from DUs to radiative forcing using a conversion factor from Myhre et al. (2013) each day after the fire event. The radiative forcing in each year was the mean radiative forcing of all the days within that year, although the annual forcing was negligible after the first year.
2.11 Ozone precursors and aerosols
We used a method based on global warming potential (GWP), similar to Huang et al. (2016), to calculate the radiative forcing of the ozone precursors and the direct aerosol effect. GWP is defined as the ratio of the time-integrated radiative forcing of a pulse emission of a gaseous species to the time-integrated radiative forcing of an equivalent emission mass of CO2 (Joos et al., 2013). GWP is typically calculated for 20- and 100-year time horizons. Here, we use GWPs to determine the warming effect of the precursor and aerosol emissions relative to CH4 at the 20- and 100-year time horizons, as shown in Eq. (8). We derived the radiative forcings for ozone precursors based on CH4 because the radiative forcing of ozone precursors is through their effect on methane over the long term (Collins et al., 2013). To remain consistent with our methodology for ozone precursors, we derive the radiative forcings for aerosols from CH4 as well. Furthermore, the radiative forcing of CH4 has the simplest derivation in our model, so we assume it is the strongest continuous radiative forcing from which to build our continuous model using GWPs.
The emissions factor (EF) and GWP are defined for gaseous species x, and the GWP is defined at the time horizon t. For CO and NMVOCs, we interpolate this relative warming effect (Rt) between year 1 and year 20 by assuming it remains constant. To interpolate this effect between years 20 and 100, we mirror the shape of methane's cumulative radiative forcing curve over that time interval. From this curve we calculated the difference between methane's cumulative radiative forcing at years 20 and 100. We then calculated the fractional decrease of this difference each year between years 20 and 100. We multiplied those fractional decreases by the difference in Rt at years 20 and 100 for CO and NMVOCs to derive a relative warming effect for the precursors. Finally, we multiplied Rt by methane's cumulative radiative forcing curve to estimate the cumulative radiative forcing for each precursor every year after the fire event. We used the global GWPs for CO and NMVOCs from Myhre et al. (2013).
Since NOx has a positive GWP at the 20-year time horizon and a negative GWP at the 100-year time horizon, we chose not to mimic the shape of methane's radiative forcing curve when interpolating between the two time points. Instead, we calculate an Rt value for NOx at year 1 by scaling R20 in proportion to the change of methane's cumulative radiative forcing from years 1 to 20. Then we interpolated between the Rt values in years 1, 20, and 100 using an exponential decay function of the form , whose coefficients were calculated using the nls function in R (R Core Team, 2020). We multiplied the Rt value for NOx at each year by the cumulative radiative forcing of CH4 in that year to obtain a cumulative radiative forcing curve for NOx. We use the global GWP for NOx from Myhre et al. (2013).
The radiative effect of aerosol emissions happens within a year of the fire event, as fire aerosols are typically removed from the atmosphere via wet and dry deposition within a matter of weeks (Bond et al., 2011; Quinn et al., 2008). We assumed that the cumulative radiative forcing of aerosols at any year after the fire event would be constant and equal to the radiative forcing of aerosols in the year of the fire event. Therefore, to calculate the cumulative radiative forcing from black and organic carbon direct effects in every year, we used R20 and multiplied this value by the cumulative radiative forcing curve of CH4 at year 20. Radiative forcings of black and organic carbon were summed to report a single value for aerosols. We used the GWPs for black and organic carbon estimated for open biomass burning including the cryosphere effect from Bond et al. (2011). To estimate the indirect aerosol effect, we multiplied the radiative forcing of the direct effect of aerosols each year by the ratio of indirect to all-sky direct effect radiative forcing from wildfires defined in Ward et al. (2012).
2.12 Statistical analyses
All statistical analyses were completed in R (R Core Team 2020) using the nlme package (Pinheiro et al., 2020). For the vegetative reference-point heights, we used the nlme package function gls to fit a linear model using the generalized least-squares method with average burn depth and height above the dense vegetation layer along the transect as the response variable in the burned and unburned areas, respectively. Within the gls function, both models were corrected for spatial autocorrelation between transect locations by choosing the model with the lowest Akaike information criterion (AIC) score across five correlation structures, exponential, Gaussian, linear, rational quadratic, and spherical, to be our final model. In burned areas, the model had vegetative reference-point type nested within burn severity type, while in unburned areas, we only modeled the effect of the vegetative reference-point type. The model with the lowest AIC score for both burned and unburned areas had a rational quadratic correlation structure. To analyze differences in organic matter and carbon pools, height, and bulk density of the vegetation and fibric soil layers, we used the lme function, defined in the nlme package, to fit linear mixed-effect models with the restricted maximum likelihood method. These models had the soil or vegetation layer characteristic value for each core as their response variable, vegetative reference-point type as a fixed effect, and transect number nested in the sampling site as random effects. Finally, we created linear-fit models using the gls function with organic matter combusted and carbon lost at each transect in the burned areas as response variables with the same structure as the burn depth model. These models had the lowest AIC scores with a rational quadratic correlation structure. An analysis of variance (ANOVA) was used to test for significant differences between groups for all of our models.
We found that burn depth measurements were consistent with burn severity classification, and burn depth increased with fire severity (Fig. 3). Based on a 2-factor ANOVA with vegetative reference-point type nested within burn severity, differences in average transect burn depth were significant (p<0.0001) between burn severity categories. The ranges of moderate-severity burn depth measurements overlapped substantially with the high-severity and low-severity/unburned measurements. Moderate-severity groups also had the most evenly distributed probability densities across burn depth. Dicranum measurements captured the shallowest and the deepest burn depths (Fig. 3). Nevertheless, across both vegetative reference points there was a clear stepwise increase in burn depth across burn severity classifications.
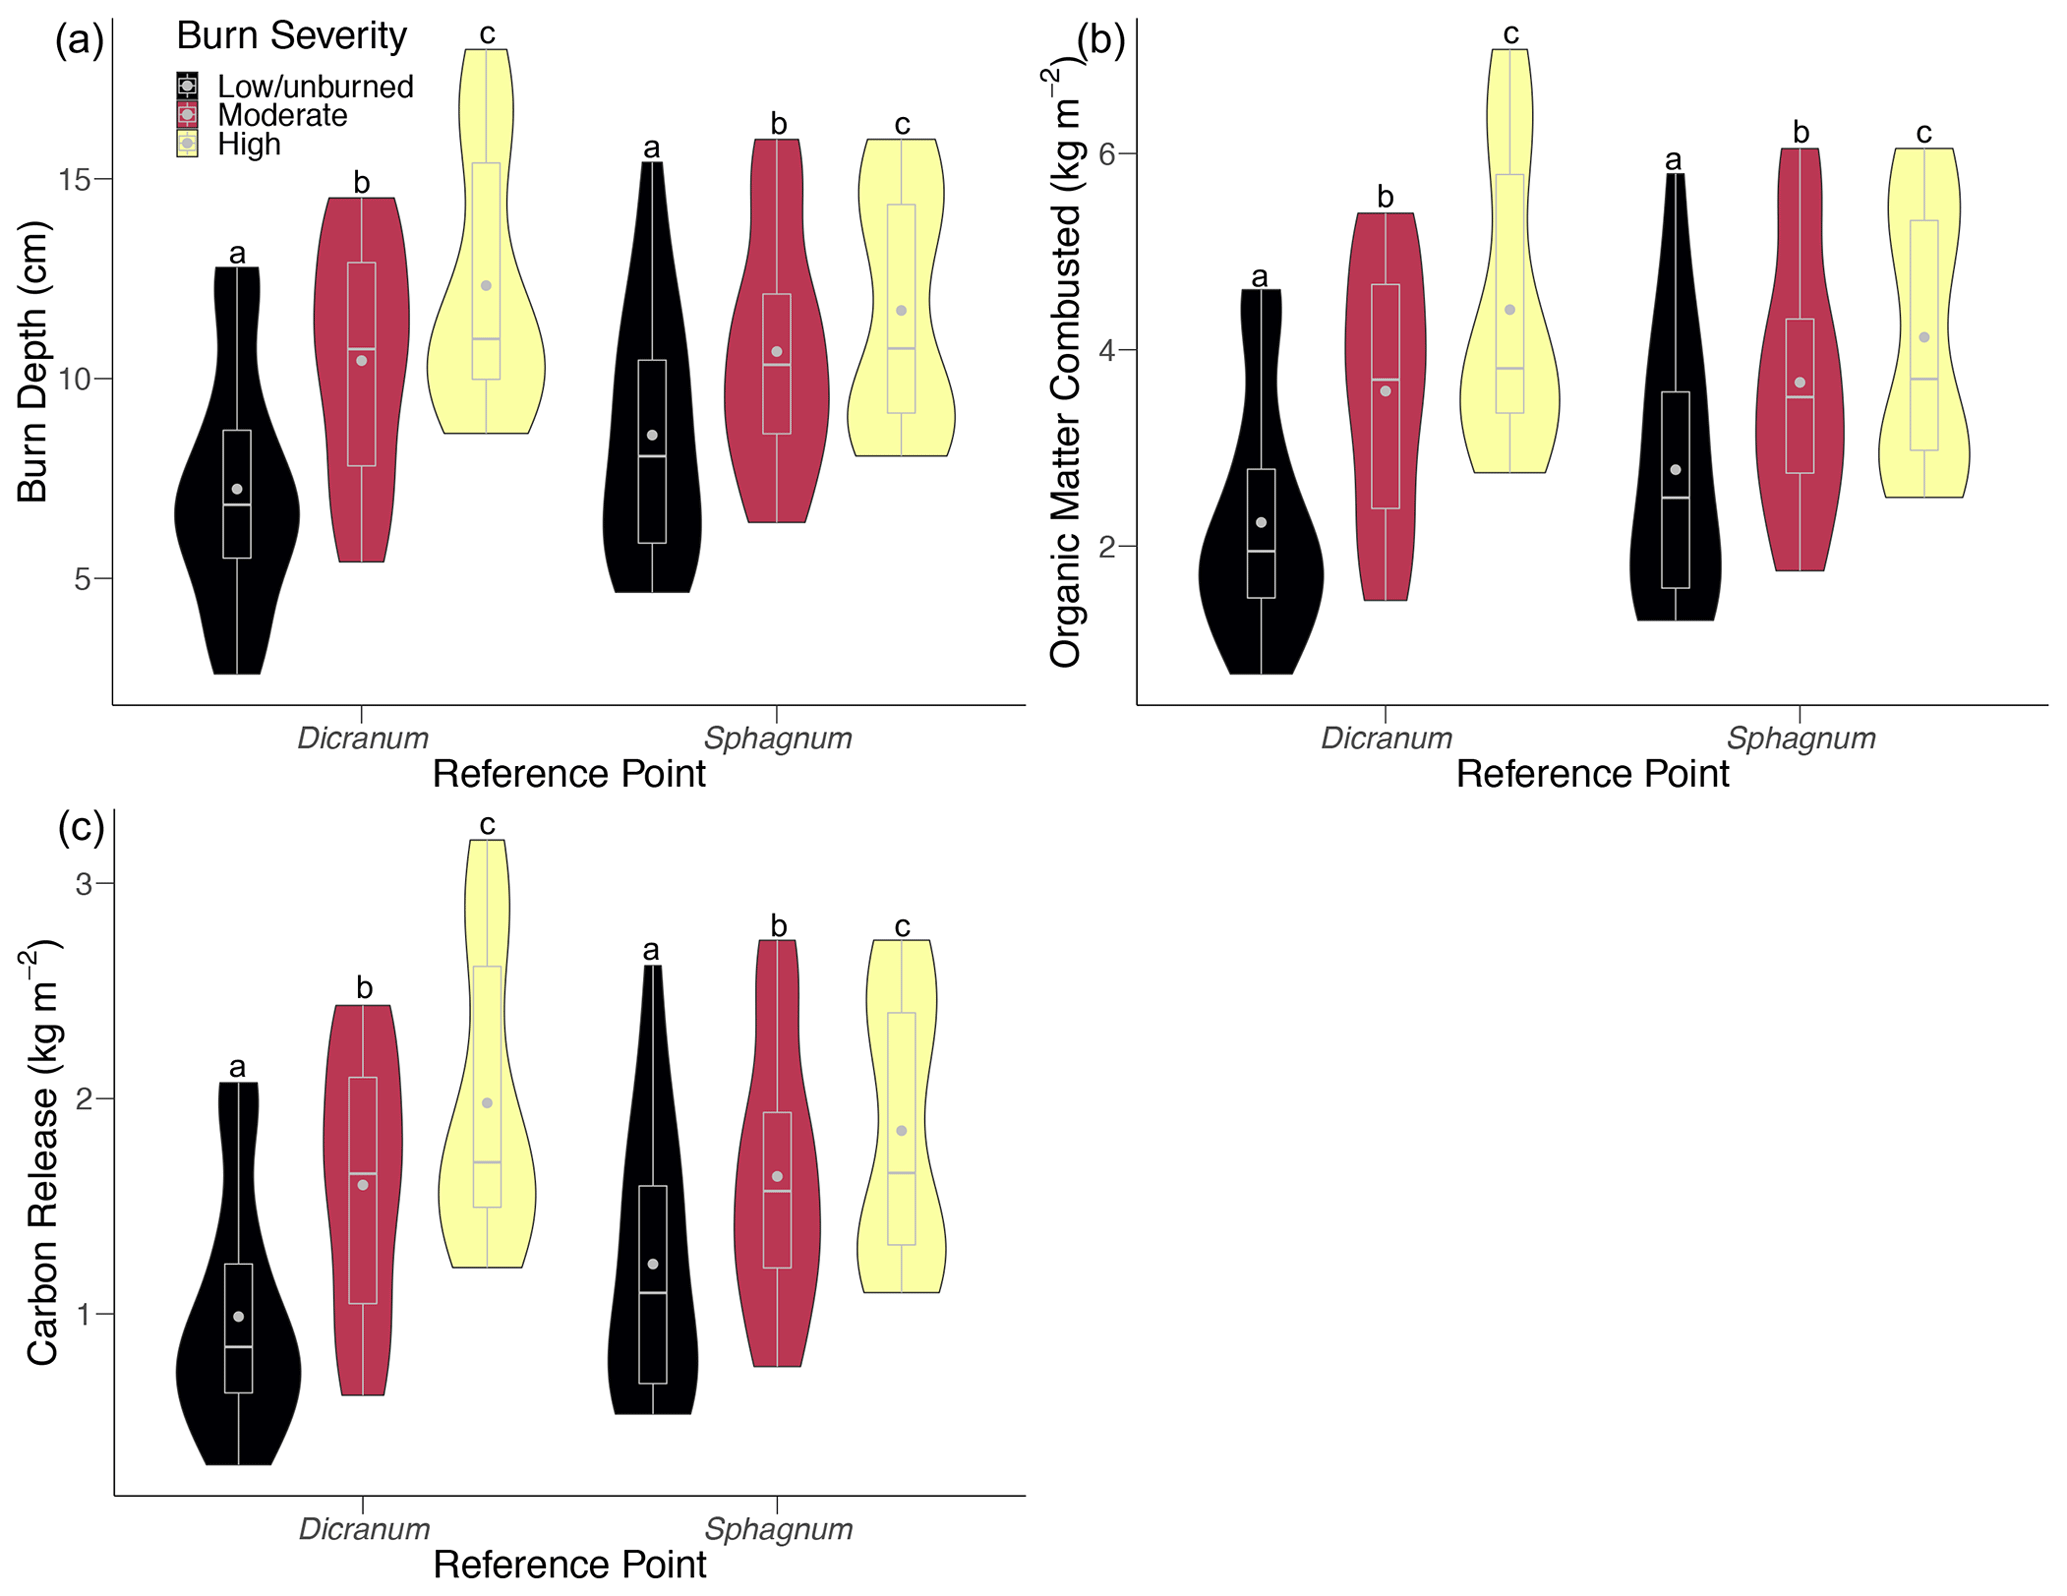
Figure 3Distributions of average (a) burn depth, (b) organic matter combusted, and (c) carbon released per unit burned area per transect within each reference point across burn severity levels. Boxes encompass the middle 50 % of data, whiskers are the upper and lower quartiles, horizontal lines intersecting boxes show the median, and gray points are the mean. Letters indicate significantly different groups of data.
We found no significant differences between vegetative reference-point types in terms of mean organic matter pool size, carbon pool size, height, or bulk density for either the live vegetation layer or fibric soil horizon extracted in our unburned cores (). In the unburned areas, the fibric soil horizon (17.9±0.63 cm) was nearly 3 times thicker than the vegetation layer (6.19±0.60 cm) to the depth that our cores reached (∼ 30 cm; Table 1), which is likely an underestimate of the soil organic-layer depth, given that our cores only occasionally reached the mineral soil layer. However, there was larger variation in the vegetation layer (1σ=6.9 cm) than fibric horizon (1σ=2.6 cm) height. In most cases, the fire burned through the vegetation layer but never completely through the fibric horizon (Fig. 3, Table 1). The fibric layer (to 24.1 cm average) had almost 3 times greater organic matter and carbon pool sizes compared to the vegetation layer because of its higher bulk density and height (Table 1).
Table 1Bulk density, height, and carbon and organic matter percent, as well as pool sizes of vegetation and fibric layers measured in unburned soils averaged across reference points. Carbon and organic matter pool measurements are the product of bulk density and their percent contents and are normalized to the height of the vegetation layer and 10 cm in the fibric layer. Sample size is 72, which is equally attributable to the two reference points. Error is reported as the standard error of the mean (SEM).
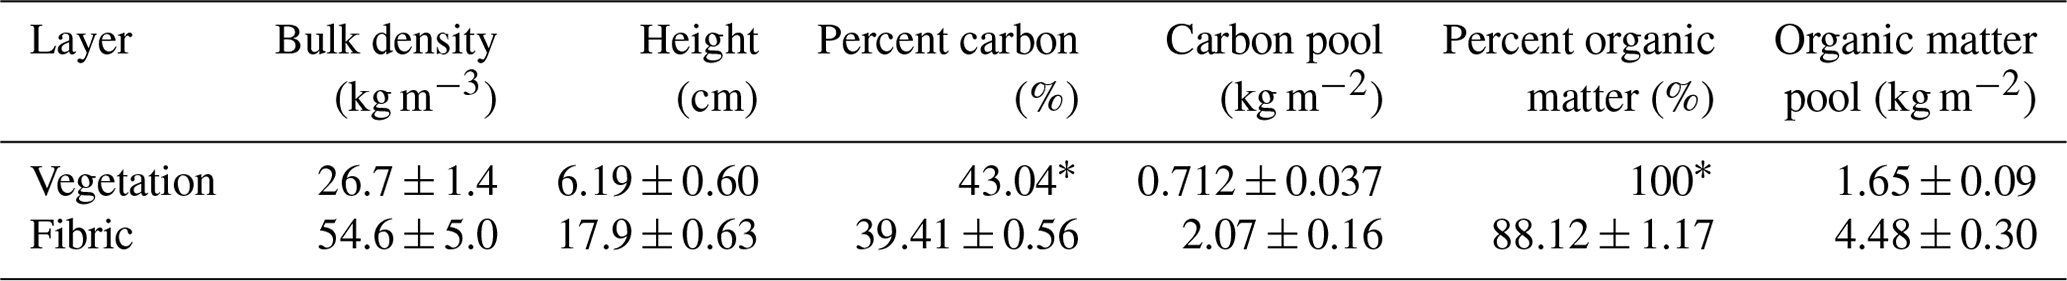
* Based on assumption.
Carbon and dry organic matter loss estimates similarly increased with burn severity (Fig. 3, Table 2). Based on a 2-factor ANOVA with vegetative reference-point type nested in burn severity, average organic matter and carbon loss differed between burn severity categories (carbon loss: p<0.0001; organic matter loss: p<0.0001) (Fig. 3). Similar to burn depth distributions, the moderate-severity range overlapped with the high-severity and low-severity/unburned distributions (Fig. 3).
Table 2Carbon and organic matter loss averaged within each burn severity category across reference point, as well as total carbon and organic mass loss over each burn severity category area. Total loss per burn severity category is summed to calculate total loss over the total fire area by burn severity classification. Error is reported as SEM, except for total loss over the fire area which is reported as the sum of errors.
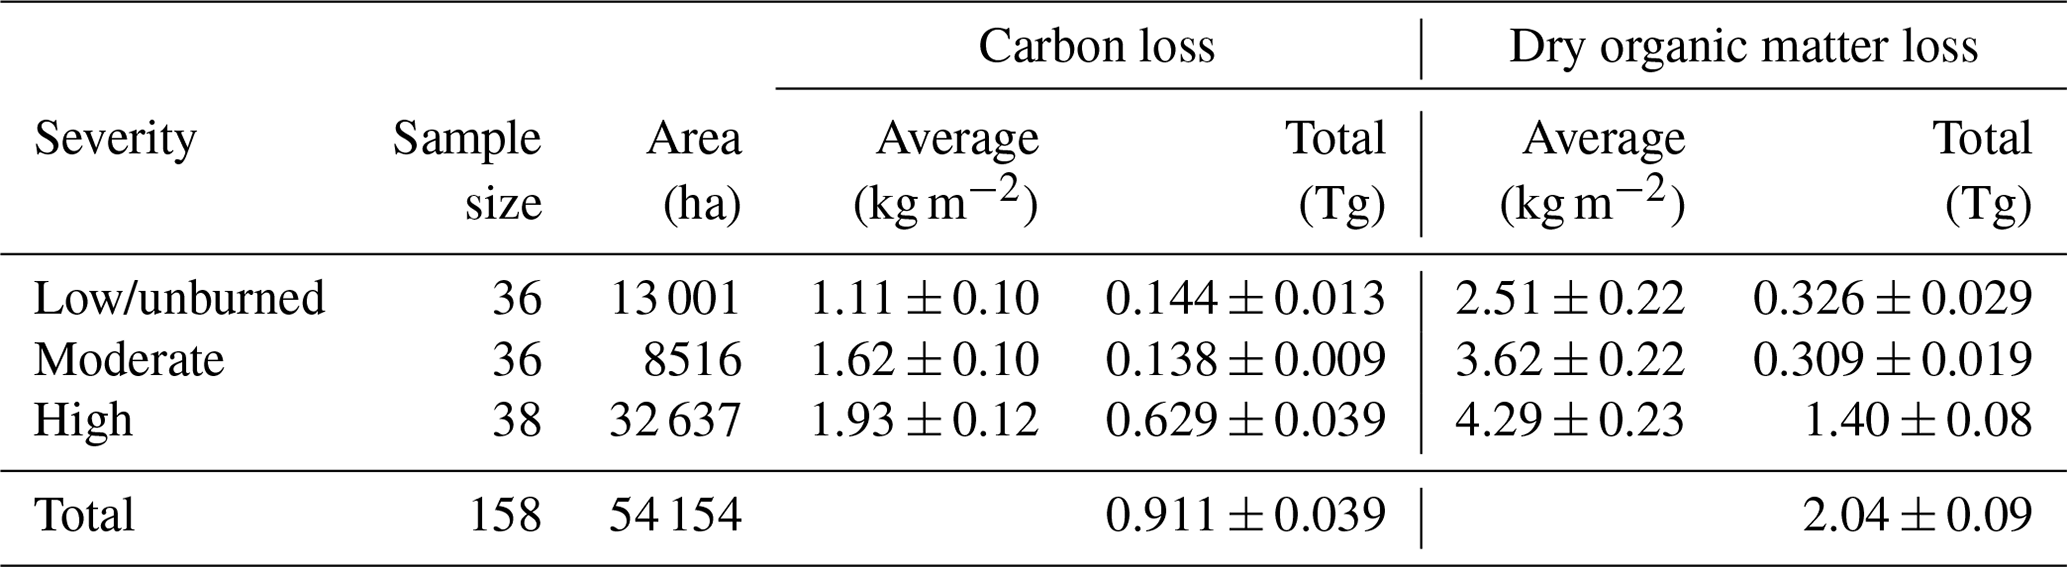
The 2015 fires burned a total of 54 154 ha in the YKD. The distribution of dNBR values for our focal fires in the YKD was intermediate compared to dNBR values from all tundra fires and on the low side but within the range of dNBR values for all boreal fires in Alaska between 1989 and 2019 (Fig. A8). Roughly 60 % of the burned area was classified as high severity, while moderate severity and low severity/unburned accounted for about 16 % and 24 % of the burned area, respectively (Table 2). As a result, total organic matter and carbon loss within the high-severity burn classification was over 3 times greater than the other two burn severity categories. Although moderate severity occupied less fire area than low severity/unburned, it contained roughly equal total organic matter and carbon loss to the low-severity/unburned areas due to about 50 % higher organic matter and carbon losses per unit area on average. However, it should be noted that losses from low-severity/unburned areas are likely overestimates, given the inclusion of unburned areas within regions of low-severity burn. Summing carbon loss and dry organic matter loss over the area of each burn severity category yielded a total loss of 2.04 ± 0.09 Tg of dry organic matter and 0.911 ± 0.039 Tg of carbon. This magnitude of total loss corresponded to an average 3.76 kg m−2 of organic matter and 1.68 kg m−2 of carbon loss across the fire area.
The age of carbon increased by ∼ 50 years from 5 to 20 cm in depth in the unburned area. Surface samples from burned soils in a low-severity/unburned area were dated to 2009, indicating a burn depth of about 5 cm or less, which is within the range of our low-severity/unburned burn depth measurements (Table 3). The rate of change in carbon age between 0 and 5 cm was 2.4 yr cm−1; for the 15 to 20 cm interval, it was 3.6 yr cm−1. Because none of our burn depth measurements exceeded 20 cm, all carbon released from the fires was likely relatively new carbon, younger than 64 years of age. Our average burn depth of 10.3 cm across burn severity and reference point indicated an average age of about 23 years for carbon released.
Table 3The fraction of the modern standard and calibrated calendar age for each radiocarbon sample. Calendar ages are the intercepts for the fraction modern value with the calibration curve. We do not consider the oldest calendar ages.
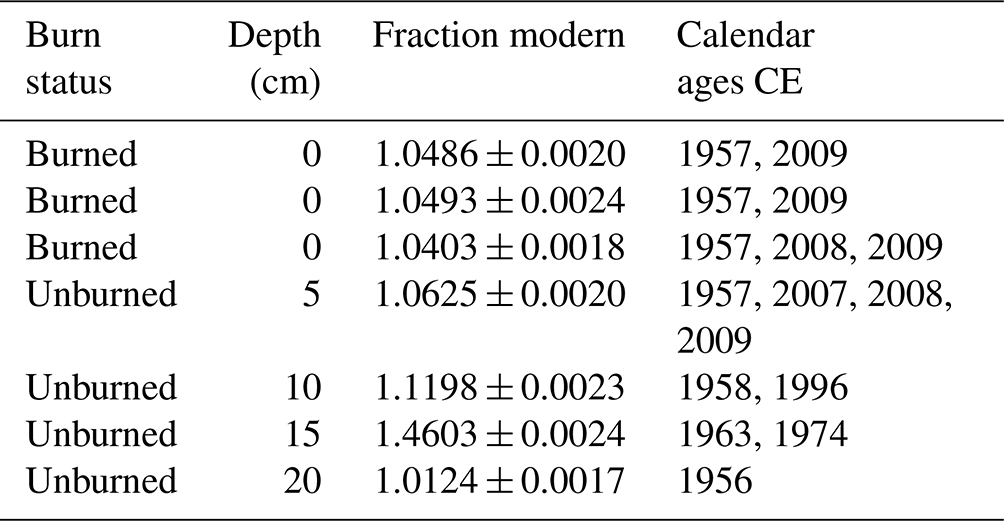
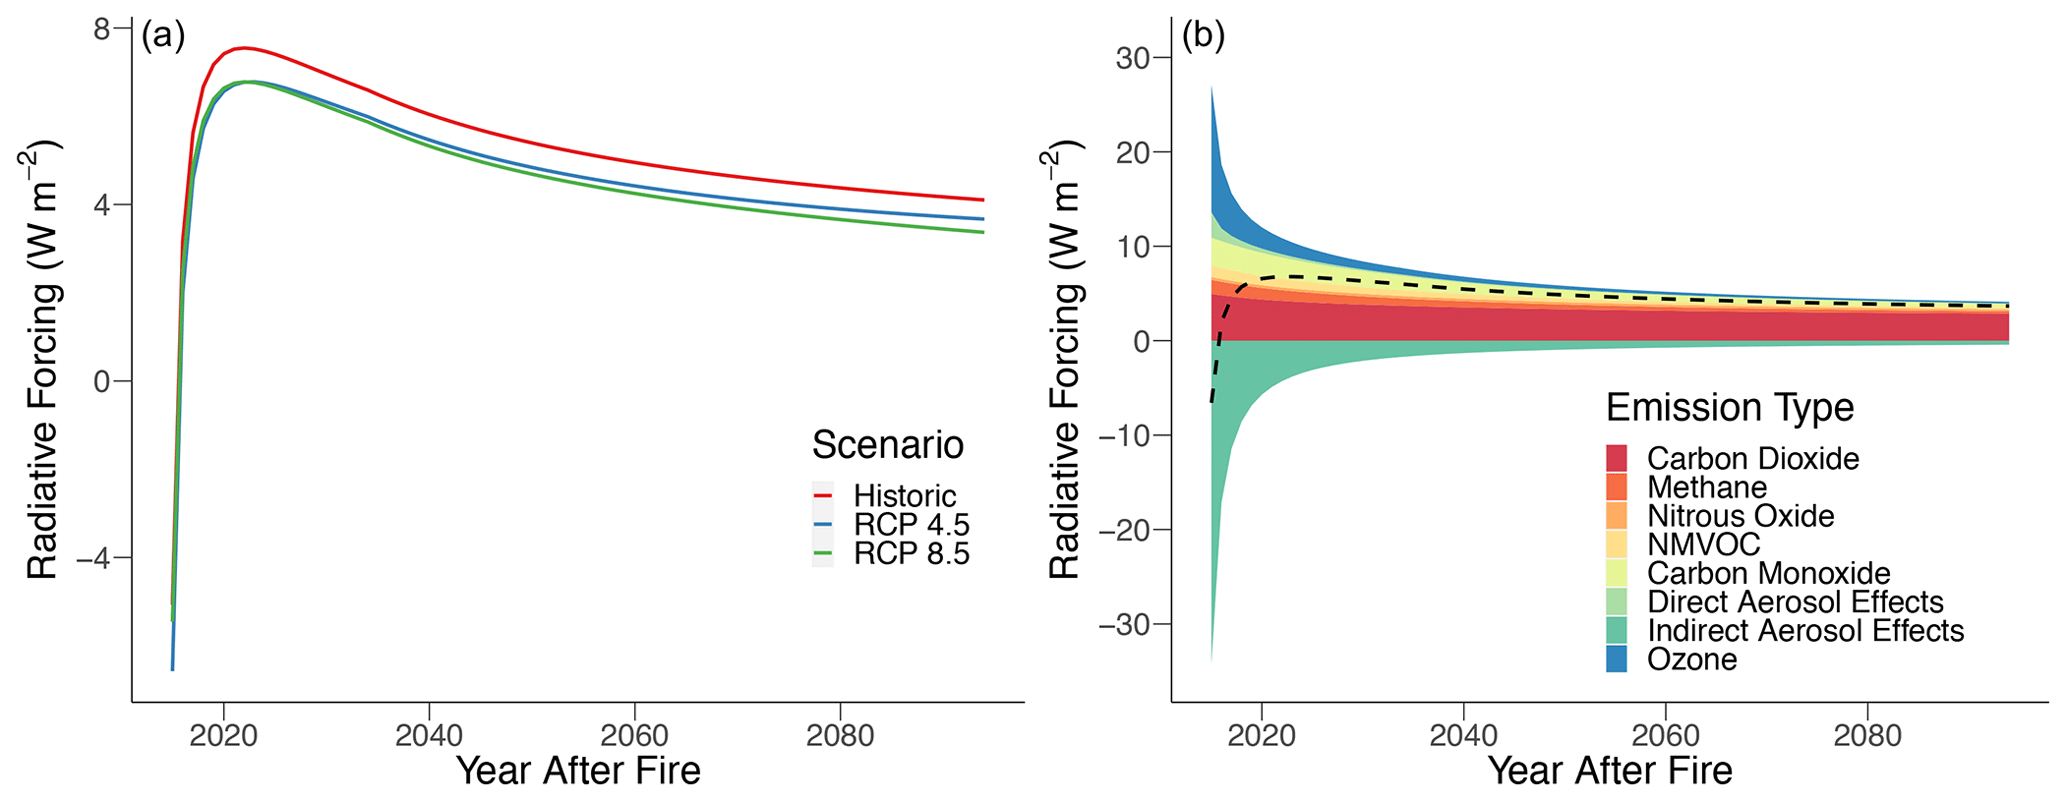
Figure 4(a) Total cumulative mean radiative forcing of gaseous emissions for three future atmospheric gas concentration scenarios and (b) cumulative mean radiative forcing of different emissions (dashed line is net forcing) under the RCP 4.5 future scenario over 80 years post-fire from the YKD 2015 fire season.
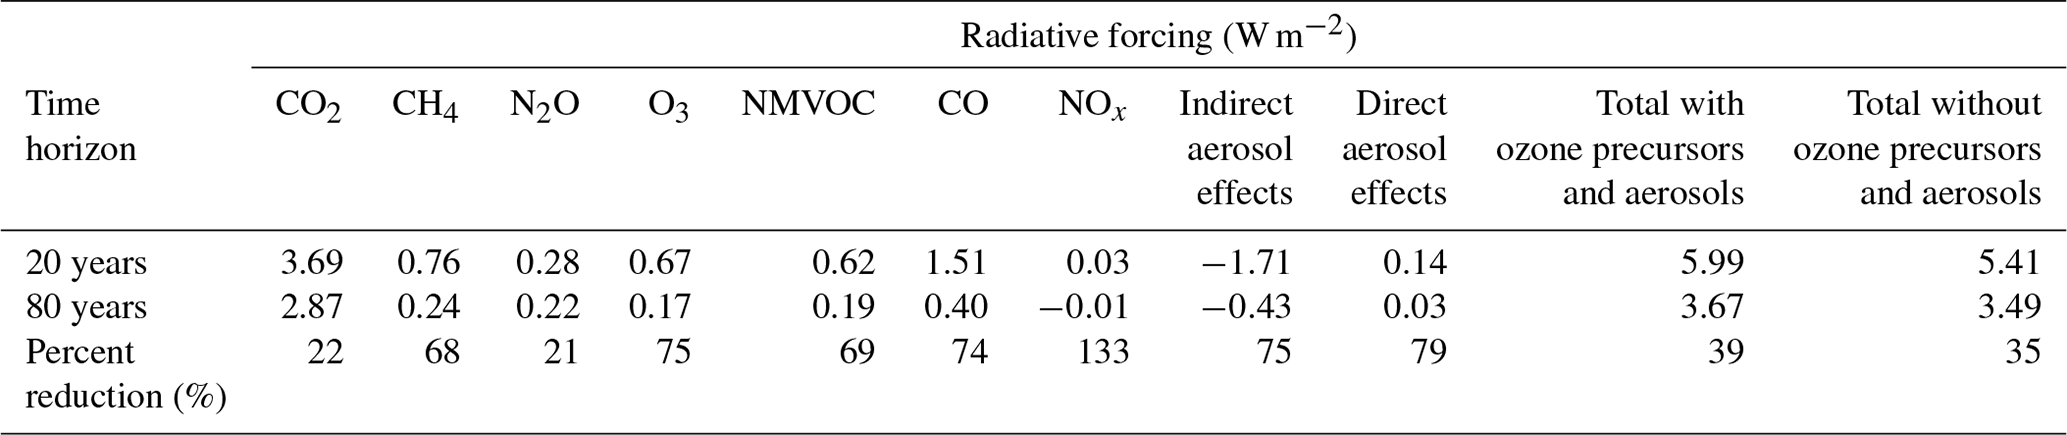
The radiative forcing for gaseous and aerosol emissions from the 2015 fire season was positive for 80 years post-fire according to our model, regardless of the future atmospheric gas concentration scenario (Fig. 4a). However, the magnitude of the fire emissions' radiative forcings decreased with increasing ambient atmospheric gas concentrations, with RCP 8.5 having the lowest radiative forcing at 80 years post-fire (Fig. 4a). Given the lack of qualitative difference across future scenarios, below we present results for the RCP 4.5 scenario only (Table 4, Fig. 4b). Nitrogen oxides were the only gas with a negative radiative forcing at the 80-year cumulative mean. However, they had a positive radiative forcing at the 20-year time horizon (Table 4). The only other negative radiative forcing came from the indirect effect of aerosols that completely counterbalanced the positive radiative forcing from other gaseous emissions in the first year, but the magnitude of this effect in terms of cumulative integrated forcing diminished rapidly after the first decade (Fig. 4b). CO2 produced the highest radiative forcing through 80 years (Table 4, Fig. 4b). Nitrous oxide sustained its positive radiative forcing; however, the radiative forcing was of intermediate magnitude with respect to all gaseous emissions. In contrast, ozone and carbon monoxide exhibited high radiative forcings, but the magnitude of these diminished rapidly with respect to carbon dioxide. Likewise, the effect of the other ozone precursors, aerosols, and methane decreased relatively rapidly (Table 4). Overall, 20 years post-fire, the effect of ozone precursors increased the total radiative forcing by roughly 11 %. However, this percent increase drops to 5 % after 80 years, and the ozone precursors and aerosols show little effect on the percent reduction of the total radiative forcing between 20 and 80 years post-fire. Therefore, the positive radiative forcing is sustained by long-lived gaseous emissions, especially carbon dioxide.
Table 4Cumulative mean radiative forcing at 20- and 80-year time horizons post-fire for different gaseous and aerosol emissions from the 2015 fire season under the RCP 4.5 future scenario. Percent reduction refers to the loss in radiative forcing when considering an 80-year time horizon compared to 20 years.
Here we describe a tundra wildfire season that combusted significant amounts of carbon and had a positive warming effect on the atmosphere due to its gaseous and aerosol emissions over an 80-year time horizon. Our findings suggest that increasingly frequent tundra fire regimes are an understudied source of global GHG emissions. The 2015 fire season in the YKD represents a large efflux of carbon from a wetland tundra ecosystem, generally not considered to be highly vulnerable to fires. In total, we estimate that about 0.911 Tg of carbon was released from 54 154 ha of burned area in the YKD. This fire area is roughly 3 times the 17 000 ha of tundra area burned on average annually between the years 2001 and 2018 in Alaska, but it only accounts for a little more than half of the 83 000 ha of Alaskan tundra that burned in the year 2015 (Scholten et al., 2021). Over the same time frame, the 2015 fire season was the largest to burn in the YKD, with the majority of years burning less than 10 000 ha (Scholten et al., 2021). Total carbon loss was driven by a similar per unit area carbon emission rate as the 2007 Anaktuvuk River fire (Mack et al., 2011), which was roughly twice the size of the fire season reported here and burned predominately moderate to high severity in a tussock tundra ecosystem (Jones et al., 2009). While the current status of tundra ecosystems as a sink or source of carbon remains uncertain, the 2015 YKD fire season alone released about a 10th of the carbon sequestered annually from tundra sink estimates (Virkkala et al., 2021). If tundra ecosystems become a source of carbon to the atmosphere under warming, emissions from tundra wildfires may further exacerbate this positive feedback to warming due to a changing balance between respiration and productivity (Natali et al., 2019; Belshe et al., 2013). Note that we did not account for post-fire effects on net ecosystem exchange of CO2, which tend to be sources to the atmosphere with greater fire severity due to continued soil respiration until sufficient vegetation recovers (Rocha and Shaver, 2011a).
The tundra fires in the YKD and at Anaktuvuk River both lost roughly 1.7 to 2.0 kg m−2 of carbon (Mack et al., 2011). Carbon loss per area from these tundra wildfires is within the range of total above- and belowground carbon loss from boreal wildfires, approximately 0.5 to 4 kg m−2 (Walker et al., 2020a, 2018b; Rogers et al., 2014), and close in value to the median wildfire loss of carbon, 2.54 kg m−2, across all land cover types in Alaska between 2001 and 2012 (Veraverbeke et al., 2015b). Despite the additional combustion of overstory vegetation in forests, carbon loss in both tundra and boreal systems comes primarily from belowground organic matter (Walker et al., 2020a, 2018b; Rogers et al., 2014). Compared to remote-sensing-derived estimates of combustion, our per unit area in situ measurements are on the low end but comparable to large-scale means across Alaska between 2001 and 2018 (Fig. A9). However, more representative field measurements in tundra fires are needed to validate remotely sensed combustion measurements, as the currently available gridded products (Potter et al., 2022; Scholten et al., 2021; Veraverbeke et al., 2017a, 2015a) are driven entirely by measurements in boreal forests. Although data from the Anaktuvuk River and YKD fires show carbon loss per unit area can be similar between boreal and tundra wildfires, information on carbon emissions from tundra wildfires is substantially more limited compared to boreal forest studies (He et al., 2021; Veraverbeke et al., 2021).
Given a fire return interval in the YKD of over around 200 years (Sae-Lim et al., 2019), fires there likely do not burn through all the carbon accumulated since the last fire. However, tundra fires may initiate post-fire successional trajectories, such as increased shrub cover, which may promote shorter fire return intervals (Hu et al., 2015; Rocha et al., 2012). Shorter fire return intervals, in turn, gradually deplete the available soil carbon stocks. For example, He et al. (2021) showed current tundra areas with frequent fire have relatively shallow soil organic layers. Moreover, our radiocarbon data show that as fires burn deeper into the tundra, they release older carbon more rapidly because the density of carbon by age increases. Coupling these burn-prone successional trajectories with projected increases in tundra wildfire occurrence over the next century due to more frequent hot and dry conditions (Hu et al., 2015; Rocha et al., 2012; Joly et al., 2012; Hu et al., 2010), as well as increases in lightning (Chen et al., 2021; Bieniek et al., 2020; Veraverbeke et al., 2017b), tundra wildfires may begin to burn carbon of an older age than the historic fire return interval. In this case, some tundra regions may transition into fire-driven carbon sources, similar to what has been observed in North American boreal forests (Walker et al., 2019).
Immediate combustion is not the only impact wildfires have on tundra carbon stocks, nor do measures of carbon loss fully describe the effect of wildfire emissions on the climate. Fires drive higher soil temperatures and deeper active layer depths that can persist over multiple decades after fire (He et al., 2021; Hu et al., 2015; Rocha et al., 2012), which is caused by the loss of insulating vegetation and upper soil layers from combustion (Rocha and Shaver, 2011b). Higher soil temperatures and deeper active layer depths may catalyze permafrost degradation and thermokarst development (Jones et al., 2015) that accelerate the effects of climate warming on tundra ecosystems. Tundra fires also emit multiple gaseous and aerosol species, which have a net positive radiative forcing for at least 80 years post-fire. Hence, even if all of the carbon lost from fire in a tundra ecosystem were to be sequestered again over time through increased photosynthesis, the long-term radiative impact of gaseous and aerosol emissions would still generate atmospheric warming and thus positive climate feedbacks, which are amplified by the post-fire permafrost thaw and degradation not accounted for in this study.
This positive radiative forcing is driven by sustained radiative forcings from long-lived GHGs, as well as significant contributions from short-lived climate forcers (SCLFs) such as ozone, NMVOCs, and CO. Carbon dioxide has the highest radiative forcing at both short and long time horizons because it is emitted in the highest quantity (Akagi et al., 2011), and its concentration decreases relatively slowly over time, especially in the RCP 4.5 and 8.5 scenarios (Joos et al., 2013). Aerosols and NOx are SCLFs with both positive and negative radiative forcings due to distinct mechanisms for affecting the Earth's radiative balance. Aerosols exert a direct radiative forcing by reflecting or absorbing sunlight in the atmosphere and when deposited on high-albedo surfaces, mainly snow and ice (Bond et al., 2011). Although black carbon aerosols have a positive direct radiative forcing effect and organic carbon aerosols have a negative direct radiative forcing effect, the magnitude of black carbon's radiative forcing far exceeds that from organic carbon (Myhre et al., 2013) (note these are combined in our representation). Indirectly, aerosols serve as the nuclei for cloud formation, which increases the Earth's albedo and exerts a negative radiative forcing (Ward et al., 2012). Nitrogen oxides have a near-term positive radiative forcing because they act in concert with NMVOCs and CO to increase ozone concentrations, yet they have a long-term negative radiative forcing because they decrease the lifetime of CH4 (Collins et al., 2013).
We include a total radiative forcing with and without aerosols and ozone precursors, CO, NMVOCs, and NOx. The radiative forcing of these ozone precursors and aerosols is uncertain within current literature, especially when originating in the Arctic, because of their short atmospheric lifetimes and dependence on regional transport patterns (Bond et al., 2011; Quinn et al., 2008). However, the long-term cumulative radiative effect of these gaseous emissions is relatively minimal in comparison to the long-lived GHGs and ozone, and both estimates of total radiative forcing are of the same order of magnitude as previous estimates of the radiative forcing of gaseous emissions from boreal forest fires (Huang et al., 2016; O'Halloran et al., 2012).
We found that as the predicted concentration of future emissions increases across RCP scenarios (Meinshausen et al., 2011), the net radiative forcing of gaseous and aerosol emissions from the fires decreases slightly. Although counterintuitive, this result is due to the dependency of the radiative forcing equations for long-lived GHGs, namely CO2, CH4, and N2O, on the ambient concentration of a gas. In more extreme future climate scenarios, the atmosphere generally has higher concentrations of these GHGs, meaning the additional quantity of gas emitted by fire has a more diluted effect. This effect is largely counterbalanced by the fact that land and ocean CO2 sink capacities are diminished in more extreme future climate scenarios, leading to longer atmospheric CO2 lifetimes (Fig. A10). The net result is that tundra wildfires have a relatively similar positive radiative forcing under all future emissions scenarios.
While the positive radiative forcing due to gaseous emissions we calculate for the 2015 YKD fire season is within the range of previously calculated radiative forcings for gaseous emissions from boreal wildfires (e.g., Huang et al., 2016; Randerson et al., 2006), boreal forests also have significant multi-decadal post-fire albedo changes due predominantly to the combustion of overstory trees that expose snow in the fall, winter, and spring (Lyons et al., 2008). Randerson et al. (2006) and O'Halloran et al. (2012) show that the negative radiative forcing of these albedo changes can exceed the positive radiative forcing of gaseous emissions and generate a net cooling effect for boreal forest fires over long time horizons in specific locations. It should be noted, however, that (i) the net cooling or warming is heavily dependent on combustion levels, pre-fire canopy composition, and time horizon; (ii) fire-induced albedo forcings predominantly impact the regional climate (Rogers et al., 2013), as opposed to globally mixed GHGs; and (iii) this cooling impact is expected to diminish with future climate change due to decreases in spring snow cover (Potter et al., 2020).
In contrast, tundra ecosystems lack an overstory, and hence fires generate relatively short-lived decreases in albedo (Rocha et al., 2012; French et al., 2016). These albedo changes are only caused by char and the exposed soil surface in the summer because tundra vegetation rarely exists above the snow layer (Mack et al., 2011). As a result, within 4 years after the Anaktuvuk River fire, low post-fire surface albedo recovered to its pre-fire reflectance as the vegetation grew over the charred soil surface (French et al., 2016; Rocha and Shaver, 2011b). The decreased surface reflectance contributes to increases in soil temperature and thaw depth after fire (Rocha and Shaver, 2011b). Therefore, the positive radiative forcing caused by tundra wildfire gaseous and aerosol emissions is not offset by post-fire albedo changes as seen in boreal forest fires. From 2001 to 2018 about 0.5 Mha of boreal forest burned on average yearly compared to a yearly average of 0.017 Mha of tundra in Alaska (Scholten et al., 2021). Across the entire Arctic region, about 9.0 Mha of boreal forest and 0.66 Mha of tundra burned on average yearly between the years 1997 and 2016 (Van der Werf et al., 2017; biome extents defined by Dinerstein et al., 2017). Given potentially comparable per area emissions from boreal and tundra fires, boreal fires still release more carbon globally. Future work could compare the total radiative forcing of tundra and boreal wildfires across their global domains by integrating gaseous, albedo, and other climate forcing effects for each biome. The predicted increase in frequency of tundra wildfires, their lack of cooling from post-fire albedo, and their contribution to increased permafrost thaw could drive a net radiative forcing higher than boreal wildfires, which in some cases may cool the climate (Oris et al., 2014; O'Halloran et al., 2012; Randerson et al., 2006).
For the purpose of calculating the radiative forcing of wildfires in future research, we make our computational code available on GitHub (see “Code and data availability” section). Our workflow is applicable to wildfires in other arctic–boreal ecosystems, and it could be applied to any ecosystem globally with the adjustment of emissions factors for the specific material burning (Akagi et al., 2011) and global warming potentials for SCLFs based on the geographic region of the wildfire (Myhre et al., 2013). As a result, our method of calculating the radiative forcing of wildfires can be used for studies across multiple regions with the appropriate parameters, which can advance a more complete understanding of the effects of wildfires on the climate.
Future work could clarify some of the uncertainties that were not explicitly analyzed in our final estimates of carbon loss and radiative forcing. We did not account for combustion of aboveground tall woody vegetation in our estimates of carbon loss from the YKD fires. Although woody biomass is relatively sparse on the YKD landscape, it represents an additional source of carbon from combustion (for boreal forest fires, see Walker et al., 2020c). Despite the lack of difference we found between soil and vegetation matter characteristics across vegetative reference-point groups, there could have been variation in these characteristics outside of the primarily peat plateau areas that we sampled. Burn depth estimated between Dicranum reference points was more variable (although not significantly different) than burn depth estimated between Sphagnum reference points. This variation could indicate more variable burn dynamics around Dicranum or better efficacy of Dicranum for measuring extreme burn depths, which highlights the potential bias introduced by choosing specific combustion markers. Likewise, we eliminated tussock measurements from our final analysis because they were relatively scarce on the landscape and yielded inconsistent results, perhaps due to burn dynamics around tussocks that remain obscure using our combustion measurement method. Minimizing potential bias by identifying combustion markers and soil characteristics for different land cover types at a higher resolution within a fire, similar to how different combustion markers are used regionally (Walker et al., 2020c; Mack et al., 2011; Boby et al., 2010), would further improve estimates of carbon loss following wildfire in tundra systems.
Our assignment of low, moderate, and high severity was based on our particular collection of field measurements and therefore may not translate well to other fire complexes. While dNBR is widely used to assess fire severity, its accuracy in high-latitude tundra systems may be diminished by environmental and methodological factors, such as the timing of image selection and rapid post-fire greening (D. Chen et al., 2020; Loboda et al., 2013). Other remotely sensed products have shown promise in tundra (e.g., Y. Chen et al., 2020), but the applicability of these results to other tundra systems remains to be explored. Within low-severity areas, there were likely patches of unburned tundra, potentially leading us to overestimate organic matter and carbon loss measurements. We also used a relatively simple method for extrapolating emissions based on fire severity. More involved techniques such as relating mechanism-based geospatial predictors to field plots using statistical techniques and machine learning, which has been employed for boreal forests in Alaska and Canada (Dieleman et al., 2020; Walker et al., 2018b; Veraverbeke et al., 2015b; Rogers et al., 2014), would likely yield more robust estimates for regional emissions. In this context, we strongly recommend increasing the number of tundra fire carbon emission observations in different regions to facilitate synthesis and biome-wide modeling, as has been done for boreal forests (Walker et al., 2020a, b, c).
Our radiative forcing model uses data and algorithms from multiple previous studies, including for emissions factors (Akagi et al., 2011), RCP scenarios (Meinshausen et al., 2011), GWPs (Myhre et al., 2013), ozone and CO concentration ratios (Jaffe and Widger, 2012), and aerosol direct and indirect effects (Ward et al., 2012), all of which may not be geographically, biologically, or temporally specific to the YKD fires. These factors are also known to be variable depending on fuel types, fire severity and lifetime, and atmospheric dynamics at the time of and following fire (e.g., Wiggins et al., 2016; Jaffe and Widger, 2012; Chen et al., 2009). Since emissions factors for tundra burning were not available, we used emissions factors for burning boreal vegetation. Using boreal emissions factors may overestimate emissions from woody vegetation in tundra and thereby increase the mass of certain gasses released. Similarly, boreal emissions factors might also misrepresent other tundra-specific gaseous emissions due to different soil and herbaceous vegetation compositions in the two biomes. Future research could integrate the range of variation associated with emission factors to quantify the uncertainty they introduce into radiative forcing estimates and directly measure the emissions factors of biomass combustion in tundra ecosystems for more accurate radiative forcing estimates. We include estimates of radiative forcing with and without SCLFs because the radiative forcings of SCLFs emitted from the Arctic are uncertain in current literature. Additional studies assessing how regional atmospheric patterns, emission location, and abbreviated atmospheric lifetimes govern the radiative forcing of SCLFs would constrain this uncertainty. Furthermore, our model does not include the potential mitigating or exacerbating effects of post-fire ecosystem changes on gas concentrations, such as changes in post-fire vegetation (Frost et al., 2020; Zhou et al., 2019; Barrett et al., 2012), increased soil respiration (Rocha and Shaver, 2011a), and increased active layer depths and permafrost degradation (Holloway et al., 2020; Jafarov et al., 2013; Rocha et al., 2012). With reparameterizations specific to individual fires, our model could be made more accurate for future work.
To our knowledge, our study is the first to account for both carbon loss and radiative forcing from tundra wildfires. We develop a method that pairs in situ measurements of combustion levels from local pre-fire reference points with remotely sensed burn severity data to scale organic matter and carbon loss to the entire fire area. Our estimate of the radiative forcing of gaseous and aerosol emissions from the fire event suggests that tundra wildfires positively reinforce climate warming; however, the role of post-fire vegetative regeneration in mitigating these carbon emissions remains unknown. Our results stress the importance of considering tundra wildfires in assessing climate feedbacks and the need for future research that more explicitly discerns the warming effect of fires across the tundra biome.
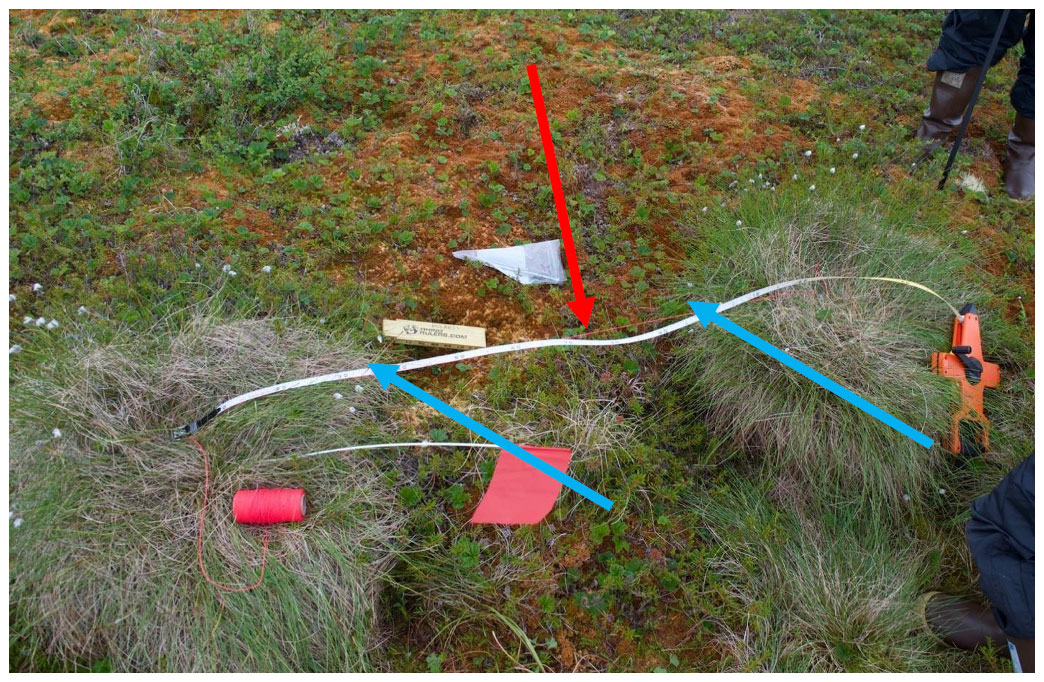
Figure A1Height measurement of Eriophorum vaginatum in an unburned area from the taut string (red arrow) to the dense vegetation layer between the starting and ending points (blue arrows) at the edge of each tussock patch.
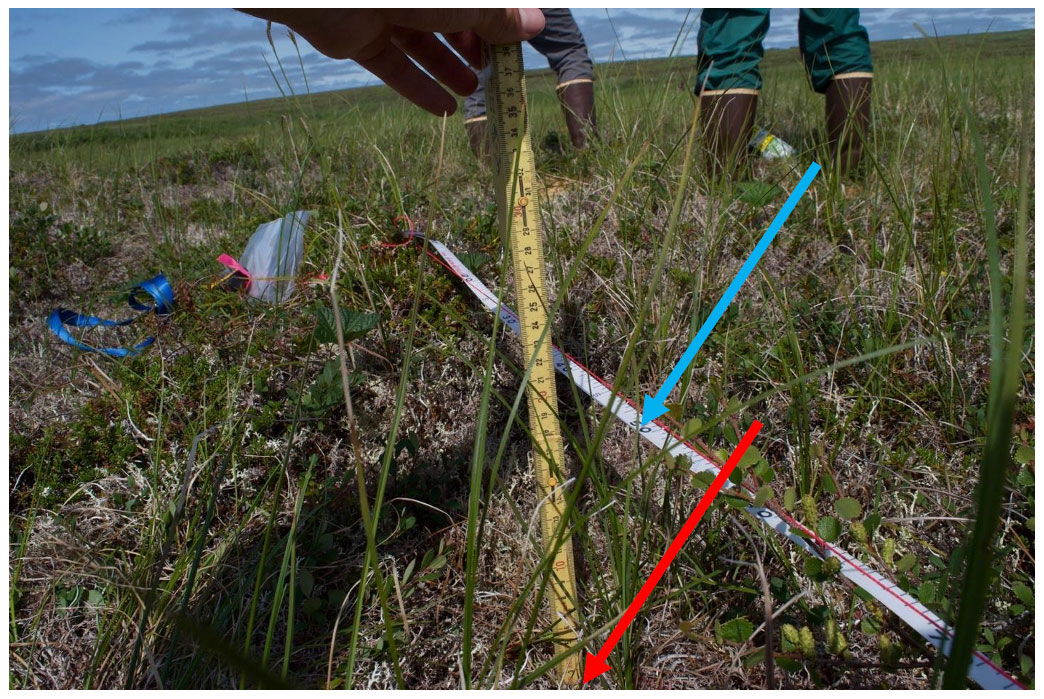
Figure A2Measurement from the taut string to the dense vegetative layer (red arrow) in an unburned area every 25 cm (blue arrow).
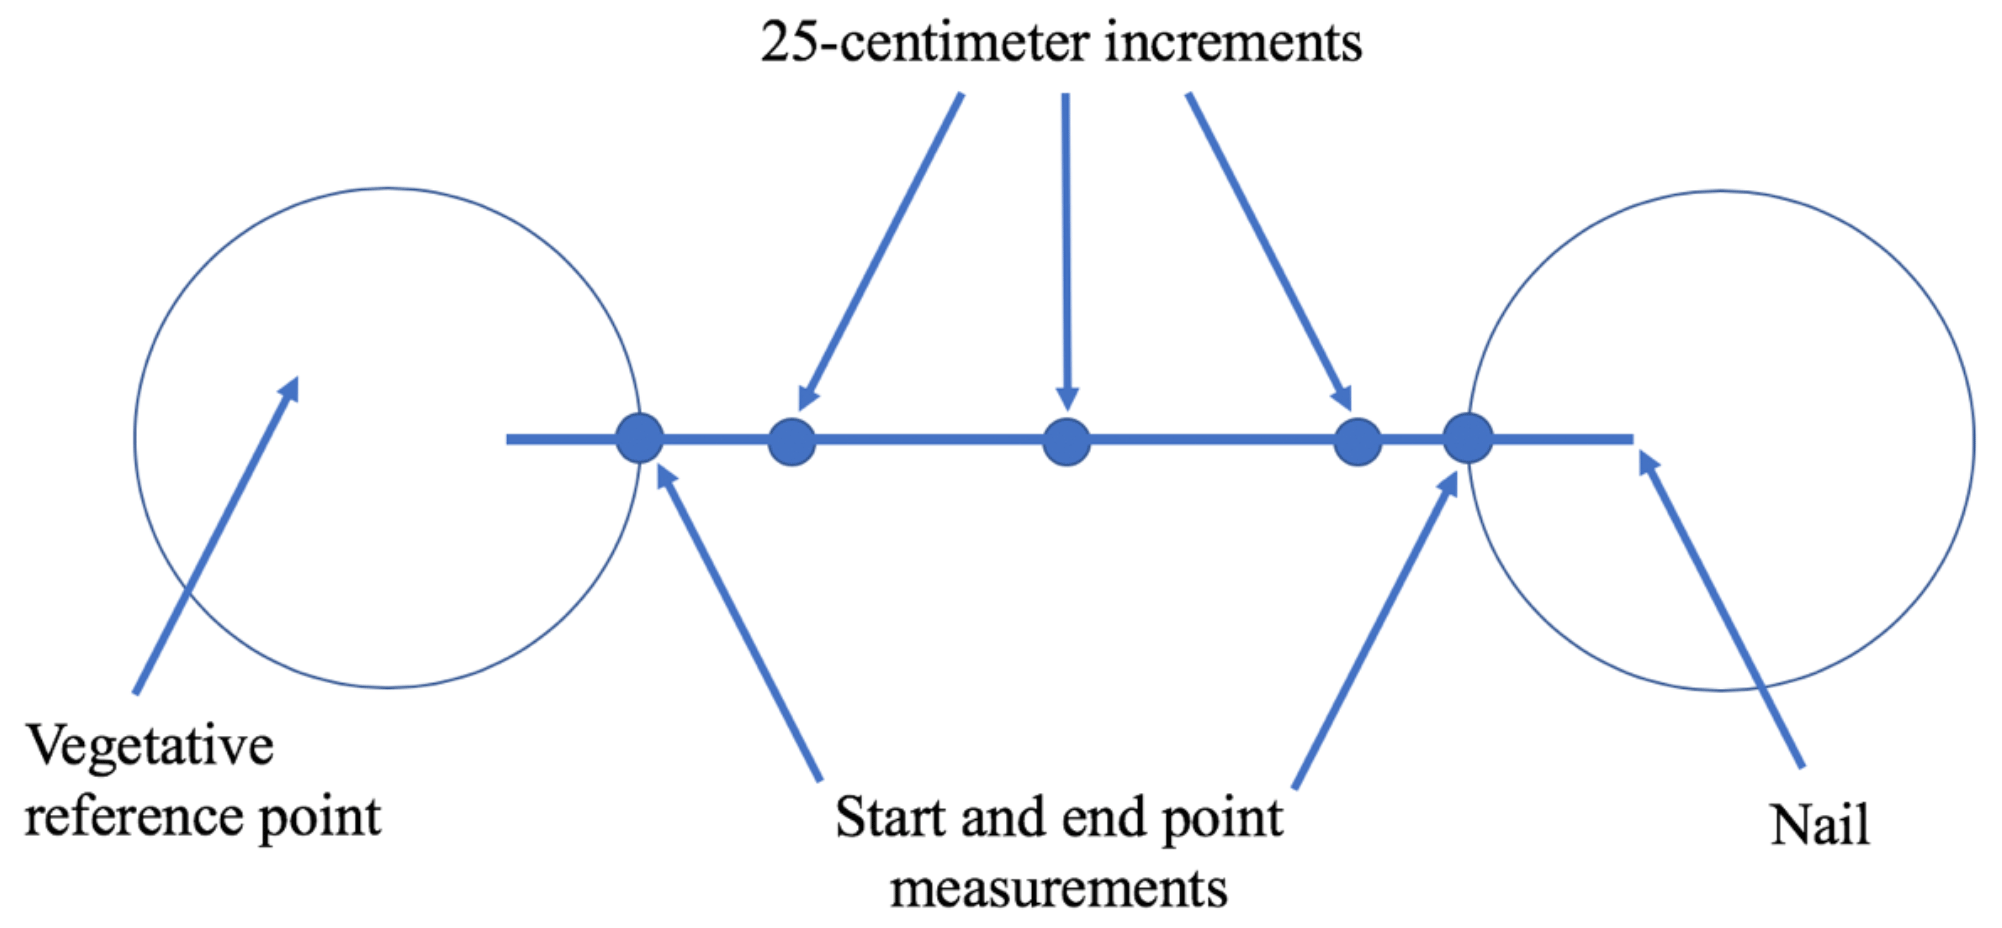
Figure A3A schematic of the height measurements made along a transect between two vegetative reference points.
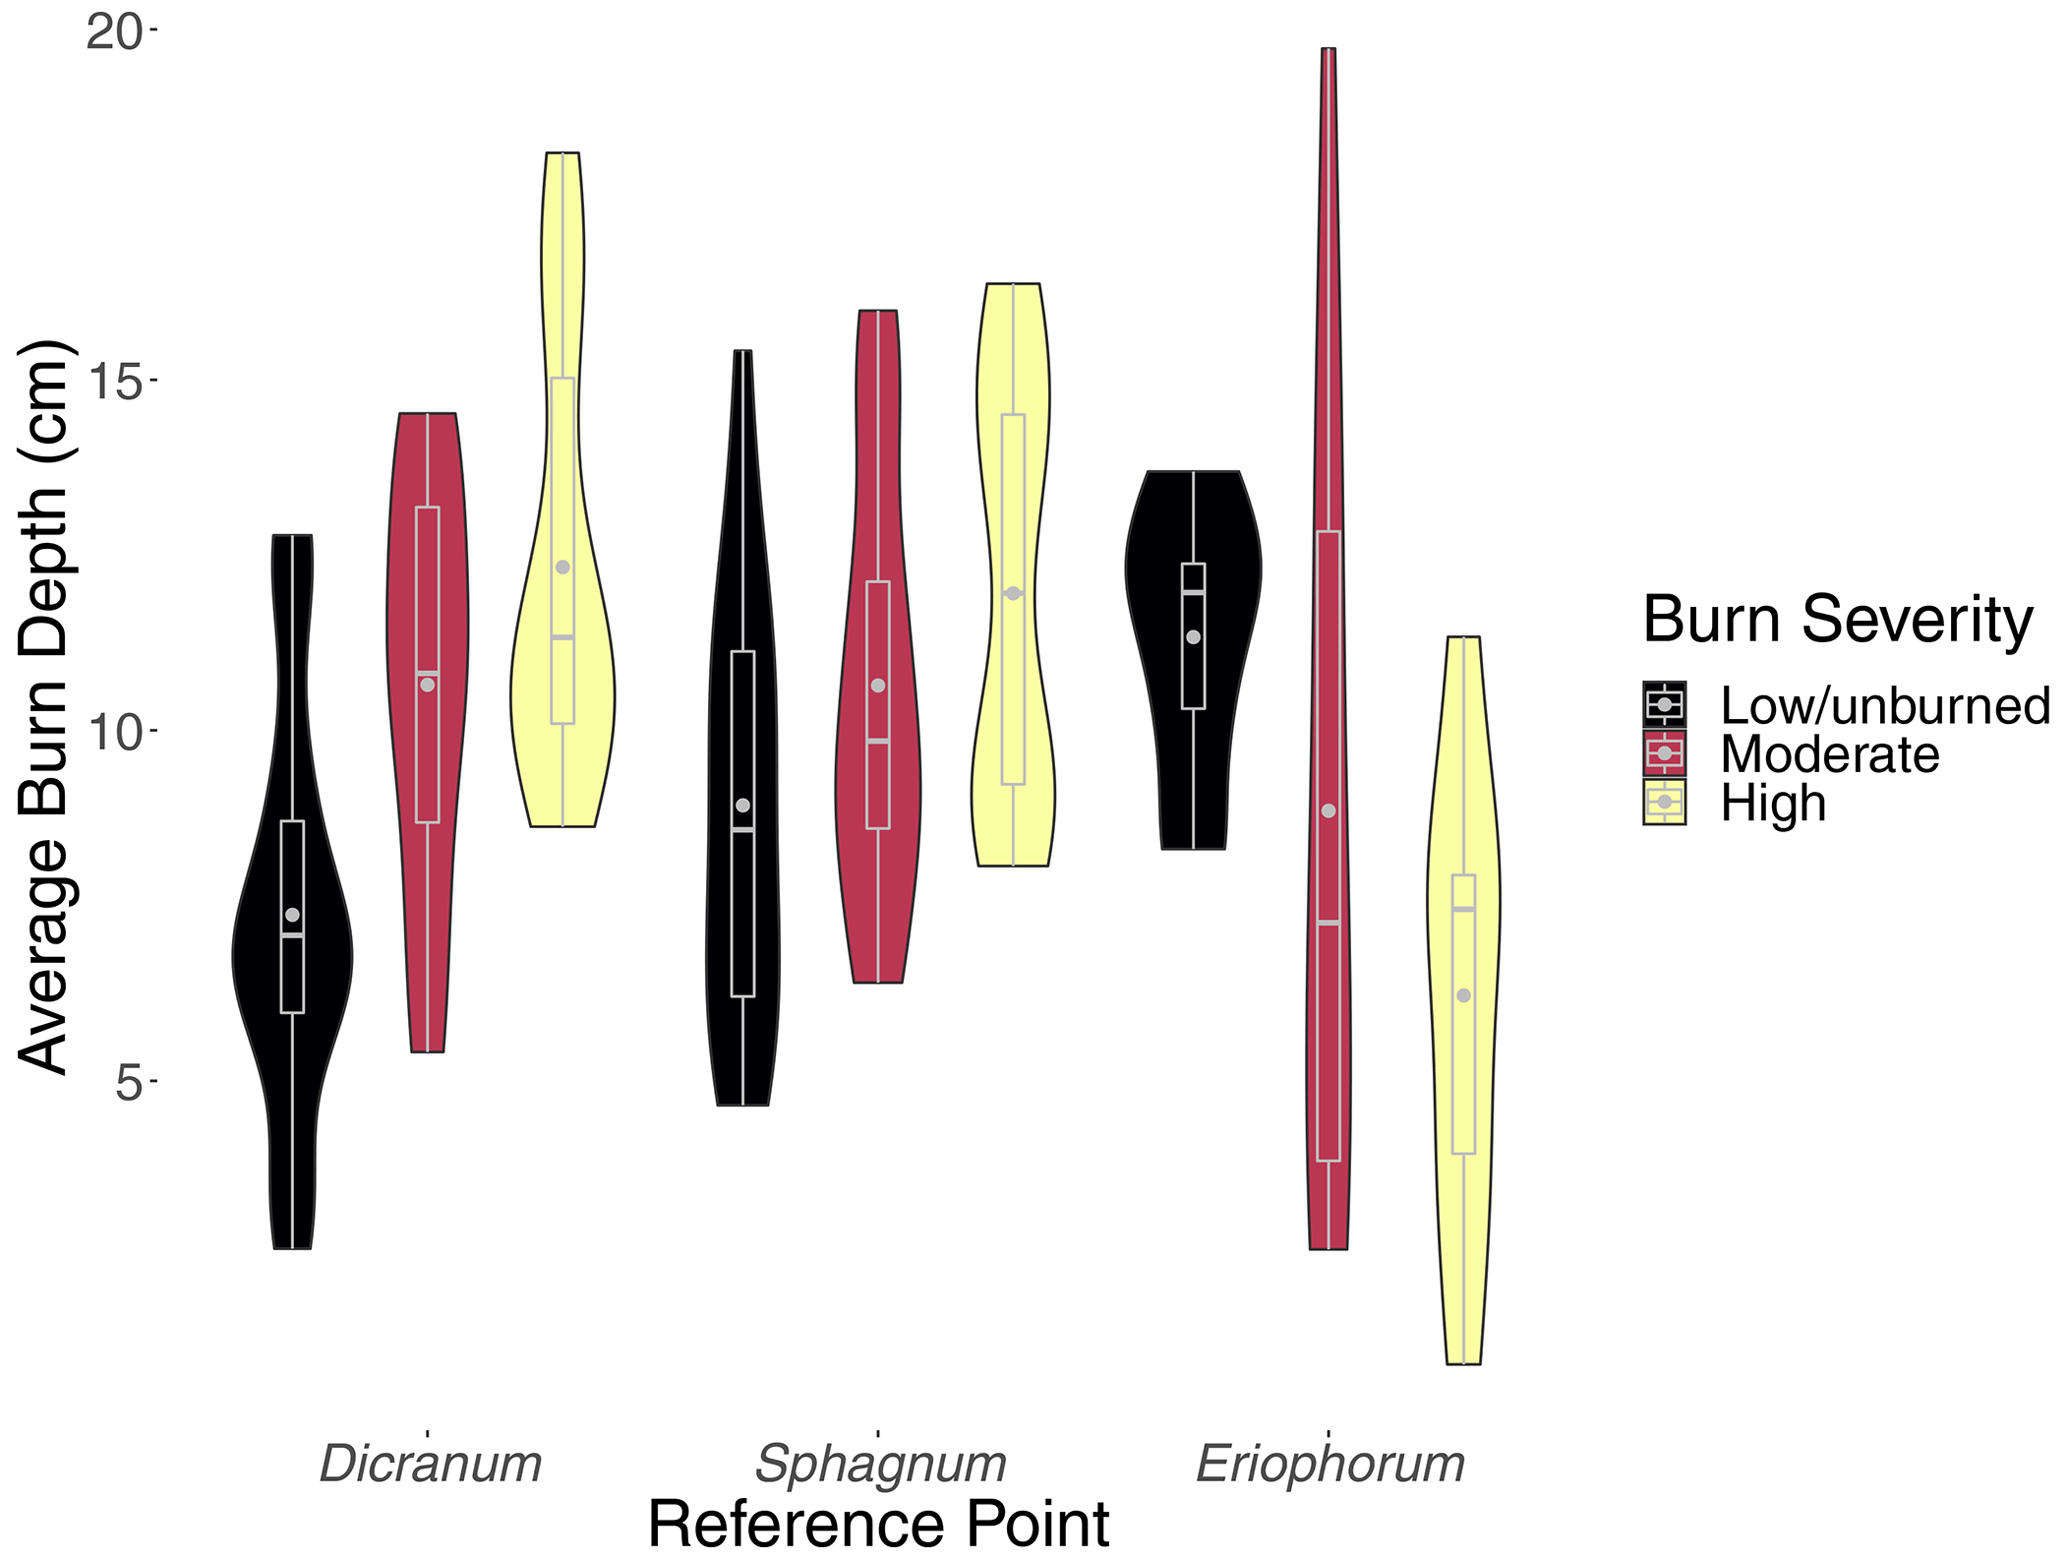
Figure A4The distributions of average burn depth per transect within each reference point (including Eriophorum vaginatum) across burn severity. Boxes encompass the middle 50 % of data, whiskers are the upper and lower quartiles, horizontal lines intersecting boxes show the median, and gray points are the mean.
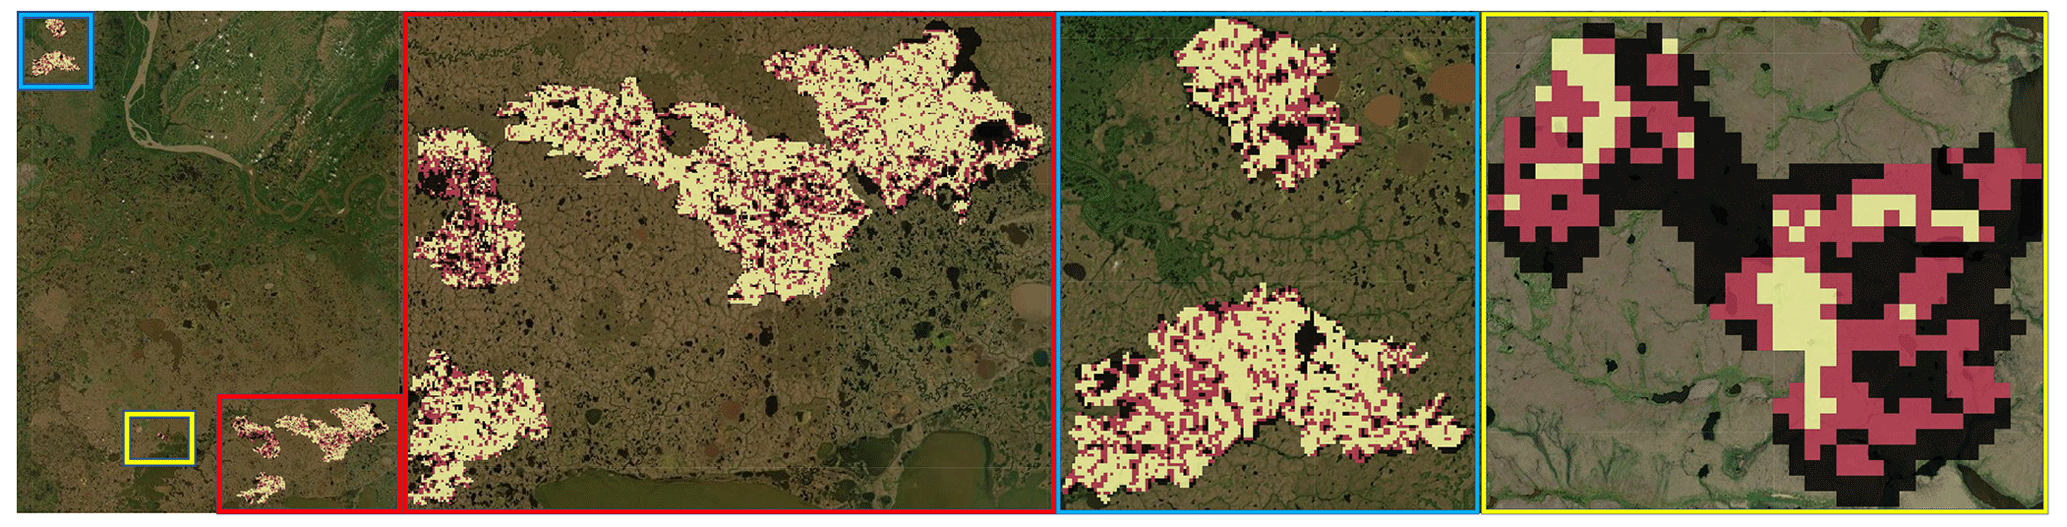
Figure A5Fire severity across the YKD 2015 fire area categorized using dNBR values into low-severity/unburned (black), moderate-severity (red), and high-severity (yellow) categories. The panels show the total fire area (far left), then close-ups of the southeastern (red), northwestern (blue), and south-central (yellow) fire scars, respectively. Basemap sources: Esri, DigitalGlobe, GeoEye, i-cubed, USDA FSA, USGS, AEX, Getmapping, Aerogrid, IGN, IGP, swisstopo, and the GIS user community.
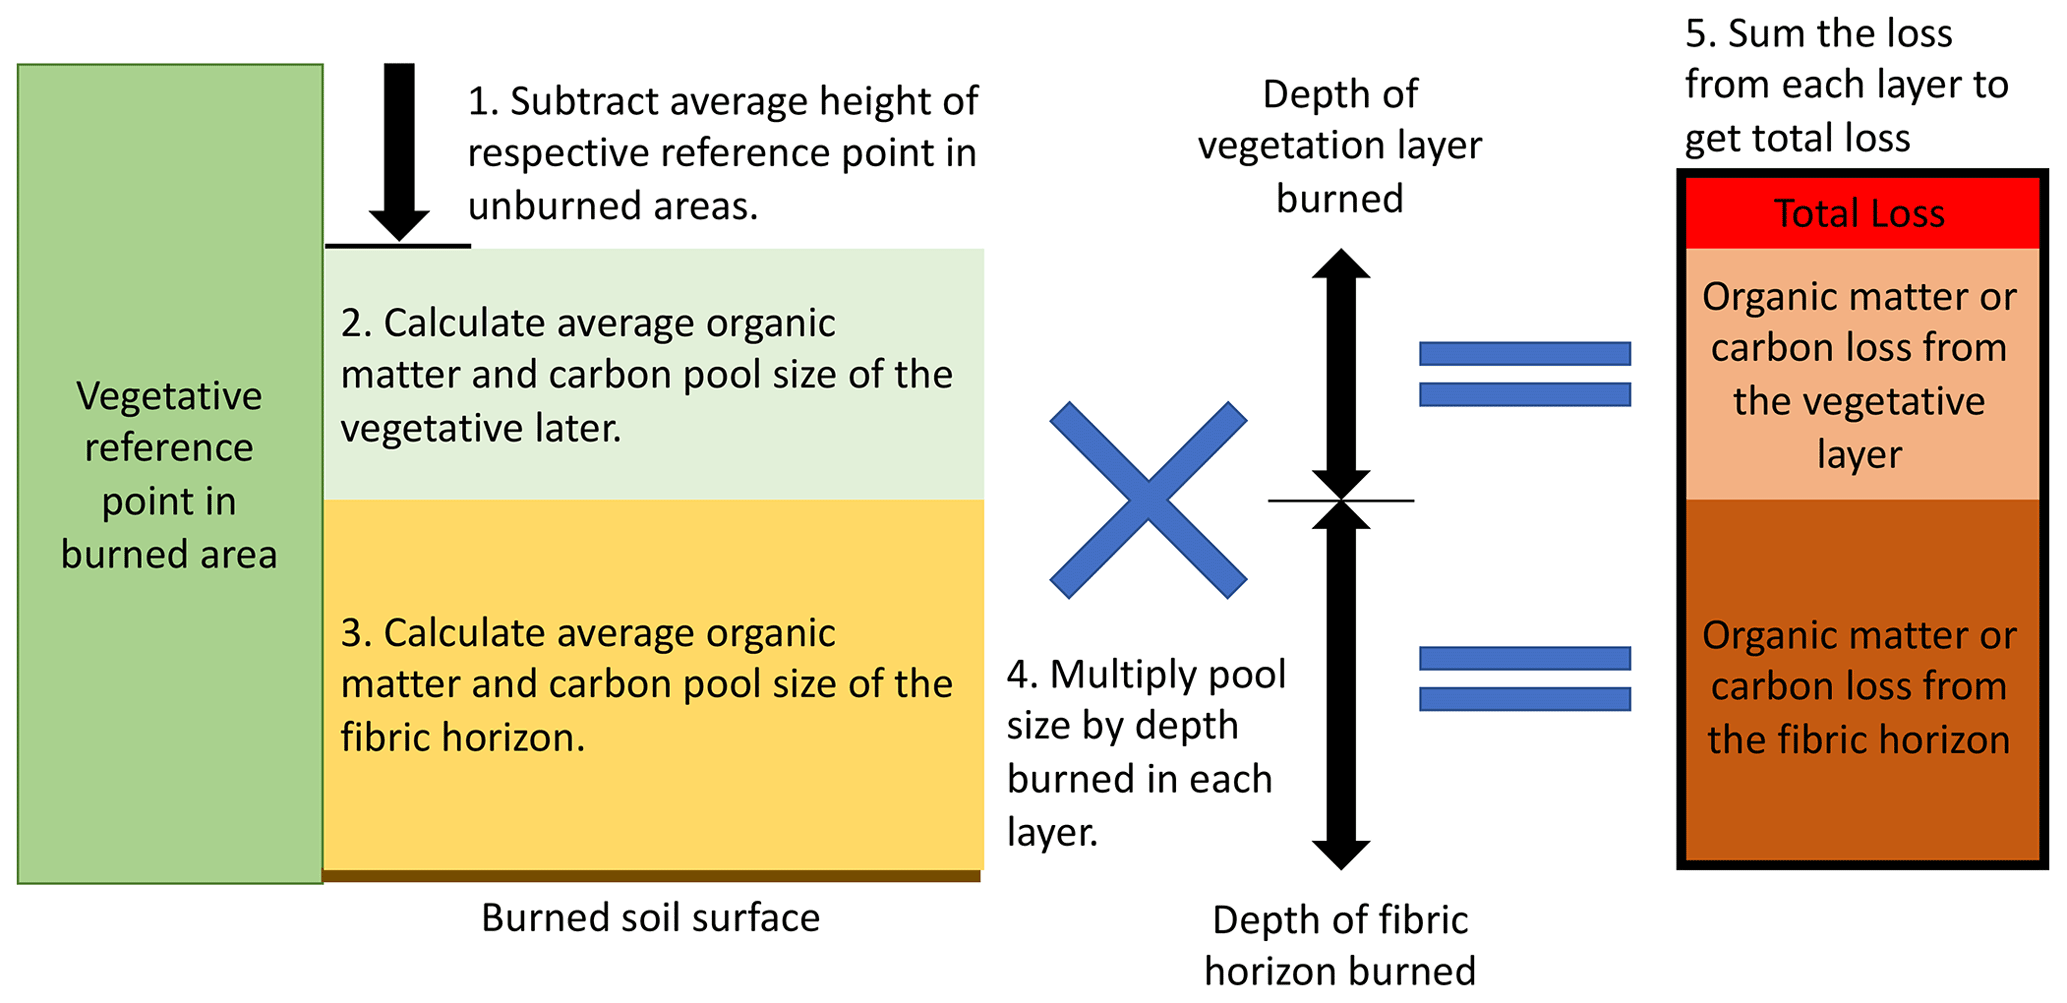
Figure A6A schematic of organic matter and carbon loss calculations at a single transect in the burned area.
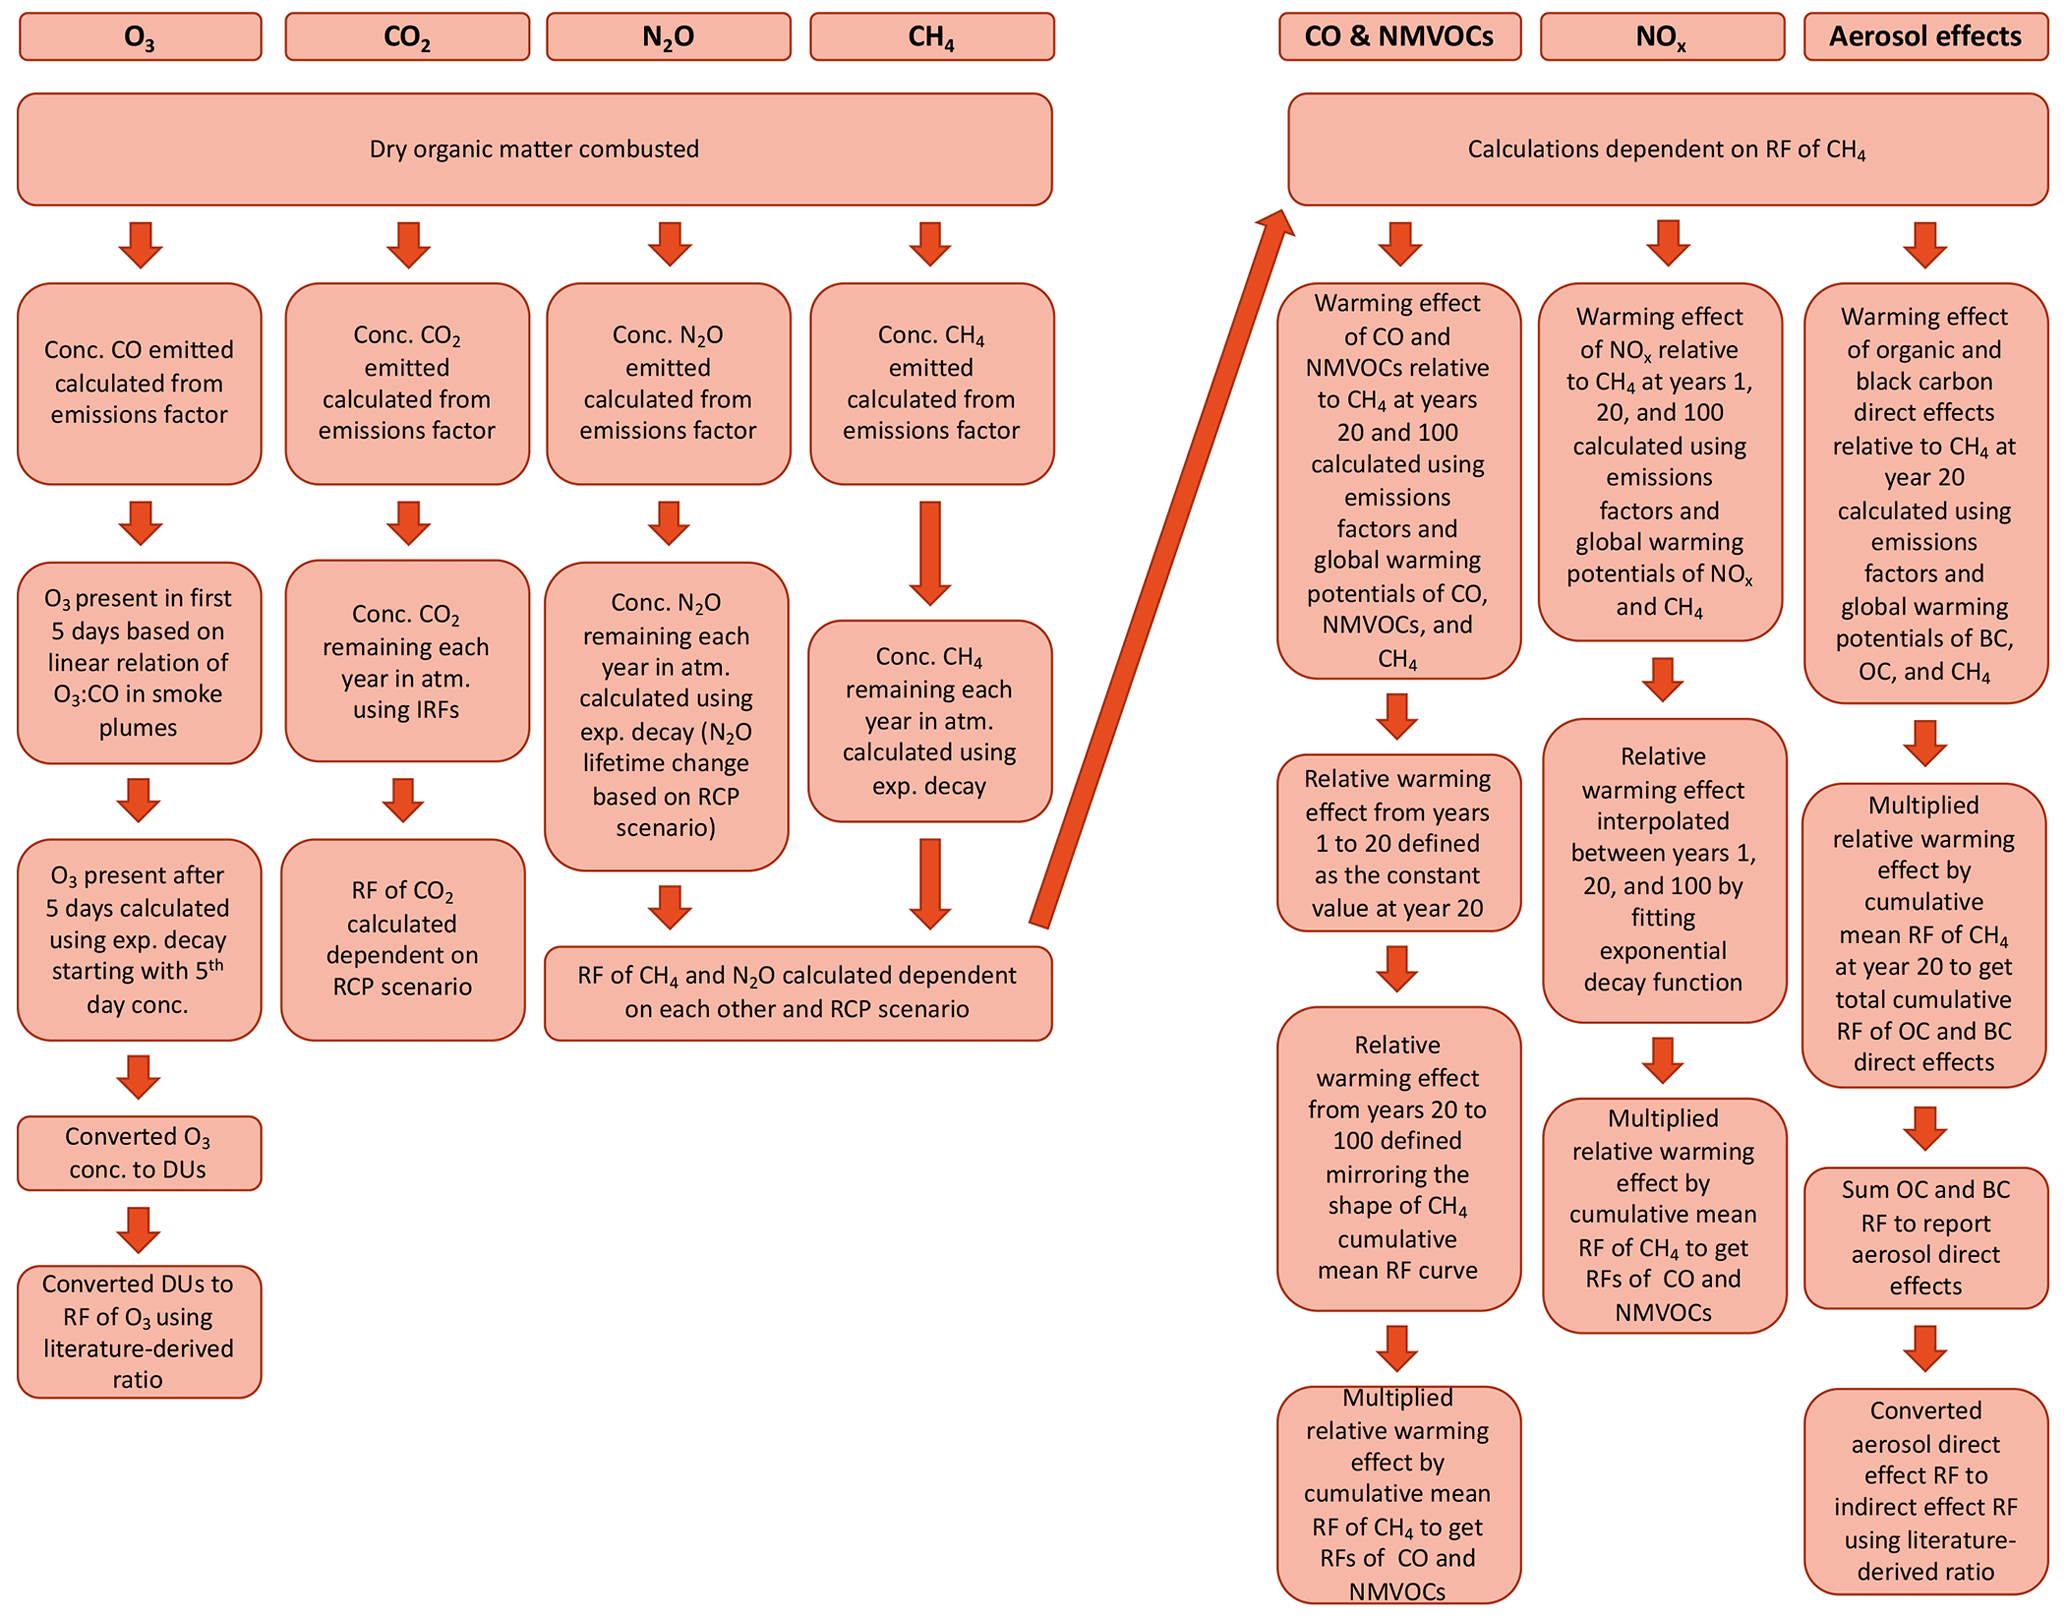
Figure A7Flowchart of the methodology for the calculation of the radiative forcings of gaseous emissions from biomass combustion generally applicable to any biome with adjustment of biome-specific parameters.
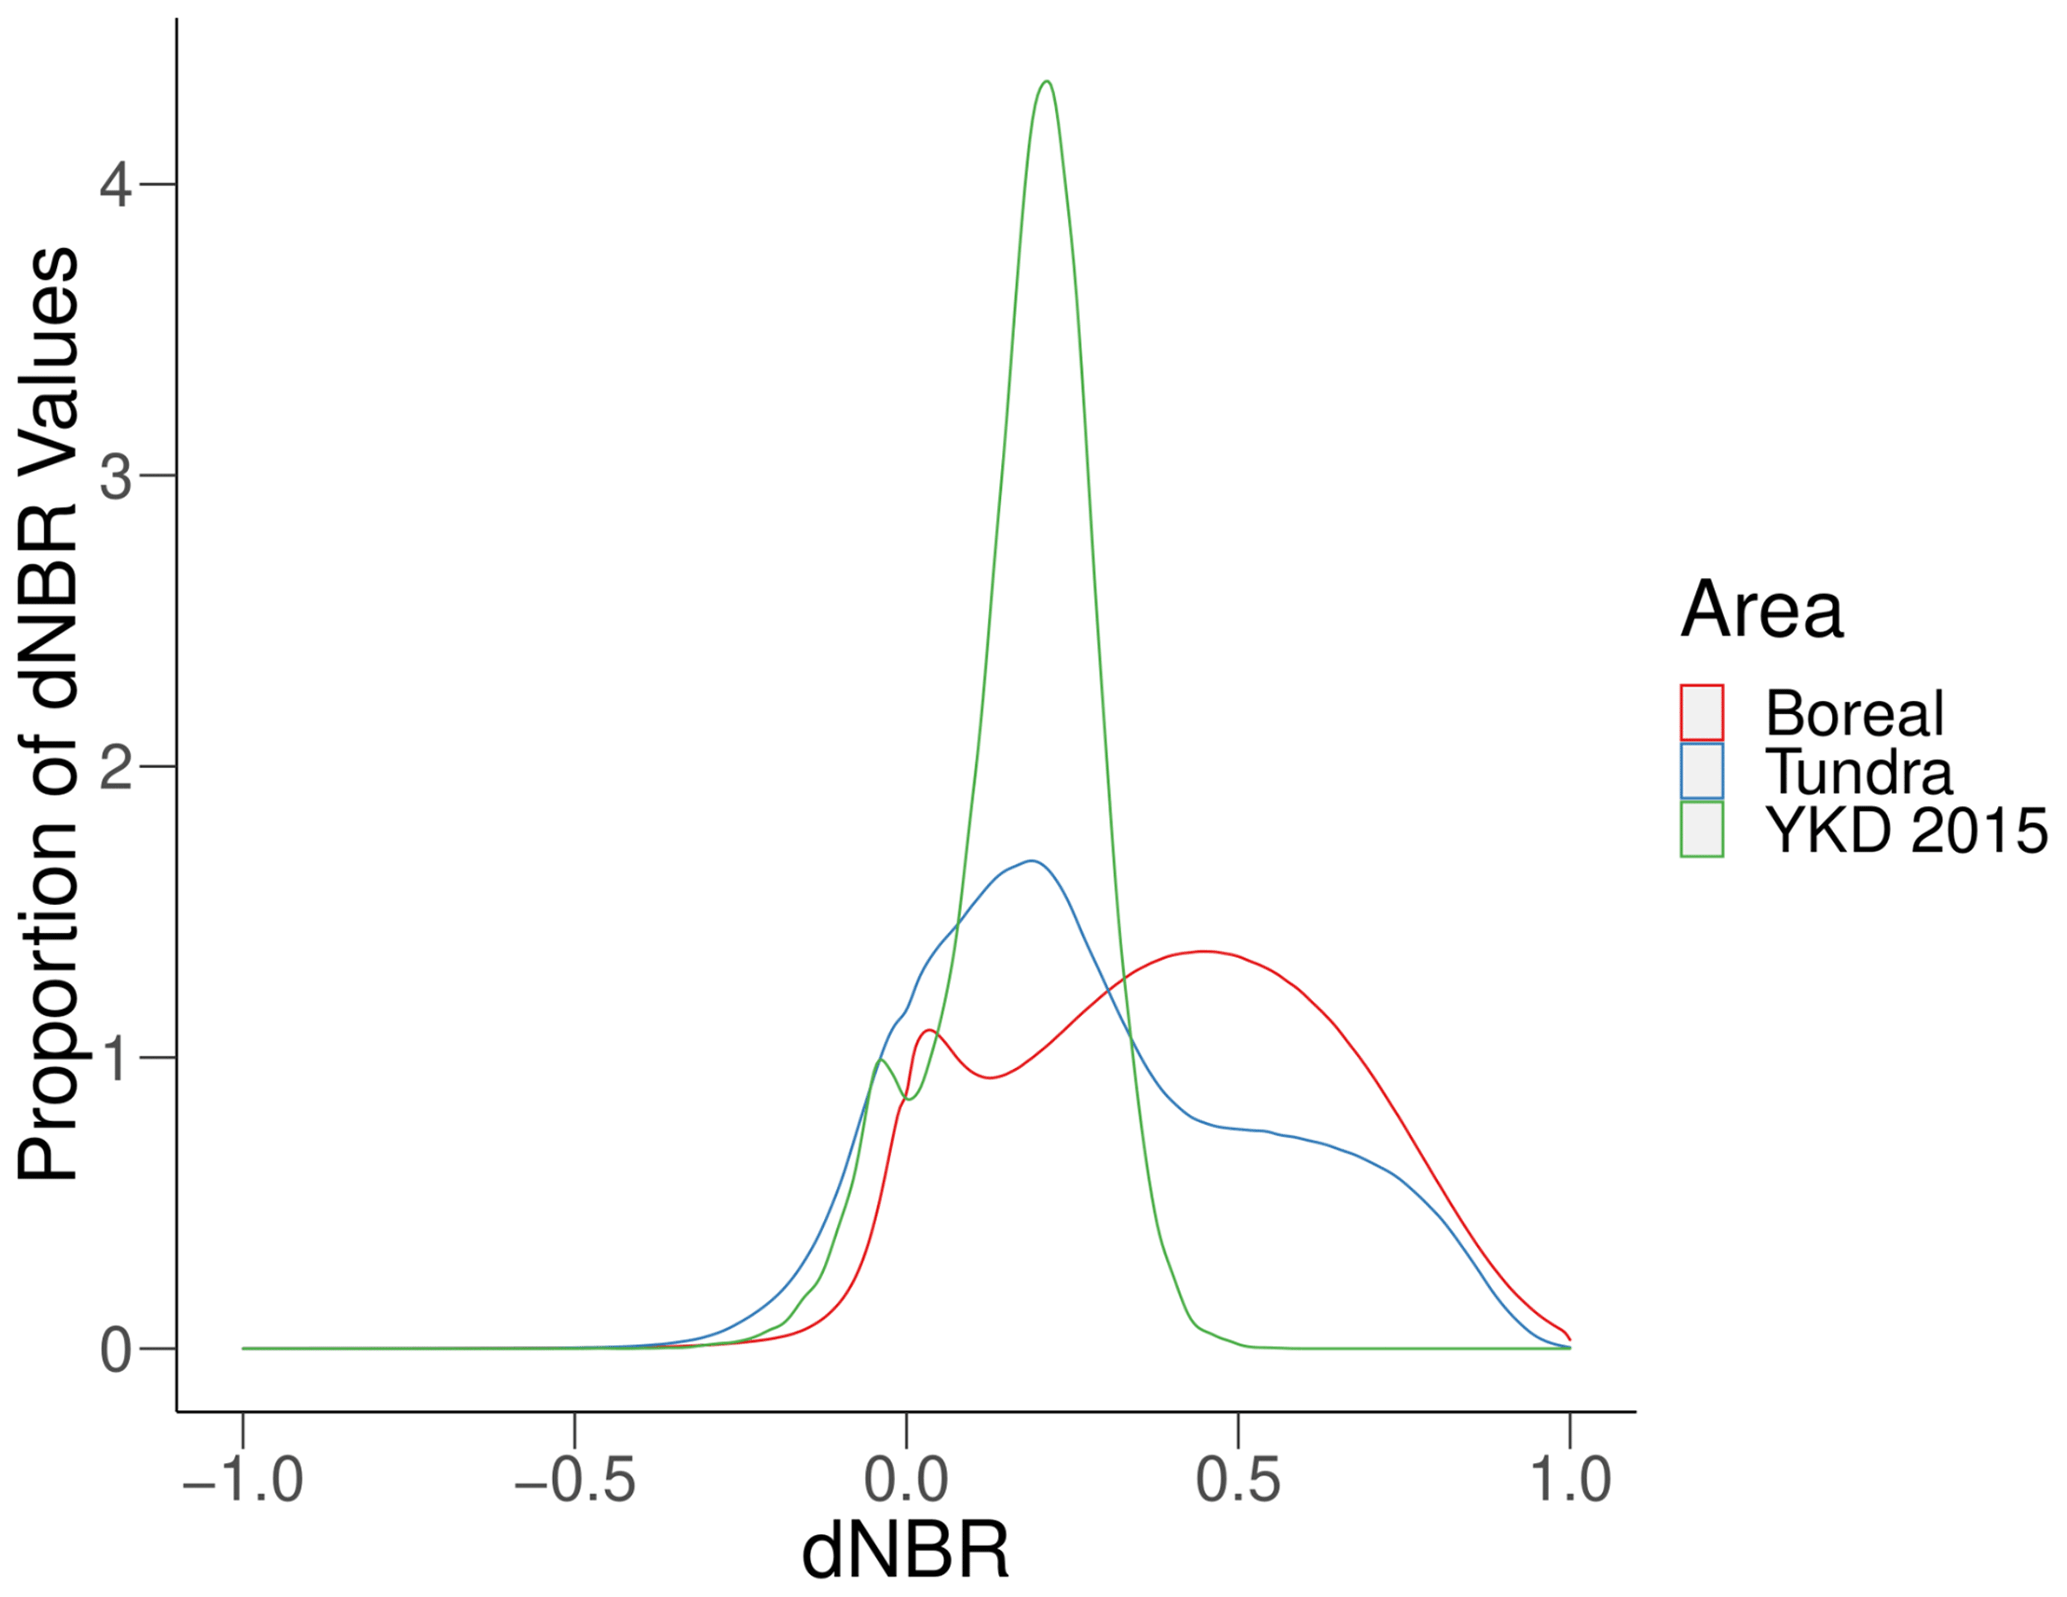
Figure A8The distribution of dNBR values for the 2015 YKD fire season compared to all fires in boreal and tundra systems in Alaska between the years 1989 and 2019.
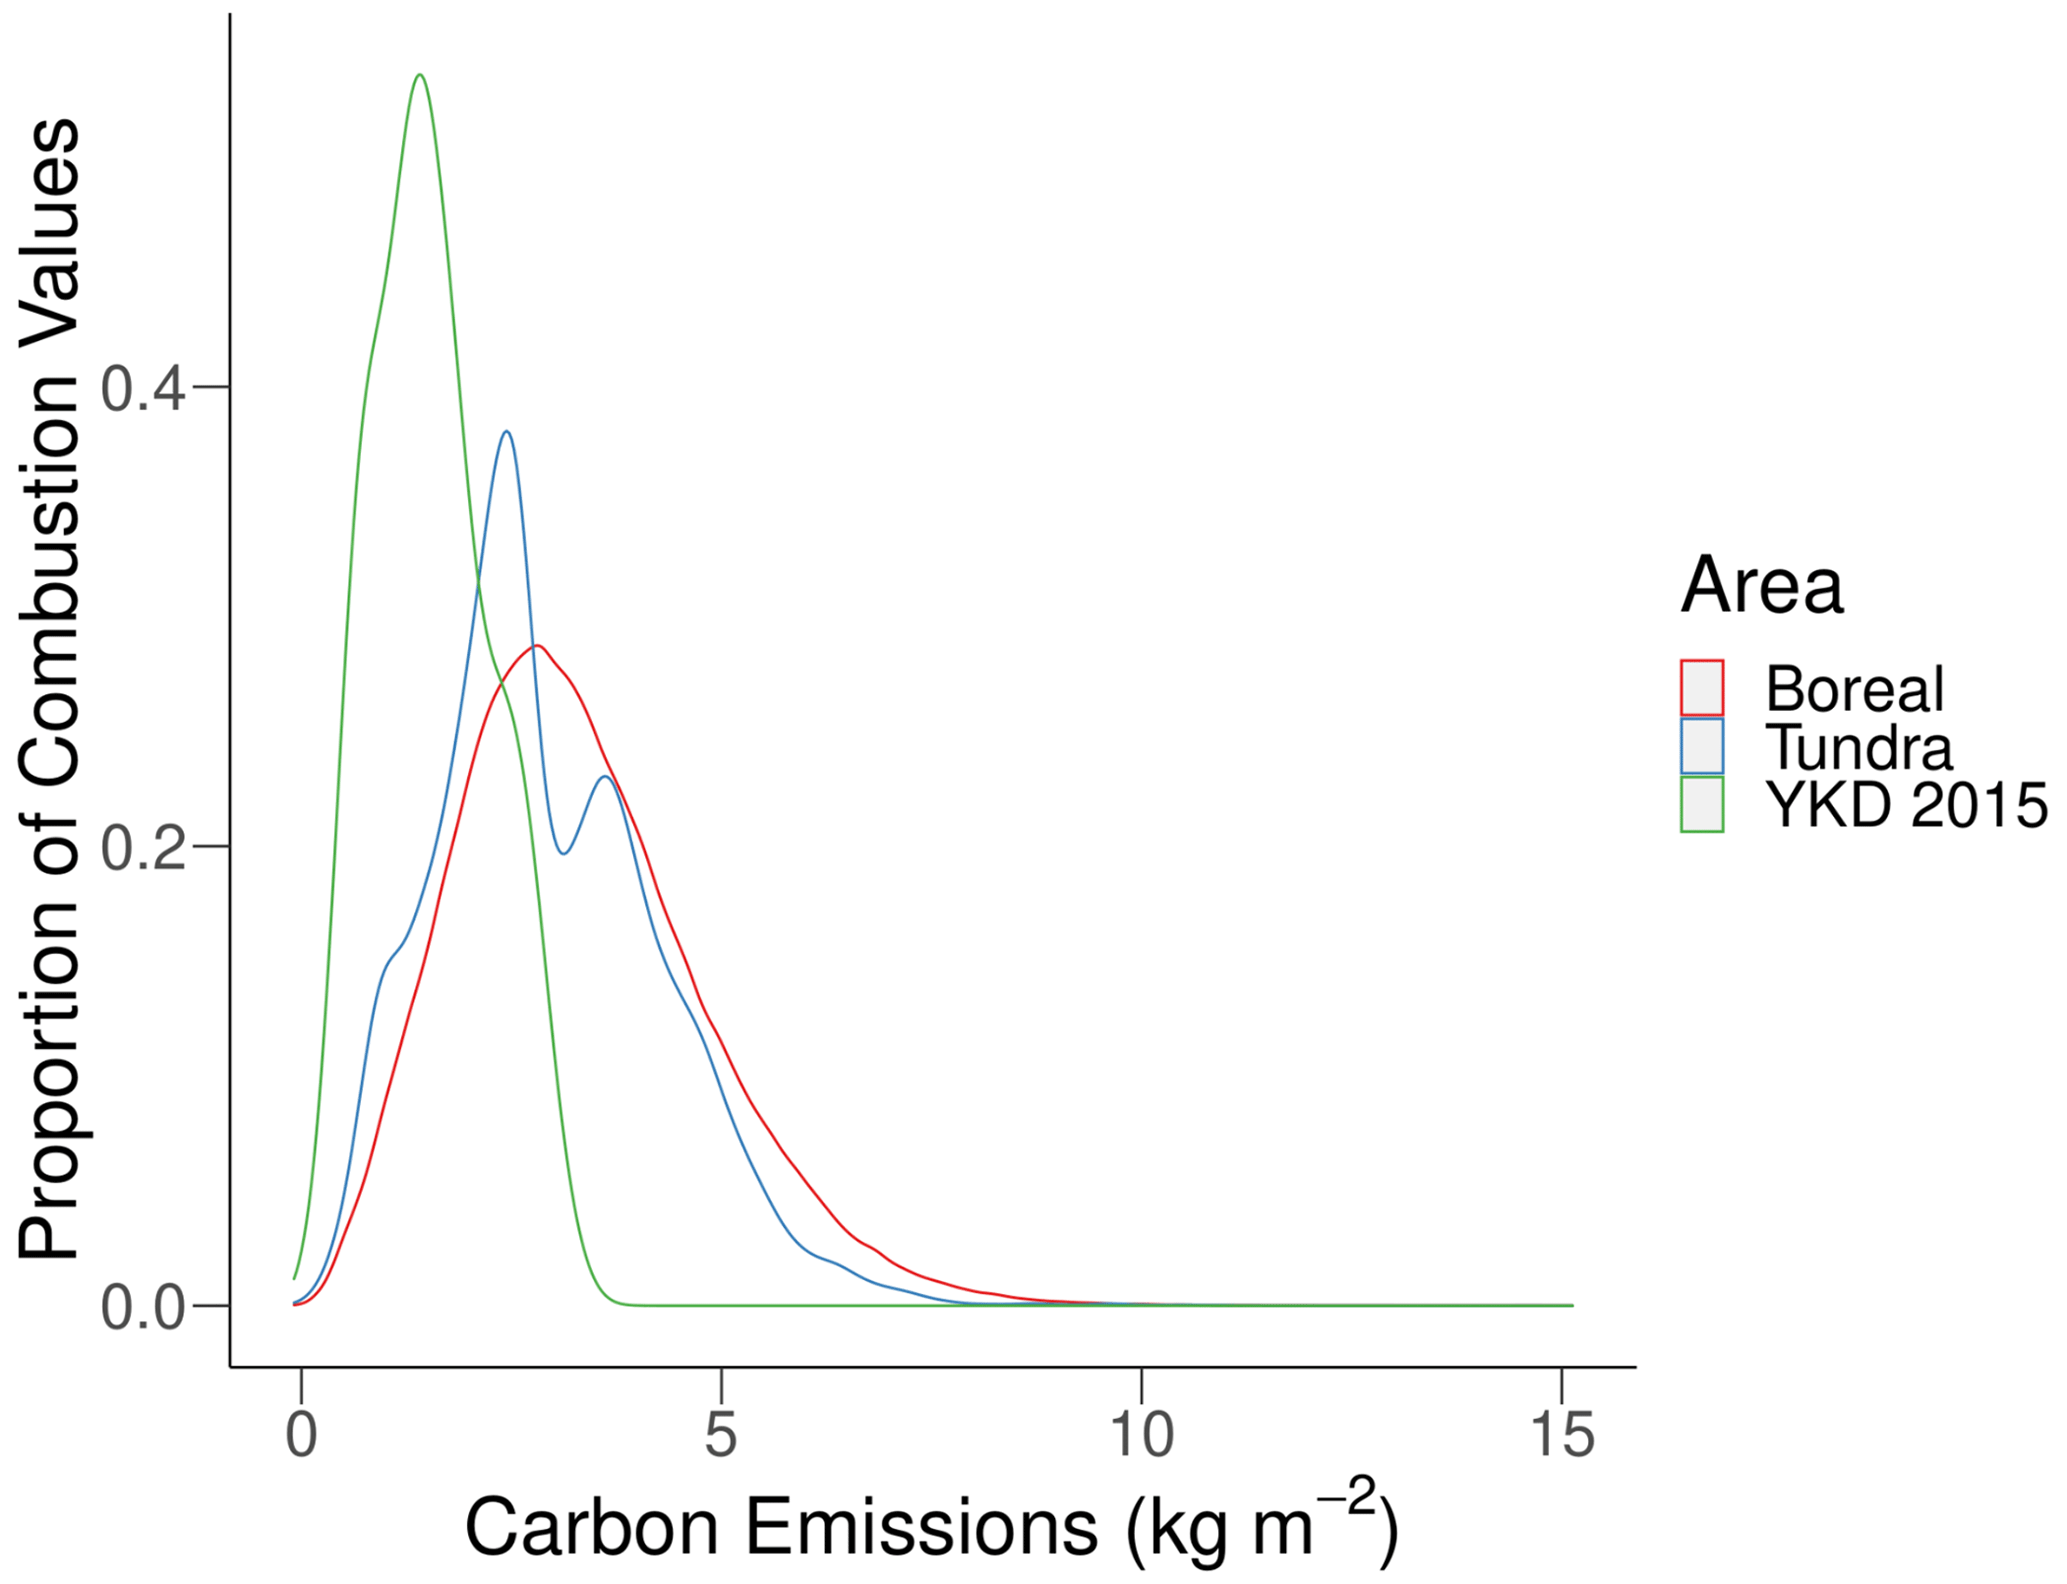
Figure A9The distribution of carbon emission values from transect measurements in the YKD 2015 fires reported herein and from remotely sensed pixels of all fires in boreal and tundra systems in Alaska between the years 2001 and 2018 (Scholten et al., 2021).
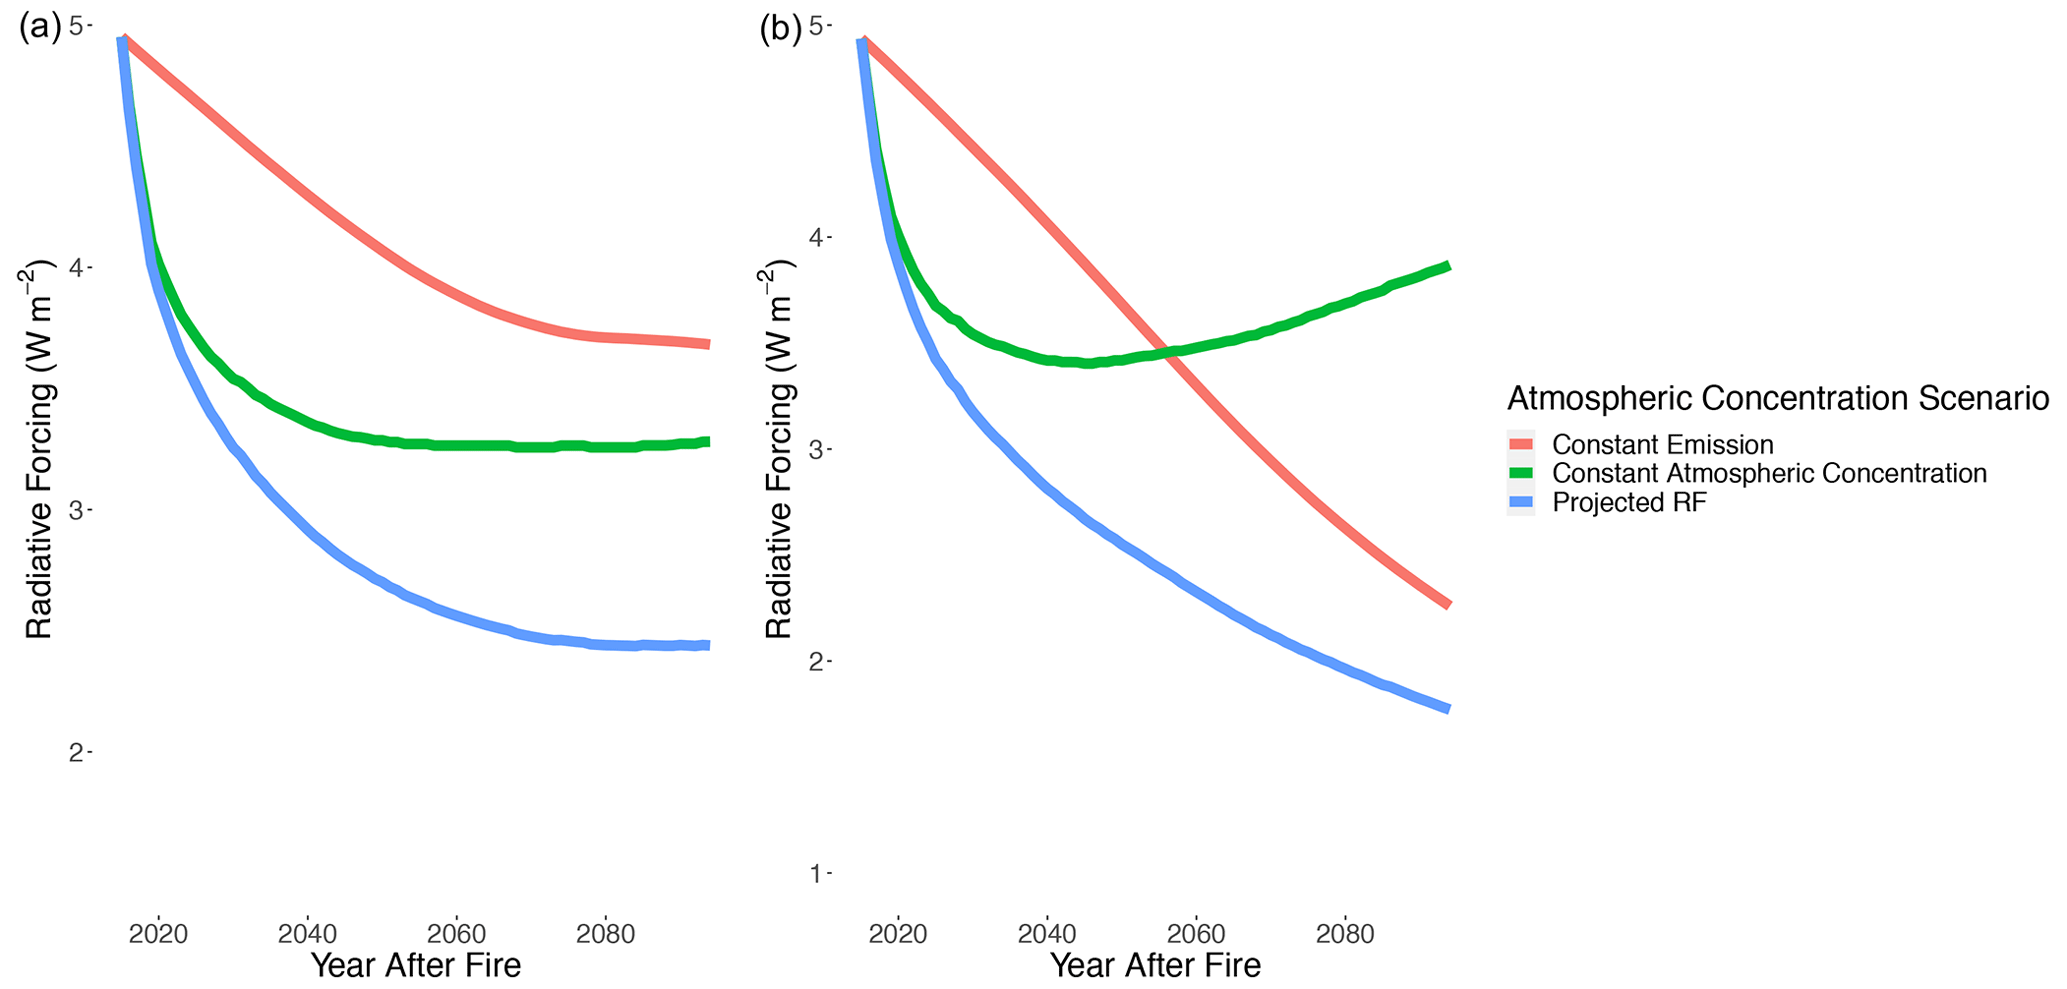
Figure A10The radiative forcing of CO2 emitted from the 2015 YKD fire season for RCP 4.5 (a) and 8.5 (b) when (i) holding the emission constant (red lines) so that no emitted CO2 is sequestered; (ii) holding the background atmospheric concentration constant (green lines); and (iii) the combination of these, resulting in our main CO2 radiative forcing equation (blue lines; Eq. 7). In the case of (i) (red lines), increasing atmospheric CO2 concentrations dampen the radiative impact of fire-emitted CO2. In the case of (ii) (green lines), the only time-varying impact on CO2 radiative forcing is ocean and land sinks, which become less effective and even reverse with more extreme climate change according to model results presented in Joos et al. (2013). These lines are similar to the impulse response function of CO2 for their respective scenarios in Joos et al. (2013).
The radiative forcing calculation code is available on GitHub and Zenodo via https://doi.org/10.5281/zenodo.6617455 (Moubarak, 2022). All field and lab raw data used in this study, including vegetative reference-point height measurements and soil and vegetation core metrics, and combustion data products derived from our calculations, are publicly available in the NSF Arctic Data Center via https://doi.org/10.18739/A2PR7MV5P (Moubarak et al., 2020).
MM, BMR, SS, and SMN were involved with conceptualization, funding acquisition, and methodology. SP completed the investigation of burn severity data and jointly completed visualization with MM. MM, SS, and BMR did the investigation of burn depth measurements and soil and vegetation characteristics. MM analyzed data and developed the radiative forcing model. SS and SMN did project administration for the field sampling. MM curated data and wrote the original manuscript draft. MM, BMR, SS, SP, and SMN reviewed and edited the final published work.
The contact author has declared that none of the authors has any competing interests.
Publisher’s note: Copernicus Publications remains neutral with regard to jurisdictional claims in published maps and institutional affiliations.
This article is part of the special issue “The role of fire in the Earth system: understanding interactions with the land, atmosphere, and society (ESD/ACP/BG/GMD/NHESS inter-journal SI)”. It is a result of the EGU General Assembly 2020, 4–8 May 2020.
The authors would like to thank William Pfitsch for his helpful mentorship in the synthesis of this project and creation of the written work. Also, the authors would like to thank Catherine Beck for offering her knowledge about radiocarbon sample preparation and analysis.
This work was funded by the National Science Foundation (grant NSF-1915307 to Susan M. Natali and Seeta Sistla), the Casstevens Family Fund (to Michael Moubarak; USD 840 for radiocarbon sampling), the National Aeronautics and Space Administration (NASA) Arctic-Boreal Vulnerability Experiment (ABoVE; grant NNX15AU56A to Brendan M. Rogers), and the Gordon and Betty Moore Foundation (grant 8414 to Susan M. Natali and Brendan M. Rogers).
This paper was edited by Fang Li and reviewed by two anonymous referees.
Akagi, S. K., Yokelson, R. J., Wiedinmyer, C., Alvarado, M. J., Reid, J. S., Karl, T., Crounse, J. D., and Wennberg, P. O.: Emission factors for open and domestic biomass burning for use in atmospheric models, Atmos. Chem. Phys., 11, 4039–4072, https://doi.org/10.5194/acp-11-4039-2011, 2011.
Barrett, K., Rocha, A. V., van de Weg, M. J., and Shaver, G.: Vegetation shifts observed in arctic tundra 17 years after fire, Remote Sens. Lett., 3, 729–736, https://doi.org/10.1080/2150704X.2012.676741, 2012.
Belshe, E. F., Schuur, E., and Bolker, B. M.: Tundra ecosystems observed to be CO2 sources due to differential amplification of the carbon cycle, Ecol. Lett., 16, 1307–1315, https://doi.org/10.1111/ele.12164, 2013.
Bieniek, P. A., Bhatt, U. S., York, A., Walsh, J. E., Lader, R., Strader, H., Ziel, R., Jandt, R. R., and Thoman, R. L.: Lightning variability in dynamically downscaled simulations of Alaska's present and future summer climate, J. Appl. Meteorol. Clim., 59, 1139–1152, https://doi.org/10.1175/JAMC-D-19-0209.1, 2020.
Boby, L. A., Schuur, E. A., Mack, M. C., Verbyla, D., and Johnstone, J. F.: Quantifying fire severity, carbon, and nitrogen emissions in Alaska's boreal forest, Ecol. Appl., 20, 1633–1647, https://doi.org/10.1890/08-2295.1, 2010.
Bond, T. C., Zarzycki, C., Flanner, M. G., and Koch, D. M.: Quantifying immediate radiative forcing by black carbon and organic matter with the Specific Forcing Pulse, Atmos. Chem. Phys., 11, 1505–1525, https://doi.org/10.5194/acp-11-1505-2011, 2011.
Chen, D., Loboda, T. V., and Hall, J. V.: A systematic evaluation of influence of image selection process on remote sensing-based burn severity indices in North American boreal forest and tundra ecosystems, ISPRS J. Photogramm., 159, 63–77, https://doi.org/10.1016/j.isprsjprs.2019.11.011, 2020.
Chen, Y., Li, Q., Randerson, J. T., Lyons, E. A., Kahn, R. A., Nelson, D. L., and Diner, D. J.: The sensitivity of CO and aerosol transport to the temporal and vertical distribution of North American boreal fire emissions, Atmos. Chem. Phys., 9, 6559–6580, https://doi.org/10.5194/acp-9-6559-2009, 2009.
Chen, Y., Lara, M. J., and Hu, F. S.: A robust visible near-infrared index for fire severity mapping in Arctic tundra ecosystems, ISPRS J. Photogramm., 159, 101–113, https://doi.org/10.1016/j.isprsjprs.2019.11.012, 2020.
Chen, Y., Romps, D. M., Seeley, J. T., Veraverbeke, S., Riley, W. J., Mekonnen, Z. A., and Randerson, J. T.: Future increases in Arctic lightning and fire risk for permafrost carbon, Nat. Clim. Change, 11, 404–410, https://doi.org/10.1038/s41558-021-01011-y, 2021.
Cohen, J., Zhang, X., Francis, J., Jung, T., Kwok, R., Overland, J., Ballinger, T., Blackport, R., Bhatt, U. S., and Chen, H.: Arctic change and possible influence on mid-latitude climate and weather: a US CLIVAR White Paper, No. 2018-1, edited by: Uhlenbrock, K., US CLIVAR reports, https://doi.org/10.5065/D6TH8KGW, 2018.
Collins, W. J., Fry, M. M., Yu, H., Fuglestvedt, J. S., Shindell, D. T., and West, J. J.: Global and regional temperature-change potentials for near-term climate forcers, Atmos. Chem. Phys., 13, 2471–2485, https://doi.org/10.5194/acp-13-2471-2013, 2013.
Dieleman, C. M., Rogers, B. M., Potter, S., Veraverbeke, S., Johnstone, J. F., Laflamme, J., Solvik, K., Walker, X. J., Mack, M. C., and Turetsky, M. R.: Wildfire combustion and carbon stocks in the southern Canadian boreal forest: Implications for a warming world, Glob. Change Biol., 26, 6062–6079, https://doi.org/10.1111/gcb.15158, 2020.
Dinerstein, E., Olson, D., Joshi, A., Vynne, C., Burgess, N. D., Wikramanayake, E., Hahn, N., Palminteri, S., Hedao, P., Noss, R., and Hansen, M.: An ecoregion-based approach to protecting half the terrestrial realm, BioScience, 67, 534–545, https://doi.org/10.1093/biosci/bix014, 2017.
Foga, S., Scaramuzza, P. L., Guo, S., Zhu, Z., Dilley, R. D., Beckmann, T., Schmidt, G. L., Dwyer, J. L., Joseph Hughes, M., and Laue, B.: Cloud detection algorithm comparison and validation for operational Landsat data products, Remote Sens. Environ., 194, 379–390, https://doi.org/10.1016/j.rse.2017.03.026, 2017.
French, N. H., Whitley, M. A., and Jenkins, L. K.: Fire disturbance effects on land surface albedo in Alaskan tundra, J. Geophys. Res.-Biogeo., 121, 841–854, https://doi.org/10.1002/2015JG003177, 2016.
Frost, G. V., Loehman, R. A., Saperstein, L. B., Macander, M. J., Nelson, P. R., Paradis, D. P., and Natali, S. M.: Multi-decadal patterns of vegetation succession after tundra fire on the Yukon-Kuskokwim Delta, Alaska, Environ. Res. Lett., 15, 025003, https://doi.org/10.1088/1748-9326/ab5f49, 2020.
Gorelick, N., Hancher, M., Dixon, M., Ilyushchenko, S., Thau, D., and Moore, R.: Google Earth Engine: Planetary-scale geospatial analysis for everyone, Remote Sens. Environ., 202, 18–27, https://doi.org/10.1016/j.rse.2017.06.031, 2017.
He, J., Chen, D., Jenkins, L., and Loboda, T. V.: Impacts of wildfire and landscape factors on organic soil properties in Arctic tussock tundra, Environ. Res. Lett., 16, 085004, https://doi.org/10.1088/1748-9326/ac1192, 2021.
Holloway, J. E., Lewkowicz, A. G., Douglas, T. A., Li, X., Turetsky, M. R., Baltzer, J. L., and Jin, H.: Impact of wildfire on permafrost landscapes: A review of recent advances and future prospects, Permafrost Periglac., 31, 371–382, https://doi.org/10.1002/ppp.2048, 2020.
Hu, F. S., Higuera, P. E., Walsh, J. E., Chapman, W. L., Duffy, P. A., Brubaker, L. B., and Chipman, M. L.: Tundra burning in Alaska: linkages to climatic change and sea ice retreat, J. Geophys. Res.-Biogeo., 115, G04002, https://doi.org/10.1029/2009JG001270, 2010.
Hu, F. S., Higuera, P. E., Duffy, P., Chipman, M. L., Rocha, A. V., Young, A. M., Kelly, R., and Dietze, M. C.: Arctic tundra fires: natural variability and responses to climate change, Front. Ecol. Environ., 13, 369–377, https://doi.org/10.1890/150063, 2015.
Hua, Q., Barbetti, M., and Rakowski, A. Z.: Atmospheric radiocarbon for the period 1950–2010, Radiocarbon, 55, 2059–2072, https://doi.org/10.2458/azu_js_rc.v55i2.16177, 2013.
Huang, S., Liu, H., Dahal, D., Jin, S., Li, S., and Liu, S.: Spatial variations in immediate greenhouse gases and aerosol emissions and resulting radiative forcing from wildfires in interior Alaska, Theor. Appl. Climatol., 123, 581–592, https://doi.org/10.1007/s00704-015-1379-0, 2016.
Jafarov, E. E., Romanovsky, V. E., Genet, H., McGuire, A. D., and Marchenko, S. S.: The effects of fire on the thermal stability of permafrost in lowland and upland black spruce forests of interior Alaska in a changing climate, Environ. Res. Lett., 8, 035030, https://doi.org/10.1088/1748-9326/8/3/035030, 2013.
Jaffe, D. A. and Wigder, N. L.: Ozone production from wildfires: A critical review, Atmos. Environ., 51, 1–10, https://doi.org/10.1016/j.atmosenv.2011.11.063, 2012.
Joly, K., Duffy, P. A., and Rupp, T. S.: Simulating the effects of climate change on fire regimes in Arctic biomes: implications for caribou and moose habitat, Ecosphere, 3, 1–18, https://doi.org/10.1890/ES12-00012.1, 2012.
Jones, B. M., Grosse, G., Arp, C. D., Miller, E., Liu, L., Hayes, D. J., and Larsen, C. F.: Recent Arctic tundra fire initiates widespread thermokarst development, Sci. Rep., 5, 1–13, https://doi.org/10.1038/srep15865, 2015.
Jones, B. M., Kolden, C. A., Jandt, R., Abatzoglou, J. T., Urban, F., and Arp, C. D.: Fire behavior, weather, and burn severity of the 2007 Anaktuvuk River tundra fire, North Slope, Alaska, Arct. Antarct. Alp. Res., 41, 309–316, https://doi.org/10.1657/1938-4246-41.3.309, 2009.
Joos, F., Roth, R., Fuglestvedt, J. S., Peters, G. P., Enting, I. G., von Bloh, W., Brovkin, V., Burke, E. J., Eby, M., Edwards, N. R., Friedrich, T., Frölicher, T. L., Halloran, P. R., Holden, P. B., Jones, C., Kleinen, T., Mackenzie, F. T., Matsumoto, K., Meinshausen, M., Plattner, G.-K., Reisinger, A., Segschneider, J., Shaffer, G., Steinacher, M., Strassmann, K., Tanaka, K., Timmermann, A., and Weaver, A. J.: Carbon dioxide and climate impulse response functions for the computation of greenhouse gas metrics: a multi-model analysis, Atmos. Chem. Phys., 13, 2793–2825, https://doi.org/10.5194/acp-13-2793-2013, 2013.
Jorgenson, M. T.: Hierarchical organization of ecosystems at multiple spatial scales on the Yukon-Kuskokwim Delta, Alaska, USA, Arct. Antarct. Alp. Res., 32, 221–239, https://doi.org/10.1080/15230430.2000.12003360, 2000.
Kasischke, E. S., Williams, D., and Barry, D.: Analysis of the patterns of large fires in the boreal forest region of Alaska, Int. J. Wildland Fire, 11, 131–144, https://doi.org/10.1071/wf02023, 2002.
Key, C. H. and Benson, N. C.: Landscape assessment (LA), in: 2006.FIREMON: Fire effects monitoring and inventory system, edited by: Lutes, D. C., Keane, R. E., Caratti, J. F., Key, C. H., Benson, N. C., Sutherland, S., and Gangi, L. J., Gen. Tech. Rep. RMRS-GTR-164-CD, Fort Collins, CO, US Department of Agriculture, Forest Service, Rocky Mountain Research Station.p.LA-1-55, 164, https://www.fs.usda.gov/treesearch/pubs/24066 (last access: 19 October 2022), 2006.
Lindgren, A., Hugelius, G., and Kuhry, P.: Extensive loss of past permafrost carbon but a net accumulation into present-day soils, Nature, 560, 219–222, https://doi.org/10.1038/s41586-018-0371-0, 2018.
Loboda, T. V., French, N. H., Hight-Harf, C., Jenkins, L., and Miller, M. E.: Mapping fire extent and burn severity in Alaskan tussock tundra: An analysis of the spectral response of tundra vegetation to wildland fire, Remote Sens. Environ., 134, 194–209, https://doi.org/10.1016/j.rse.2013.03.003, 2013.
Lyons, E. A., Jin, Y., and Randerson, J. T.: Changes in surface albedo after fire in boreal forest ecosystems of interior Alaska assessed using MODIS satellite observations, J. Geophys. Res.-Biogeo., 113, G02012, https://doi.org/10.1029/2007JG000606, 2008.
Ma, S., He, F., Tian, D., Zou, D., Yan, Z., Yang, Y., Zhou, T., Huang, K., Shen, H., and Fang, J.: Variations and determinants of carbon content in plants: a global synthesis, Biogeosciences, 15, 693–702, https://doi.org/10.5194/bg-15-693-2018, 2018.
Mack, M. C., Bret-Harte, M. S., Hollingsworth, T. N., Jandt, R. R., Schuur, E. A., Shaver, G. R., and Verbyla, D. L.: Carbon loss from an unprecedented Arctic tundra wildfire, Nature, 475, 489–492, https://doi.org/10.1038/nature10283, 2011.
Meinshausen, M., Smith, S. J., Calvin, K., Daniel, J. S., Kainuma, M. L., Lamarque, J., Matsumoto, K., Montzka, S. A., Raper, S. C., and Riahi, K.: The RCP greenhouse gas concentrations and their extensions from 1765 to 2300, Climatic Change, 109, 213–241, https://doi.org/10.1007/s10584-011-0156-z, 2011.
Moubarak, M.: Radiative forcings of gaseous emissions, Zenodo [code], https://doi.org/10.5281/zenodo.6617455, 2022.
Moubarak, M., Sistla, S., and Natali, S. M.: Yukon-Kuskokwim River Delta 2015 fire burn depth measurements and unburned soil and vegetation organic matter and carbon content collected in 2019, Arctic Data Center [data set], https://doi.org/10.18739/A2DN3ZX3Q, 2020.
Myhre, G., Highwood, E. J., Shine, K. P., and Stordal, F.: New estimates of radiative forcing due to well mixed greenhouse gases, Geophys. Res. Lett., 25, 2715–2718, https://doi.org/10.1029/98GL01908, 1998.
Myhre, G., Shindell, D., Bréon, F.-M., Collins, W., Fuglestvedt, J., Huang, J., Koch, D., Lamarque, J.-F., Lee, D., Mendoza, B., Nakajima, T., Robock, A., Stephens, G., Takemura, T., and Zhang, H.: Anthropogenic and Natural Radiative Forcing, in: Climate Change: The Physical Science Basis. Contribution of Working Group I to the Fifth Assessment Report of the Intergovernmental Panel on Climate Change, edited by: Stocker, T. F., Qin, D., Plattner, G.-K., Tignor, M., Allen, S. K., Boschung, J., Nauels, A., Xia, Y., Bex, V., and Midgley, P. M., Cambridge University Press, Cambridge, United Kingdom and New York, NY, USA, 659–740, https://doi.org/10.1017/CBO9781107415324.018, 2013.
Natali, S. M., Schuur, E. A., Mauritz, M., Schade, J. D., Celis, G., Crummer, K. G., Johnston, C., Krapek, J., Pegoraro, E., and Salmon, V. G.: Permafrost thaw and soil moisture driving CO2 and CH4 release from upland tundra, J. Geophys. Res.-Biogeo., 120, 525–537, https://doi.org/10.1002/2014JG002872, 2015.
Natali, S. M., Watts, J. D., Rogers, B. M., Potter, S., Ludwig, S. M., Selbmann, A., Sullivan, P. F., Abbott, B. W., Arndt, K. A., and Birch, L.: Large loss of CO2 in winter observed across the northern permafrost region, Nat. Clim. Change, 9, 852–857, https://doi.org/10.1038/s41558-019-0592-8, 2019.
O'Halloran, T. L., Law, B. E., Goulden, M. L., Wang, Z., Barr, J. G., Schaaf, C., Brown, M., Fuentes, J. D., Göckede, M., and Black, A.: Radiative forcing of natural forest disturbances, Global Change Biol., 18, 555–565, https://doi.org/10.1111/j.1365-2486.2011.02577.x, 2012.
Oris, F., Asselin, H., Ali, A. A., Finsinger, W., and Bergeron, Y.: Effect of increased fire activity on global warming in the boreal forest, Environ. Rev., 22, 206–219, https://doi.org/10.1139/er-2013-0062, 2014.
Pinheiro, J., Bates, D., DebRoy, S., Sarkar, D., and R Core Team: nlme: Linear and Nonlinear Mixed Effects Models, R package version 3.1-149, https://CRAN.R-project.org/package=nlme (last access: 19 October 2022), 2020.
Potter, S., Solvik, K., Erb, A., Goetz, S. J., Johnstone, J. F., Mack, M. C., Randerson, J. T., Román, M. O., Schaaf, C. L., and Turetsky, M. R.: Climate change decreases the cooling effect from postfire albedo in boreal North America, Global Change Biol., 26, 1592–1607, https://doi.org/10.1111/gcb.14888, 2020.
Potter, S., Veraverbeke, S., Walker, X. J., Mack, M. C., Goetz, S. J., Baltzer, J. L., Dieleman, C., French, N. H. F., Kane, E. S., Turetsky, M. R., Wiggins, E. B., and Rogers, B. M.: ABoVE: Burned Area, Depth, and Combustion for Alaska and Canada, 2001–2019, ORNL DAAC, Oak Ridge, Tennessee, USA [data set], https://doi.org/10.3334/ORNLDAAC/2063, 2022.
Quinn, P. K., Bates, T. S., Baum, E., Doubleday, N., Fiore, A. M., Flanner, M., Fridlind, A., Garrett, T. J., Koch, D., Menon, S., Shindell, D., Stohl, A., and Warren, S. G.: Short-lived pollutants in the Arctic: their climate impact and possible mitigation strategies, Atmos. Chem. Phys., 8, 1723–1735, https://doi.org/10.5194/acp-8-1723-2008, 2008.
Ramsey, C. B.: Bayesian analysis of radiocarbon dates, Radiocarbon, 51, 337–360, https://doi.org/10.1017/S0033822200033865, 2009.
Randerson, J. T., Liu, H., Flanner, M. G., Chambers, S. D., Jin, Y., Hess, P. G., Pfister, G., Mack, M. C., Treseder, K. K., and Welp, L. R.: The impact of boreal forest fire on climate warming, Science, 314, 1130–1132, https://doi.org/10.1126/science.1132075, 2006.
Raynolds, M. K., Walker, D. A., and Maier, H. A.: Plant community-level mapping of arctic Alaska based on the Circumpolar Arctic Vegetation Map, Phytocoenologia, 35, 821, https://doi.org/10.1127/0340-269X/2005/0035-0821, 2005.
R Core Team: R: A language and environment for statistical computing, R Foundation for Statistical Computing, Vienna, Austria, https://www.R-project.org/ (last access: 19 October 2022), 2020.
Reimer, P. J., Brown, T. A., and Reimer, R. W.: Discussion: reporting and calibration of post-bomb 14C data, Radiocarbon, 46, 1299–1304, https://doi.org/10.1017/S0033822200033154, 2004.
Rocha, A. V. and Shaver, G. R.: Burn severity influences postfire CO2 exchange in arctic tundra, Ecol. Appl., 21, 477–489, https://doi.org/10.1890/10-0255.1, 2011a.
Rocha, A. V. and Shaver, G. R.: Postfire energy exchange in arctic tundra: the importance and climatic implications of burn severity, Glob. Change Biol., 17, 2831–2841, https://doi.org/10.1111/j.1365-2486.2011.02441.x, 2011b.
Rocha, A. V., Loranty, M. M., Higuera, P. E., Mack, M. C., Hu, F. S., Jones, B. M., Breen, A. L., Rastetter, E. B., Goetz, S. J., and Shaver, G. R.: The footprint of Alaskan tundra fires during the past half-century: implications for surface properties and radiative forcing, Environ. Res. Lett., 7, 044039, https://doi.org/10.1088/1748-9326/7/4/044039, 2012.
Rogers, B. M., Randerson, J. T., and Bonan, G. B.: High-latitude cooling associated with landscape changes from North American boreal forest fires, Biogeosciences, 10, 699–718, https://doi.org/10.5194/bg-10-699-2013, 2013.
Rogers, B. M., Veraverbeke, S., Azzari, G., Czimczik, C. I., Holden, S. R., Mouteva, G. O., Sedano, F., Treseder, K. K., and Randerson, J. T.: Quantifying fire-wide carbon emissions in interior Alaska using field measurements and Landsat imagery, J. Geophys. Res.-Biogeo., 119, 1608–1629, https://doi.org/10.1002/2014JG002657, 2014.
Roy, D. P., Kovalskyy, V., Zhang, H. K., Vermote, E. F., Yan, L., Kumar, S. S., and Egorov, A.: Characterization of Landsat-7 to Landsat-8 reflective wavelength and normalized difference vegetation index continuity, Remote Sens. Environ., 185, 57–70, https://doi.org/10.1016/j.rse.2015.12.024, 2016.
Sae-Lim, J., Russell, J. M., Vachula, R. S., Holmes, R. M., Mann, P. J., Schade, J. D., and Natali, S. M.: Temperature-controlled tundra fire severity and frequency during the last millennium in the Yukon-Kuskokwim Delta, Alaska, Holocene, 29, 1223–1233, https://doi.org/10.1177/0959683619838036, 2019.
Scholten, R. C., Veraverbeke, S., Jandt, R., Miller, E. A., and Rogers, B. M.: ABoVE: Ignitions, Burned Area, and Emissions of Fires in AK, YT, and NWT, 2001–2018, ORNL DAAC, Oak Ridge, Tennessee, USA [data set], https://doi.org/10.3334/ORNLDAAC/1812, 2021.
Schuur, E. A., McGuire, A. D., Schädel, C., Grosse, G., Harden, J. W., Hayes, D. J., Hugelius, G., Koven, C. D., Kuhry, P., and Lawrence, D. M.: Climate change and the permafrost carbon feedback, Nature, 520, 171–179, https://doi.org/10.1038/nature14338, 2015.
Shaw, R. D.: An archaeology of the central Yupik: A regional overview for the Yukon-Kuskokwim Delta, northern Bristol Bay, and Nunivak Island, Arctic Anthropol., 35, 234–246, http://www.jstor.org/stable/40316467 (last access: 25 May 2021), 1998.
U.S. Environmental Protection Agency: NA Eco Level 1, U.S. EPA Office of Research & Development (ORD) – National Health and Environmental Effects Research Laboratory (NHEERL) [data set], https://www.epa.gov/eco-research/ecoregions-north-america (last access: 19 October 2022), 2010.
Van der Werf, G. R., Randerson, J. T., Giglio, L., van Leeuwen, T. T., Chen, Y., Rogers, B. M., Mu, M., van Marle, M. J. E., Morton, D. C., Collatz, G. J., Yokelson, R. J., and Kasibhatla, P. S.: Global fire emissions estimates during 1997–2016, Earth Syst. Sci. Data, 9, 697–720, https://doi.org/10.5194/essd-9-697-2017, 2017.
Veraverbeke, S., Rogers, B. M., and Randerson, J. T.: CARVE: Alaskan Fire Emissions Database (AKFED), 2001-2013, ORNL DAAC, Oak Ridge, Tennessee, USA [data set], https://doi.org/10.3334/ORNLDAAC/1282, 2015a.
Veraverbeke, S., Rogers, B. M., and Randerson, J. T.: Daily burned area and carbon emissions from boreal fires in Alaska, Biogeosciences, 12, 3579–3601, https://doi.org/10.5194/bg-12-3579-2015, 2015b.
Veraverbeke, S., Rogers, B. M., Goulden, M. L., Jandt, R., Miller, C. E., Wiggins, E. B., and Randerson, J. T.: ABoVE: Ignitions, burned area and emissions of fires in AK, YT, and NWT, 2001–2015, ORNL DAAC, Oak Ridge, Tennessee, USA [data set], https://doi.org/10.3334/ORNLDAAC/1341, 2017a.
Veraverbeke, S., Rogers, B. M., Goulden, M. L., Jandt, R. R., Miller, C. E., Wiggins, E. B., and Randerson, J. T.: Lightning as a major driver of recent large fire years in North American boreal forests, Nat. Clim. Change, 7, 529–534, https://doi.org/10.1038/nclimate3329, 2017b.
Veraverbeke, S., Delcourt, C. J., Kukavskaya, E., Mack, M., Walker, X., Hessilt, T., Rogers, B., and Scholten, R. C.: Direct and longer-term carbon emissions from arctic-boreal fires: a short review of recent advances, Current Opinion in Environmental Science & Health, 23, 100277, https://doi.org/10.1016/j.coesh.2021.100277, 2021.
Virkkala, A., Aalto, J., Rogers, B. M., Tagesson, T., Treat, C. C., Natali, S. M., Watts, J. D., Potter, S., Lehtonen, A., and Mauritz, M.: Statistical upscaling of ecosystem CO2 fluxes across the terrestrial tundra and boreal domain: Regional patterns and uncertainties, Glob. Change Biol., 27, 4040–4059, https://doi.org/10.1111/gcb.15659, 2021.
Walker, X. J., Baltzer, J. L., Cumming, S. G., Day, N. J., Johnstone, J. F., Rogers, B. M., Solvik, K., Turetsky, M. R., and Mack, M. C.: Soil organic layer combustion in boreal black spruce and jack pine stands of the Northwest Territories, Canada, Int. J. Wildland Fire, 27, 125–134, https://doi.org/10.1071/WF17095, 2018a.
Walker, X. J., Rogers, B. M., Baltzer, J. L., Cumming, S. G., Day, N. J., Goetz, S. J., Johnstone, J. F., Schuur, E. A., Turetsky, M. R., and Mack, M. C.: Cross-scale controls on carbon emissions from boreal forest megafires, Glob. Change Biol., 24, 4251–4265, https://doi.org/10.1111/gcb.14287, 2018b.
Walker, X. J., Baltzer, J. L., Cumming, S. G., Day, N. J., Ebert, C., Goetz, S., Johnstone, J. F., Potter, S., Rogers, B. M., and Schuur, E. A.: Increasing wildfires threaten historic carbon sink of boreal forest soils, Nature, 572, 520–523, https://doi.org/10.1038/s41586-019-1474-y, 2019.
Walker, X. J., Baltzer, J. L., Bourgeau-Chavez, L. L., Day, N. J., De groot, W. J., Dieleman, C., Hoy, E. F., Johnstone, J. F., Kane, E. S., and Parisien, M. A.: ABoVE: Synthesis of Burned and Unburned Forest Site Data, AK and Canada, 1983–2016, ORNL DAAC [data set], https://doi.org/10.3334/ORNLDAAC/1744, 2020a.
Walker, X. J., Rogers, B. M., Veraverbeke, S., Johnstone, J. F., Baltzer, J. L., Barrett, K., Bourgeau-Chavez, L., Day, N. J., de Groot, W. J., and Dieleman, C. M.: Fuel availability not fire weather controls boreal wildfire severity and carbon emissions, Nat. Clim. Change, 10, 1130–1136, https://doi.org/10.1038/s41558-020-00920-8, 2020b.
Walker, X. J., Baltzer, J. L., Bourgeau-Chavez, L., Day, N. J., Dieleman, C. M., Johnstone, J. F., Kane, E. S., Rogers, B. M., Turetsky, M. R., and Veraverbeke, S.: Patterns of ecosystem structure and wildfire carbon combustion across six ecoregions of the North American boreal forest, Frontiers in Forests and Global Change, 3, 87, https://doi.org/10.3389/ffgc.2020.00087, 2020c.
Ward, D. S., Kloster, S., Mahowald, N. M., Rogers, B. M., Randerson, J. T., and Hess, P. G.: The changing radiative forcing of fires: global model estimates for past, present and future, Atmos. Chem. Phys., 12, 10857–10886, https://doi.org/10.5194/acp-12-10857-2012, 2012.
Wiggins, E. B., Veraverbeke, S., Henderson, J. M., Karion, A., Miller, J. B., Lindaas, J., Commane, R., Sweeney, C., Luus, K. A., and Tosca, M. G.: The influence of daily meteorology on boreal fire emissions and regional trace gas variability, J. Geophys. Res.-Biogeo., 121, 2793–2810, https://doi.org/10.1002/2016JG003434, 2016.
Zhou, Z., Liu, L., Jiang, L., Feng, W., and Samsonov, S. V.: Using long-term SAR backscatter data to monitor post-fire vegetation recovery in tundra environment, Remote Sens., 11, 2230, https://doi.org/10.3390/rs11192230, 2019.