the Creative Commons Attribution 4.0 License.
the Creative Commons Attribution 4.0 License.
 | 25 Apr 2023
How much do bacterial growth properties and biodegradable dissolved organic matter control water quality at low flow?
Masihullah Hasanyar
Thomas Romary
Shuaitao Wang
Nicolas Flipo
The development of accurate water quality modeling tools is necessary for integrated water quality management of river systems. Even though some water quality models can simulate dissolved oxygen (DO) concentrations accurately during high-flow periods and phytoplankton blooms in rivers, significant discrepancies remain during low-flow periods, when the dilution capacity of the rivers is reduced. We use the C-RIVE biogeochemical model to evaluate the influence of controlling parameters on DO simulations at low flow. Based on a coarse model pre-analysis, three sensitivity analyses (SAs) are carried out using the Sobol method. The parameters studied are related to bacterial community (e.g., bacterial growth rate), organic matter (OM; partitioning and degradation of OM into constituent fractions), and physical factors (e.g., reoxygenation of the river due to navigation and wind). Bacterial growth and mortality rates are found to be by far the two most influential parameters, followed by bacterial growth yield. More refined SA results indicate that the biodegradable fraction of dissolved organic matter (BDOM) and the bacterial growth yield are the most influential parameters under conditions of a high net bacterial growth rate (= growth rate − mortality rate), while bacterial growth yield is independently dominant in low net growth situations. Based on the results of this study, proposals are made for in situ measurement of BDOM under an urban area water quality monitoring network that provides high-frequency data. The results also indicate the need for bacterial community monitoring in order to detect potential bacterial community shifts after transient events such as combined sewer overflows and modifications in internal processes of treatment plants. Furthermore, we discuss the inclusion of BDOM in statistical water quality modeling software for improvement in the estimation of organic matter inflow from boundary conditions.
- Article
(839 KB) - Full-text XML
-
Supplement
(586 KB) - BibTeX
- EndNote


Dissolved oxygen (DO) has been considered the most important indicator of water quality in surface water resources (Streeter and Phelps, 1925; Odum, 1956; Escoffier et al., 2018), because it integrates the biological functioning of a system and the impact of anthropogenic forcing. It is the main variable used to evaluate river metabolism (Odum, 1956; Staehr et al., 2010; Demars et al., 2015) by comparing the gross primary production (GPP) with ecosystem respiration (ER) and defining whether an ecosystem is autotrophic or heterotrophic based on the net ecosystem production (NEP = GPP − ER) being positive or negative, respectively (Garnier et al., 2020). Maintaining a sufficient level of DO is necessary for the overall health of rivers, not only because of the life dependency of water species (Garvey et al., 2007), but also for preventing smell and taste degradation (Bailey and Ahmadi, 2014).
The situation of rivers during low flow is of particular interest, since studies have demonstrated that the river water quality during such flow periods is more vulnerable to degradation due to lower dilution rates. This is particularly the case if the river receives organic matter load from waste water treatment plants (WWTPs) and combined sewer overflows (CSOs). These organic matter (OM) loads lead to heterotrophic conditions in the river, where very low DO levels and high fish mortality can be observed (Seidl et al., 1998a; Even et al., 2004; Vilmin et al., 2016; Garnier et al., 2020). Therefore, river water quality modeling has been one of the main research interests of water quality managers and researchers ever since the use of the very first water quality model (Streeter and Phelps, 1925) to more complex ones (Billen et al., 1994; Garnier et al., 1995; Even et al., 1998; Vanrolleghem et al., 2001; Flipo, 2005; Wang et al., 2013). Its aim is to identify the main determinants of DO evolution and to forecast the response of aquatic systems to human-induced pressure, in particular due to waste water treatment plants (WWTPs) outflows.
Large discrepancies exist between DO simulations and observations during low-flow periods in water quality models. These mismatches were found in the QUESTOR model applied on the Thames (UK) (Hutchins et al., 2020), in the Riverstrahler model applied on the Mosel River (Germany) (Garnier et al., 1999), the Scheldt River (Belgium) (Thieu et al., 2009), and the Seine River (France) (Garnier et al., 2020). Yang et al. (2010) found the same results in the WASP model and noted that the uncertainty of the model lies in characterization of OM degradation and nitrification rates. Bailey and Ahmadi (2014) found similar results in the QUAL2E-OTIS water quality model. The ProSe model also has mismatches at low flow (Even et al., 2004, 2007; Vilmin et al., 2018; Garnier et al., 2020; Wang et al., 2022). Among the parameters that control DO concentration in water (Cox, 2003), Wang et al. (2022) assume that the uncertainties related to the parameterization of OM degradation kinetics and OM biodegradability at system's boundaries (tributary rivers, WWTPs, and CSOs) play a major role in the discrepancies observed during low-flow periods.
In order to objectively evaluate the controlling parameters of DO during such periods, a sensitivity analysis (SA) is conducted. Several applications of SA methods can be found for water quality modeling (Nossent et al., 2011; Bailey and Ahmadi, 2014; Cho et al., 2017; Wang et al., 2018). Moreover, SA applications in hydrological and water quality modeling are summarized by Reusser et al. (2011) and Wang et al. (2018). In this study, the Sobol method (Sobol, 1993) is chosen in order to understand the interparameter interactions.
For the first time, the influence of bacterial properties and that of the quantity and different fractions of OM sources are investigated on DO evolution at low flow using the C-RIVE model (Vilmin et al., 2012; Wang et al., 2018). It is conducted for better understanding of the short-term (5 d) and mid-term (45 d) effects of the rapidly and slowly biodegradable OM, respectively. To further understand the functioning of the Sobol SA, the interparameter interactions are calculated to address how one parameter hides the influence of other parameters. On the basis of the SA results, suggestions are made for water quality monitoring in urban areas. Finally, proposals are made for a better integration of the influential parameters in data assimilation.
Based on the above discussion, we address three research questions:
-
What are the influential parameters controlling DO during a post-bloom summer low-flow period where discrepancies are observed in different water quality models? Is a model that includes bacteria physiological parameters (growth and yield rates) alone sufficient to describe DO variation?
-
To what extent is the knowledge of the quantity of OM share, especially that of the biodegradable fraction of dissolved organic matter (BDOM), influential for water quality modeling?
-
What is the hierarchy (importance ranking) among the influential parameters?
Here we represent the C-RIVE model (Sect. 2.1) as the forward model of the study and identify the parameters that need to be included in the study. Then, two new sets of parameters are added to the study to account for the uncertainties related to the parameterization of OM degradation kinetics and its partitioning into different constituent fractions. This is followed by the determination of the variation ranges of the introduced parameters (Sect. 2.1.2). Then, the strategy for conducting different SAs is detailed in Sect. 2.3 to determine the influential parameters.
2.1 C-RIVE biogeochemical model
C-RIVE is a C ANSI library that implements RIVE concepts (Billen et al., 1994; Garnier et al., 1995). It simulates the cycles of carbon, oxygen, and other nutrients both in the water column and sediments of river systems (Fig. 1). The model is community centered and explicitly describes microorganisms' communities, such as phytoplankton and heterotrophic bacteria. The physiological parameters of those communities were determined through multiple lab experiments. Both the RIVE model and its parameters were coupled in two river water quality models: RIVERSTRAHLER (Billen et al., 1994) and ProSe (Even et al., 1998). These two models are calibrated and validated on real case applications in different river basins over the world, such as in the Danube River (Romania and Bulgaria) (Garnier et al., 2002), in the Day–Nhue River (Vietnam) (Luu et al., 2021), in the Grand Morin river (France) (Flipo et al., 2004, 2007), in the Lule and Kalix rivers (Sweden) (Sferratore et al., 2008), in the Mosel River (Germany) (Garnier et al., 1999), in the Red River system (Vietnam and China) (Quynh et al., 2014), in the Scheldt River (Belgium and Netherlands) (Billen et al., 2005; Thieu et al., 2009), in the Seine River (France) (Even et al., 2004, 2007; Raimonet et al., 2015; Vilmin et al., 2015, 2016; Garnier et al., 2020), in the Somme river (France) (Thieu et al., 2009, 2010), and in the Zenne River (Belgium) (Garnier et al., 2013).
In the C-RIVE model, DO in the water column depends on physical, bacterial, and phytoplanktonic processes (Fig. 1). The physical and phytoplanktonic processes tend to provide DO, while bacterial processes consume DO. The bacterial respiration, that is the main source of oxygen consumption, depends on the heterotrophic bacterial kinetics and the availability of substrate matter. These equations are accessible in previous publications (Billen et al., 1988; Servais, 1989; Billen, 1991; Wang et al., 2018). For the readability of the paper, they are developed in the Supplement, Sect. S1.1, and S1.2 only.
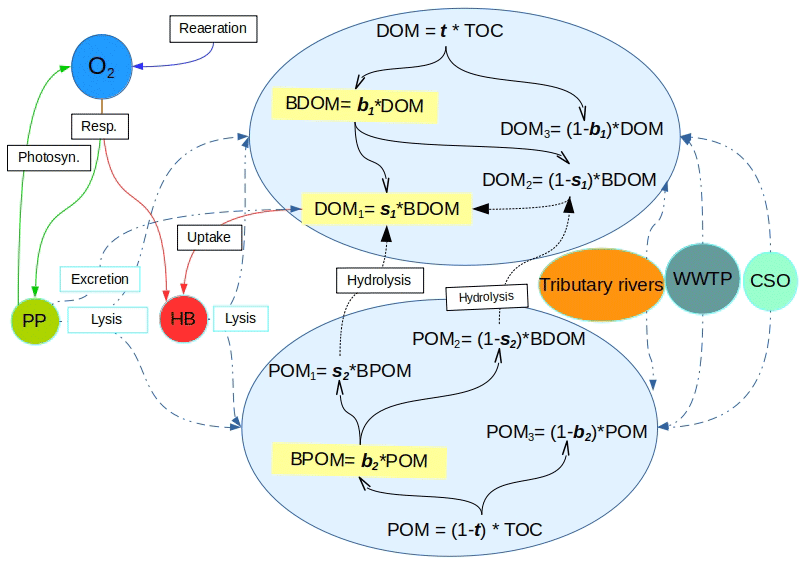
Figure 1Schematic description of the OM-related processes accounted for by C-RIVE in the water column where OM is partitioned into six fractions of dissolved and particulate matter using the five partitioning parameters, namely, t, b1, s1, b2, and s2. POM: particulate organic matter. DOM: dissolved organic matter. BDOM: biodegradable DOM. BPOM: biodegradable POM (subscripts 1, 2, and 3 refer to rapidly degradable, slowly degradable, and non-biodegradable fractions of OM, respectively). Dashed double-dotted blue lines: OM input from sources and partitioning between POM and DOM. Solid black lines: partitioning of DOM and POM into biodegradability pools. Dotted black lines: hydrolysis. Remaining solid lines: biogeochemical processes. Resp.: respiration. Photo.: photosynthesis. PP: primary producers. HB: heterotrophic bacteria. WWTP: waste water treatment plant. CSO: combined sewer overflow.
2.1.1 OM partitioning parameters: from total organic carbon to six OM fractions
The OM partitioning parameters are a novelty added in C-RIVE. Indeed, the former version of C-RIVE did not include any parameter to define the partitioning of OM into DOM and POM and then further into their corresponding fractions DOM and POM (see Fig. 1 for the definitions). In the recent development of C-RIVE, the total organic carbon (TOC) is initially divided into dissolved (DOM) and particulate (POM) forms by t parameter (Fig. 1). Then, DOM is divided into biodegradable (BDOM) and refractory (DOM3) fractions by b1 parameter. Then, thanks to s1 parameter, BDOM is further divided into (i) DOM1 as the limiting substrate (rapidly biodegradable DOM in 5 d) and (ii) DOM2 (slowly biodegradable DOM in 45 d). POM is similarly divided into its constituent fractions using b2 and s2 parameters. The equations concerning these five parameters and that of OM degradation are accessible in Sect. S1.3. To further clarify, the only required forced information is TOC that comes from experimental data. Therefore, the five OM partitioning parameters (t, b1, b2, s1, s2) give us the possibility to conduct a sensitivity analysis to quantify their influence on DO concentration. Using this OM partitioning model and depending on these five parameters, we are able to convert time-varying TOC of boundary conditions per se river inflows, into time-varying DOM and POM fractions.
2.1.2 Parameters for SA and their variation ranges
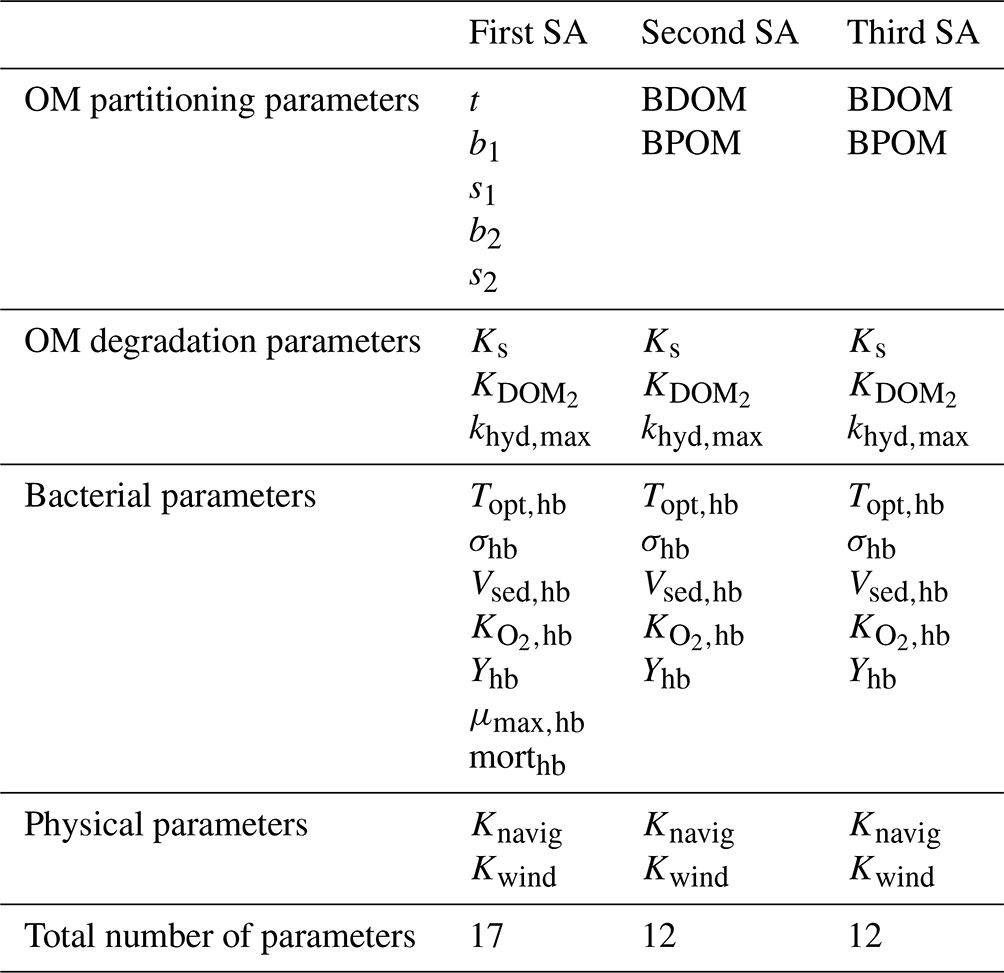
The influence of 17 parameters on oxygen concentrations is evaluated in this study (Table 1). Various types of parameters are identified: two physical parameters that account for O2 re-aeration; seven bacterial parameters that account for bacteria growth, mortality, and respiration; three OM degradation parameters; and five OM partitioning parameters (Fig. 1).
Before proceeding to a SA, it is necessary to specify the range of variation of each parameter according to an a priori distribution based on former knowledge. Those distributions are assumed to be uniform within a range, whose definition relies on a literature review. The range of variation of the partitioning and degradation parameters (Table 1) is selected based on a detailed bibliographical review (Hasanyar et al., 2020, 2023a; Wang et al., 2018). Table 1 also includes the range of variation of TOC, which represents the total organic matter input in the model due to the boundary conditions and varies from 1 to 10 mgC L−1 under low flow (Hasanyar et al., 2020).
20202023a2018Table 1List of the parameters accounted for in the sensitivity analyses and their corresponding ranges of variation.
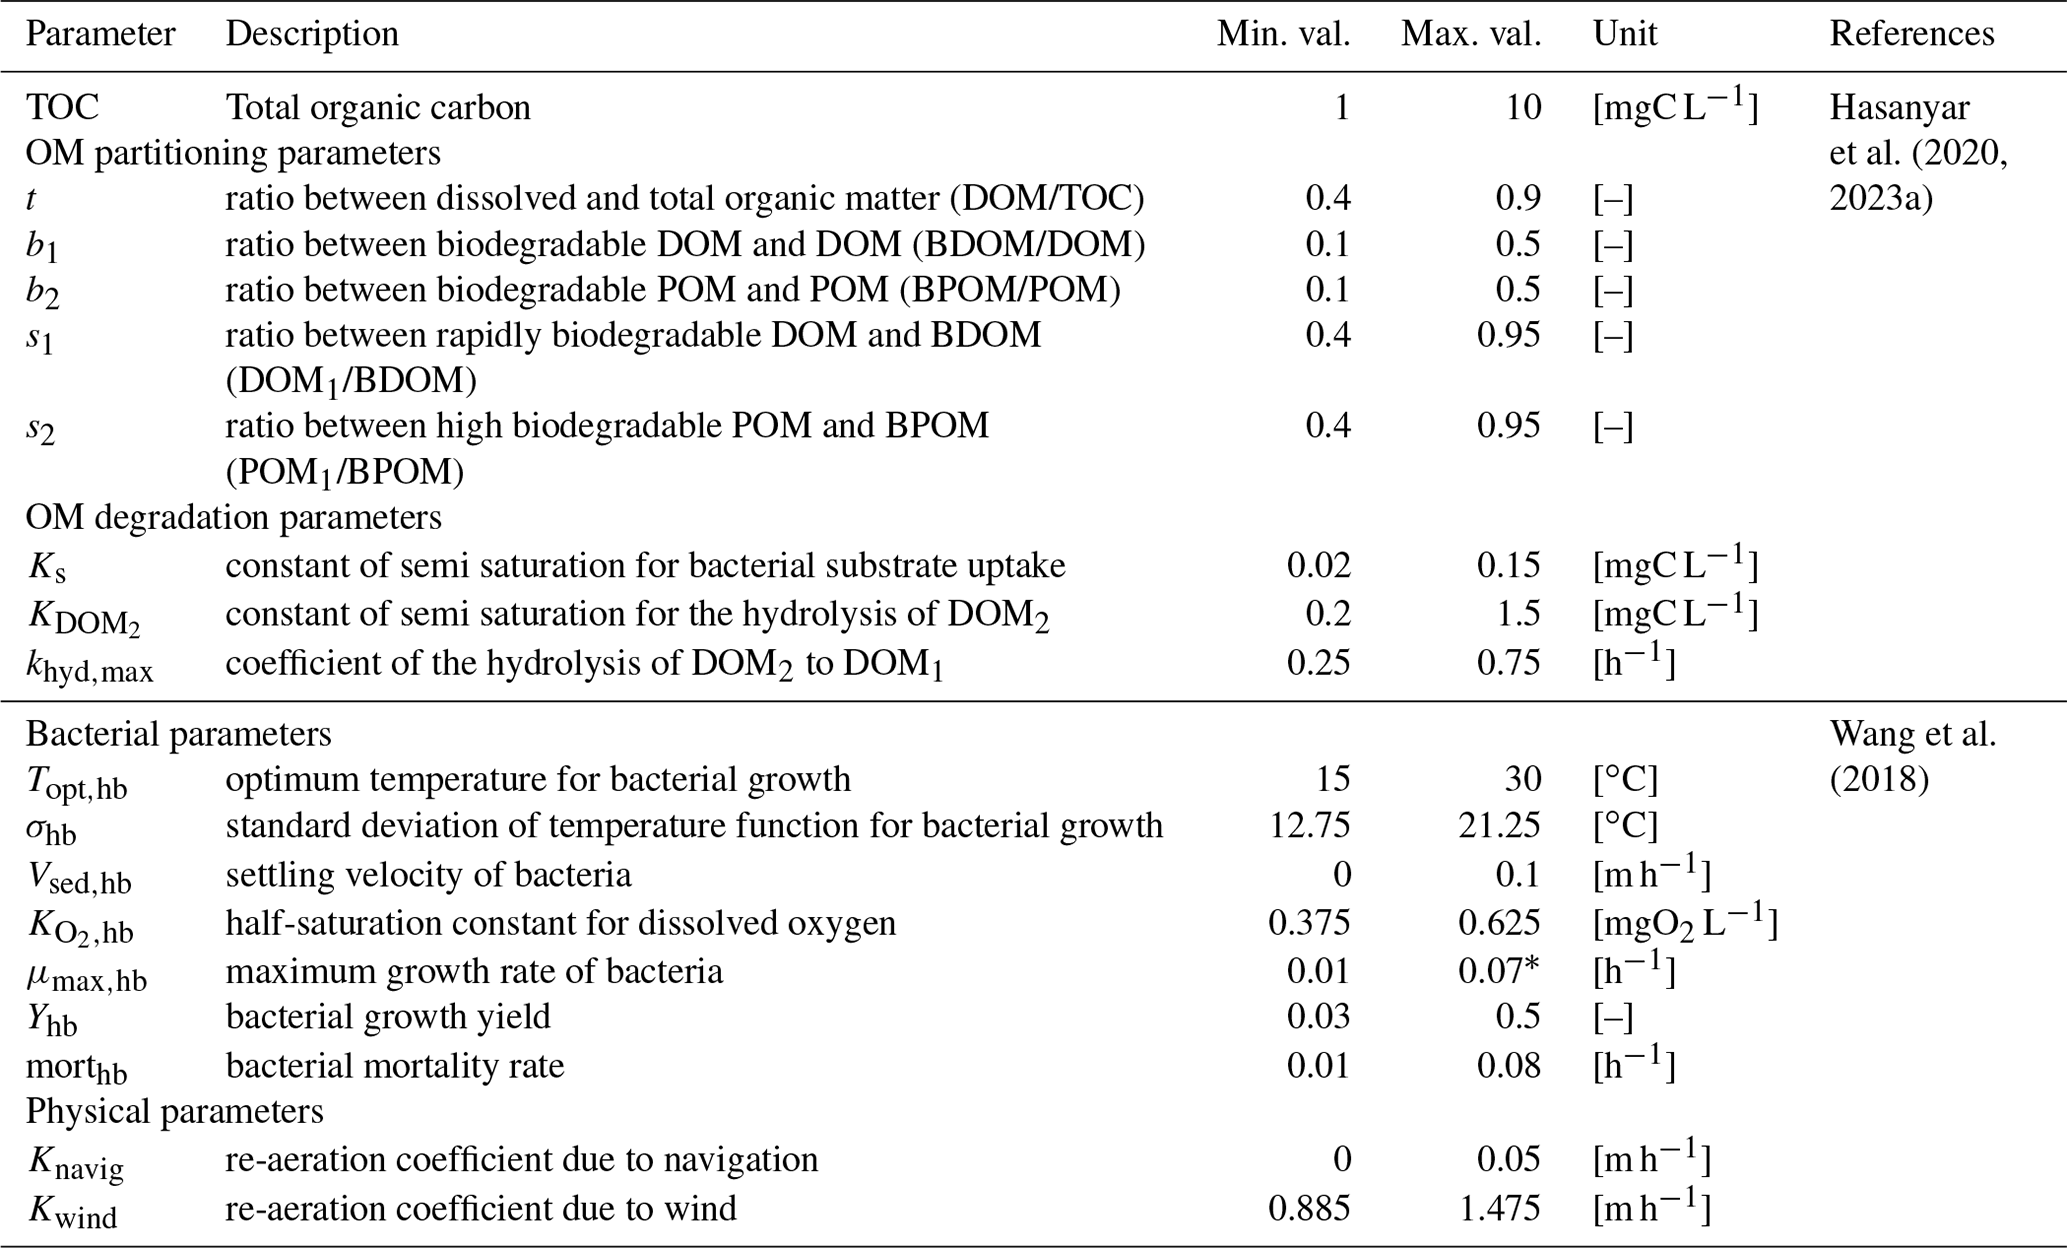
* The upper limit identified by Wang et al. (2018) is decreased from 0.13 to 0.07 h−1 in order to avoid complete DO depletion in simulations longer than 5 d.
2.2 Case study
The synthetic case developed by Wang et al. (2018) is adapted for the application of SAs on C-RIVE parameters during a low-flow period (Fig. 2). It is a river stretch with a width of 100 m and a length of 1000 m representing the Seine River. The low-flow period is characterized by a discharge of 80 m3 s−1. The simulation period is 45 d long in order to be coherent with the experimental protocol of the BDOM measurement (Servais et al., 1995), that considers 45 d as a limit between refractory and slowly biodegradable organic matter. Moreover, a 45 d simulation period is also necessary for studying the long-term effect of TOC degradation on river metabolism.

Figure 2Synthetic scheme representing a reach of the Seine River (modified from Wang et al., 2018).
Considering the discharge and the wet section, the numerical experiment can be viewed as a Lagrangian one, where we follow a river body along a river network of the above mentioned dimension with a speed of 0.14 m s−1.
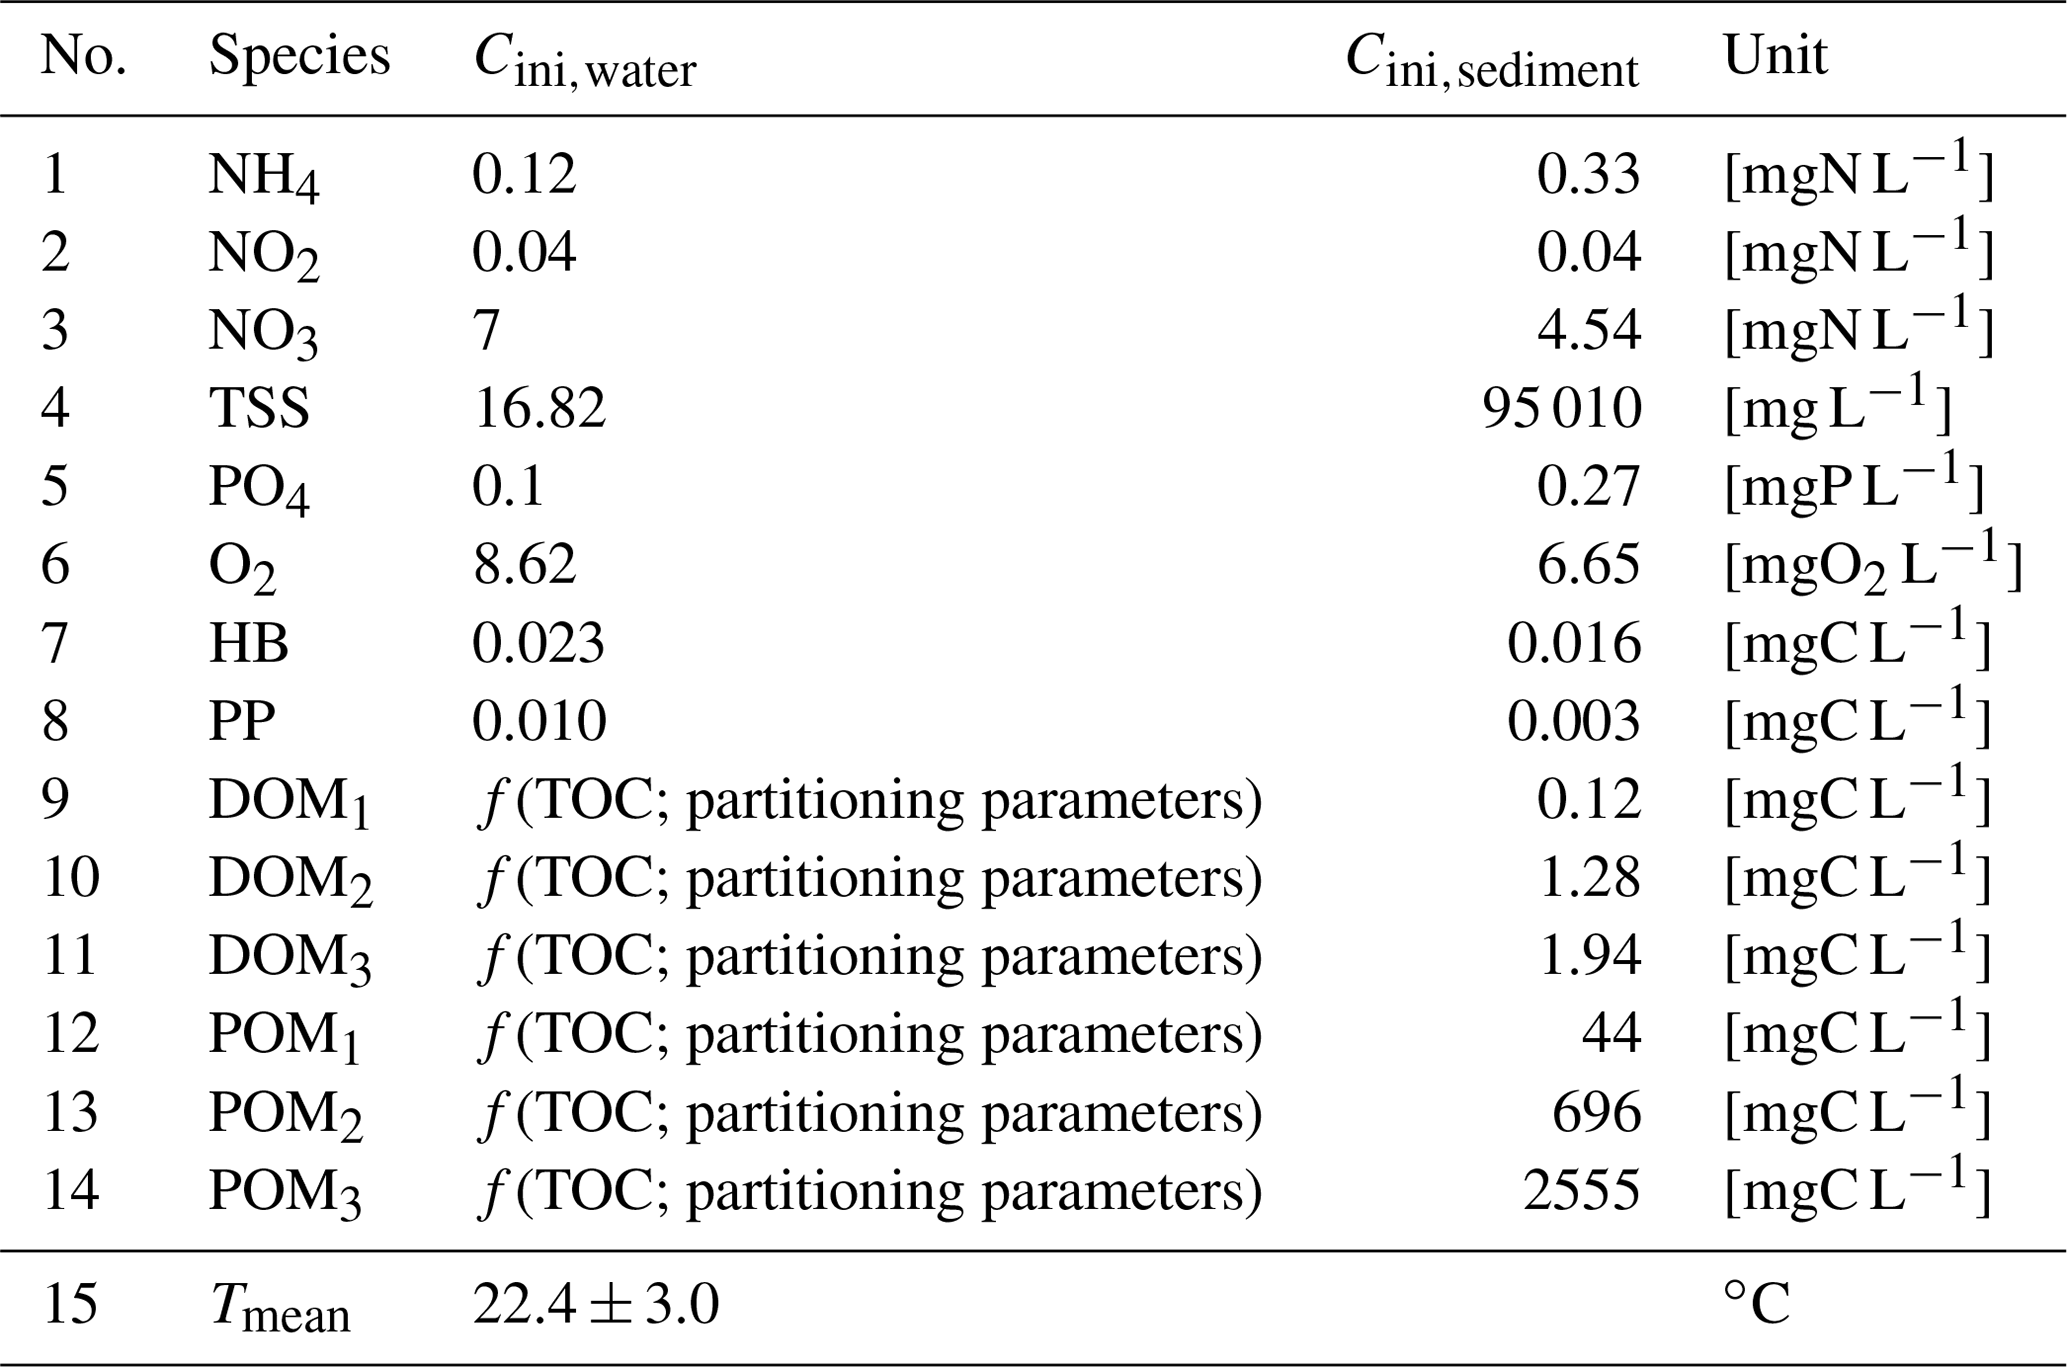
Initial conditions
The initial concentrations for both water and sediment compartments (Table 2) are set based on the mean concentrations of the simulations at Bougival station during the 2007–2012 period (Vilmin et al., 2016), except for water temperature (depending on summer season), DO (depending on oxygen solubility), POM and DOM fractions (depending on the TOC concentration and partitioning parameters), and phytoplankton and bacterial biomass (depending on a post-bloom condition). As far as organic matter is concerned, TOC is first defined and then distributed into its DOM and POM fractions depending on the values of the five OM partitioning parameters (t, b1, s1, b2, s2). The hyporheic exchanges (between groundwater and river) are ignored in this work because the contribution of groundwater to a downstream river (Strahler order: >6), such as the Seine River at the crossing of the Paris urban area, is negligible with respect to the discharge of the river itself. For the Seine River, the groundwater contribution along a 100 km is around 1 m3 s−1 with respect to the Seine discharge amounting for 80 m3 s−1 during severe low-flow conditions (Pryet et al., 2015).
2.3 Sensitivity analysis strategy
Before defining in detail the SA, a coarse pre-analysis consisting in forward simulations of the C-RIVE model is conducted with extreme parameter values. Then, various SA are developed to assess the assumptions and conclusions put in place in the pre-analysis.
2.3.1 Pre-analysis of the model with extreme parameter values
First, we need to select certain parameters for the pre-analysis. We consider μmax,hb, morthb, and Yhb, as they were found to be influential in the study of Wang et al. (2018) under non-bloom situations. However, to decrease the number of parameters, morthb and μmax,hb are represented together as a single parameter called “net growth (NG)”.
Fixing morthb = 0.02 h−1 at its reference value and μmax,hb ranging between 0.022 and 0.07 h−1, the net growth ranges from 0.002 to 0.05 h−1, while the range for Yhb is taken from Table 1. As the OM partitioning parameters are not C-RIVE inputs, we consider BDOM to represent them in the model. Its range is given by Eqs. (1)–(2) as follows:
Here, TOCref is a reference TOC value and fixed at 5 mgC L−1 (considered as the baseline concentration of TOC in the Seine River; Vilmin et al., 2016), the reference t (tref) = 0.7 is the average value of t variation range, and b1 is taken from Table 1. This way, BDOM varies following b1 only and therefore remains statistically independent from the other parameters.
Eight simulations pertaining to eight different combinations of the minimum and maximum values of the net growth, its associated yield, and BDOM are launched (Table 3), and accordingly for each combination, the evolution of DO, DOM1, DOM2, and BDOM is plotted (Fig. 3).
Table 3Definition of the eight single simulations achieved with extreme values of biodegradable dissolved organic matter, net growth of bacteria community, and its associated yield.
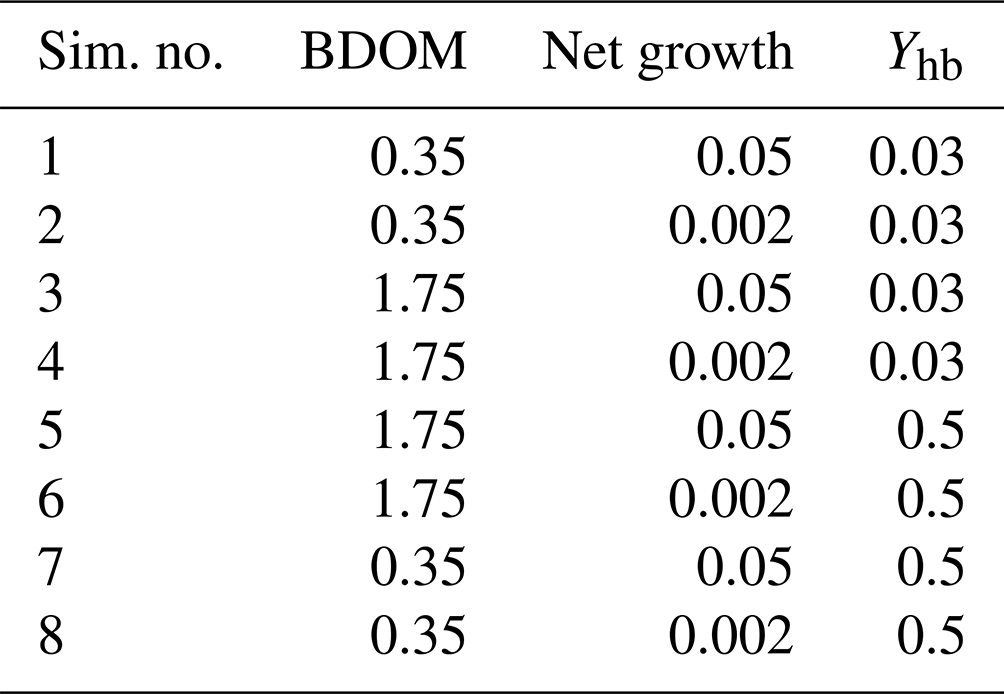
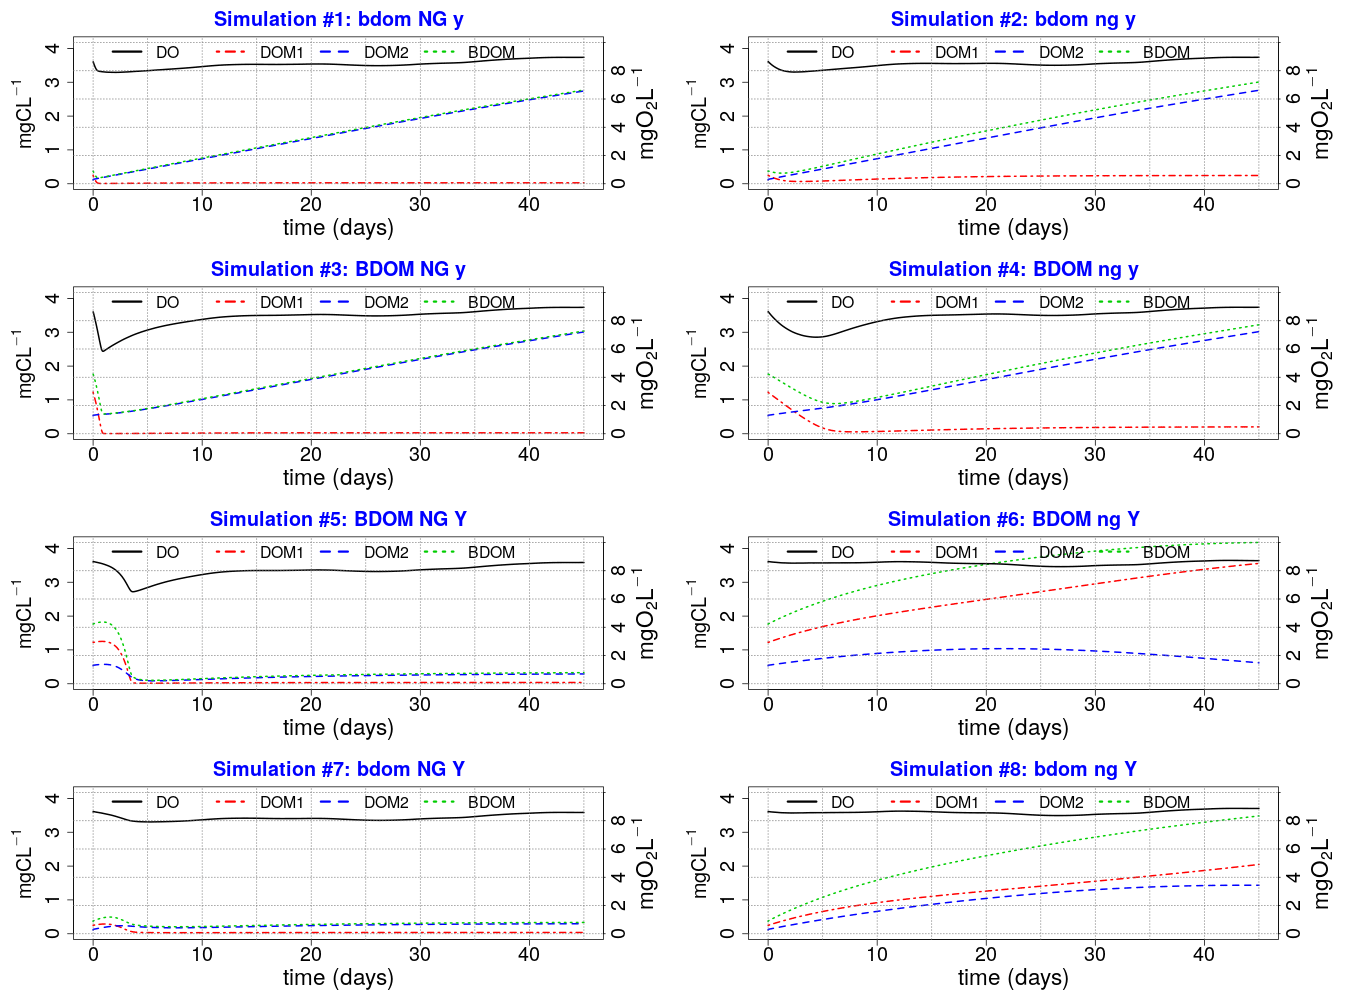
Figure 3Eight plots of single simulations; (XX yy ZZ) Any parameter name written in capital or small letters means that its maximum or minimum value is used, respectively, in that specific single simulation. For example, plot no. 3 (BDOM NG y) that corresponds to simulation no. 3 in Table 3 is a simulation where the maximum values of BDOM and net growth and the minimum value of Yhb are used.
From the pre-analysis, we hypothesize that:
-
The net growth is one of the most influential parameters on DO because all simulations on the left side with a high net growth demonstrate significant depletion of DO than those on the right side having low net growth rates.
-
DO is sensitive to BDOM under high net growth conditions. This could be observed by comparing simulations 3 and 4 (under high net growth condition) with simulations 4 and 6 (under low net growth condition) (Fig. 3).
-
DO is not sensitive to BDOM under low net growth rates. Comparison of simulations 6 and 7 demonstrate that even a high BDOM coupled with low net growth (simulation 6) has less effect on DO than a low BDOM coupled with high net growth (simulation 7).
2.3.2 Understanding river metabolism controls with multiple sensitivity analyses
Three sensitivity analyses (SAs) are derived to test the former three hypotheses. The details of each SA parameterization is available in Table 4.
The first SA is conducted by assuming the general influence of net growth parameters in the pre-analysis and in order to have a broader view of the model sensitivity with respect to all the model parameters. Based on the pre-analysis, we observed that the main effect due to BDOM is linked to high net growth rates; therefore, we can assume that the effect of parameters other than net growth parameters is demonstrated when they are coupled with a high net growth condition. In addition, since a significant interaction (the difference between the first and total sensitivity indices) is observed between net growth parameters in Wang et al. (2018), they are assumed to be hiding the influence of other parameters. We therefore implement a second SA where net growth parameters are fixed at their highest value. This SA removes the possibility of interactions among net growth and other model parameters. It results in a better evaluation of the model sensitivity with respect to the parameters whose influences might be hidden by the dominant and interacting parameters.
The third SA is performed to verify the second SA assumption that parameters other than net growth exert their influence only under a high net growth condition, and thus the same parameters could be deemed non-influential under a low net growth situation. The net growth parameter is fixed at its lowest value.
To summarize, the settings for the three SAs are as follows:
-
First SA (all parameters included). There are 17 defined parameters (Tables 1 and 4) in the model, the simulation period is 45 d. It is repeated for each TOC concentration from 1 to 10 mgC L−1, with a 1 mgC L−1 increase step.
-
Second SA (fixed high net growth). The influence of 12 parameters is evaluated (Table 4). The bacteria net growth rate is fixed to its maximum value using the highest value of the bacteria growth rate ( h−1) and a mortality rate of 0.02 h−1. Furthermore, to decrease the computational cost of the model, the three OM partitioning parameters (t, b1, and b2) from the first SA are narrowed to BDOM and BPOM whose variation ranges are calculated based on the following Eqs. (3)–(6):
where tref is set to 0.7. TOC varies between 1 and 10 mgC L−1, with a 1 mgC L−1 increase step. The time length is set to 5 d according to the pre-analysis, which demonstrated that BDOM or precisely the substrate (DOM1) was consumed in less than 5 d under the high net growth condition (simulations 1, 3, 5, and 7).
-
Third SA (fixed low net growth). The influence of 12 parameters is evaluated (Table 4). This SA is conducted in a similar way than the second SA, except that this time μmax,hb is fixed at a lower value of 0.022 h−1 in order to simulate a very low net growth rate condition of approximately 0.002 h−1. This SA is also implemented for a 5 d period of time and repeated 10 times to simulate TOC ranging from 1 to 10 mgC L−1.
Table 4The parameters considered in each of the four sensitivity analyses.
Each of the three aforementioned SAs is implemented based on an innovative SA methodology initially proposed in Wang et al. (2018) and adopted in this study, where the influence of input parameters (X) is evaluated on the C-RIVE model according to the variations of a large set of DO simulations (model output; Y). The necessary steps pursued for SA are summarized in Sect. S2.
Each SA is performed with a Python script that computes on an Intel(R) Xeon(R) E5-2640 (20 cores at 2.4 GHz). The computational time is 12 h per TOC value for the first SA, while it is reduced to only 3 h per TOC value for the second and third ones.
This section presents the results of the three Sobol SAs during a summer low-flow period. The influential parameters of each analysis are discussed in the following paragraphs.
3.1 First SA: all parameters
Figure 4a presents the results of the Sobol SA method for TOC = 5 mgC L−1. It is expressed by a bar plot of the total sensitivity (ST), first-order sensitivity (S1), and second-order sensitivity (S2) indices of the parameters. The higher-order sensitivity indices are also calculated in terms of the difference between the total and the first- and second-order indices (). The parameters are ranked based on their ST, and the most influential parameters are shown by the shaded area, which includes parameters constituting 95 % of the total variance of the model output. The first SA is conducted for TOC values ranging from 1 to 10 mgC L−1, which corresponds to 10 runs. For each run, the evolution of the normalized total sensitivity indices () of the six most influential parameters is plotted (Fig. 4b).
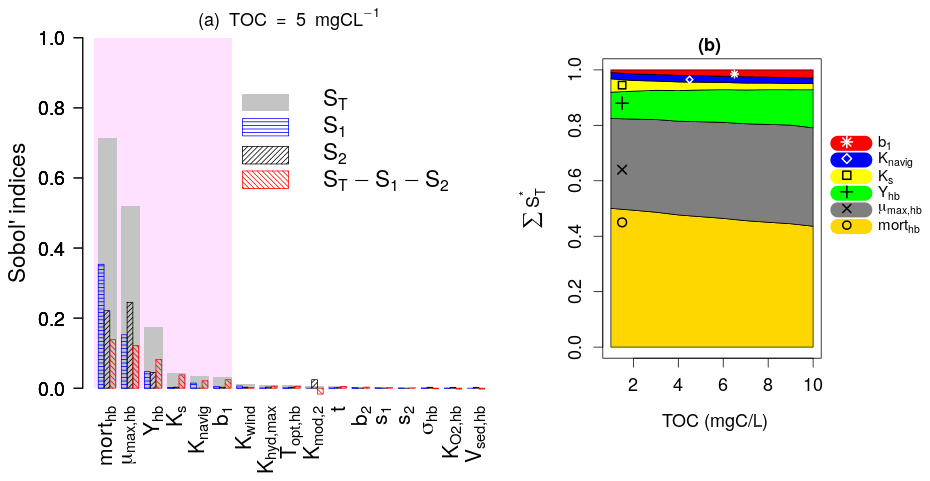
Figure 4Sobol SA results of first SA: all parameters. (a) Sobol SA results for TOC of 5 mgC L−1. (b) Evolution of the normalized total sensitivity indices of the influential parameters with TOC.
DO is controlled by the bacterial mortality rate (morthb), maximum bacterial growth rate (μmax,hb), and bacterial yield (Yhb), whatever the TOC concentration (Fig. 4b). By increasing TOC, we observe a gradual decrease in the influence of morthb but an increase in the influence of Yhb. This result obtained over the 45 d simulation period (Fig. 4) confirms the assumption made in the pre-analysis step (Sect. 2.3.1) regarding the overall dominance of bacterial parameters in long-term low-flow periods.
Apart from the constant of navigation (Knavig), which is a physical parameter, the other two influential parameters (Ks, b1) are OM-related parameters that were introduced in this study. Ks seems to be more important in lower TOC concentrations compared to b1 whose influence increases in higher TOC concentrations.
These results also confirm the assumptions made in the pre-analysis step that the dominant parameters tend to hide the influence of other parameters. Observing the second-order (S2) and higher-order sensitivity () indices of morthb, μmax,hb, and Yhb in Fig. 4a, very strong interactions can be highlighted between these parameters, i.e., a significant portion of their total sensitivity indices is due to their internal interactions. b1 and Ks exert their influence only through higher-order interactions with these three parameters.
In the first SA, the three OM parameters (t, s1, and s2) are found to be non-influential, which means they can be excluded from SA by fixation in the second and third SA while calculating the variation ranges of BDOM and BPOM (Eqs. 1–4). Finally, the inclusion of b1 among influential parameters out of the five OM parameters validates the selection of the BDOM concentration instead of other OM components in the pre-analysis step.
3.2 Second SA under high bacteria net growth rate
The bacteria yield, Yhb, and BDOM are the most influential parameters under high net growth rate conditions (Fig. 5a). This is due to the fact that the bacterial community manages to consume most of BDOM under a high net growth condition, and then at some point, BDOM becomes a limiting factor for their growth. This result confirms the assumption made in the pre-analysis that the influence of parameters other than net growth parameters will be displayed if they are studied under a high net growth condition. The other important parameters are Knavig and Ks whose influence is reduced by increase in TOC. Moreover, very small interactions are observed between the parameters, because almost all of their global influence stem from their main effects (ST≈S1 for each parameter), which once again confirms the previous consideration that interactions are related to the effect of a varying net growth rate.
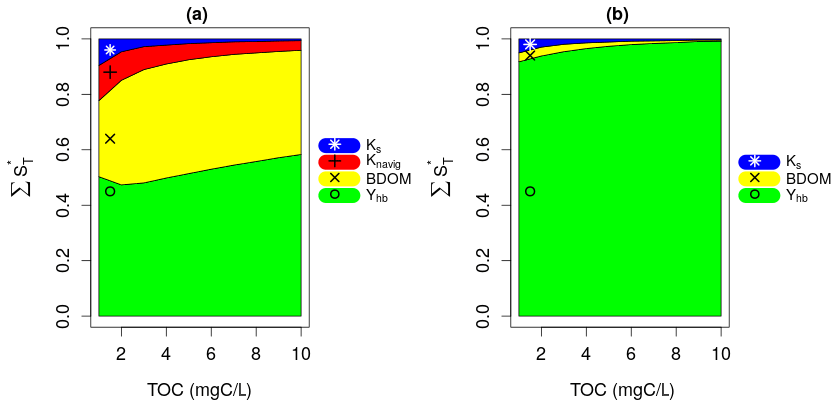
Figure 5Results of (a) second SA: fixed high net growth and (b) third SA: fixed low net growth.
3.3 Third SA under low bacteria net growth rate
The results of the third SA (Fig. 5b) reveal that Yhb only is the influential parameter under a low net growth rate condition across whatever the TOC concentrations. This is due to the fact that, with such a low net growth rate, the bacterial community hardly grows at all, and BDOM is subsequently not a limiting factor for such a small bacterial growth. This result confirms the assumption made in the second SA by displaying all previous influential parameters except Yhb as non-influential.
Finally, the second and third SA show that the influence of BDOM on DO increases with an increasing bacteria net growth rate.
In this section, we propose first to synthesize our results before analyzing the limitations in terms of physical processes accounted for. We then discuss what consequences our results have on water quality monitoring in urban areas and on data assimilation.
4.1 Hierarchy of the most influential parameters on DO during low-flow period
This study confirms that over a 45 d post-bloom summer low-flow period and whatever the TOC concentration, the bacterial net growth rate and Yhb control the DO evolution. This is in agreement with the findings of the study by Wang et al. (2018), which was conducted over a 4 d simulation period. However, the mentioned bacteria physiological parameters are not sufficient to describe DO variation because the OM partitioning parameter, b1, and the OM degradation parameter, Ks, are also influential at low flow under a high bacteria net growth rate.
Conducting the Sobol SA for 5 d under a high bacterial net growth rate condition demonstrated the significant influence of BDOM and Yhb at low flow. This is in connection with the findings of Hullar et al. (2006) and Crump et al. (2003) that emphasized the importance of BDOM on bacteria population. This result is also in accordance with Bailey and Ahmadi (2014) who consider the model boundary condition as influential on DO, but they do not specify which portion of the OM nor do they conduct their study at low flow. Nevertheless, this work is the first quantitative recognition of the role of BDOM on DO evolution that illustrates BDOM as the most influential fraction of the total organic matter entering a river system from its boundary conditions.
4.2 Limitations of the sensitivity analysis
This study is conducted under carbon source conditions where TOC varies between 1 and 10 mgC L−1. It is also assumed that a carbon sink condition never happens. Indeed, carbon depletion would preclude the possibility to quantify the influence of the carbon on the DO concentration. Therefore the upper limit of μmax,hb is reduced from 0.13 to 0.07 h−1 so as to avoid depletion of both carbon and oxygen during the simulation period.
Moreover, since C-RIVE currently lacks the impact of solar radiation on bacteria population, this process is not considered in this work. Nevertheless, it is recommended to be considered in future researches, as solar radiation is found to damage the bacteria DNA impacting their growth and oxygen intake rates (Matallana-Surget and Wattiez, 2013). This phenomenon could be included in the model in a simplistic approach either by increasing bacterial mortality or decreasing its growth rate by a given factor. However, it is necessary to find experimental data in order to quantify the effects of solar radiation that also depend on the type of bacterial community (Park et al., 2023).
4.3 Consequences of the results on water quality monitoring in urban areas
Rivers are highly sensitive to urban outflows at low flow (Seidl et al., 1998a; Huang et al., 2017) due to their low dilution capacity at this period of the year. Moreover, the construction or renewal of sanitary facilities, such as WWTP and CSO during transient events, induces changes in water quality due to changes in DOM, and BDOM concentrations (Servais and Garnier, 1993; Seidl et al., 1998b). As a result, this induces potential shifts in bacterial communities, which have been found to be related to DOM source and its biodegradability (Hullar et al., 2006; Crump et al., 2003) such that an increase in BDOM is considered to increase the diversity of bacterial populations (Landa et al., 2013). Even et al. (2004) therefore recommended a regular reassessment of the influential bacterial parameters. The sampling frequency in the monitoring stations should be set up not only considering the temporal variability of the variable of interest but also integrating possible successions of species.
Our study provides the list of important parameters for water quality modeling at low flow. For the bacterial parameters (mortality rate, maximum growth rate, and growth yield), we propose the implementation of regular bacterial community sampling campaigns in the framework of the water quality monitoring program. Samples should thus be taken in river waters upstream from the major urban areas and in the effluents of major WWTPs and CSOs.
Finally, considering the importance of BDOM at low-flow periods, we propose the addition of BDOM measurement in the existing and new monitoring stations. Innovative methods such as specific ultraviolet absorbance at 254 nm (SUVA254) and fluorescence spectroscopy (Parlanti et al., 2000, 2002; Goffin et al., 2017) could be proposed for high-frequency measurement of OM and BDOM specifically. The monitoring stations shall be dense enough in space so that they could characterize the upstream tributary rivers and the outflow of anthropogenic sources such as WWTP and CSO. Such a spatial density and consideration of point and non-point pollution sources is necessary to cover all BDOM sources (Dixon et al., 1999; Polus et al., 2010; Do et al., 2012).
4.4 Consequences of the results on data assimilation (DA) in water quality modeling
Data assimilation is a method that combines observation data and physically-based modeling in a statistical framework. It consists of sequentially updating the model parameters so that the output of the model will match the observation at each time step (Carrassi et al., 2018). These techniques not only estimate the evolution of influential parameters thanks to observation data such as those of DO but also provide enhanced simulation results of state variables.
The first assimilation tool that uses the particle filter technique (a statistical technique where numerous simulations are launched instead of one single simulation and are weighted based upon how well they reproduce the observed data) to couple with a water quality model is the ProSe-PA software (Wang et al., 2019; Wang, 2019; Wang et al., 2022). While studying a dry year using this software, mismatches were found between simulated and observed DO during low-flow periods (Wang et al., 2022). These mismatches were assumed to be due to insufficient biodegradable organic matter loading in the model caused by underestimated BDOM inputs to the Seine River. Therefore, based on our SA results, we can confirm that hypothesis and propose the incorporation of BDOM (the most influential OM-related parameter through the b1 parameter) as a new component of ProSe-PA. It will facilitate not only the estimation of BDOM but also improves the simulation results subsequently.
Another consequence of our results is that it would be appropriate to fix one or both of the morthb and μmax,hb parameters during data assimilation in order to facilitate parameter identification. In addition, the model of OM partitioning (Fig. 1) shall be explicitly included in the data assimilation software. The description of BDOM in each major organic matter source (tributary river, WWTP, and CSO) should also be independently represented in the DA scheme, because each source brings its own specific contribution of organic matter and heterotrophic bacteria in urban rivers (Garnier et al., 1992; Servais and Garnier, 1993; Seidl et al., 1998b).
The objective of this work was to investigate the role of organic matter loadings to river systems and the physiology of bacteria in river metabolism during a summer non-bloom low-flow period. New parameters were introduced to account for partitioning and degradation of OM. Then, the sensitivity of the C-RIVE model was analyzed against the newly introduced and the already existing model parameters. The following conclusions can be drawn from this study:
-
The Sobol sensitivity analysis method proved to be very efficient in the identification of influential parameters on DO evolution in the C-RIVE model. Then, by fixing the interaction-inducing parameters, the influence of other parameters was assessed. This methodology may also be of interest for future sensitivity analysis where parameter interactions may hide the effect of other parameters;
-
The river metabolism is dominated by bacterial activity at low flow during summer non-bloom periods. As a consequence, the net growth rate of bacteria, that combines their maximum growth rate (μmax,hb) and mortality rate (morthb), is the most important parameter under different TOC concentrations; therefore, it is essential to have a better estimation of the variation ranges of the growth and mortality rates of bacterial communities;
-
Model response is very sensitive to the biodegradable share of DOM (BDOM) contributed by the boundary conditions. The effect of this parameter prevails at higher bacteria net growth rates occurring during summer low-flow periods when the organic matter brought by urban outflows is abundant in the river;
-
Water quality monitoring networks shall continuously measure the influential parameters of this study in order to provide the water quality models with update values;
-
More frequent sampling of autochthonous bacteria communities upstream and downstream of major urban areas and in major WWTP and CSO effluents will be of considerable interest to validate time-varying parameter values estimated by data assimilation frameworks;
-
The results of this study provide a list of influential and non-influential parameters. The latter can be fixed at their average or preferred value as per the literature, and the former can be introduced to the data assimilation tools in order to estimate their temporal evolution with assimilation of high-frequency DO data.
C-RIVE is available under Eclipse Public License 2.0 in the following Zenodo depository: https://doi.org/10.5281/zenodo.7849609 (Wang et al., 2023).
The dataset is available in the following depository: https://doi.org/10.5281/zenodo.7851169 (Hasanyar et al., 2023b).
The supplement related to this article is available online at: https://doi.org/10.5194/bg-20-1621-2023-supplement.
The author contributions are as follows:
-
The calculations were designed by all the authors.
-
The calculations were executed by MH.
-
The results were analyzed by all the authors.
-
The first draft of the article was drafted by MH, and then it was revised and corrected by all the authors.
-
Finally, NF did the search for funding.
The contact author has declared that none of the authors has any competing interests.
Publisher’s note: Copernicus Publications remains neutral with regard to jurisdictional claims in published maps and institutional affiliations.
This work is a contribution to the PIREN-SEINE research program, part of the French Long-Term Socio-Ecological Research (LTSER) site “Zones Ateliers Seine.”
This paper was edited by Gabriel Singer and reviewed by two anonymous referees.
Bailey, R. T. and Ahmadi, M.: Spatial and Temporal Variability of In-Stream Water Quality Parameter Influence on Dissolved Oxygen and Nitrate within a Regional Stream Network, Ecol. Model., 277, 87–96, https://doi.org/10.1016/j.ecolmodel.2014.01.015, 2014. a, b, c, d
Billen, G.: Protein Degradation in Aquatic Environments, in: Microbial Enzymes in Aquatic Environments, edited by: Brock, T. D. and Chróst, R. J., 123–143, Springer New York, New York, NY, https://doi.org/10.1007/978-1-4612-3090-8_7, 1991. a
Billen, G., Lancelot, C., Becker, E., and Servais, P.: Modelling Microbial Processes (Phyto- and Bacterioplankton) in the Schelde Estuary, Hydrobiological Bulletin, 22, 43–55, https://doi.org/10.1007/BF02256781, 1988. a
Billen, G., Garnier, J., and Hanset, P.: Modelling Phytoplankton Development in Whole Drainage Networks: The RIVERSTRAHLER Model Applied to the Seine River System, Hydrobiologia, 289, 119–137, https://doi.org/10.1007/BF00007414, 1994. a, b, c
Billen, G., Garnier, J., and Rousseau, V.: Nutrient Fluxes and Water Quality in the Drainage Network of the Scheldt Basin over the Last 50 Years, Hydrobiologia, 540, 47–67, https://doi.org/10.1007/s10750-004-7103-1, 2005. a
Carrassi, A., Bocquet, M., Bertino, L., and Evensen, G.: Data assimilation in the geosciences: An overview of methods, issues, and perspectives, WIRES Clim. Change, 9, e535, https://doi.org/10.1002/wcc.535, 2018. a
Cho, J., Her, Y., and Bosch, D.: Sensitivity of Simulated Conservation Practice Effectiveness to Representation of Field and In-Stream Processes in the Little River Watershed, Environ. Model. Assess., 22, 159–173, https://doi.org/10.1007/s10666-016-9530-6, 2017. a
Cox, B.: A Review of Currently Available In-Stream Water-Quality Models and Their Applicability for Simulating Dissolved Oxygen in Lowland Rivers, Sci. Total Environ., 314–316, 335–377, https://doi.org/10.1016/S0048-9697(03)00063-9, 2003. a
Crump, B. C., Kling, G. W., Bahr, M., and Hobbie, J. E.: Bacterioplankton Community Shifts in an Arctic Lake Correlate with Seasonal Changes in Organic Matter Source, Appl. Environ. Microbiol., 69, 2253–2268, https://doi.org/10.1128/AEM.69.4.2253-2268.2003, 2003. a, b
Demars, B., Thompson, J., and Manson, J.: Stream Metabolism and the Open Diel Oxygen Method: Principles, Practice, and Perspectives, Limnol. Oceanogr.-Meth., 13, 356–374, https://doi.org/10.1002/lom3.10030, 2015. a
Dixon, W., Smyth, G. K., and Chiswell, B.: Optimized Selection of River Sampling Sites, Water Res., 33, 971–978, https://doi.org/10.1016/S0043-1354(98)00289-9, 1999. a
Do, H. T., Lo, S.-L., Chiueh, P.-T., and Phan Thi, L. A.: Design of Sampling Locations for Mountainous River Monitoring, Environ. Model. Softw., 27–28, 62–70, https://doi.org/10.1016/j.envsoft.2011.09.007, 2012. a
Escoffier, N., Bensoussan, N., Vilmin, L., Flipo, N., Rocher, V., David, A., Métivier, F., and Groleau, A.: Estimating Ecosystem Metabolism from Continuous Multi-Sensor Measurements in the Seine River, Environ. Sci. Pollut. R., 25, 23451–23467, https://doi.org/10.1007/s11356-016-7096-0, 2018. a
Even, S., Poulin, M., Garnier, J., Billen, G., Servais, P., Chesterikoff, A., and Coste, M.: River Ecosystem Modelling: Application of the PROSE Model to the Seine River (France), Hydrobiologia, 373, 27–45, https://doi.org/10.1023/A:1017045522336, 1998. a, b
Even, S., Poulin, M., Mouchel, J.-M., Seidl, M., and Servais, P.: Modelling Oxygen Deficits in the Seine River Downstream of Combined Sewer Overflows, Ecol. Model., 173, 177–196, https://doi.org/10.1016/j.ecolmodel.2003.08.019, 2004. a, b, c, d
Even, S., Mouchel, J. M., Servais, P., Flipo, N., Poulin, M., Blanc, S., Chabanel, M., and Paffoni, C.: Modeling the impacts of Combined Sewer Overflows on the river Seine water quality, Sci. Total Environ., 375, 140–151, https://doi.org/10.1016/j.scitotenv.2006.12.007, 2007. a, b
Flipo, N.: Modélisation intégrée des transferts d'azote dans les aquifères et les rivières: Application au bassin du Grand Morin, PhD thesis, CIG, https://pastel.archives-ouvertes.fr/pastel-00001432 (last access: 24 April 2023), 2005. a
Flipo, N., Even, S., Poulin, M., Tusseau-Vuillemin, M.-H., Ameziane, T., and Dauta, A.: Biogeochemical Modelling at the River Scale: Plankton and Periphyton Dynamics: Grand Morin Case Study, France, Ecol. Model., 176, 333–347, https://doi.org/10.1016/j.ecolmodel.2004.01.012, 2004. a
Flipo, N., Rabouille, C., Poulin, M., Even, S., Tusseau-Vuillemin, M.-H., and Lalande, M.: Primary Production in Headwater Streams of the Seine Basin: The Grand Morin River Case Study, Sci. Total Environ., 375, 98–109, https://doi.org/10.1016/j.scitotenv.2006.12.015, 2007. a
Garnier, J., Billen, G., Servais, P., and Servais, P.: Physiological Characteristics and Ecological Role of Small and Large Sized Bacteria in a Polluted River (Seine River, France), Arch. Hydrobiol. Beih., 37, 83–94, 1992. a
Garnier, J., Billen, G., and Coste, M.: Seasonal Succession of Diatoms and Chlorophyceae in the Drainage Network of the Seine River: Observation and Modeling, Limnol. Oceanogr., 40, 750–765, https://doi.org/10.4319/lo.1995.40.4.0750, 1995. a, b
Garnier, J., Billen, G., and Palfner, L.: Understanding the Oxygen Budget and Related Ecological Processes in the River Mosel: The RIVERSTRAHLER Approach, in: Man and River Systems, edited by: Garnier, J. and Mouchel, J.-M., 151–166, Springer Netherlands, Dordrecht, https://doi.org/10.1007/978-94-017-2163-9_17, 1999. a, b
Garnier, J., Billen, G., Hannon, E., Fonbonne, S., Videnina, Y., and Soulie, M.: Modeling transfer and retention of nutrients in the drainage network of the Danube River, Estuar. Coast. Shelf S., 54, 285–308, 2002. a
Garnier, J., Brion, N., Callens, J., Passy, P., Deligne, C., Billen, G., Servais, P., and Billen, C.: Modeling Historical Changes in Nutrient Delivery and Water Quality of the Zenne River (1790s–2010): The Role of Land Use, Waterscape and Urban Wastewater Management, J. Marine Syst., 128, 62–76, https://doi.org/10.1016/j.jmarsys.2012.04.001, 2013. a
Garnier, J., Marescaux, A., Guillon, S., Vilmin, L., Rocher, V., Billen, G., Thieu, V., Silvestre, M., Passy, P., Raimonet, M., Groleau, A., Théry, S., Tallec, G., and Flipo, N.: Ecological Functioning of the Seine River: From Long-Term Modelling Approaches to High-Frequency Data Analysis, in: The Handbook of Environmental Chemistry, edited by: Flipo, N., Labadie, P., and Lestel, L., 1–28, Springer Berlin Heidelberg, https://doi.org/10.1007/698_2019_379, 2020. a, b, c, d, e
Garvey, J. E., Whiles, M. R., and Streicher, D.: A Hierarchical Model for Oxygen Dynamics in Streams, Can. J. Fish. Aquat. Sci., 64, 1816–1827, https://doi.org/10.1139/f07-144, 2007. a
Goffin, A., Guérin, S., Rocher, V., and Varrault, G.: Caractérisation de l'évolution de la matière organique dissoute de l'amont à l'aval de l'agglomération parisienne pendant une année hydrologique par spectrométrie de fluorescence 3D, Tech. rep., PIREN-Seine phase VII, https://doi.org/10.26047/6z21-5788, 2017. a
Hasanyar, M., Flipo, N., Romary, T., Wang, S., and Yari, A.: Rôle de la matière organique dans le métabolisme des rivières à bas débit, PIREN-Seine phase 8 – Technical report, PIREN-Seine, https://doi.org/10.26047/fqt4-gx71, 2020. a, b, c
Hasanyar, M., Flipo, N., Romary, T., Wang, S., Parlanti, E., and Garnier, J.: A review of variables representing the description and degradation of organic matter in world rivers under different climatic, hydrological, and land cover conditions, in preparation, 2023a. a, b
Hasanyar, M., Wang, S., and Flipo, N.: Biogeosciences paper data for Hasanyar et al. “How much do bacterial growth properties and biodegradable dissolved organic matter control water quality at low flow?”, Zenodo [data set], https://doi.org/10.5281/zenodo.7851169, 2023b. a
Huang, J., Yin, H., Chapra, S., and Zhou, Q.: Modelling Dissolved Oxygen Depression in an Urban River in China, Water, 9, 520, https://doi.org/10.3390/w9070520, 2017. a
Hullar, M. A. J., Kaplan, L. A., and Stahl, D. A.: Recurring Seasonal Dynamics of Microbial Communities in Stream Habitats, Appl. Environ. Microbiol., 72, 713–722, https://doi.org/10.1128/AEM.72.1.713-722.2006, 2006. a, b
Hutchins, M., Harding, G., Jarvie, H., Marsh, T., Bowes, M., and Loewenthal, M.: Intense Summer Floods May Induce Prolonged Increases in Benthic Respiration Rates of More than One Year Leading to Low River Dissolved Oxygen, Journal of Hydrology X, 8, 100056, https://doi.org/10.1016/j.hydroa.2020.100056, 2020. a
Landa, M., Cottrell, M. T., Kirchman, D. L., Blain, S., and Obernosterer, I.: Changes in Bacterial Diversity in Response to Dissolved Organic Matter Supply in a Continuous Culture Experiment, Aquat. Microb. Ecol., 69, 157–168, https://doi.org/10.3354/ame01632, 2013. a
Luu, M. T., Dinh, T. D., Trinh, D. A., and Doc, N. T.: Water Quality in an Urbanized River Basin Impacted by Multi-Pollution Sources: From Comprehensive Surveys to Modelling, ScienceAsia, 47, 86–95, https://doi.org/10.2306/scienceasia1513-1874.2021.014, 2021. a
Matallana-Surget, S. and Wattiez, R.: Impact of Solar Radiation on Gene Expression in Bacteria, Proteomes, 1, 70–86, https://doi.org/10.3390/proteomes1020070, 2013. a
Nossent, J., Elsen, P., and Bauwens, W.: Sobol' Sensitivity Analysis of a Complex Environmental Model, Environ. Modell. Softw., 26, 1515–1525, https://doi.org/10.1016/j.envsoft.2011.08.010, 2011. a
Odum, H. T.: Primary Production in Flowing Waters1, Limnol. Oceanogr., 1, 102–117, https://doi.org/10.4319/lo.1956.1.2.0102, 1956. a, b
Park, H., Shah, S. S. A., Korshin, G., Angelidaki, I., and Choo, K.-H.: The Impact of Sunlight on Fouling Behaviors and Microbial Communities in Membrane Bioreactors, J. Membrane Sci., 672, 121443, https://doi.org/10.1016/j.memsci.2023.121443, 2023. a
Parlanti, E., Wörz, K., Geoffroy, L., and Lamotte, M.: Dissolved Organic Matter Fluorescence Spectroscopy as a Tool to Estimate Biological Activity in a Coastal Zone Submitted to Anthropogenic Inputs, Org. Geochem., 31, 1765–1781, https://doi.org/10.1016/S0146-6380(00)00124-8, 2000. a
Parlanti, E., Morin, B., and Vacher, L.: Combined 3D-Spectrofluorometry, High Performance Liquid Chromatography and Capillary Electrophoresis for the Characterization of Dissolved Organic Matter in Natural Waters, Org. Geochem., 33, 221–236, https://doi.org/10.1016/S0146-6380(01)00154-1, 2002. a
Polus, E., de Fouquet, C., Flipo, N., and Poulin, M.: Caractérisation spatiale et temporelle de la qualité des ≪Masses d'Eau Cours d'Eau≫ [Spatial and temporal characterization of “Stream Water Bodies” quality], Revue des Sciences de l'eau, 23, 415–429, https://doi.org/10.7202/045101ar, 2010. a
Pryet, A., Labarthe, B., Saleh, F., Akopian, M., and Flipo, N.: Reporting of stream-aquifer flow distribution at the regional scale with a distributed process-based model, Water Resour. Manag., 29, 139–159, https://doi.org/10.1007/s11269-014-0832-7, 2015. a
Quynh, L. T. P., Garnier, G., Billen, G., Thiem, L. N., and Minh, C. V.: Preminary results of riverstrahler model application to the red river system (Vietnam), Vietnam Journal of Chemistry, 47, 110–115, https://doi.org/10.15625/4550, 2014. a
Raimonet, M., Vilmin, L., Flipo, N., Rocher, V., and Laverman, A.: Modelling the fate of nitrite in an urbanized river using experimentally obtained nitrifier growth parameters, Water Res., 73, 373–387, https://doi.org/10.1016/j.watres.2015.01.026, 2015. a
Reusser, D. E., Buytaert, W., and Zehe, E.: Temporal dynamics of model parameter sensitivity for computationally expensive models with the Fourier amplitude sensitivity test, Water Resour. Res., 47, W07551, https://doi.org/10.1029/2010WR009947, 2011. a
Seidl, M., Servais, P., Martaud, M., Gandouin, C., and Mouchel, J. M.: Organic Carbon Biodegradability and Heterotrophic Bacteria along a Combined Sewer Catchment during Rain Events, Water Sci. Technol., 37, 25–33, https://doi.org/10.1016/S0273-1223(97)00752-X, 1998a. a, b
Seidl, M., Servais, P., and Mouchel, J.: Organic Matter Transport and Degradation in the River Seine (France) after a Combined Sewer Overflow, Water Res., 32, 3569–3580, https://doi.org/10.1016/S0043-1354(98)00169-9, 1998b. a, b
Servais, P.: Modélisation de la biomasse et de l'activité bactérienne dans la Meuse belge, Revue des Sciences de l'eau, 2, 543–563, https://doi.org/10.7202/705042ar, 1989. a
Servais, P. and Garnier, J.: Contribution of Heterotrophic Bacterial Production to the Carbon Budget of the River Seine (France), Microb. Ecol., 25, 19–33, https://doi.org/10.1007/BF00182127, 1993. a, b
Servais, P., Barillier, A., and Garnier, J.: Determination of the Biodegradable Fraction of Dissolved and Particulate Organic Carbon in Waters, Ann. Limnol.-Int. J. Lim., 31, 75–80, https://doi.org/10.1051/limn/1995005, 1995. a
Sferratore, A., Billen, G., Garnier, J., Smedberg, E., Humborg, C., and Rahm, L.: Modelling nutrient fluxes from sub-arctic basins: Comparison of pristine vs. dammed rivers, J. Marine Syst., 73, 236–249, https://doi.org/10.1016/j.jmarsys.2007.10.012, 2008. a
Sobol, I. M.: Sensitivity Estimates for Nonlinear Mathematical Models, Mathematical Modelling and Computational Experiments, 1, 407–414, 1993. a
Staehr, P., Bade, D., van de Bogert, M., Koch, G., Williamson, C., Hanson, P., Cole, J., and Kratz, T.: Lake Metabolism and the Diel Oxygen Technique: State of the Science, Limnol. Oceanogr.-Meth., 8, 628–644, https://doi.org/10.4319/lom.2010.8.0628, 2010. a
Streeter, H. and Phelps, E. B.: A study of the pollution and natural purification of the Ohio River, Tech. Rep. 146, U.S. Public Health Service, Treasury Department, Washington DC, http://udspace.udel.edu/handle/19716/1590 (last access: 24 April 2023), 1925. a, b
Thieu, V., Billen, G., and Garnier, J.: Nutrient Transfer in Three Contrasting NW European Watersheds: The Seine, Somme, and Scheldt Rivers. A Comparative Application of the Seneque/Riverstrahler Model, Water Res., 43, 1740–1754, https://doi.org/10.1016/j.watres.2009.01.014, 2009. a, b, c
Thieu, V., Garnier, J., and Billen, G.: Assessing the Effect of Nutrient Mitigation Measures in the Watersheds of the Southern Bight of the North Sea, Sci. Total Environ., 408, 1245–1255, https://doi.org/10.1016/j.scitotenv.2009.12.031, 2010. a
Vanrolleghem, P., Borchardt, D., Henze, M., Rauch, W., Reichert, P., Shanahan, P., and Somlyódy, L.: River Water Quality Model no.1 (RWQM1): III Biochemical submodel selection, Water Sci. Technol., 43, 31–40, 2001. a
Vilmin, L., Flipo, N., and Poulin, M.: Le modèle de simulation biogéochimique C-RIVE, Tech. rep., PIREN-Seine, https://doi.org/10.26047/txs7-tm11, 2012. a
Vilmin, L., Flipo, N., de Fouquet, C., and Poulin, M.: Pluri-Annual Sediment Budget in a Navigated River System: The Seine River (France), Sci. Total Environ., 502, 48–59, https://doi.org/10.1016/j.scitotenv.2014.08.110, 2015. a
Vilmin, L., Flipo, N., Escoffier, N., Rocher, V., and Groleau, A.: Carbon Fate in a Large Temperate Human-Impacted River System: Focus on Benthic Dynamics, Global Biogeochem. Cy., 30, 1086–1104, https://doi.org/10.1002/2015GB005271, 2016. a, b, c, d
Vilmin, L., Flipo, N., Escoffier, N., and Groleau, A.: Estimation of the water quality of a large urbanized river as defined by the European WFD: what is the optimal sampling frequency?, Environ. Sci. Pollut. R., 25, 23485–23501, https://doi.org/10.1007/s11356-016-7109-z, 2018. a
Wang, Q., Li, S., Jia, P., Qi, C., and Ding, F.: A Review of Surface Water Quality Models, Sci. World J., 2013, e231768, https://doi.org/10.1155/2013/231768, 2013. a
Wang, S.: Simulation Du Métabolisme de La Seine Par Assimilation de Données En Continu, These de doctorat, Paris Sciences et Lettres, https://pastel.archives-ouvertes.fr/tel-02388690 (last access: 24 April 2023), 2019. a
Wang, S., Flipo, N., and Romary, T.: Time-Dependent Global Sensitivity Analysis of the C-RIVE Biogeochemical Model in Contrasted Hydrological and Trophic Contexts, Water Res., 144, 341–355, https://doi.org/10.1016/j.watres.2018.07.033, 2018. a, b, c, d, e, f, g, h, i, j, k, l, m
Wang, S., Flipo, N., and Romary, T.: Oxygen Data Assimilation for Estimating Micro-Organism Communities' Parameters in River Systems, Water Res., 165, 115021, https://doi.org/10.1016/j.watres.2019.115021, 2019. a
Wang, S., Flipo, N., Romary, T., and Hasanyar, M.: Particle Filter for High Frequency Oxygen Data Assimilation in River Systems, Environ. Modell. Softw., 151, 105382, https://doi.org/10.1016/j.envsoft.2022.105382, 2022. a, b, c, d
Wang, S., Vilmin, L., Hasanyar, M., and Flipo, N.: C-RIVE, Zenodo [code], https://doi.org/10.5281/zenodo.7849609, 2023. a
Yang, C.-P., Lung, W.-S., Kuo, J.-T., and Liu, J.-H.: Water Quality Modeling of a Hypoxic Stream, Pract. Period. Hazard. Toxic Radioact. Waste Manage., 14, 115–123, https://doi.org/10.1061/(ASCE)HZ.1944-8376.0000021, 2010. a