the Creative Commons Attribution 4.0 License.
the Creative Commons Attribution 4.0 License.
 | 23 May 2023
A comparison of the climate and carbon cycle effects of carbon removal by afforestation and an equivalent reduction in fossil fuel emissions
Koramanghat Unnikrishnan Jayakrishnan
Govindasamy Bala
Afforestation and reduction of fossil fuel emissions are two major components of climate mitigation policies. However, their effects on the Earth's climate are different because a reduction of fossil fuel emissions directly alters the biogeochemical cycle of the climate system and modifies the physics of the atmosphere via its impact on radiation and the energy budget, while afforestation causes biophysical changes in addition to changes in the biogeochemical cycle. In this paper, we compare the climate and carbon cycle consequences of carbon removal by afforestation and an equivalent fossil fuel emission reduction using simulations from an intermediate complexity Earth system model. We performed two major sets of idealized simulations in which fossil fuel emissions follow extended Shared Socioeconomic Pathway (SSP) scenarios (SSP2-4.5, 3-7.0, and 5-8.5), and equal amounts of carbon are removed by afforestation in one set and by a reduction in fossil fuel emissions in another set. Our simulations show that the climate is cooler by 0.36, 0.47, and 0.42 ∘C in the long term (2471–2500) in the case of reduced fossil fuel emissions compared to the case with afforestation when the emissions follow the SSP2-4.5, SSP3-7.0, and SSP5-8.5 scenarios, respectively. The global mean surface temperature is cooler in the reduced fossil fuel emissions case compared to the afforestation case because the net biophysical effect of warming from afforestation partly offsets the biogeochemical cooling effect of afforestation. Thus, in terms of climate benefits, reducing fossil fuel emissions could be relatively more beneficial than afforestation for the same amount of carbon removed from the atmosphere. However, a robust understanding of the processes that govern the biophysical effects of afforestation should be improved before considering our results for climate policy.
- Article
(2475 KB) - Full-text XML
-
Supplement
(2975 KB) - BibTeX
- EndNote


Human activities in the industrial era have led to an increase in the concentration of greenhouse gases (GHGs) and an increase in global mean surface temperature (Masson-Delmotte et al., 2021). Climate change has been directly linked to an increase in the frequency of floods, extreme rainfall events, and forest fires in different parts of the world (Allan and Soden, 2008; Anderson et al., 2011; Alfieri et al., 2015; Ali et al., 2019; Papalexiou and Montanari, 2019; Canadell et al., 2021). Two major strategies considered for mitigating climate change are (i) reforestation/afforestation and (ii) the reduction of fossil fuel emissions. While both these methods reduce the carbon accumulation in the atmosphere, the net effect of these two actions on Earth's climate could be different. It may be noted that reforestation/afforestation is one of several carbon dioxide removal (CDR) options that have been suggested to mitigate climate change (Pacala and Socolow, 2004; Psarras et al., 2017; van Kooten, 2020).
The nature of the source or sink of atmospheric CO2 could play a key role in determining its net effect on the Earth's climate. For example, fossil fuel and deforestation emissions differ fundamentally in two ways: (i) fossil fuel use transfers carbon from a relatively inert geological reservoir to the atmosphere, while deforestation results in an internal rearrangement of carbon within the active carbon reservoirs of the climate system, and (ii) deforestation emissions involve a direct change in surface properties of land cover, while fossil fuel emissions do not involve any direct change in land cover. Jayakrishnan et al. (2022) showed that the millennial-scale response of the climate system to emissions from fossil fuel use and deforestation is different because of the above fundamental differences in fossil fuel and deforestation emissions. However, adequate emphasis is not given to the nature of the source or sink in many contexts. An example of the importance of including the non-radiative effects of the source of atmospheric CO2 is discussed in Simmons and Matthews (2016), where they show that the net response of the climate system to land cover change is non-linear when the biophysical cooling effect of land cover change is included. In the current study, we address another set of related questions where the nature of the source or sink is important: are the climate and carbon cycle effects of carbon removal by afforestation or an equivalent reduction of fossil fuel emissions the same? Which of these two actions is more beneficial from a climate change mitigation point of view?
Previous studies on the biophysical effects of land cover change are relevant in answering these questions (Anderson et al., 2011; Wang et al., 2014; Huang et al., 2018). The biophysical effects of land cover change (such as afforestation/deforestation) refer to changes in land surface properties such as land surface albedo, surface roughness, and evapotranspiration. The land surface albedo depends on the vegetation type, since each has different optical properties (Henderson-Sellers and Wilson, 1983; Gao et al., 2005; Houldcroft et al., 2009). Therefore, large-scale changes in the vegetation type can significantly affect the Earth's climate by changing the land surface albedo. Converting the grasslands to forests will lower the land surface albedo, resulting in a warming effect (Chen et al., 2012; Wang et al., 2014; Huang et al., 2018; Shen et al., 2022). Winckler et al. (2019a) show that changes in surface roughness associated with land cover changes can have significant effects on surface temperatures. In addition, afforestation can also result in an increase in evapotranspiration because of the larger transpiration rates of trees compared to grasslands resulting in a cooling influence (Bonan, 2008; Chen et al., 2012; Wang et al., 2014; Duveiller et al., 2018; Huang et al., 2018). However, elevated atmospheric CO2 levels could increase plant water use efficiency, resulting in reduced transpiration rates (Cao et al., 2009, 2010; Gopalakrishnan et al., 2011). The effects of elevated atmospheric CO2 on the transpiration rates are larger for trees compared to grasslands (Kirschbaum and McMillan, 2018). The net effect of afforestation is determined by the balance of the biophysical effects and the biogeochemical cooling effect of removal of carbon from the atmosphere. While many previous studies have shown that the biophysical effects of afforestation are comparable to the biogeochemical cooling effect of afforestation (Chen et al., 2012; Huang et al., 2018; Shen et al., 2022), it is often neglected while climate mitigations strategies are developed primarily because of the uncertainties in quantifying the biophysical effects of afforestation.
In this study, we compare the climate and carbon cycle effects of afforestation and reduction of fossil fuel emissions by considering two idealized simulations. In the first case, fossil fuel emissions follow three extended Shared Socioeconomic Pathway (SSP) scenarios (SSP2-4.5, SSP3-7.0, and SSP5-8.5; Meinshausen et al., 2020), and afforestation results in the removal of carbon from the atmosphere. In the second case, fossil fuel emissions are reduced by the same amount additionally stored on land by afforestation in each of the three SSP scenarios. Figure S1 in the Supplement shows a schematic representation of the two simulations. The final climate states in these two cases are compared to assess the differences in the climate and carbon cycle effects of afforestation and reduced fossil fuel emissions. We hypothesize that the atmospheric warming in these two cases will be different because of the biophysical effects of afforestation. We compare the ocean potential temperature, ocean carbon content, and surface ocean pH in the afforestation and reduced fossil fuel emissions cases to investigate the differences in the impacts on the ocean in these two cases. The sea surface temperature could be different in the afforestation and reduced fossil fuel emission cases because the differences in the atmospheric state should be reflected in the surface ocean on decadal timescales. However, the impacts on the ocean carbon cycle in these two cases are expected to be similar, as the amount of carbon removed from the atmosphere is the same.
2.1 Model
Our simulations use the University of Victoria Earth System Climate Model (UVic ESCM) version 2.9, an Earth system model of intermediate complexity (EMIC), with a horizontal resolution of 3.6∘ in longitude and 1.8∘ in latitude. UVic ESCM includes a vertically integrated energy–moisture balance atmospheric model, a primitive equation ocean general circulation model with 19 vertical layers, and a dynamic–thermodynamic sea ice model (Weaver et al., 2001). A detailed description of the atmospheric, ocean, and sea ice components of the UVic model is given by Weaver et al. (2001). The inorganic ocean carbon cycle is included in the UVic model following the Ocean Carbon Cycle Model Intercomparison Project (OCMIP) protocol and a marine ecosystem model described by Keller et al. (2012). The sediment processes are represented by an oxic-only model of sediment respiration (Eby et al., 2009). The land surface component of the UVic model has a dynamic vegetation model coupled with a land surface scheme (Meissner et al., 2003).
The large-scale present-day climate is represented quite well in the UVic model (Weaver et al., 2001; Skvortsov et al., 2010; Eby et al., 2009; Cao and Jiang, 2017). The spatial distribution of the precipitation and evaporation is simulated quite well in the UVic model compared to the NCEP reanalysis data (Weaver et al., 2001; Meissner et al., 2003). The vegetation biomass, areal coverage of the different plant functional types, and the atmosphere-to-land carbon fluxes simulated by the UVic model are also comparable to the observations (Meissner et al., 2003). Further, Keller et al. (2012) show that the annual global net primary production in the ocean simulated by the UVic model agrees with observations.
The dynamic vegetation model of UVic ESCM is the Top-down Representation of Interactive Foliage and Flora Including Dynamics (TRIFFID; Cox, 2001) model. TRIFFID describes the state of the terrestrial ecosystem using soil carbon, the structure and areal coverage of five plant functional types (broad-leaf tree, needle-leaf tree, C3 grass, C4 grass, and shrub), and bare ground. The competition between the different plant functional types is modeled using the Lotka–Volterra approach (Cox, 2001). When the agricultural land is specified in a grid cell, natural vegetation in that grid cell is removed to satisfy the specified agricultural land fraction. A part of the carbon from the removal of natural vegetation goes into the atmosphere, and the rest goes into the soil depending on a variable called burn fraction (BF). If BF is 1, the total carbon from the removal of natural vegetation goes into the atmosphere. In our simulations, BF is set to 0.5. Thus, half of the carbon from the removal of natural vegetation goes into the atmosphere, and the rest goes into the soil.
In the dynamic vegetation model, the trees and shrubs can grow on the prescribed agricultural land. This regrowth of trees and shrubs into the agricultural land is continually removed to maintain the specified agricultural land fraction. The variable “VEGBURN” indicates the amount of carbon released into the atmosphere either from the removal of natural vegetation for the expansion of agricultural land or from the removal of trees and shrubs that regrow on the prescribed agricultural land fraction. The TRIFFID dynamic vegetation model is coupled to the Met Office Surface Exchange Scheme (MOSES), which is a single-layer version of the MOSES scheme described in Cox et al. (1999). TRIFFID, together with the MOSES scheme, simulates the distribution of vegetation over land and calculates terrestrial carbon stocks and fluxes. The land surface model (TRIFFID dynamic vegetation model coupled to MOSES land surface scheme) calculates the land surface albedo as a function of snow, ice, or changing vegetation distributions (Matthews et al., 2004). A detailed description of the energy–moisture balance equations for the land surface is given by Meissner et al. (2003) and Matthews et al. (2004, 2005).
2.2 Simulations
First, we spin up the model with the land use data corresponding to the year 1750 (Chini et al., 2014) for 7500 years to a steady state with an atmospheric CO2 concentration of 280.8 ppm (Fig. S2a and Table S1 in the Supplement). The last 30 years of this preindustrial spinup simulation (PI_1750) have a global mean surface air temperature (SAT) of 13.2 ∘C (Fig. S2b, Table S1). Further details of the spinup simulation are given in Text S1 in the Supplement. A historical simulation (HIST_1750_2005) is performed from 1750 to 2005, starting from the end of PI_1750 by prescribing historical fossil fuel emissions (Hoesly et al., 2018), land cover change (Chini et al., 2014), and volcanic forcing (Crowley, 2000). The atmospheric CO2 concentration and SAT averaged over the last 30 years (1976–2005) of HIST_1750_2005 are 349.1 ppm and 13.5 ∘C, respectively (Fig. S3 and Table S1 in the Supplement). Comparing our historical simulation with observations shows that the model underestimates the amount of warming in the historical period (Text S2 in the Supplement, Fig. S3). The evolution of key climate variables during the historical simulation is shown in Fig. S4 in the Supplement, and further details of the historical simulation are provided in Text S2.
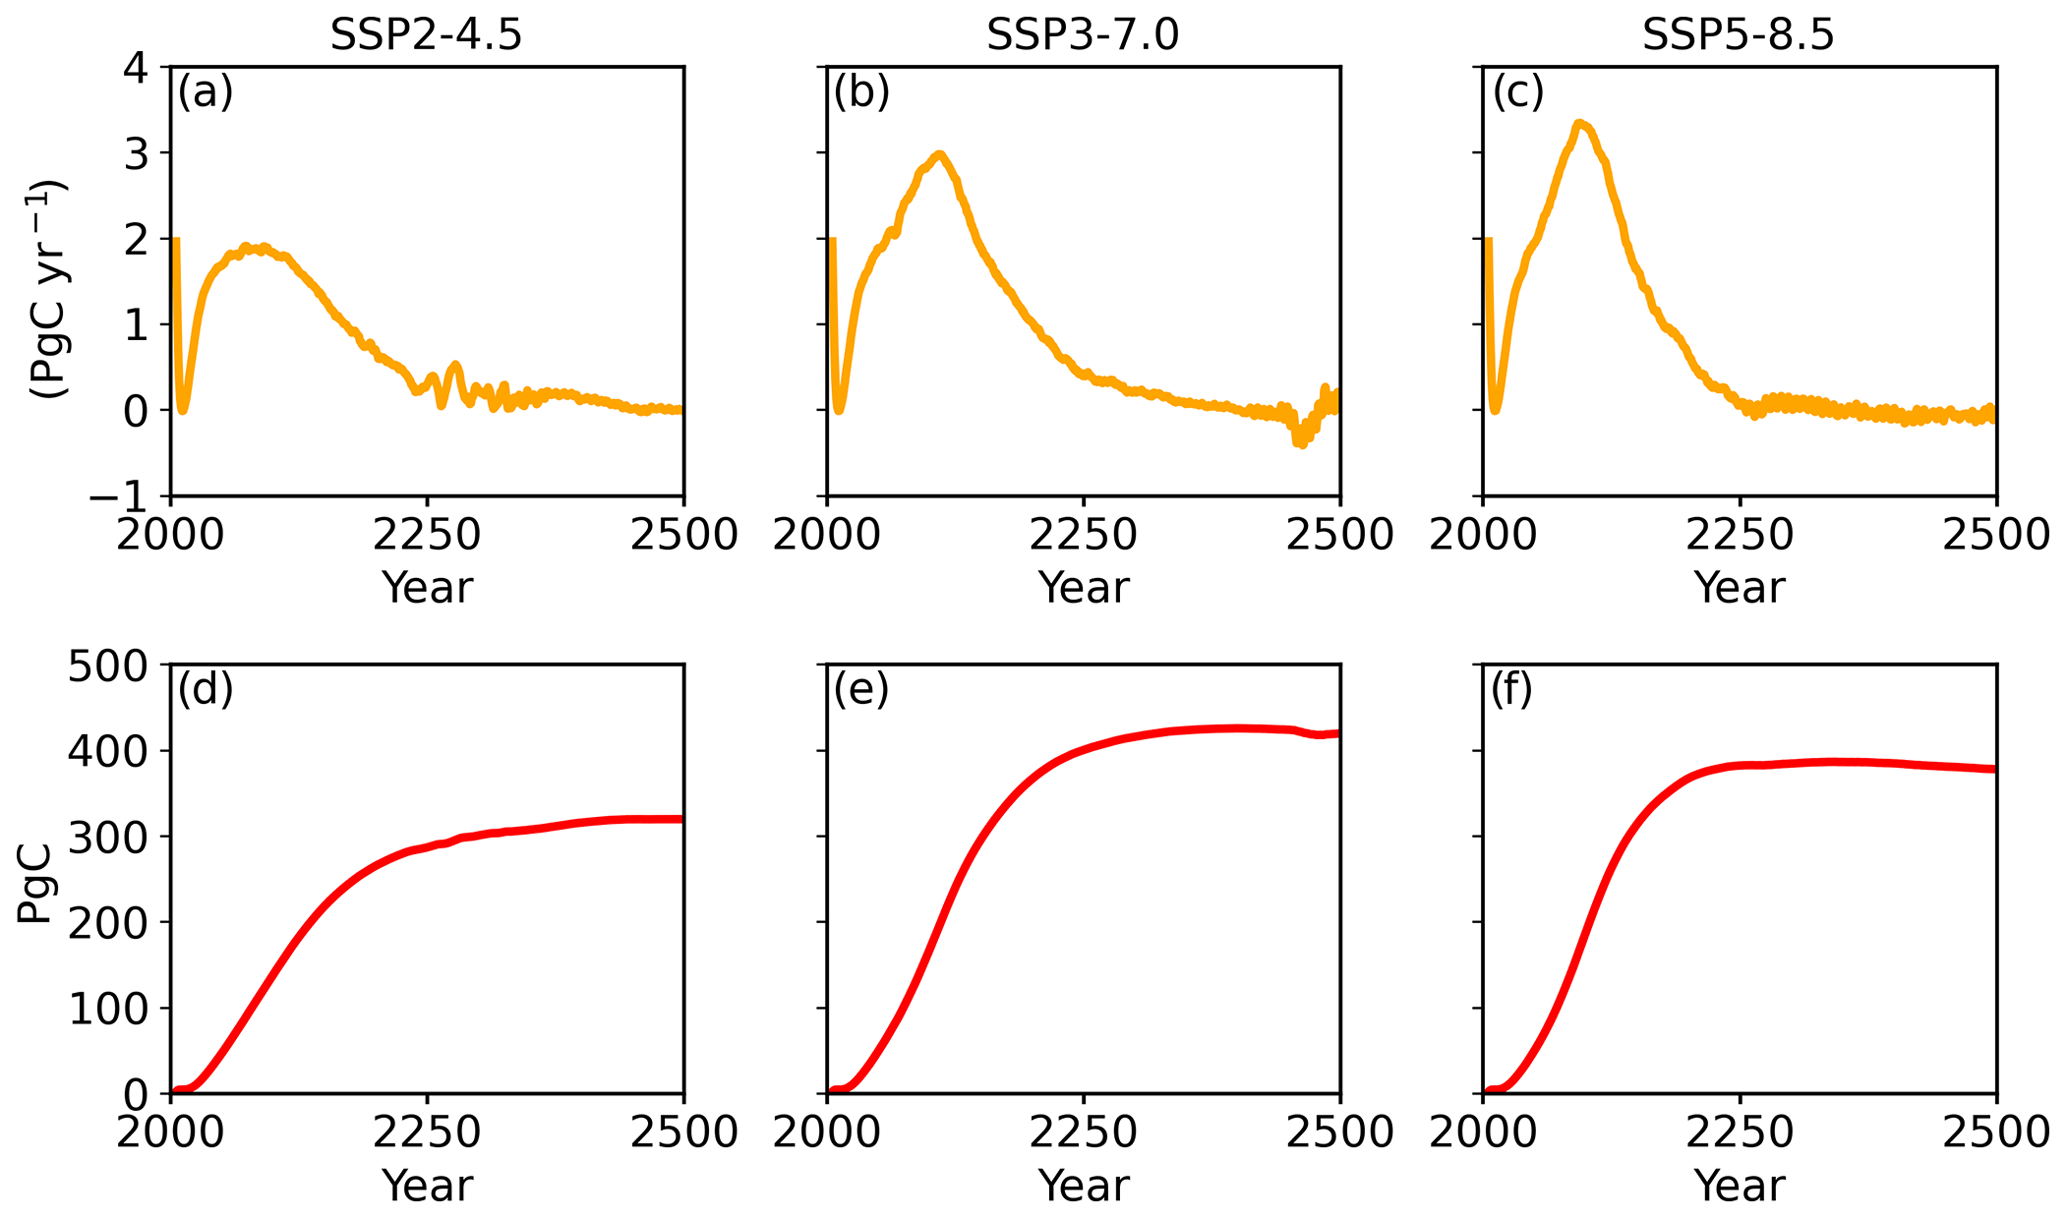
Figure 1Top panels show the amount of carbon additionally stored in land each year in the AFFOREST case compared to the FIXED_AGR case in (a) SSP2-4.5, (b) SSP3-7.0, and (c) SSP 5-8.5 scenarios, respectively. The bottom panels show the cumulative amount of additional carbon storage in land in the AFFOREST case compared to the FIXED_AGR case each year in (d) SSP2-4.5, (e) SSP 3-7.0, and (f) SSP5-8.5 scenarios, respectively. In the AFFOREST simulations, the amount of carbon additionally stored in the land (between 2006–2500) compared to the FIXED_AGR case is 319.84, 418.93, and 379.21 Pg C in the SSP2-4.5, SSP3-7.0, and SSP 5-8.5 scenarios, respectively. The initial peak in yearly additional carbon storage is due to the rapid growth of vegetation over abandoned agricultural land in the AFFOREST case. The second peak is due to the gradual increase in tree fraction in the AFFOREST case (Fig. S5).
Table 2Key climate and carbon cycle variables in the AFFOREST and REDUCED_FF simulations relative to the FIXED_AGR case in the SSP2-4.5, SSP3-7.0, and SSP5-8.5 scenarios (difference in each variable averaged over 2471–2500). The difference between the AFFOREST (REDUCED_FF) and FIXED_AGR cases gives the effects of afforestation (reduced fossil fuel emission) on the climate or carbon cycle variables.

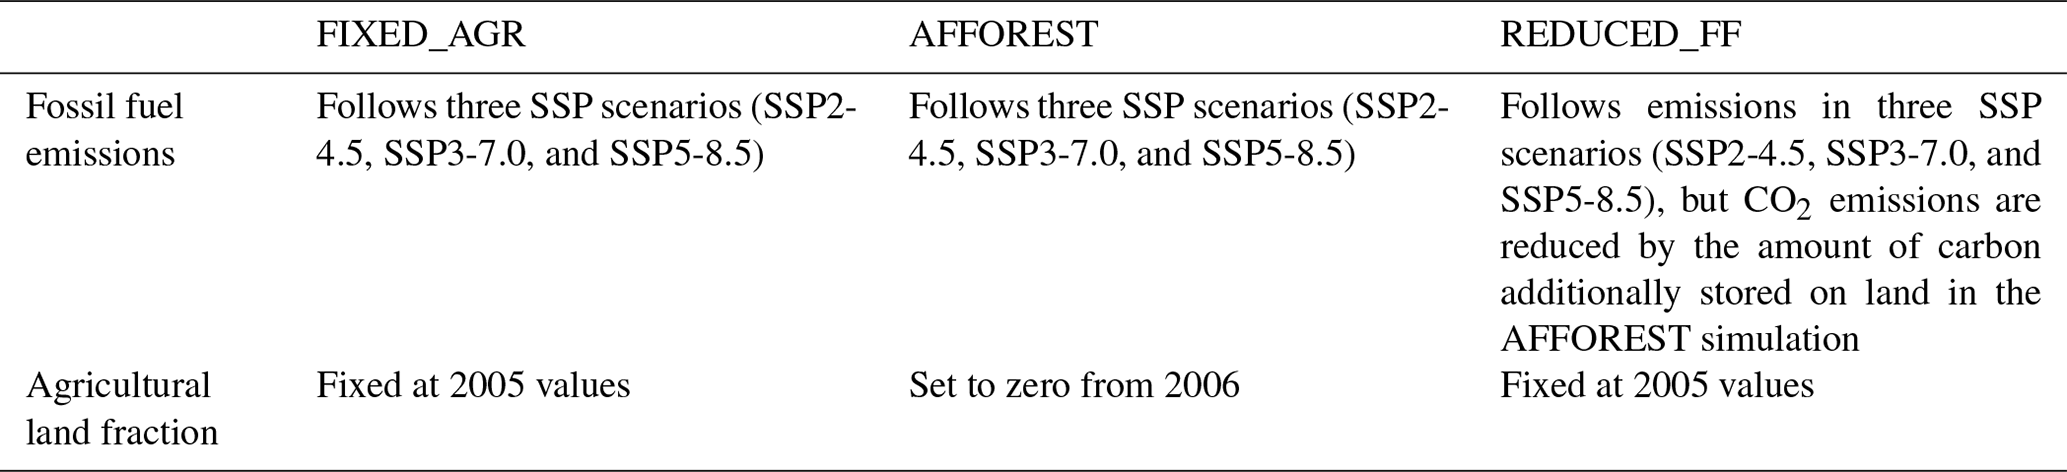
Starting from the historical simulation, we performed three simulations from the year 2006 to 2500 (Table 1): (i) prescribed fossil fuel emission simulation with fixed agricultural land (FIXED_AGR) corresponding to the year 2005, which is a reference simulation to calculate the net effects of afforestation or reduction of fossil fuel emissions; (ii) prescribed fossil fuel emission simulation with afforestation starting from the year 2006 (AFFOREST); and (iii) prescribed fossil fuel emission simulation with reduced emissions (REDUCED_FF) and fixed agricultural land corresponding to the year 2005. The fossil fuel emissions in these three simulations follow extended SSP scenarios (SSP2-4.5, SSP3-7.0, and SSP5-8.5; Meinshausen et al., 2020). The fossil fuel emissions peak in the year 2040, 2100, and 2100 in the SSP2-4.5, SSP3-7.0, and SSP5-8.5 scenarios, respectively, and they reduce to zero by the year 2250 in all three scenarios. In the REDUCED_FF case, the fossil fuel emissions are reduced from the corresponding SSP scenarios by the same amount of carbon additionally stored in land in the AFFOREST case.
In the FIXED_AGR and REDUCED_FF cases, the fraction of the agricultural land is kept constant at values corresponding to the year 2005. Note that the five natural vegetation types can compete outside the agricultural land, and thus, the land cover in the FIXED_AGR and REDUCED_FF cases can change dynamically depending on the climate conditions. In the AFFOREST experiment, vegetation is allowed to regrow over the agricultural land by abruptly setting the agricultural land fraction to zero everywhere, which leads to additional storage of carbon in the land and a reduction in the growth of atmospheric CO2. In the AFFOREST simulations, the amount of carbon additionally stored in the land (between 2006–2500) is 319.84, 418.93, and 379.21 Pg C in the SSP2-4.5, SSP3-7.0, and SSP 5-8.5 scenarios, respectively (Fig. 1, Table 2). Note that our simulations (AFFOREST and REDUCED_FF) are highly idealized and are designed with the sole purpose to assess the relative effectiveness of afforestation and reduced fossil fuel emissions. Hence, these simulations are not consistent with the SSP scenarios.
The AFFOREST (REDUCED_FF) simulations differ from the FIXED_AGR simulations only by afforestation (reduced fossil fuel emissions) in the AFFOREST (REDUCED_FF) simulations. Thus, the net effect of afforestation (reduced fossil fuel emissions) on the climate system is estimated by comparing the climate state of AFFOREST (REDUCED_FF) case with the FIXED_AGR case.
We recognize that the term “afforestation” in the real world refers to the intentional human activity of planting trees to increase forest cover. However, the increase in forest in our AFFOREST simulations is due to the dynamic natural evolution of tree-type vegetation with no human intervention. Nevertheless, we use the term afforestation to refer to the increase in tree cover in these simulations.
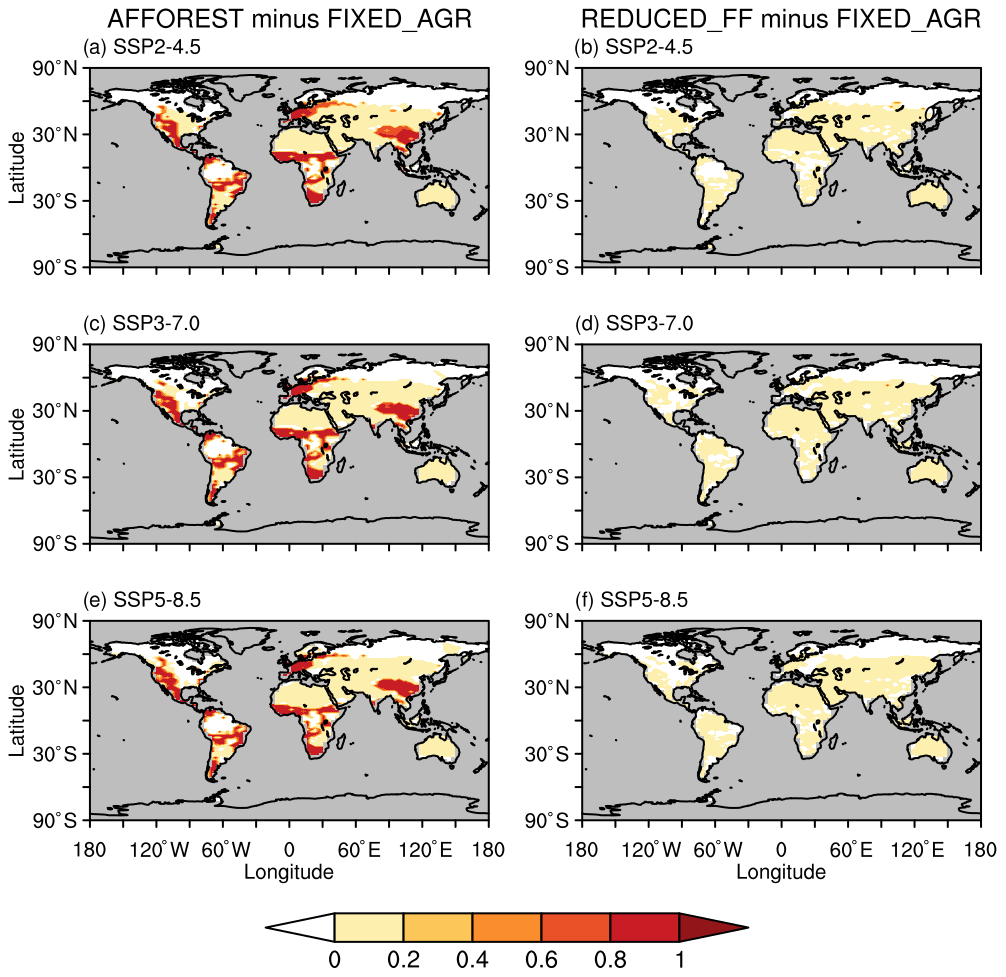
Figure 2The left (a, c, and e) (right; b, d, and f) panel shows the spatial pattern of the difference in tree fraction (averaged over 2471–2500) between the AFFOREST (REDUCED_FF) and FIXED_AGR cases. The top (a, b), middle (c, d), and bottom (e, f) panels correspond to the SSP2-4.5, SSP3-7.0, and SSP5-8.5 scenarios, respectively. The tree fraction is higher in the AFFOREST case compared to the FIXED_AGR case regionally because of the regrowth of forests over abandoned agricultural land after the year 2005, while the REDUCED_FF and FIXED_AGR cases have similar tree fractions in all regions.
3.1 Land carbon stock changes
In this section, we analyze the effects of afforestation on land carbon stock in our simulations. In the AFFOREST case, the regrowth of forests in the abandoned agricultural land results in an increase in tree fraction from approximately 0.22 to 0.44 globally, while in the FIXED_AGR and REDUCED_FF cases, tree fraction remains nearly unchanged at around 0.2 (Fig. S5 in the Supplement) in the three SSP scenarios. The larger tree fraction (averaged over 2471–2500) in the AFFOREST case compared to the FIXED_AGR case has similar spatial distribution in the three SSP scenarios, while there is virtually no difference in tree fraction (averaged over 2471–2500) between REDUCED_FF and FIXED_AGR cases everywhere in the three SSP scenarios (Fig. 2).
In our preindustrial spinup simulation, the land carbon stock is 1789 Pg C (averaged over the last 30 years of PI_1750) (Table S1). In the historical simulation, it stays nearly unchanged at the preindustrial value (Fig. S6 in the Supplement), as the land carbon stock averaged over the last 30 years (1976–2005) of HIST_1750_2005 is 1779 Pg C (Table S1). In the UVic model, the atmosphere-to-land carbon flux is the difference between net primary productivity (NPP) and the sum of soil respiration and vegetation burning flux (VEGBURN). Because the agricultural land fraction is zero everywhere in the AFFOREST case, VEGBURN is zero in the AFFOREST case (Fig. S7 in the Supplement). In all nine simulations, NPP increases initially until around the year when emissions peak (2040 in SSP2-4.5 and 2100 in SSP3-7.0 and SSP5-8.5) due to the CO2 fertilization effect, in which elevated atmospheric CO2 levels lead to increased plant productivity (Fig. S8 in the Supplement). The increase in atmosphere-to-land carbon flux due to this increase in NPP is partly offset by an increase in soil respiration (Fig. S9 in the Supplement) due to an increase in SAT.
The land carbon stock initially increases in all nine simulations until near the end of the 21st century (Fig. S6) because the increase in NPP is larger than the increase in the sum of soil respiration and VEGBURN during this period. After the emissions peak, the rate of increase in NPP and soil respiration starts to decrease because of a weaker CO2 fertilization effect and reduced warming rates, respectively (Figs. S8 and S9). During this period, the land carbon stock decreases after the emissions peak in five out of nine simulations (FIXED_AGR and REDUCED_FF simulations of the SSP3-7.0 scenario and in all three simulations of SSP5-8.5 scenario) (Fig. S6), because the sum of soil respiration and VEGBURN becomes larger than the NPP in these simulations. In the other four simulations, land carbon stock becomes almost constant after the emissions peak (Fig. S6). After the cessation of emissions by the year 2250 (Fig. S10 in the Supplement), NPP becomes relatively constant (Fig. S8) in all nine simulations because of the absence of the CO2 fertilization effect. Global SAT increases only slightly after the cessation of emissions (Sect. 3.3); hence soil respiration also becomes almost constant near the end of all our simulations (Fig. S9). Since NPP, soil respiration, and VEGBURN become relatively constant after the cessation of emissions (Figs. S7–S9), land carbon also becomes relatively constant after the cessation of emissions in all nine simulations (Fig. S6).
The AFFOREST simulations show a larger increase in land carbon stock compared to FIXED_AGR simulations because of the forest regrowth, while the REDUCED_FF simulations show a similar land carbon stock as that of the FIXED_AGR simulations in the three SSP scenarios (Fig. 3a). In the AFFOREST simulations, land carbon stock (averaged over 2471–2500) is larger in regions with forest regrowth (Figs. S11 in the Supplement and Fig. 2), while the spatial distribution of land carbon stock in the REDUCED_FF case is similar to the FIXED_AGR case in the three SSP scenarios (Fig. S11).

Figure 3Changes in (a) global total land carbon stock, (b) land surface albedo, and (c) evapotranspiration in the AFFOREST (solid lines; ΔAFFOREST) and REDUCED_FF (solid lines with triangle markers; ΔREDUCED_FF) cases relative to the FIXED_AGR case in the SSP2-4.5 (green), SSP3-7.0 (orange), and SSP5-8.5 (red) scenarios. In the AFFOREST case, land carbon stock is larger than the FIXED_AGR case by 319.84, 418.93, and 379.21 Pg C in the SSP2-4.5, SSP3-7.0, and SSP5-8.5 scenarios by the year 2500, respectively, while the difference between land carbon stock in REDUCED_FF and FIXED_AGR cases is nearly zero in the three SSP scenarios. The land surface albedo in the AFFOREST case is smaller by 0.011 (averaged over 2471–2500) in the three SSP scenarios compared to the FIXED_AGR case, while the REDUCED_FF case has a similar land surface albedo as in the FIXED_AGR case in the three SSP scenarios. The evapotranspiration is smaller (larger) in the AFFOREST (REDUCED_FF) case compared to the FIXED_AGR case due to changes in the water use efficiency of vegetation at higher atmospheric CO2 levels.
3.2 Biophysical effects of afforestation
The global land surface albedo in our preindustrial simulation (PI_1750) is 0.28 (Table S1), which remains nearly unchanged in the historical simulation (HIST_1750_2005; Fig. S12 in the Supplement, Table S1). In the FIXED_AGR and REDUCED_FF simulations, the land surface albedo is nearly constant, while in the AFFOREST case, land surface albedo decreases initially due to the regrowth of forests and becomes nearly constant after 2250 in the three SSP scenarios (Fig. S12). In the AFFOREST case, the land surface albedo is lower than in the FIXED_AGR case by 0.011 globally in the three SSP scenarios (Fig. 3b, Table 2), while the changes in land surface albedo in the REDUCED_FF case relative to the FIXED_AGR case are nearly zero in the three SSP scenarios (Fig. 3b, Table 2). The land surface albedo (averaged over 2471–2500) is lower in the AFFOREST case compared to the FIXED_AGR case in regions with forest regrowth (Figs. S13 in the Supplement and 2), while in the REDUCED_FF case, the land surface albedo (averaged over 2471–2500) is similar to the FIXED_AGR case everywhere in the three SSP scenarios (Fig. S13).
In the AFFOREST case, evapotranspiration (averaged over 2471–2500) is smaller by 2.6 %, 4.5 % and 6.2 % relative to the FIXED_AGR case in the SSP2-4.5, SSP3-7.0, and SSP5-8.5 scenarios, respectively (Fig. 3c). In contrast, the evapotranspiration (averaged over 2471–2500) is larger by 3.7 %, 7.0 % and 5.3 % in the REDUCED_FF case relative to the FIXED_AGR case in the SSP2-4.5, SSP3-7.0, and SSP5-8.5 scenarios, respectively (Fig. 3c). The decrease (increase) in evapotranspiration in the AFFOREST (REDUCED_FF) case could be explained by the increase in water use efficiency of plants at elevated CO2 levels in the atmosphere as discussed in Sect. 4. In the AFFOREST case, the evapotranspiration (averaged over 2471–2500) is smaller compared to the FIXED_AGR case mostly over the regions with an increase in tree fraction in the three SSP scenarios, while in the REDUCED_FF case, the evapotranspiration is larger or nearly the same as the FIXED_AGR case in different regions in the three SSP scenarios (Fig. S14 in the Supplement).
3.3 Evolution of atmospheric CO2 and surface air temperature
The atmospheric CO2 concentration and SAT (averaged over the last 30 years of PI_1750) in our preindustrial simulation (PI_1750) are 280.8 ppm and 13.2 ∘C (Fig. S2, Table S1), respectively. In our historical simulation (HIST_1750_2005), atmospheric CO2 increases due to fossil fuel and land use change emissions. At the end of the historical simulation, atmospheric CO2 concentration (averaged over 1976–2005) increases to 349.1 ppm (Fig. S3, Table S1), and consequently, SAT increases to 13.5 ∘C (Fig. S3, Table S1).
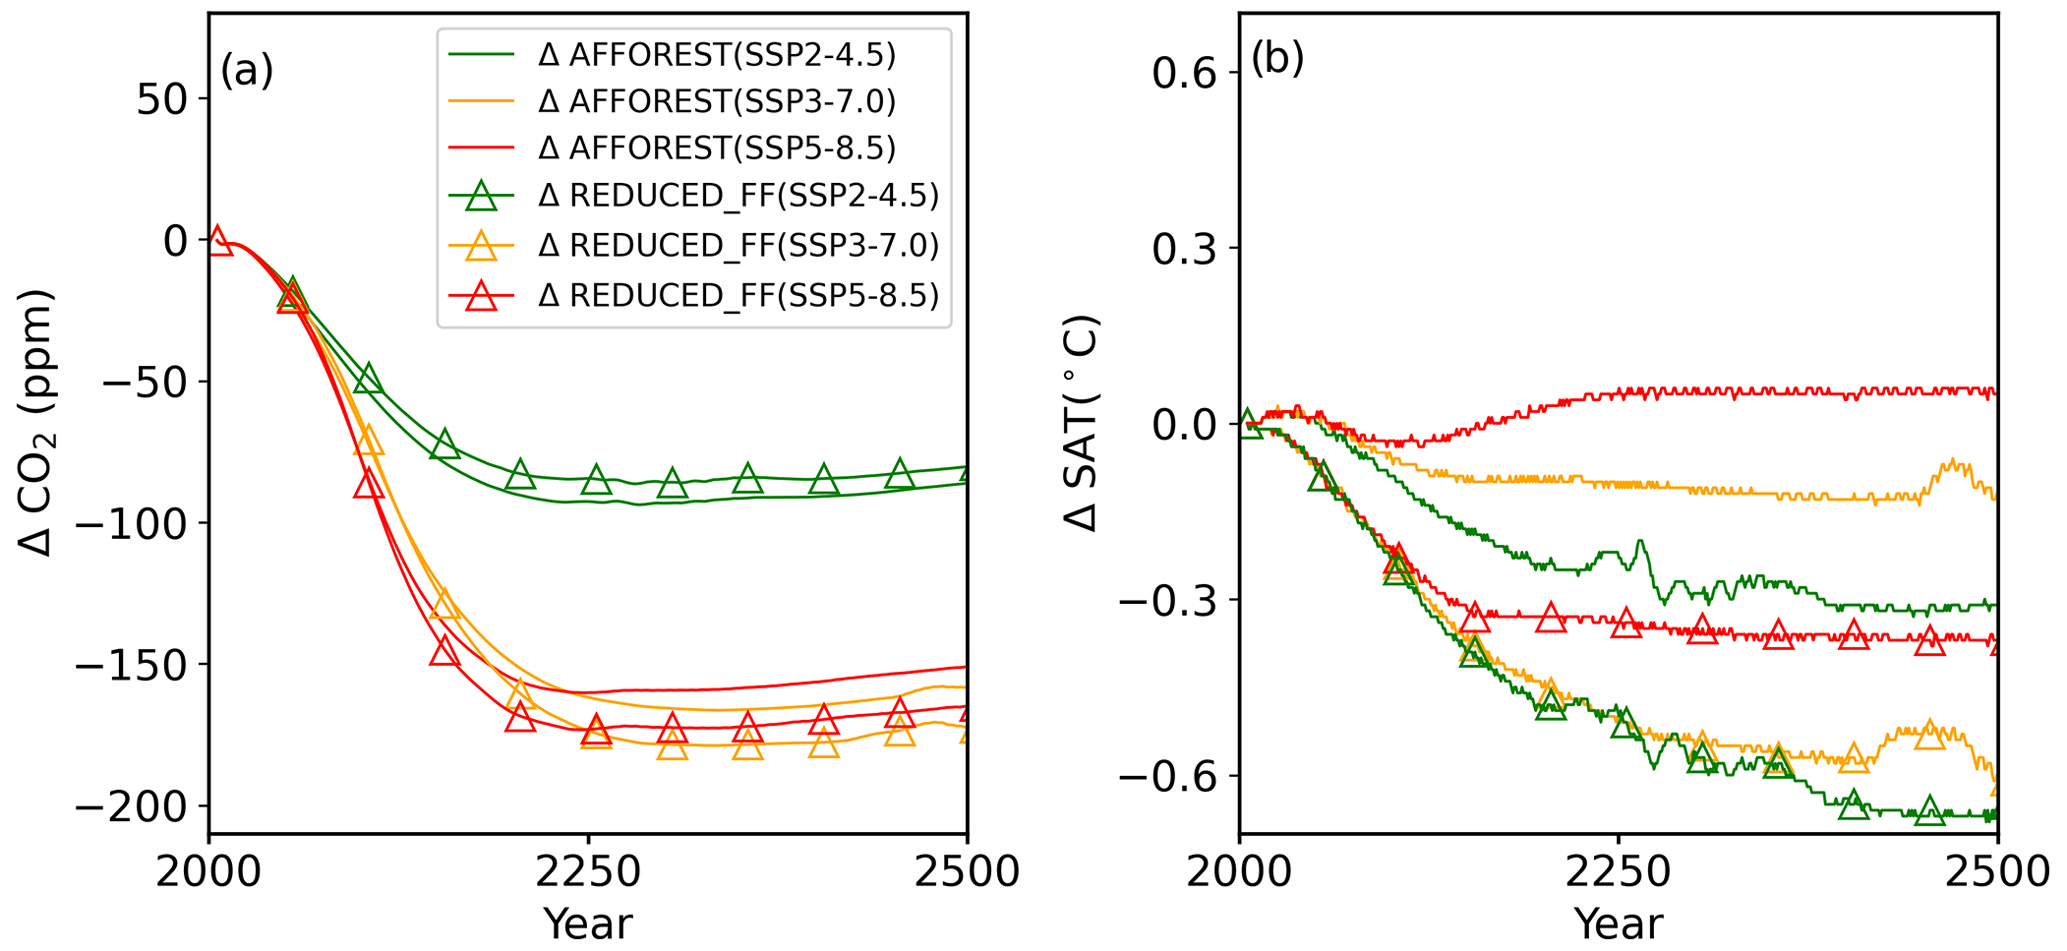
Figure 4Changes in (a) global mean atmospheric CO2 concentration and (b) global mean surface air temperature in the AFFOREST (solid lines; ΔAFFOREST) and REDUCED_FF (solid lines with triangle markers; ΔREDUCED_FF) cases relative to the FIXED_AGR case in the SSP2-4.5 (green), SSP3-7.0 (orange), and SSP5-8.5 (red) scenarios. The decrease in atmospheric CO2 because of afforestation or reduced fossil fuel emissions is almost twice in SSP3-7.0 and SSP5-8.5 compared to SSP2-4.5 due to two reasons: (i) the amount of carbon removed by land is larger in the SSP3-7.0 and SSP5-8.5 scenarios because of the larger CO2 fertilization effect as discussed in Sect. 3.1, and (ii) the larger ocean carbon uptake in the FIXED_AGR case relative to the AFFOREST and REDUCED_FF cases in the SSP2-4.5 compared to SSP3-7.0 and SSP5-8.5 scenarios (Table 2). The REDUCED_FF case has a lower SAT than the FIXED_AGR case in the three SSP scenarios because of reduced fossil fuel emissions in the REDUCED_FF case. In the AFFOREST case, the cooling effect of the removal of CO2 is partially or completely offset by the biophysical warming effects from the regrowth of forests. Hence, the AFFOREST case has a similar SAT as that of the FIXED_AGR case in the SSP3-7.0 and SSP5-8.5 scenarios and a smaller SAT in the SSP2-4.5.
The increase in atmospheric CO2 (averaged over 2471–2500) in our nine simulations compared to HIST_1750 (averaged over 1976–2005) ranges from 140 ppm to 1675 ppm (Fig. S15 in the Supplement, Table S2). Initially, atmospheric CO2 increases until around the cessation of fossil fuel emissions in the year 2250 in all simulations because fossil fuel emissions add more carbon to the atmosphere. After the cessation of emissions, atmospheric CO2 decreases slightly until the end of the simulations (Fig. S15) because the ocean continues to be a weak sink till the end (Sect. 3.4) in all nine simulations, although the land becomes neutral. The atmospheric CO2 concentration is similar and smaller in the AFFOREST and REDUCED_FF simulations compared to the FIXED_AGR simulation in the three SSP scenarios because of the removal of carbon by afforestation and reduced fossil fuel emissions, respectively (Fig. 4a).
The future projections of changes in SAT (averaged over 2471–2500) in our nine simulations relative to HIST_1750 (averaged over 1976–2005) range from 2 to 8 ∘C (Fig. S16 in the Supplement, Table S2). In the three SSP scenarios, the REDUCED_FF case simulates a smaller SAT increase compared to the AFFOREST and FIXED_AGR cases (Fig. S16). The afforestation in the AFFOREST case results in a cooling of 0.31 and 0.1 ∘C and a warming of 0.05 ∘C in the SSP2-4.5, SSP3-7.0, and SSP5-8.5 scenarios, respectively, while the reduction of fossil fuel emissions in the REDUCED_FF case results in a cooling of 0.66, 0.56 and 0.36 ∘C in the SSP2-4.5, SSP3-7.0, and SSP5-8.5 scenarios, respectively, when compared to the FIXED_AGR case (Fig. 4b, Table 2).
In the AFFOREST case, the cooling effect of CO2 removal from afforestation is partly offset by the biophysical warming effects (from lower land surface albedo and reduced evapotranspiration) due to the regrowth of forests. Hence, the AFFOREST case has a larger SAT than the REDUCED_FF case in the three SSP scenarios (Figs. 4b and S17 in the Supplement). In the SSP3-7.0 and SSP5-8.5 scenarios, this offset is almost perfect so that the AFFOREST and FIXED_AGR cases have similar SAT (Figs. 4b and S16). However, in the SSP2-4.5 scenario, the biophysical warming effects due to the regrowth of forests do not completely offset the cooling effect of removing atmospheric CO2 as discussed in Sect. 4.
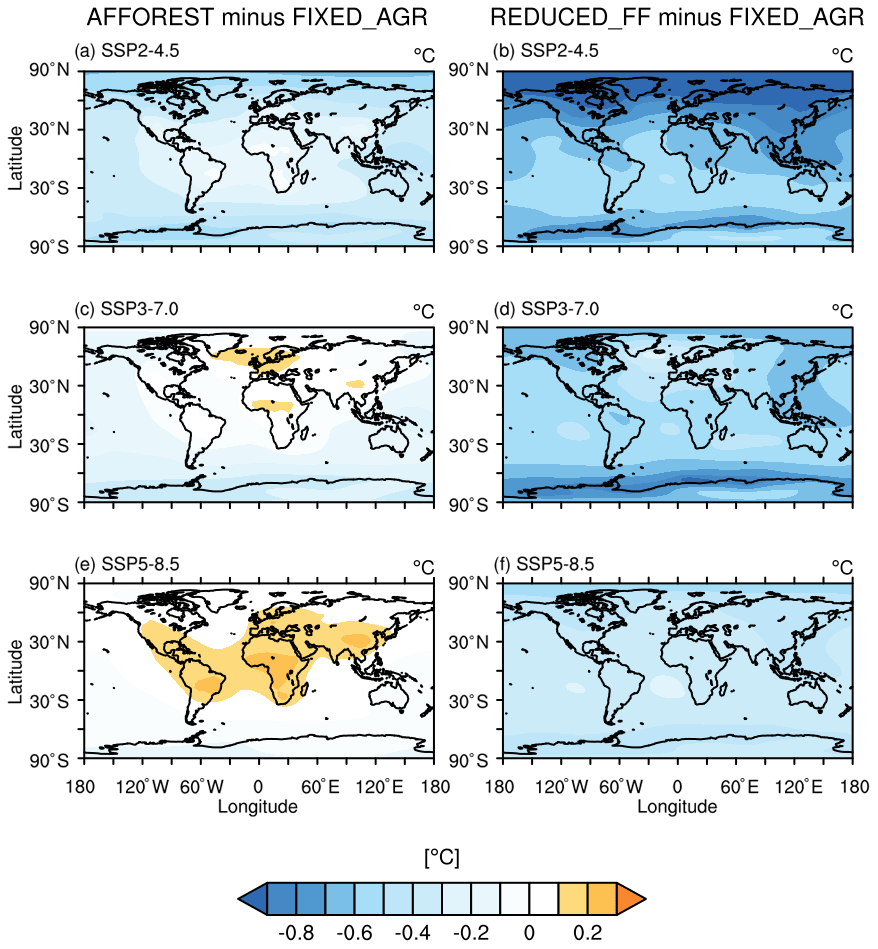
Figure 5The left (a, c, and e) (right; b, d, and f) panel shows the spatial pattern of the difference in annual mean surface air temperature (SAT) averaged over the last 30 years between the AFFOREST (REDUCED_FF) and FIXED_AGR cases. The top (a, b), middle (c, d), and bottom (e, f) panels correspond to the SSP2-4.5, SSP3-7.0, and SSP5-8.5 scenarios, respectively. The REDUCED_FF case shows lower SAT everywhere relative to the FIXED_AGR case in the three SSP scenarios, while the AFFOREST case shows regional warming relative to the FIXED_AGR case in the SSP3-7.0 and SSP5-8.5 scenarios. Note that the regions of warming in the AFFOREST case are more prominent over land where the forest regrowth results in a lower land surface albedo (Fig. S13).
The spatial patterns of SAT (averaged over 2471–2500) in the AFFOREST and REDUCED_FF cases are compared with the FIXED_AGR case in Fig. 5. The REDUCED_FF case is cooler in all regions with respect to the FIXED_AGR case in the three SSP scenarios (Fig. 5), while the AFFOREST case shows regional warming in the SSP3-7.0 and SSP5-8.5 scenarios. This regional warming in the AFFOREST case is more prominent over land, where the afforestation results in a lower land surface albedo and reduced evapotranspiration (Fig. 5). The REDUCED_FF case has a lower surface ocean potential temperature (averaged over 2471–2500) compared to the FIXED_AGR case, while the ocean potential temperature is nearly the same in the AFFOREST and FIXED_AGR cases (Fig. 6). The effects of atmospheric carbon removal are only seen in the surface ocean as it equilibrates with the changes in the atmosphere on shorter timescales compared to the deep ocean.

Figure 6The left (a, c, and e) (right; b, d, and f) panel shows the spatial pattern of the difference in zonally averaged ocean potential temperature (averaged over 2471–2500) between the AFFOREST (REDUCED_FF) and FIXED_AGR simulations. The top (a, b), middle (c, d), and bottom (e, f) panels correspond to the SSP2-4.5, SSP3-7.0, and SSP5-8.5 scenarios, respectively. The difference in ocean potential temperature between AFFOREST and FIXED_AGR cases is nearly zero everywhere, while in the REDUCED_FF case, the surface ocean is cooler compared to the FIXED_AGR case.
3.4 Ocean carbon content and surface ocean pH
The ocean carbon content in the PI_1750 simulation (averaged over 2471–2500) is 37 287 Pg C (Table S1). In our historical simulation (HIST_1750_2005), ocean carbon content increases as increasing CO2 levels in the atmosphere result in increased carbon uptake by the ocean (Fig. S17). The increase in ocean carbon content averaged over the period 1976–2005 of HIST_1750_2005 from the preindustrial period is 82 Pg C (Table S1), and the cumulative increase by 2005 is 113 Pg C.
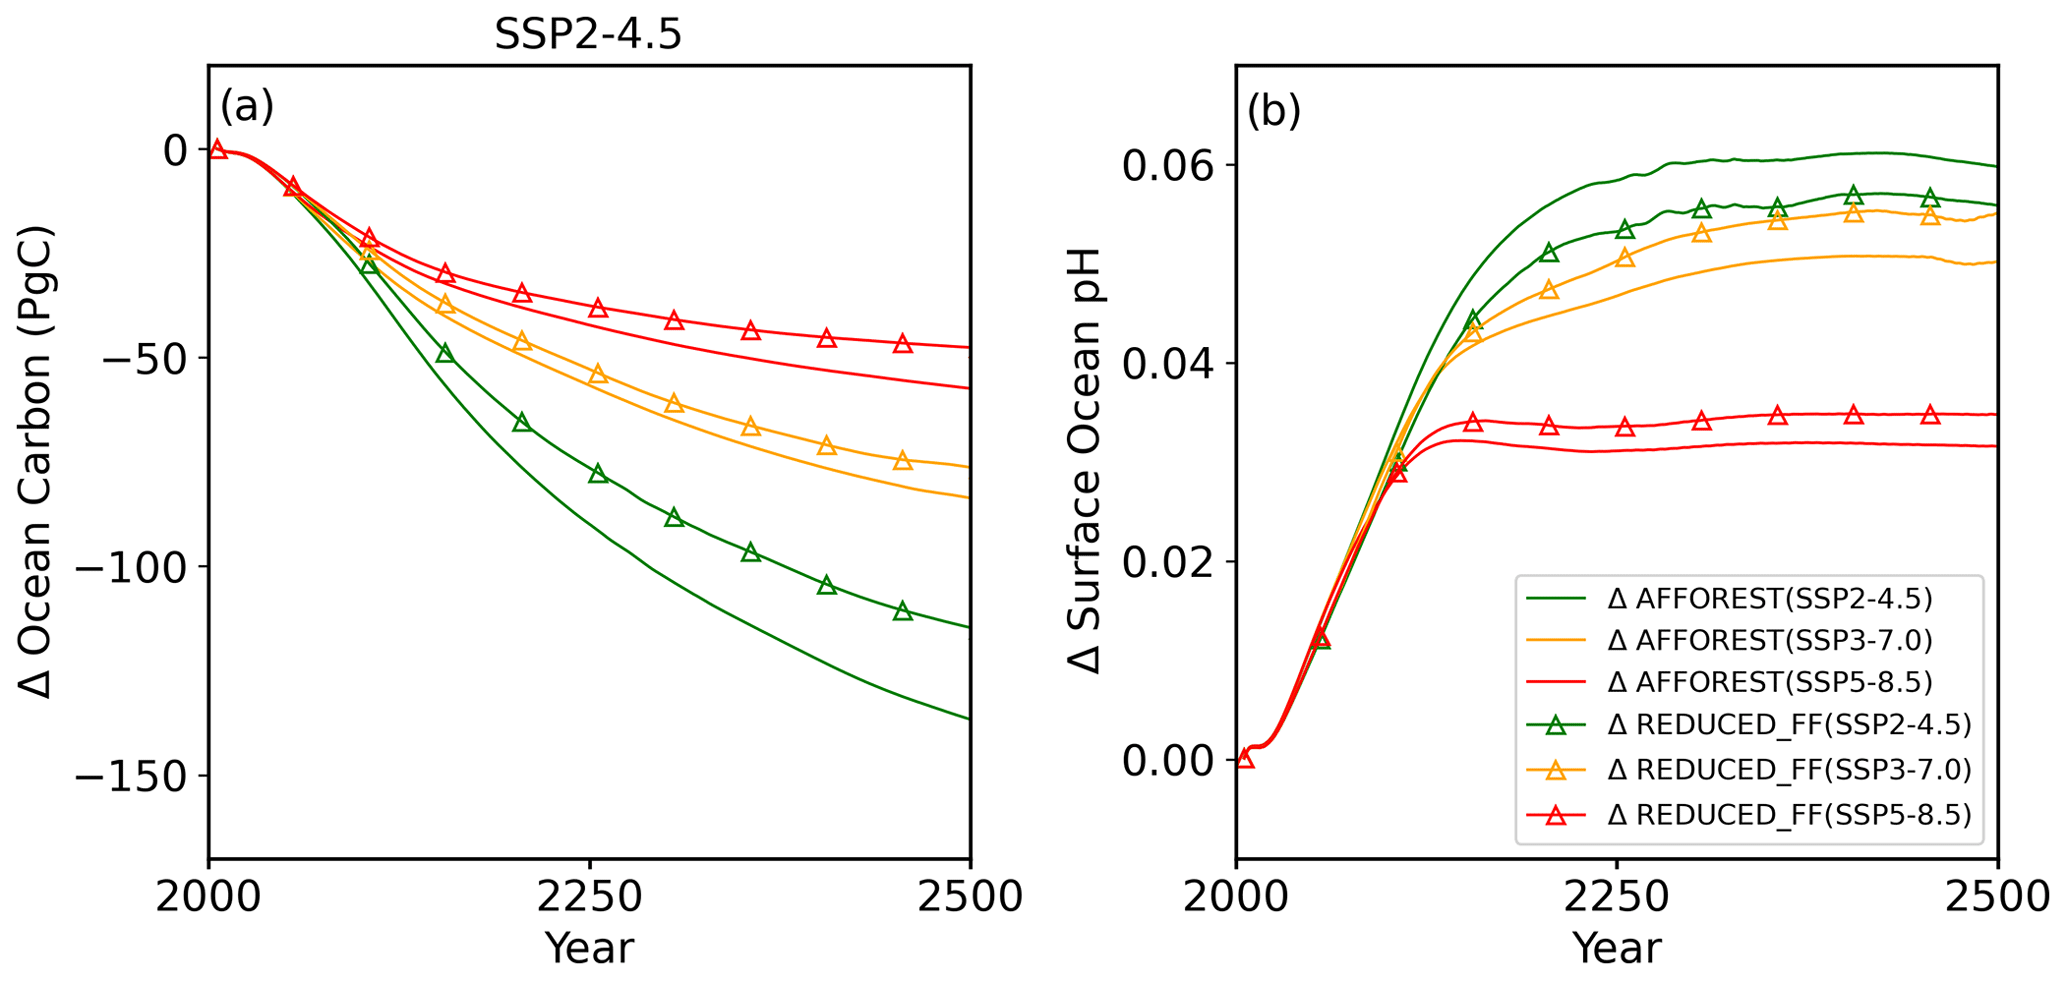
Figure 7Changes in (a) global total ocean carbon content and (b) global mean surface ocean pH in the AFFOREST (solid lines; ΔAFFOREST) and REDUCED_FF (solid lines with triangle markers; ΔREDUCED_FF) cases relative to the FIXED_AGR case in the SSP2-4.5 (green), SSP3-7.0 (orange), and SSP5-8.5 (red) scenarios. The AFFOREST and REDUCED_FF cases have smaller ocean carbon than the FIXED_AGR case in the three SSP scenarios because of the reduction of atmospheric CO2 in the AFFOREST and REDUCED_FF cases by afforestation and reduced fossil fuel emissions, respectively, and the consequent reduction in ocean carbon uptake. The AFFOREST and REDUCED_FF cases have larger surface ocean pH than the FIXED_AGR case because of the smaller ocean carbon content in the AFFOREST and REDUCED_FF cases.
The ocean carbon content increases in the FIXED_AGR, AFFOREST, and REDUCED_FF simulations in the three SSP scenarios. The FIXED_AGR case shows the largest ocean carbon content in the three SSP scenarios (Figs. 7a and S17) because of larger atmospheric CO2 in the FIXED_AGR case compared to the AFFOREST and REDUCED_FF cases. The spatial pattern of the ocean carbon content (averaged over 2471–2500) in the AFFOREST and REDUCED_FF cases relative to the FIXED_AGR case shows that the increase in ocean carbon content is less in the AFFOREST and REDUCED_FF cases compared to the FIXED_AGR case in all regions in the three SSP scenarios (Fig. S18 in the Supplement). The reduction of ocean carbon content (averaged over 2471–2500) in the AFFOREST and REDUCED_FF cases compared to the FIXED_AGR case is more pronounced in the surface ocean as the surface ocean adjusts more rapidly to the changes in atmospheric CO2 (Fig. S19 in the Supplement). A longer simulation would be required for larger changes in carbon content in the deep ocean.
The surface ocean pH in our preindustrial state is 8.15 (averaged over the last 30 years of PI_1750). By the year 2005, the surface ocean pH (averaged over 1976–2005) reduces to 8.09 because the ocean takes up more carbon as atmospheric CO2 increases during the historical period (Fig. S20 in the Supplement). In all nine simulations, surface ocean pH decreases until the fossil fuel emissions reduce to zero in the year 2250 and increases slightly after the emissions cease (Fig. S20). The AFFOREST and REDUCED_FF cases show larger and similar changes in surface ocean pH in comparison with the FIXED_AGR case in the three SSP scenarios (Fig. 7b) because of a smaller increase in ocean carbon content in the AFFOREST and REDUCED_FF cases compared to the FIXED_AGR case (Figs. 7a and S18, and Table 2).

Figure 8The left (a, c, and e) (right; b, d, and f) panel shows the spatial pattern of the difference in surface ocean pH (averaged over 2471–2500) between the AFFOREST (REDUCED_FF) and FIXED_AGR cases. The top (a, b), middle (c, d), and bottom (e, f) panels correspond to the SSP2-4.5, SSP3-7.0, and SSP5-8.5 scenarios, respectively. The AFFOREST and REDUCED_FF cases have larger and similar surface ocean pH in all regions compared to the FIXED_AGR case in the three SSP scenarios.
The AFFOREST and REDUCED_FF cases show larger surface ocean pH (averaged over 2471–2500) in all regions in the three SSP scenarios relative to the corresponding FIXED_AGR case because of smaller ocean carbon content as a result of reduced atmospheric CO2 (Fig. 8). In the high-emission scenarios (SSP3-7.0 and SSP5-8.5), the increase in surface ocean pH in the AFFOREST and REDUCED_FF cases is less compared to SSP2-4.5 (Figs. 7b and 8) because the reduction in ocean carbon is smaller in high-emission scenarios (Fig. 7a).
We have analyzed the relative effectiveness of afforestation and reduction of fossil fuel emissions for mitigating climate change using three sets (FIXED_AGR, AFFOREST, and REDUCED_FF) of climate model simulations starting from the year 2005 of a historical simulation. The atmospheric CO2 concentration, surface air temperature, and precipitation in the historical simulation are compared with the observations (Text S2). The areal coverage of tree and grass-type vegetation at the end of the historical simulation (averaged over 1976–2005) is 22 % and 32 %, respectively (Fig. S5), compared to the observed values of 32 % and 36 % (Poulter et al., 2011). The land carbon stock is underestimated in the UVic model (Table S1) compared to the observations, likely because of the simple land surface scheme used in the UVic model, which does not include a representation of peatlands (Meissner et al., 2003). Our historical simulation indicates that the land is a net source of ∼ 10 Pg C during the historical period (Table S1), which is in the range of 30 ± 45 Pg C estimated by Ciais et al. (2014). The cumulative ocean carbon uptake during the historical period is 113 Pg C, which falls in the observed range of 105 ± 20 Pg C (Masson-Delmotte et al., 2021).
Our results show that allowing forests to grow back by abandoning all agricultural land in the year 2005 leads to additional storage of 319.84, 418.93, and 379.21 Pg C in the land by the year 2500 (averaged over 2471–2500) in the SSP2-4.5, SSP3-7.0, and SSP5-8.5 scenarios, respectively. In the SSP 5-8.5 and SSP3-7.0 scenarios, the carbon stored in land during 2006–2500 is larger than that of the SSP 2-4.5 scenario (Fig. 3a), because of the CO2 fertilization effect at elevated atmospheric CO2 concentrations. However, carbon stored in land after the year 2005 is more in the SSP3-7.0 scenario than the SSP5-8.5 scenario, though SSP5-8.5 has a larger atmospheric CO2 concentration. This is due to larger warming in the SSP5-8.5 scenario, which causes a larger increase in soil respiration than the increase in net primary productivity (NPP) due to CO2 fertilization (Fig. S21).
If fossil fuel emissions are reduced by the same amount of carbon additionally stored in land, the climate is cooler in the reduced fossil fuel emission case compared to the afforestation case, even though the decrease in atmospheric CO2 is similar in the AFFOREST and REDUCED_FF cases. The decrease in atmospheric CO2 because of afforestation or reduced fossil fuel emissions is almost twice as much in SSP3-7.0 and SSP5-8.5 compared to SSP2-4.5 due to two reasons: (i) the amount of carbon uptake by land being larger in the SSP3-7.0 and SSP5-8.5 scenarios because of the larger CO2 fertilization effect, as discussed in Sect. 3.1; and (ii) the larger ocean carbon uptake in the FIXED_AGR case relative to the AFFOREST and REDUCED_FF cases in the SSP2-4.5 compared to SSP3-7.0 and SSP5-8.5 scenarios (Table 2).
There is more cooling in the reduced fossil fuel emission cases, and the relative cooling is 0.36, 0.47, and 0.42 ∘C in the reduced fossil fuel emission case compared to the afforestation case in the year 2500 (averaged over 2471–2500) in the SSP2-4.5, SSP3-7.0, and SSP5-8.5 scenarios, respectively. The cooling effect of reduced fossil fuel emissions is comparable in SSP2-4.5 and SSP3-7.0 (Table 2), though the reduction in fossil fuel emissions (the REDUCED_FF simulations) is smaller for the SSP2-4.5 scenario compared to SSP3-7.0. This is because the effect of removal of the same amount of carbon is higher in SSP2-4.5 due to the lower background atmospheric CO2 concentration (CO2 radiative forcing magnitude for a fixed CO2 change is larger for lower background CO2 concentration). The cooling effect of reduced fossil fuel emissions is lowest in SSP5-8.5 (Table 2) because the amount of carbon removed is similar to SSP3-7.0, but SSP5-8.5 has a larger background CO2 concentration than SSP3-7.0.
In the case of afforestation, the changes in vegetation cover from grasslands to forests have a warming effect due to the decrease in land surface albedo and evapotranspiration which nearly offsets the cooling effect from the removal of carbon from the atmosphere. The decrease in evapotranspiration in our AFFOREST simulations is in contrast with previous studies which showed an increase in evapotranspiration due to afforestation (Chen et al., 2012; Wang et al., 2014; Duveiller et al., 2018; Huang et al., 2018). This contradiction could be explained by the dominant effect of increase in water use efficiency of plants at elevated CO2 levels over the effects from an increase in roughness length and an increase in the evaporative capacity of vegetation in our model simulations, resulting in a net reduction in transpiration (Cao et al., 2009, 2010; Gopalakrishnan et al., 2011). The effects of elevated atmospheric CO2 on transpiration fluxes are larger for trees compared to grasslands (Kirschbaum and McMillan, 2018). In contrast with the AFFOREST case, the effect of an increase in plant water use efficiency is an increase in evapotranspiration in the REDUCED_FF case because of the lower atmospheric CO2 levels in the REDUCED_FF case compared to the FIXED_AGR case.
In our simulations, the cooling effect of afforestation is completely offset by its warming effect in the higher-emission scenarios (SSP3-7.0 and SSP5-8.5). However, in the lower-emission scenario (SSP 2-4.5), the offsetting of the cooling effect of afforestation is only partial because the removal of atmospheric carbon by afforestation results in a stronger cooling effect when the atmospheric CO2 is lower. Therefore, the biophysical warming effect of the regrowth of trees does not completely offset the biogeochemical cooling effect from the atmospheric carbon removal by afforestation. This suggests that afforestation may have a larger climate benefit in the lower-emission scenarios.
Both afforestation and reduced fossil fuel emissions result in smaller ocean carbon stock (Figs. S19 and S20) because the surface ocean equilibrates rapidly in response to changes in the atmosphere (Fig. S20). However, the changes in the deep ocean are nearly zero (Fig. S20) because the transport of ocean carbon between the surface and deep ocean could take multiple centuries to millennia. In the high-emission scenarios (SSP3-7.0 and SSP5-8.5), the reduction in the ocean carbon content in the AFFOREST and REDUCED_FF cases is less compared to SSP2-4.5 (Figs. 7a and S18) because of the reduction in buffering capacity of the ocean as it takes up more carbon (Middelburg et al., 2020; DeVries, 2022) and the reduced solubility of atmospheric CO2 in seawater at higher temperatures (Duan and Sun, 2003).
Several previous studies, both observational and modeling, have investigated the biophysical effects of deforestation/afforestation (Bala et al., 2007; Chen et al., 2012; Wang et al., 2014; Alkama and Cescatti, 2016; Duveiller et al., 2018; Huang et al., 2018; Winckler et al., 2019b; Boysen et al., 2020; Shen et al., 2022). Observational studies on the biophysical effects of deforestation by Alkama and Cescatti (2016) and Duveiller et al. (2018) show that deforestation results in a biophysical warming effect which qualitatively contradicts our results, while climate modeling studies by Bala et al. (2007), Boysen et al. (2020), and Portmann et al. (2022) show that large-scale deforestation results in a biophysical cooling effect which is qualitatively consistent with our results. Winckler et al. (2019b) showed that this contradiction between the observational and modeling studies arises from the non-local cooling in models, which is excluded from observations. On regional scales, the net effect of afforestation could be warming or cooling depending on the location at which the afforestation occurs (Chen et al., 2012; Huang et al., 2018; Shen et al., 2022). Wang et al. (2014) showed that the net biophysical effect from global afforestation is a warming of 0.68–1.38 ∘C, which is qualitatively consistent with the biophysical warming effect of afforestation in our results. Previous studies (Bonan, 2008; Li et al., 2016; De Hertog et al., 2022) find that afforestation in the tropics leads to a cooling effect, while we simulate warming for afforestation in the tropics. This contradiction is the result of higher atmospheric CO2 concentrations in the SSP scenarios used in our study, resulting in increased water use efficiency of plants and, consequently, a warming effect due to a decrease in evapotranspiration (Kirschbaum and McMillan, 2018).
Our study has the following limitations. First, the afforestation in our model is highly idealized. In our afforestation simulations, we assume that the entire agricultural land in the year 2005 is abandoned and vegetation is allowed to regrow abruptly, while in the real world, implementing afforestation at this scale would take a longer period. Also, in our simulations, vegetation grows back naturally according to the climate conditions over abandoned agricultural land, while in the real world, it might be possible to grow trees in areas where the climate conditions do not support the growth of trees using dams and irrigation, etc. Second, many processes in the model are highly simplified representations aimed at achieving a lower computational cost. For example, the dynamic vegetation model in our simulation has only five plant functional types, while real-world ecosystems are far more diverse and complex. However, the simplified representation enables us to understand the role of climate–vegetation feedbacks in longer timescales with less computational cost. Third, the climate change scenarios used in our simulations would occur with frequent intense droughts that prevent vegetation regrowth, which is not fully accounted for in our simulations because of a simple one-layer energy balance atmospheric model (Weaver et al., 2001) that does not simulate convection and clouds. Therefore, the magnitude of the estimated sink from the vegetation regrowth might be lower in the real world than in our simulations. Fourth, there could be uncertainty in the sensitivity of the transpiration to CO2 change in future scenarios (Mengis et al., 2015). Despite the above limitations, we believe that our results provide useful insights into the biophysical effects of afforestation in future climate scenarios. Several previous studies (Bala et al., 2007; Wang et al., 2014; Devaraju et al., 2018; Jayakrishnan et al., 2022) have used similar highly idealized deforestation/afforestation experiments.
Afforestation and reduced fossil fuel emissions are two major components of climate change mitigation currently adopted to slow climate change. Understanding the net effects of afforestation and reduced fossil fuel emissions is important for the development of climate mitigation strategies. In this paper, we have shown that the climate response to carbon removal by afforestation and an equivalent reduction in fossil fuel emissions is different because of the biophysical effects of afforestation, which is often neglected in the development of climate mitigation strategies. Our results show that a reduction in fossil fuel emissions could be more effective than afforestation in mitigating climate change. Though afforestation might be relatively less effective in mitigating climate change, it has other benefits such as a reduction in ocean acidification: the removal of carbon from the atmosphere results in a slightly reduced amount of carbon in the ocean, which leads to higher surface ocean pH and less ocean acidification. While our study shows that the biophysical effects have a significant role in determining the net effects of afforestation in the future climate, there are many uncertainties in the representation of the processes that govern the biophysical changes in our climate model simulations. Therefore, the understanding of the biophysical effects of afforestation should be improved further before considering the implications of our research for climate policy.
The source code of the University of Victoria Earth System Climate Model is freely available at https://terra.seos.uvic.ca/model/, last access: 22 May 2023. The time series data from our climate model outputs are available at https://doi.org/10.5281/zenodo.7321684 (Jayakrishnan and Bala, 2022). The climate model outputs used in the spatial plots are too large to be uploaded in a public repository, which will be made available on request to the contact author.
The supplement related to this article is available online at: https://doi.org/10.5194/bg-20-1863-2023-supplement.
GB formulated the idea behind the study. GB and KUJ designed the experiments. KUJ performed the experiments. GB and KUJ contributed to the writing and editing of the paper.
The contact author has declared that none of the authors has any competing interests.
Publisher's note: Copernicus Publications remains neutral with regard to jurisdictional claims in published maps and institutional affiliations.
We thank the Supercomputer Education and Research Centre, Indian Institute of Science, Bangalore, for providing the computational facility required for running the UVic model. We are thankful to the developers of UVic model for providing us with the source code of the model. We are also thankful to Michael Eby (School of Earth and Ocean Sciences, University of Victoria, Canada), Long Cao and Xiaoyu Jin (School of Earth Sciences, Zhejiang University, China) for helping us with instructions for running the simulations. We also thank Kate Dooley (University of Melbourne, Australia) and Ken Caldeira (Department of Global Ecology, Stanford University) for an earlier discussion on the difference between the effects of fossil fuel emission reduction and afforestation.
This research has been supported by the Department of Science and Technology, Government of India (grant no. DST/CCP/NMSKCC/MRDP/210/2022(C)) and Prime Ministers Research Fellowship, Government of India (ID no. 0200377).
This paper was edited by Sara Vicca and reviewed by Steven De Hertog and three anonymous referees.
Alfieri, L., Burek, P., Feyen, L., and Forzieri, G.: Global warming increases the frequency of river floods in Europe, Hydrol. Earth Syst. Sci., 19, 2247–2260, https://doi.org/10.5194/hess-19-2247-2015, 2015.
Ali, H., Modi, P., and Mishra, V.: Increased flood risk in Indian sub-continent under the warming climate, Weather Clim. Extrem., 25, 100212, https://doi.org/10.1016/J.WACE.2019.100212, 2019.
Alkama, R. and Cescatti, A.: Biophysical climate impacts of recent changes in global forest cover, Science (80-), 351, 600–604, 2016.
Allan, R. P. and Soden, B. J.: Atmospheric warming and the amplification of precipitation extremes, Science (80-), 321, 1481–1484, https://doi.org/10.1126/science.1160787, 2008.
Anderson, R. G., Canadell, J. G., Randerson, J. T., Jackson, R. B., Hungate, B. A., Baldocchi, D. D., Ban-Weiss, G. A., Bonan, G. B., Caldeira, K., Cao, L., Diffenbaugh, N. S., Gurney, K. R., Kueppers, L. M., Law, B. E., Luyssaert, S., and O'Halloran, T. L.: Biophysical considerations in forestry for climate protection, Front. Ecol. Environ., 9, 174–182, https://doi.org/10.1890/090179, 2011.
Bala, G., Caldeira, K., Wickett, M., Phillips, T. J., Lobell, D. B., Delire, C., and Mirin, A.: Combined climate and carbon-cycle effects of large-scale deforestation, P. Natl. Acad. Sci. USA, 104, 6550–6555, https://doi.org/10.1073/PNAS.0608998104, 2007.
Bonan, G. B.: Forests and climate change: forcings, feedbacks, and the climate benefits of forests, Science (80-), 320, 1444–1449, 2008.
Boysen, L. R., Brovkin, V., Pongratz, J., Lawrence, D. M., Lawrence, P., Vuichard, N., Peylin, P., Liddicoat, S., Hajima, T., Zhang, Y., Rocher, M., Delire, C., Séférian, R., Arora, V. K., Nieradzik, L., Anthoni, P., Thiery, W., Laguë, M. M., Lawrence, D., and Lo, M.-H.: Global climate response to idealized deforestation in CMIP6 models, Biogeosciences, 17, 5615–5638, https://doi.org/10.5194/bg-17-5615-2020, 2020.
Canadell, J. G., Meyer, C. P. (Mick.), Cook, G. D., Dowdy, A., Briggs, P. R., Knauer, J., Pepler, A., and Haverd, V.: Multi-decadal increase of forest burned area in Australia is linked to climate change, Nat. Commun., 121, 1–11, https://doi.org/10.1038/s41467-021-27225-4, 2021.
Cao, L. and Jiang, J.: Simulated Effect of Carbon Cycle Feedback on Climate Response to Solar Geoengineering, Geophys. Res. Lett., 44, 12484–12491, https://doi.org/10.1002/2017GL076546, 2017.
Cao, L., Bala, G., Caldeira, K., Nemani, R., and Ban-Weiss, G.: Climate response to physiological forcing of carbon dioxide simulated by the coupled Community Atmosphere Model (CAM3.1) and Community Land Model (CLM3.0), Geophys. Res. Lett., 36, L10402, https://doi.org/10.1029/2009GL037724, 2009.
Cao, L., Bala, G., Caldeira, K., Nemani, R., and Ban-Weiss, G.: Importance of carbon dioxide physiological forcing to future climate change, P. Natl. Acad. Sci. USA, 107, 9513–9518, 2010.
Chen, G. S., Notaro, M., Liu, Z., and Liu, Y.: Simulated Local and Remote Biophysical Effects of Afforestation over the Southeast United States in Boreal Summer, J. Climate, 25, 4511–4522, https://doi.org/10.1175/JCLI-D-11-00317.1, 2012.
Chini, L. P., Hurtt, G. C., and Frolking, S.: LUH1: Harmonized Global Land Use for Years 1500–2100, V1, ORNL DAAC, 2014.
Ciais, P., Sabine, C., Bala, G., Bopp, L., Brovkin, V., Canadell, J., Chhabra, A., DeFries, R., Galloway, J., and Heimann, M.: Carbon and other biogeochemical cycles, in: Climate change 2013: the physical science basis. Contribution of Working Group I to the Fifth Assessment Report of the Intergovernmental Panel on Climate Change, Cambridge University Press, 465–570, 2014.
Cox, P. M.: Description of the “TRIFFID” Dynamic Global Vegetation Model, Hadley Centre Technical Note, 24, 1–16, 2001.
Cox, P. M., Betts, R. A., Bunton, C. B., Essery, R. L. H., Rowntree, P. R., and Smith, J.: The impact of new land surface physics on the GCM simulation of climate and climate sensitivity, Clim. Dynam., 153, 183–203, https://doi.org/10.1007/S003820050276, 1999.
Crowley, T. J.: Causes of climate change over the past 1000 years, Science, 289, 270–277, https://doi.org/10.1126/science.289.5477.270, 2000.
De Hertog, S. J., Havermann, F., Vanderkelen, I., Guo, S., Luo, F., Manola, I., Coumou, D., Davin, E. L., Duveiller, G., Lejeune, Q., Pongratz, J., Schleussner, C.-F., Seneviratne, S. I., and Thiery, W.: The biogeophysical effects of idealized land cover and land management changes in Earth system models, Earth Syst. Dynam., 13, 1305–1350, https://doi.org/10.5194/esd-13-1305-2022, 2022.
Devaraju, N., de Noblet-Ducoudré, N., Quesada, B., and Bala, G.: Quantifying the relative importance of direct and indirect biophysical effects of deforestation on surface temperature and teleconnections, J. Climate, 31, 3811–3829, 2018.
DeVries, T.: The Ocean Carbon Cycle, Annu. Rev. Env. Resour., 47, 317–341, 2022.
Duan, Z. and Sun, R.: An improved model calculating CO2 solubility in pure water and aqueous NaCl solutions from 273 to 533 K and from 0 to 2000 bar, Chem. Geol., 193, 257–271, 2003.
Duveiller, G., Hooker, J., and Cescatti, A.: The mark of vegetation change on Earth's surface energy balance, Nat. Commun., 9, 679, https://doi.org/10.1038/s41467-017-02810-8, 2018.
Eby, M., Zickfeld, K., Montenegro, A., Archer, D., Meissner, K. J., and Weaver, A. J.: Lifetime of Anthropogenic Climate Change: Millennial Time Scales of Potential CO2 and Surface Temperature Perturbations, J. Climate, 22, 2501–2511, https://doi.org/10.1175/2008JCLI2554.1, 2009.
Gao, F., Schaaf, C. B., Strahler, A. H., Roesch, A., Lucht, W., and Dickinson, R.: MODIS bidirectional reflectance distribution function and albedo Climate Modeling Grid products and the variability of albedo for major global vegetation types, J. Geophys. Res.-Atmos., 110, 1–13, https://doi.org/10.1029/2004JD005190, 2005.
Gopalakrishnan, R., Bala, G., Jayaraman, M., Cao, L., Nemani, R., and Ravindranath, N. H.: Sensitivity of terrestrial water and energy budgets to CO2-physiological forcing: An investigation using an offline land model, Environ. Res. Lett., 6, 44013, https://doi.org/10.1088/1748-9326/6/4/044013, 2011.
Henderson-Sellers, A. and Wilson, M. F.: Surface albedo data for climatic modeling, Rev. Geophys., 21, 1743–1778, https://doi.org/10.1029/RG021I008P01743, 1983.
Hoesly, R. M., Smith, S. J., Feng, L., Klimont, Z., Janssens-Maenhout, G., Pitkanen, T., Seibert, J. J., Vu, L., Andres, R. J., Bolt, R. M., Bond, T. C., Dawidowski, L., Kholod, N., Kurokawa, J.-I., Li, M., Liu, L., Lu, Z., Moura, M. C. P., O'Rourke, P. R., and Zhang, Q.: Historical (1750–2014) anthropogenic emissions of reactive gases and aerosols from the Community Emissions Data System (CEDS), Geosci. Model Dev., 11, 369–408, https://doi.org/10.5194/gmd-11-369-2018, 2018.
Houldcroft, C. J., Grey, W. M. F., Barnsley, M., Taylor, C. M., Los, S. O., and North, P. R. J.: New Vegetation Albedo Parameters and Global Fields of Soil Background Albedo Derived from MODIS for Use in a Climate Model, J. Hydrometeorol., 10, 183–198, https://doi.org/10.1175/2008JHM1021.1, 2009.
Huang, L., Zhai, J., Liu, J., and Sun, C.: The moderating or amplifying biophysical effects of afforestation on CO2-induced cooling depend on the local background climate regimes in China, Agr. Forest Meteorol., 260–261, 193–203, https://doi.org/10.1016/J.AGRFORMET.2018.05.020, 2018.
Jayakrishnan, K. U. and Bala, G.: A comparison of the climate and carbon cycle effects of carbon removal by Afforestation and Reduction of Fossil fuel emissions, Zenodo [data set], https://doi.org/10.5281/zenodo.7321684, 2022.
Jayakrishnan, K. U., Bala, G., Cao, L., and Caldeira, K.: Contrasting climate and carbon-cycle consequences of fossil-fuel use versus deforestation disturbance, Environ. Res. Lett., 17, 064020, https://doi.org/10.1088/1748-9326/AC69FD, 2022.
Keller, D. P., Oschlies, A., and Eby, M.: A new marine ecosystem model for the University of Victoria Earth System Climate Model, Geosci. Model Dev., 5, 1195–1220, https://doi.org/10.5194/gmd-5-1195-2012, 2012.
Kirschbaum, M. U. F. and McMillan, A. M. S.: Warming and elevated CO2 have opposing influences on transpiration. Which is more important?, Curr. For. Reports, 4, 51–71, 2018.
Li, Y., Zhao, M., Mildrexler, D. J., Motesharrei, S., Mu, Q., Kalnay, E., Zhao, F., Li, S., and Wang, K.: Potential and actual impacts of deforestation and afforestation on land surface temperature, J. Geophys. Res.-Atmos., 121, 14–372, 2016.
Masson-Delmotte, V., Zhai, P., Pirani, A., Connors, S. L., Péan, C., Berger, S., Caud, N., Chen, Y., Goldfarb, L., and Gomis, M. I.: Climate change 2021: the physical science basis, Contrib. Work. Gr. I to sixth Assess. Rep. Intergov. panel Clim. Chang., 2, Cambridge University Press, Cambridge, United Kingdom and New York, NY, USA, 2021.
Matthews, H. D., Weaver, A. J., Meissner, K. J., Gillett, N. P., and Eby, M.: Natural and anthropogenic climate change: Incorporating historical land cover change, vegetation dynamics and the global carbon cycle, Clim. Dynam., 22, 461–479, https://doi.org/10.1007/s00382-004-0392-2, 2004.
Matthews, H. D., Weaver, A. J., and Meissner, K. J.: Terrestrial carbon cycle dynamics under recent and future climate change, J. Climate, 18, 1609–1628, 2005.
Meinshausen, M., Nicholls, Z. R. J., Lewis, J., Gidden, M. J., Vogel, E., Freund, M., Beyerle, U., Gessner, C., Nauels, A., Bauer, N., Canadell, J. G., Daniel, J. S., John, A., Krummel, P. B., Luderer, G., Meinshausen, N., Montzka, S. A., Rayner, P. J., Reimann, S., Smith, S. J., van den Berg, M., Velders, G. J. M., Vollmer, M. K., and Wang, R. H. J.: The shared socio-economic pathway (SSP) greenhouse gas concentrations and their extensions to 2500, Geosci. Model Dev., 13, 3571–3605, https://doi.org/10.5194/gmd-13-3571-2020, 2020.
Meissner, K. J., Weaver, A. J., Matthews, H. D., and Cox, P. M.: The role of land surface dynamics in glacial inception: A study with the UVic Earth System Model, Clim. Dynam., 21, 515–537, https://doi.org/10.1007/s00382-003-0352-2, 2003.
Mengis, N., Keller, D. P., Eby, M., and Oschlies, A.: Uncertainty in the response of transpiration to CO2 and implications for climate change, Environ. Res. Lett., 10, 94001, https://doi.org/10.1088/1748-9326/10/9/094001, 2015.
Middelburg, J. J., Soetaert, K., and Hagens, M.: Ocean alkalinity, buffering and biogeochemical processes, Rev. Geophys., 58, e2019RG000681, https://doi.org/10.1029/2019RG000681, 2020.
Pacala, S. and Socolow, R.: Stabilization wedges: solving the climate problem for the next 50 years with current technologies, Science (80-), 305, 968–972, 2004.
Papalexiou, S. M. and Montanari, A.: Global and Regional Increase of Precipitation Extremes Under Global Warming, Water Resour. Res., 55, 4901–4914, https://doi.org/10.1029/2018WR024067, 2019.
Portmann, R., Beyerle, U., Davin, E., Fischer, E. M., De Hertog, S., and Schemm, S.: Global forestation and deforestation affect remote climate via adjusted atmosphere and ocean circulation, Nat. Commun., 13, 5569, https://doi.org/10.1038/s41467-022-33279-9, 2022.
Poulter, B., Ciais, P., Hodson, E., Lischke, H., Maignan, F., Plummer, S., and Zimmermann, N. E.: Plant functional type mapping for earth system models, Geosci. Model Dev., 4, 993–1010, https://doi.org/10.5194/gmd-4-993-2011, 2011.
Psarras, P., Krutka, H., Fajardy, M., Zhang, Z., Liguori, S., Dowell, N. Mac, and Wilcox, J.: Slicing the pie: how big could carbon dioxide removal be?, WIREs. Energy Environ., 6, e253, https://doi.org/10.1002/wene.253, 2017.
Shen, W., He, J., He, T., Hu, X., Tao, X., and Huang, C.: Biophysical Effects of Afforestation on Land Surface Temperature in Guangdong Province, Southern China, J. Geophys. Res.-Biogeo., 127, e2022JG006913, https://doi.org/10.1029/2022JG006913, 2022.
Simmons, C. T. and Matthews, H. D.: Assessing the implications of human land-use change for the transient climate response to cumulative carbon emissions, Environ. Res. Lett., 11, 035001, https://doi.org/10.1088/1748-9326/11/3/035001, 2016.
Skvortsov, A., Eby, M., and Weaver, A.: Snow cover validation and sensitivity to CO2 in the UVic ESCM, Atmos.-Ocean, 47, 224–237, https://doi.org/10.3137/AO929.2009, 2010.
van Kooten, G. C.: How effective are forests in mitigating climate change?, Forest Policy Econ., 120, 102295, 2020.
Wang, Y., Yan, X., and Wang, Z.: The biogeophysical effects of extreme afforestation in modeling future climate, Theor. Appl. Climatol., 118, 511–521, https://doi.org/10.1007/S00704-013-1085-8, 2014.
Weaver, A. J., Eby, M., Wiebe, E. C., Ewen, T. L., Fanning, A. F., MacFadyen, A., Matthews, H. D., Meissner, K. J., Saenko, O., Schmittner, A., Yoshimori, M., Bitz, C. M., Holland, M. M., Duffy, P. B., and Wang, H.: The UVic earth system climate model: Model description, climatology, and applications to past, present and future climates, Atmos. Ocean, 39, 361–428, https://doi.org/10.1080/07055900.2001.9649686, 2001.
Winckler, J., Reick, C. H., Bright, R. M., and Pongratz, J.: Importance of surface roughness for the local biogeophysical effects of deforestation, J. Geophys. Res.-Atmos., 124, 8605–8618, 2019a.
Winckler, J., Lejeune, Q., Reick, C. H., and Pongratz, J.: Nonlocal effects dominate the global mean surface temperature response to the biogeophysical effects of deforestation, Geophys. Res. Lett., 46, 745–755, 2019b.