the Creative Commons Attribution 4.0 License.
the Creative Commons Attribution 4.0 License.
 | 06 Jun 2023
Relationships between greenhouse gas production and landscape position during short-term permafrost thaw under anaerobic conditions in the Lena Delta
Mélissa Laurent
Matthias Fuchs
Tanja Herbst
Alexandra Runge
Susanne Liebner
Claire C. Treat
Soils in the permafrost region have acted as carbon sinks for thousands of years. As a result of global warming, permafrost soils are thawing and will potentially release greenhouse gases (GHGs) such as methane (CH4) and carbon dioxide (CO2). However, small-scale spatial heterogeneities of GHG production have been neglected in previous incubation studies. Here, we used an anaerobic incubation experiment to simulate permafrost thaw along a transect from upland Yedoma to the floodplain on Kurungnakh Island. Potential CO2 and CH4 production was measured during incubation of the active layer and permafrost soils at 4 and 20 ∘C, first for 60 d (approximate length of the growing season) and then continuing for 1 year. An assessment of methanogen abundance was performed in parallel for the first 60 d. Yedoma samples from upland and slope cores remained in a lag phase during the growing season simulation, while those located in the floodplain showed high production of CH4 (6.5×10³ µg CH4-C g−1 C) and CO2 (6.9×10³ µg CO2-C g−1 C) at 20 ∘C. The Yedoma samples from the permafrost layer started producing CH4 after 6 months of incubation. We conclude that landscape position is a key factor triggering CH4 production during the growing season time on Kurungnakh Island.
- Article
(3032 KB) - Full-text XML
-
Supplement
(2209 KB) - BibTeX
- EndNote


For the past decades, scientists have warned about the effects of global climate change (IPCC, 2021). The effects of this warming will be pronounced in the polar regions, where the air temperature increase over the last 50 years is already 3 times higher than the increase in the global average for the same period (AMAP, 2021; Rantanen et al., 2022). This particularly affects soils in northern high-latitude permafrost regions, which cover 14.6 % of the Northern Hemisphere (Obu et al., 2019) and contain 1300 Pg of organic carbon (C) (Hugelius et al., 2014a). A majority of this C (822 Pg) is stored in permafrost (Hugelius et al., 2014b), which is defined as ground where the temperature remains at or below 0 ∘C for more than 2 consecutive years (Washburn, 1973). Due to low temperatures, the organic matter (OM) stored in permafrost soils is characterized by a low decomposition rate (Davidson and Janssens, 2006). However, during summer, the upper part of the permafrost-affected soils thaws (active layer) and allows OM decomposition (Lee et al., 2012). With climate change, permafrost thaw will likely increase and lead to higher OM decomposition rates, releasing greenhouse gases (GHGs) like carbon dioxide (CO2) and methane (CH4) (Wagner et al., 2007; Schuur et al., 2015; Knoblauch et al., 2018).This turnover might lead to the transformation of Arctic soils from C sinks to C sources (Koven et al., 2011; Dean et al., 2018; Lara et al., 2019).
Carbon emissions, and mainly CH4 emissions, greatly vary across the Arctic and especially on small scales (Treat et al., 2018; Lara et al., 2019; Elder et al., 2020). Treat et al. (2018) showed that C flux variability was strongly associated with specific landscape types due to differences in soil moisture and site drainage in uplands and wetlands that also controlled vegetation communities, which we refer to here as landscape position. Landscape change due to permafrost thaw is also highly affected by landscape position; low-lying ice-rich areas can become waterlogged following permafrost thaw, while higher areas can be drained by water run-off (Osterkamp et al., 2009; Liljedahl et al., 2016). The water-logged areas like thermokarst lakes or wetlands have been identified as CH4 emission hotspots (Olefeldt et al., 2013; Treat et al., 2018; Kuhn et al., 2021) because of the anaerobic conditions that favor methanogen communities (Conrad, 2002; Yavitt et al., 2006). On the other hand, well-drained sites, such as upland tundra, have the capacity to offset CH4 emissions by acting as CH4 sinks due to net oxidation in the surface soil layer (Juncher Jørgensen et al., 2015; Treat et al., 2018). Hence, after permafrost thaw, the redox conditions, determined by the landscape position, lead to different microbial communities and ultimately different CH4 emissions (McCalley et al., 2014).
To quantify CH4 and CO2 production and to understand C turnover from thawing permafrost, numerous incubation studies have been carried out (Lee et al., 2012; Knoblauch et al., 2018; Walz et al., 2018; Holm et al., 2020). Studies have shown that C decomposition depends on several factors, such as organic C quantity, OM quality, temperature, and oxygen availability in the soil (Ganzert et al., 2007; Lee et al., 2012; Schädel et al., 2014; Treat et al., 2015; Knoblauch et al., 2018). In addition, Treat et al. (2015) highlighted that CH4 production differences were partly explained by the landscape position, with differences between uplands, wetlands, floodplain soils, lowlands, and drained lake basins. For incubation under aerobic conditions, Kuhry et al. (2020) demonstrated that landscape types based on soil type (peaty wetlands, mineral soils) and the origin of the deposits (peat deposits, alluvial deposits) gave a good estimation of soil organic matter (SOM) lability and therefore explained differences in CO2 production better than using only the % C, which is a commonly used metric for C quality across incubation studies (Treat et al., 2015). However, few studies have specifically focused on how the landscape position affects CO2 and CH4 production under anaerobic conditions and whether landscape position is a good indicator of CO2 and CH4 production under anaerobic conditions, as might be expected from field observations of CO2 and CH4 fluxes (Treat et al., 2018; Elder et al., 2020).
Besides landscape position, climate change affects the environmental factors in the study region. It modifies weather conditions and plays a key role in controlling rain events (frequency and intensity) (Callaghan et al., 2010; Tabari, 2020; Wang et al., 2021; Fewster et al., 2022). During the past 60 years, precipitation in Siberia has increased by 2.6 mm per decade (Wang et al., 2021). This finding likely leads to wetter conditions during the growing season in Siberia, and therefore, soil moisture increases. Changes in soil moisture will impact vegetation cover and soil redox conditions. Increasing precipitation and warming will also lead to deepening of the active layer (Zhu et al., 2017; Douglas et al., 2020) and, hence, the release of bioavailable C from the upper part of the permafrost layers. Waldrop et al. (2010) identified more labile C in shallow permafrost than in the active layer, which fueled more CO2 production in an incubation experiment. On the other hand, other incubation experiments showed higher C turnover and more CO2 production in the active layer than in the permafrost (Walz et al., 2017; Faucherre et al., 2018). Regarding CH4 production, incubation studies tend to show higher CH4 production in the active layer than in shallow permafrost (Treat et al., 2015), but some studies also measured the opposite behavior among their samples (Wagner et al., 2007; Waldrop et al., 2010). Therefore, it is still unclear how much CO2 and CH4 can be produced from shallow permafrost. Furthermore, high CH4 production heterogeneity and long lag times have been measured with samples from Kurungnakh Island, Lena Delta, Russia (Knoblauch et al., 2013, 2018). Hence, the question remains whether the methanogen communities will have the time to become active during the short growing season (60 d) under anaerobic conditions.
The aim of this study was to simulate permafrost thaw under wet growing-season conditions across different landscape units in the Lena Delta and to measure CO2 and CH4 production. Here, we incubated upland Yedoma and adjacent lowland floodplain samples under anaerobic conditions and focused on the relationships between GHG production and microbial abundance shifts following short-term (60 d, growing-season length) and longer-term (1 year) permafrost thaw. The objectives of the study were to (1) quantify CH4 and CO2 production over 1 year under anaerobic incubation, (2) establish relationships between CH4 and CO2 production and methanogen abundances, and (3) characterize the role of the landscape position in gas production in thawed permafrost soils during a growing-season time frame.
2.1 Site description and sampling
Soil samples were collected in August 2018 on Kurungnakh Island (72.333∘ N, 126.283∘ E), Lena Delta, Siberia (Fig. 1). Kurungnakh Island is located in the continuous permafrost zone and is an erosional remnant of Late Pleistocene deposits, characterized by ice- and organic-rich sediments (Grigoriev, 1993; Schwamborn et al., 2002); most of the island is composed of fluvial sandy sediments and Yedoma ice complex (IC) deposits. The IC is made up of ice-saturated sediments (65 % to 90 %) composed of cryoturbated silty sands and peaty deposits of Holocene origin (Schwamborn et al., 2002; Schirrmeister et al., 2011, 2013). Sediments from the Yedoma IC contain, on average, 3 % total organic carbon (TOC) (Strauss et al., 2013a); however, IC sediments can include organic-rich layers, with TOC content reaching more than 20 % in layers contained within the ice complex sediments (e.g., buried peat horizons; Andreev et al., 2009). Kurungnakh Island is characterized by thermokarst lakes and wetlands due to thermo-erosional activity (Morgenstern et al., 2021). Samples were also collected in the young Kurungnakh Island floodplain area. The young and active floodplains in the Lena River Delta are of Holocene deltaic origin and are composed of stratified middle to fine sands and silts with layers of autochthonous peat and allochthonous OM (Schwamborn et al., 2002; Boike et al., 2013).
The soil sampling was carried out in two stages. First, the active layer was extracted using a spade, and active-layer samples were collected using a fixed-volume cylinder (250 cm3). Then, permafrost soil cores were sampled to a depth of 1 m below the surface by drilling with a modified snow, ice, and permafrost (SPIRE) auger (Jon Holmgren's Machine Shop, Alaska, USA). For this study, three cores were selected; two were from the Yedoma deposits (P15 and P16), and one belonged to a floodplain area (P17). The three coring locations were on a well-drained upland soil (P15; Fig. S1 in the Supplement), on a north-eastern facing slope (P16), and on a floodplain (P17; Fig. 1). The floodplain samples were taken in the highest part of the floodplain, 5 m above the Lena River water level.
These cores were chosen on the basis of geographical proximity to each other, landscape position, moisture gradient, and ice composition. The three cores had an organic layer ranging between 3 to 7 cm (Yedoma and floodplain, respectively). Below this organic surface layer, the soil cores were identified as mineral soil. The permafrost layers from the Yedoma cores were ice-rich, while no visible ice structure was seen for the floodplain core (Table 1).
Cores were described and subsampled in the field. Detailed core descriptions are presented in Table 1 and Table S1 in the Supplement. For the purpose of our study, we chose two samples from each core, one from the active layer and one from the frozen layer (above 1 m depth to simulate shallow permafrost thaw) (Table S1 in the Supplement). Care was taken not to select samples from the top of the active layer in order to avoid the top organic layers. Cores were subsampled in a climate chamber at −4 ∘C with a hammer and a chisel instead of a saw to limit contamination.
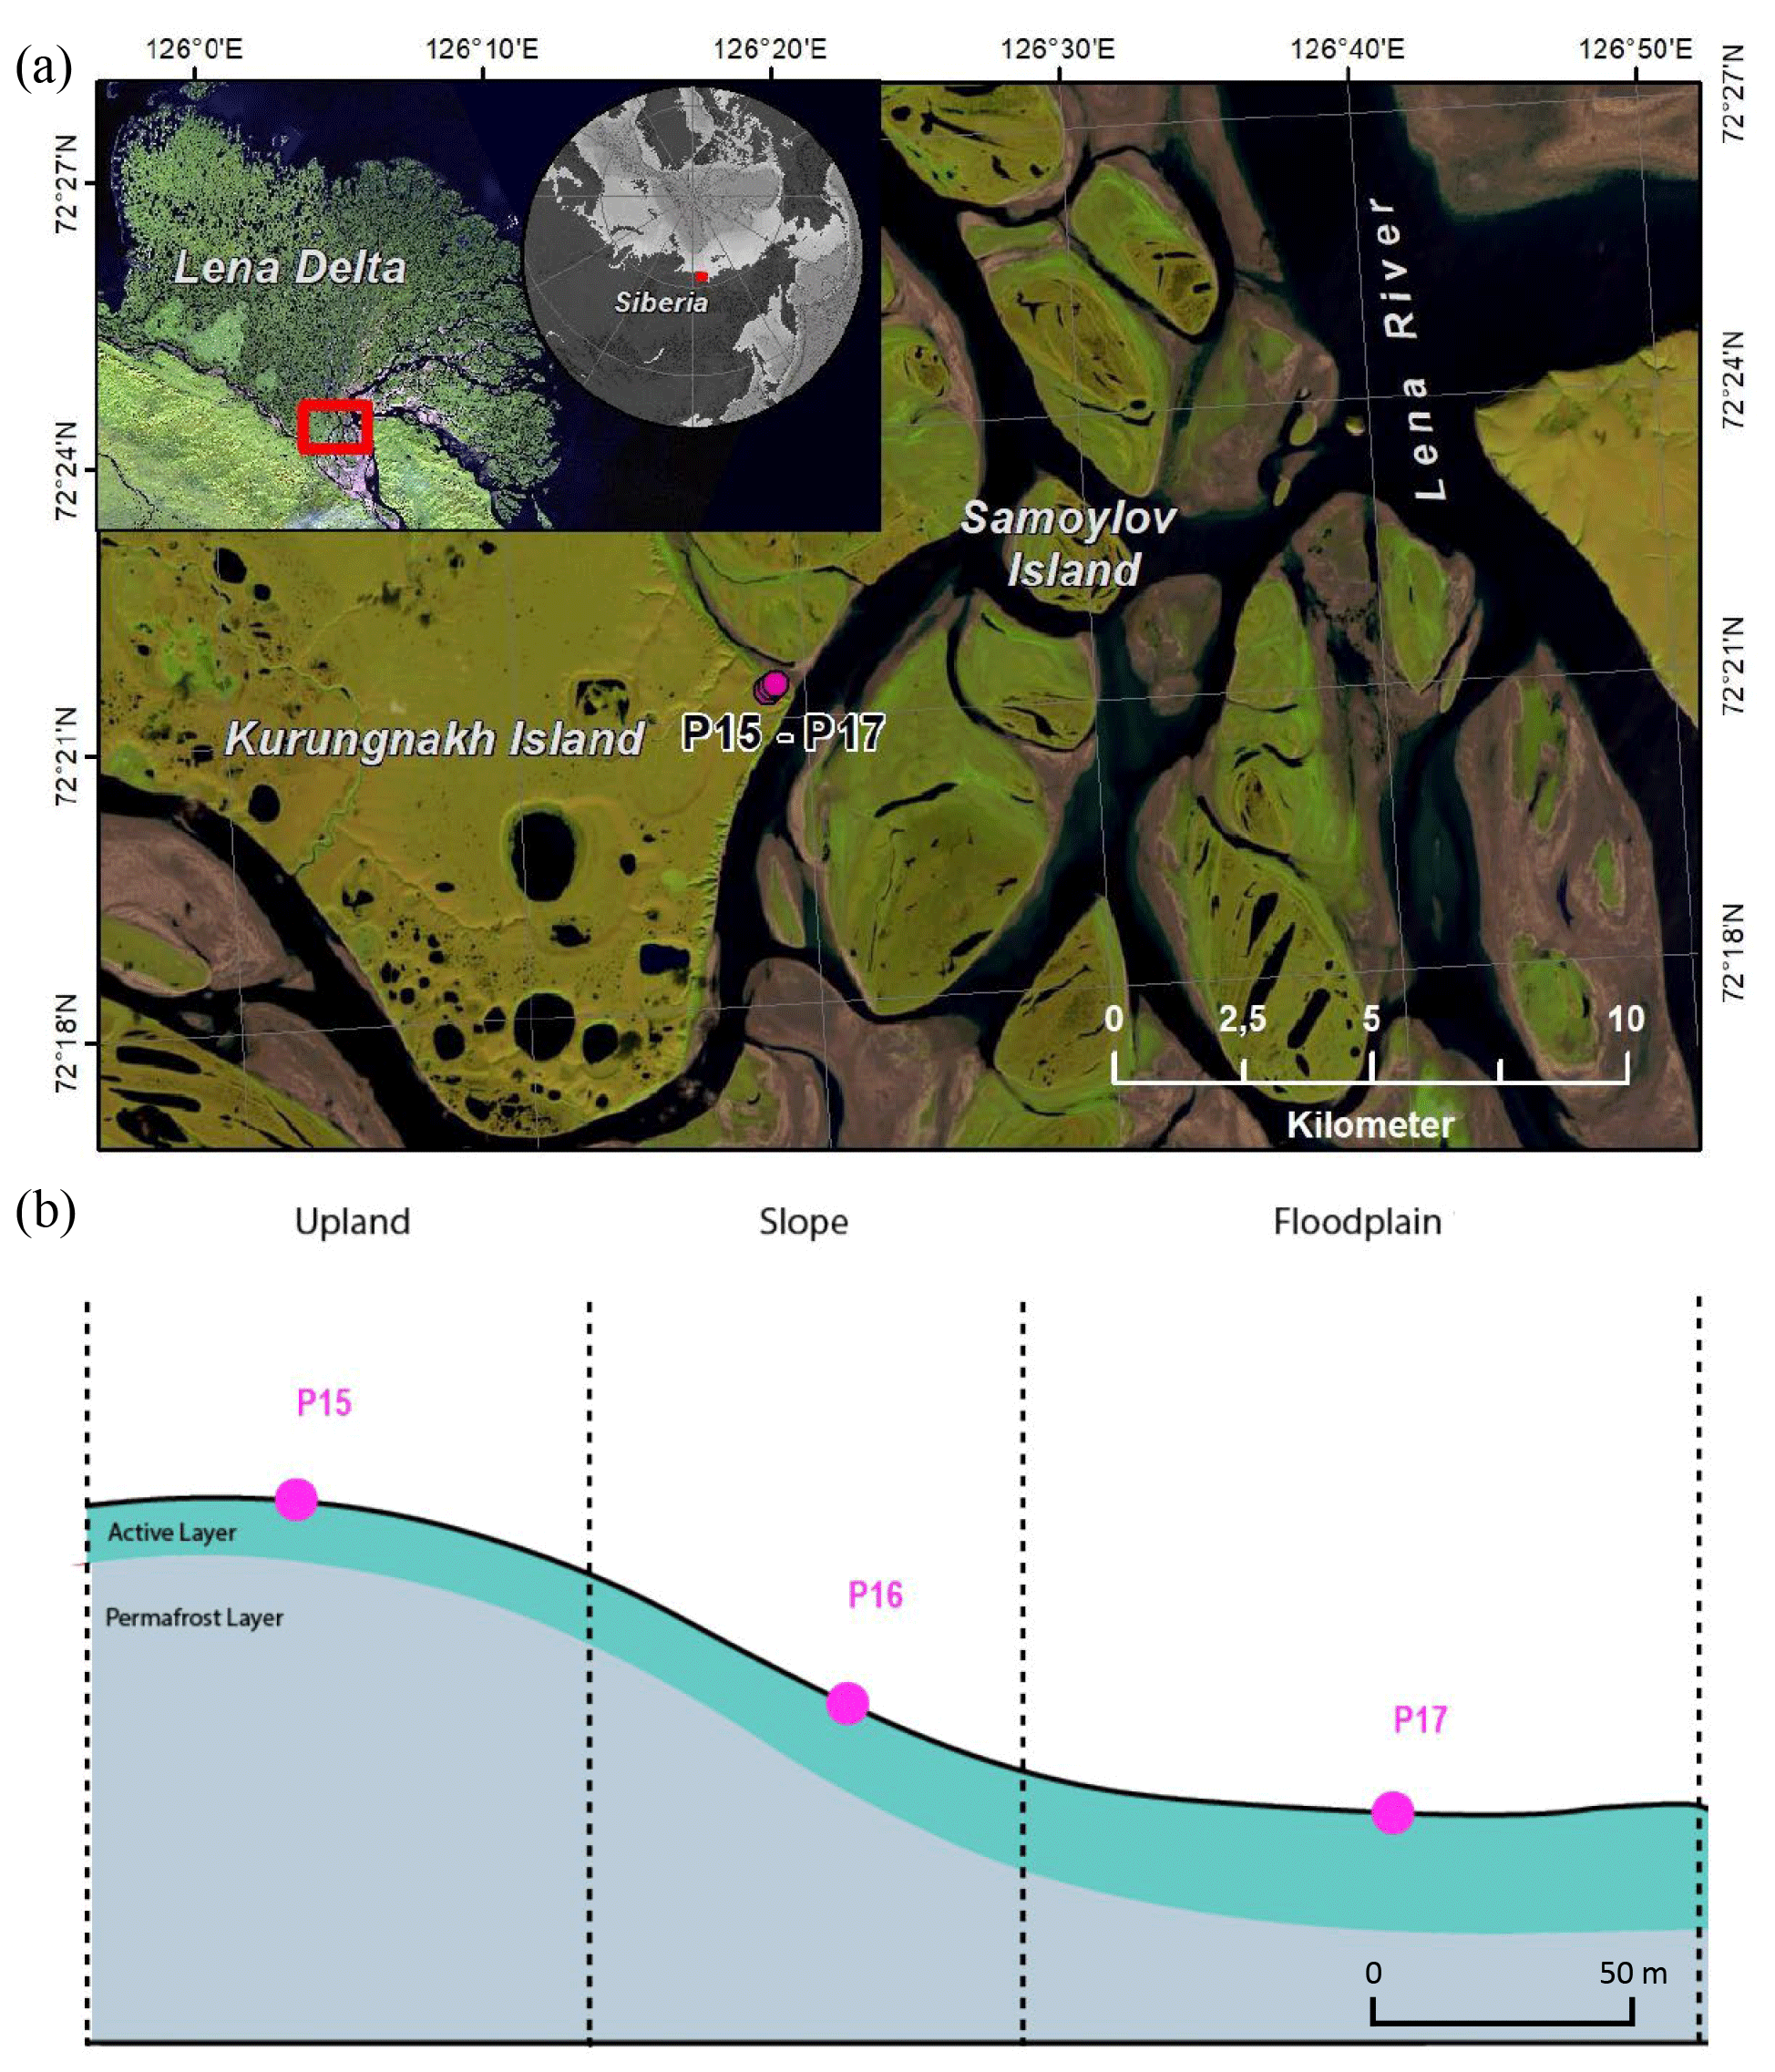
Figure 1Location of Kurungnakh Island in the Lena Delta (Siberia). The location of the cores used for the study are indicated on the map (a) and along a schematic transect (b). Samples were taken during the Lena summer expedition in 2018.
2.2 Sedimentary and geochemical characterization
We characterized the samples for soil texture, C and nitrogen contents, water content, conductivity, and pH. First, samples were thawed at 4 ∘C overnight; then the pore water was extracted with a Rhizon soil moisture sampler (Rhizon MOM 0.6 µm, Rhizosphere Research Products) (Meijboom and van Noordwijk, 1991). Electrical conductivity and pH were measured from pore water. Prior to further analyses, soil samples were freeze-dried, and the absolute water content (Eq. 1) was calculated. For TOC weight percent, total carbon (TC) and total nitrogen (TN) subsamples were homogenized and measured with a carbon–nitrogen–sulfur (CNS) analyzer (Elementar Vario EL III). Each subsample was measured in duplicate, and standards and blanks were used to ensure reliable analytical measurements. The bulk density was determined based on a transfer function between absolute water content and bulk density made by Fuchs (2019) (Fig. S2 in the Supplement). Since most of the samples used to establish this correlation came from the same area as our samples, we assumed that the transfer function was applicable to our samples.
where Θ is the water content, Ww is the wet weight, and Wd is the dry weight.
Carbon storage was calculated by multiplying the TOC contents with the bulk density and then dividing by the sample length.
Another subsample was used for grain size characterization. The grain size analysis was conducted using a laser diffraction particle size analyzer (Mastersizer 3000, Malvern Panalytical, Malvern, UK). Prior to measuring, subsamples were put on a heated shaker for 3 weeks, and H2O2 was added daily to remove the organic materials. The samples were measured in a wet dispersion unit, and at least three subsamples from each sample were measured. The average grain size distribution (in vol %) was calculated from the measured replicates.
2.3 Incubation setup and substrate addition
To mimic a wet growing season, the samples were first incubated under anaerobic conditions for 60 d at two different temperatures, 4 and 20 ∘C. Since 11 samples out of 12 did not produce CH4 after 2 months of incubation, we extended the incubation time to 363 d to see whether the other cores would produce CH4. For every sample, three replicates were incubated, resulting in a total of 36 samples. Prior to incubation, the samples were thawed at 4 ∘C and prepared under oxygen-free conditions using an anoxic glovebox. The samples were homogenized, and 13 g of wet soil was collected and inserted into a 120 mL vial. Sterilized tap water was added only to samples with a gravimetric moisture content of less than 30 % to limit the effect of gas dissolution (Henry's law). The amount of sterilized tap water was calculated to reach 30 % gravimetric moisture based on the original water content and the weight (wet and dry). The flasks were closed with rubber stoppers and aluminum lids. The headspace of the samples was flushed with pure nitrogen for 3 min to remove potential O2 inside the vials. Then the samples were incubated in the dark.
After 60 d of incubation, 0.7 mg glucose g−1 dry sample weight was added to two of the three replicates to understand the effect of potential substrate limitation in the soil system. The glucose was diluted with Milli-Q water to obtain a 100 g L−1 solution. Solutions were injected via syringe to minimize soil disturbance (Pegoraro et al., 2019). The same amount of water as in the glucose solution was added to the third replicate to ensure that differences in gas production were only due to the addition of glucose (Pegoraro et al., 2019; Adamczyk et al., 2021). The glucose addition was also carried out under oxygen-free conditions.
The effects of glucose are usually observed within less than 48 h (Yavitt et al., 1997; Pegoraro et al., 2019). Therefore, after the glucose addition, the gas was measured daily for 1 week (described in the following section). As the first injection had little effect on gas production, a second injection (day 64) was added with twice the amount of glucose solution (1.4 mg glucose g−1 dry sample weight).
2.4 Gas analyses
CO2 and CH4 in the headspace were measured with a gas chromatograph (GC) (7890A, Agilent Technologies, USA) with flame ionization detection (FID). The temperature in the column was 50 ∘C with a flow of 15 mL min−1 and a runtime of 4.5 min. Helium was used as a carrier gas. A Hamilton syringe was used to introduce 250 µL of the sampling gas into the GC. For the first week, measurements were made every 2 d, then twice a week for 3 weeks, then once a week until day 60. The incubation vials were flushed when either the CH4 or CO2 concentration reached 104 ppm to avoid gas saturation inside the flask. The production rate was calculated with the change in concentration of CO2 and CH4 over the incubation time. First, the measured CO2 and CH4 concentrations were converted from ppmv to µmol L−1 using the ideal gas law, then a linear regression between each measurement point was used to calculate the change in concentration over time. The production rate was calculated using the change in concentration over time from the linear regression, then the rates were normalized using the volume of the soil (for differences in the jar headspace) and the weight of the dry soil samples (Robertson et al., 1999). Then these rates were also normalized by the percentage of C found in each sample to look at substrate quality. For samples with pH > 7, water contents were very low (Table 1); therefore, we assumed that a negligible amount of CO2 was stored as DIC in the sample water and did not correct the calculation for the pH. However, we are aware that this might underestimate C mineralization.
The impact of glucose on CH4 and CO2 production was quantified as a glucose factor, calculated using the cumulative C production at 67 d as follows:
where Gf is the glucose factor, Pgt is the total CH4 production for samples with glucose, and Pt is the total CH4 production.
2.5 Quantification of methanotrophic and methanogenic gene copy numbers
Methanogenic archaea were quantified with a quantitative polymerase chain reaction (qPCR) at the following different times during the incubations: when the samples were still frozen (1), after 60 d of incubation (2), and after glucose addition (67 d of incubation) (3). However, due to laboratory restrictions during the Covid-19 pandemic, it was not possible to analyze all the incubated vials. Only one replicate per sample for the first two runs was analyzed. For the last run, we selected the two samples with the highest CH4 production rates after the glucose addition – the active layers of P16 and P17.
Since methanotrophic bacteria are good indicators of the oxidation level under in situ conditions, they were quantified with qPCR before starting the incubation.
Key genes encoding the enzyme methyl coenzyme M reductase (mcrA) (Thauer, 1998) and the enzyme particulate methane mono-oxygenase (pmoA) (Theisen and Murrell, 2005) were examined to identify methanogens and methanotrophs, respectively. DNA extractions were performed with a GeneMATRIX Soil DNA purification kit (Roboklon, Germany) according to the manufacturer's protocol. After DNA extraction, the DNA concentration was quantified by fluorescence with the Qubit dsDNA HS Assay Kit (Invitrogen, United States). Gene copy numbers were quantified using a SYBRGreen qPCR assay using the KAPA SYBR FAST qPCR Master Mix (Sigma Aldrich, Germany) on a CFX96 real-time thermal cycler (Bio-Rad Laboratories Inc., United States). All runs were performed in technical triplicates, and each run was completed through melt-curve analysis in order to check for specificity of the assay (Liebner et al., 2015). Methanogenic archaea were targeted with the primer set mlas-F/mcrA-R (Microysynth, Balgach, Switzerland) (Hales et al., 1996).
To amplify the methanogenic archaea mcrA gene, PCR samples were kept at 95 ∘C for 5 min to denature the DNA. The amplification process was performed with 40 denaturation cycles at 95 ∘C for 1 min, annealing at 60 ∘C for 45 s and elongating at 72 ∘C for 90 s. To ensure complete amplification, samples were kept at 80 ∘C for 10 min. In addition, to amplify the methanotrophic pmoA gene, using primer pmoA189-F and primer pmoAmb661-R, two PCR reaction conditions were used. The first PCR comprised initial denaturation at 95 ∘C for 5 min, 30 cycles with denaturation at 94 ∘C for 45 s, decreasing annealing temperature from 64 ∘C to 52 ∘C for 60 s, elongation at 72 ∘C for 90s, and final elongation at 80 ∘C for 90 s. The second PCR comprised an initial denaturation and polymerase activation at 95 ∘C for 5 min, 22 cycles of denaturation at 94 ∘C for 45 s, annealing at 56 ∘C for 60 s, elongation at 72 ∘C for 90 s, and a final extension at 72 ∘C for 10 min.
2.6 Statistical analyses
The gas production and microbial data did not show a normal distribution; consequently, it was not possible to test for differences by performing an ANOVA. The differences between cores and depths, and also the impact of temperature on gas production and microbes, were therefore tested using the Kruskal–Wallis test with the R function kruskal.test.
All statistics and results analyses were performed with R version 4.0.5 (R Core Team, 2021).
3.1 Soil characteristics
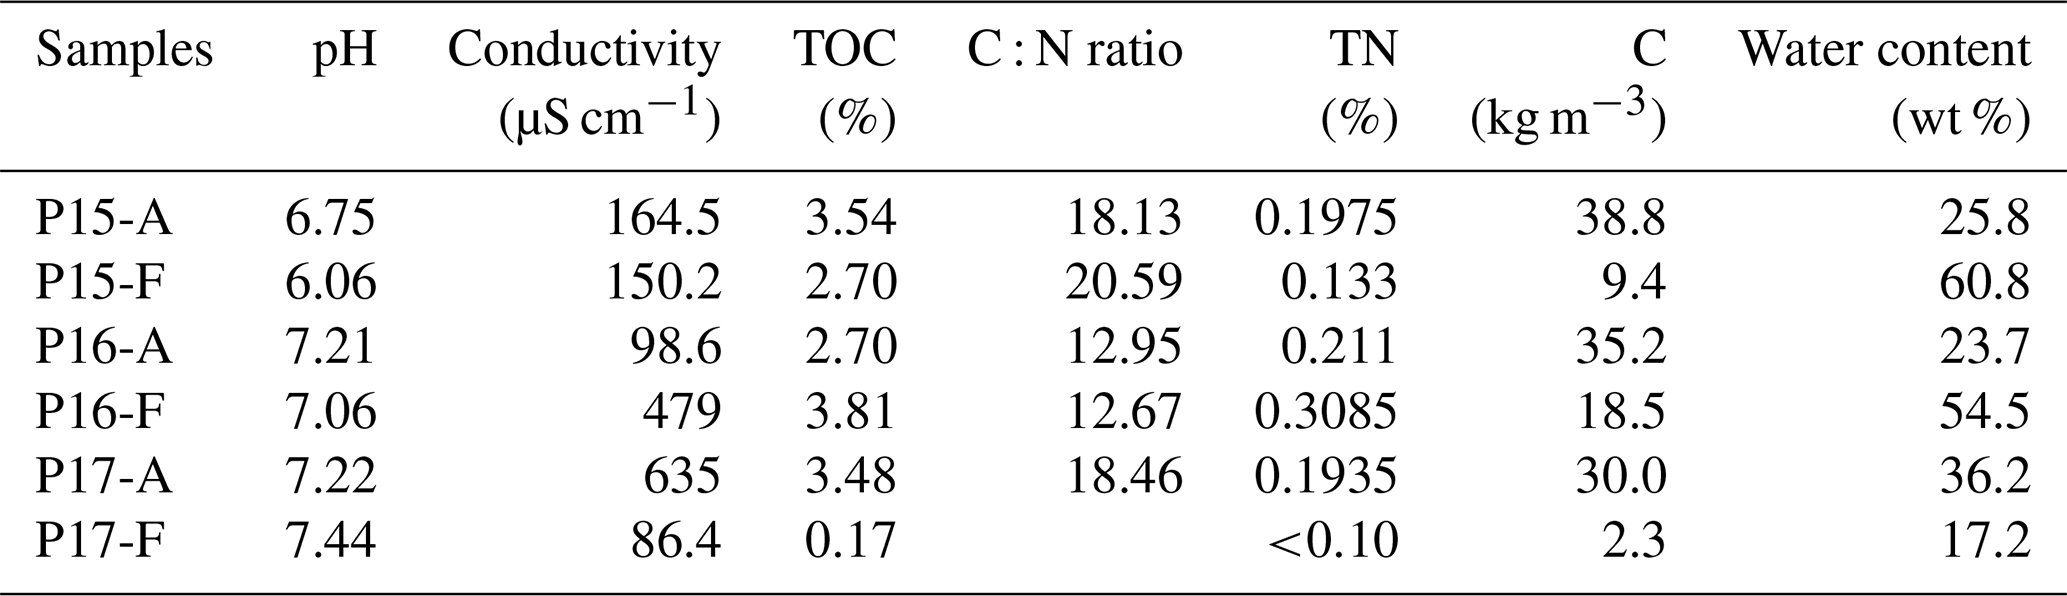
All soil samples had a pH between 6.5–7.5, except P15-F. Most electrical conductivities were very low (< 200 µS cm−1), except for two samples, namely P16-F and P17-A (Table 2). Water content was higher in permafrost (54.5 %–60.8 %) than in the active layer (23.7 %–25.8 %) for the two yedoma cores, P15 and P16. The water content was higher in the active layer than in the permafrost layer in the floodplain core P17 (36.2 % vs. 17.2 %) (Table 2).
Sediment TOC ranged from 0.2 %–3.8 %. Most TOC contents ranged from 2.7 %–3.8 %, but the TOC content in the permafrost layer of P17 was the lowest of the six samples (0.17 %) (Table 2). All the samples had TOC below 6 %, and therefore they were considered to be mineral soils (% C < 12 %) (Table 2) (Soil Survey Staff, 2014). TN contents were very low for all the samples (< 0.3 %) and were below the detection limit of the laser analyzer (below 0.1 %) for P17-F. C : N ratios ranged between 12 and 20. The highest ratios were measured in P15; the lowest were in P16. The C : N ratio was higher in the permafrost layer of P15 than in the active layer.
The C stock ranged from 2.3 to 38.8 kg m−3. The active layers for all the samples were higher than 30 kg m−2, while the highest C stock in the permafrost layer was 19 kg m−3 in the Yedoma core P16. The permafrost layer of the floodplain had the lowest C storage, more than 10 times lower than samples from the active layers (Table 2).
The grain size distribution was similar between P15 and P16. The active layer of P17 contained more clay and the least sand of the other samples, while permafrost in P17-F was the sandiest sample (Table S1 in the Supplement).
Table 1Soil description and vertical position of the sampling cores.
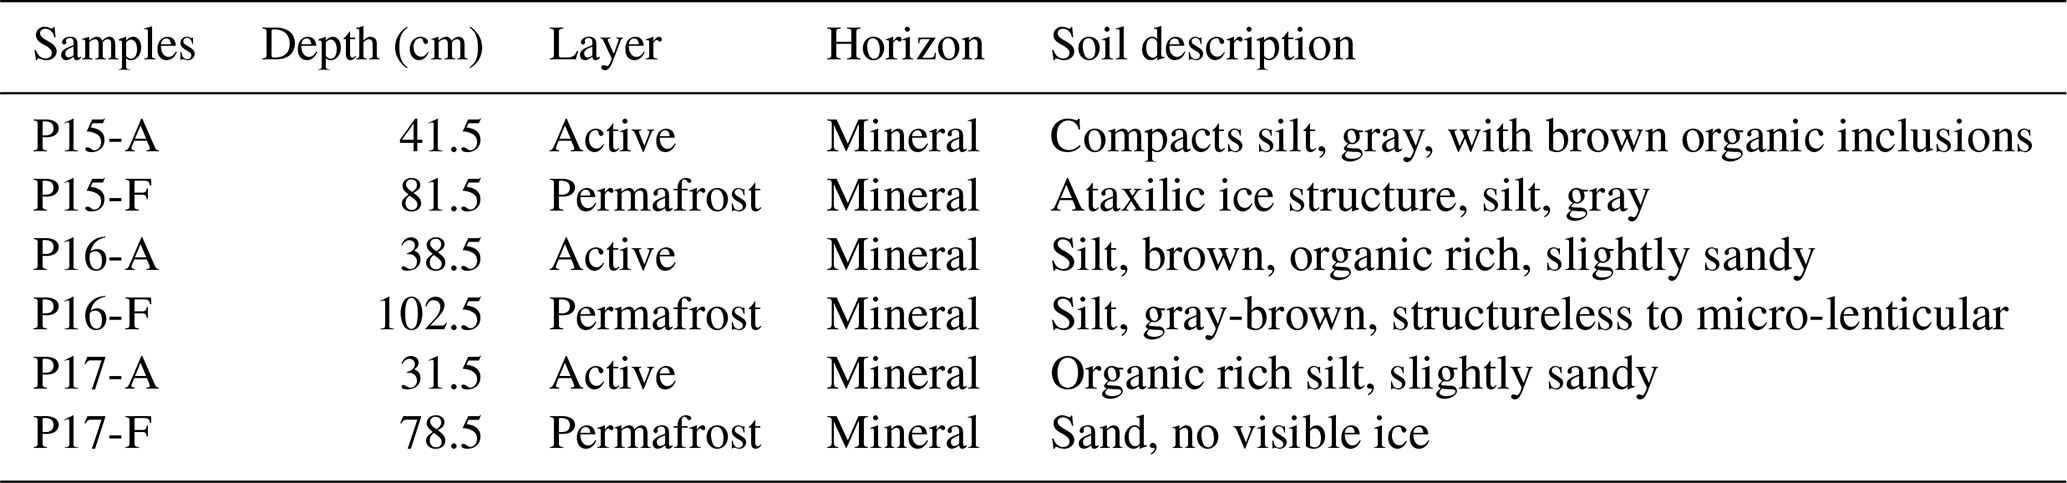
Table 2Chemical and physical properties of the active and frozen layers of the three cores. The conductivity temperature reference was 25 ∘C. Numbers in brackets are standard deviations.
3.2 Potential gas production
3.2.1 CH4 production over one year of incubation
At the end of the 363 d incubation, four of the six samples produced CH4 at a 20 ∘C incubation temperature (Fig. 2, Fig. 3). The floodplain active layer (P17-A) was the sample with the highest cumulative CH4 production over the incubation time (917.2 ± 150 µg CH4-C g−1 DW). After 6 months of incubation, the CH4 production rate of P17-A decreased and then plateaued. The floodplain permafrost core (P17-F) produced 1 % of the amount of CH4 produced by the active layer from the same core (0.5 ± 0.2 µg CH4-C g−1 DW) at 20 ∘C. The permafrost layers at 20 ∘C of both Yedoma cores (P15 and P16) produced similar amounts of CH4 (20.5 ± 6.1 and 159 ± 104 µg CH4-C g−1 DW, respectively), while CH4 production from the active layers of these cores was minimal (P16-A: 3.34 ± 0.25 µg CH4-C g−1 DW; P15-A: 0.51 ± 0.14 µg CH4-C g−1 DW). Cumulative CH4 production at 4 ∘C was limited to one sample, the active layer of the floodplain core (Figs. 2, 3). Cumulative production of the other cores was less than 1 µg CH4-C g DW−1 after 1 year (Figs. 2a and b, 3).
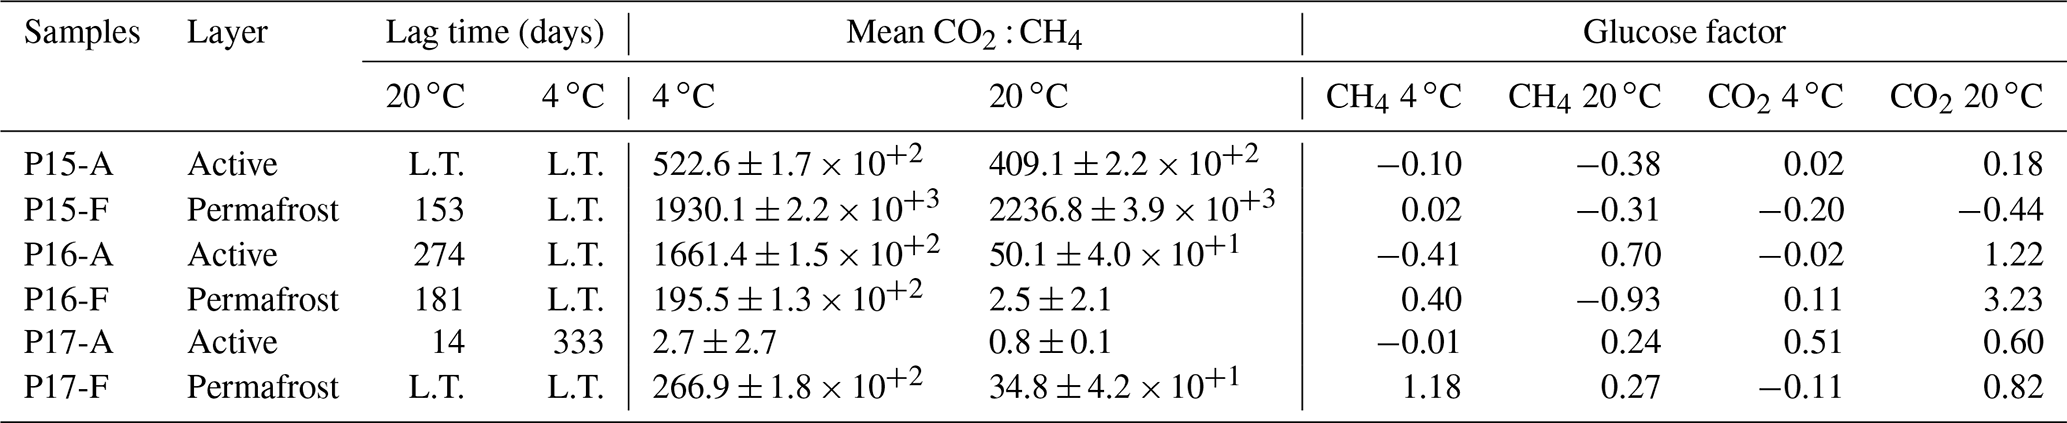
The lag time before CH4 production was observed ranged from 14 d to over 363 d. The active layer of the floodplain core (P17-A-20) was the first to produce CH4 after 14 d of incubation at 20 ∘C. In the frozen layers of Yedoma, the cores required at least 6 months of incubation to start producing CH4 at 20 ∘C (Fig. 2, Table 2), but in the active layer of the Yedoma cores, CH4 production took substantially longer, specifically 273 d for P16-A-20, while P15-A did not produce appreciable CH4 over 363 d in the experiment. At 4 ∘C, CH4 production in P17-A started after 333 d but was not observed for the other samples (Fig. 2, Table 3).
3.2.2 CO2 production over 1 year of incubation
Over the 363 d incubation, cumulative CO2 production ranged from 90.3 to 701.4 µg CO2-C g−1 DW. The cumulative CO2 production of P17-A at 20 ∘C was the highest among all the samples (701.4 ± 124 µg CO2-C g−1 DW), while it was the lowest in permafrost layer of the same core at 20 ∘C (Figs. 2, 3). The CO2 production of P15 and P16 was in the same range, between 142 ± 85 µg CO2-C g−1 DW (P16-A at 4 ∘C) and 348.3 ± 135 µg CO2-C g−1 DW (P15-F at 20 ∘C), except in the case of P16-F at 4 ∘C (chi squared = 2.80, df = 1, p=0.20) (Figs. 2, 3). At 4 ∘C, the permafrost layers of the Yedoma core P16 and the floodplain core P17 had cumulative production below 60 µg CO2-C g−1 DW. The results per gram C showed a different pattern for the cumulative CO2 production of the floodplain core P17. The permafrost layer at 4 ∘C reached 7.98 mg CO2-C g−1 C and had higher CO2 production than the permafrost layer at 20 ∘C and the active layer at 4 ∘C (Fig. S3 in the Supplement).
A decrease of CO2 production at the beginning of the incubation was observed for all the samples (Fig. 2, Fig. S4 in the Supplement). All the active-layer samples (except the active layer of the floodplain P17 at 4 ∘C), as well as the permafrost layers of the Yedoma cores P15 and P16 at 20 ∘C, reached the maximum production rates of CO2 before or at the end of the first 2 months (Fig. 2). The maximum production rate of CO2 for the active layer of the floodplain at 4 ∘C was attained after 300 d of incubation, and the other permafrost samples reached the maximum production rate between 2 and 5 months (Fig. 2). Maximum production rates ranged between 57.13 µg C-CO2 g C−1 d−1 (P16-A) and 754 µg C-CO2 g C−1 d−1 (P17-F) at 4 ∘C and between 120.54 and 510.65 µg C-CO2 g C−1 d−1 for P16-F and P15-A, respectively, at 20 ∘C (Table S2 in the Supplement). After half a year of incubation, CO2 production plateaued for all the samples, except for the active layer of the floodplain sample at 4 ∘C. For all the samples, we noticed an increase in CO2 production after 60 d of incubation, e.g., after the microbial sampling, followed by a decrease in the CO2 production. We did not consider those results to be descriptive of the maximum production rates.
After 1 year of incubation, neither the temperature nor the depth impacted the cumulative CO2 production of the cores (chi squared = 3.86, df = 1, p = 0.09)) (Figs. 2, 3). CO2 production was higher at 20 ∘C only for the permafrost layer of the Yedoma core P16 and the active layer of the floodplain P17 (chi squared = 3.86, df = 1, p<0.05) (Figs. 2, 3).
The P17-A-20 CO2 : CH4 ratio decreased rapidly during the first 14 d. The CO2 : CH4 ratio reached 1 after 40 d and remained stable until the end of incubation (Table 2). In addition, the CO2 : CH4 ratio of P17-A at 4 ∘C and of P16-F at 20 ∘C was low after 363 d of incubation (respectively, 2.7 ± 2.7 and 2.5 ± 2.1). For all the samples, except for P15-F, CO2 : CH4 ratios were significantly lower at 20 ∘C than at 4 ∘C (chi squared = 3.92, df = 1, p<0.05) (Table 3).
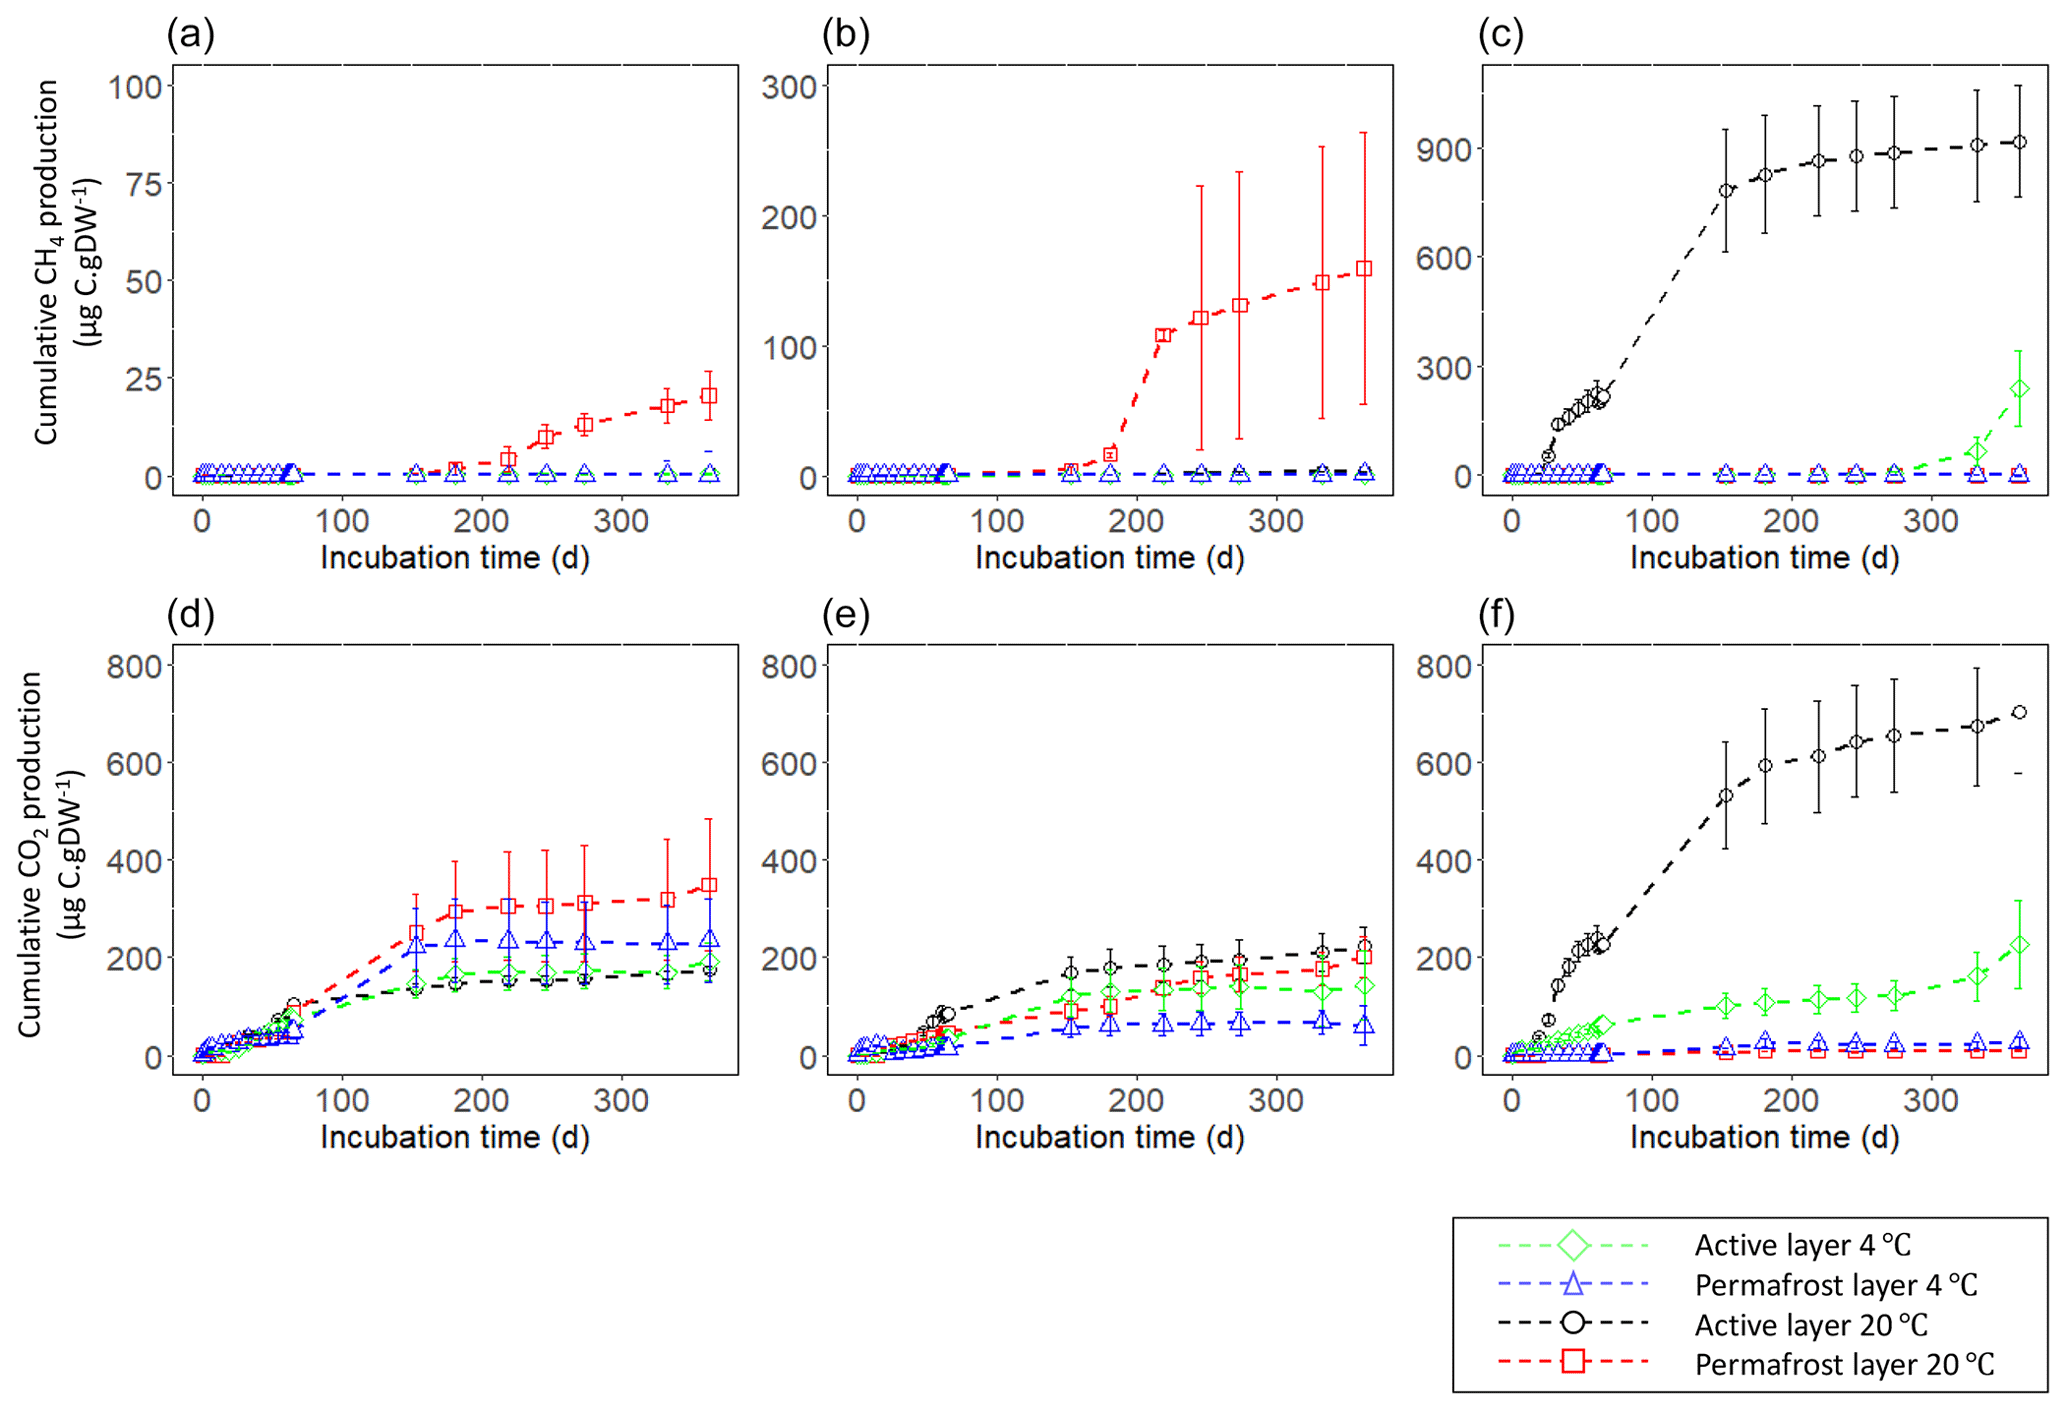
Figure 2Cumulative gas production per gram dry weight (DW) at 4 and 20 ∘C for 363 d of incubation. CH4 production of (a) P15, (b) P16, and (c) P17. CO2 production of (d) P15, (e) P16, and (f) P17. Error bars show the standard deviation from the means ± standard error (n=3). Note the differing y-axis scales between cores for CH4.
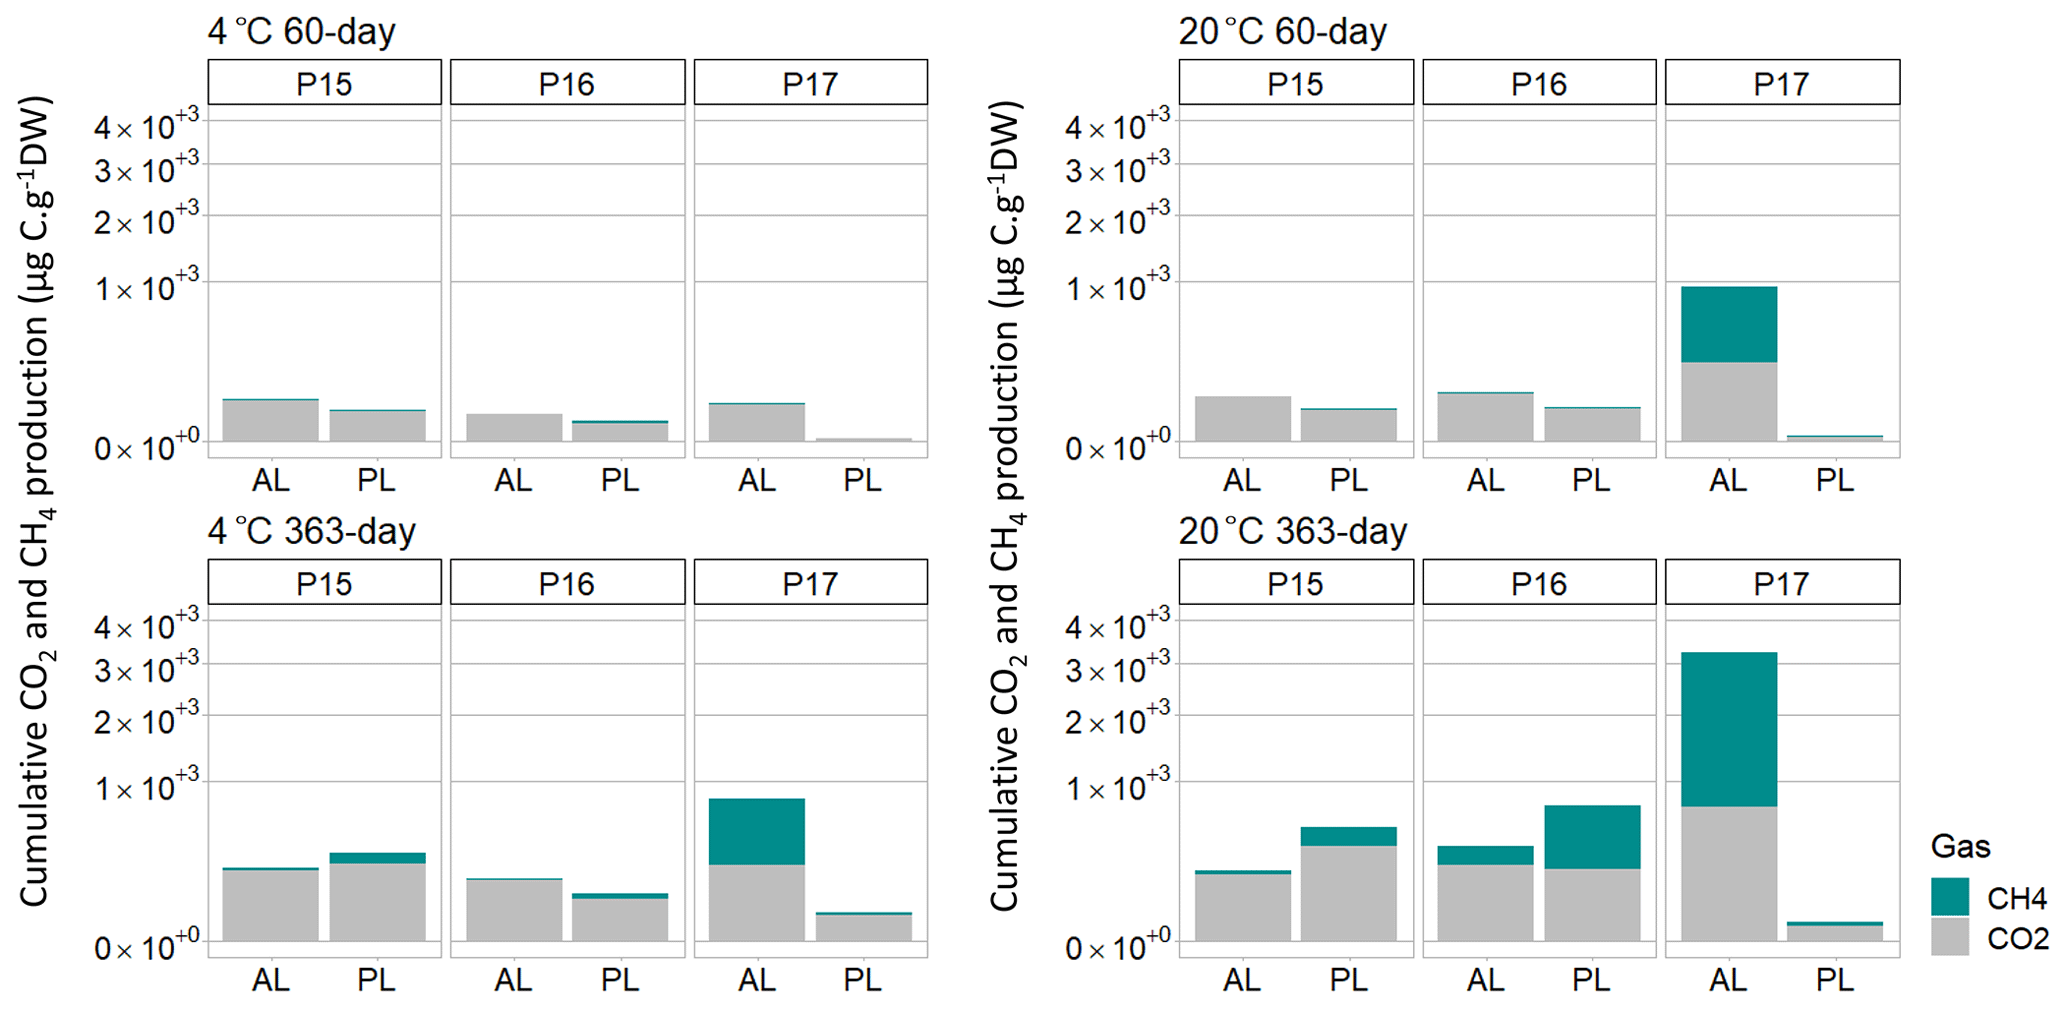
Figure 3Cumulative production of CO2 and CH4 per gram dry weight after 60 d of incubation at 4 and 20 ∘C and after 363 d. AL stands for active layer, and PL stands for permafrost layer. Scale is expressed as square root for a better representation of the data.
Table 3Summary of lag time of CH4 offset, CO2 : CH4 ratios, and glucose factors. Lag time is expressed in days. L.T. stands for samples where the lag time did not end after 1 year of incubation. CO2 : CH4 ratios represent the means of total production after 363 d of incubation at 20 and 4 ∘C. Glucose factors were calculated based on cumulative C production 7 d after glucose addition. Positive values indicate the positive impact of glucose on GHG production, while negative values indicate less GHG production after glucose addition.
3.2.3 Effect of glucose addition
Overall, no effect of glucose injection on CH4 production was detected after 67 d of incubation (Table 3) (chi squared = 0.25, df = 1, p = 0.5913). A CH4 production peak was detected 1 d after the second glucose addition for P15 and P16. The response factors were low (CH4 production was between 1.2 and 1.7 times higher with glucose addition compared to without) and appeared only at 20 ∘C. No impact of the glucose addition was detected on CH4 production for the samples at 4 ∘C after neither the first nor the second injection (Fig. S5 in the Supplement).
CO2 production at 20 ∘C was, overall, increased by glucose (chi squared = 3.78, df = 1, p<0.05). The maximum increase of CO2 production was seen for the permafrost layer of P16 (4.2 times higher with the glucose addition). No difference in CO2 production was detected for any of the samples at 4 ∘C after the glucose addition (Fig. S5 in the Supplement).
3.3 Gene copy numbers of methanogens and methanotrophs
For half of the samples, no methanogenic gene copy numbers were detected when the samples were thawed prior to beginning the incubation. From these samples, only the methanogenic gene copy number for core P17-A was above the detection limit (4.3 × 10³). Therefore, it was not possible to compare the methanogenic gene copy numbers before the start of the incubation (Fig. 4).
After 60 d of incubation, the mcrA gene copy numbers ranged from 5.35 × 10³ to 5.34 × 10⁵. The qPCR results showed significant differences between cores after 60 d of incubation (chi squared = 3.89, df = 1, p<0.05) with the highest copy number per gram soil (Fig. 4c) in P17-A. No methanogenic gene copy numbers were detected for the permafrost layer of P17 or for the active layer of P16.
P16-F and P17-A had 9 and 36 times higher mcrA copy numbers per gram soil, respectively, at 20 ∘C than at 4 ∘C (chi squared = 3.9, df = 1, p<0.05) (Fig. 4). The temperature response for the active and permafrost layer of P15 was not identified because the results were below the detection limit at both 4 and 20 ∘C.
Similarly, no comparison was possible between active and permafrost layers for all the samples.
Gene copy numbers of methanotrophic bacteria based on the pmoA gene were either below the detection limit or not detected before the incubation; therefore, no interpretation of the oxic conditions under field condition was possible (Fig. 4).
Copy numbers after the addition of glucose did not differ from those without glucose (Fig. 4).
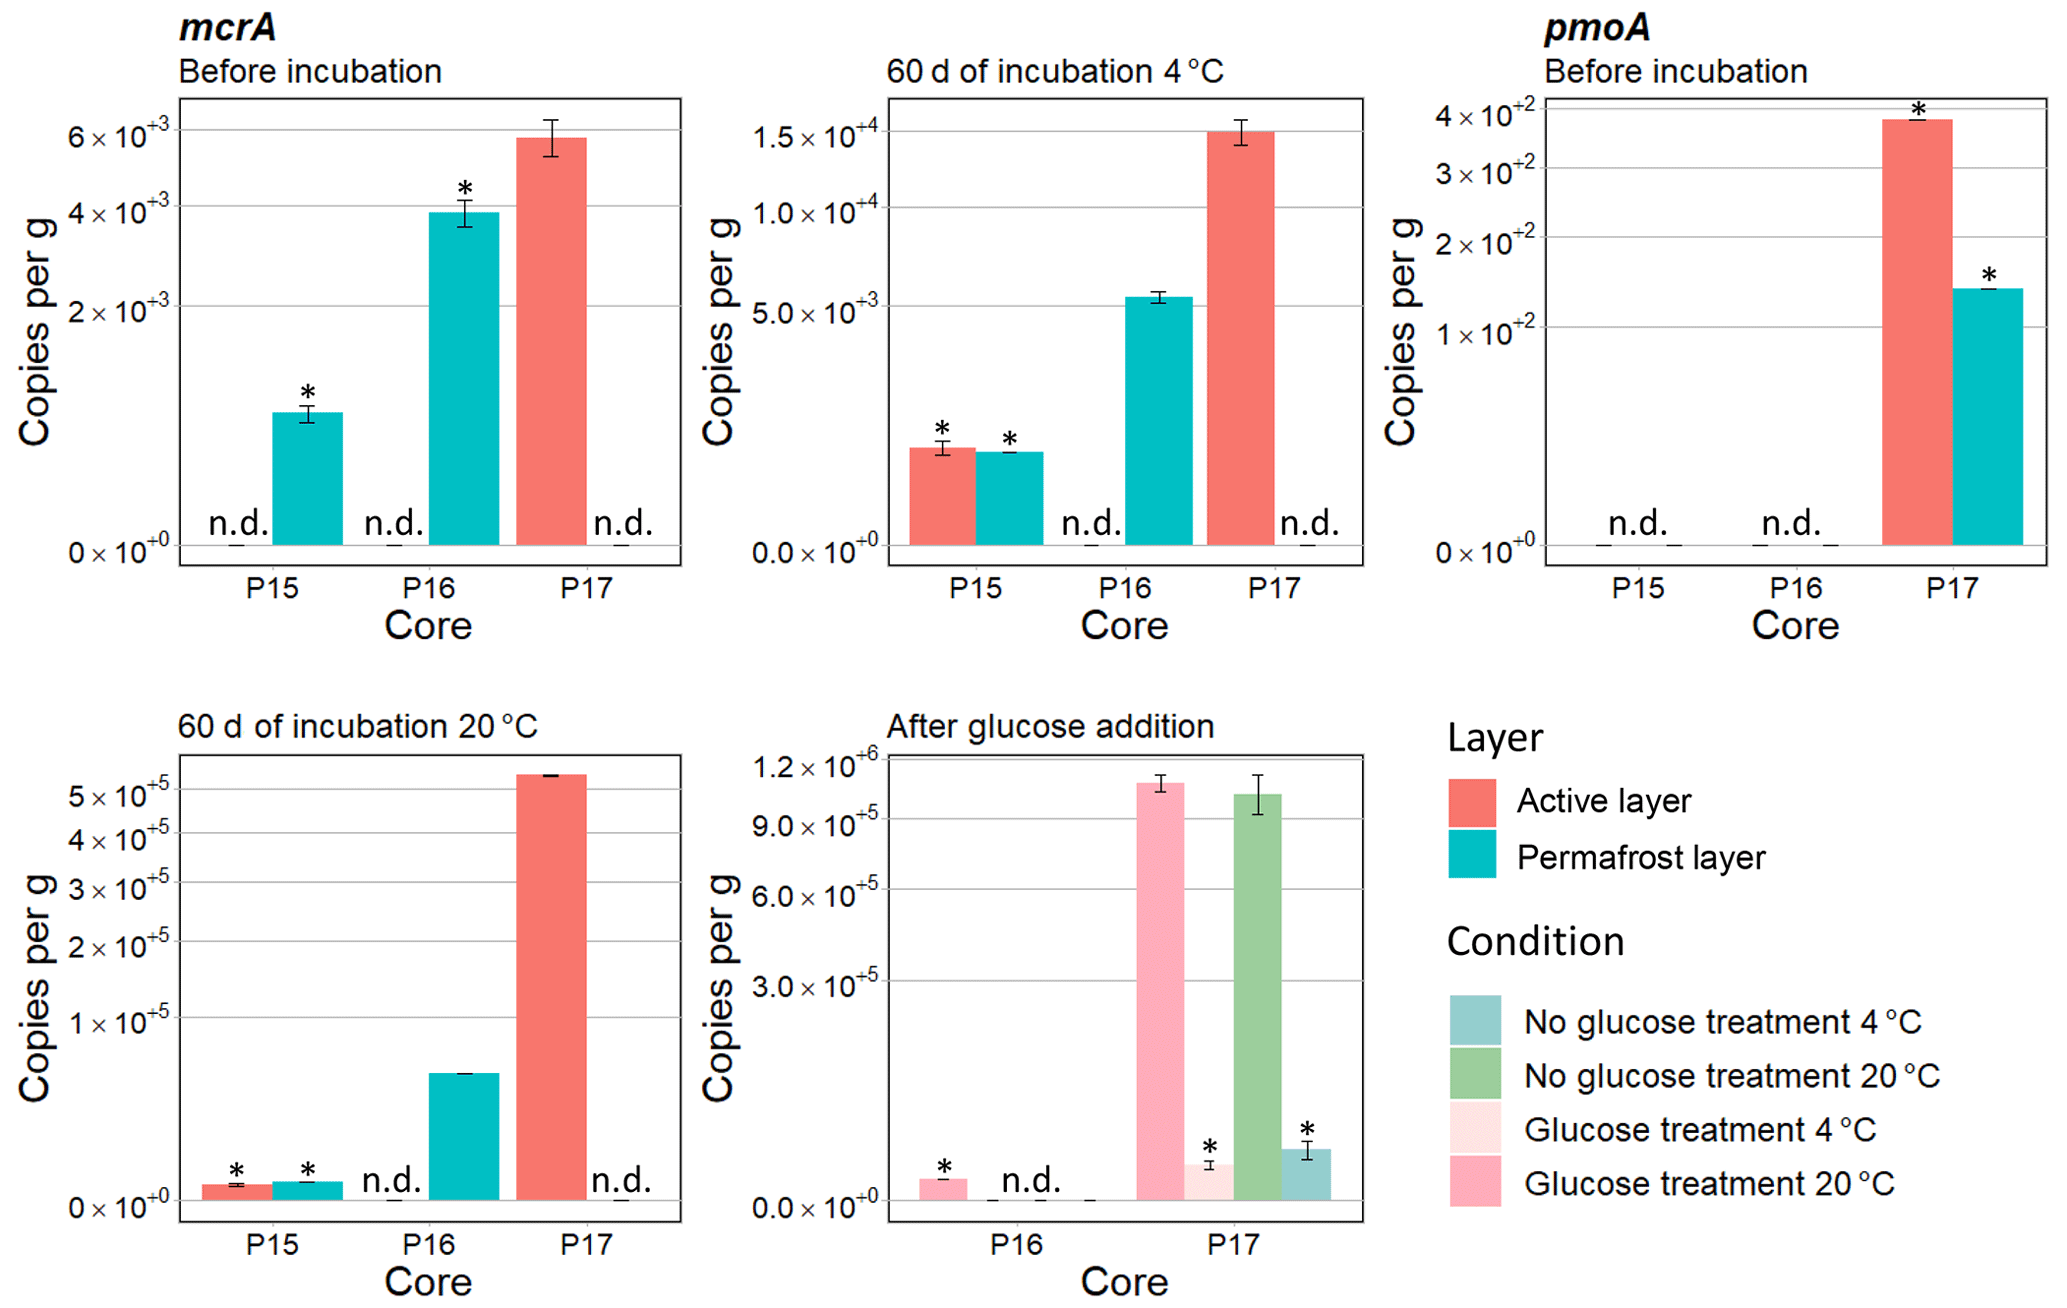
Figure 4Means of gene copies per gram calculated with qPCR amplification at different times for different conditions – before the incubation, after 60 d of incubation, and at the end. Gene copy numbers of mcrA were calculated for P15, P16, and P17. mcrA results are shown for the active layers of P16 and P17 with or without glucose treatment after 67 d of incubation. Gene copy numbers of pmoA are shown for P15, P16, and P17 before the incubation. Samples below the detection limit are indicated by *, and samples where copies per gram were not detected are indicated by n.d. Scale is expressed as square root in order to have a better display.
4.1 CH4 production in floodplain environment and Yedoma cores across landscape positions
4.1.1 Floodplain core
We mimicked potential CH4 production during a growing season (60 d) in a floodplain environment of Kurungnakh Island in the Lena River Delta and extended the incubation time to 1 year to capture the CH4 production behavior. Within the first 2 months, the results showed high rates and a quick onset of CH4 production, as well as the presence of methanogen communities (Fig. 4), in the active layer of the floodplain core P17 at 20 ∘C only. Those findings, as well as the low CO2 : CH4 ratio, indicated a quick establishment of optimum methanogenic conditions within the growing season time frame of 60 d (Symons and Buswell, 1993) (Figs. 2c, 3; Table 3). Herbst (2022) did a similar incubation study with samples from the active floodplains of Kurungnakh Island and nearby Samoylov Island (Fig. 1). CH4 was produced from two of the three cores within the first 60 d of incubation (Table S3 in the Supplement). In both this study and the Herbst study, CH4 production was triggered quickly after the beginning of the incubation (from 10 to 40 d) within these floodplain samples. Thus, these Arctic floodplain environments may allow the fast establishment of methanogens and therefore rapid CH4 production under anaerobic conditions.
However, not all floodplain soils showed fast establishment of methane communities and high rates of potential methane production. Unlike the active layer, the permafrost layers of floodplain did not produce appreciable CH4 after 1 year of incubation at either 4 or 20 ∘C and were still considered to be in the lag phase. The absence of detectable mcrA copy numbers per gram soil after 60 d of incubation indicated the absence of methanogen communities in the permafrost samples (Fig. 4). Similarly, low rates of CO2 production, low C content, and high sand content in this permafrost sample indicate non-suitable conditions for many types of soil microbes (Figs. 2, 4; Table 1) (Eskelinen et al., 2009).
As expected, our results showed significant differences between CH4 production rates at 4 and 20 ∘C. At 4 ∘C, almost 300 d of incubation were needed to trigger CH4 production in the active layer of the floodplain (versus 14 d at 20 ∘C), with a total cumulative CH4 production 4 times lower than at 20 ∘C (Fig. 3). Other studies showed similar patterns; e.g., CH4 production increases with temperature and has shorter lag times (Ganzert et al., 2007; Treat et al., 2015). This is explained by a strong temperature sensitivity of methanogen communities (Westermann, 1993; Li et al., 2015). At the end of the growing-season simulation, our results showed mcrA copy numbers 36 times lower at 4 ∘C than at 20 ∘C (Fig. 4), again indicating that the methanogen community required both time and high temperatures to establish.
4.1.2 Yedoma cores
This study highlights a different CH4 production behavior between the floodplain and the Yedoma cores. The permafrost layers from the Yedoma cores only started producing CH4 after 6 months of incubation at 20 ∘C, whereas the floodplain core produced CH4 earlier (Fig. 2). The CO2 : CH4 ratios remained high after 1 year of incubation (Table 3), meaning that the methanogenic conditions were not yet optimal (Symons and Buswell, 1993). The low mcrA copies after the 60 d of incubation compared to the active layer of the floodplain, as well as the long lag times, showed that the methanogen communities took more time to become active in the permafrost Yedoma cores (Figs. 2, 4).
Our results indicated higher CH4 production rates in the permafrost layer than in the active layer, while others generally show the opposite (Yavitt et al., 2006; Treat et al., 2015, p.201). However, most of the studies on CH4 production from Yedoma cores showed high variability in the cumulative CH4 production. As explained above, lag times measured from former studies, as well as CH4 production rates, differed (Lee et al., 2012; Knoblauch et al., 2013; Walz et al., 2018; Jongejans et al., 2021). It is therefore difficult to estimate the potential production of CH4 after thawing from Yedoma soils due to this high variability. Methanogens are highly constrained microbial communities, and the community size varied strongly between the sites in this study (Fig. 4), which partly explains the discrepancies among the studies on Yedoma soils due to the ecological and phylogenetic narrowness of the methanogen communities (Ernakovich et al., 2022).
The active layers at 4 and 20 ∘C and the permafrost layers at 4 ∘C were still in the lag phase without appreciable CH4 production after 1 year of incubation (Figs. 2, 3; Table 3), which agrees with the absence of detected methanogen community (Fig. 4). Several multiannual studies also observed long and heterogeneous lag times at 4 ∘C for Yedoma soils (from 53±23 up to 2500 d; Knoblauch et al., 2018; Walz et al., 2018). Knoblauch et al. (2018) explained the long lag time as being the result of a lack of methanogens or a lack of active methanogenic communities in soil samples. We added glucose to test whether the absence of CH4 production was due to a lack of labile C or a lack of established methanogenic communities. If the methanogen community was small but established, we would expect to have community growth after the glucose addition. Since glucose had no effect on either CH4 production rates or P15 and P16 methanogen community growth, we concluded that the absence of CH4 production for those samples was because the methanogens were not active (or not active enough to detect). It has been shown that the establishment of a microbial community after thaw is correlated to the community characteristics and the thaw disturbance (Deng et al., 2015; Ernakovich et al., 2022). For ecologically and phylogenetically narrow microbial communities, like methanogens, random environmental processes like microtopography (stochastic processes) strongly influence the abundances and activation of the microbial communities. After an abrupt thaw, like we simulated in our incubation study, the role played by stochastic processes on constrained microbial communities is even stronger (Deng et al., 2015; Ernakovich et al., 2022). Therefore, although the incubation was carried out under anaerobic conditions, the quantity and the establishment of an active methanogen community in the samples after thaw was strongly controlled by stochastic processes.
4.1.3 Controls on CH4 production across landscape positions
CH4 production over the incubation time was not correlated with the TOC and TN % (Fig. 3, Table 2). The landscape position rather than soil characteristics played a key role in the establishment of microbial activity and, consequently, explained much of the variation in GHG production among the samples. Periodic water saturation in core P17 was indicated by oxidation marks at several depths in the field. These redox features indicate periodically anoxic conditions that likely favored the establishment or persistence of methanogen communities and reduced the lag times prior to CH4 production under anaerobic conditions (Chasar et al., 2000; Paul et al., 2006; Jaatinen et al., 2007; Keller and Bridgham, 2007) (Fig. 2, Table 3). On the other hand, well-drained conditions were found in the field for the active layers of both the upland and the slope cores (P15 and P16), which did not produce appreciable CH4 after 1 year of incubation (Figs. 2, 3). The aerobic conditions due to the dry environment likely inhibited methanogenesis (Megonigal and Schlesinger, 2002). Unlike the active layers, the permafrost layers of Yedoma showed low but existing mcrA results from the Yedoma permafrost layers at 20 ∘C (Fig. 4) and started producing CH4 after 6 months. The methanogen community was likely established prior to or during the deposit of the Yedoma sediments, and the microbial community survived despite being freeze-locked (Holm et al., 2020). In addition, we quantified methanotroph communities to include more information about the potential for methane oxidation under field conditions, but the results showed amounts below the detection limit before the incubation (Fig. 4). These results support our hypothesis concerning the impact of landscape position on CH4 production, namely that aerobic conditions in the landscape coincide with poor establishment of methanogenesis even when incubation conditions become favorable for methanogens.
4.2 Controls on potential CO2 production
The rates of CO2 production per gram C were on the same order of magnitude as other Yedoma incubation studies from Kurungnakh Island (Knoblauch et al., 2013, 2018) and the nearby Lena River Delta (Walz et al., 2018). These similar results suggest that C in these Yedoma soils is easily available due to the organic-rich characteristics (Strauss et al., 2013a). On the other hand, the adjacent samples from the permafrost layers of the floodplain showed CO2 production per gram similar to the Yedoma cores, while it had the lowest CO2 cumulative production per gram dry weight of soil. Although floodplain environments in the Lena Delta are considered to be low-C-content pools (Siewert et al., 2016), our results showed that the C in this soil was highly labile and comparable to the lability of Yedoma soils.
The CO2 production followed trends in total C and N contents. The samples with similar C and N contents produced comparable ranges of CO2, whereas the sample (P17-F) with the lowest TOC and N content showed low CO2 production (per gram DW) during the incubation (Fig. 2, Table 2, Table S2 in the Supplement). As shown by Schädel et al. (2014), the C : N ratio was positively correlated to the cumulative CO2 production. However, the correlation was stronger at 4 than at 20 ∘C (Fig. S7 in the Supplement). Therefore, consistent with other studies (Schädel et al., 2014; Knoblauch et al., 2018), the quality (N), quantity (C), and the bioavailability (C : N) of the OM is a key factor for the mineralization into CO2 production.
Our CO2 and CH4 production results combined with microbial analysis indicated that CO2 production pathways might change according to the landscape position. The CO2 : CH4 production ratio of 1:1, as well as the presence of a high number of methanogenic archaea, indicated that the CO2 production in the active-layer floodplain could have originated from methanogenesis (Figs. 3, 4) (Symons and Buswell, 1993; Knoblauch et al., 2018; Holm et al., 2020). In drier environments, like the P15 and P16 cores, the high CO2 : CH4 production rates resulted from other, undetermined anaerobic decomposition pathways. Anaerobic respiration is a common function, and diverse microbial communities are able to decompose the OM to CO2; therefore, the anaerobic microbial community is not a limiting factor for C mineralization to CO2 (Elderfield and Schlesinger, 1998). Based on the positive correlation between C : N and the cumulative CO2 (Fig. S7 in the Supplement), as well as the broad microbial community that is able to produce CO2, our CO2 production is rather controlled by the quality (N) and the quantity (TOC) of the OM rather than by the microbial communities (Knoblauch et al., 2018; Holm et al., 2020).
4.3 Implication for C feedback on Kurungnakh Island during the growing season
With climate change, Arctic environments will be subject to changes in moisture conditions, vegetation shifts, increased active-layer depth, and abrupt permafrost thaw (Serreze et al., 2000; Hinzman et al., 2005; Myers-Smith et al., 2011; Turetsky et al., 2019). Our permafrost thaw simulation under wet summer conditions for Kurungnakh Island soil showed that the CO2 production for the Yedoma cores was similar in magnitude to other studies including Yedoma soil. In the incubation experiment, all the Yedoma samples reached the maximum production rates within the first 2 months of incubation (Fig. 2). Schädel et al. (2014) attributed the decrease in CO2 production rates after some time in incubation to a rapid C turnover that relied mainly on the decomposition of the labile C pool (Schädel et al., 2014; Walz et al., 2018; Schädel et al., 2020). However, several studies pointed out the small size of the labile C pool of Yedoma deposits (Knoblauch et al., 2013; Strauss et al., 2013b). Here, the Yedoma soils from Kurungnakh Island showed labile-C-pool depletion after 6 months of incubation (e.g., the CO2 production rates decreased, and the cumulative CO2 production plateaued after 6 months of incubation; Fig. 2). Therefore, under wet summer conditions, it is likely that there will be rapid C turnover and CO2 production during the growing season.
The active layer of the floodplain at 20 ∘C produced up to 300 µg CH4-C g−1 DW at the end of the simulated growing season. The low-lying position of the floodplain allows regular flooding from the river. The hydrological conditions of this area provide favorable redox conditions, i.e., anaerobic conditions, for the establishment of active methanogen communities if the temperature is high enough (Figs. 3, 4). Therefore, we expect CH4 production from the floodplain site relatively soon after the beginning of the growing season. Long-term in situ measurements in the Lena Delta have shown the highest CH4 emission rates for moist to dry dwarf-shrub-dominated tundra, located mainly in lower floodplain environments (5048.5 mg m−2 yr−1; Schneider et al., 2009). In this area of the Lena Delta, CH4 emissions have been measured from June to September, with the highest emission rates in July (Rößger et al., 2022). Our results showed a high CH4 production potential from the floodplain; however, floodplain environments are periodically flooded, meaning there might be periods where the floodplain would be too dry to allow CH4 production (Huissteden et al., 2005; Oblogov et al., 2020). A long-term study like that by Rößger et al. (2022) in floodplain environments would help to quantify CH4 emission from floodplains, how often it occurs during the growing season, and how the CH4 flux would respond to changes in soil moisture over time.
While CH4 production did occur in the year-long anaerobic incubation of Yedoma samples, other factors might result in these tundra regions still being a net CH4 sink barring abrupt permafrost thaw (Schneider et al., 2009; Juncher Jørgensen et al., 2015). In these dry Yedoma sites, the net CH4 flux is the balance between CH4 production in anoxic soil layers and CH4 oxidation in overlying aerobic layers. Here, we showed that CH4 production was possible from these soils given high-enough temperatures (Fig. 3), but this required a long lag time for the establishment of the methanogen communities (Fig. 4). Therefore, it is unlikely that the active methanogen communities have enough time (>60 d; Fig. 4) or warm-enough temperatures (Fig. 3) to establish during the growing season in the upland and slope areas (P15, P16) on Kurungnakh Island even with deeper active layers, soil moisture increases, and highly bioavailable C in Yedoma sediments (Anthony et al., 2014; Mann et al., 2014; Spencer et al., 2015). These conditions may constrain the potential CH4 emissions from some Yedoma soils even with warmer climates, wetter soils, and permafrost thaw but will require additional field-based observations to account for plant transport and methane oxidation processes occurring in situ.
In this study, we provide new information regarding the importance of the landscape position for CH4 production during the growing season on Kurungnakh Island in the Lena River Delta. High CH4 production was measured in waterlogged (floodplain) areas within the 60 d simulation of the growing season at 20 ∘C thanks to a fast establishment of the methanogen community (14 d). In contrast, the well-drained Yedoma active-layer samples were still in the lag phase at the end of the growing-season simulation and did not produce appreciable CH4 emissions, and C turnover resulted in CO2 production. CH4 was produced by the Yedoma permafrost layers after a lag phase of 6 months at 20 ∘C. Although the permafrost layer of the floodplain had low TOC, we identified similar C lability for the three cores as for other studies with samples from Siberia and therefore high potential C gas production throughout this region but mainly as CO2. As a result, the data presented in this case study contribute to quantifying and understanding C turnover in permafrost areas. Questions remain regarding how to upscale results from laboratory incubation to in situ conditions, and our results highlighted the need to better understand changes in redox conditions across the landscape position to improve upscaling.
The data sets used in this paper are available at https://doi.org/10.1594/PANGAEA.945685 (Laurent et al., 2023).
The supplement related to this article is available online at: https://doi.org/10.5194/bg-20-2049-2023-supplement.
ML, CCT and SL designed the study. ML conducted all the experiments (soil analyses, incubations, and microbe quantification). MF and AR collected the soil samples and field notes during the expedition in 2018 and created the map. SL furnished the laboratory materials to perform microbe analyses and gas measurements. TH provided data from her incubation experiments. ML wrote the paper with contributions from all the co-authors.
The contact author has declared that none of the authors has any competing interests.
Publisher's note: Copernicus Publications remains neutral with regard to jurisdictional claims in published maps and institutional affiliations.
Funding for this study was provided by ERC-H2020 grant no. 851181 FluxWIN, the Helmholtz Impulse Initiative and Networking Fund. Samples were collected during the joint Russian-German LENA 2018 expedition to Samoylov Island within the framework of the BMBF KoPf (Kohlenstoff in Permafrost) project (project no. 3F0764B). This project was also supported by the European Erasmus+ programme. We thank the staff at the Samoylov Research Station for the support and logistics during the fieldwork. We also thank the Alfred-Wegener Institute and GFZ lab technicians in Potsdam for the laboratory assistance.
This research has been supported by Eurogia2020 (grant no. 851181). The project was also supported by the European ErasmusC Program.
Additionally, the samples collection was funded by the BMBF KoPf (Kohlenstoff in Permafrost).
The article processing charges for this open-access publication were covered by the Alfred Wegener Institute, Helmholtz Centre for Polar and Marine Research (AWI).
This paper was edited by Nicolas Brüggemann and reviewed by Suzanne Hodgkins and two anonymous referees.
Adamczyk, M., Rüthi, J., and Frey, B.: Root exudates increase soil respiration and alter microbial community structure in alpine permafrost and active layer soils, Environ. Microbiol., 23, 2152–2168, https://doi.org/10.1111/1462-2920.15383, 2021.
AMAP: Arctic Climate Change Update 2021: Key Trends and Impacts, Summary for Policy-makers, 2021.
Andreev, A. A., Grosse, G., Schirrmeister, L., Kuznetsova, T. V., Kuzmina, S. A., Bobrov, A. A., Tarasov, P. E., Novenko, E. Y., Meyer, H., Derevyagin, A. Y., Kienast, F., Bryantseva, A., and Kunitsky, V. V.: Weichselian and Holocene palaeoenvironmental history of the Bol'shoy Lyakhovsky Island, New Siberian Archipelago, Arctic Siberia, Boreas, 38, 72–110, https://doi.org/10.1111/j.1502-3885.2008.00039.x, 2009.
Anthony, K. M. W., Zimov, S. A., Grosse, G., Jones, M. C., Anthony, P. M., Iii, F. S. C., Finlay, J. C., Mack, M. C., Davydov, S., Frenzel, P., and Frolking, S.: A shift of thermokarst lakes from carbon sources to sinks during the Holocene epoch, Nature, 511, 452–456, https://doi.org/10.1038/nature13560, 2014.
Boike, J., Kattenstroth, B., Abramova, K., Bornemann, N., Chetverova, A., Fedorova, I., Fröb, K., Grigoriev, M., Grüber, M., Kutzbach, L., Langer, M., Minke, M., Muster, S., Piel, K., Pfeiffer, E.-M., Stoof, G., Westermann, S., Wischnewski, K., Wille, C., and Hubberten, H.-W.: Baseline characteristics of climate, permafrost and land cover from a new permafrost observatory in the Lena River Delta, Siberia (1998–2011), Biogeosciences, 10, 2105–2128, https://doi.org/10.5194/bg-10-2105-2013, 2013.
Callaghan, T. V., Bergholm, F., Christensen, T. R., Jonasson, C., Kokfelt, U., and Johansson, M.: A new climate era in the sub-Arctic: Accelerating climate changes and multiple impacts, Geophysical Res. Lett., 37, L14705, https://doi.org/10.1029/2009GL042064, 2010.
Chasar, L. S., Chanton, J. P., Glaser, P. H., Siegel, D. I., and Rivers, J. S.: Radiocarbon and stable carbon isotopic evidence for transport and transformation of dissolved organic carbon, dissolved inorganic carbon, and CH4 in a northern Minnesota peatland, Global Biogeochem. Cy., 14, 1095–1108, https://doi.org/10.1029/1999GB001221, 2000.
Conrad, R.: Control of microbial methane production in wetland rice fields, Nutr. Cycl. Agroecosyst., 64, 59–69, https://doi.org/10.1023/A:1021178713988, 2002.
Davidson, E. A. and Janssens, I. A.: Temperature sensitivity of soil carbon decomposition and feedbacks to climate change, Nature, 440, 165–173, https://doi.org/10.1038/nature04514, 2006.
Dean, J. F., Middelburg, J. J., Röckmann, T., Aerts, R., Blauw, L. G., Egger, M., Jetten, M. S. M., de Jong, A. E. E., Meisel, O. H., Rasigraf, O., Slomp, C. P., in't Zandt, M. H., and Dolman, A. J.: Methane Feedbacks to the Global Climate System in a Warmer World, Rev. Geophys., 56, 207–250, https://doi.org/10.1002/2017RG000559, 2018.
Deng, J., Gu, Y., Zhang, J., Xue, K., Qin, Y., Yuan, M., Yin, H., He, Z., Wu, L., Schuur, E. A. G., Tiedje, J. M., and Zhou, J.: Shifts of tundra bacterial and archaeal communities along a permafrost thaw gradient in Alaska, Mol. Ecol., 24, 222–234, https://doi.org/10.1111/mec.13015, 2015.
Douglas, T. A., Turetsky, M. R., and Koven, C. D.: Increased rainfall stimulates permafrost thaw across a variety of Interior Alaskan boreal ecosystems, npj Clim. Atmos. Sci., 3, 1–7, https://doi.org/10.1038/s41612-020-0130-4, 2020.
Elder, C. D., Thompson, D. R., Thorpe, A. K., Hanke, P., Walter Anthony, K. M., and Miller, C. E.: Airborne Mapping Reveals Emergent Power Law of Arctic Methane Emissions, Geophys. Res. Lett., 47, e2019GL085707, https://doi.org/10.1029/2019GL085707, 2020.
Elderfield, H. and Schlesinger, W.: Biogeochemistry. An Analysis of Global Change, Earth System Science and Global Change, Geol. Mag., 135, 819–842, https://doi.org/10.1017/S0016756898231505, 1998.
Ernakovich, J. G., Barbato, R. A., Rich, V. I., Schädel, C., Hewitt, R. E., Doherty, S. J., Whalen, E. D., Abbott, B. W., Barta, J., Biasi, C., Chabot, C. L., Hultman, J., Knoblauch, C., Vetter, M. C. Y. L., Leewis, M.-C., Liebner, S., Mackelprang, R., Onstott, T. C., Richter, A., Schütte, U. M. E., Siljanen, H. M. P., Taş, N., Timling, I., Vishnivetskaya, T. A., Waldrop, M. P., and Winkel, M.: Microbiome assembly in thawing permafrost and its feedbacks to climate, Glob. Change Biol., 28, 5007–5026, https://doi.org/10.1111/gcb.16231, 2022.
Eskelinen, A., Stark, S., and Männistö, M.: Links between plant community composition, soil organic matter quality and microbial communities in contrasting tundra habitats, Oecologia, 161, 113–123, https://doi.org/10.1007/s00442-009-1362-5, 2009.
Faucherre, S., Jørgensen, C. J., Blok, D., Weiss, N., Siewert, M. B., Bang-Andreasen, T., Hugelius, G., Kuhry, P., and Elberling, B.: Short and Long-Term Controls on Active Layer and Permafrost Carbon Turnover Across the Arctic, J. Geophys. Res.-Biogeo., 123, 372–390, https://doi.org/10.1002/2017JG004069, 2018.
Fewster, R. E., Morris, P. J., Ivanovic, R. F., Swindles, G. T., Peregon, A. M., and Smith, C. J.: Imminent loss of climate space for permafrost peatlands in Europe and Western Siberia, Nat. Clim. Change, 12, 373–379, https://doi.org/10.1038/s41558-022-01296-7, 2022.
Fuchs, M.: Soil organic carbon and nitrogen pools in thermokarst-affected permafrost terrain, PhD thesis, Universität Potsdam, hdl: 10013/epic.393b95ff-1d0f-4659-9376-ef084d27741a, 2019.
Ganzert, L., Jurgens, G., Münster, U., and Wagner, D.: Methanogenic communities in permafrost-affected soils of the Laptev Sea coast, Siberian Arctic, characterized by 16S rRNA gene fingerprints, FEMS Microbiol. Ecol., 59, 476–488, https://doi.org/10.1111/j.1574-6941.2006.00205.x, 2007.
Grigoriev, M. N.: Cryomorphogenesis in the Lena Delta, Yakutsk, Permafrost Institute Press, 176 pp., 1993.
Hales, B. A., Edwards, C., Ritchie, D. A., Hall, G., Pickup, R. W., and Saunders, J. R.: Isolation and identification of methanogen-specific DNA from blanket bog peat by PCR amplification and sequence analysis, Appl. Environ. Microbiol., 62, 668–675, https://doi.org/10.1128/aem.62.2.668-675.1996, 1996.
Herbst, T.: Carbon Stocks and Potential Greenhouse Gas Release of Permafrost-affected Active Floodplains in the Lena River Delta, Master thesis, Faculty of Environment and Natural Resources, 73 pp., hdl: 10013/epic.0c07aee1-d4a7-467e-ad7c-3f3527267f73, 2022.
Hinzman, L. D., Bettez, N. D., Bolton, W. R., Chapin, F. S., Dyurgerov, M. B., Fastie, C. L., Griffith, B., Hollister, R. D., Hope, A., Huntington, H. P., Jensen, A. M., Jia, G. J., Jorgenson, T., Kane, D. L., Klein, D. R., Kofinas, G., Lynch, A. H., Lloyd, A. H., McGuire, A. D., Nelson, F. E., Oechel, W. C., Osterkamp, T. E., Racine, C. H., Romanovsky, V. E., Stone, R. S., Stow, D. A., Sturm, M., Tweedie, C. E., Vourlitis, G. L., Walker, M. D., Walker, D. A., Webber, P. J., Welker, J. M., Winker, K. S., and Yoshikawa, K.: Evidence and Implications of Recent Climate Change in Northern Alaska and Other Arctic Regions, Climatic Change, 72, 251–298, https://doi.org/10.1007/s10584-005-5352-2, 2005.
Holm, S., Walz, J., Horn, F., Yang, S., Grigoriev, M. N., Wagner, D., Knoblauch, C., and Liebner, S.: Methanogenic response to long-term permafrost thaw is determined by paleoenvironment, FEMS Microbiol. Ecol., 96, fiaa021, https://doi.org/10.1093/femsec/fiaa021, 2020.
Hugelius, G., Strauss, J., Zubrzycki, S., Harden, J. W., Schuur, E. A. G., Ping, C.-L., Schirrmeister, L., Grosse, G., Michaelson, G. J., Koven, C. D., O'Donnell, J. A., Elberling, B., Mishra, U., Camill, P., Yu, Z., Palmtag, J., and Kuhry, P.: Estimated stocks of circumpolar permafrost carbon with quantified uncertainty ranges and identified data gaps, Biogeosciences, 11, 6573–6593, https://doi.org/10.5194/bg-11-6573-2014, 2014a.
Hugelius, G., Strauss, J., Zubrzycki, S., Harden, J. W., Schuur, E. A. G., Ping, C.-L., Schirrmeister, L., Grosse, G., Michaelson, G. J., Koven, C. D., O'Donnell, J. A., Elberling, B., Mishra, U., Camill, P., Yu, Z., Palmtag, J., and Kuhry, P.: Estimated stocks of circumpolar permafrost carbon with quantified uncertainty ranges and identified data gaps, Biogeosciences, 11, 6573–6593, https://doi.org/10.5194/bg-11-6573-2014, 2014b.
Huissteden, J. van, Maximov, T. C., and Dolman, A. J.: High methane flux from an arctic floodplain (Indigirka lowlands, eastern Siberia): methane flux arctic floodplain Siberia, J. Geophys. Res., 110, G02002, https://doi.org/10.1029/2005JG000010, 2005.
IPCC: IPCC, 2021: Climate Change 2021: The Physical Science Basis, Contribution of Working Group I to the Sixth Assessment Report of the Intergovernmental Panel on Climate Change, Cambridge University Press, Vol. 6, p. 131, 2021.
Jaatinen, K., Fritze, H., Laine, J., and Laiho, R.: Effects of short- and long-term water-level drawdown on the populations and activity of aerobic decomposers in a boreal peatland, Glob. Change Biol., 13, 491–510, https://doi.org/10.1111/j.1365-2486.2006.01312.x, 2007.
Jongejans, L. L., Liebner, S., Knoblauch, C., Mangelsdorf, K., Ulrich, M., Grosse, G., Tanski, G., Fedorov, A. N., Konstantinov, P. Ya., Windirsch, T., Wiedmann, J., and Strauss, J.: Greenhouse gas production and lipid biomarker distribution in Yedoma and Alas thermokarst lake sediments in Eastern Siberia, Glob. Change Biol., 27, 2822–2839, https://doi.org/10.1111/gcb.15566, 2021.
Juncher Jørgensen, C., Lund Johansen, K. M., Westergaard-Nielsen, A., and Elberling, B.: Net regional methane sink in High Arctic soils of northeast Greenland, Nat. Geosci., 8, 20–23, https://doi.org/10.1038/ngeo2305, 2015.
Keller, J. K. and Bridgham, S. D.: Pathways of anaerobic carbon cycling across an ombrotrophic-minerotrophic peatland gradient, Limnol. Oceanogr., 52, 96–107, https://doi.org/10.4319/lo.2007.52.1.0096, 2007.
Knoblauch, C., Beer, C., Sosnin, A., Wagner, D., and Pfeiffer, E.-M.: Predicting long-term carbon mineralization and trace gas production from thawing permafrost of Northeast Siberia, Glob. Change Biol., 19, 1160–1172, https://doi.org/10.1111/gcb.12116, 2013.
Knoblauch, C., Beer, C., Liebner, S., Grigoriev, M. N., and Pfeiffer, E.-M.: Methane production as key to the greenhouse gas budget of thawing permafrost, Nat. Clim. Change, 8, 309–312, https://doi.org/10.1038/s41558-018-0095-z, 2018.
Koven, C. D., Ringeval, B., Friedlingstein, P., Ciais, P., Cadule, P., Khvorostyanov, D., Krinner, G., and Tarnocai, C.: Permafrost carbon-climate feedbacks accelerate global warming, P. Natl. Acad. Sci. USA, 108, 14769–14774, https://doi.org/10.1073/pnas.1103910108, 2011.
Kuhn, M. A., Thompson, L. M., Winder, J. C., Braga, L. P. P., Tanentzap, A. J., Bastviken, D., and Olefeldt, D.: Opposing Effects of Climate and Permafrost Thaw on CH4 and CO2 Emissions From Northern Lakes, AGU Adv., 2, e2021AV000515, https://doi.org/10.1029/2021AV000515, 2021.
Kuhry, P., Bárta, J., Blok, D., Elberling, B., Faucherre, S., Hugelius, G., Jørgensen, C. J., Richter, A., Šantrůčková, H., and Weiss, N.: Lability classification of soil organic matter in the northern permafrost region, Biogeosciences, 17, 361–379, https://doi.org/10.5194/bg-17-361-2020, 2020.
Lara, M. J., Lin, D. H., Andresen, C., Lougheed, V. L., and Tweedie, C. E.: Nutrient Release From Permafrost Thaw Enhances CH4 Emissions From Arctic Tundra Wetlands, J. Geophys. Res.-Biogeo., 124, 1560–1573, https://doi.org/10.1029/2018JG004641, 2019.
Laurent, M., Fuchs, M., Treat, C. C., Liebner, S., Runge, A.: One year anaerobic incubation measurements (CH4 + CO2) and microbe quantification from samples of Lena Delta collected in 2018, PANGAEA [data set], https://doi.org/10.1594/PANGAEA.945685, 2023.
Lee, H., Schuur, E. A. G., Inglett, K. S., Lavoie, M., and Chanton, J. P.: The rate of permafrost carbon release under aerobic and anaerobic conditions and its potential effects on climate, Glob. Change Biol., 18, 515–527, https://doi.org/10.1111/j.1365-2486.2011.02519.x, 2012.
Li, F., Tianze, S., and Yahai, L.: Snapshot of methanogen sensitivity to temperature in Zoige wetland from Tibetan plateau, Front. Microbiol., 6, 131, https://doi.org/10.3389/fmicb.2015.00131, 2015.
Liebner, S., Ganzert, L., Kiss, A., Yang, S., Wagner, D., and Svenning, M. M.: Shifts in methanogenic community composition and methane fluxes along the degradation of discontinuous permafrost, Front. Microbiol., 6, https://doi.org/10.3389/fmicb.2015.00356, 2015.
Liljedahl, A. K., Boike, J., Daanen, R. P., Fedorov, A. N., Frost, G. V., Grosse, G., Hinzman, L. D., Iijma, Y., Jorgenson, J. C., Matveyeva, N., Necsoiu, M., Raynolds, M. K., Romanovsky, V. E., Schulla, J., Tape, K. D., Walker, D. A., Wilson, C. J., Yabuki, H., and Zona, D.: Pan-Arctic ice-wedge degradation in warming permafrost and its influence on tundra hydrology, Nat. Geosci., 9, 312–318, https://doi.org/10.1038/ngeo2674, 2016.
Mann, P. J., Sobczak, W. V., LaRue, M. M., Bulygina, E., Davydova, A., Vonk, J. E., Schade, J., Davydov, S., Zimov, N., Holmes, R. M., and Spencer, R. G. M.: Evidence for key enzymatic controls on metabolism of Arctic river organic matter, Glob. Change Biol., 20, 1089–1100, https://doi.org/10.1111/gcb.12416, 2014.
McCalley, C. K., Woodcroft, B. J., Hodgkins, S. B., Wehr, R. A., Kim, E.-H., Mondav, R., Crill, P. M., Chanton, J. P., Rich, V. I., Tyson, G. W., and Saleska, S. R.: Methane dynamics regulated by microbial community response to permafrost thaw, Nature, 514, 478–481, https://doi.org/10.1038/nature13798, 2014.
Megonigal, J. P. and Schlesinger, W. H.: Methane-limited methanotrophy in tidal freshwater swamps, Global Biogeochem. Cy., 16, 1088, https://doi.org/10.1029/2001GB001594, 2002.
Meijboom, F. and Noordwijk, M. van: Rhizon soil solu-tion samplers as artificial roots, in: Root ecology and its practical application, Verein für Wurzelforschung, A-9020 Klagenfurt Austria, 793–795, 1991.
Morgenstern, A., Overduin, P. P., Günther, F., Stettner, S., Ramage, J., Schirrmeister, L., Grigoriev, M. N., and Grosse, G.: Thermo-erosional valleys in Siberian ice-rich permafrost, Permafrost Periglac., 32, 59–75, https://doi.org/10.1002/ppp.2087, 2021.
Myers-Smith, I. H., Forbes, B. C., Wilmking, M., Hallinger, M., Lantz, T., Blok, D., Tape, K. D., Macias-Fauria, M., Sass-Klaassen, U., Lévesque, E., Boudreau, S., Ropars, P., Hermanutz, L., Trant, A., Collier, L. S., Weijers, S., Rozema, J., Rayback, S. A., Schmidt, N. M., Schaepman-Strub, G., Wipf, S., Rixen, C., Ménard, C. B., Venn, S., Goetz, S., Andreu-Hayles, L., Elmendorf, S., Ravolainen, V., Welker, J., Grogan, P., Epstein, H. E., and Hik, D. S.: Shrub expansion in tundra ecosystems: dynamics, impacts and research priorities, Environ. Res. Lett., 6, 045509, https://doi.org/10.1088/1748-9326/6/4/045509, 2011.
Oblogov, G. E., Vasiliev, A. A., Streletskaya, I. D., Zadorozhnaya, N. A., Kuznetsova, A. O., Kanevskiy, M. Z., and Semenov, P. B.: Methane Content and Emission in the Permafrost Landscapes of Western Yamal, Russian Arctic, Geosciences, 10, p. 412, https://doi.org/10.3390/geosciences10100412, 2020.
Obu, J., Westermann, S., Bartsch, A., Berdnikov, N., Christiansen, H. H., Dashtseren, A., Delaloye, R., Elberling, B., Etzelmüller, B., Kholodov, A., Khomutov, A., Kääb, A., Leibman, M. O., Lewkowicz, A. G., Panda, S. K., Romanovsky, V., Way, R. G., Westergaard-Nielsen, A., Wu, T., Yamkhin, J., and Zou, D.: Northern Hemisphere permafrost map based on TTOP modelling for 2000–2016 at 1 km2 scale, Earth-Sci. Rev., 193, 299–316, https://doi.org/10.1016/j.earscirev.2019.04.023, 2019.
Olefeldt, D., Turetsky, M. R., Crill, P. M., and McGuire, A. D.: Environmental and physical controls on northern terrestrial methane emissions across permafrost zones, Glob. Change Biol., 19, 589–603, https://doi.org/10.1111/gcb.12071, 2013.
Osterkamp, T. E., Jorgenson, M. T., Schuur, E. a. G., Shur, Y. L., Kanevskiy, M. Z., Vogel, J. G., and Tumskoy, V. E.: Physical and ecological changes associated with warming permafrost and thermokarst in Interior Alaska, Permafrost Periglac., 20, 235–256, https://doi.org/10.1002/ppp.656, 2009.
Paul, S., Küsel, K., and Alewell, C.: Reduction processes in forest wetlands: Tracking down heterogeneity of source/sink functions with a combination of methods, Soil Biol. Biochem., 38, 1028–1039, https://doi.org/10.1016/j.soilbio.2005.09.001, 2006.
Pegoraro, E., Mauritz, M., Bracho, R., Ebert, C., Dijkstra, P., Hungate, B. A., Konstantinidis, K. T., Luo, Y., Schädel, C., Tiedje, J. M., Zhou, J., and Schuur, E. A. G.: Glucose addition increases the magnitude and decreases the age of soil respired carbon in a long-term permafrost incubation study, Soil Biol. Biochem., 129, 201–211, https://doi.org/10.1016/j.soilbio.2018.10.009, 2019.
R Core Team: R: A Language and Environment for Statistical Computing, R Foundation for Statistical Computing, Vienna, Austria, https://www.R-project.org/ (last access: 1 April 2023), 2021.
Rantanen, M., Karpechko, A. Y., Lipponen, A., Nordling, K., Hyvärinen, O., Ruosteenoja, K., Vihma, T., and Laaksonen, A.: The Arctic has warmed nearly four times faster than the globe since 1979, Commun. Earth Environ., 3, 1–10, https://doi.org/10.1038/s43247-022-00498-3, 2022.
Robertson, G. P., Coleman, D. C., Sollins, P., and Bledsoe, C. S.: Standard Soil Methods for Long-term Ecological Research, Oxford University Press, Inc., 481 pp., ISBN: 0-19-512083-3, 1999.
Rößger, N., Sachs, T., Wille, C., Boike, J., and Kutzbach, L.: Seasonal increase of methane emissions linked to warming in Siberian tundra, Nat. Clim. Change, 12, 1031–1036, https://doi.org/10.1038/s41558-022-01512-4, 2022.
Schädel, C., Schuur, E. A. G., Bracho, R., Elberling, B., Knoblauch, C., Lee, H., Luo, Y., Shaver, G. R., and Turetsky, M. R.: Circumpolar assessment of permafrost C quality and its vulnerability over time using long-term incubation data, Glob. Change Biol., 20, 641–652, https://doi.org/10.1111/gcb.12417, 2014.
Schädel, C., Beem-Miller, J., Aziz Rad, M., Crow, S. E., Hicks Pries, C. E., Ernakovich, J., Hoyt, A. M., Plante, A., Stoner, S., Treat, C. C., and Sierra, C. A.: Decomposability of soil organic matter over time: the Soil Incubation Database (SIDb, version 1.0) and guidance for incubation procedures, Earth Syst. Sci. Data, 12, 1511–1524, https://doi.org/10.5194/essd-12-1511-2020, 2020.
Schirrmeister, L., Kunitsky, V., Grosse, G., Wetterich, S., Meyer, H., Schwamborn, G., Babiy, O., Derevyagin, A., and Siegert, C.: Sedimentary characteristics and origin of the Late Pleistocene Ice Complex on north-east Siberian Arctic coastal lowlands and islands – A review, Quaternary Int., 241, 3–25, https://doi.org/10.1016/j.quaint.2010.04.004, 2011.
Schirrmeister, L., Froese, D., Tumskoy, V., Grosse, G., and Wetterich, S.: PERMAFROST AND PERIGLACIAL FEATURES – Yedoma: Late Pleistocene Ice-Rich Syngenetic Permafrost of Beringia, in: Encyclopedia of Quaternary Science, Elsevier, 542–552, https://doi.org/10.1016/B978-0-444-53643-3.00106-0, 2013.
Schneider, J., Grosse, G., and Wagner, D.: Land cover classification of tundra environments in the Arctic Lena Delta based on Landsat 7 ETM+ data and its application for upscaling of methane emissions, Remote Sens. Environ., 113, 380–391, https://doi.org/10.1016/j.rse.2008.10.013, 2009.
Schuur, E. a. G., McGuire, A. D., Schädel, C., Grosse, G., Harden, J. W., Hayes, D. J., Hugelius, G., Koven, C. D., Kuhry, P., Lawrence, D. M., Natali, S. M., Olefeldt, D., Romanovsky, V. E., Schaefer, K., Turetsky, M. R., Treat, C. C., and Vonk, J. E.: Climate change and the permafrost carbon feedback, Nature, 520, 171–179, https://doi.org/10.1038/nature14338, 2015.
Schwamborn, G., Rachold, V., and Grigoriev, M. N.: Late Quaternary sedimentation history of the Lena Delta, Quaternary Int., 89, 119–134, https://doi.org/10.1016/S1040-6182(01)00084-2, 2002.
Serreze, M. C., Walsh, J. E., Chapin, F. S., Osterkamp, T., Dyurgerov, M., Romanovsky, V., Oechel, W. C., Morison, J., Zhang, T., and Barry, R. G.: Observational Evidence of Recent Change in the Northern High-Latitude Environment, Climatic Change, 46, 159–207, https://doi.org/10.1023/A:1005504031923, 2000.
Siewert, M. B., Hugelius, G., Heim, B., and Faucherre, S.: Landscape controls and vertical variability of soil organic carbon storage in permafrost-affected soils of the Lena River Delta, CATENA, 147, 725–741, https://doi.org/10.1016/j.catena.2016.07.048, 2016.
Soil Survey Staff: Keys to Soil Taxonomy, 12th Edn., Twelfth Edition, USDA-Natural Resources Conservation Service, Washington, DC, 360 pp., ISBN: 978-0-359-57324-0, 2014.
Spencer, R. G. M., Mann, P. J., Dittmar, T., Eglinton, T. I., McIntyre, C., Holmes, R. M., Zimov, N., and Stubbins, A.: Detecting the signature of permafrost thaw in Arctic rivers, Geophys. Res. Lett., 42, 2830–2835, https://doi.org/10.1002/2015GL063498, 2015.
Strauss, J., Schirrmeister, L., Grosse, G., Wetterich, S., Ulrich, M., Herzschuh, U., and Hubberten, H.-W.: The deep permafrost carbon pool of the Yedoma region in Siberia and Alaska, Geophys. Res. Lett., 40, 6165–6170, https://doi.org/10.1002/2013GL058088, 2013a.
Strauss, J., Schirrmeister, L., Grosse, G., Wetterich, S., Ulrich, M., Herzschuh, U., and Hubberten, H.-W.: The deep permafrost carbon pool of the Yedoma region in Siberia and Alaska, Geophys. Res. Lett., 40, 6165–6170, https://doi.org/10.1002/2013GL058088, 2013b.
Symons, G. E. and Buswell, A. M.: The methane fermentation of carbohydrates, J. Am. Chem. Soc., 55, 2028–2036, 1993.
Tabari, H.: Climate change impact on flood and extreme precipitation increases with water availability, Sci. Rep., 10, 13768, https://doi.org/10.1038/s41598-020-70816-2, 2020.
Thauer, R. K.: Biochemistry of methanogenesis: a tribute to Marjory Stephenson:1998 Marjory Stephenson Prize Lecture, Microbiology, 144, 2377–2406, https://doi.org/10.1099/00221287-144-9-2377, 1998.
Theisen, A. R. and Murrell, J. C.: Facultative Methanotrophs Revisited, J. Bacteriol., 187, 4303–4305, https://doi.org/10.1128/JB.187.13.4303-4305.2005, 2005.
Treat, C. C., Natali, S. M., Ernakovich, J., Iversen, C. M., Lupascu, M., McGuire, A. D., Norby, R. J., Roy Chowdhury, T., Richter, A., Šantrůčková, H., Schädel, C., Schuur, E. A. G., Sloan, V. L., Turetsky, M. R., and Waldrop, M. P.: A pan-Arctic synthesis of CH4 and CO2 production from anoxic soil incubations, Glob. Change Biol., 21, 2787–2803, https://doi.org/10.1111/gcb.12875, 2015.
Treat, C. C., Marushchak, M. E., Voigt, C., Zhang, Y., Tan, Z., Zhuang, Q., Virtanen, T. A., Räsänen, A., Biasi, C., Hugelius, G., Kaverin, D., Miller, P. A., Stendel, M., Romanovsky, V., Rivkin, F., Martikainen, P. J., and Shurpali, N. J.: Tundra landscape heterogeneity, not interannual variability, controls the decadal regional carbon balance in the Western Russian Arctic, Glob. Change Biol., 24, 5188–5204, https://doi.org/10.1111/gcb.14421, 2018.
Turetsky, M. R., Abbott, B. W., Jones, M. C., Walter Anthony, K., Olefeldt, D., Schuur, E. A. G., Koven, C., McGuire, A. D., Grosse, G., Kuhry, P., Hugelius, G., Lawrence, D. M., Gibson, C., and Sannel, A. B. K.: Permafrost collapse is accelerating carbon release, Nature, 569, 32–34, https://doi.org/10.1038/d41586-019-01313-4, 2019.
Wagner, D., Gattinger, A., Embacher, A., Pfeiffer, E.-M., Schloter, M., and Lipski, A.: Methanogenic activity and biomass in Holocene permafrost deposits of the Lena Delta, Siberian Arctic and its implication for the global methane budget, Glob. Change Biol., 13, 1089–1099, https://doi.org/10.1111/j.1365-2486.2007.01331.x, 2007.
Waldrop, M. P., Wickland, K. P., White Iii, R., Berhe, A. A., Harden, J. W., and Romanovsky, V. E.: Molecular investigations into a globally important carbon pool: permafrost-protected carbon in Alaskan soils, Glob.Change Biol., 16, 2543–2554, https://doi.org/10.1111/j.1365-2486.2009.02141.x, 2010.
Walz, J., Knoblauch, C., Böhme, L., and Pfeiffer, E.-M.: Regulation of soil organic matter decomposition in permafrost-affected Siberian tundra soils – Impact of oxygen availability, freezing and thawing, temperature, and labile organic matter, Soil Biol. Biochem., 110, 34–43, https://doi.org/10.1016/j.soilbio.2017.03.001, 2017.
Walz, J., Knoblauch, C., Tigges, R., Opel, T., Schirrmeister, L., and Pfeiffer, E.-M.: Greenhouse gas production in degrading ice-rich permafrost deposits in northeastern Siberia, Biogeosciences, 15, 5423–5436, https://doi.org/10.5194/bg-15-5423-2018, 2018.
Wang, P., Huang, Q., Tang, Q., Chen, X., Yu, J., Pozdniakov, S. P., and Wang, T.: Increasing annual and extreme precipitation in permafrost-dominated Siberia during 1959–2018, J. Hydrol., 603, 126865, https://doi.org/10.1016/j.jhydrol.2021.126865, 2021.
Washburn, A. L.: Periglacial processes and environment, St. Martin's Press, New York, Hodder & Stoughton Educational, ISBN 10: 0713156538, 1973.
Westermann, P.: Temperature regulation of methanogenesis in wetlands, Chemosphere, 26, 321–328, https://doi.org/10.1016/0045-6535(93)90428-8, 1993.
Yavitt, J. B., Williams, C. J., and Wieder, R. K.: Production of methane and carbon dioxide in peatland ecosystems across North America: Effects of temperature, aeration, and organic chemistry of peat, Geomicrobiol. J., 14, 299–316, https://doi.org/10.1080/01490459709378054, 1997.
Yavitt, J. B., Basiliko, N., Turetsky, M. R., and Hay, A. G.: Methanogenesis and Methanogen Diversity in Three Peatland Types of the Discontinuous Permafrost Zone, Boreal Western Continental Canada, Geomicrobiol. J., 23, 641–651, https://doi.org/10.1080/01490450600964482, 2006.
Zhu, X., Wu, T., Li, R., Xie, C., Hu, G., Qin, Y., Wang, W., Hao, J., Yang, S., Ni, J., and Yang, C.: Impacts of Summer Extreme Precipitation Events on the Hydrothermal Dynamics of the Active Layer in the Tanggula Permafrost Region on the Qinghai-Tibetan Plateau, J. Geophys. Res.-Atmos., 122, 11549–11567, https://doi.org/10.1002/2017JD026736, 2017.