the Creative Commons Attribution 4.0 License.
the Creative Commons Attribution 4.0 License.
 | 22 Jun 2023
Dynamics of short-term ecosystem carbon fluxes induced by precipitation events in a semiarid grassland
Josué Delgado-Balbuena
Henry W. Loescher
Carlos A. Aguirre-Gutiérrez
Teresa Alfaro-Reyna
Luis F. Pineda-Martínez
Rodrigo Vargas
Tulio Arredondo
Infrequent and small precipitation (PPT) events characterize PPT patterns in semiarid grasslands; however, plants and soil microorganisms are adapted to use the unpredictable small pulses of water. Several studies have shown short-term responses of carbon and nitrogen mineralization rates (called the “priming effect” or the Birch effect) stimulated by wet–dry cycles; however, dynamics, drivers, and the contribution of the priming effect to the annual C balance are poorly understood. Thus, we analyzed 6 years of continuous net ecosystem exchange measurements to evaluate the effect of the PPT periodicity and magnitude of individual PPT events on the daily/annual net ecosystem C exchange (NEE) in a semiarid grassland. We included the period between PPT events, previous daytime NEE rate, and previous soil moisture content as the main drivers of the priming effect. Ecosystem respiration (ER) responded within a few hours following a PPT event, whereas it took 5–9 d for gross ecosystem exchange (GEE; where −NEE = GEE + ER) to respond. Precipitation events as low as 0.25 mm increased ER, but cumulative PPT > 40 mm infiltrating deep into the soil profile stimulated GEE. Overall, ER fluxes following PPT events were related to the change in soil water content at shallow depth and previous soil conditions (e.g., previous NEE rate, previous soil water content) and the size of the stimulus (e.g., PPT event size). Carbon effluxes from the priming effect accounted for less than 5 % of ecosystem respiration but were significantly high with respect to the carbon balance. In the long term, changes in PPT regimes to more intense and less frequent PPT events, as expected due to the effects of climate change, could convert the semiarid grassland from a small C sink to a C source.
- Article
(5081 KB) - Full-text XML
- BibTeX
- EndNote


Arid lands comprise many ecosystem types covering more than 30 % of terrestrial land (Lal, 2004). In these ecosystems annual potential evapotranspiration is larger than yearly precipitation due to regional atmospheric high-pressure zones (i.e., Hadley cells), continental winds, cold oceanic winds, and local orographic effects that reduce the precipitation (PPT) amounts (Maliva and Missimer, 2012). Here, PPT occurs as infrequent, discrete, small (< 5 mm), and unpredictable events (Noy-Meir, 1973; Loik et al., 2004). This results in water-limited ecosystems, where biological activity is restricted to periods of soil water availability (Lauenroth and Sala, 1992). Consequently, the productivity and stability of these ecosystems are more vulnerable to changes in climate, particularly to changes in the historic mean annual PPT amounts (MAP; Wang et al., 2021) and the change in the periodicity (i.e., frequency) of these PPT events (Korell et al., 2021; Nielsen and Ball, 2015).
Precipitation stimulates short-term changes in carbon and nitrogen mineralization rates because soil microorganisms activate with increased soil water content (Turner and Haygarth, 2001). This “priming effect” (Borken and Matzner, 2009), also called the Birch effect (Birch, 1964), describes the soil carbon released from the decomposition of heterotrophic sources to the atmosphere following soil rewetting. The amount and timing of PPT events modify the magnitude and duration of the priming effect by modulating soil wet–dry cycles. The size of a PPT event determines the temporal duration and the biotic components that respond to the pulse (Huxman et al., 2004a), thus defining the magnitude and direction of CO2 effluxes (Chen et al., 2019). In general, small precipitation events that induce changes in soil humidity at shallow depths do not induce plant activity but activate soil microorganisms (Collins et al., 2008) and consequently enhance CO2 effluxes (Vargas et al., 2012). On the other hand, successive rewetting cycles reduce carbon mineralization rates as the amount of available organic labile carbon declines (Jarvis et al., 2007). Thus, PPT events after long drought periods (until 9 months in semiarid grassland) trigger larger and longer soil respiration efflux rates than consecutive PPT events (Reichmann et al., 2013; Vargas et al., 2018).
At the ecosystem scale, deserts and grasslands have shown larger CO2 efflux rates after rewetting than temperate ecosystems or croplands (Kim et al., 2012) and in ecosystems with low soil organic carbon content (Bastida et al., 2019). Characteristics and dynamics of these short-term soil C effluxes were addressed by the “threshold-delay” model (T-D model; Ogle and Reynolds, 2004). The T-D model takes previous environmental conditions, PPT event size, PPT thresholds, and time delays to inform the time constants that modulate ecosystem responses after a PPT event. Moreover, Huxman et al. (2004a) described the dynamics of the net ecosystem exchange of carbon (NEE) and its components (gross ecosystem exchange (GEE) and ecosystem respiration (ER), such as –NEE = GEE + ER) with parameters of the T-D model (Fig. A1 in the Appendix). GEE and ER have different time delays based on threshold PPT quantities and event size, with ER responding to smaller PPT events than GEE (Huxman et al., 2004a). In addition, GEE and ER have asymptotic responses to large PPT events (the upper PPT thresholds), with an upper ER threshold lower than that found for GEE (Huxman et al., 2004b).
In the semiarid grasslands of Mexico, small PPT events likely activate biological soil crusts (BSCs) that cover up to 60 % of plant interspaces (Concostrina-Zubiri et al., 2014) and stimulate ER instead of C uptake. However, Bouteloua gracilis H.B.K. Lag. ex Steud (blue grama), the keystone species in the semiarid grassland of Mexico (Medina-Roldán et al., 2007), may contribute to C uptake because of its adaptations to take advantage of small PPT events (Sala and Lauenroth, 1982; Medina-Roldán et al., 2013). Understanding disturbances of ecosystem processes (C fluxes) due to changing regional PPT patterns in semiarid grasslands is particularly salient given that the global circulation models forecast between a 10 % and 30 % reduction in summer and winter precipitation, respectively, by the end of the 21st century (Christensen et al., 2007). Furthermore, PPT patterns are expected to have fewer events with more water quantity per event (Easterling et al., 2000).
The objective of this study was to evaluate the effect of PPT periodicity and the magnitude of individual PPT events and a priori soil moisture conditions on daily and annual ecosystem C balance (NEE) for the semiarid grassland in Mexico. Over a 6-year study period, we examined event-based PPT amount, the period between PPT events, and the previous daytime NEE rate and soil water content at two depths as the main drivers of daily mean NEE change rate. Because we were interested in short-term NEE changes and their components, only short-term NEE changes within a few days following a PPT event were evaluated. Effects on daily mean GEE (GEE = –NEE + ER) were also evaluated at the beginning of the growing season. Based on the T-D model (Ogle and Reynolds, 2004), we expect that (1) semiarid grassland will exhibit a quick response (short time delay) to small PPT events (low PPT threshold) through positive NEE fluxes (C release, H1). Moreover, (2) ER and GEE (C release and C uptake, respectively) will differ in their response times and PPT thresholds, with shorter time delays and lower PPT thresholds for ER than GEE (H2). This response is because small PPT events should enhance ER mainly through heterotrophic respiration of soil surface microorganisms that are activated within 1 h after wetting (Placella et al., 2012), whereas larger PPT events are required to reach roots at deeper soil profiles and longer times for plants to start growing. On the other hand, we expect that (3) the size and timing of PPT patterns will modulate the magnitude of C efflux; therefore, large precipitation events after long dry periods will release more CO2 than small or consecutive PPT events (H3). Finally, we expect (4) C efflux after PPT events will be a meaningful CO2 source to the atmosphere in the semiarid grassland, decreasing the ecosystem's annual net C uptake (H4).
2.1 Site description
The study site is located on a shortgrass steppe within the Llanos de Ojuelos subprovince of the state of Jalisco, Mexico. The shortgrass biome in Mexico extends from the North American Midwest along a strip that follows the Sierra Madre Occidental through the Chihuahuan Desert into the subprovince Llanos de Ojuelos. Vegetation is dominated by grasses, with Bouteloua gracilis (Willd. ex Kunth) Lag. ex Griffiths as the key grass species, forming near mono-specific stands. The region has a semiarid climate with mean annual precipitation of 424 mm ± 11 mm (last 30 years, Delgado-Balbuena et al., 2019) distributed mainly between June and September and with 6–9 months of low PPT. Winter–summer rain accounts for < 20 % of annual precipitation (Delgado-Balbuena et al., 2019). The mean annual temperature is 17.5 ± 0.5 ∘C. The topography is characterized by valleys and gentle rolling hills with soils classified as Haplic Xerosols (associated with Lithosols and Eutric Planosols) and Haplic Phaeozems (associated with Lithosols) (Aguado-Santacruz, 1993). Soils are shallow, with an average depth of 0.3–0.4 m containing a cemented layer at ∼ 0.5 m deep, with textures dominated by silty clay and sandy loam soils (Aguado-Santacruz, 1993).
The study site is a fenced area of ∼ 64 ha of semiarid grassland under grazing management. A 6 m high tower was placed at the center of the area of interest to support carbon–energy flux measurements and meteorological instruments. That location allowed an ever-changing and integrated measurement footprint of 320, 410, 580, and 260 m from the tower according to the N, E, S, and W orientations, respectively. The study site is part of the MexFlux network (Vargas et al., 2013).
2.2 Meteorological and soil measurements
Meteorological data were collected continuously at a rate of 1 s and averaged at 30 min intervals using a datalogger (CR3000, Campbell Scientific Inc., Logan, UT). Variables measured included air temperature and relative humidity (HMP45C, Vaisala, Helsinki, Finland) housed into a radiation shield (R.M. Young Company Inc., Traverse City, MI), incident and reflected shortwave and longwave solar radiation (NR01, Hukseflux, the Netherlands), and photosynthetic photon flux density (PPFD; PAR LITE, Kipp & Zonen, Delft, the Netherlands). Soil variables were measured at a 5 min frequency and averaged at 30 min intervals. These included volumetric soil water content (CS616, Campbell Scientific Inc., Logan, UT) positioned horizontally to 2.5 and 15 cm deep, average soil temperature of the top 8 cm soil profile, and soil temperature at 5 cm deep (T108 temperature probes, Campbell Scientific Inc., Logan, UT). Soil temperature variables were acquired with another datalogger (CR510, Campbell Scientific Inc., Logan, UT). Precipitation was measured with a bucket rain gauge installed 5 m away from the tower (FTS, Victoria, British Columbia, Canada) at 1
2.3 Net ecosystem CO2 exchange measurements
An open-path eddy covariance system was placed at 3 m high to cover a fetch of 300 m and used to measure NEE over the semiarid grassland. The system consisted of a three-dimensional sonic anemometer (CSAT3, Campbell Scientific Inc., Logan, UT) for measuring wind velocity on each polar coordinate () and sonic temperature (θs) and an open-path infrared gas analyzer (IRGA; Li-7500, LI-COR Inc., Lincoln, NE) to measure CO2 and water vapor concentrations. Instruments were mounted in a tower at 3 m above the soil surface, oriented towards the prevailing winds. The IRGA sensor was mounted with a 10 cm offset from the anemometer transducers; the center of the IRGA optical path was centered with the distance between the vertically oriented sonic transducers and tilted 45∘ to avoid dust and water accumulation in the IRGA optical path. The digital signal of both sensors was recorded at a sampling rate of 10 Hz in a datalogger (CR3000, Campbell Scientific Inc., Logan, UT) (Ocheltree and Loescher 2007). NEE was estimated as
where the overbar denotes time averaging (30 min), and primes are the deviations of instantaneous values (at 10 Hz) of vertical wind speed (w′, m s−1) and molar volume of CO2 (, µmol CO2 m−3) from the block-averaged mean. Micrometeorological convention was used, where negative NEE values stand for ecosystem C uptake (Loescher et al., 2006). We did not estimate a storage flux because of the low vegetation stature and well-mixed conditions; therefore, we assumed it would be 0 over a 24 h period (Loescher et al., 2006).
2.4 Data processing
Raw eddy covariance data were processed in EdiRe (v1.5.0.10, University of Edinburgh, Edinburgh, UK). Wind velocities, sonic temperature and [CO2] and [H2O] signals were despiked (Vickers and Mahrt, 1997); any value larger than 6 standard deviations into a moving window (5 min) was considered a spike, whereas those values with a deviation larger than 8 standard deviations were flagged as outliers. A two-dimensional coordinate rotation was applied to sonic anemometer wind velocities to obtain turbulence statistics perpendicular to the local streamline. Lags between horizontal wind velocity and scalars were removed with a cross-correlation procedure to maximize the covariance among signals. Carbon and water vapor fluxes were estimated as molar fluxes () at 30 min block averages, and then they were corrected for air density fluctuations (WPL correction; Webb et al., 1980). Frequency response correction was done after Massman (2000). Sensible heat flux was estimated from the covariance between fluctuations of horizontal wind velocity (w′) and sonic temperature (). This buoyancy flux was corrected for humidity effects (Schotanus et al., 1983; Foken et al., 2012).
Fluxes were submitted to quality control procedures, namely (i) stationarity (< 50 %); (ii) integral turbulence characteristics (< 50 %); (iii) flags of IRGA and sonic anemometer (AGC value < 75, max CSAT diagnostic flag = 63), which are frequently caused by raindrops on the anemometer transducers and IRGA path; (iv) screening of flux values into expected magnitudes (± 20 ); and (v) the u∗ threshold was used to filter nighttime NEE under poorly developed turbulence. This threshold was defined through the 99 % threshold criterion after Reichstein et al. (2005); it varied seasonally among years with around 0.1 m s−1.
Temporally integrated estimates are noted throughout this paper. Because GEE cannot be measured directly, it was estimated from light-response curves (see below), whereas ER was determined from (i) light-response curves and (ii) nighttime NEE data (under PPFD < 10 light conditions). Henceforth, ecosystem respiration derived from light-response curves is denoted as ER and as nighttime NEE when derived from nighttime net ecosystem exchange data.
For identifying changes induced by PPT events in GEE and ER, daytime and nighttime NEE data on a 1 d window were adjusted with a rectangular hyperbolic response function to photosynthetic photon flux density (PPFD; Ruimy et al., 1995):
where α is the apparent quantum yield (µmol CO2 m−2 s−1 µmol photons m−2 s−1), β is the maximum photosynthetic capacity (), and ER is the ecosystem respiration (). Due to Amax being calculated to unrealistic “infinite” PPFD, we calculated a more realistic maximum photosynthetic capacity (A2500), which is the maximum photosynthesis at 2500 . Changes and transitions from ER-dominated NEE fluxes to C-gain processes (GEE) were verified with the shape of the light-response curve.
We choose this method instead of standard partitioning procedures (i.e., Reichstein et al., 2005, or Lasslop et al., 2010) because we were interested in detecting changes at a 1 d scale. Both algorithms use data windows larger than 1 d to estimate some parameters and tend to smooth fast changes in soil respiration like those observed in this study. For visually checking for changes in GEE and ER at a diel time step, 0.5 h of NEE were partitioned by Eq. (2) and then averaged by day.
2.5 Gap-filling procedures and characterization of PPT events
Data gaps shorter than 2 h were linearly interpolated, whereas gaps larger than 2 h were left as empty data. Only daytime NEE data were used for most of the analysis because nighttime NEE is subjected to quality problems like poorly developed turbulence. Moreover, if mean NEE is estimated from only a few 30 min nighttime NEE 0.5 h, the estimate may be biased if the full night cycle is not represented similarly across days. The NEE-related PPT events were selected for analysis based on data quality and availability to evenly cover the daytime cycle (on average more than 85 % of NEE data) and then averaged through the day. The daytime scale was selected to avoid confounding diurnal NEE variability and to achieve robust analyses. All precipitation events between 2011 and 2016 were isolated and filtered by the number of 0.5 h that accounted for mean daily fluxes.
Mean ER derived from nighttime NEE data was used for analysis only when more than 50 % of the data were available after QA/QC procedures. This data were exclusively used for correlation with environmental and soil data (see “Statistical analysis” section). In contrast, daytime NEE (without partitioning) was used for the analysis of changes in NEE fluxes induced by PPT events.
The C flux 1 d before the PPT event was taken as the reference C flux. The event-response effect (priming NEE effect) was measured as the difference between mean daytime NEE post-event and mean daytime NEE pre-event, described as
where NEE is the daytime NEE average (). The same method was used to calculate changes in soil water content at 2.5 and 15 cm depth (ΔVWC2.5 and ΔVWC15, respectively) and changes in photosynthetic photon flux density (ΔPPFD). Intervals between PPT events (hereafter inter-event periods, IEPs) were counted in days from the last PPT event, regardless of its magnitude.
The enhanced vegetation index (EVI) of 250 m spatial resolution and 8 d time resolution from NASA's MODIS instruments (Didan, 2021) was used to approximate plant leaf activity. The Savitzky–Golay (Yang et al., 2014) filter was used to eliminate outliers of EVI derived from adverse atmospheric conditions.
Considering that previous conditions are determinant for carbon fluxes, data were divided into fluxes dominated by photosynthesis (carbon uptake) and fluxes dominated by ecosystem respiration (carbon efflux). A threshold of −1 of average previous daytime CO2 flux was used to divide data. This was done to avoid confounding factors because the environmental drivers of photosynthesis and respiration may differ in magnitude and direction. Moreover, under photosynthetic conditions it is hard to identify if a positive change in NEE (less photosynthesis) was due to an increase in soil respiration or a dampening of photosynthesis by less available radiation under cloudy conditions.
To estimate the contribution of the priming effect to the annual carbon balance in the semiarid grassland, we averaged and extrapolated ΔNEE by the number of precipitation events per year. Decaying rates, PPT event size, and previous soil and flux conditions were not considered in this approach. Although this is a rough estimation, it provides a broad overview of how precipitation patterns influence the annual carbon balance. It is important to have this broad overview to better understand the impacts of climate change on carbon cycling in semiarid grasslands.
2.6 Statistical analysis
Boosted regression tree analysis (BRT; Elith et al., 2008) was developed to identify the most important variable controlling this response's priming C effect and thresholds. BRT analysis was also used to identify the form of function, i.e., whether the relationship between independent variables and the priming effect was linear, exponential, sigmoidal, peak shape, etc. Independent variables included PPT event size, inter-event periods (IEPs), previous and current volumetric water content (VWC), change in VWC at two depths (2.5 and 15 cm), soil temperature, previous daytime NEE, enhanced vegetation index (EVI), and change in photosynthetic photon flux density (ΔPPFD). For BRT analysis, data were divided into photosynthesis-dominated and respiration-dominated data. On the other hand, to identify delays between C fluxes (ecosystem respiration and gross primary productivity) and precipitation events, a cross-correlation analysis was done. For cross correlation, the parameter of the light-response curve was used; the ER was used to identify delays between ecosystem respiration and soil water content at 2.5 cm, and A2500 was used to identify delays between gross ecosystem productivity and soil water content at 15 cm because ER and A2500 were better correlated with soil volumetric water content at 2.5 and 15 cm, respectively. All these variables were detrended before cross-correlation analysis. Finally, linear correlation analyses were performed among environmental variables, priming effect, and nighttime NEE (ER) and among independent variables to test for autocorrelations. The gbm package (R Core Team) was used for performing BRT analysis, whereas the astsa package for R was used to conduct cross-correlation analyses.
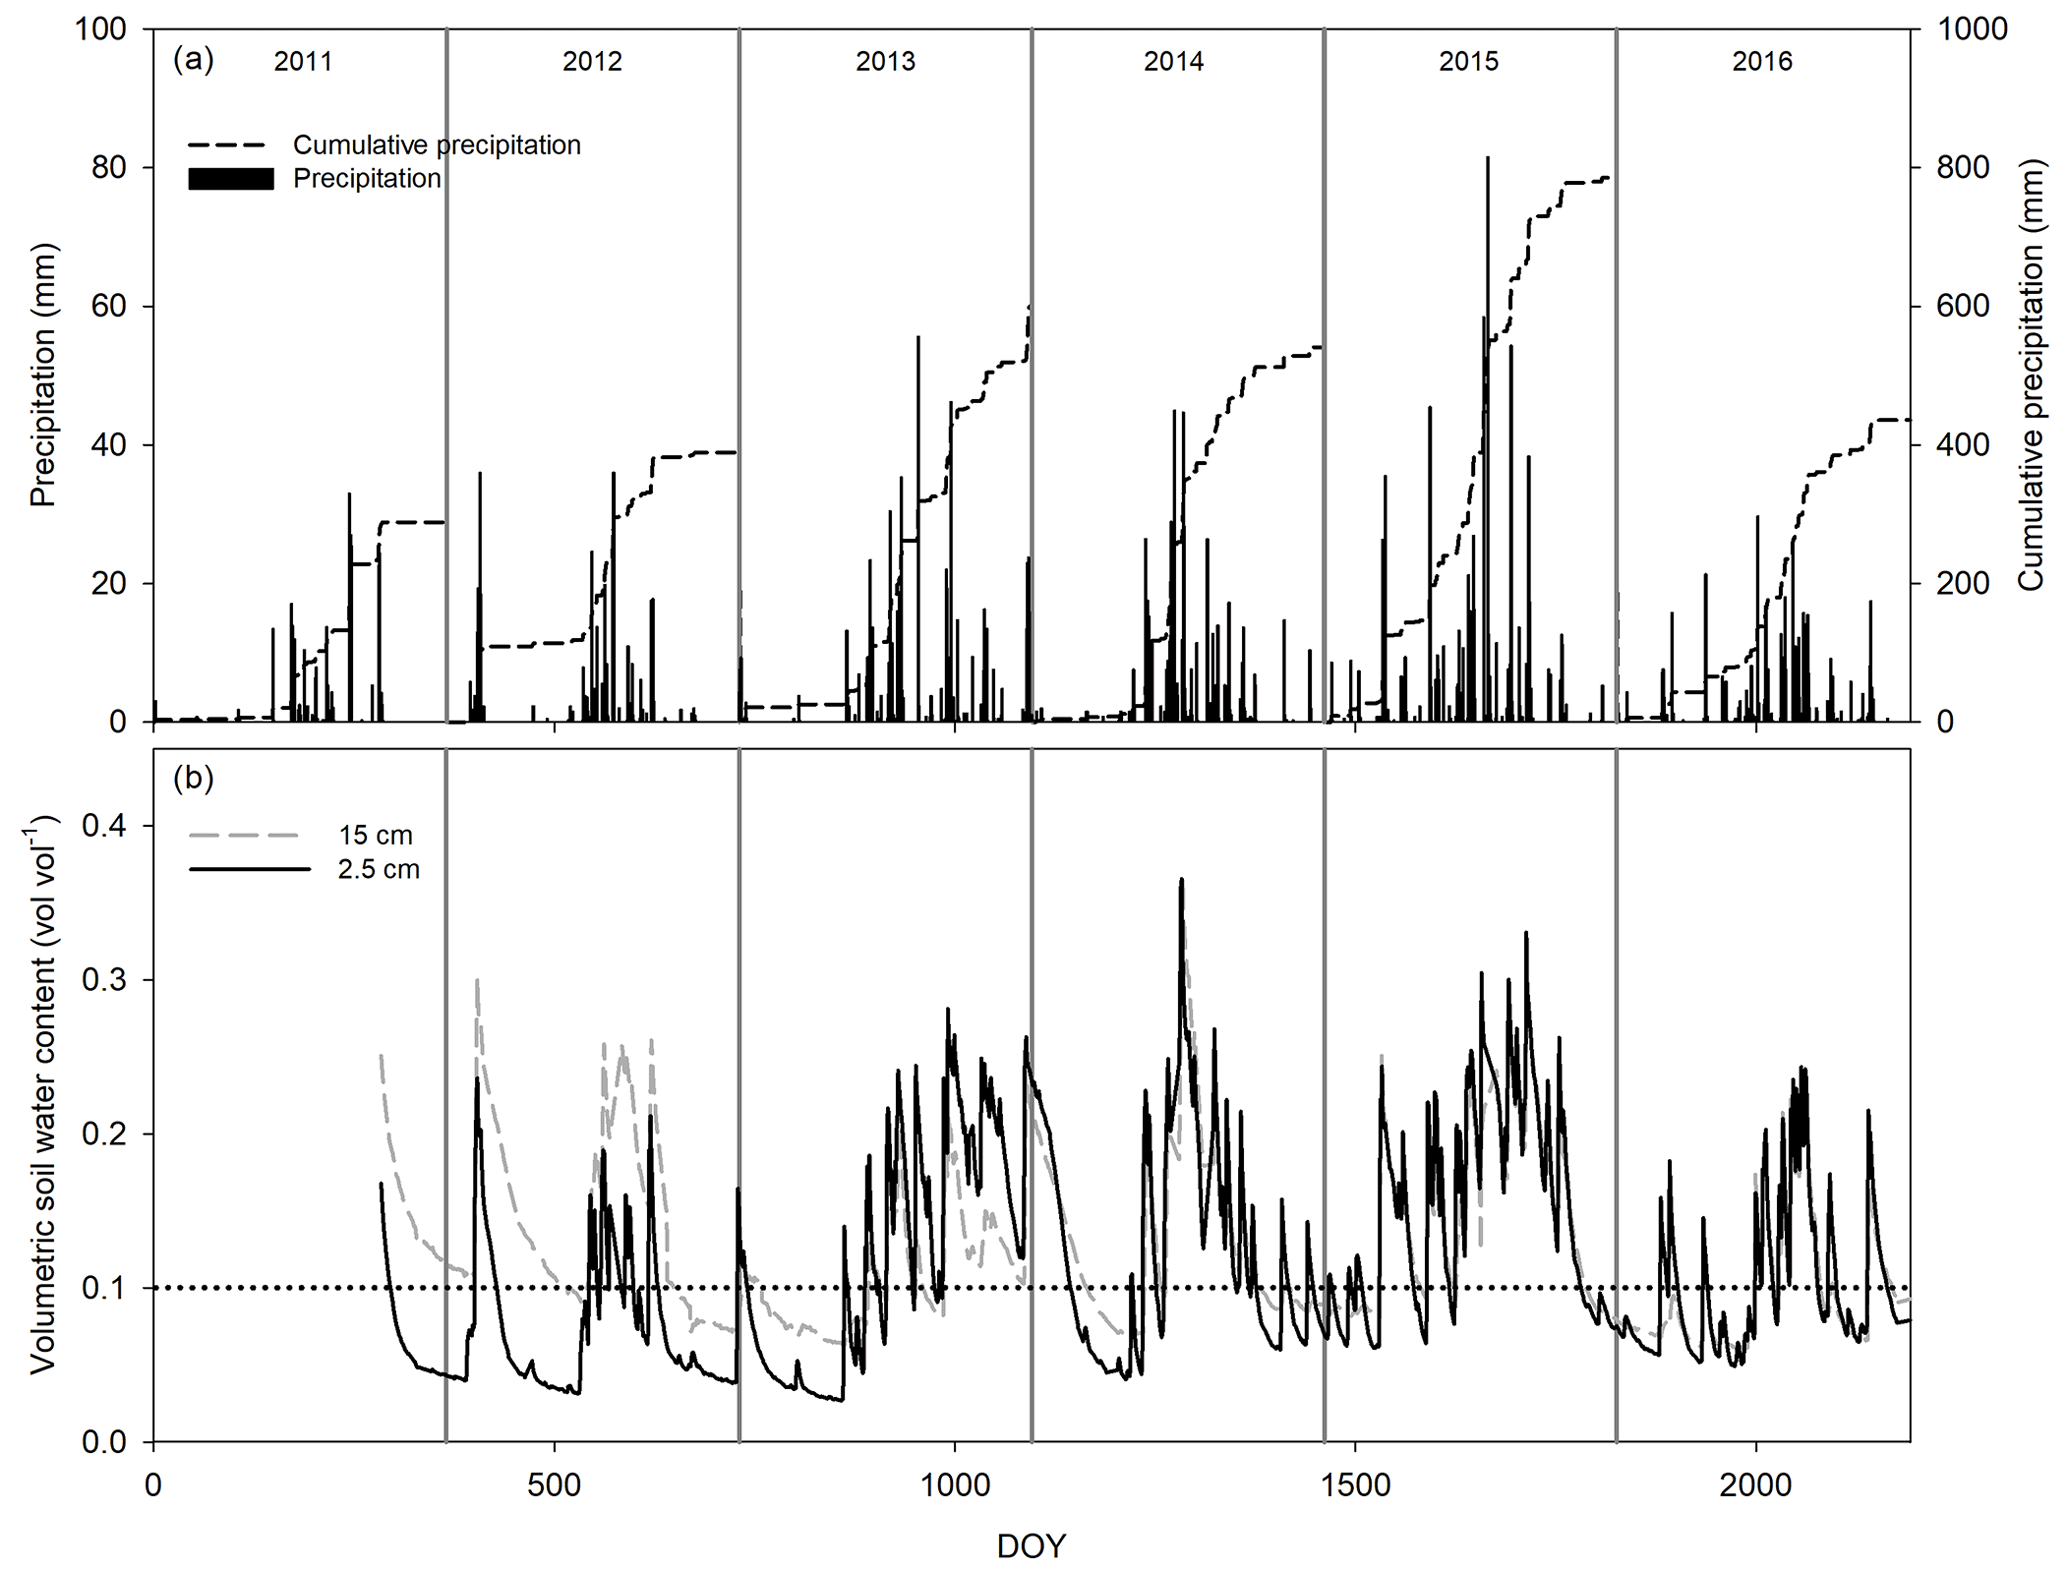
Figure 1Seasonal and interannual variation in daily precipitation and cumulative precipitation (a) and volumetric soil water content at 2.5 (black line) and 15 cm depth (gray line, b). The dotted line at 10 % of soil water content was depicted as a reference.
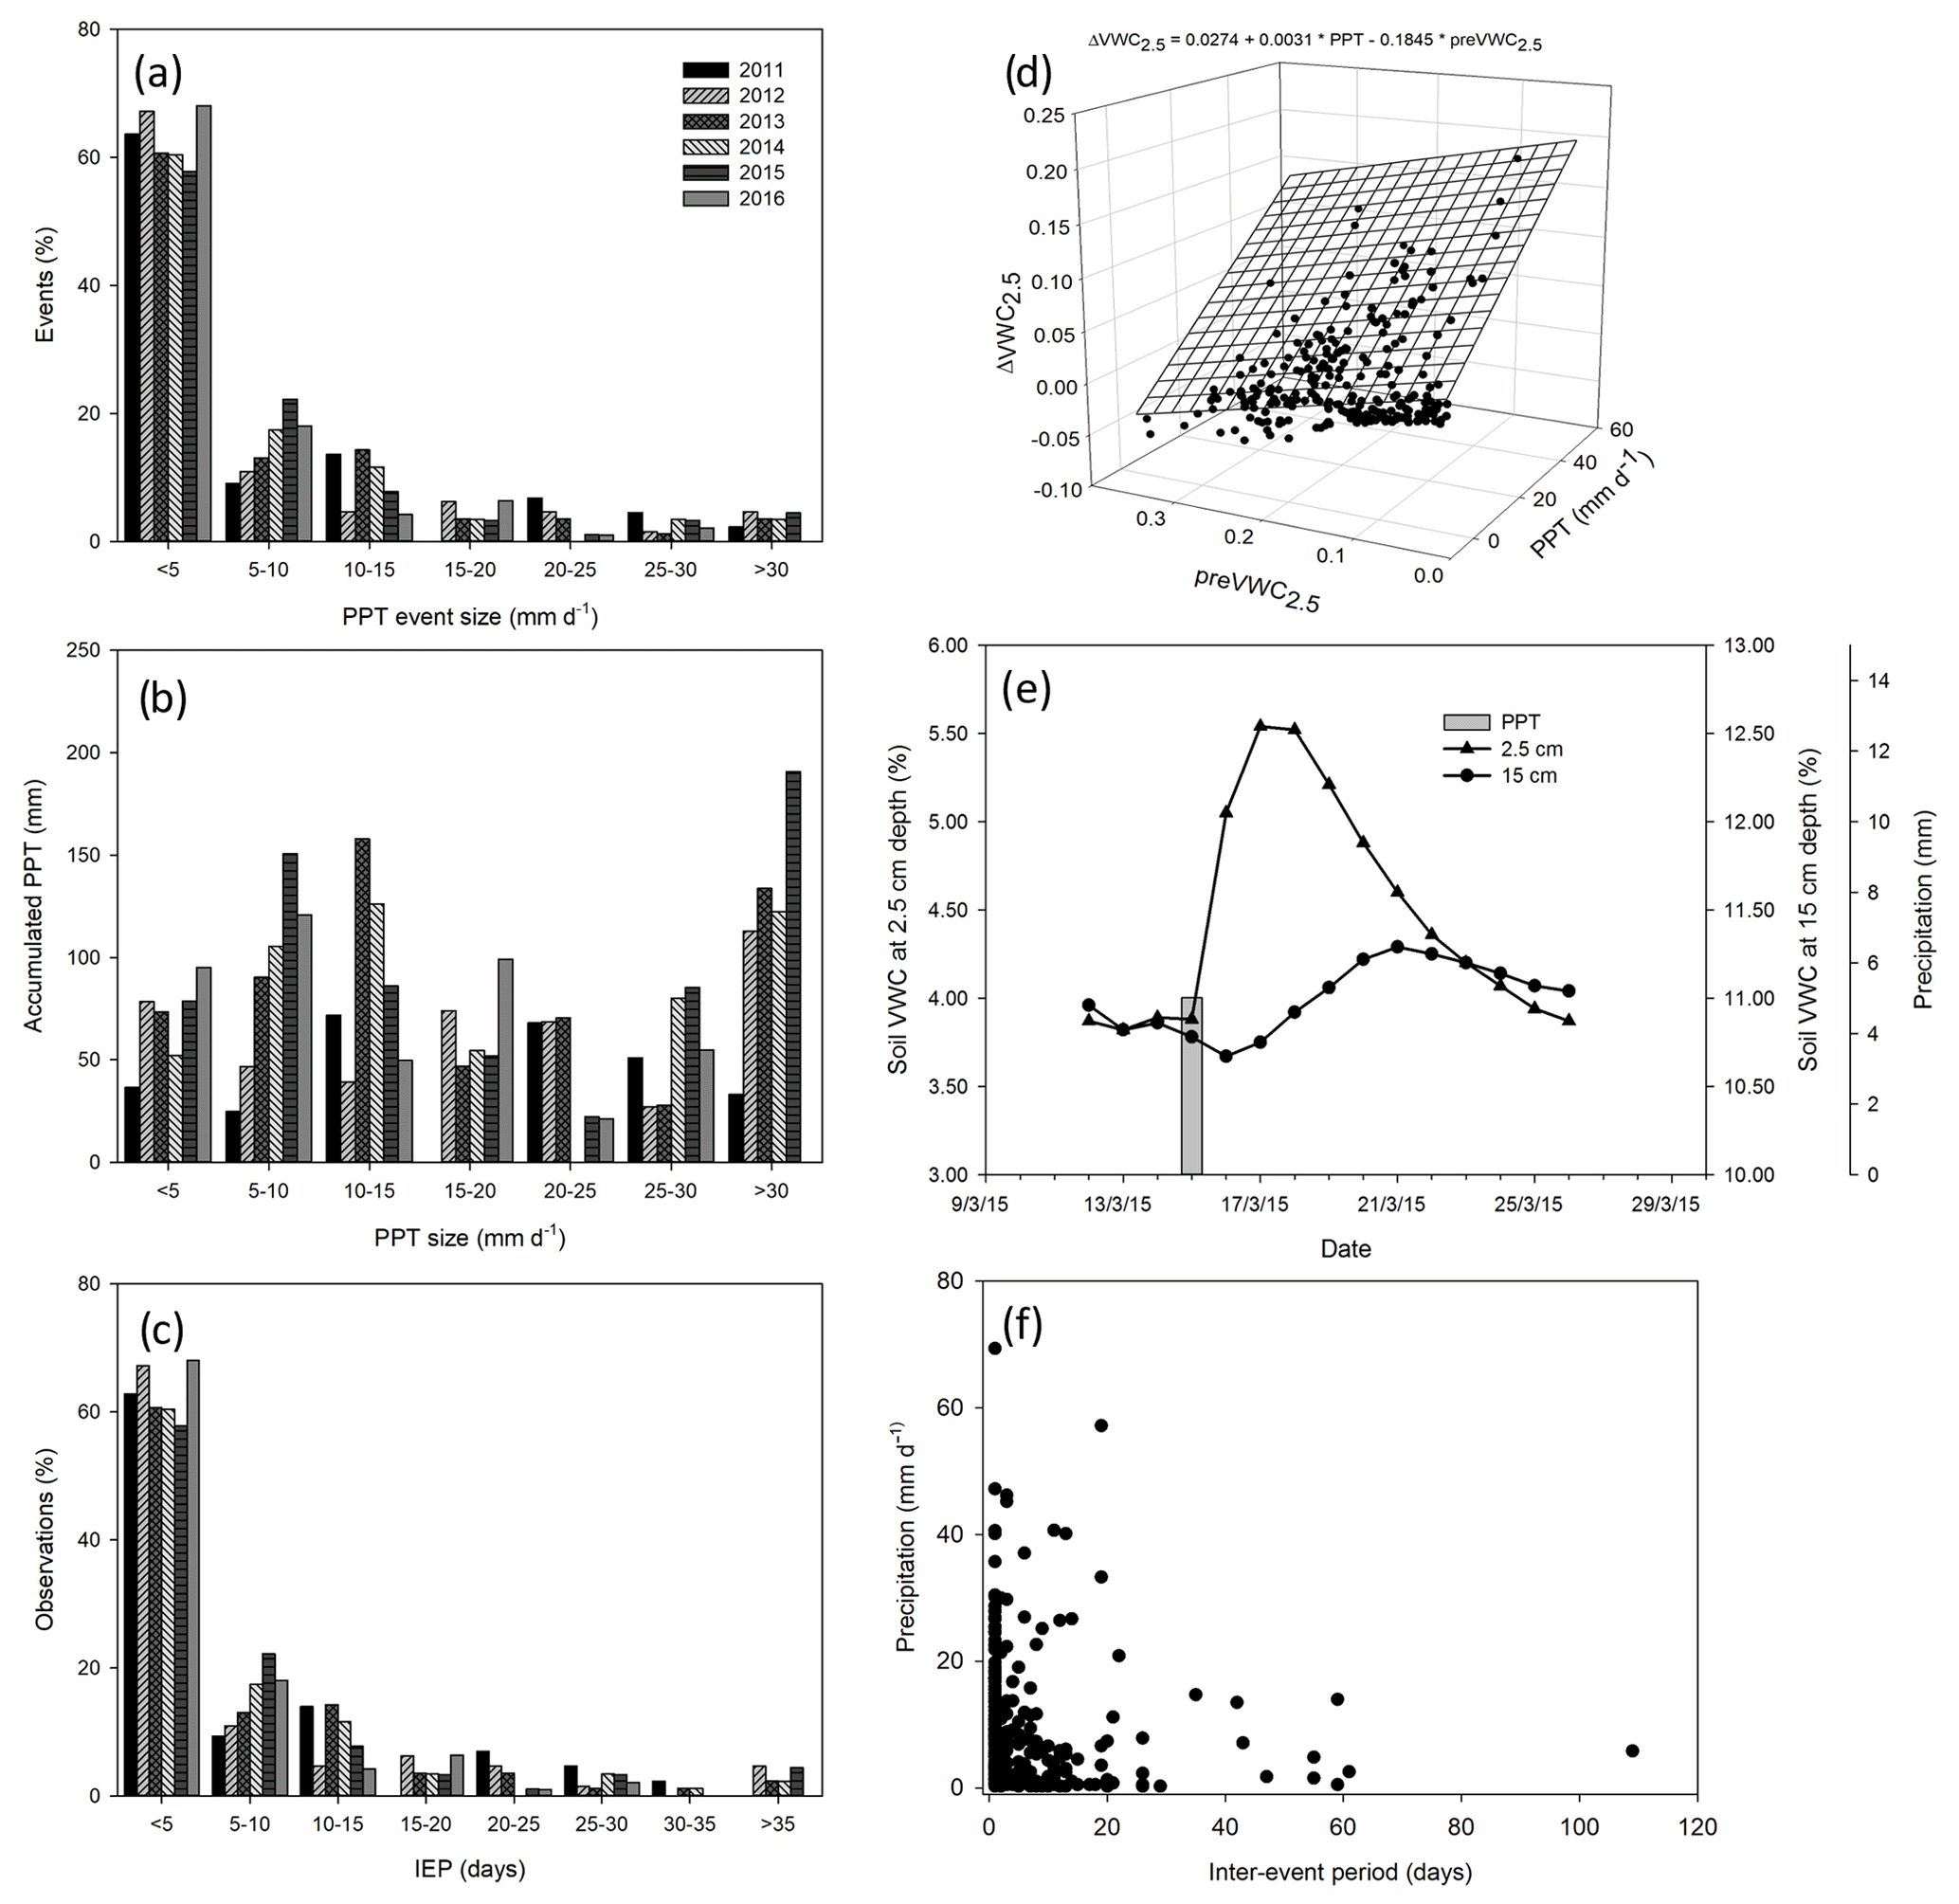
Figure 2Characterization of precipitation pattern. Histogram of the size of precipitation events through 6 years (a), the accumulated precipitation by the size of the precipitation event (b), and the number (%) of precipitation events by inter-event period classes (IEP, days; c). The relationship between the size of the precipitation event (mm d−1), previous volumetric soil water content at 2.5 cm depth (), and the change in soil volumetric water content at 2.5 cm depth () (d). Dynamic of soil water content at two depths (2.5 and 15 cm) after a precipitation event of 5 mm through the time (e) and relationship between the inter-event period and the size of the precipitation event (f).
3.1 Precipitation pattern
Cumulative precipitation for 2011 (288.5 mm) was below the 30-year average for the site (420 mm) and was the worst drought of the last 70 years. In contrast, 2012 received less PPT (393.2 mm), and 2014 and 2016 received more PPT (528.5 and 436 mm, respectively) than average, whereas 2013 (601.6 mm) and 2015 (785.9 mm) were very humid years (Fig. 1). The 6 years differed in precipitation frequency, but they were similar in the size of PPT events with ∼ 60 % of the PPT events < 5 mm (Fig. 2a). However, notwithstanding the lower proportion of larger-sized PPT events (PPT events > 5 mm), they summed a similar or an even higher amount of water than small PPT events (Fig. 2b). Overall, the precipitation pattern was characterized by short inter-event periods with 60 % of PPT events falling consecutively (IEP < 5 d; Fig. 2c).
Soil saturated after large or recurrent PPT events. Largely, soil moisture was maintained at over 10 % in the wettest years, with the largest peak reaching 40 % in the summer of 2014 (Fig. 1b). Most VWC variability was observed at 2.5 cm rather than 15 cm depth, and it was better correlated with precipitation amount per event (p < 0.05, R2 = 0.72, Fig. 2d), increasing with22 0.3 % of VWC per mm of precipitation. The PPT events of 0.25 mm increased the VWC2.5 with ∼ 1 %–2 %, but this increase lasted for less than 1 h, whereas VWC15 increased after PPT of ∼ 5 mm (data not shown). Additionally, PPT events and soil moisture dynamics at 15 cm depth were out of phase (up to 5 d between the PPT event and the VWC15 peak, Fig. 2e).
A total of 391 PPT events were isolated over the 6 years, but 34 % did not fulfill the representativity conditions of diel time representativity (> 85 % of NEE data); thus, 256 events were used for statistical analysis. A sample of 100 PPT events was used for the respiration-dominated fluxes (> −1.0 ) and 156 PPT events for the photosynthesis-dominated fluxes (< −1.0 ). Small precipitation events dominated our dataset but represented the precipitation pattern of the site well. The sample was integrated by events ranging from 0.25 to 57.1 mm and a mean of 5.7 ± 0.53 mm (mean ± 1 SE). Large PPT events occurred after short inter-event periods, and small PPT events were preceded by long inter-event periods. Medium PPT events after long inter-event periods were rare, and extremely large PPT events after long inter-event periods were not observed (Fig. 2f).
The size of the precipitation event (PPT) and previous soil water content at 2.5 cm depth (preVWC2.5) explained a large variation in the change in soil water content at 2.5 cm depth (ΔVWC2.5; R2 = 0.54; Fig. 2d). The best correlation among variables was observed between previous soil water content and soil water content at different depths, for instance, VWC15 and preVWC15 (R2 = 0.84), between the same variables but at 2.5 cm (R2 = 0.81). The change in NEE (priming effect) did not have a strong relationship with any single variable (Fig. A2).
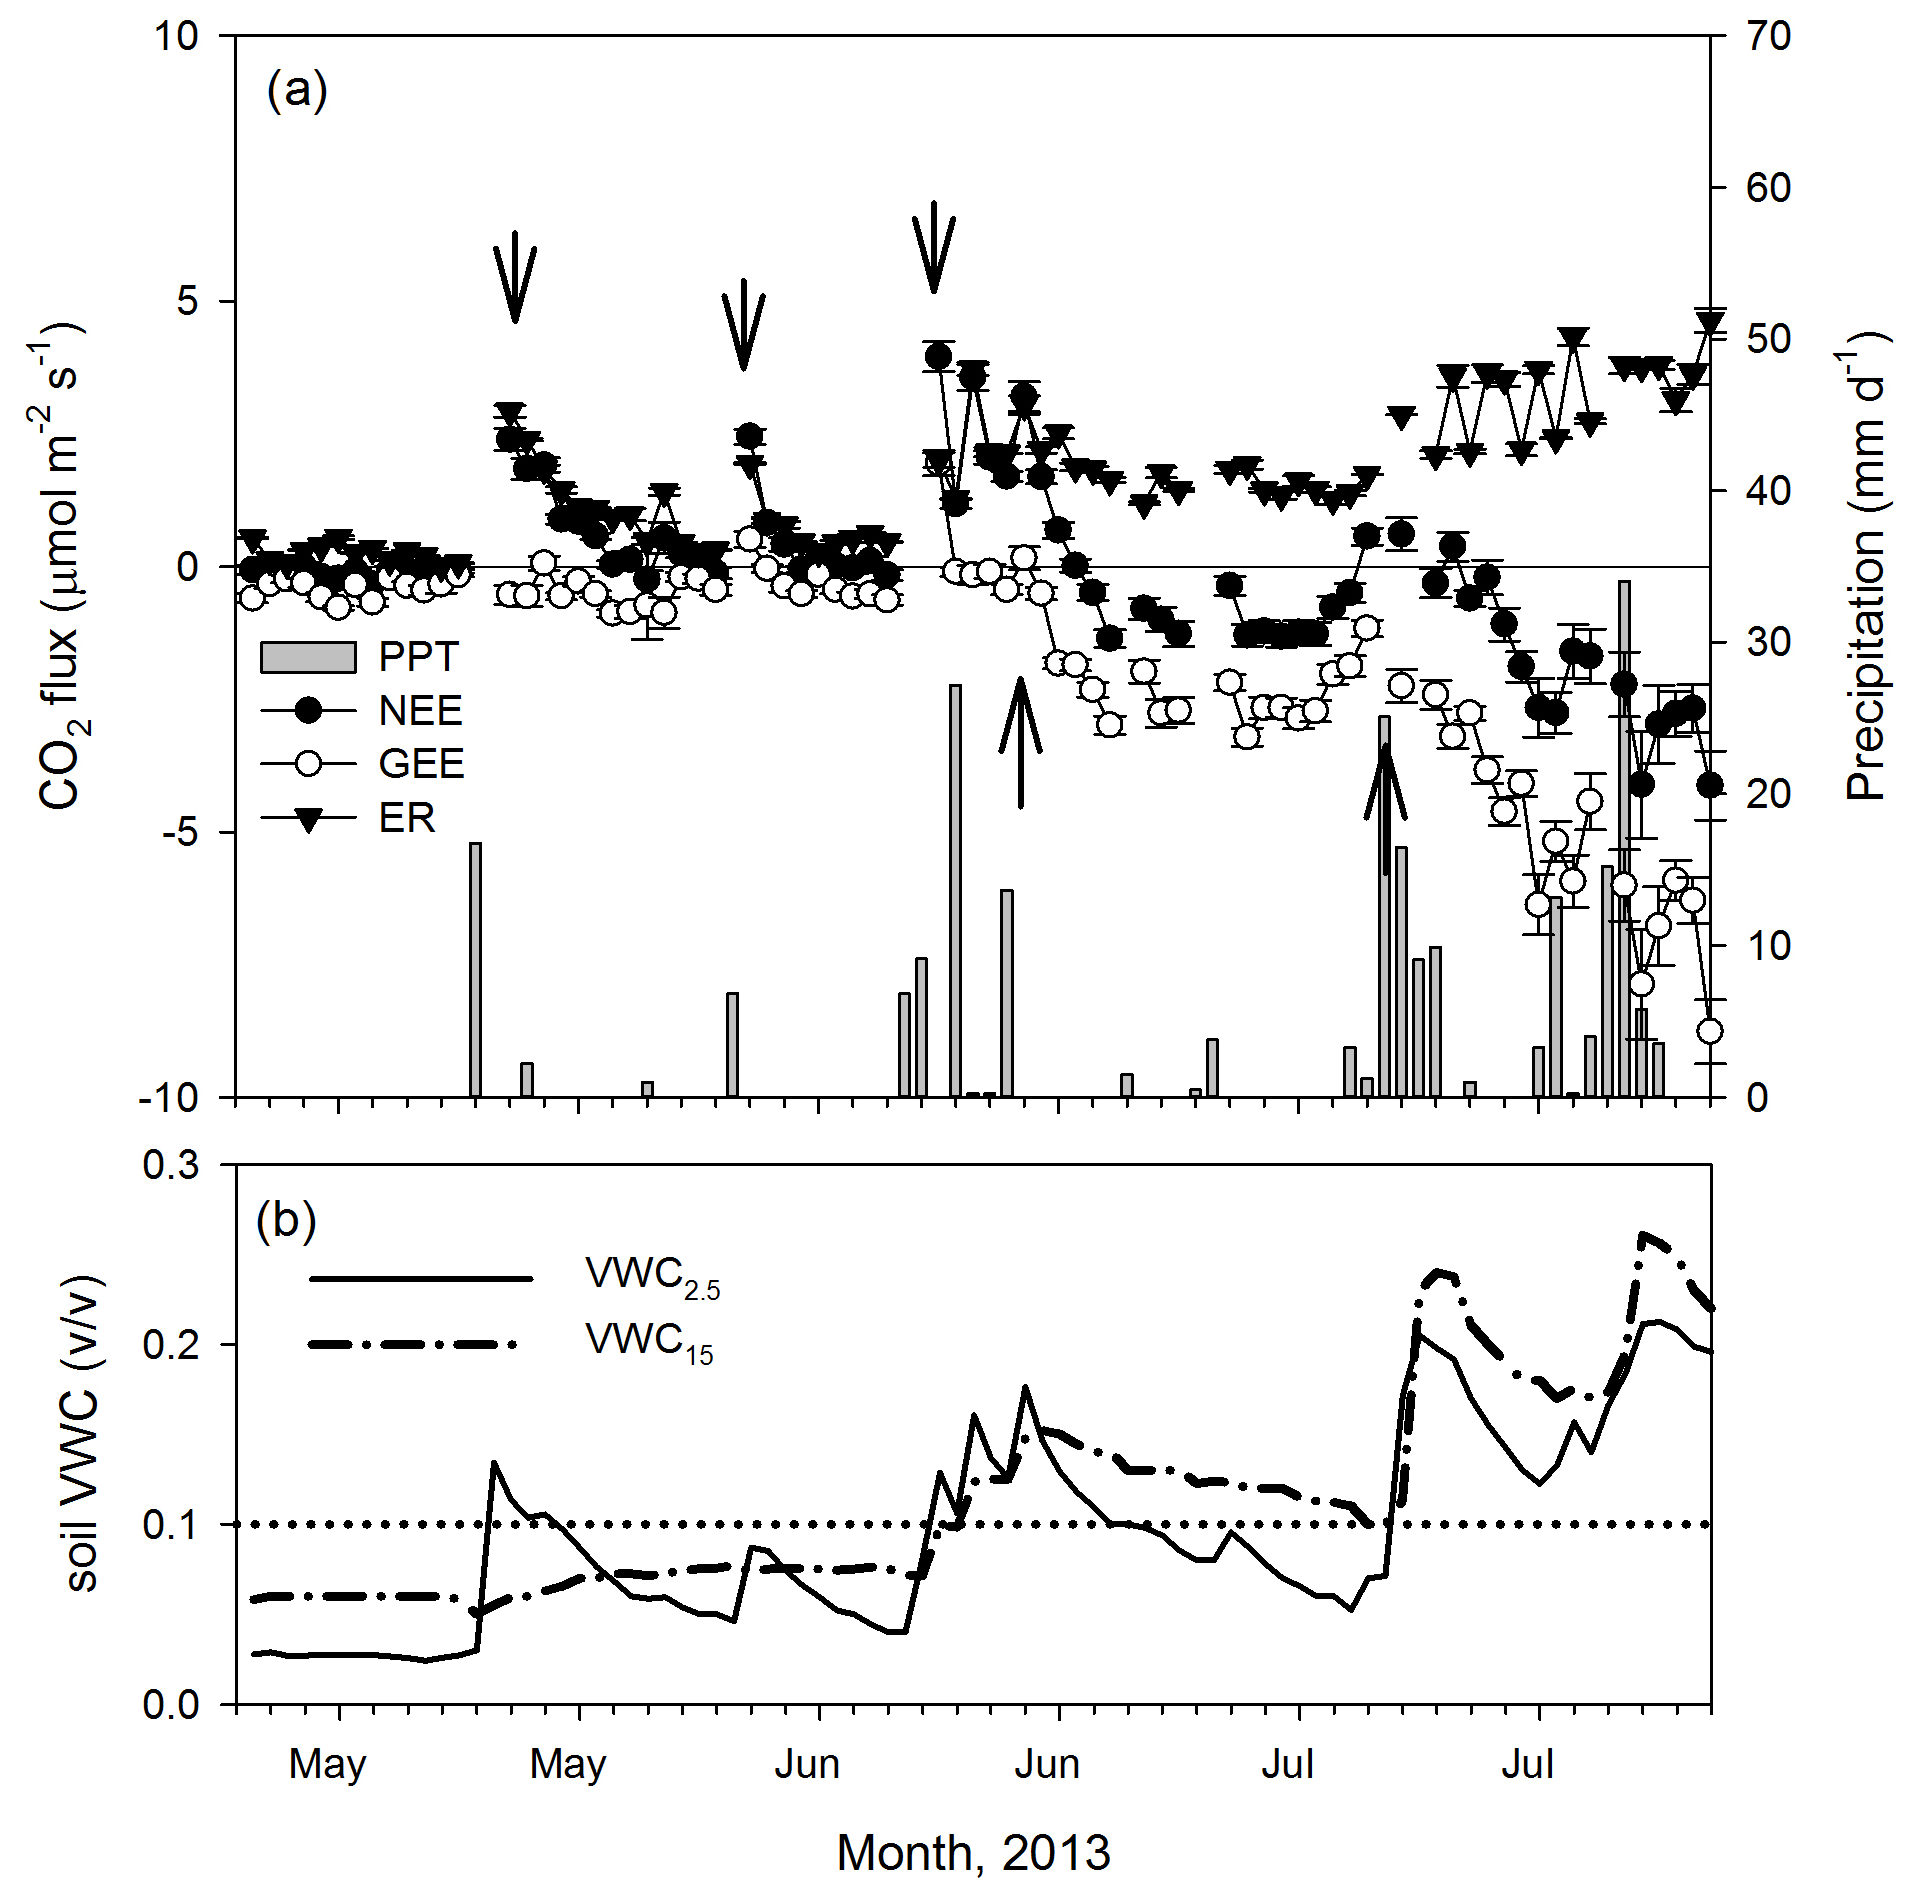
Figure 3Dynamics of (a) precipitation (mm d−1) and net ecosystem exchange (NEE, , daily means ± 1 SE) and its components, the gross ecosystem exchange (GEE, ) and ecosystem respiration (ER, ) for the transition from the dry (December–May) to the wet season (June–November) in 2013. (b) Volumetric soil water content dynamics (VWC, ) at two depths (2.5 and 15 cm). Arrows indicate apparent changes in GEE and ER trends. The dotted line indicates SWC = 0.1.
3.2 Time delays and thresholds
The minimum PPT event that altered NEE rates was 0.25 mm. Overall, the analysis of half-hourly fluxes showed an almost instantaneous positive response of NEE to the PPT event that exponentially decreased over time into 0.5 to 2 h after the PPT event (Fig. A3). The ER rates increased after 0.25 mm PPT events, but we detected a different threshold for GEE where either a larger PPT event or multiple consecutive events (e.g., > 40 mm, Fig. 2a) were needed and showed a delay of ∼ 5 d after the positive change in VWC at the 15 cm depth, this at the beginning of the growing season (Fig. 3a and b).
Cross-correlation analysis of light-response curve parameters showed no lags between ecosystem respiration (ER) and volumetric soil water content at 2.5 cm (Fig. 3a), whereas there was a lag of 9 d between photosynthetic capacity at 2500 PPFD (A2500; Fig. 3b) and soil water content, which was longer than the observed lag at several precipitation events of 2013 (Fig. 2a and b).
The BRT analysis showed sigmoidal relationships between the priming effect and environmental variables with different thresholds. At the respiration-dominated period, a minimum change in soil volumetric water content at 2.5 cm positively affected the carbon flux, but a change larger than 8 % in this variable did not induce a larger C efflux (upper threshold; Fig. 4). On the other hand, the C priming effect was larger under previous neutral NEE (preNEE ∼ 0) and decreased in magnitude as preNEE became more positive (Fig. 5). Moreover, previous dry conditions at shallow soil depth promoted larger C efflux by the priming effect, and this effect decreased as previous soil conditions were wetter, with a threshold at 15 % (Fig. 5). Like the change in soil water content at 2.5 cm, even the lowest PPT event (0.25 mm) caused an increase in C efflux but with a threshold between 10–15 mm. Precipitation events larger than 15 mm did not enhance the priming effect (Fig. 5). In contrast, in the photosynthesis-dominated period, a larger priming effect was observed at more negative preNEE (−7 ) and had no more effect at ∼ −4 . Dry-soil conditions enhanced the priming effect at 15 cm depth (< 30 %) with a rapid suppression after that. On the other hand, the priming effect was gradually decreasing with reductions in PPFD.
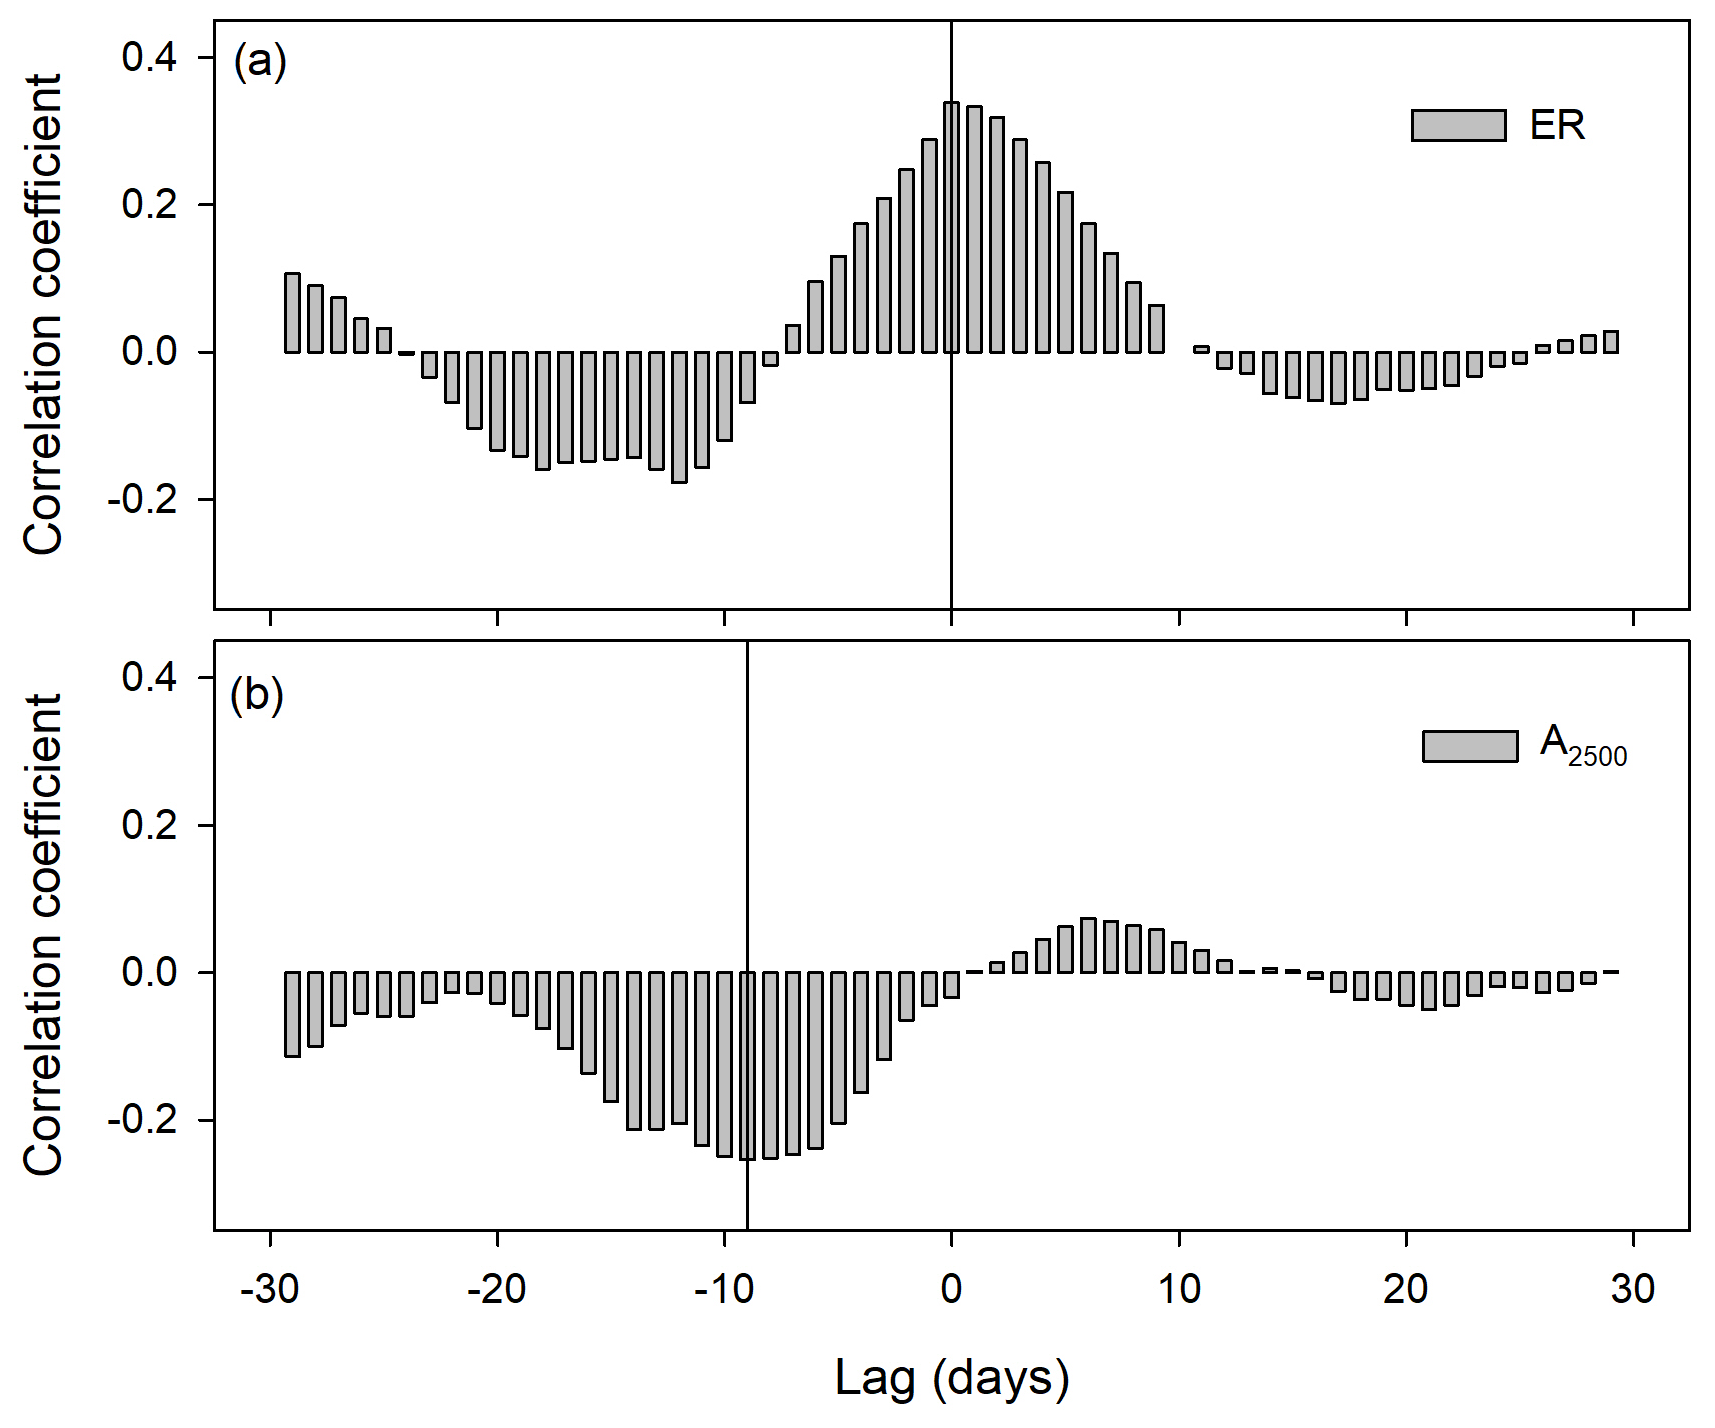
Figure 4Cross-correlation coefficients between detrended time series of soil water content at 2.5 cm depth and ecosystem respiration (ER; a) and between soil water content at 15 cm depth and photosynthesis at 2500 of photosynthetic photon flux density (A2500; b).
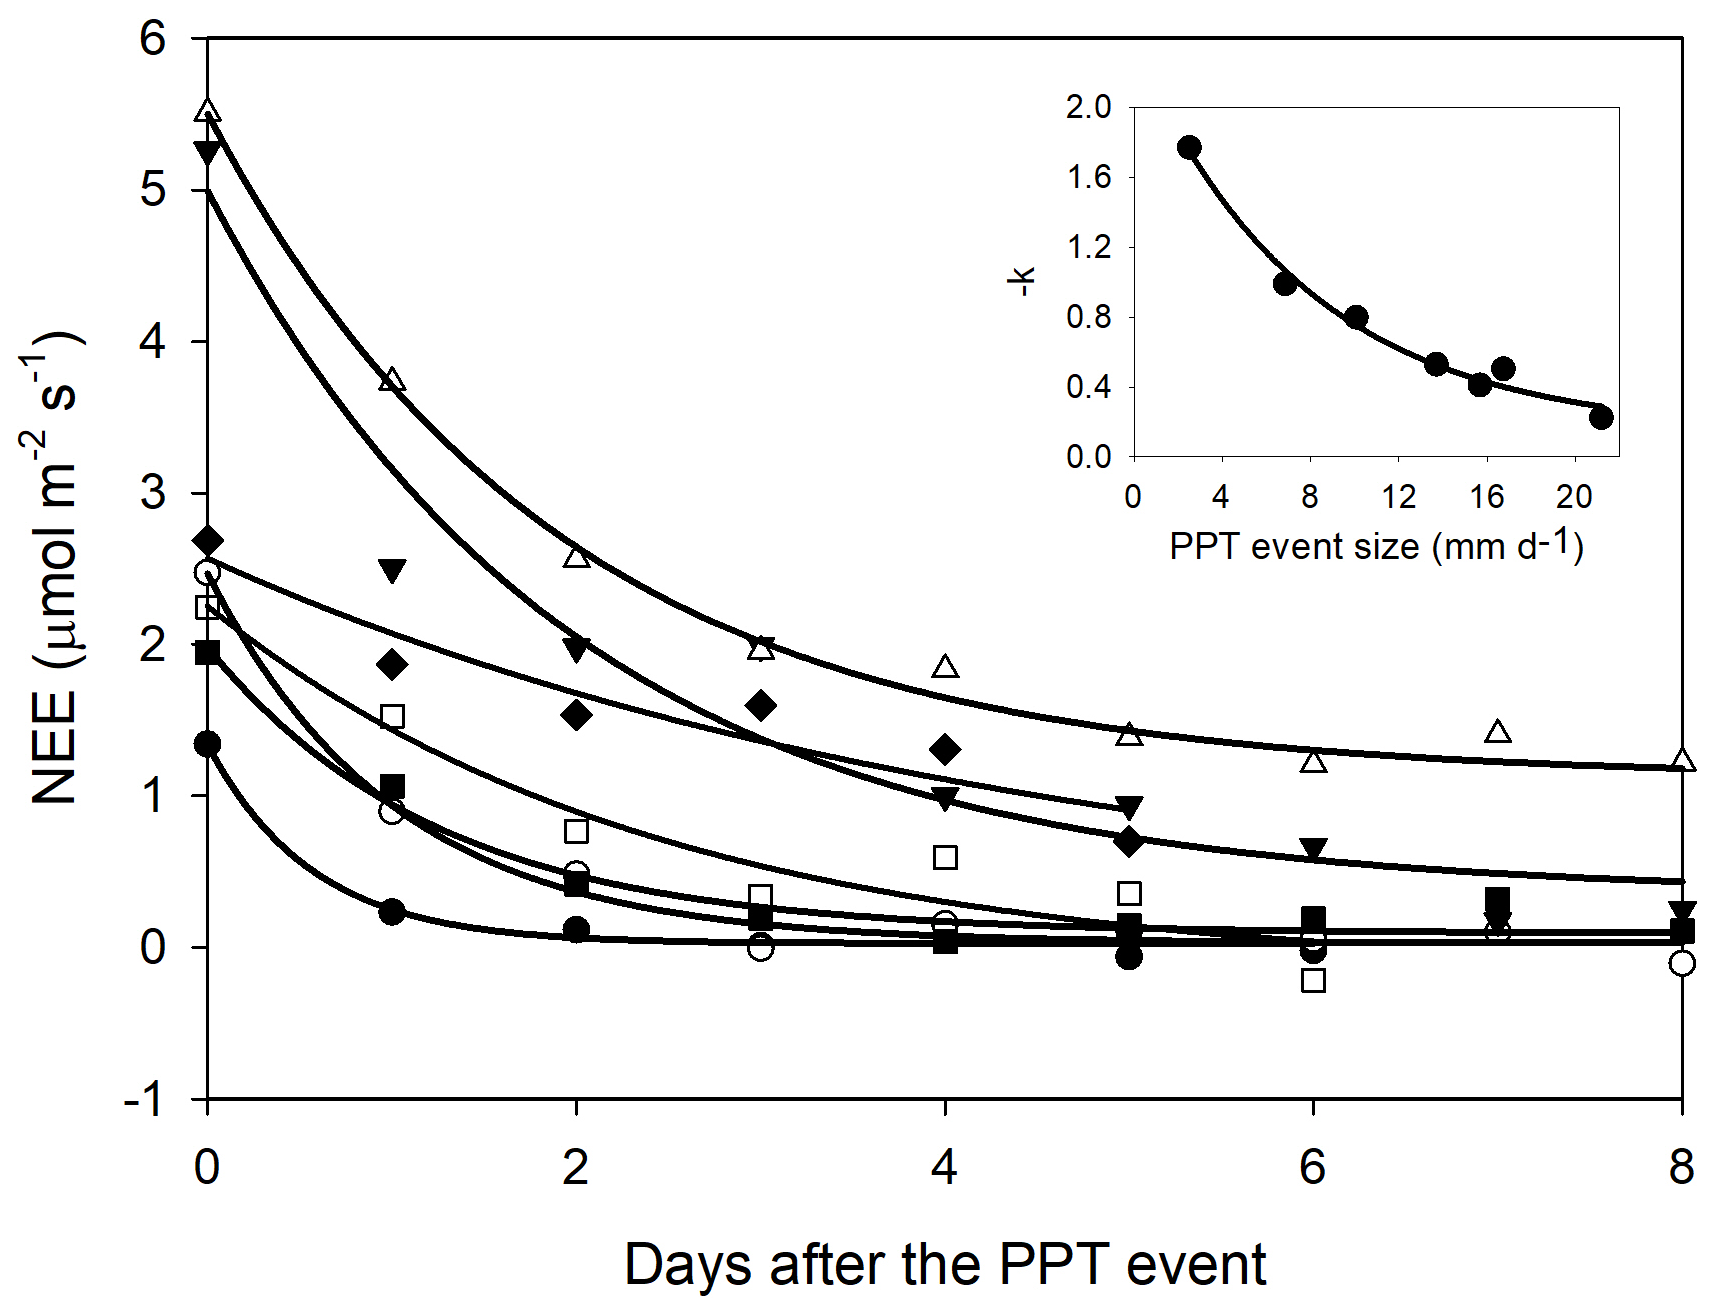
Figure 5Net ecosystem exchange (NEE) after a precipitation event showing the decreasing effect through time (days). The decreasing effect rate was adjusted to an exponential negative model NEE = . The insert stands for the relationship between the decaying rate (−k) and the PPT event that originated the NEE change. This relationship was fitted with an exponential model (black line; −k = ). Symbols indicate different PPT event sizes that originated the NEE change, 13.7 mm d−1 (Δ), 16.74 mm d−1 (▾), 6.86 mm d−1 (∘), 10.08 mm d−1 (▪), and 2.52 mm d−1 (•).
Nighttime NEE (ecosystem respiration derived from nighttime NEE data) showed a correlation with soil water content at the two depths and EVI; however, the relationship was linear at low soil water content, reached a maximum at medium values of VWC, and then decreased with minimum values at high soil water content. The largest ecosystem respiration was observed at the highest EVI values (Fig. A4).
3.3 Dynamics and drivers of the priming effect
The priming effect lasted longer with initial larger changes in NEE; i.e., whereas the priming effect was higher (ΔNEE), the C fluxes took more time in returning to initial values (before the PPT event). However, decreasing NEE rates were better explained by the PPT event size than by the initial change in NEE (insert Fig. 4). For instance, after a 13.7 mm PPT event and initial daytime NEE = 5.1 , the C flux exponentially decreased at a rate of ∼ 50 % of its earlier value, whereas with an initial NEE efflux ∼ 2.5 , the C flux decreased at a rate of 100 % (Fig. 4). Thus, the total C efflux was a contribution of the initial change in NEE and the time taken to return to basal values (i.e., decreasing rates).
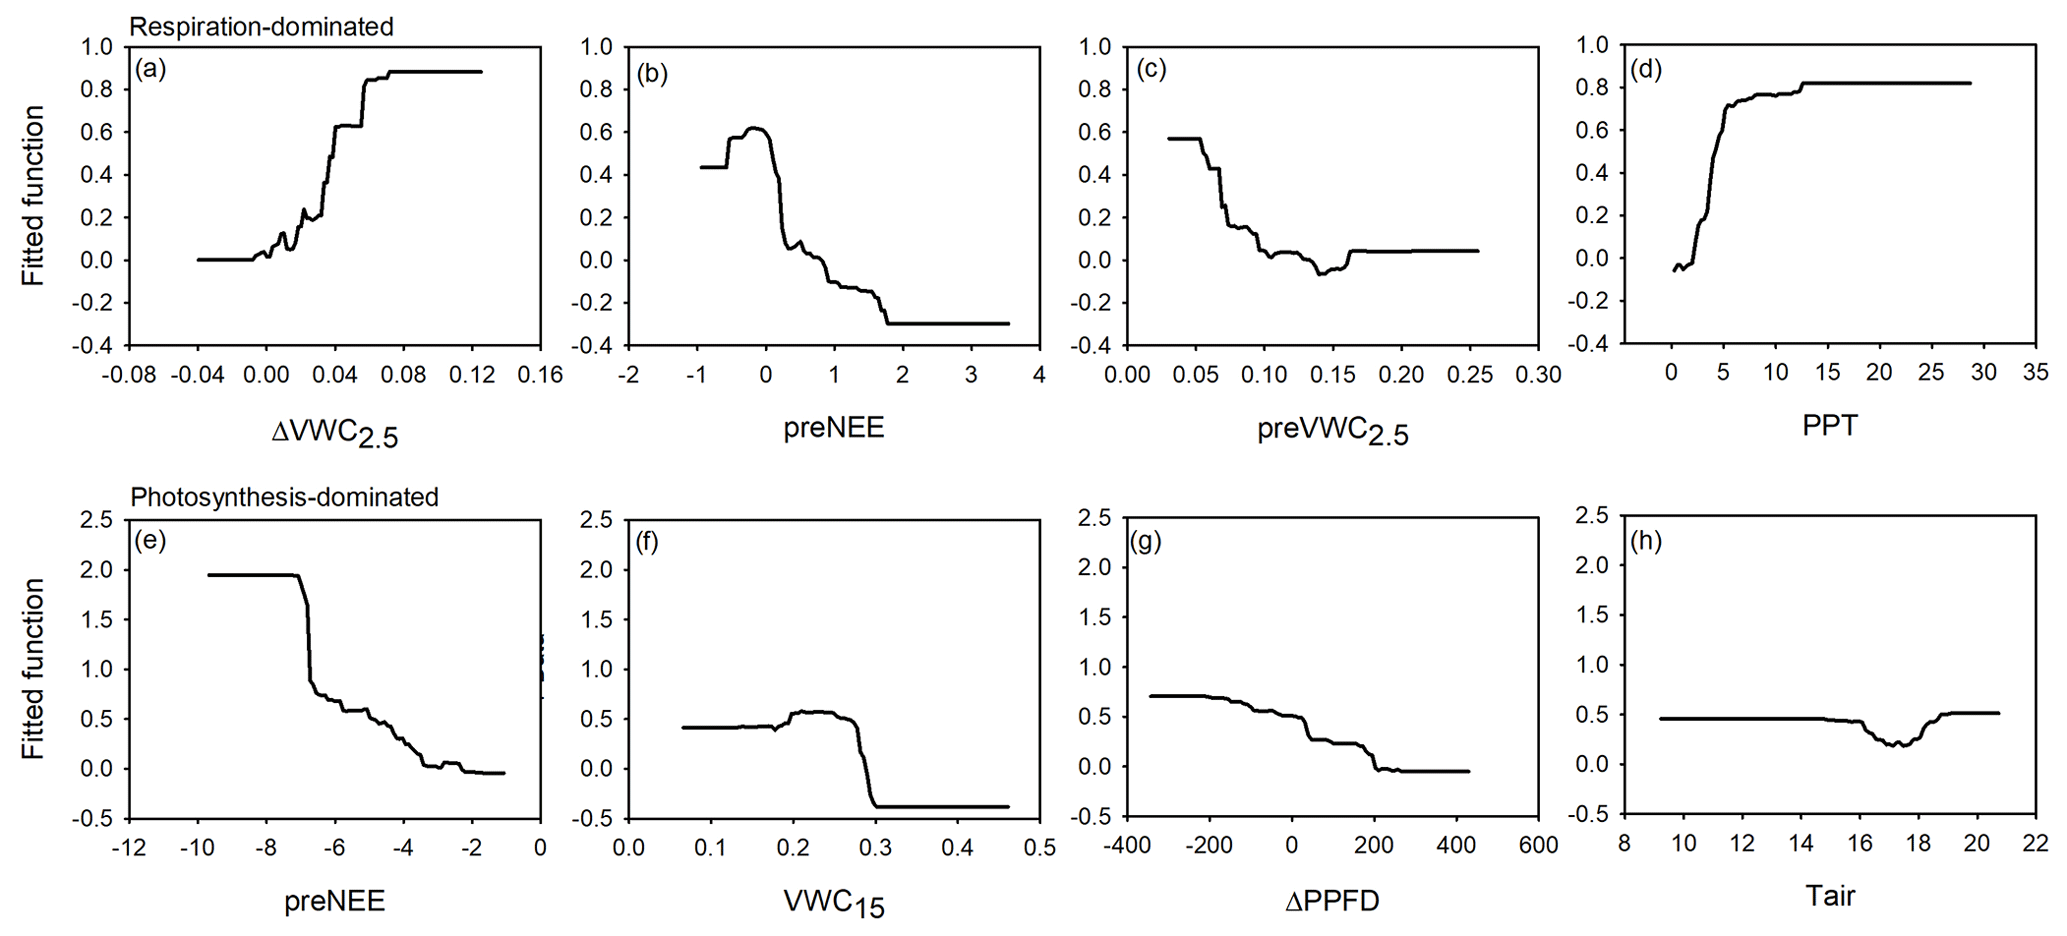
Figure 6Fitted functions of the boosted regression trees between the priming CO2 effect and the four most important environmental variables at the ecosystem-respiration-dominated period (a–d) and at the photosynthesis-dominated period (e–h). Priming effect (ΔNEE, ), previous NEE (preNEE, ), previous VWC at 2.5 cm depth (preVWC2.5, ), PPT event size (PPT, mm), VWC at 15 cm depth (VWC15, ), change in photosynthetic photon flux density (ΔPPFD, ), and air temperature (Tair, ∘C).
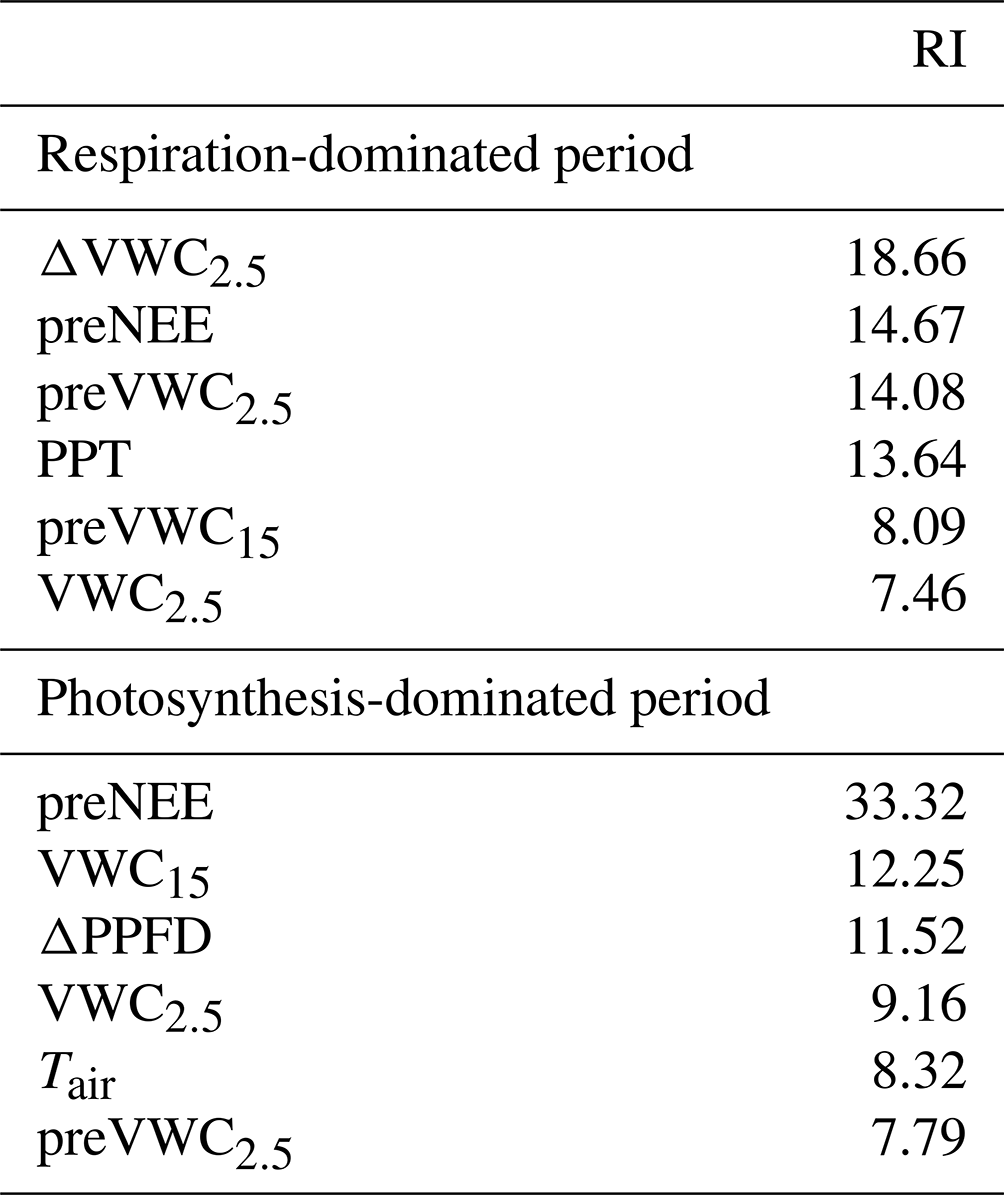
According to the BRT analysis, the factor that most influenced the priming effect in the respiration-dominated period was the change in soil water content at 2.5 cm depth (ΔVWC2.5; relative importance, RI, = 18 %), which was followed by the previous NEE (preNEE; RI = 14 %), the previous VWC at 2.5 cm depth (RI = 14 %), and the size of the PPT event (RI = 13 %). All the other factors had individual RI values lower than 10 % (Table 1; Fig. 6). Maximum ΔNEE values were observed with (i) larger changes in soil water content at 2.5 cm depth (Fig. 6a), (ii) previous neutral NEE (i.e., NEE ∼ 0 ; Fig. 6b), (iii) previous dry-soil water content at 2.5 cm depth (Fig. 6c), and (iv) large PPT events (> 15 mm d−1; Fig. 6d). The priming NEE effect decreased farther than these limits. In contrast, in the photosynthesis-dominated period, the previous NEE was the most important factor explaining the priming effect (RI = 33 %). In contrast, the volumetric water content at 15 cm depth, the change in photosynthetic photon flux density, and the volumetric water content at 2.5 cm depth followed in importance (Table 1). Larger changes in NEE (priming effect) were observed (i) at more negative previous NEE (i.e., under more photosynthetic activity; Fig. 6e), (ii) under drier soil water conditions at 15 cm depth (Fig. 6f), (iii) with larger changes in PPFD (decrease in PPFD; Fig. 6g), and (iv) under air temperature lower than 16 ∘C and higher than 19 ∘C (Fig. 6h). There was a large interaction between preVWC2.5 and PPT for the respiration-dominated period and between preNEE and ΔPPFD for the photosynthesis-dominated period.
Table 1Relative importance (RI) of the first four most important environmental factors for the priming CO2 effect.
3.4 Contribution of the priming effect on the carbon balance
The carbon balance for these 6 years for this site was −126 g C m−2, with 2955 and −3080 g m−2 of ecosystem respiration and gross ecosystem exchange, respectively, and varied from a sink of −107 to a source of 114 (Delgado-Balbuena et al., 2019). A rough calculation of carbon efflux due to the priming effect indicated that extrapolation of mean ΔNEE per event and by year contributes 142 g m−2 for the full 6-year period, which corresponds to 5 % of the total ER flux. In this calculation, parameters like decaying rates, the size of the PPT event, and previous soil and flux conditions were not considered (modeled) and were subject to the number of PPT events. Logically, humid years with more PPT events have a higher contribution of C efflux by the priming effect. Each year contributed less than 30 .
4.1 Dynamics of the priming effect
In agreement with the T-D model, NEE exponentially decreased after the PPT pulse (Fig. 5) to almost the pre-PPT NEE rate. The largest C efflux pulses slowly returned to basal C efflux rates and showed larger NEE remnants than the smaller pulses (Fig. 5). This suggests that more persistent VWC quantities achieved with larger-sized PPT events promoted larger and longer C emissions. If the event is large enough to maintain VWC above a threshold for a long time (e.g., above the wilting point for plants), NEE is expected to remain higher than pre-event rates until nutrients or labile C are depleted (Jarvis et al., 2007; Xu et al., 2004). In contrast, when the PPT event is small, and the soil remains wet for a short time, the C flux peak will be small and less persistent because of soil dry-out, and the activity of microorganisms is likely to end before soil nutrients are depleted. Thus, priming effect decaying rates (−k) are more likely an issue of water availability than nutrient or C source depletion.
4.2 Thresholds and time delays of the priming carbon flux effect
In our study, the NEE increased immediately (short time delay) after a PPT event, in accordance with H1. Moreover, the minimum size of a PPT event needed to detect NEE change was as low as 0.25 mm d−1, in agreement with H2. We interpret that immediate daytime PPT-induced responses in NEE and ER rates were dominated by heterotrophic respiration and assume that these microbial communities have evolved to take advantage of this short-term water availability. Short-term responses of < 30 min have also been reported in studies that analyzed soil microorganism activity through molecular and stable isotope techniques (Placella et al., 2012; Unger et al., 2010). Fungi and bacteria on the soil surface have the capability for water-induced re-activation within 1 to 72 h after a PPT event (Placella et al., 2012). Immediate positive NEE increase observed in our study (Fig. A3) may have resulted from rapid activation of bacteria displaying the highest activity 1 h after wetting. Biological soil crusts (BSCs) are assemblages of microorganisms forming crusts on the soil and rock surfaces (Belnap, 2003) common in arid lands. At our site, the BSC covers up to 70 % of plant interspaces in grazing-excluded conditions and up to 30 % in overgrazed sites (Concostrina-Zubiri et al., 2014), with the dominance of Actinobacteria (e.g., actinomycetes) and cyanobacteria, which are identified as rapid responders (Bowling et al., 2011).
The maximum priming NEE effect was identified under changes larger than 8 % in soil water content at 2.5 cm, previous dry soil, previous neutral NEE, and PPT events > 15 mm. These limits may be defined by several conditions, including (1) the largest and most intense events did not completely infiltrate into the soil, forming abundant runoff and moderating the amount of water penetrating the soil profile at a similar depth as that observed for large-size PPT events; (2) oxygen and CO2 diffusion limitation under high soil VWC dampened soil respiration; (3) all soil aggregates are disrupted at medium soil VWC, likely providing no additional nutrient or C substrate at higher VWCs (Bailey et al., 2019; Lado-Monserrat et al., 2014; Homyak et al., 2018; Chen et al., 2019); and (4) a combination of any of these three. A linear relationship between PPT event size, preVWC2.5, and ΔVWC2.5 (Fig. 2d) showed that there was not a substantial limitation of water infiltration into the soil at shallow depths, discarding in some way the first condition, whereas the reduction in ER rates in nighttime NEE data after VWC2.5> 12 % and daytime ΔNEE reductions under higher preVWC2.5 support the second mechanism (Figs. 6 and A4).
4.3 The ER and GEE threshold and time delay difference
The smallest PPT events only stimulated ER rates, with no apparent change observed in GEE (Fig. 3). Even a large PPT event of 20 mm d−1 recorded in May 2013 (Fig. 3) did not induce an increase in GEE. In contrast, larger or consecutive PPT events that reached deeper soil profiles stimulated GEE (cumulative PPT > 40 mm). These results also explain why the previous soil moisture and the change in soil moisture (2.5 cm depth) better explained ΔNEE at the respiration-dominated period rather than soil moisture at 15 cm depth (Fig. 5); this confirms our notion that soil microorganism activity was the source of the immediate CO2 efflux. In contrast, VWC at 15 cm depth was the second most important factor explaining the priming NEE effect in the photosynthesis-dominated period. Additionally, the change in PPFD during the photosynthesis-dominated period positively affected the priming effect (Fig. 6), meaning that cloudy conditions reduced carbon uptake rather than PPT and stimulated ecosystem respiration.
The low PPT threshold that stimulated ER agrees with results from other studies in arid ecosystems (and are even lower). PPT events as small as 3 mm induced respiration of biological soil crusts (Kurc and Small, 2007), and PPT events < 10 mm d−1 on a shortgrass steppe promoted net loss of C (Parton et al., 2012). Moreover, Medina-Roldán et al. (2013) at the same study site showed an increase of 36 % and 34 % of extractable and NO3−, respectively, after a PPT event of 10 mm, which is indicative of soil biological activity. However, the dominant species at our site, B. gracilis, was reported to respond to PPT events as small as 5 mm (Sala and Lauenroth, 1982), which was the PPT threshold we were expecting. Instead, this study found that large or consecutive PPT events had to occur before an effect on GEE was observed (Fig. 3). Nevertheless, we highlight that small PPT events in arid ecosystems that do not lead to C uptake may alleviate stress after severe droughts, rehydrating plant tissues and helping plants to respond faster after larger PPT events (Sala and Lauenroth, 1982; Aguirre-Gutiérrez et al., 2019; Thomey et al., 2011).
Causes of longer time delays in GEE than in ER are likely due to the delay between the PPT event and the infiltration of water to a given soil layer (e.g., 15 cm depth; Fig. 2e) and the time spent for regrowing of new roots and leaves (Ogle and Reynolds, 2004). These processes promote C losses rather than C uptake in the early growing season (Huxman et al., 2004b; Delgado-Balbuena et al., 2019). In contrast, ER was primarily controlled by soil moisture at shallow soil layers that moist immediately after any PPT event and may activate soil microorganisms just a few hours after soil wetting as discussed above.
4.4 Influence of event size and a priori conditions
The magnitude of the priming effect was determined by the size of the PPT event and mainly by the ΔVWC, as well as the previous condition of the ecosystem (i.e., previous C flux and previous soil VWC). These results agree with H3 that proposed the PPT event size and previous conditions of the semiarid grassland would control the magnitude of the priming NEE effect. The previous VWC offers insight into the potential dry–wet shock experienced by soil aggregates and microorganisms (Haynes and Swift, 1990) and thus accounts for nutrient and labile C accumulation in soil (Bailey et al., 2019).
Results indicated that larger C effluxes were induced from a medium amount of PPT when the previous soil conditions were dry and had an initial value of NEE = ∼ 0. Several mechanisms can explain this result: (i) the accumulation of nutrients and labile C into the soil (Schimel and Bennet, 2004) because of the low activity of microorganisms (NEE ∼ 0) under dry soil (Homyak et al., 2018), (ii) if soil VWC is maintained for an extended period above a threshold, then soil microbial activity exhausts labile C sources (Jarvis et al., 2007; Fierer and Schimel, 2002). Consequently, recalcitrant C sources subjected to microbial decomposition decrease mineralization rates (Van Gestel et al., 1993).
4.5 Importance of the priming effect in the annual C balance
Our results do not support the hypothesis that a significant contribution of C release from the priming effect decreases the net annual C uptake of the semiarid grassland (H4). The contribution of these short-term C efflux events to annual C balances accounted for a considerable amount, but it was a small contribution compared to the ecosystem respiration flux, which was almost 3000 (Delgado-Balbuena et al., 2019). Notwithstanding the fact that its contribution is low (∼ 5 % of ecosystem respiration), it is important considering that the annual C balance (NEE) is a small fraction of the difference between ER and GEE. Thus, 5 % of C released represents up to 500 % of the net C uptake during an almost neutral year and may turn a C sink ecosystem into a net C source.
4.6 Priming effect and climate change perspectives
The low ΔSWC2.5 and PPT threshold for respiration suggests that almost all PPT events occurring in the semiarid grasslands will produce C efflux but will be limited by the characteristics of the PPT pattern and previous soil conditions at the site. Therefore, we expect that small PPT events with previous dry conditions or long inter-event periods will limit the priming effect by maintaining the system below threshold conditions. Moreover, consecutive PPT events or large PPT events should keep soil water content above a threshold that will promote C uptake by photosynthesis, which in the long term will overcome C loss from the priming effect. However, climate change scenarios forecast for the semiarid grassland in Mexico a decrease in winter PPT and an increase in storms with larger inter-event periods, which are conditions for increasing the amount of C released by the priming effect (Arca et al., 2021; Darenova et al., 2017).
Further analysis of the effect of these PPT events on vegetation is necessary, since productivity will also depend on PPT event size and be modulated by previous soil conditions. Additionally, it is likely that productivity will benefit more from accumulated PPT than respiration. Still, more analyses of projected PPT scenarios are required to accurately forecast the contribution of the Birch effect to the C balance under more frequent droughts. In this sense, parameterizing a model like the T-D model will provide valuable information on more accurate C effluxes from the priming effect and how it will be affected by changes in precipitation pattern. Only after that will we be able to predict the course of the semiarid grassland as a source or sink of C under PPT pattern changes.
Previous soil water conditions and previous NEE were the most important factors controlling the priming effect in the semiarid grassland. The precipitation amount had an important role in explaining the priming effect but only in the respiration-dominated period. Delays between change responses at the deeper soil layer and regrowing processes could hide the relationship between precipitation and the priming effect during the photosynthesis-dominated period. The importance of the priming effect in the carbon balance could be more relevant under forecasted changes in precipitation patterns by increasing in both the frequency and intensity the dry–wet soil cycles. Further analysis of the effect of this change in precipitation patterns on ecosystem productivity is necessary before we can make conclusions about changes in the carbon balance of the semiarid grassland.
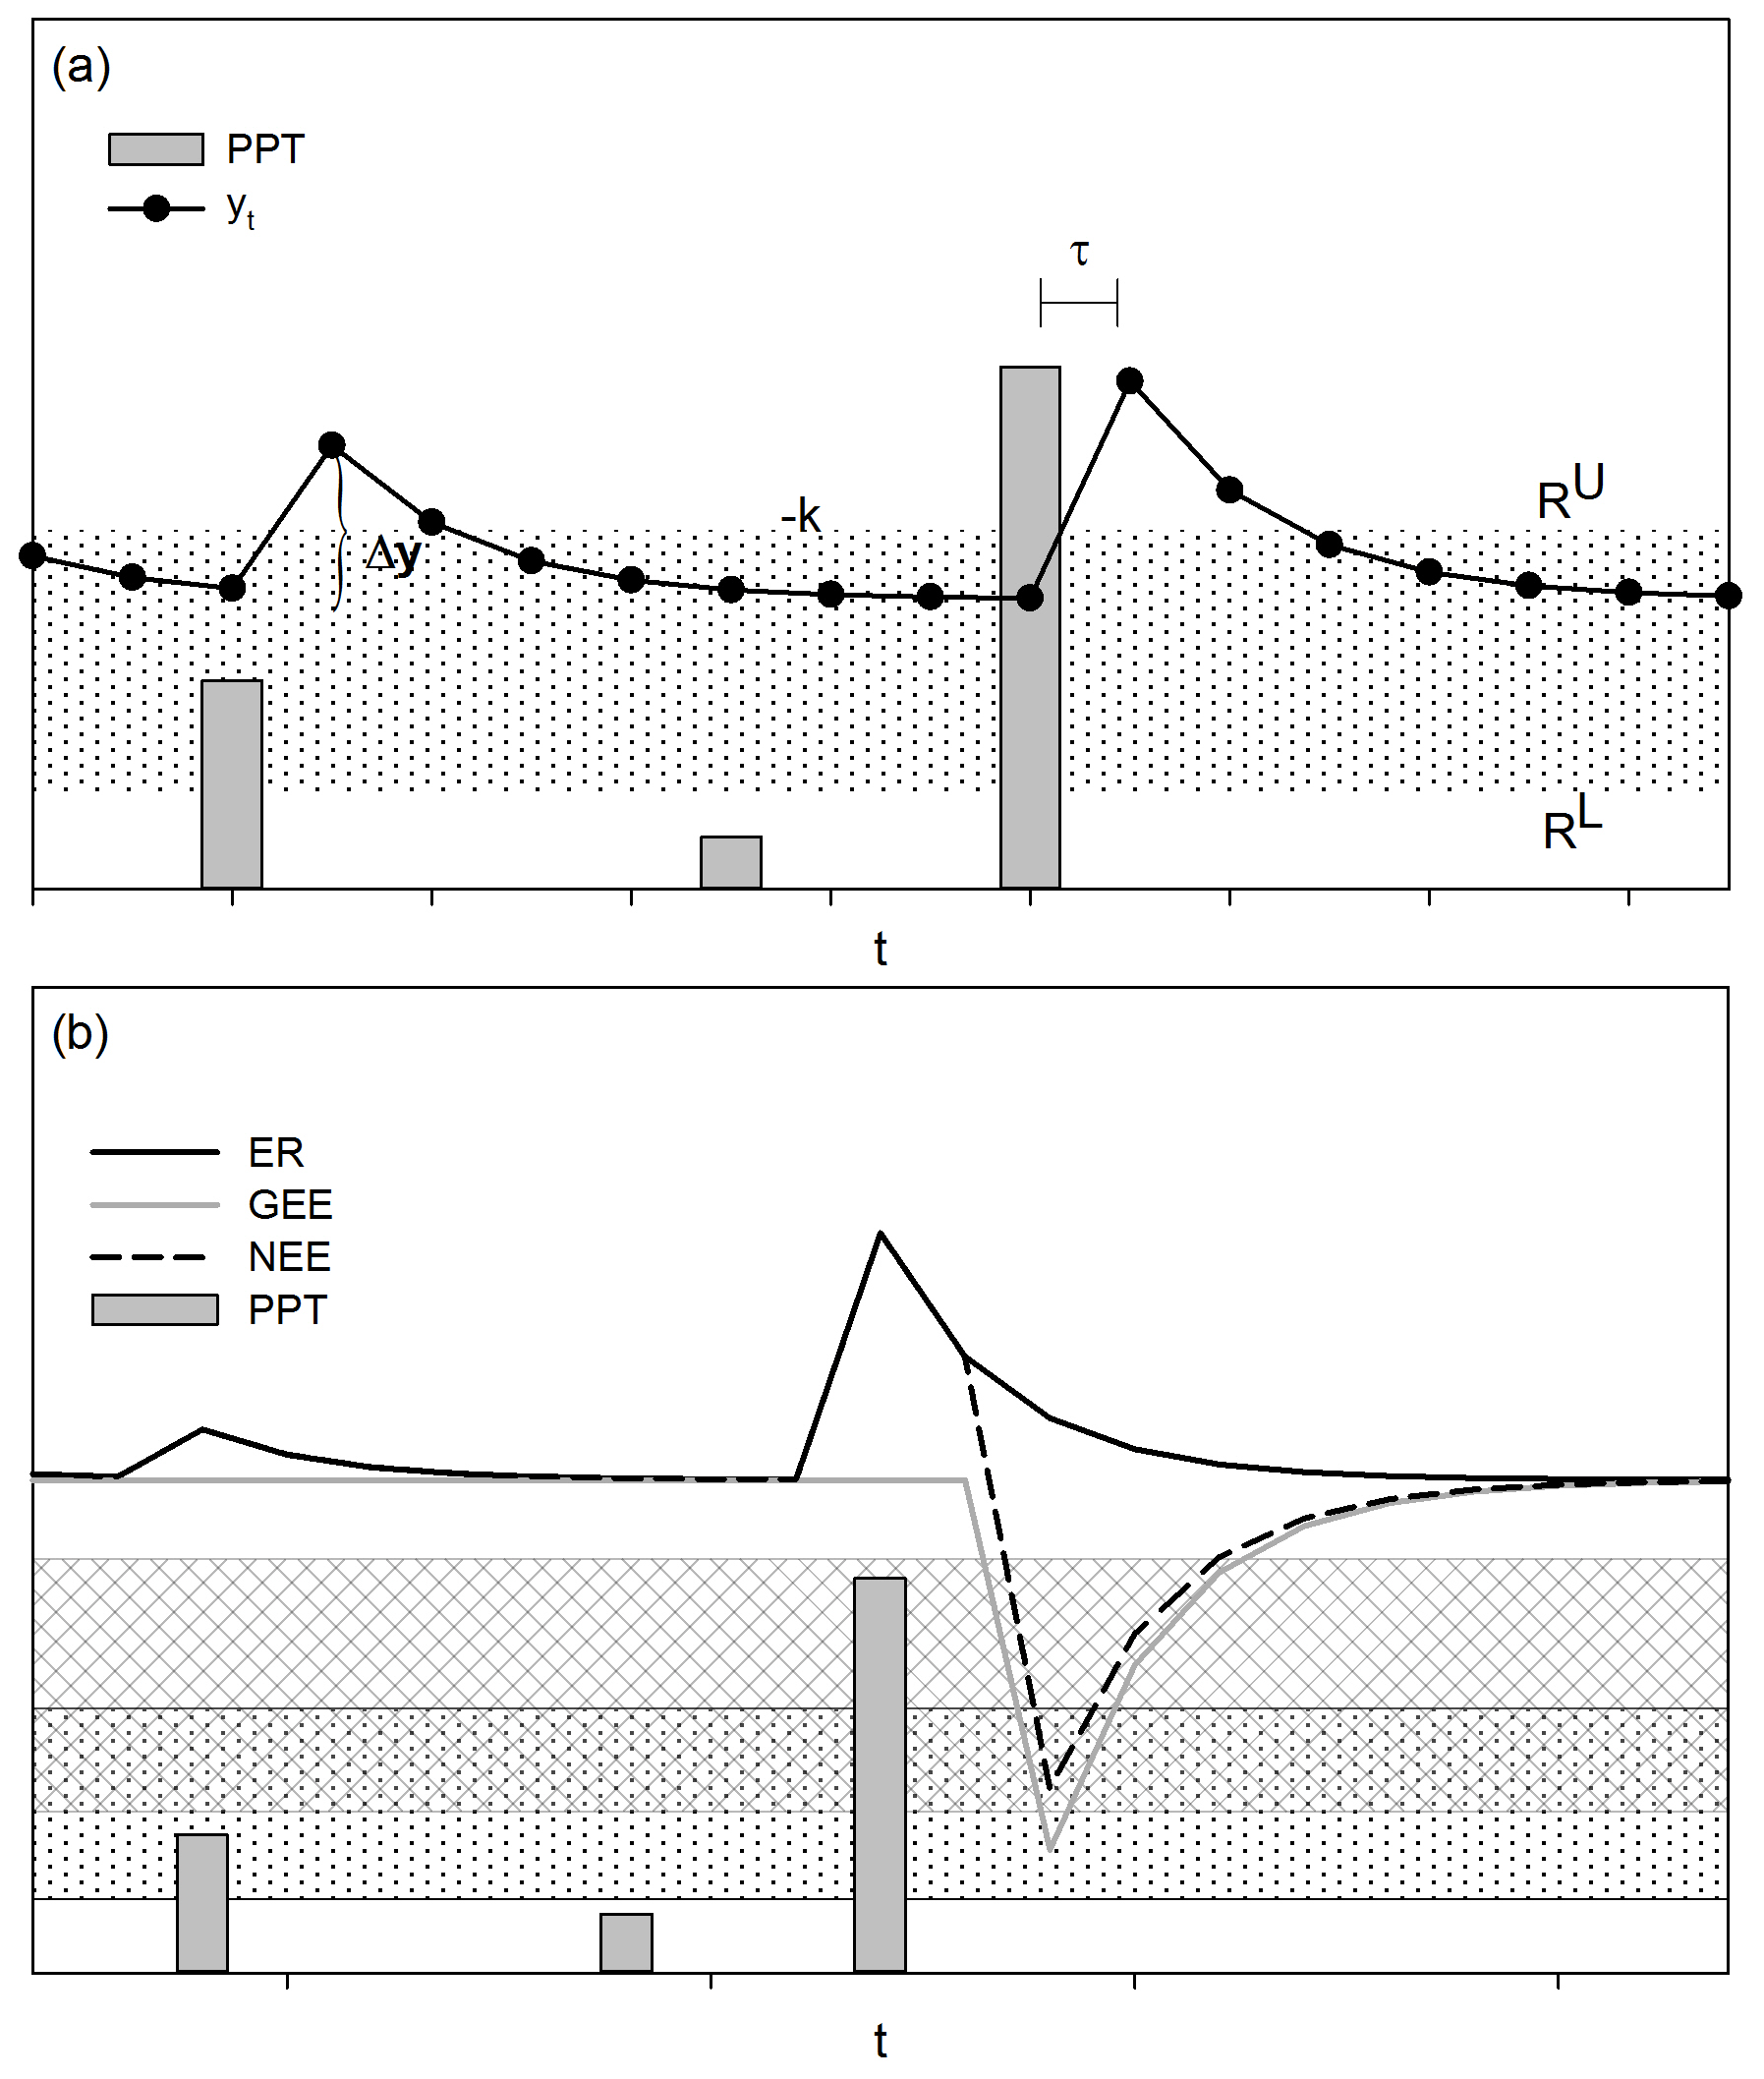
Figure A1The threshold-delay model (Ogle and Reynolds, 2004). (a) The magnitude of the increase in the response variable (Δt, e.g., carbon flux, yt) is determined by the size of the PPT event and by the previous state of the response variable. The decreasing rate of the response following the stimulus is denoted by −k. The low PPT threshold (RL) indicates the minimum size of the PPT event to stimulate a response, and the upper PPT threshold (RU) indicates PPT events that do not cause additional increments in the response variable. The time interval between the stimulus and the response is described by τ. (b) The response of the net ecosystem exchange (NEE), which is the balance between the gross ecosystem exchange (GEE) and ecosystem respiration (ER), varies in response to changes in GEE and ER. According to the T-D model, GEE and ER have different PPT thresholds (dotted band and mesh stand for effective PPT event size for ER and GEE, respectively), with ER responding to smaller-sized PPT events than GEE; therefore, small PPT events favor C release, whereas large PPT events stimulate net C uptake by the ecosystem. Differences in time responses between soil microorganisms and plants to soil wet-up led GEE and ER to differ in time delays (τ), with shorter time delays for ER than GEE (Huxman et al., 2004a). The hypothetical curve for NEE and its components were calculated, introducing arbitrary parameters in the T-D model equations of Ogle and Reynolds (2004).
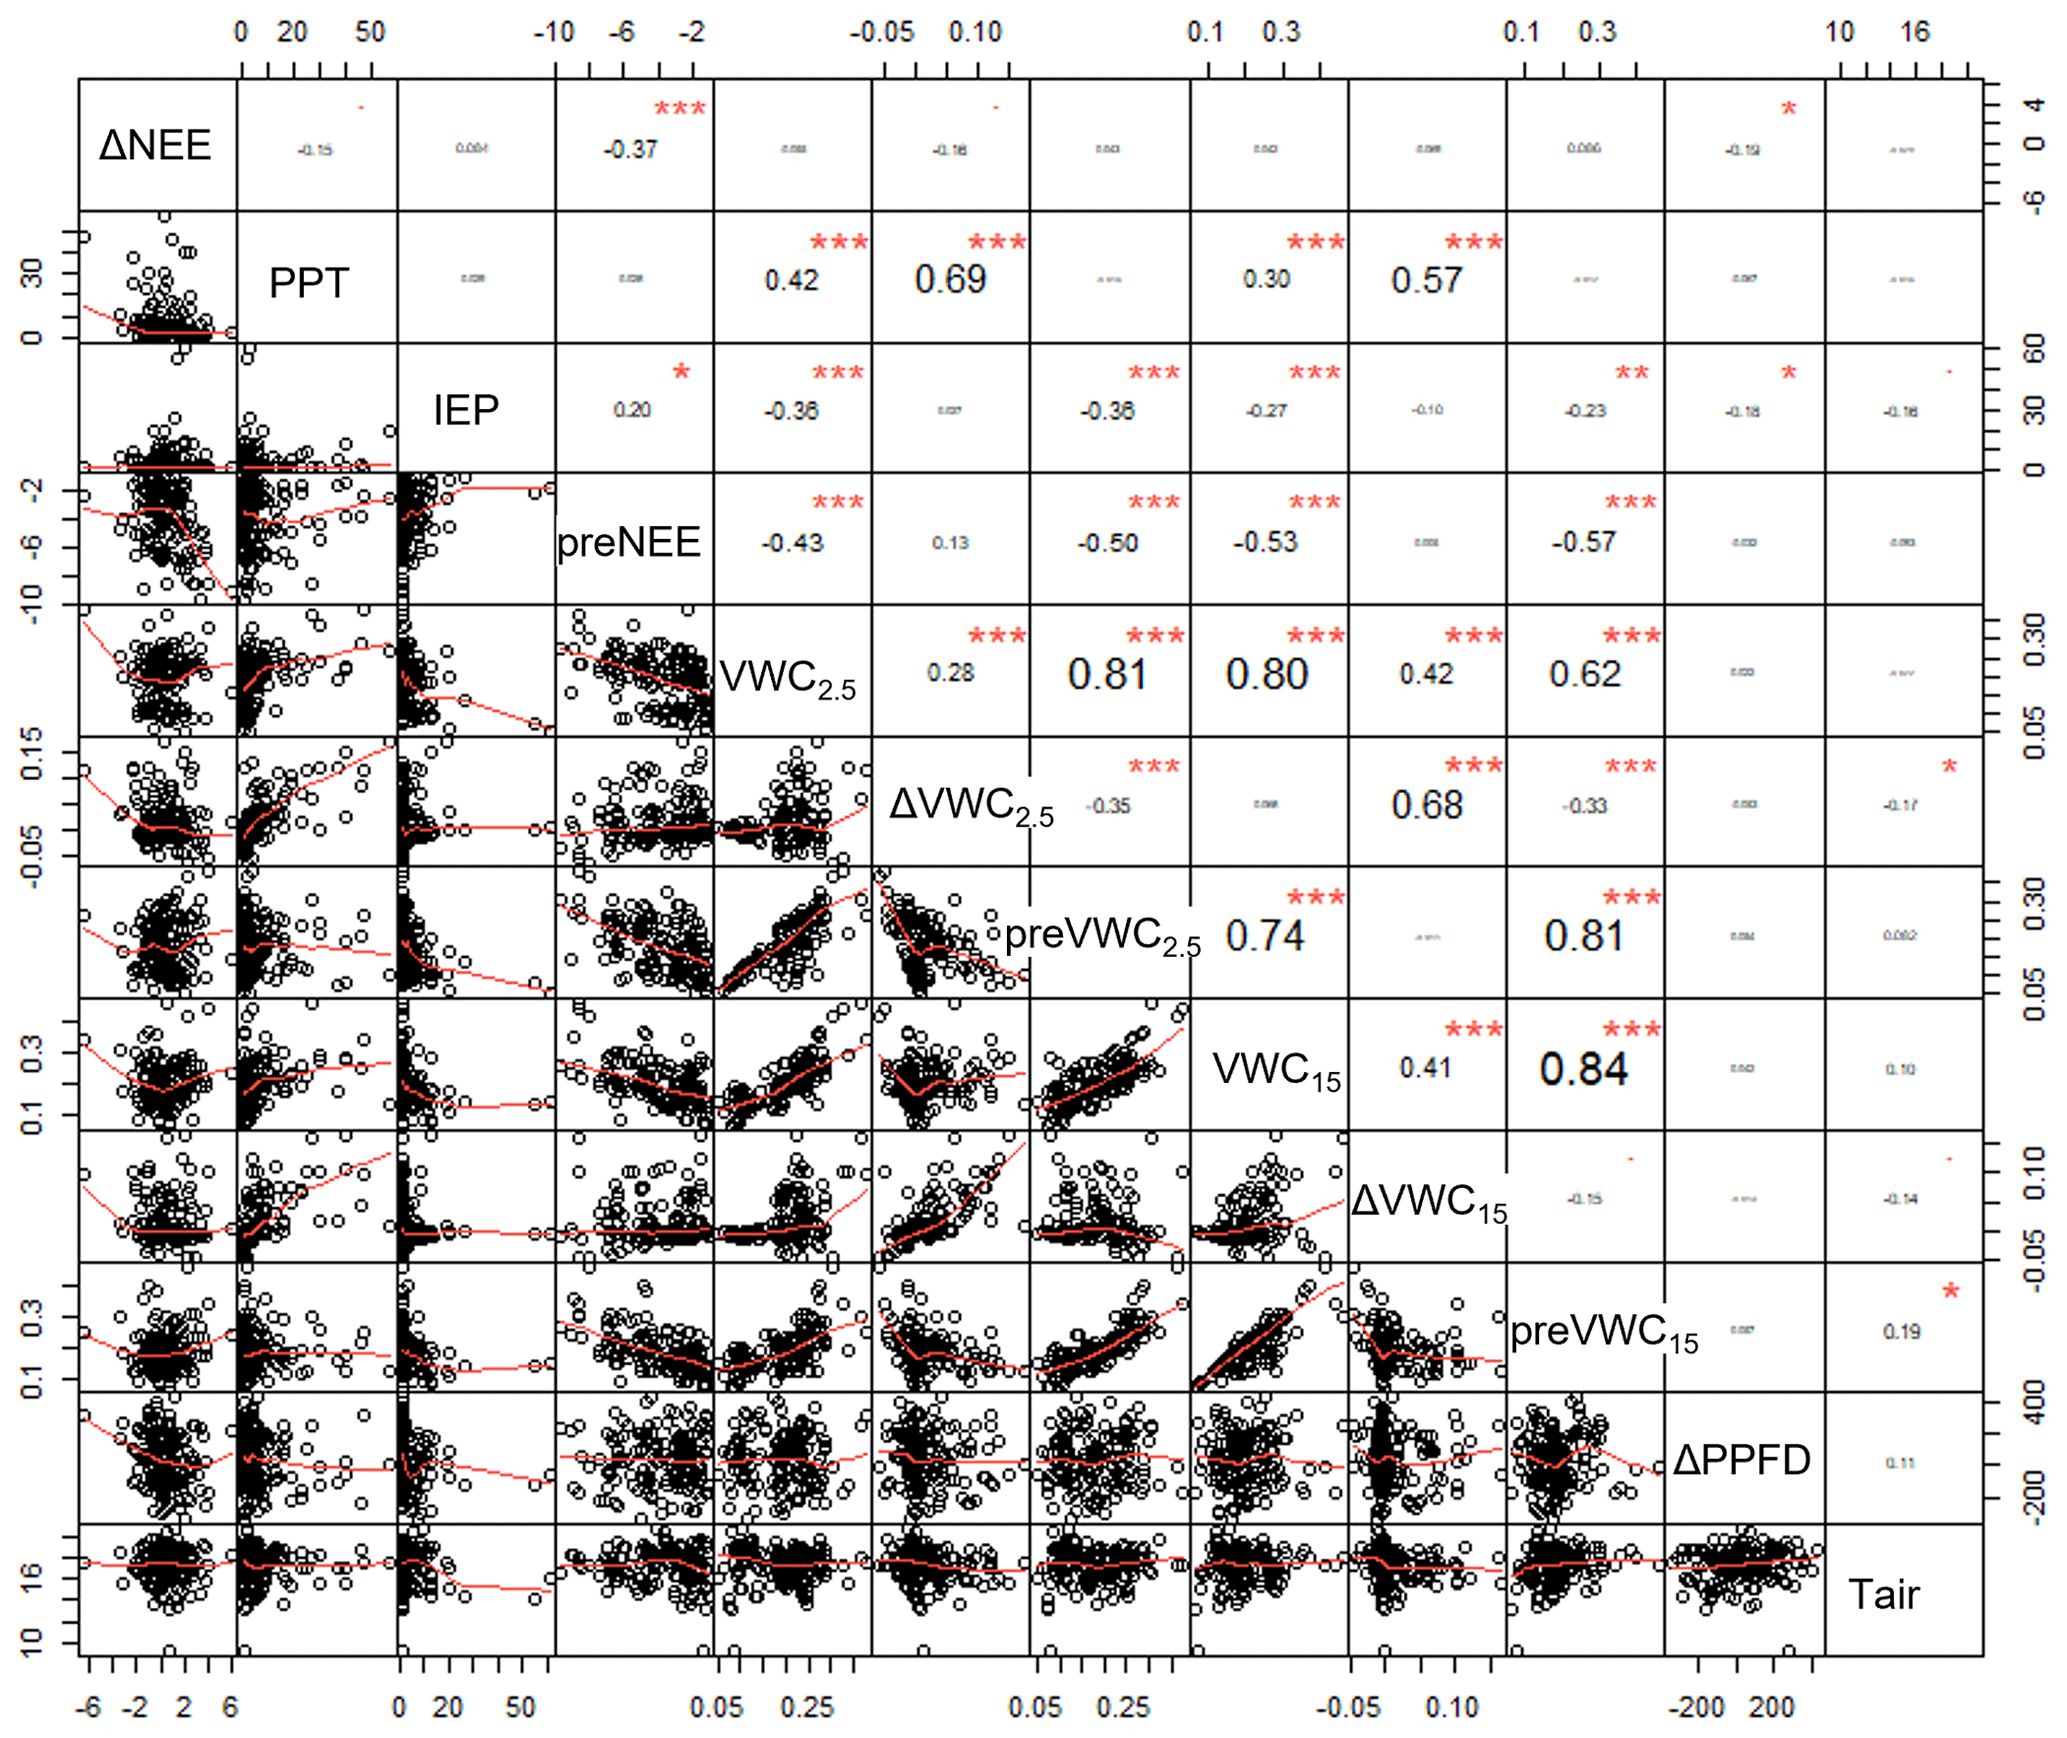
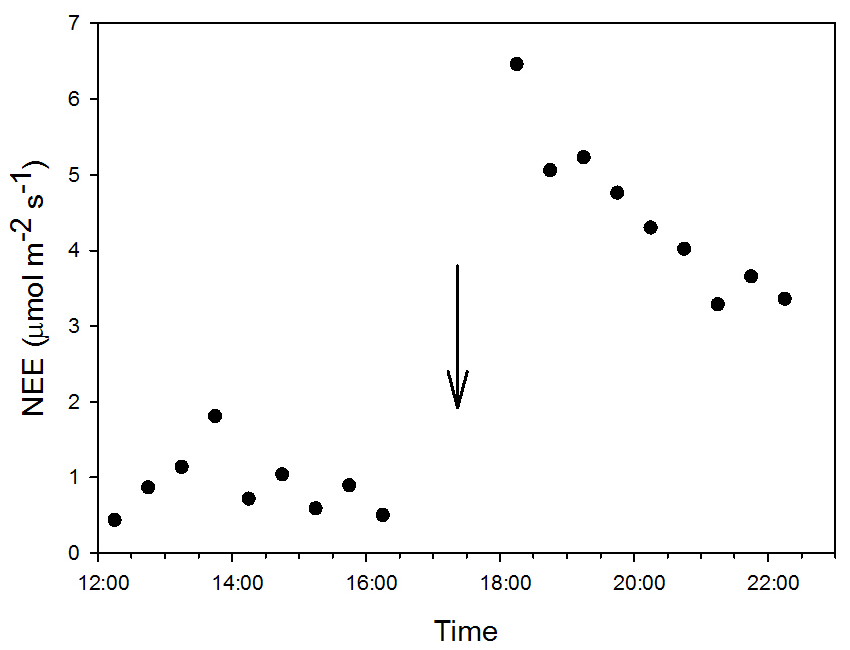
Figure A3Dynamic of 0.5 h net ecosystem exchange () after a precipitation event of 8.12 mm. The arrow indicates the time of the PPT event occurrence.
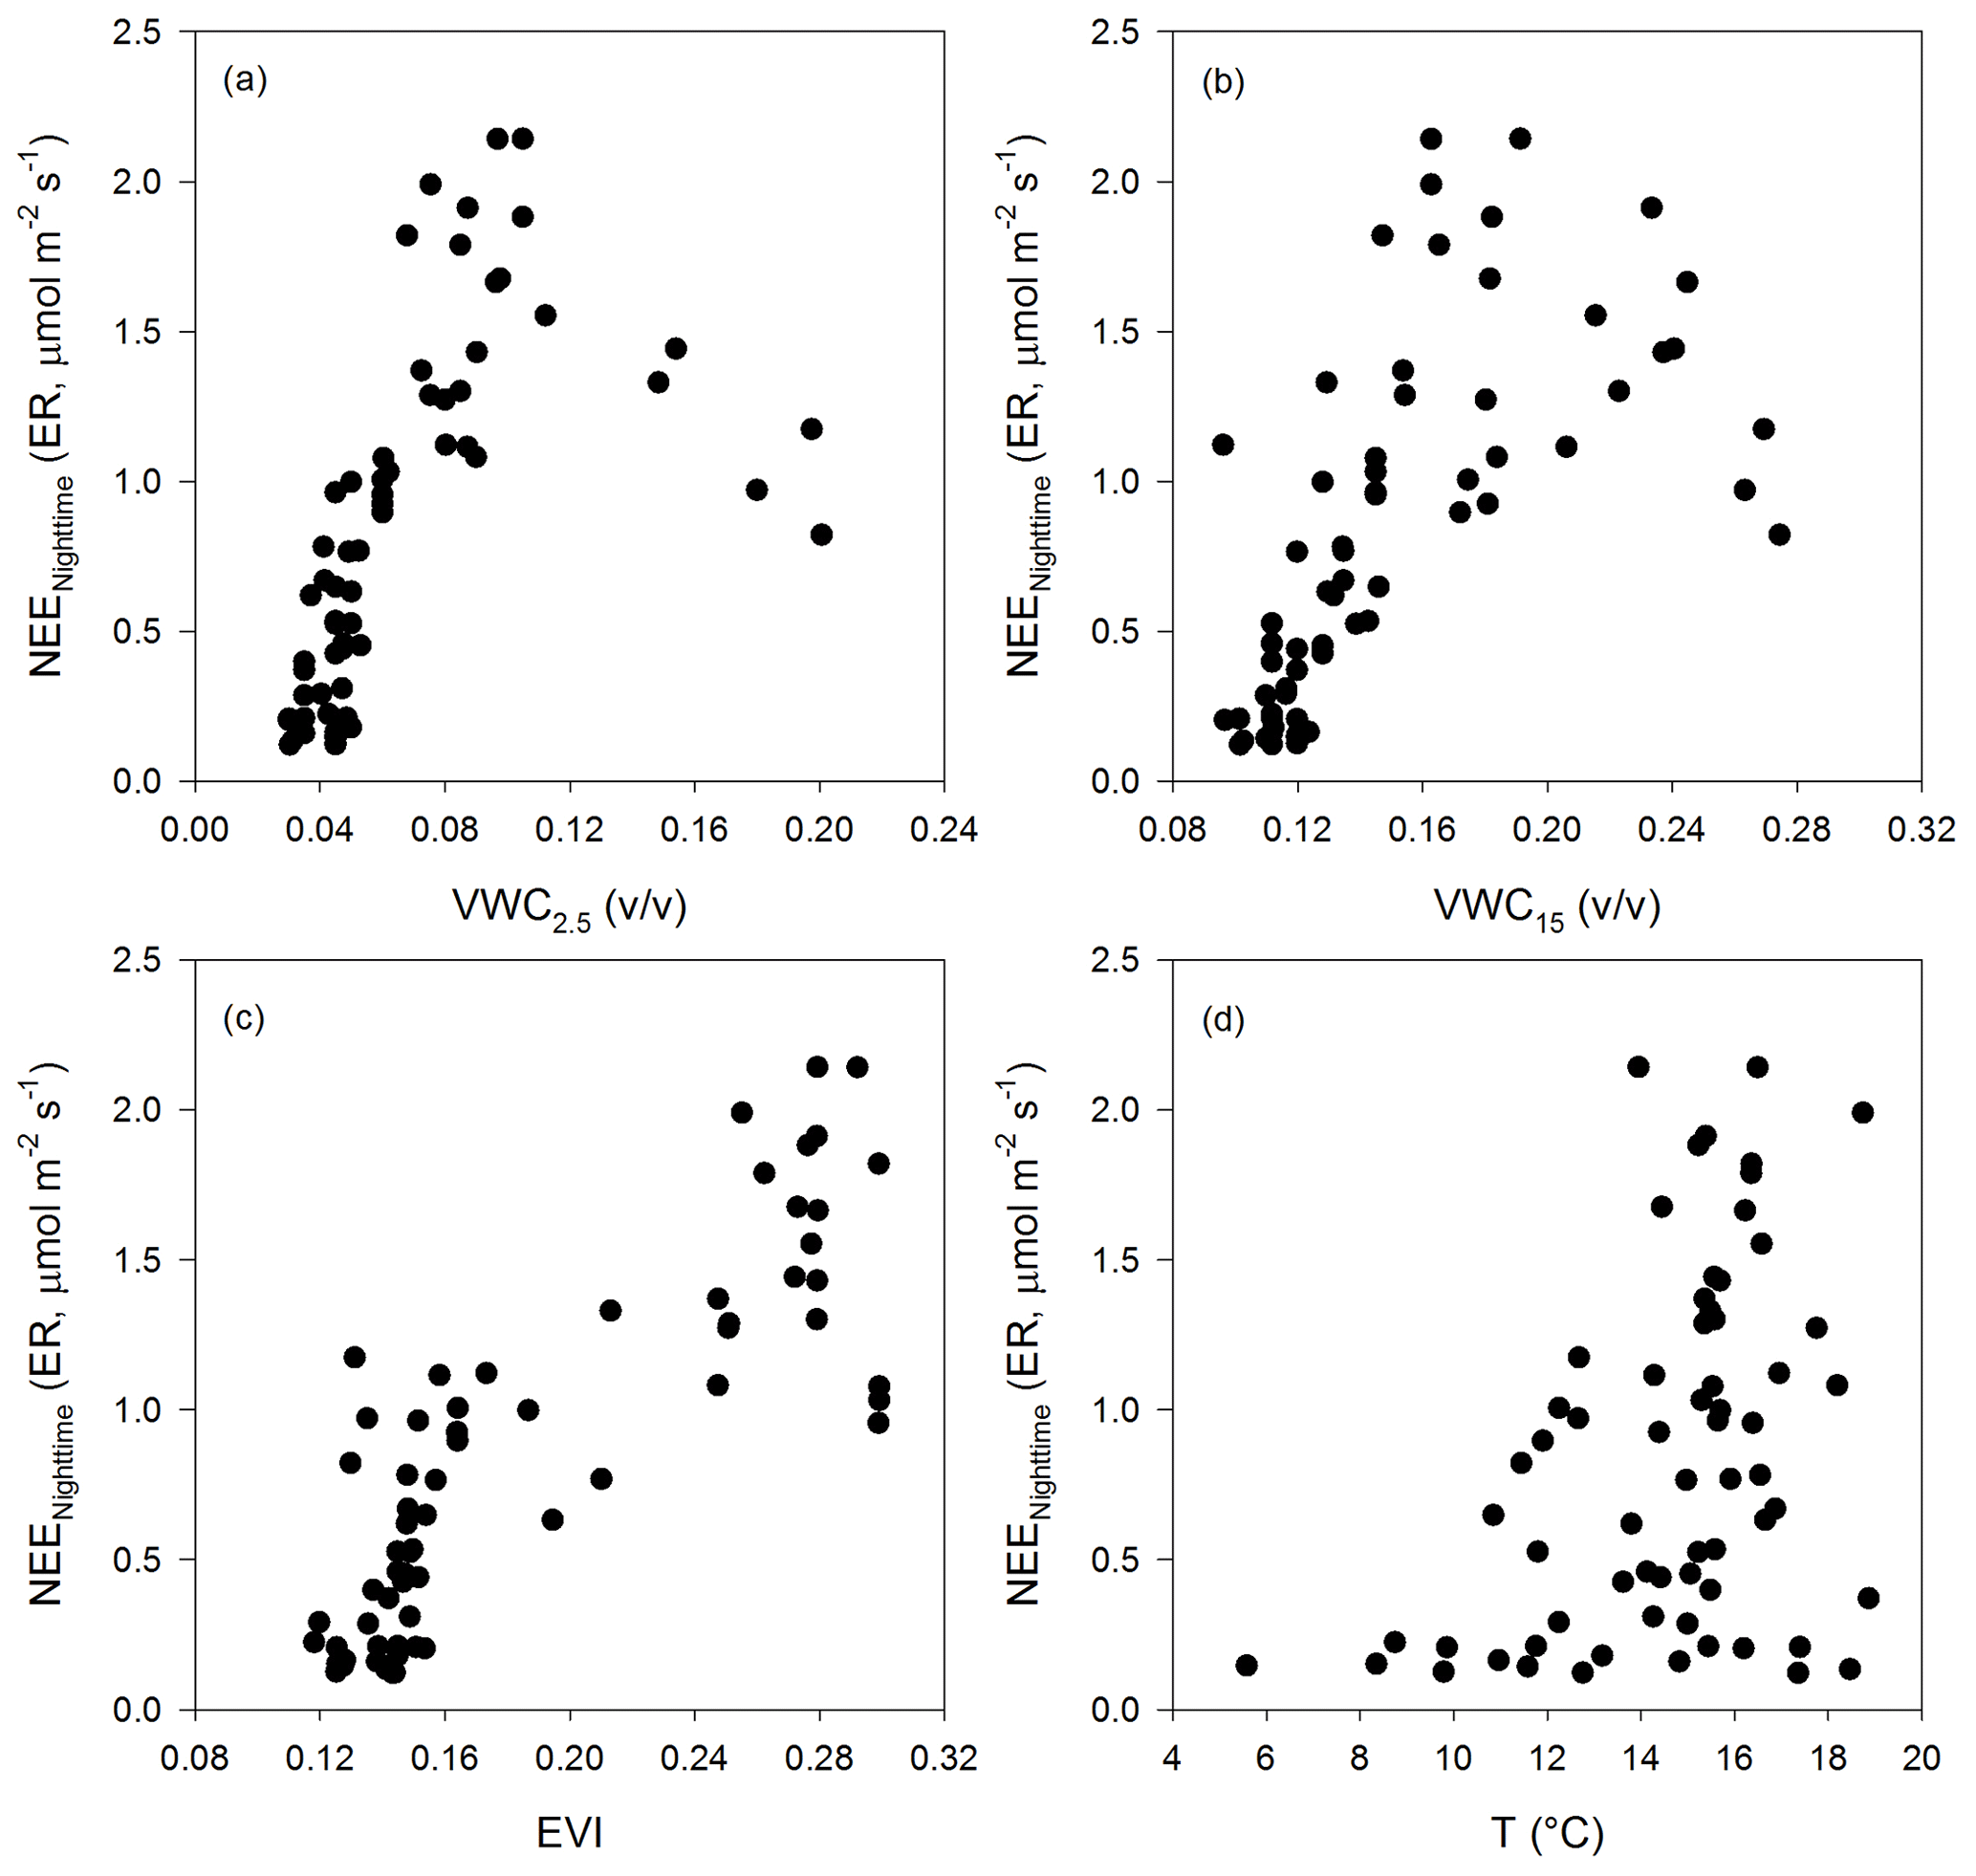
Figure A4The relationship between nighttime-NEE-derived ER and (a) the soil volumetric water content at 2.5 cm depth (VWC2.5, ), (b) the soil volumetric water content at 15 cm depth (VWC15, ), (c) the enhanced vegetation index (EVI), and (d) the air temperature (T, ∘C).
The datasets used for this study are available at Zenodo https://doi.org/10.5281/zenodo.7379206 (Delgado Balbuena, 2022).
The study was conceived by JDB, TA, HWL, and RV. JDB, TA, and CAAG obtained and processed eddy covariance data. JDB, TAR, and LFPM implemented the method and performed the data analyses. TAR and CAAG obtained and processed the enhanced vegetation index data. TA, HWL, LFPM, and RV helped to interpret the results. JDB, TA, HWL, and RV prepared the first draft, and all authors contributed to the discussion of the results and the revisions of the paper.
The contact author has declared that none of the authors has any competing interests.
Any opinions, findings, conclusions, and recommendations expressed in this material are those of the authors and do not necessarily reflect the views of their sponsoring agencies.
Publisher's note: Copernicus Publications remains neutral with regard to jurisdictional claims in published maps and institutional affiliations.
The authors thank INIFAP for the facilities at the CENID Agricultura Familiar research site in Ojuelos, Jalisco, to carry out this study. Henry W. Loescher acknowledges the National Science Foundation (NSF) for ongoing support under the cooperative support agreement to Battelle.
This research has been supported by the Consejo Nacional de Ciencia y Tecnología (grant nos. CF 320641, CB 2008-01 102855, and CB 2013 220788), Consejo Nacional de Ciencia y Tecnología – Secretaría del Medio ambiente y Recursos Naturales (grant no. 108000), and the National Science Foundation (grant no. EF-1029808).
This paper was edited by Paul Stoy and reviewed by two anonymous referees.
Aguado-Santacruz, G. A.: Efecto de factores ambientales sobre la dinámica vegetacional en pastizales de los Llanos de Ojuelos, Jalisco: un enfoque multivariable, Colegio de Postgraduados, Chapingo, México, 155 pp., 1993.
Aguirre-Gutiérrez, C. A., Holwerda, F., Goldsmith, G. R., Delgado, J., Yepez, E., Carbajal, N., Escoto-Rodríguez, M., and Arredondo, J. T.: The importance of dew in the water balance of a continental semiarid grassland, J. Arid Environ., 168, 26–35, https://doi.org/10.1016/j.jaridenv.2019.05.003, 2019.
Arca, V., Power, S. A., Delgado-Baquerizo, M., Pendall, E., and Ochoa-Hueso, R.: Seasonal effects of altered precipitation regimes on ecosystem-level CO2 fluxes and their drivers in a grassland from Eastern Australia, Plant Soil, 460, 435–451, https://doi.org/10.1007/s11104-020-04811-x, 2021.
Bailey, V. L., Pries, C. H., and Lajtha, K.: What do we know about soil carbon destabilization?, Environ. Res. Lett., 14, 083004, https://doi.org/10.1088/1748-9326/ab2c11, 2019.
Bastida, F., García, C., Fierer, N., Eldridge, D. J., Bowker, M. A., Abades, S., Alfaro, F. D., Asefaw Berhe, A., Cutler, N. A., Gallardo, A., García-Velázquez, L., Hart, S. C., Hayes, P. E., Hernández, T., Hseu, Z. Y., Jehmlich, N., Kirchmair, M., Lambers, H., Neuhauser, S., Peña-Ramírez, V. M., Pérez, C. A., Reed, S. C., Santos, F., Siebe, C., Sullivan, B. W., Trivedi, P., Vera, A., Williams, M. A., Luis Moreno, J., and Delgado-Baquerizo, M.: Global ecological predictors of the soil priming effect, Nat. Commun., 10, 1–9, https://doi.org/10.1038/s41467-019-11472-7, 2019.
Belnap, J.: Microbes and Microfauna Associated with Biological Soil Crusts, in: Biological Soil Crusts: Structure, Function, and Management, edited by: Belnap, J. and Lange, O. L., Springer Berlin Heidelberg, Berlin, Heidelberg, 167–174, https://doi.org/10.1007/978-3-642-56475-8_14, 2003.
Birch, H. F.: Mineralisation of plant nitrogen following alternate wet and dry conditions, Plant Soil, 20, 43–49, https://doi.org/10.1007/BF01378096, 1964.
Borken, W. and Matzner, E.: Reappraisal of drying and wetting effects on C and N mineralization and fluxes in soils, Glob. Change Biol., 15, 808–824, https://doi.org/10.1111/j.1365-2486.2008.01681.x, 2009.
Bowling, D. R., Grote, E. E., and Belnap, J.: Rain pulse response of soil CO2 exchange by biological soil crusts and grasslands of the semiarid Colorado Plateau, United States, J. Geophys. Res.-Biogeo., 116, G03028, https://doi.org/10.1029/2011JG001643, 2011.
Chen, L., Liu, L., Qin, S., Yang, G., Fang, K., Zhu, B., Kuzyakov, Y., Chen, P., Xu, Y., and Yang, Y.: Regulation of priming effect by soil organic matter stability over a broad geographic scale, Nat. Commun., 10, 1–10, https://doi.org/10.1038/s41467-019-13119-z, 2019.
Christensen, J. H., Hewitson, B., Busuioc, A., Chen, A., Gao, X., Held, I., Jones, R., Kolli, R. K., Kwon, W. T., Laprise, R., Magana Rueda, V., Mearns, L., Menéndez, C. G., Räisänen, J., Rinke, A., Sarr, A., and Whetton, P.: Regional Climate Projections, in: Climate Change 2007: The Physical Science Basis. Contribution of Working Group I to the Fouth Assessment Report of the Intergovernmental Panel on Climate Change, edited by: Solomon, S., Qin, D., Manning, M., Chen, Z., Marquis, M., Averyt, K. B., Tignor, M., and Miller, H. L., Cambridge University Press, Cambridge, United Kingdom and New York, NY, USA, 847–940, https://doi.org/10.1080/07341510601092191, 2007.
Collins, S. L., Sinsabaugh, R. L., Crenshaw, C., Green, L., Porras-Alfaro, A., Stursova, M., and Zeglin, L. H.: Pulse dynamics and microbial processes in aridland ecosystems: Pulse dynamics in aridland soils, J. Ecol., 96, 413–420, https://doi.org/10.1111/j.1365-2745.2008.01362.x, 2008.
Concostrina-Zubiri, L., Huber-Sannwald, E., Martínez, I., Flores Flores, J. L., Reyes-Agüero, J. A., Escudero, A., and Belnap, J.: Biological soil crusts across disturbance-recovery scenarios: Effect of grazing regime on community dynamics, Ecol. Appl., 24, 1863–1877, https://doi.org/10.1890/13-1416.1, 2014.
Darenova, E., Holub, P., Krupkova, L., and Pavelka, M.: Effect of repeated spring drought and summer heavy rain on managed grassland biomass production and CO2 efflux, J. Plant Ecol., 10, 476–485, https://doi.org/10.1093/jpe/rtw058, 2017.
Delgado Balbuena, J.: Data on: Dynamics of short-term ecosystem carbon fluxes induced by precipitation events in a semiarid grassland, Zenodo [data set], https://doi.org/10.5281/zenodo.7379206, 2022.
Delgado-Balbuena, J., Arredondo, J. T., Loescher, H. W., Pineda-Martínez, L. F., Carbajal, J. N., and Vargas, R.: Seasonal Precipitation Legacy Effects Determine the Carbon Balance of a Semiarid Grassland, J. Geophys. Res.-Biogeo., 124, 987–1000, https://doi.org/10.1029/2018JG004799, 2019.
Didan, K.: MOD13Q1 MODIS/Terra Vegetation Indices 16-Day L3 Global 250 m SIN Grid V061, NASA EOSDIS Land Processes DAAC [data set], https://doi.org/10.5067/MODIS/MOD13Q1.061, 2021.
Easterling, D. R., Meehl, G. A., Parmesan, C., Changnon, S. A., Karl, T. R., and Mearns, L. O.: Climate Extremes: Observations, Modeling, and Impacts, Science, 289, 2068–2074, 2000.
Elith, J., Leathwick, J. R., and Hastie, T.: A working guide to boosted regression trees, J. Anim. Ecol., 77, 802–813, https://doi.org/10.1111/j.1365-2656.2008.01390.x, 2008.
Fierer, N. and Schimel, J. P.: Effects of drying–rewetting frequency on soil carbon and nitrogen transformations, Soil Biol. Biochem., 34, 777–787, https://doi.org/10.1016/S0038-0717(02)00007-X, 2002.
Foken, T., Leuning, R., Oncley, S. R., Mauder, M., and Aubinet, M.: Corrections and Data Quality Control, in: Eddy Covariance, Springer Netherlands, Dordrecht, 85–131, https://doi.org/10.1007/978-94-007-2351-1_4, 2012.
Haynes, R. J. and Swift, R. S.: Stability of soil aggregates in relation to organic constituents and soil water content, J. Soil Sci., 41, 73–83, https://doi.org/10.1111/j.1365-2389.1990.tb00046.x, 1990.
Homyak, P. M., Blankinship, J. C., Slessarev, E. W., Schaeffer, S. M., Manzoni, S., and Schimel, J. P.: Effects of altered dry season length and plant inputs on soluble soil carbon, Ecology, 99, 2348–2362, https://doi.org/10.1002/ecy.2473, 2018.
Huxman, T. E., Smith, M. D., Fay, P. A., Knapp, A. K., Shaw, M. R., Loik, M. E., Smith, S. D., Tissue, D. T., Zak, J. C., Weltzin, J. F., Pockman, W. T., Sala, O. E., Haddad, B. M., Harte, J., Koch, G. W., Schwinning, S., Small, E. E., and Williams, D. G.: Convergence across biomes to a common rain-use efficiency, Nature, 429, 651–654, https://doi.org/10.1038/nature02561, 2004a.
Huxman, T. E., Snyder, K. A., Tissue, D., Leffler, A. J., Ogle, K., Pockman, W. T., Sandquist, D. R., Potts, D. L., and Schwinning, S.: Precipitation pulses and carbon fluxes in semiarid and arid ecosystems, Oecologia, 141, 254–268, https://doi.org/10.1007/s00442-004-1682-4, 2004b.
Jarvis, P., Rey, A., Petsikos, C., Wingate, L., Rayment, M., Pereira, J., Banza, J., David, J., Miglietta, F., Borghetti, M., Manca, G., and Valentini, R.: Drying and wetting of Mediterranean soils stimulates decomposition and carbon dioxide emission: the “Birch effect”, Tree Physiol., 27, 929–940, 2007.
Kim, D.-G., Vargas, R., Bond-Lamberty, B., and Turetsky, M. R.: Effects of soil rewetting and thawing on soil gas fluxes: a review of current literature and suggestions for future research, Biogeosciences, 9, 2459–2483, https://doi.org/10.5194/bg-9-2459-2012, 2012.
Korell, L., Auge, H., Chase, J. M., Harpole, W. S., and Knight, T. M.: Responses of plant diversity to precipitation change are strongest at local spatial scales and in drylands, Nat. Commun., 12, 2489, https://doi.org/10.1038/s41467-021-22766-0, 2021.
Kurc, S. A. and Small, E. E.: Soil moisture variations and ecosystem-scale fluxes of water and carbon in semiarid grassland and shrubland, Water Resour. Res., 43, W06416, https://doi.org/10.1029/2006WR005011, 2007.
Lado-Monserrat, L., Lull, C., Bautista, I., Lidon, A., and Herrera, R.: Soil moisture increment as a controlling variable of the “Birch effect”. Interactions with the pre-wetting soil moisture and litter addition, Plant Soil, 379, 21–34, https://doi.org/10.1007/s11104-014-2037-5, 2014.
Lal, R.: Carbon Sequestration in Dryland Ecosystems, Environ. Manage., 33, 528–544, https://doi.org/10.1007/s00267-003-9110-9, 2004.
Lasslop, G., Reichstein, M., Papale, D., Richardson, A. D., Arneth, A., Barr, A., Stoy, P., and Wohlfahrt, G.: Separation of net ecosystem exchange into assimilation and respiration using a light response curve approach: critical issues and global evaluation: SEPARATION OF NEE INTO GPP AND RECO, Glob. Change Biol., 16, 187–208, https://doi.org/10.1111/j.1365-2486.2009.02041.x, 2010.
Lauenroth, W. K. and Sala, O. E.: Long-term forage production of North American shortgrass steppe, Ecol. Appl., 2, 397–403, https://doi.org/10.2307/1941874, 1992.
Loescher, H. W., Law, B. E., Mahrt, L., Hollinger, D. Y., Campbell, J., and Wofsy, S. C.: Uncertainties in, and interpretation of, carbon flux estimates using eddy covariance techniques, J. Geophys. Res., 111, D21S90, https://doi.org/10.1029/2005JD006932, 2006.
Loik, M. E., Breshears, D. D., Lauenroth, W. K., and Belnap, J.: A multi-scale perspective of water pulses in dryland ecosystems: Climatology and ecohydrology of the western USA, Oecologia, 141, 269–281, https://doi.org/10.1007/s00442-004-1570-y, 2004.
Maliva, R. and Missimer, T.: Precipitation and Evapotranspiration, in: Arid Lands Water Evaluation and Management, Springer Berlin Heidelberg, 163–185, https://doi.org/10.1007/978-3-642-29104-3_7, 2012.
Massman, W. J.: A simple method for estimating frequency response corrections for eddy covariance systems, Agr. Forest Meteorol., 104, 185–198, https://doi.org/10.1016/S0168-1923(00)00164-7, 2000.
Medina-Roldán, E., Arredondo Moreno, J. T., García Moya, E., and Huerta Martínez, F. M.: Soil Water Content Dynamics Along a Range Condition Gradient in a Shortgrass Steppe, Rangeland Ecol. Manag., 60, 79–87, https://doi.org/10.2111/05-219R2.1, 2007.
Medina-Roldán, E., Huber-Sannwald, E., and Arredondo, J. T.: Plant phenotypic functional composition effects on soil processes in a semiarid grassland, Soil Biol. Biochem., 66, 1–9, https://doi.org/10.1016/j.soilbio.2013.06.011, 2013.
Nielsen, U. N. and Ball, B. A.: Impacts of altered precipitation regimes on soil communities and biogeochemistry in arid and semi-arid ecosystems, Glob. Change Biol., 21, 1407–1421, https://doi.org/10.1111/gcb.12789, 2015.
Noy-Meir, I.: Desert Ecosystems: Environment and Producers, Annu. Rev. Ecol. Syst., 4, 25–51, 1973.
Ocheltree, T. W. and Loescher, H. W.: Design of the AmeriFlux portable eddy covariance system and uncertainty analysis of carbon measurements, J. Atmos. Ocean. Tech., 24, 1389–1406, https://doi.org/10.1175/JTECH2064.1, 2007.
Ogle, K. and Reynolds, J. F.: Plant responses to precipitation in desert ecosystems: integrating functional types, pulses, thresholds, and delays, Oecologia, 141, 282–294, https://doi.org/10.1007/s00442-004-1507-5, 2004.
Parton, W., Morgan, J., Smith, D., Del Grosso, S., Prihodko, L., LeCain, D., Kelly, R., and Lutz, S.: Impact of precipitation dynamics on net ecosystem productivity, Glob. Change Biol., 18, 915–927, https://doi.org/10.1111/j.1365-2486.2011.02611.x, 2012.
Placella, S. A., Brodie, E. L., and Firestone, M. K.: Rainfall-induced carbon dioxide pulses result from sequential resuscitation of phylogenetically clustered microbial groups, P. Natl. Acad. Sci. USA, 109, 10931–10936, https://doi.org/10.1073/pnas.1204306109, 2012.
Reichmann, L. G., Sala, O. E., and Peters, D. P. C.: Water controls on nitrogen transformations and stocks in an arid ecosystem, Ecosphere, 4, 1–17, https://doi.org/10.1890/ES12-00263.1, 2013.
Reichstein, M., Falge, E., Baldocchi, D., Papale, D., Aubinet, M., Berbigier, P., Bernhofer, C., Buchmann, N., Gilmanov, T., Granier, A., Grünwald, T., Havránková, K., Ilvesniemi, H., Janous, D., Knohl, A., Laurila, T., Lohila, A., Loustau, D., Matteucci, G., Meyers, T., Miglietta, F., Ourcival, J. M., Pumpanen, J., Rambal, S., Rotenberg, E., Sanz, M., Tenhunen, J., Seufert, G., Vaccari, F., Vesala, T., Yakir, D., and Valentini, R.: On the separation of net ecosystem exchange into assimilation and ecosystem respiration: Review and improved algorithm, Glob. Change Biol., 11, 1424–1439, https://doi.org/10.1111/j.1365-2486.2005.001002.x, 2005.
Ruimy, A., Jarvis, P. G., Baldocchi, D. D., and Saugier, B.: CO2 Fluxes over Plant Canopies and Solar Radiation: A Review, in: Advances in Ecological Research, Vol. 26, edited by: Begon, M. and Fitter, A. H., Academic Press, 1–68, https://doi.org/10.1016/S0065-2504(08)60063-X, 1995.
Sala, O. E. and Lauenroth, W. K.: Small rainfall events: An ecological role in semiarid regions, Oecologia, 53, 301–304, https://doi.org/10.1007/BF00389004, 1982.
Schimel, J. P. and Bennett, J.: Nitrogen mineralization: challenges of a changing paradigm, Ecology, 85, 591–602, 2004.
Schotanus, P., Nieuwstadt, F. T. M., and De Bruin, H. A. R.: Temperature measurement with a sonic anemometer and its application to heat and moisture fluxes, Bound.-Lay. Meteorol., 26, 81–93, https://doi.org/10.1007/BF00164332, 1983.
Thomey, M. L., Collins, S. L., Vargas, R., Johnson, J. E., Brown, R. F., Natvig, D. O., and Friggens, M. T.: Effect of precipitation variability on net primary production and soil respiration in a Chihuahuan Desert grassland: Precipitation variability in desert grasslands, Glob. Change Biol., 17, 1505–1515, https://doi.org/10.1111/j.1365-2486.2010.02363.x, 2011.
Turner, B. and Haygarth, P. M.: Phosphorus solubilization in rewetted soils, Nature, 411, 258, https://doi.org/10.1002/(SICI)1097-0177(199909)216:1<1::AID-DVDY1>3.0.CO;2-T, 2001.
Unger, S., Máguas, C., Pereira, J. S., David, T. S., and Werner, C.: The influence of precipitation pulses on soil respiration – Assessing the “Birch effect” by stable carbon isotopes, Soil Biol. Biochem., 42, 1800–1810, https://doi.org/10.1016/j.soilbio.2010.06.019, 2010.
Van Gestel, M., Merckx, R., and Vlassak, K.: Microbial biomass and activity in soils with fluctuating water contents, Geoderma, 56, 617–626, https://doi.org/10.1016/0016-7061(93)90140-G, 1993.
Vargas, R., Collins, S. L., Thomey, M. L., Johnson, J. E., Brown, R. F., Natvig, D. O., and Friggens, M. T.: Precipitation variability and fire influence the temporal dynamics of soil CO2 efflux in an arid grassland, Glob. Change Biol., 18, 1401–1411, https://doi.org/10.1111/j.1365-2486.2011.02628.x, 2012.
Vargas, R., Yépez, E. A., Andrade, J. L., Ángeles, G., Arredondo, T., Castellanos, A. E., Delgado-Balbuena, J., Garatuza-Payán, J., González Del Castillo, E., Oechel, W., Rodríguez, J. C., Sánchez-Azofeifa, A., Velasco, E., Vivoni, E. R., and Watts, C.: Progress and opportunities for monitoring greenhouse gases fluxes in Mexican ecosystems: the MexFlux network, Atmósfera, 26, 325–336, https://doi.org/10.1016/S0187-6236(13)71079-8, 2013.
Vargas, R., Sánchez-Cañete P., E., Serrano-Ortiz, P., Curiel Yuste, J., Domingo, F., López-Ballesteros, A., and Oyonarte, C.: Hot-Moments of Soil CO2 Efflux in a Water-Limited Grassland, Soil Syst., 2, 47, https://doi.org/10.3390/soilsystems2030047, 2018.
Vickers, D. and Mahrt, L.: Quality Control and Flux Sampling Problems for Tower and Aircraft Data, J. Atmos. Ocean. Tech., 14, 512–526, https://doi.org/10.1175/1520-0426(1997)014<0512:QCAFSP>2.0.CO;2, 1997.
Wang, B., Chen, Y., Li, Y., Zhang, H., Yue, K., Wang, X., Ma, Y., Chen, J., Sun, M., Chen, Z., and Wu, Q.: Differential effects of altered precipitation regimes on soil carbon cycles in arid versus humid terrestrial ecosystems, Glob. Change Biol., 27, 6348–6362, https://doi.org/10.1111/gcb.15875, 2021.
Webb, E. K., Pearman, G. I., and Leuning, R.: Correction of flux measurements for density effects due to heat and water vapour transfer, Q. J. Roy. Meteorol. Soc., 106, 85–100, https://doi.org/10.1002/qj.49710644707, 1980.
Xu, L., Baldocchi, D. D., and Tang, J.: How soil moisture, rain pulses, and growth alter the response of ecosystem respiration to temperature, Global Biogeochem. Cy., 18, GB4002, https://doi.org/10.1029/2004GB002281, 2004.
Yang, X., Tang, J., and Mustard, J. F.: Beyond leaf color: Comparing camera-based phenological metrics with leaf biochemical, biophysical, and spectral properties throughout the growing season of a temperate deciduous forest, J. Geophys. Res.-Biogeo., 119, 181–191, https://doi.org/10.1002/2013JG002460, 2014.