the Creative Commons Attribution 4.0 License.
the Creative Commons Attribution 4.0 License.
 | 05 Jul 2023
Drivers of particle sinking velocities in the Peruvian upwelling system
Allanah Joy Paul
Jan Taucher
Lennart Thomas Bach
Silvan Goldenberg
Paul Stange
Fabrizio Minutolo
Ulf Riebesell
As one of Earth's most productive marine ecosystems, the Peruvian upwelling system transports large amounts of biogenic matter from the surface to the deep ocean. Whilst particle sinking velocity is a key factor controlling the biological pump, thereby affecting carbon sequestration and O2-depletion, it has not yet been measured in this system. During a 50 d mesocosm experiment in the surface waters off the coast of Peru, we assessed particle sinking velocities and their biogeochemical and physical drivers. We further characterized the general properties of exported particles under different phytoplankton communities and nutritional states. Average sinking velocities varied between size classes and ranged from 12.8 ± 0.7 m d−1 (particles 40–100 µm) to 19.4 ± 0.7 m d−1 (particles 100–250 µm) and 34.2 ± 1.5 m d−1 (particles 250–1000 µm) (± 95 % CI). Despite a distinct plankton succession from diatoms to dinoflagellates with concomitant 5-fold drop in opal ballasting, substantial changes in sinking velocity were not observed. This illustrates the complexity of counteracting factors driving the settling behaviour of marine particles. In contrast, we found higher sinking velocities with increasing particle size and roundness and decreasing porosity. Size had by far the strongest influence among these physical particle properties, despite a high amount of unexplained variability. Our study provides a detailed analysis of the drivers of particle sinking velocity in the Peruvian upwelling system, which allows modellers to optimize local particle flux parameterization. This will help to better project oxygen concentrations and carbon sequestration in a region that is subject to substantial climate-driven changes.
- Article
(13962 KB) - Full-text XML
- BibTeX
- EndNote


The Peruvian upwelling system is one of the most productive marine ecosystems in the world (Pennington et al., 2006). It is situated along the Peruvian and northern Chilean coasts in the boundary current system of the eastern tropical South Pacific and is one of four major eastern boundary upwelling systems (EBUSs). It is characterized by strong Ekman-transport-induced upwelling of nutrient-rich subsurface water along the coast, which results in a shallow thermocline that confines an optimal phytoplankton habitat. The high primary productivity of Peru's “brown waters” sustains a rich ecosystem with abundant fish and other larger organisms and leads to the vertical transport of large amounts of biogenic matter (Kämpf and Chapman, 2016). This sinking flux fuels high respiration rates in the subsurface, which in combination with slow ventilation results in permanently oxygen-deficient waters (Chavez and Messié, 2009). These can start at 50 m depth and shallower (Kämpf and Chapman, 2016; Karthäuser et al., 2021), stretch hundreds of metres of depth (Karstensen et al., 2008) and extend up to 1000 km from the coast. The dimensions and biogeochemical properties of this oxygen minimum zone (OMZ) are directly affected by the amount and properties of sinking material (Kalvelage et al., 2013; Karthäuser et al., 2021).
A key metric of sinking biogenic matter is the velocity with which particles settle (e.g. Alldredge and Gotschalk, 1988). Sinking velocity influences the export efficiency of biogenic matter out of the surface layer and its transfer efficiency through the mesopelagic zone, two biological carbon pump processes that sequester CO2 (Khatiwala et al., 2013; McDonnell et al., 2015). In the Peruvian upwelling system, sinking velocity additionally determines the length of exposure of a particle to deoxygenated OMZ waters. Here, the degradation of small sinking particles (< 500 µm) might contribute significantly to the loss of nitrogen via anammox (Karthäuser et al., 2021) and hence to the sustained presence of the subsurface OMZ.
Sinking velocity is controlled by a variety of physical characteristics. A particle's excess density compared to seawater ultimately determines if it sinks and how fast. Amongst particles of the same composition and structure, larger particles sink faster (Alldredge and Gotschalk, 1988). Yet, a small but dense particle can sink faster than a larger, more porous one (McDonnell and Buesseler, 2010). Although a size–sinking velocity relationship has not been detected in some observational datasets (e.g. Iversen and Lampitt, 2020), a recent meta-analysis resolved a relatively weak but clear relationship (Cael et al., 2021). Particle size can thus be an important driver for sinking velocity in some particle types but a weak one in others, where it is often obscured by factors like ballast minerals or particle geometry (Cael et al., 2021).
Particle density and size are dependent on physical processes, such as turbulence and shear, as well as on biological processes, which influence the structure, shape and composition of a particle. Diatom blooms can produce large cells with appendages that promote aggregation and can lead to fast sinking matter (Smetacek et al., 2012). An oligotrophic phytoplankton community, on the other hand, consists of smaller cells, which tend to sink slower (Guidi et al., 2009). Biomineral ballast produced by phytoplankton and zooplankton is denser than organic matter (calcium carbonate, opal and organic matter densities: 2.71, 2.1 and ∼ 1.06 g cm−3, respectively; Klaas and Archer, 2002) and can enhance particle sinking velocities (Armstrong et al., 2009). Furthermore, the porosity of a particle (i.e. the fraction of particle volume occupied by seawater) affects its density (Laurenceau-Cornec et al., 2020). If organic matter is densely packed, e.g. by zooplankton into a fecal pellet, it has a higher excess density and sinks faster compared to one that is packed more loosely (Steinberg and Landry, 2017; Bach et al., 2019). The plankton community structure thus influences physical characteristics of sinking particles (Bach et al., 2019; Turner, 2015; Guidi et al., 2009).
Here, we report sinking velocities and physical particle properties of more than 100 000 individual particles collected during a mesocosm study in the Peruvian upwelling system (Bach et al., 2020). We determine relationships between velocity and particle size, shape and porosity. We further assessed how sinking velocities change with the quantity and stoichiometry of the overall export flux, as well as with the proportion of biogenic ballast, and try to decipher the influence of the prevailing phytoplankton community. Our study provides insights into the controls of particle sinking velocity, a key aspect of carbon sequestration and OMZ shaping processes.
2.1 Experimental setup
Our experimental setup consisted of eight sea-going mesocosms (M1–M8, see Riebesell et al., 2013), which were moored in the coastal upwelling area off Callao, Peru (12.06∘ S, 77.23∘ W, Fig. 1), on 23 February 2017 (late austral summer). The top and bottom openings were equipped with screens of 3 mm mesh size to keep larger organisms such as small pelagic fish out of the mesocosms. The mesocosms were left fully submerged for 2 d after mooring to ensure a flow-through of surrounding Pacific water. Afterwards, the two screens of each mesocosm were removed, the top was pulled above sea level and a cone-shaped sediment trap was attached to the bottom, thereby enclosing a pelagic community inside the mesocosms. They contained ∼ 54 m3 of seawater and extended 19 m below the water surface, which was well below the mixed layer depth at the time of mesocosm enclosure (5 m) and throughout the rest of the experiment (max. 15 m). The closing of the mesocosms marked the start of the experiment (t0, 25 February), which lasted for 50 d until 16 April.
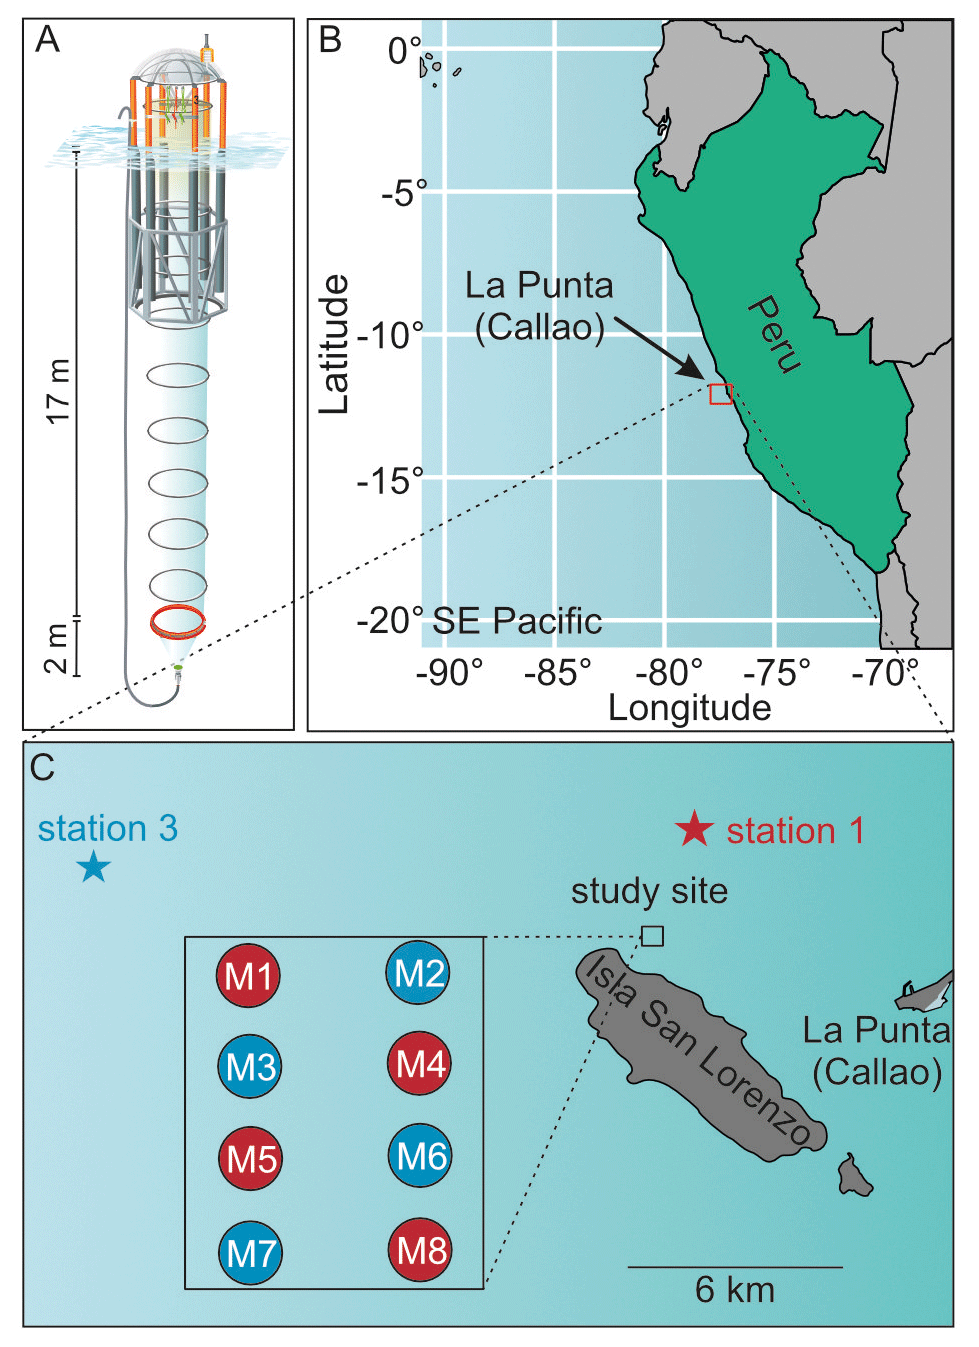
Figure 1(a) Mesocosm design, (b) geographical location of study site and (c) detailed map of study site and locations of oxygen-minimum-zone water acquisition. Figure taken from Bach et al. (2020).
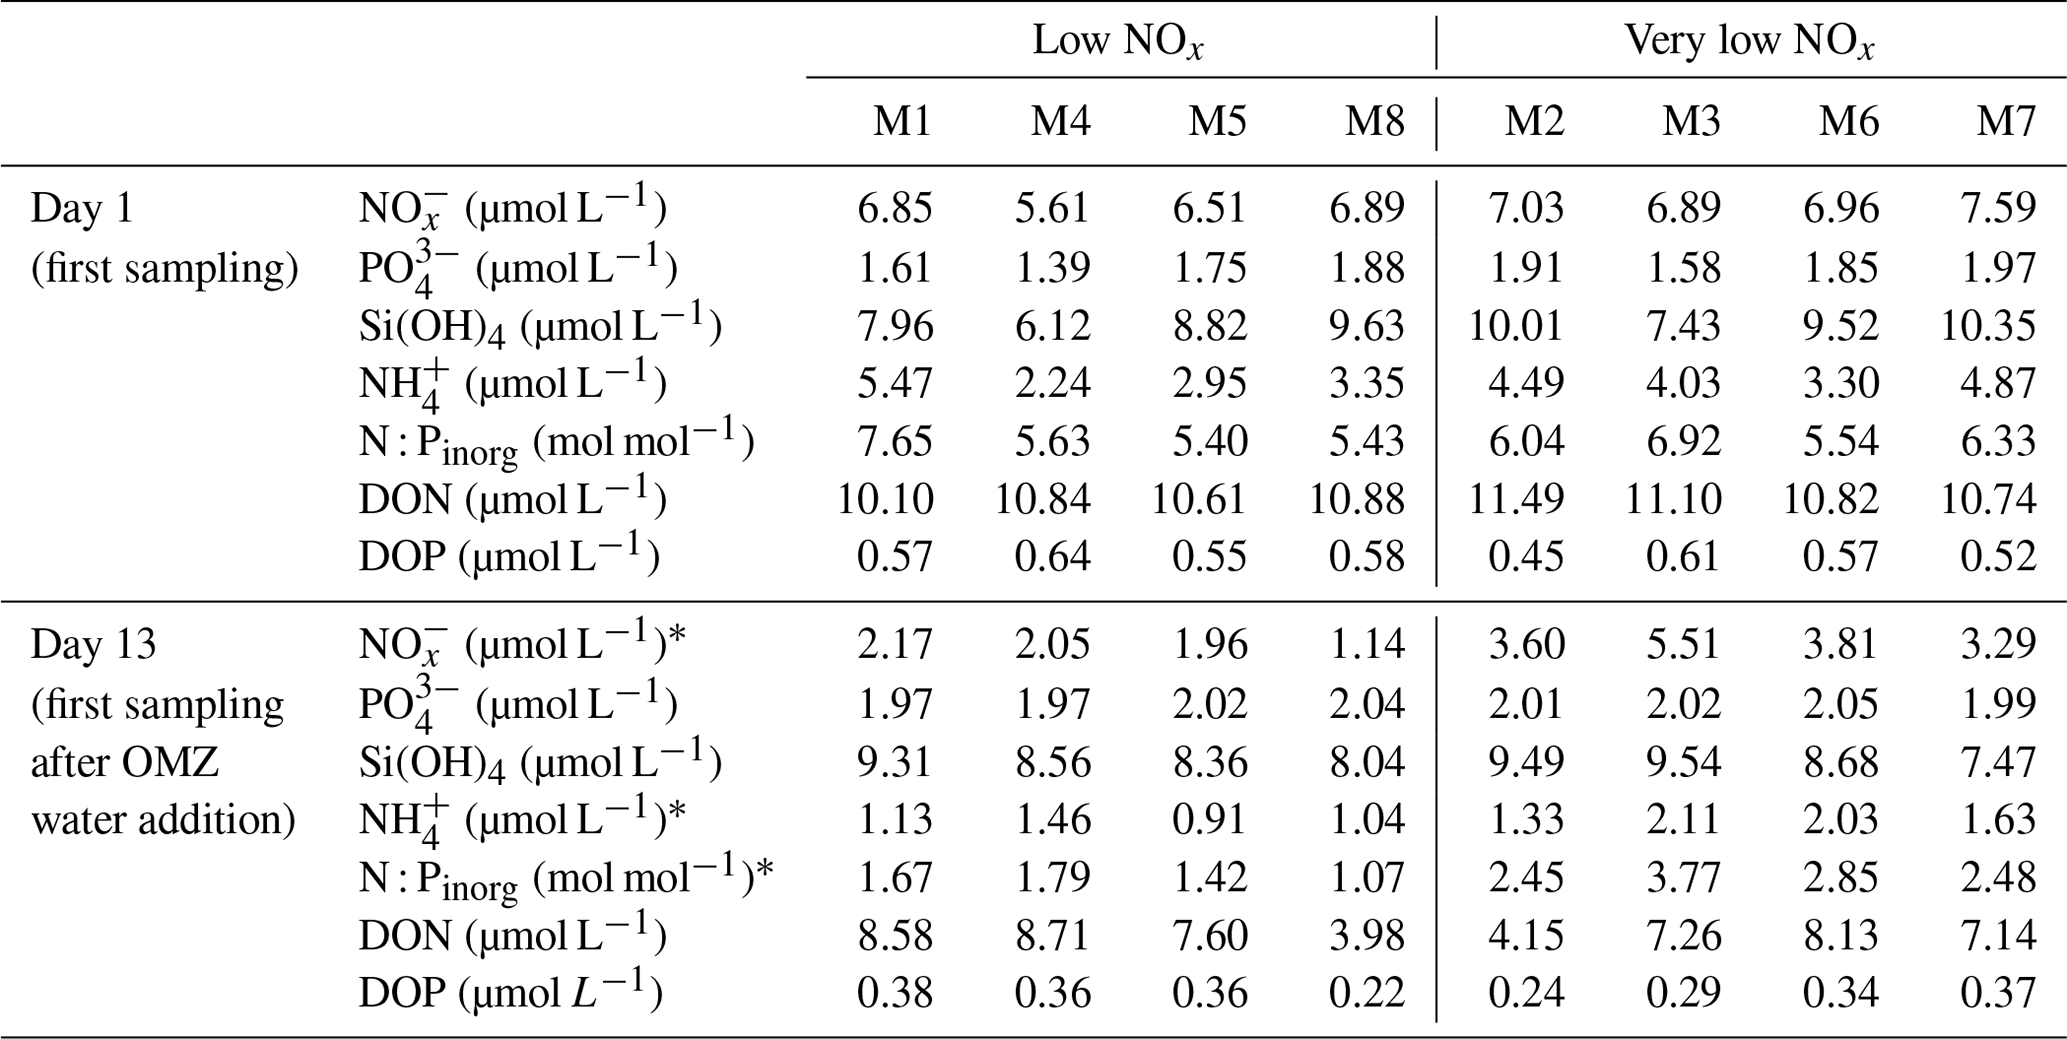
To simulate an upwelling event and test the effect of oxygen-minimum-zone-influenced (OMZ-influenced) water masses on the natural plankton community, we collected two different OMZ-influenced water batches and added them to the mesocosms. The batches differed from each other in terms of NO (nitrate + nitrite) concentrations. One had low NO and the other very low NO concentrations of 4 and 0.3 µmol L−1, respectively, compared to the naturally occurring waters of the coastal upwelling area. The upwelling event was simulated on t11 and t12 by replacing 20 m3 of mesocosm water with OMZ-influenced water in every mesocosm using a submersible pump (Grundfos SP 17-5R, pump rate ∼ 18 m3 h−1). Mesocosms M1, M4, M5 and M8 received water from station 1 (low NO), whereas mesocosms M2, M3, M6 and M7 were treated with water from station 3 (very low NO). Table 1 shows the changes in the dissolved nutrient pools following the additions.
An overview of the basic system parameters, as well as detailed information on the experimental setup, mesocosm maintenance, sampling procedure and sample analysis, is given in a complementary paper by Bach et al. (2020).
Table 1Nutrient concentrations at the beginning of the experiment and after the OMZ water addition. Asterisks indicate significant differences between OMZ treatments (two-tailed t test). Table modified from Bach et al. (2020).
2.2 Sampling procedure
Long silicon tubes were connected to the bottom of the sediment traps, through which sedimented matter was sampled using a manual vacuum pump (< 0.3 bar; see Boxhammer et al., 2016). The tubes were connected to 5 L glass sampling bottles (Schott, Denmark) via a glass pipe, through which the sampled material was screened. By observing the colour and texture of the sampled suspension, we were able to abort the sampling once all sediment was collected. Non-sinking particles hovering close above the accumulated sediment might have unintentionally been sampled as well; however, due to the high amount of sedimented material (on average 9.3 g dry weight per sampling per mesocosm), the introduced error would have been negligible. The sample bottles (Schott, Denmark) were stored dark and cool for ∼ 1 h until arrival in the lab. There, they were gently rotated, and the mixed sediment suspension was subsampled for particle sinking velocity measurements using a pipette.
Bulk water column samples were taken at least every second day and were used for a variety of parameters, among which were chlorophyll a and phytoplankton community composition (Bach et al., 2020). Depth-integrated water samples were taken using 5 L water samplers equipped with pressure sensors (Hydro-Bios, Germany). The samples were transferred into 10 L carboys and transported to the onshore laboratories.
2.3 Sample analysis
All samples were processed in onshore laboratories inside the Club Náutico Del Centro Naval and the Instituto del Mar del Perú (IMARPE), both located in La Punta (Callao), and were either measured directly or prepared for transport to the GEOMAR Helmholtz Centre for Ocean Research Kiel for later analyses.
2.3.1 Sinking velocity and particle properties
Sinking velocity and optical particle properties were measured via video microscopy using the method described in Bach et al. (2012) and further developed in previous studies (Bach et al., 2019; Baumann et al., 2021). The sediment subsamples were transferred to a sinking chamber (edge length: 1×1 cm), which was mounted vertically in a FlowCam device (Fluid Imaging Technologies, United States). The trajectories of sinking particles were recorded for 20 min at ∼ 7 frames s−1, and sinking velocities were calculated by fitting a linear model to the vertical positions and time stamps of multiple captures of the same particle. Besides position and time, the FlowCam measured proxies for several physical particle properties for each individual particle. Particle size was estimated as equivalent spherical diameter (ESD) and shape as the aspect ratio (length-to-width ratio). Unfortunately, we could not determine the orientation of the sinking particles in front of the lens, leaving an uncertainty as to the actual shape of elongated sinking particles. Furthermore, porosity was estimated as a size-normalized measure for particle intensity (Pint). To calculate it, each particle image was transformed to greyscale, with dark pixels considered optically opaque (low intensity) and bright pixels translucent (high intensity, pixel intensity ranging from 0 to 255). The underlying assumption is that a particle looks brighter when it is more porous, compared to a darker-appearing particle. Since most larger particles are generally more porous than smaller ones (Laurenceau-Cornec et al., 2020), we combined the intensity value with particle size (i.e. ESD) and calculated porosity (Pint) following Bach et al. (2019).
Particles out of focus were excluded from the analysis based on their sharpness, which the FlowCam software calculated using edge detection. Sinking velocities were corrected for wall effects of the sinking chamber using the equation given in Ristow (1997), which increased values on average by 0.82 % (± 0.77 % SD). The accuracy of the sinking velocity measurements was shown to be high by Bach et al. (2012, Fig. 2a), who measured polystyrene beads and compared them to theoretical sinking velocity (SV) values calculated by Stokes' law (< 1 % difference). Measurements were carried out in a temperature controlled lab, which was set to daily in situ temperatures of between 16 and 21 ∘C. Calculations were done using the MATLAB script described by Bach et al. (2012), which was adjusted for a broader particle size spectrum (40–1000 µm). Further data analysis was carried out using the R software (R Core Team, 2021; version 4.1.2) and the package “tidyverse” (Wickham et al., 2019).
Unfortunately, the original FlowCam images were lost after processing, leaving us with sinking velocity and physical particle properties for measured particles but without their respective pictures. We could thus not separate particles into different classes (e.g. micro-aggregates, fecal pellets, phytoplankton cells, etc.) and differentiate our sinking velocity analysis accordingly.
The size distribution of the measured particles was heavily right-skewed, i.e. there were far more small than large particles. Based on the ESD, the sinking velocity data were thus separated into three size classes, 40–100, 100–250 and 250–1000 µm. The increasing bin widths thereby consider the particle size distribution, resulting in narrower size classes for small particles and broader ones for larger particles. Due to the relatively low contribution of large particles in general, for some measurements there were too few particles in the large size class to be considered for further analysis. We hence removed the 250–1000 µm size class of those measurements that consisted of fewer than three particles. This affected the measurements of M5 and M7 on T32, as well as M5 on T40 and M7 on T48. The right-skewed size distribution was also the reason why we plotted the median ESD, porosity and aspect ratio in Fig. 4a, since the mean would have given the few large particles undue weight.
Furthermore, our sinking velocity and ESD measurements of all particles measured across mesocosms were collated and used to resolve the relationship between sinking velocity and particle size, following the power function of Cael et al. (2021, Eq. 3).
Here, α and β are scaling factors, whose variability is based on the particle characteristics and environmental conditions (e.g. composition, porosity, temperature). They were estimated for our dataset using the linearized logarithmic function.
In order to not give the numerous small particles in our measurements undue weight, the sinking velocity and ESD data were binned into log-spaced size classes (40–63, 63–100, 100–158, 158–251, 251–398, 398–631, 631–1000). This second size-class binning with more and narrower bins was implemented to achieve a more precise calculation of size–sinking relationships than what would have been possible with the three larger size class bins established before (see above, Sect. 2.3.1). Per size class, log(sinking velocity) and log(ESD) means from all eight mesocosms were calculated for each experimental day. Based on these, size–sinking relationships were calculated by fitting linear models, in which the slope represented the scaling factor β and the y intercept log(α). From these daily α and β coefficients, average values (± SD) over time were calculated, and the corresponding relationships were plotted in Fig. 5 (Sect. 4.2.3). Since the largest size class (631–1000 µm) had too few particle counts (< 500 particles), we only used the size classes between 40 and 631 µm.
2.3.2 Elemental analysis of sediment trap samples
The remaining sediment trap samples were prepared for elemental analysis by removing the particulate material from the water. For this, the samples were treated with 3 M FeCl3 to induce particle flocculation, coagulation and subsequent sedimentation inside the 5 L bottle and with 3 M NaOH to adjust the pH to 8.1. Subsequently, they went through multiple centrifugation steps (see Bach et al., 2020 for details), after each of which the supernatant was carefully decanted. The resulting sediment pellets were deep-frozen and transported to Kiel, where they were freeze-dried to remove the remaining moisture. The dry pellets were ground in a ball mill, which produced a fine homogeneous powder (Boxhammer et al., 2016). Representative subsamples of the sediment powder were analysed for their contents of particulate organic carbon and nitrogen (POC PON), particulate inorganic carbon (PIC, i.e. calcium carbonate), biogenic silica (BSi, i.e. opal) and total particulate phosphorus (TPP). In contrast to the sinking velocity measurements, the elemental analysis of sediment samples was not carried out for single particles but for the bulk particulate matter flux.
TPP and BSi contents were measured spectrophotometrically after Hansen and Koroleff (1999), and C and N contents were measured on an elemental analyser (Euro EA) following Sharp (1974). While PON samples were measured directly, subsamples for POC were fumed with 1 mol L−1 HCl and dried at 50 ∘C overnight to remove the inorganic carbon fraction prior to its measurement. PIC was calculated as the difference between the carbon contents of HCl-untreated and HCl-treated subsamples, i.e. between subsamples containing inorganic carbon and subsamples not containing any. Total mass fluxes to the sediment trap were obtained by upscaling the measured contents of each compound to the total sample weight. Mass fluxes were then normalized to the mesocosm volume and the time between sampling collection (48 h) to obtain mass flux data in µmol L−1 d−1. The conventional definition of a mass flux as the mass of matter passing through a surface (µmol m−2 d−1) is not practical for mesocosms due to two reasons. First of all, the mass fluxes inside mesocosms are not comparable to mass fluxes in observational studies obtained at the bottom of the surface ocean (∼ 100 m) or deeper because mesocosms incorporate a much smaller water column per square metre (m2). Secondly, comparing mesocosms with the same diameter but different bag lengths and hence different volumes is only meaningful when normalizing to the mesocosm volume.
We further calculated the relative contribution of opal and calcium carbonate to the total export flux, i.e. their biomineral weight fractions (BSiWF and PICWF), on each sampling day according to Bach et al. (2016) as
where “biomineral” stands for either BSi or PIC, and POCST, BSiST and PICST are the daily mass fluxes to the sediment trap of the respective compound.
2.3.3 Chlorophyll a and phytoplankton pigments
Samples for chlorophyll a and other phytoplankton pigments were filtered through combusted (450 ∘C, 6 h) GF/F glass fibre filters (0.7 µm pore size, Whatman) in the onshore laboratories. Directly after filtration the filters were flash-frozen in cryovials and stored at −80 ∘C. Back in Kiel, phytoplankton pigments were extracted from the filters using 100 % acetone as described by Paul et al. (2015) and then analysed using reverse-phase high-performance liquid chromatography (HPLC; Barlow et al., 1997). The output was analysed using CHEMTAX, which classifies phytoplankton taxa based on their pigment ratios (Mackey et al., 1996) and allows one to estimate the contribution of different phytoplankton taxa to the total amount of chlorophyll a. We employed the reference pigment ratios described for the Peruvian upwelling system by DiTullio et al. (2005).
2.4 Data analysis
Linear mixed-effect models were used to investigate the relationship between our predictors and particle sinking velocity as central response variable. Day (of the experiment) was always employed as a categorical fixed effect and mesocosm as a random effect (n=8, random intercept) to account for the repeated measures of the mesocosms over time. The models were fitted using restricted maximum likelihood. Analysis of variance was used to test for significances of the fixed effects (type III test, Satterthwaite's approximation, α=0.05).
Firstly, we tested the effect of the upwelling with different oxygen minimum zone water (OMZ; categorical with two levels: very low and low NOx) to rule out its presumably non-existent effect. Average sinking velocity of each size fraction (40–100, 100–250 and 250–1000 µm) was modelled as a function of OMZ, Day and their interaction (OMZ × Day). The Day term thereby incorporates all sources of variation originating from any changes in the system, for instance shifts in the plankton community or changes in environmental conditions. We only included data obtained after the application of the treatment (OMZ water addition on t11/t12). OMZ × Day or OMZ was clearly insignificant for all size classes (all p values > 0.318), while Day was exclusively highly significant (Table A1 in the Appendix). For the purpose of parsimony, we therefore removed the factor of the OMZ from all our subsequent investigations and thereafter focused on other controlling factors. The appropriateness of this exclusion was verified by fitting all following models once with and once without the OMZ, finding it to be highly insignificant in every instance.
Secondly, we explored the influence of biogeochemical properties of the export flux (continuous predictors), that are, in turn, a result of the current state of the pelagic system. The average sinking velocity of each size fraction (40–100, 100–250 and 250–1000 µm) was modelled as a function of Day and a series of continuous fixed effects, including the magnitude of the export flux (POCST), its elemental composition (NST:PST) and the contribution of biominerals (BSiWF and PICWF). Due to the time lag between organic matter production and its sinking, it is difficult to statistically assess the effects of the water column plankton community on the velocity of sinking particles. This is why, instead, we correlated sinking velocities with export flux parameters, which reflected community composition-related changes in the water column well.
Thirdly, we modelled the relationship between sinking velocity and physical particle properties. Sinking velocity was modelled as a function of Day and the continuous fixed effects particle size (ESD), particle porosity (Pint) and shape (aspect ratio, i.e. length-to-width ratio). Here, we could use individual particles as the lowest level of replication, as the FlowCam data provided matching measures of physical properties and sinking velocity for hundreds of particles per mesocosm and day, resulting in N>100 000 particles. In order to account for the relatedness of particles measured within the same sample, the factor sample was added as an additional random effect (random intercept) nested within the mesocosm. Since porosity is dependent on size for physically aggregated marine particles (see Eq. 1), we assured that there was no autocorrelation between size and porosity (in a tentative model fit without interaction terms).
Statistical analysis was carried out using R (R Core Team, 2021). The packages lme4 (Bates et al., 2015) and lmerTest (Kuznetsova et al., 2017), sjstats (Lüdecke, 2018), and performance (Lüdecke et al., 2021) were used to fit and test linear mixed-effect models, calculate partial effect sizes (partial eta squared ) and check assumptions, respectively. The normality of residuals and random effects were checked using Q–Q plots and the homogeneity of variance using residuals versus fitted plots. The sinking velocity data of the medium and large size fractions were log10-transformed to meet the assumptions for normality and homogeneity (Tables A1b–c and A2b–c). The right-skewed sinking velocity, ESD and Pint data were log10-transformed, after which only slight deviations from normality remained (Table A3). Autocorrelation was tested for using Durbin–Watson tests. Multicollinearity was assessed by calculating the variance inflation factor and assessing the correlations between predictors. The fitted models were checked for influential data points using Cook's distance, and detected outliers were removed.
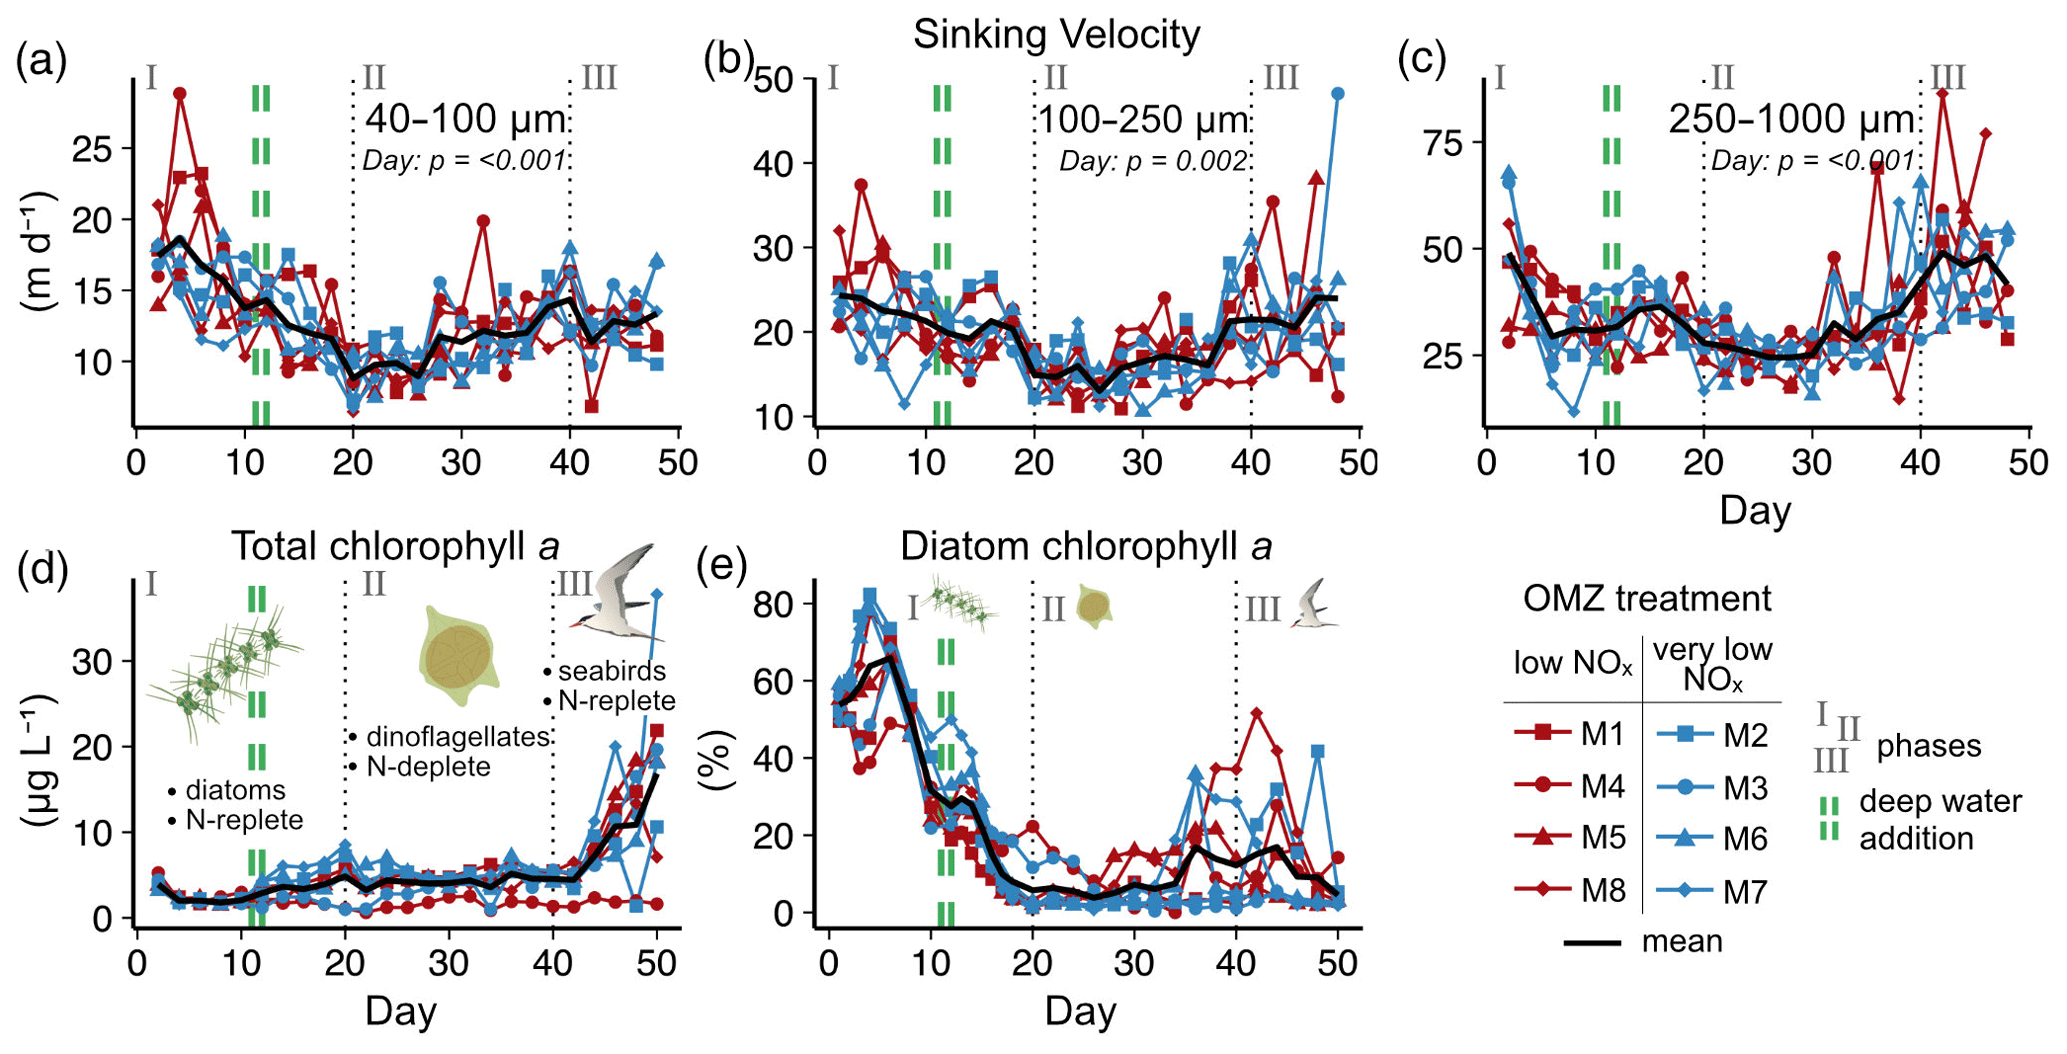
Figure 2Temporal developments in particle sinking velocities and phytoplankton community. (a–c) Mean daily sinking velocities sampled from the sediment trap in three particle size classes. Significant fixed effects (OMZ, Day or OMZ × Day) are displayed including p values (Table A1). (d–e) Total chlorophyll a and the contribution of diatoms to total chlorophyll a in the water column. Here, the shifts in phytoplankton and trophic state are indicated by text and symbols (Integration and Application Network; ian.umces.edu/media-library).
3.1 Particle sinking velocities and phytoplankton community succession
We observed average sinking velocities of 12.8 ± 0.7 m d−1 (particle size: 40–100 µm), 19.4 ± 0.7 m d−1 (particle size: 100–250 µm) and 34.2 ± 1.5 m d−1 (particle size: 250–1000 µm) (± 95 % CI, Fig. 2a–c). Sinking velocities increased almost threefold from the smallest to the largest size class. The variability in sinking velocities of bulk sediment samples across space and time is indicated by standard deviations of 0.8, 0.9 and 1.8 m d−1 from the smallest to the largest size fraction, respectively. Individual particles were much more variable, however, ranging from < 1 to 267 m d−1.
The oxygen minimum zone (OMZ) treatment did not affect sinking velocities in any of the particle size classes over the course of the experiment (Fig. 2 and Table A1). Any potential signal of the OMZ treatment (red and blue lines) must have been minor compared to the variability caused by other processes, so that mesocosms appeared to be distributed randomly around the overall mean (Fig. 2).
In contrast, pronounced temporal trends in sinking velocity were detected in all size classes, represented by the factor Day (Fig. 2 and Table A1). Depending on the size class, between 42 % and 48 % of the variation in sinking velocity was explained by our models (see R2 in Table A1), primarily via this temporal effect. Sinking velocities of all size classes were lowest during the middle of the experiment (between days 20–30) and higher at the beginning and end.
We observed a distinct phytoplankton community succession (see Fig. B2), which is linked to both suspended and exported particulate matter and ultimately particle sinking velocities. Following these major biogeochemical developments, we segmented the experiment into three distinct phases: phase I (t1–t20), phase II (t20–t40) and phase III (t40–t50). The conditions inside the mesocosms were initially N-replete and sustained diatom-dominated communities (Fig. 2e). Although the OMZ water addition on t11/t12 enriched the dissolved inorganic nutrient pools slightly, these nutrients were readily taken up, and the systems became N-deplete at around t20 (see Fig. 4 in Bach et al., 2020). The decline in diatom dominance as nutrients became depleted coincided with a gradual decrease in sinking velocities of exported particles in the small and medium size classes. In the 40–100 µm size class sinking velocities decreased 2-fold between t4 and t20 (paired t test: t=6.03, p=<0.001). However, this does not account for the time lag between water column processes and resulting mass flux changes. The community shifted towards the mixotrophic dinoflagellate Akashiwo sanguinea, which thrived under the regenerative conditions, and sinking velocities reached their minimum between t20 and t30. Finally, during the last 10 d of the experiment (t40–t50) seabirds (Inca tern, Larosterna inca) started to use the mesocosm facilities as a resting place, defecating into the mesocosms and thereby providing new N and P, fuelling regenerated production (Fig. 2d). Simultaneously, sinking velocities reached another maximum towards t50, this time especially in the medium and large size classes.
3.2 Export flux and biomineral ballast
We could not detect an influence of the magnitude and quality of the export flux on particle sinking velocities in any of the size classes (Fig. 3b and Table A2). In this analysis, mean daily sinking velocities were neither correlated with the amount of sinking particulate organic carbon (POC) nor with the composition of the exported material, including the contribution of biominerals such as biogenic silica and calcium carbonate or the sedimented N : P ratio.
The phytoplankton community succession in the water column was, nevertheless, associated with clear temporal trends in the magnitude and elemental composition of the export flux (Fig. 3a–b). The period of diatom domination (phase I) was characterized by variable daily fluxes that consisted of almost 30 % biogenic silica. The subsequent shift from diatoms to the dinoflagellate A. sanguinea (phase II) was apparent in a 5-fold decrease of the opal weight fraction (BSiWF) between t19 and t30. Intriguingly, this substantial drop in opal ballast was not reflected by a concomitant decrease in sinking velocities (compare Figs. 3a and 2a–c). During phase II, the mean POCST flux became temporally more stable, while it differed substantially between mesocosms, as did the sedimented N : P ratios. The “orni-eutrophication” in phase III was accompanied by a slight increase in POCST and a marked increase of TPPST (see Fig. 7 in Bach et al., 2020), with consequently decreasing sinking matter N : P ratios. All the while, the A. sanguinea bloom remained suspended in the water column from the beginning of phase II until the end of the experiment and thus probably did not contribute much to the sinking flux (Bach et al., 2020).
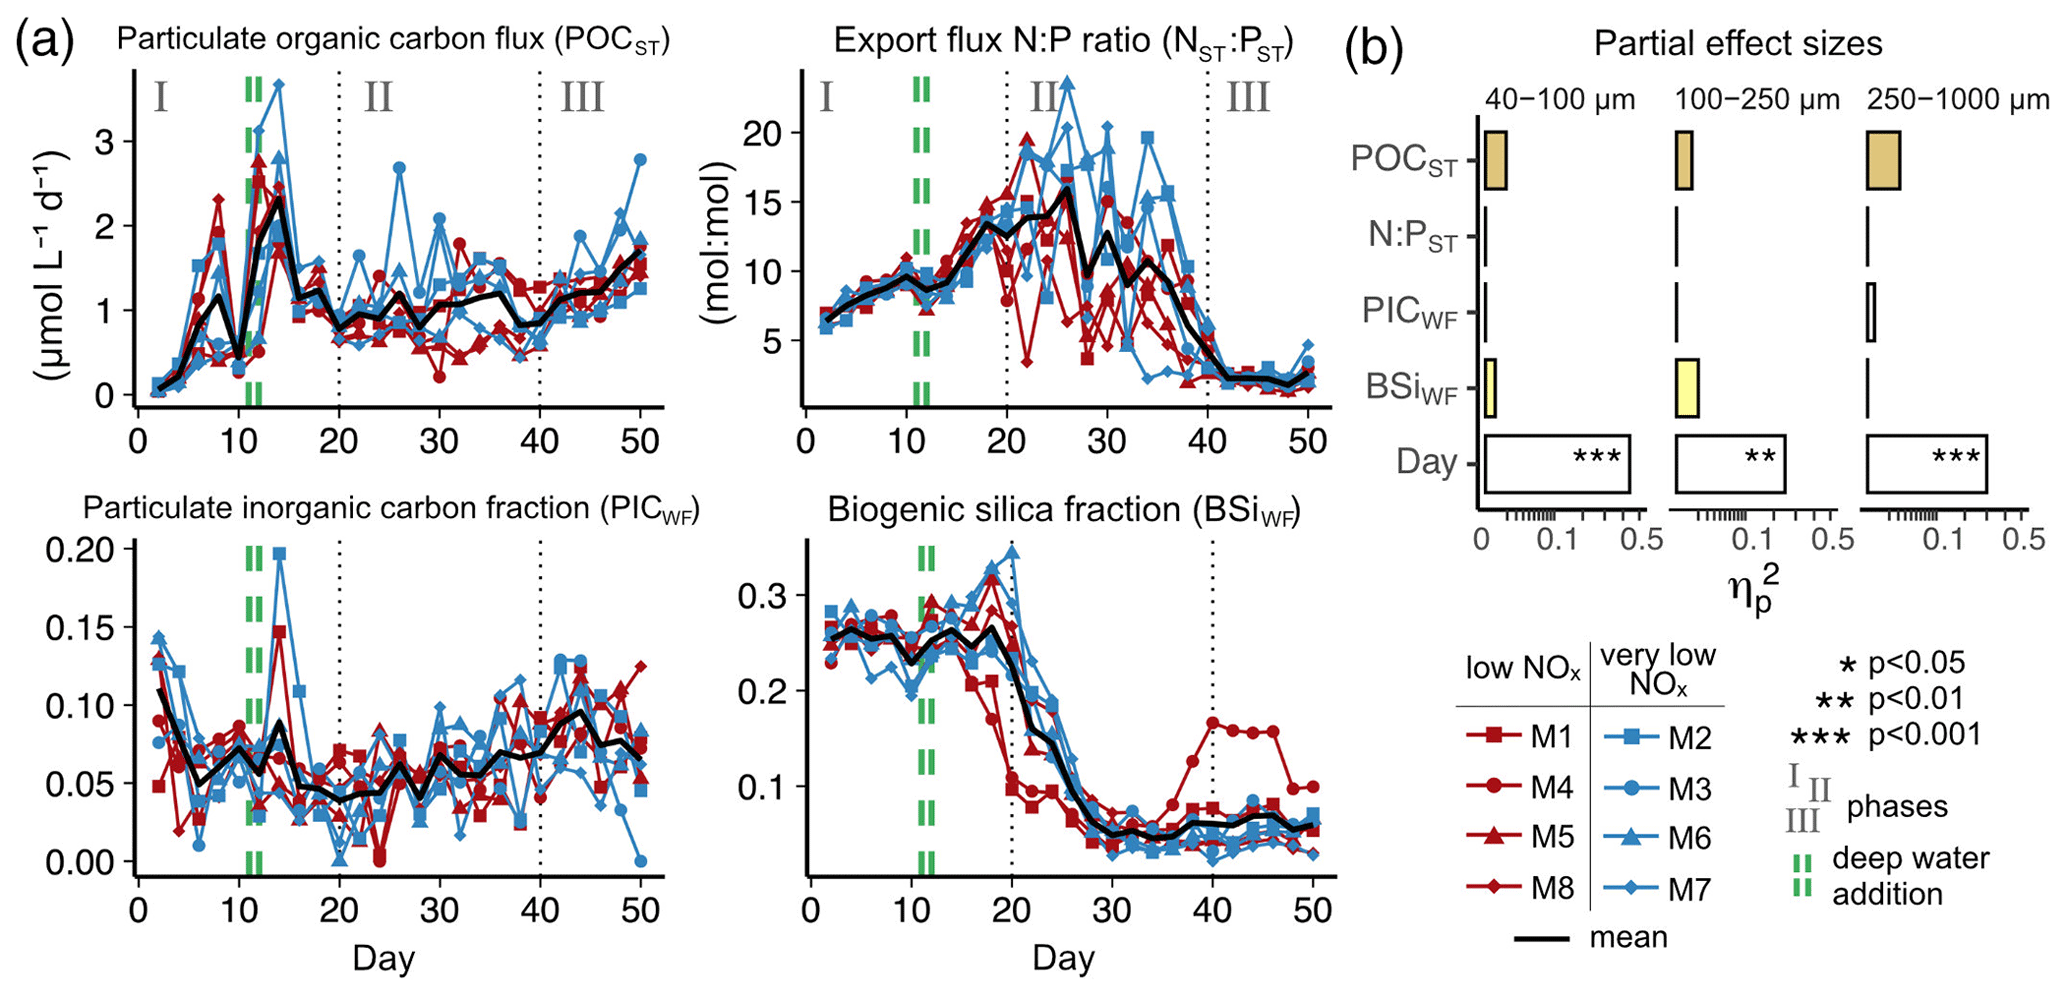
Figure 3(a) Temporal development of key export parameters including absolute flux, elemental stoichiometry and mineral ballast (POCST and NST : PST; modified from Bach et al., 2020). (b) Modelled effects of these parameters on particle sinking velocity (: partial effect size).
3.3 Physical particle properties
The physical properties of individual particles were linked to their sinking velocities (Table A3 and Fig. 4b). The most important property was size (ESD), which correlated positively with sinking velocity (see Fig. B3 in the Appendix). Porosity (Pint), as the second most influential property, was associated with a decrease in sinking velocity. Particle shape (aspect ratio), on the other hand, comparably had only a minor effect, which was nevertheless still detectable. Rounder particles (high aspect ratio) tended to sink slightly faster than elongated ones. Finally, time (Day) showed the weakest effect here, unlike for the bulk biogeochemical export flux parameters presented before. Altogether, these physical particle properties explained a quarter of the variation in the sinking velocity at the level of the individual particle (, Table A3). Whilst we detected interactions between the physical particle properties and time, overarching patterns concerning the development of the relationships over time could not be identified (Fig. B3–5). The variation explained by these interactions was negligible compared to the main effects (Table A3).
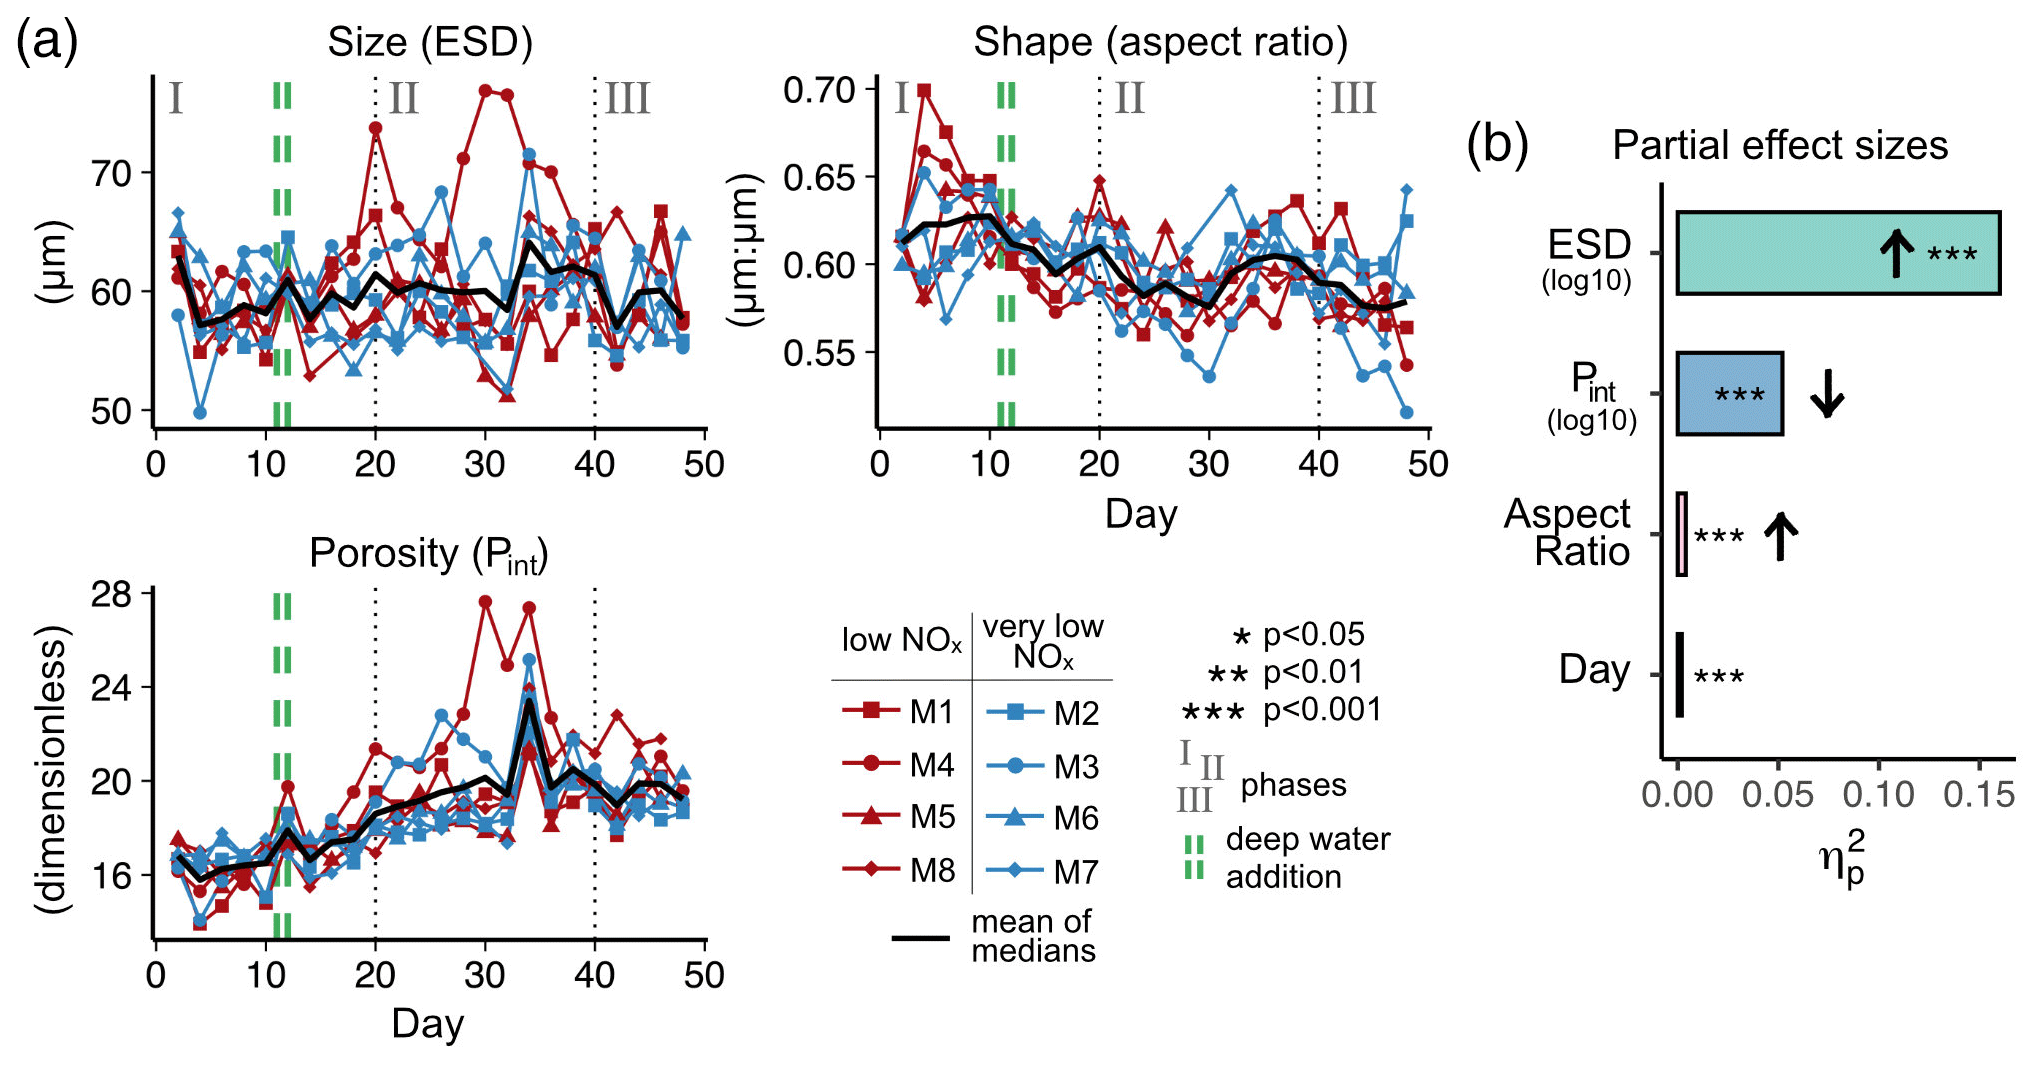
Figure 4(a) Temporal development of physical particle properties and (b) their effect on particle sinking velocity, with effect directions indicated by arrows (up is positive, down is negative). The full statistical results, including interactions between the properties and day, are given in Table A3. Note that panel (a) shows daily median particle properties.
Particle size, shape and porosity were relatively similar between mesocosms and OMZ treatments (Fig. 4a). M3 and M4, however, slightly stood out. During phase II, exported particles in M4 were bigger and more porous compared to the other mesocosms, especially on t30 and t32. M4 also had the highest sinking velocities on t32 in all size classes and among the highest on t30 (Fig. 2a–c). Similarly, in M3, bigger, more porous and slightly more elongated particles sank compared to the other mesocosms. Interestingly, these two mesocosms also showed a different phytoplankton community succession. In M4, the community shift from diatoms to dinoflagellates did not happen before the very end of the experiment, while in M3 it occurred ∼ 10 d later than in the other mesocosms (see Fig. 6 in Bach et al., 2020). This is also apparent in the delayed decrease of diatom chlorophyll a at around t20 in M3 and M4 (Fig. 2e). The initial diatom communities of M3 and M4 were instead replaced by cryptophytes, and in M4 those were subsequently succeeded by chlorophytes, before A. sanguinea finally took over (Fig. B2). The deviations in physical particle properties in M3 and M4 might hence be connected to their peculiarities in terms of community succession.
Apart from these two deviations, the median particle size remained relatively stable over time in all mesocosms (Fig. 4a), which implies that the particle size spectrum did not change much throughout the experiment. In contrast, porosities increased slightly and aspect ratios tended to decrease from the beginning to the middle of the experiment (around t30). This implies that particles became less spherical and more porous, which would in theory be associated with decreased sinking velocities. This was reflected relatively well by our data, with decreasing sinking velocities until around t25 (Fig. 2a–c).
4.1 Roles of phytoplankton community succession and opal ballast
During the first phase of our experiment we observed a phytoplankton community shift from diatoms to dinoflagellates (∼ t5–t20). The signal was transferred to the sinking flux with a time lag of roughly ∼ 10 d, as indicated by the delayed decrease of the biogenic silica fraction in the mass flux (t18–t30). During the time, in which the community changes affected the sinking flux, there were no clear-cut effects on particle sinking velocities in any of the size classes. The decreasing opal ballast and the increasing and more variable exported N : P ratios indicate that the composition of sinking matter was modified, while sinking velocities remained relatively constant. One would have expected sinking velocities to be more strictly linked to the dominant phytoplankton group, given their repeatedly reported importance for physical particle properties (Bach et al., 2019; Turner, 2015; Guidi et al., 2009).
We did not find a correlation between the 5-fold drop in biogenic silica ballasting and mean particle sinking velocities. We assume this was due to the relatively small variability in sinking velocity and biogenic silica fraction between mesocosms on a specific measurement day. Most of the variation instead occurred over time, making the statistical detection of a possible opal effect difficult. In theory, a 5-fold drop in the opal weight fraction should have altered sinking velocities substantially. The effect of different opal ballasting on the sinking velocity of idealized particles can be calculated using Stokes' law (Stokes, 1851). Let us assume two spherical particles with 100 µm diameter that consist of POC and BSi exclusively (densities of 1.06 and 2.1 g cm−3, respectively; Klaas and Archer, 2002). One has an opal contribution of 25 %, the other of 5 %, which represents values from before and after the opal drop during phase II. The resulting sinking velocities are 137 and 40 m d−1 for the 25 % and 5 % opal particle, respectively. According to this, the observed drop in BSi should have decreased particle sinking velocities by a factor of 3.4.
One possible explanation for why the decrease in opal ballast was not impactful could be counteracting mechanisms, which changed in parallel and increased sinking velocity. There could have been an increase in particle size or compactness due to the phytoplankton community shift or zooplankton repackaging, respectively. However, neither size increased nor porosity decreased while the opal contribution to the export flux declined. Likewise, one would suspect that changes in the mesozooplankton community might have entailed elevated sinking velocities due to enhanced repackaging and increased fecal pellet production (Turner, 2015). Yet, there were no major temporal changes in the mesozooplankton community; copepods dominated consistently (80 %–99.8 % of total abundance), with Paracalanus sp. and Hemicyclops sp. being the most abundant genera (Ayón Dejo et al., 2023). The trophic link between copepods and the dominant phytoplankton groups was likely weak, which suggests a limited impact on exported matter.
Apparently, the idealized opal-sinking velocity relationship does not necessarily hold true in a plankton community in the surface ocean. The reason for this is likely the complexity of pelagic systems, in which numerous physical and biological drivers affect particle sinking velocities, such as size and porosity, particle type (McDonnell and Buesseler, 2010; Durkin et al., 2021), phytoplankton community composition via porosity and ballasting (e.g. Bach et al., 2016, 2019), diatom morphology (Laurenceau-Cornec et al., 2015), and the physiological state of diatom cells (González et al., 2009). To disentangle this multitude of mechanisms, targeted laboratory studies similar to those of Laurenceau-Cornec et al. (2020) are needed, who designed an experiment specifically to examine effects of calcite ballasting on particle sinking velocities.
Although the community shift did not result in stark changes in sinking velocity, there was some indication that the community composition affected sinking particle properties. The mesocosms M3 and M4 differed from the others in terms of phytoplankton community composition and to some degree in sinking particle properties. Particle sizes and porosities in M3 and especially in M4 were higher than in the other mesocosms during phase II, which was, to a certain degree, reflected by faster sinking. There was a higher contribution of cryptophytes and chlorophytes in both mesocosms during that time, while the others were dominated by A. sanguinea (see Fig. 6 in Bach et al., 2020). At the same time, M4 and especially M3 were among the mesocosms with the highest POC export flux during phase II. This constitutes evidence for an interaction between the phytoplankton community composition, the resulting export flux and the properties and sinking velocities of settling particles.
The orni-eutrophication at the end of the experiment also shaped export mechanics and potentially modified sinking particle properties. After day 40, seabird sightings of often more than 10 Inca terns per mesocosm and feces on the inner walls of the mesocosms above the water level (see video by Boxhammer et al., 2019) indicated a substantial nutrient input. The excreted N and P of sea birds are partly short-term bioavailable and can play a significant role in regional nutrient cycling (Otero et al., 2018). In our study, it likely induced the phytoplankton bloom in phase III (Sect. 4.1, Bach et al., 2020) and was probably the reason for the strong decrease in sedimented N : P ratios and the noticeable increase in POC export. At the same time, particle porosities decreased and sinking velocities increased in the medium and large size fractions. The fertilization of the N-depleted system and the consequent export-related changes seem to have affected the properties of sinking particles, leading to increased sinking velocities.
4.2 Size, porosity and shape as drivers of sinking velocity
We found that size was the most important predictor for sinking velocity among our tested particle properties. Previous studies reported contrasting results concerning the size–sinking relationship in marine particle datasets, some finding size to be a strong predictor (e.g. Alldredge and Gotschalk, 1988; Iversen et al., 2010), while others do not (e.g. Diercks and Asper, 1997; Iversen and Lampitt, 2020). Cavan et al. (2018) found a size effect for particles with an ESD < 1250 µm, which disappeared for larger particles, possibly due to their lower sample size (n=56). In fact, studies are often based on relatively low sample sizes ( 1000). In contrast, our dataset encompasses over 100 000 particles, which let us uncover the relatively weak correlation between size and sinking velocity. Considerably larger sample sizes than usually obtained might be needed to detect weak – but existing – size–sinking relationships.
Despite being the most important predictor, particle size explained relatively little of the variation in sinking velocity (). Part of the remaining variation can be explained by other predictors, such as structure and composition. Due to the variety of contrasting drivers, the size–sinking relationship is subject to large temporal and spatial variability, which asks for context-specific estimates (Laurenceau-Cornec et al., 2015; Giering et al., 2020; Cael et al., 2021). We estimated such a relationship for our dataset in order to provide the first empirical size–sinking relationship for particles from the Peruvian upwelling system (Fig. 5). Our average estimates for the scaling factors α and β were 2.01 ± 1.03 and 0.48 ± 0.09, which is well in range of Cael et al.'s estimates for their overall dataset (2021, see Fig. 3). According to their categorizations, our size–sinking relationship is most akin to flow chamber measurements of aggregate particles in a cold (< 14 ∘C) open ocean environment originating from a non-diatom-based plankton community (2021, Fig. 4). Except for the coastal environment and higher temperature in our mesocosms, these characteristics apply quite accurately to our dataset. The offsets can be explained by the large variability in size–sinking relationships of similar data types. The size–sinking relationship we provide might help modellers to optimize local particle flux parameterizations for the Peruvian upwelling system.
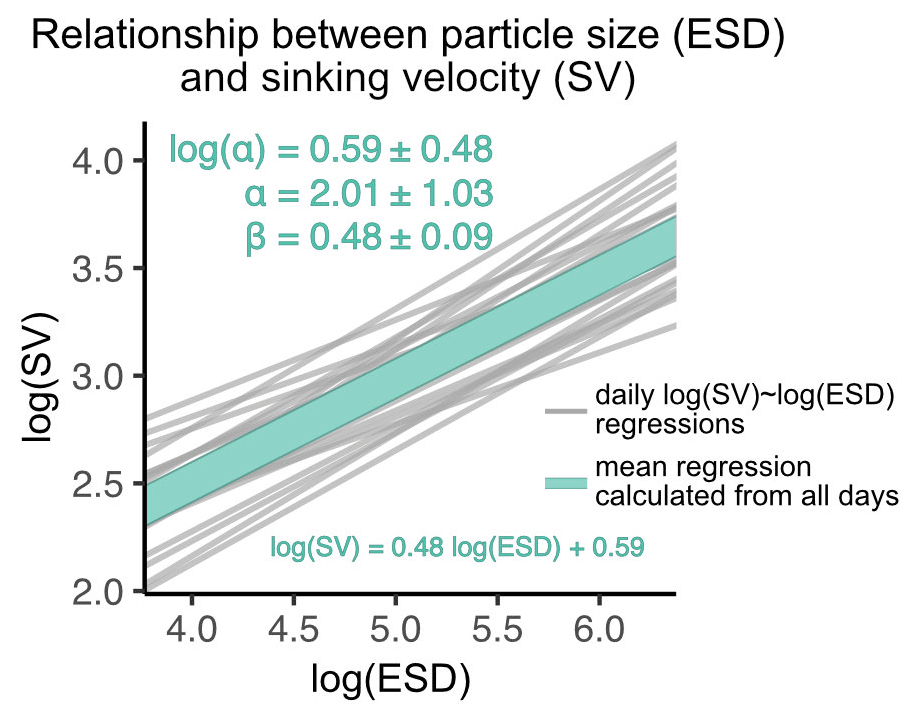
Figure 5Size–sinking relationship of particles sampled from the sediment trap. Shown are the scaling factors α and β ± SD, as well as the mean regression model formula according to Eq. (3). This relationship was calculated in the 40–630 µm size range (see Sect. 2.3.1).
Our size–sinking relationship remained relatively stable throughout the experiment, despite the marked phytoplankton community shift and potential change in predominant particle type (Fig. B6). Such robust datasets could help to calibrate BGC-Argo floats equipped with bio-optical sensors, which record physical particle properties but not sinking velocity or information about particle type. Using the calibration slopes, one could compute sinking velocities from the float datasets for the given particle size range. Being able to use BGC-Argo float data to infer about particle settling behaviour would be highly beneficial to biological carbon pump research.
Porosity was the second most important driver of sinking velocity. Our study is, to the best of our knowledge, the first to quantify the relative contribution of size (ESD) and porosity (Pint) to the control of sinking velocity in a marine particle dataset. Although porosity has repeatedly been reported as an important driver of sinking velocity (Alldredge and Crocker, 1995; Giering et al., 2020; Laurenceau-Cornec et al., 2020), size seems to be the more influential property in the size range of 40–1000 µm. This stands to reason, as relatively small particles tend to have higher drag coefficients and lower particle Reynolds numbers, with size being the more influential factor in this case (see Fig. 4 in Dey et al., 2019). Porosity becomes more influential for larger particles with lower drag coefficients and higher Reynolds numbers. As the particles considered here are quite small (≤ 1 mm), their sinking velocity might have primarily been controlled by size. The third assessed particle property, shape, was inconsequential compared to the former two. Although particle shape has been found to influence sinking behaviour (e.g. Laurenceau-Cornec et al., 2015, 2020), it is not considered as an important driver, with which our results agree.
4.3 Limitations
We were unfortunately not able to characterize particle classes (e.g. micro-aggregates, fecal pellets, etc.) due to a loss of the original FlowCam pictures. Particle pools will naturally differ from one another in terms of particle type, composition and structure. Without linking sinking velocity measurements to particle type, it is thus challenging to explain changes in sinking velocity mechanistically. This is why we refrain from detailed comparisons of our sinking velocities to those from other studies and regions. Nonetheless, our study helps to improve the understanding of sinking velocity drivers, such as size and porosity, and yields further evidence on the limited role of opal ballast.
We could not measure sinking velocity on undisturbed particles in situ. Sampling processes can modify, damage and (dis-) aggregate marine particles, in our case by pumping sedimented material through the sampling hose or by rotating sampling bottles before subsampling. The accumulation of material in the sediment trap and storage of sediment material between sampling and sinking velocity measurements can further change its aggregation properties. These processes might lead to a more homogeneous particle pool than in the natural environment, which can for example strengthen the relationship between particle size and sinking velocity (Williams and Giering, 2022). As we cannot compare our ex situ particle size distributions with in situ ones, the combined error of sampling and sampling handling processes remains unknown.
We provide the first empirical data on particle sinking velocities in the small-to-medium size range (40–1000 µm) in the coastal Peruvian upwelling system. The phytoplankton community shift from diatoms to dinoflagellates did not result in substantial changes in sinking velocity, despite the concomitant decrease in opal ballast. This finding consolidates the notion that particle settling behaviour in pelagic systems is influenced by numerous drivers that potentially counteract each other. To disentangle these and detect correlations that might otherwise be overlooked, a large number of measured particles, and hence a large test power, might be necessary. Combining automated sinking velocity measurements with (optical) particle type assessments would be an optimal next step to uncover mechanistic relationships in different particle classes. Modern machine learning approaches make the analysis of such datasets easier than ever and could profoundly improve our understanding of biological carbon pump processes.
Our results suggest that sinking velocity parameterizations in numerical models should include particle size and porosity as physical particle properties. In our case, size was the more influential driver in the observed particle size spectrum, exerting a relatively stable positive effect despite the transition of the dominant phytoplankton group. The provided metrics of a size–sinking relationship could help to further optimize local particle flux parameterizations. Since sinking velocity determines for how long particles are exposed to degradation processes on their way to depth, it is a crucial parameter for assessing carbon sequestration and changes in subsurface oxygen concentrations. This is especially important for a region that is highly susceptible to climate-driven changes. Our study might thus help to better estimate the strength and efficiency of the biological carbon pump in the Peruvian upwelling system and hence project the expansion of the local oxygen-deficient waters.
Table A1Linear mixed models for the effects of oxygen minimum zone (OMZ) treatment across time on averaged sinking velocity per size class. Shown are the ANOVA output (df: degrees of freedom, MS: mean squares), R2 of fixed effects () and partial effect sizes (). Measurement days before the OMZ water addition (sampling days t2–t10) were excluded. Model diagnostics: raw data of scenario (a) met the assumptions for normality and homogeneity. For scenarios (b) and (c), the response variable was log10-transformed to meet the assumptions for normality and homogeneity.
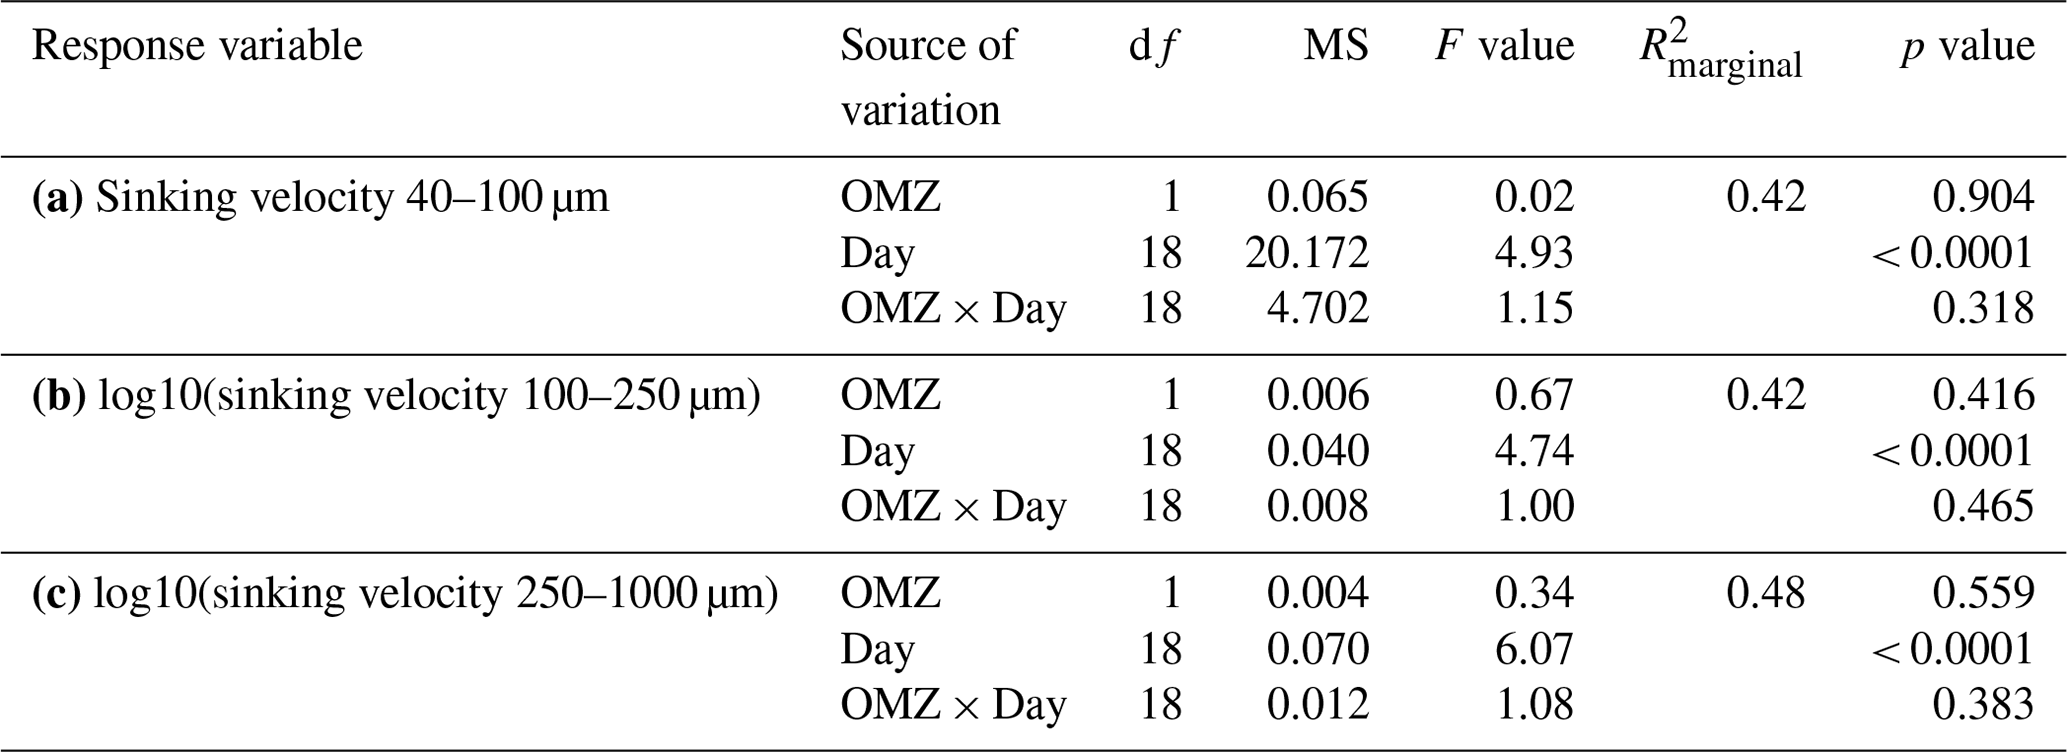
Table A2Linear mixed models for the relationships between averaged sinking velocities per size class and biogeochemical particle properties and time. Shown are the ANOVA output (df: degrees of freedom, MS: mean squares), R2 of fixed effects () and partial effect sizes (). Model diagnostics: raw data of scenario (a) met the assumptions for normality and homogeneity. For scenarios (b) and (c) the response variable was log10-transformed to meet the assumptions for normality and homogeneity.
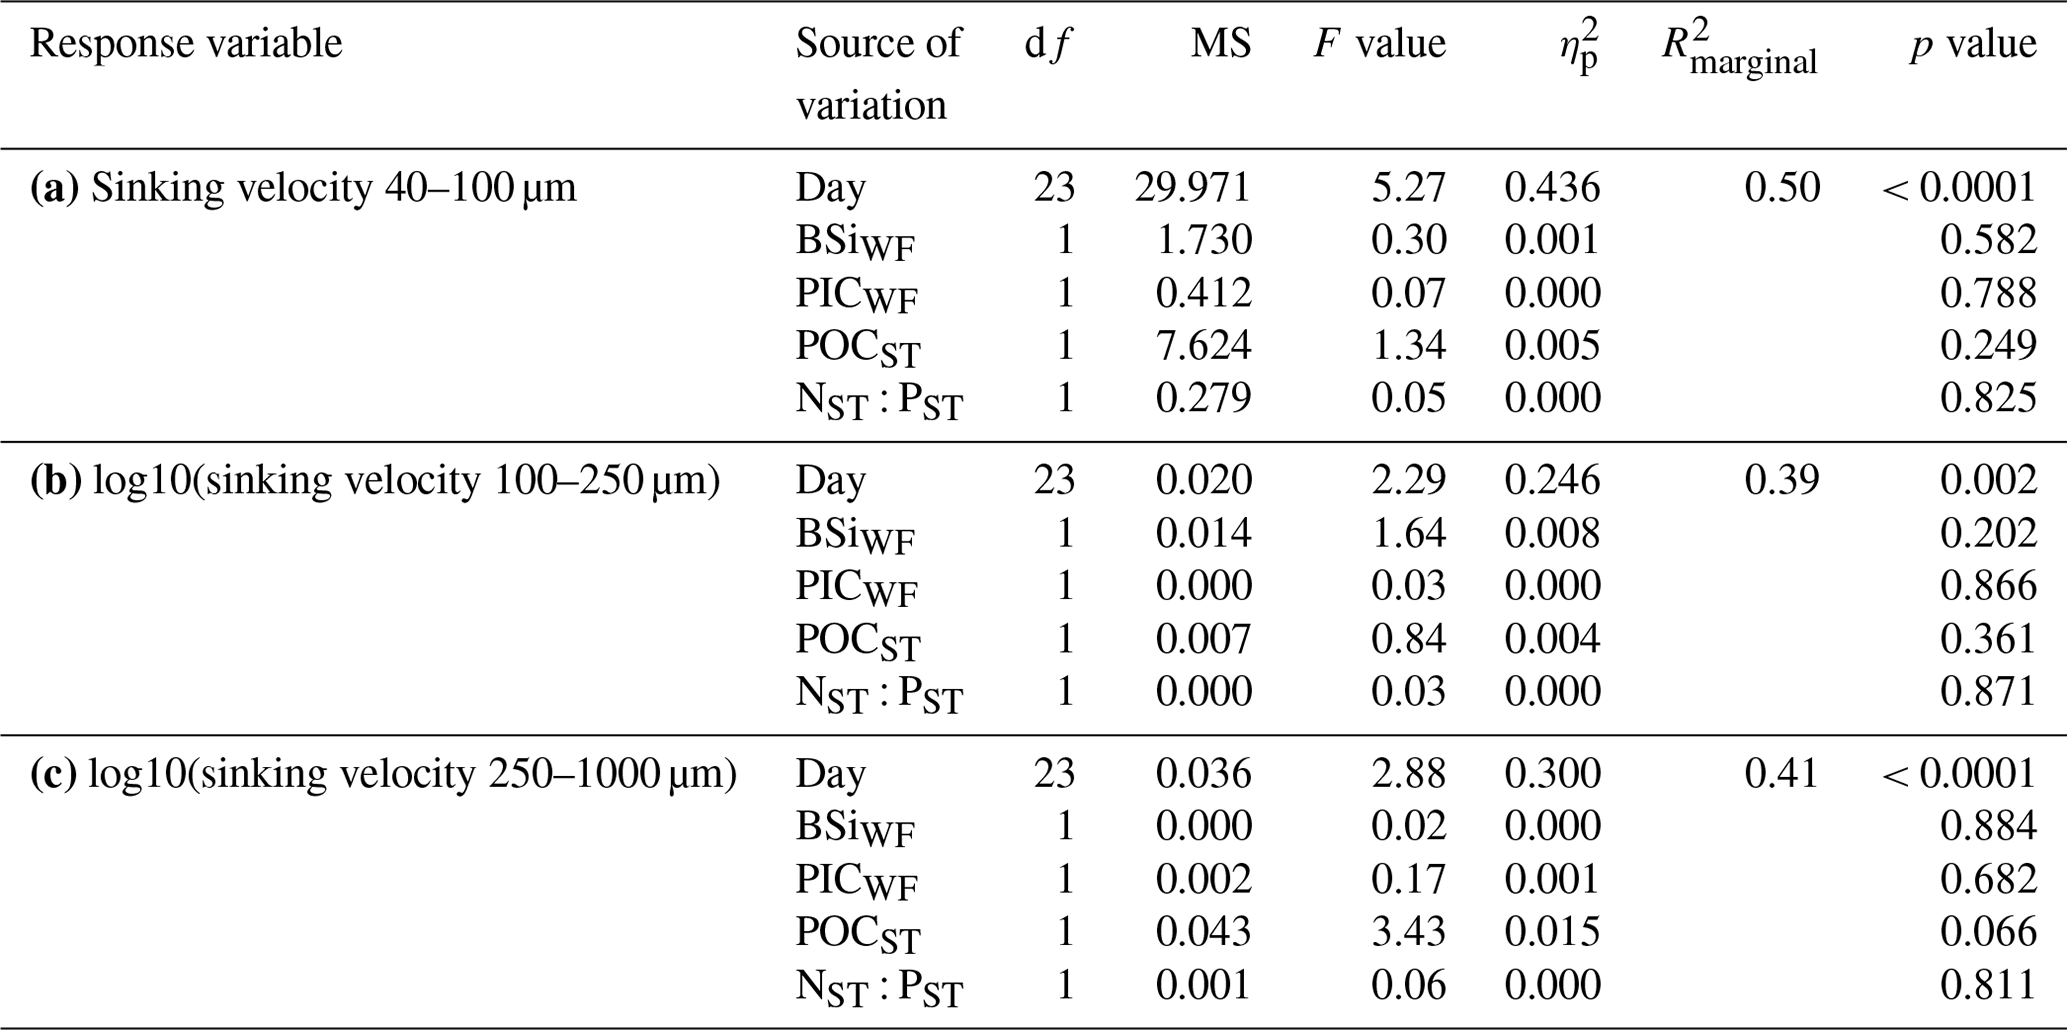
Table A3Linear mixed models for the relationships between sinking velocity and physical particle properties (size, porosity and shape) across time. Shown are the ANOVA output (df: degrees of freedom, MS: mean squares), R2 of fixed effects () and partial effect sizes (). The analysis is based on N>100 000 particles. Model diagnostics: the right-skewed sinking velocity, ESD and Pint data were log10-transformed, after which only slight deviations from normality remained. Particles within one measurement were correlated with each other. The reason might be that fast sinking particles were generally measured at the beginning of a measurement, while more slow particles were measured towards the end. We nevertheless argue that our model results are interpretable due to the high significance of our correlations (all p values < 10−24).
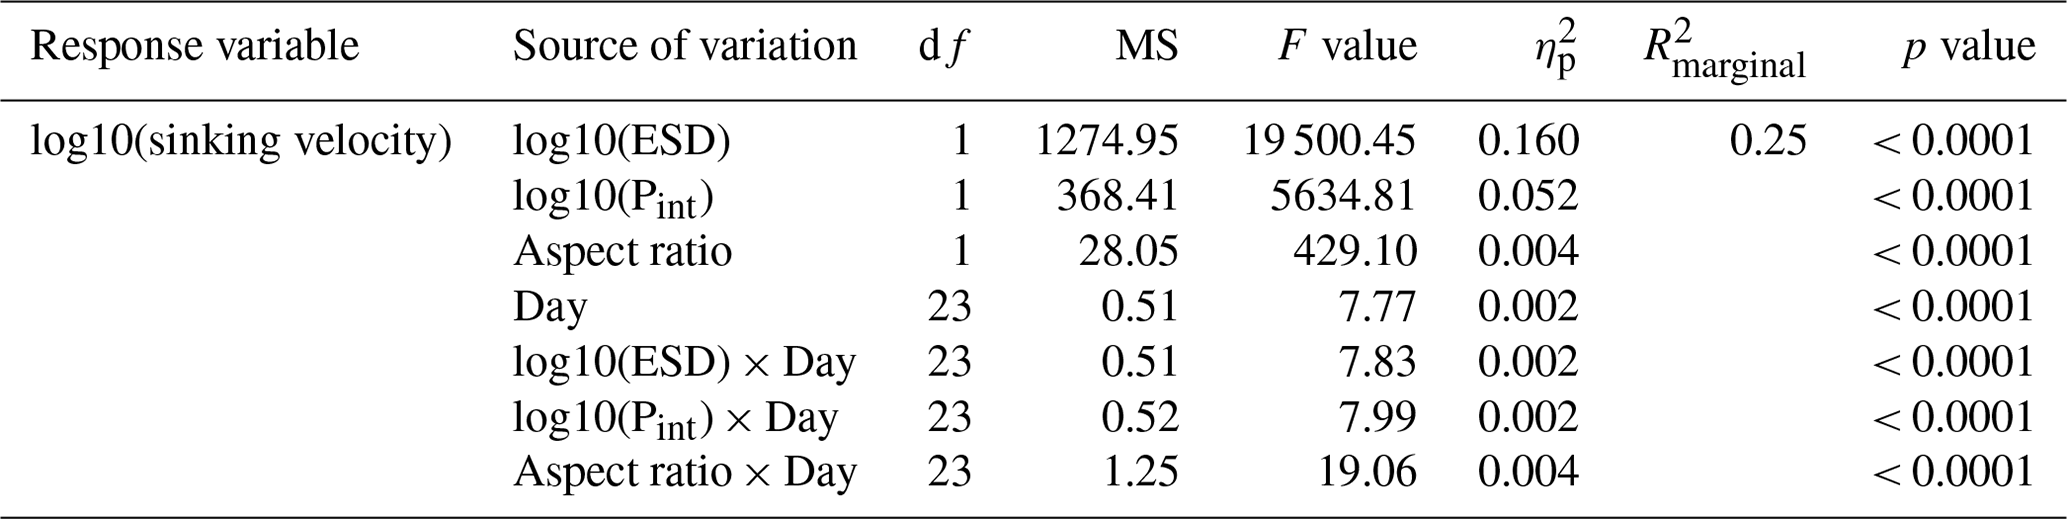
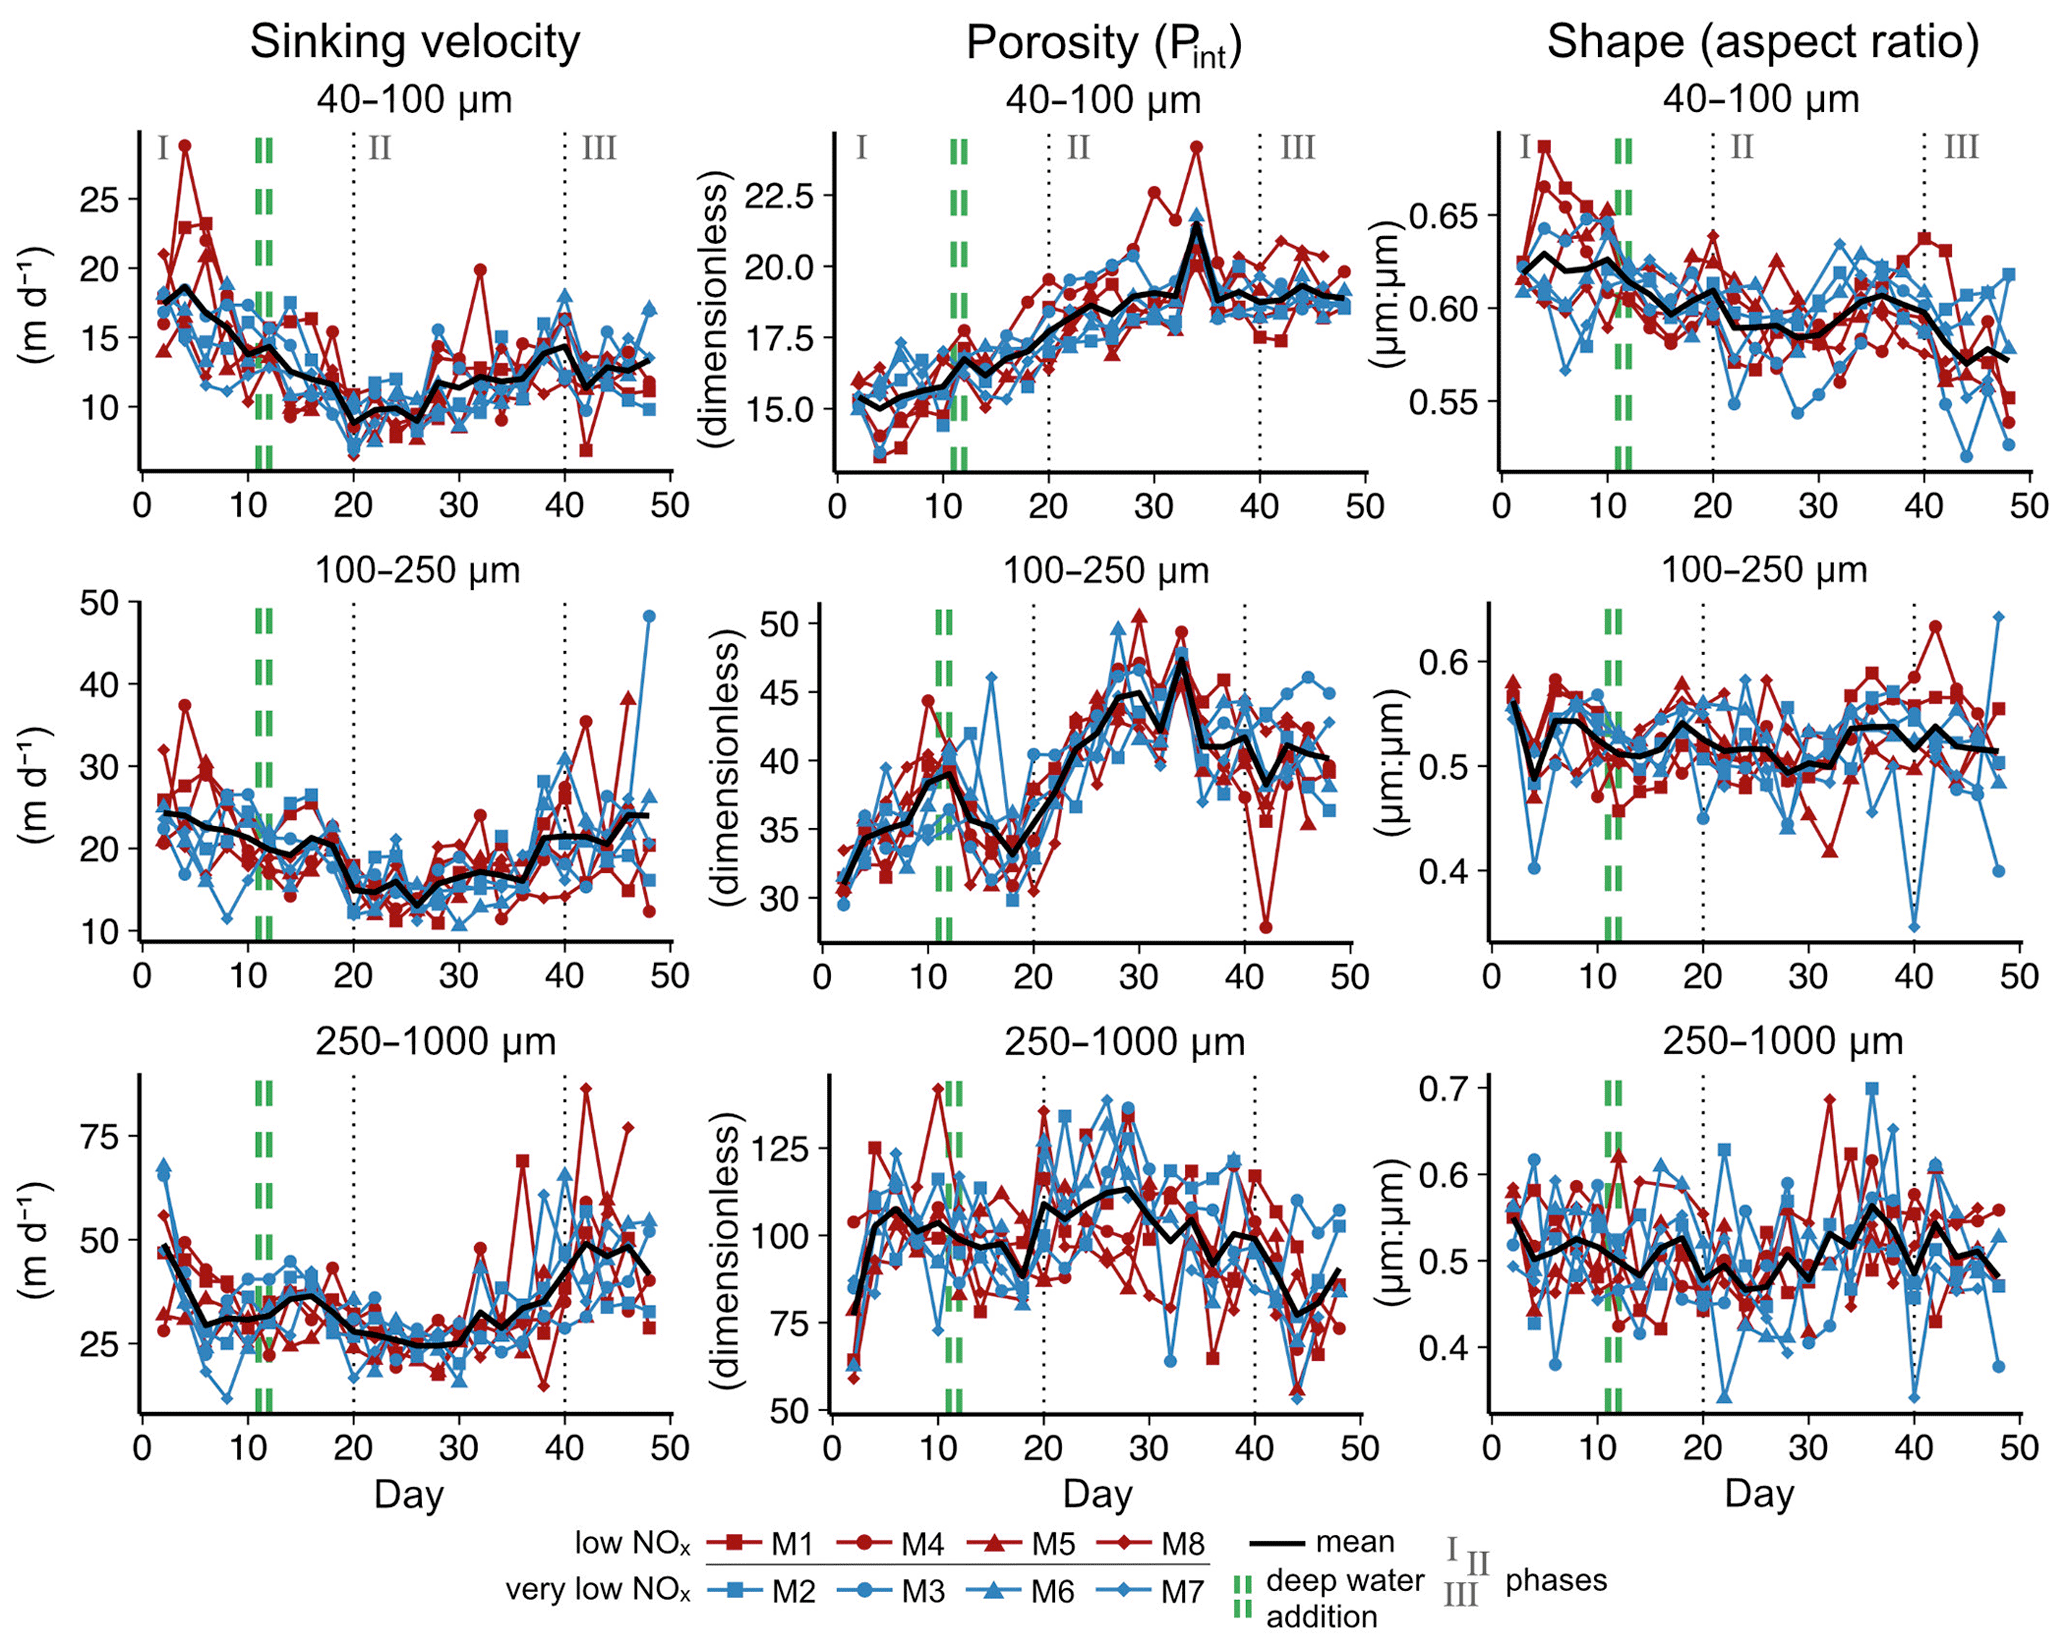
Figure B1Temporal developments of particle sinking velocities, porosities and shapes per size class. Note that sinking velocities are also shown in Fig. 2 but are replicated here to facilitate the comparison with other particle properties.
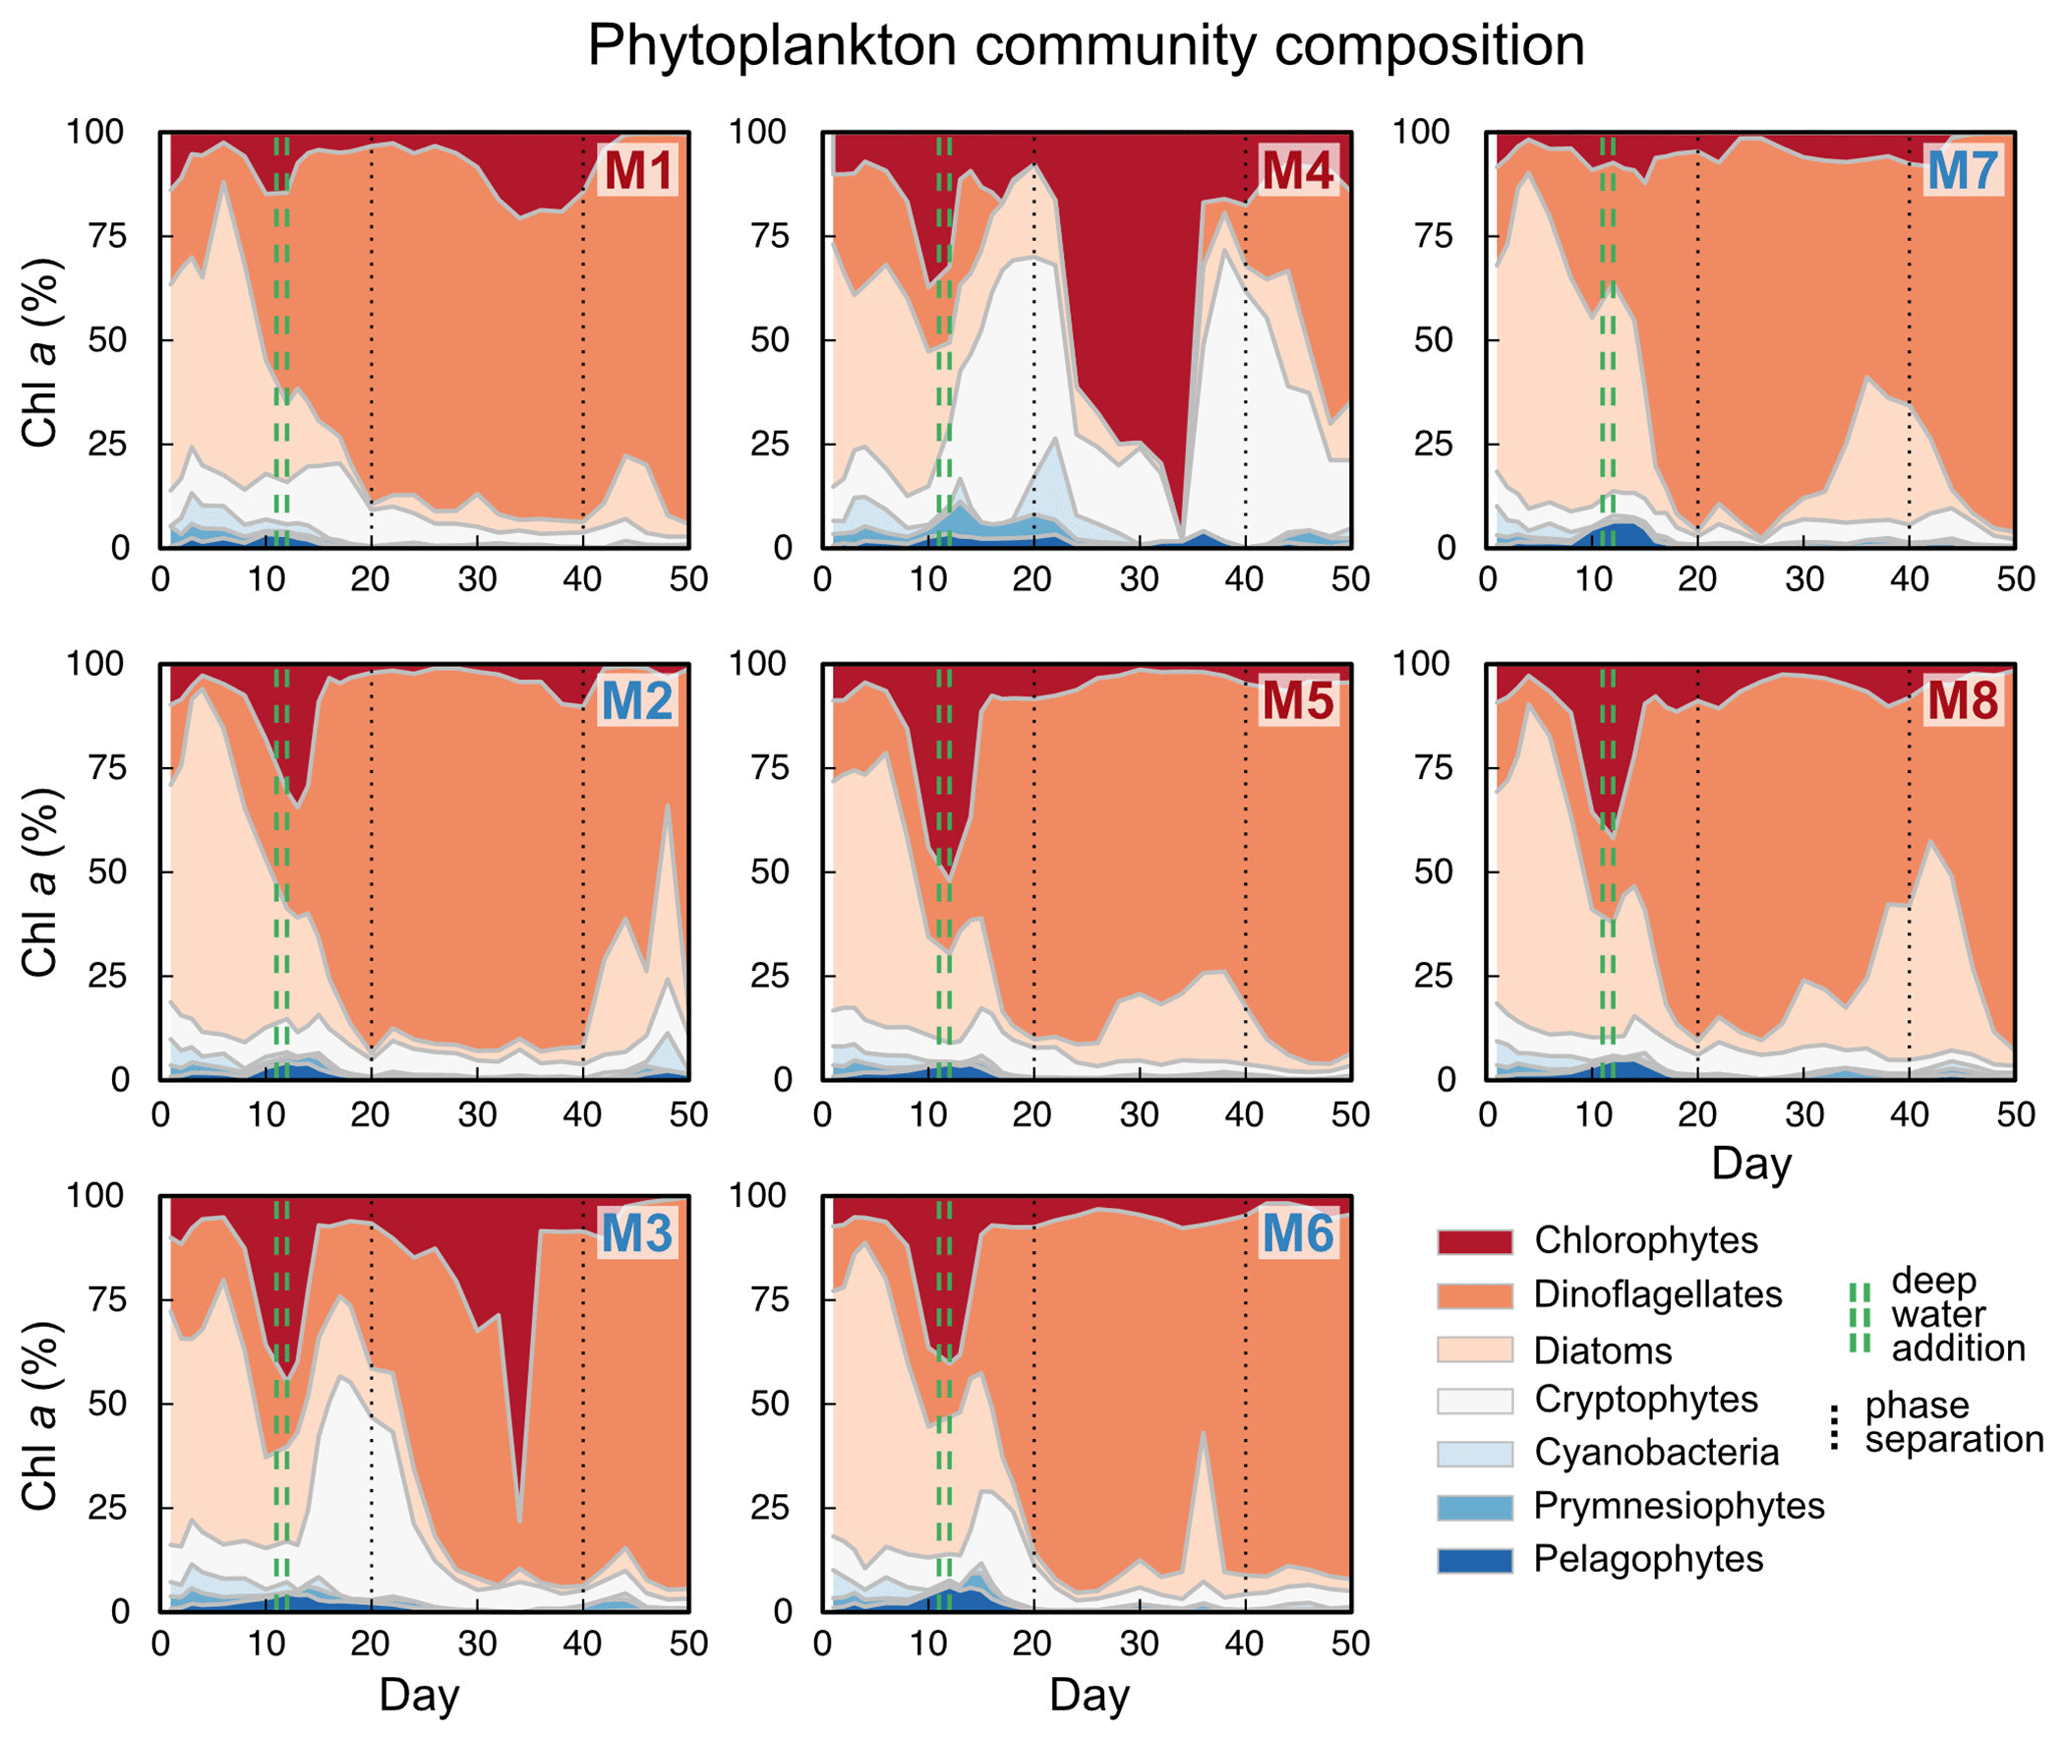
Figure B2Relative contribution of phytoplankton groups to total chlorophyll a concentration. Red mesocosms received low, blue mesocosms very low, NOx concentrations.
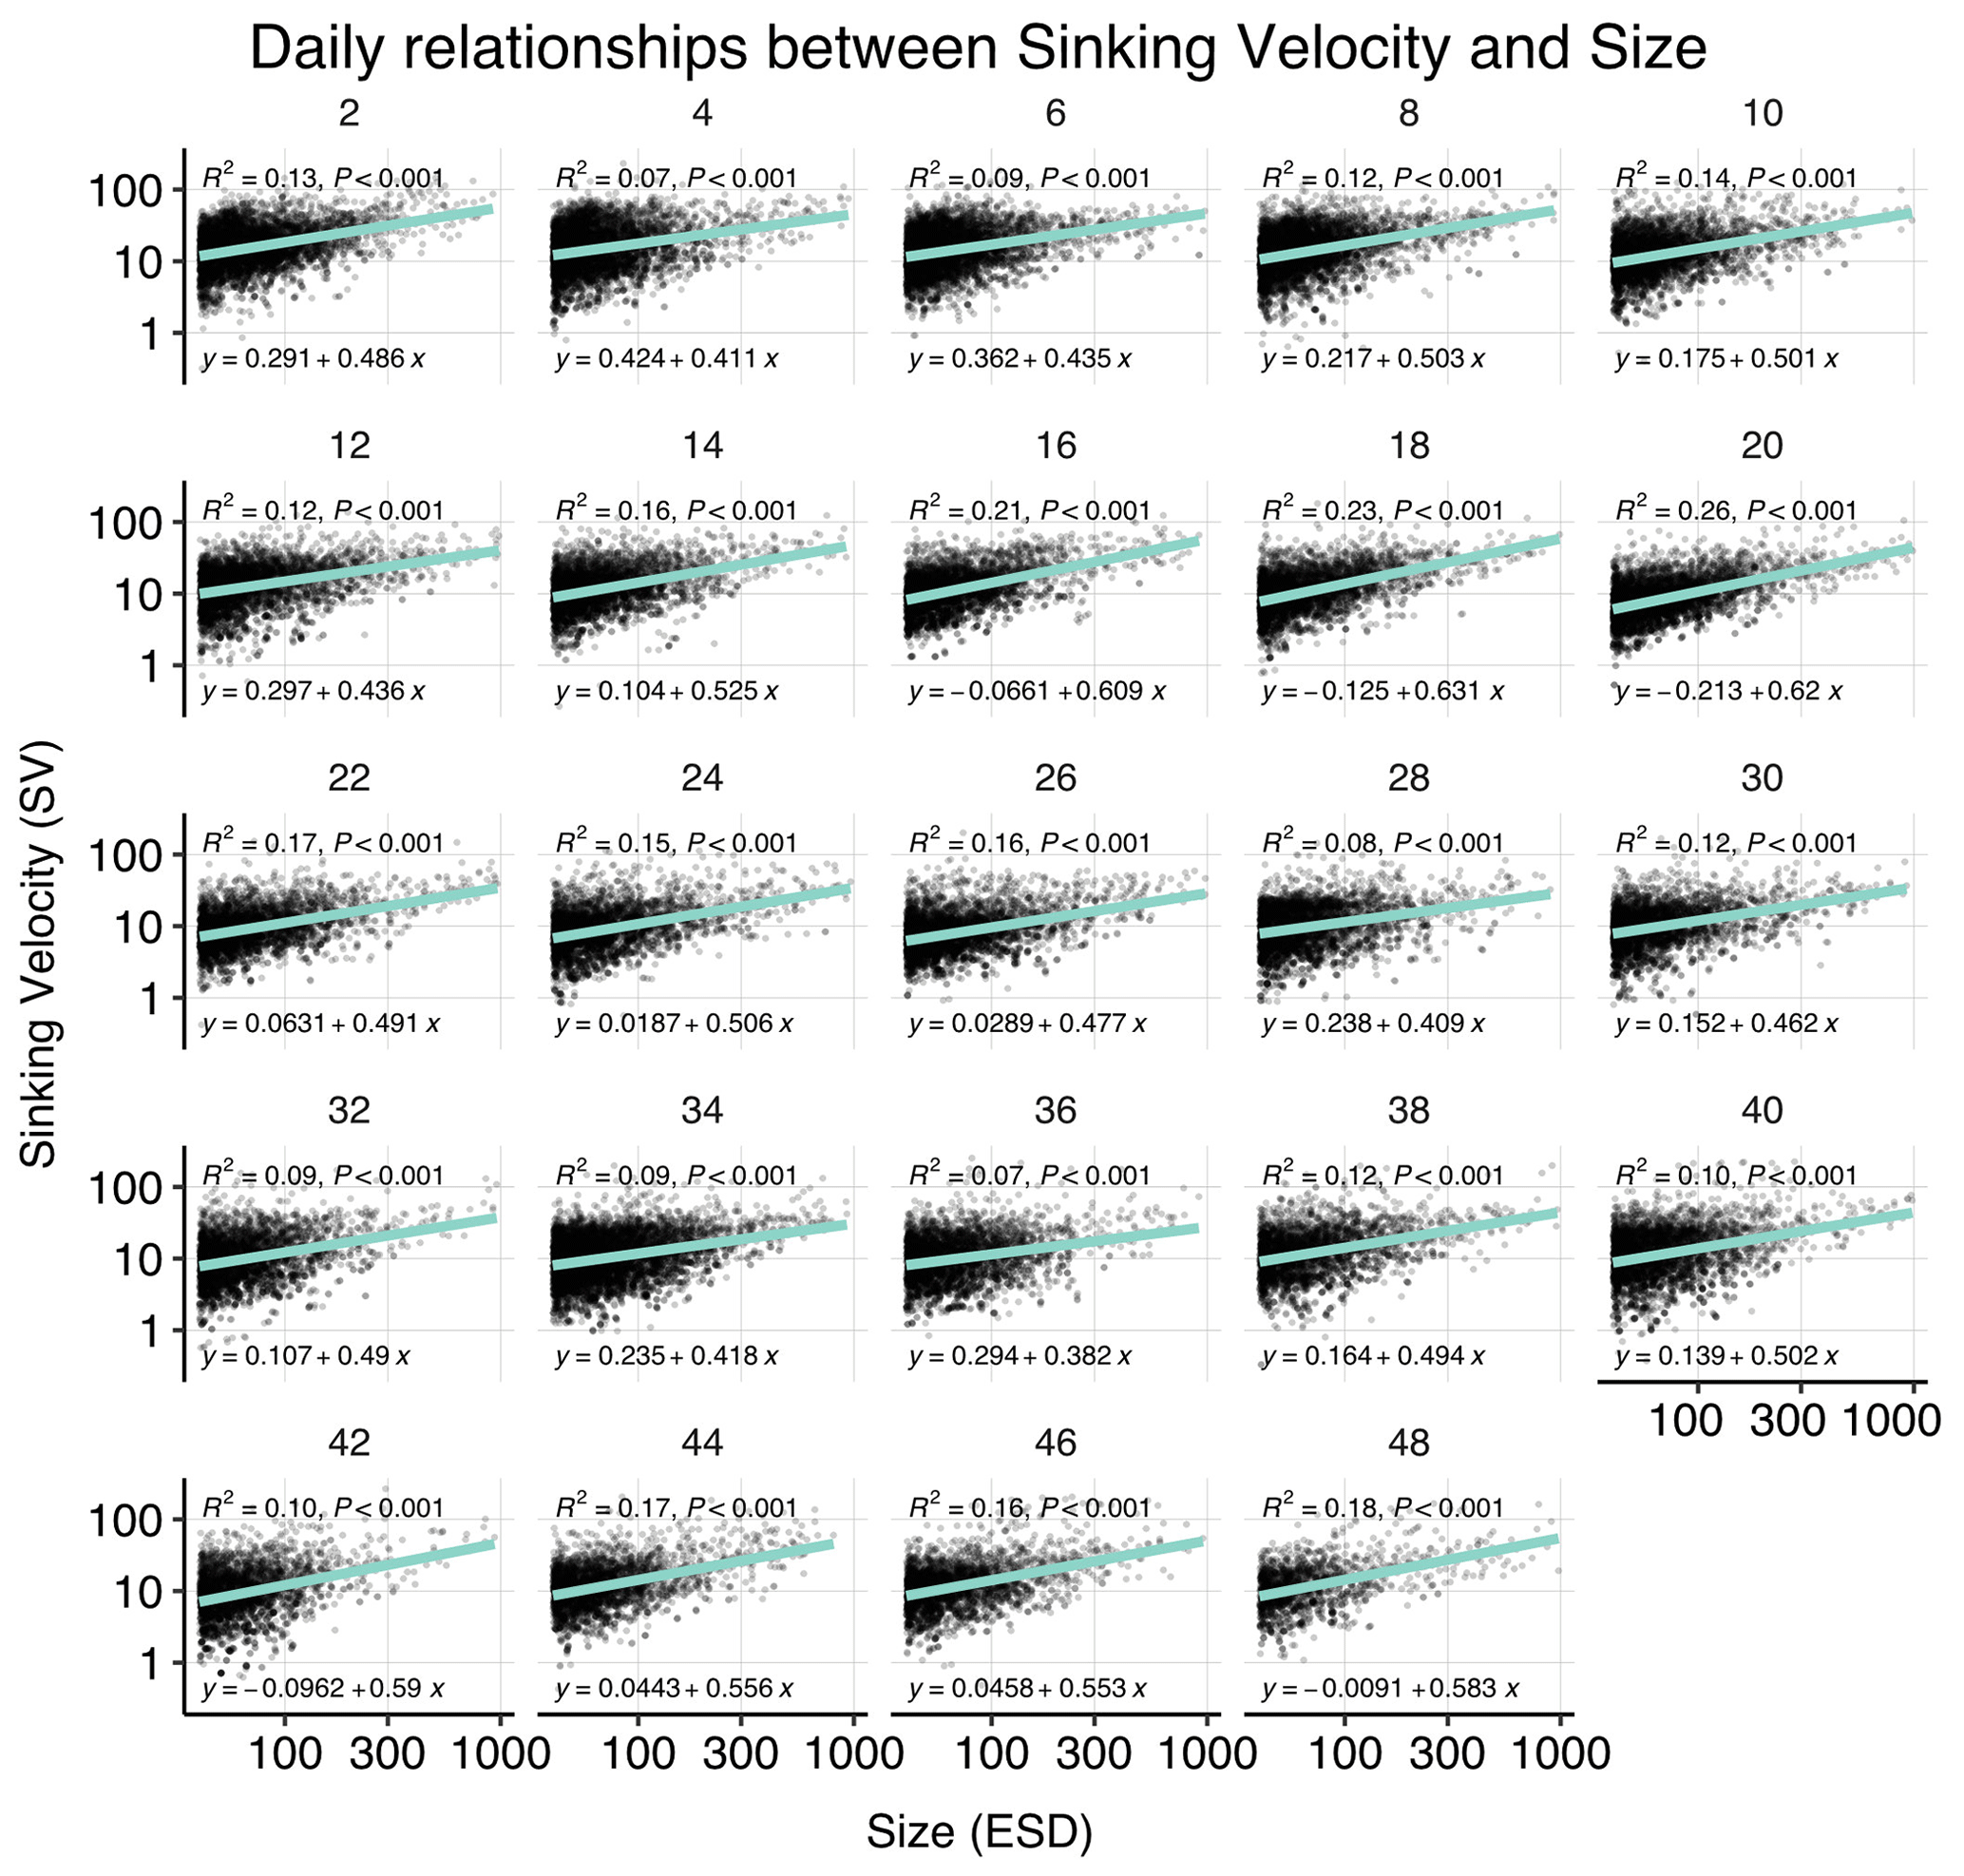
Figure B3Correlations between sinking velocity and particle size over time. Each panel shows data of all mesocosms for 1 experimental day, including a linear regression with test statistics and model formula, and each black dot corresponds to one particle. Related model output: Table A3 and Fig. 4b.
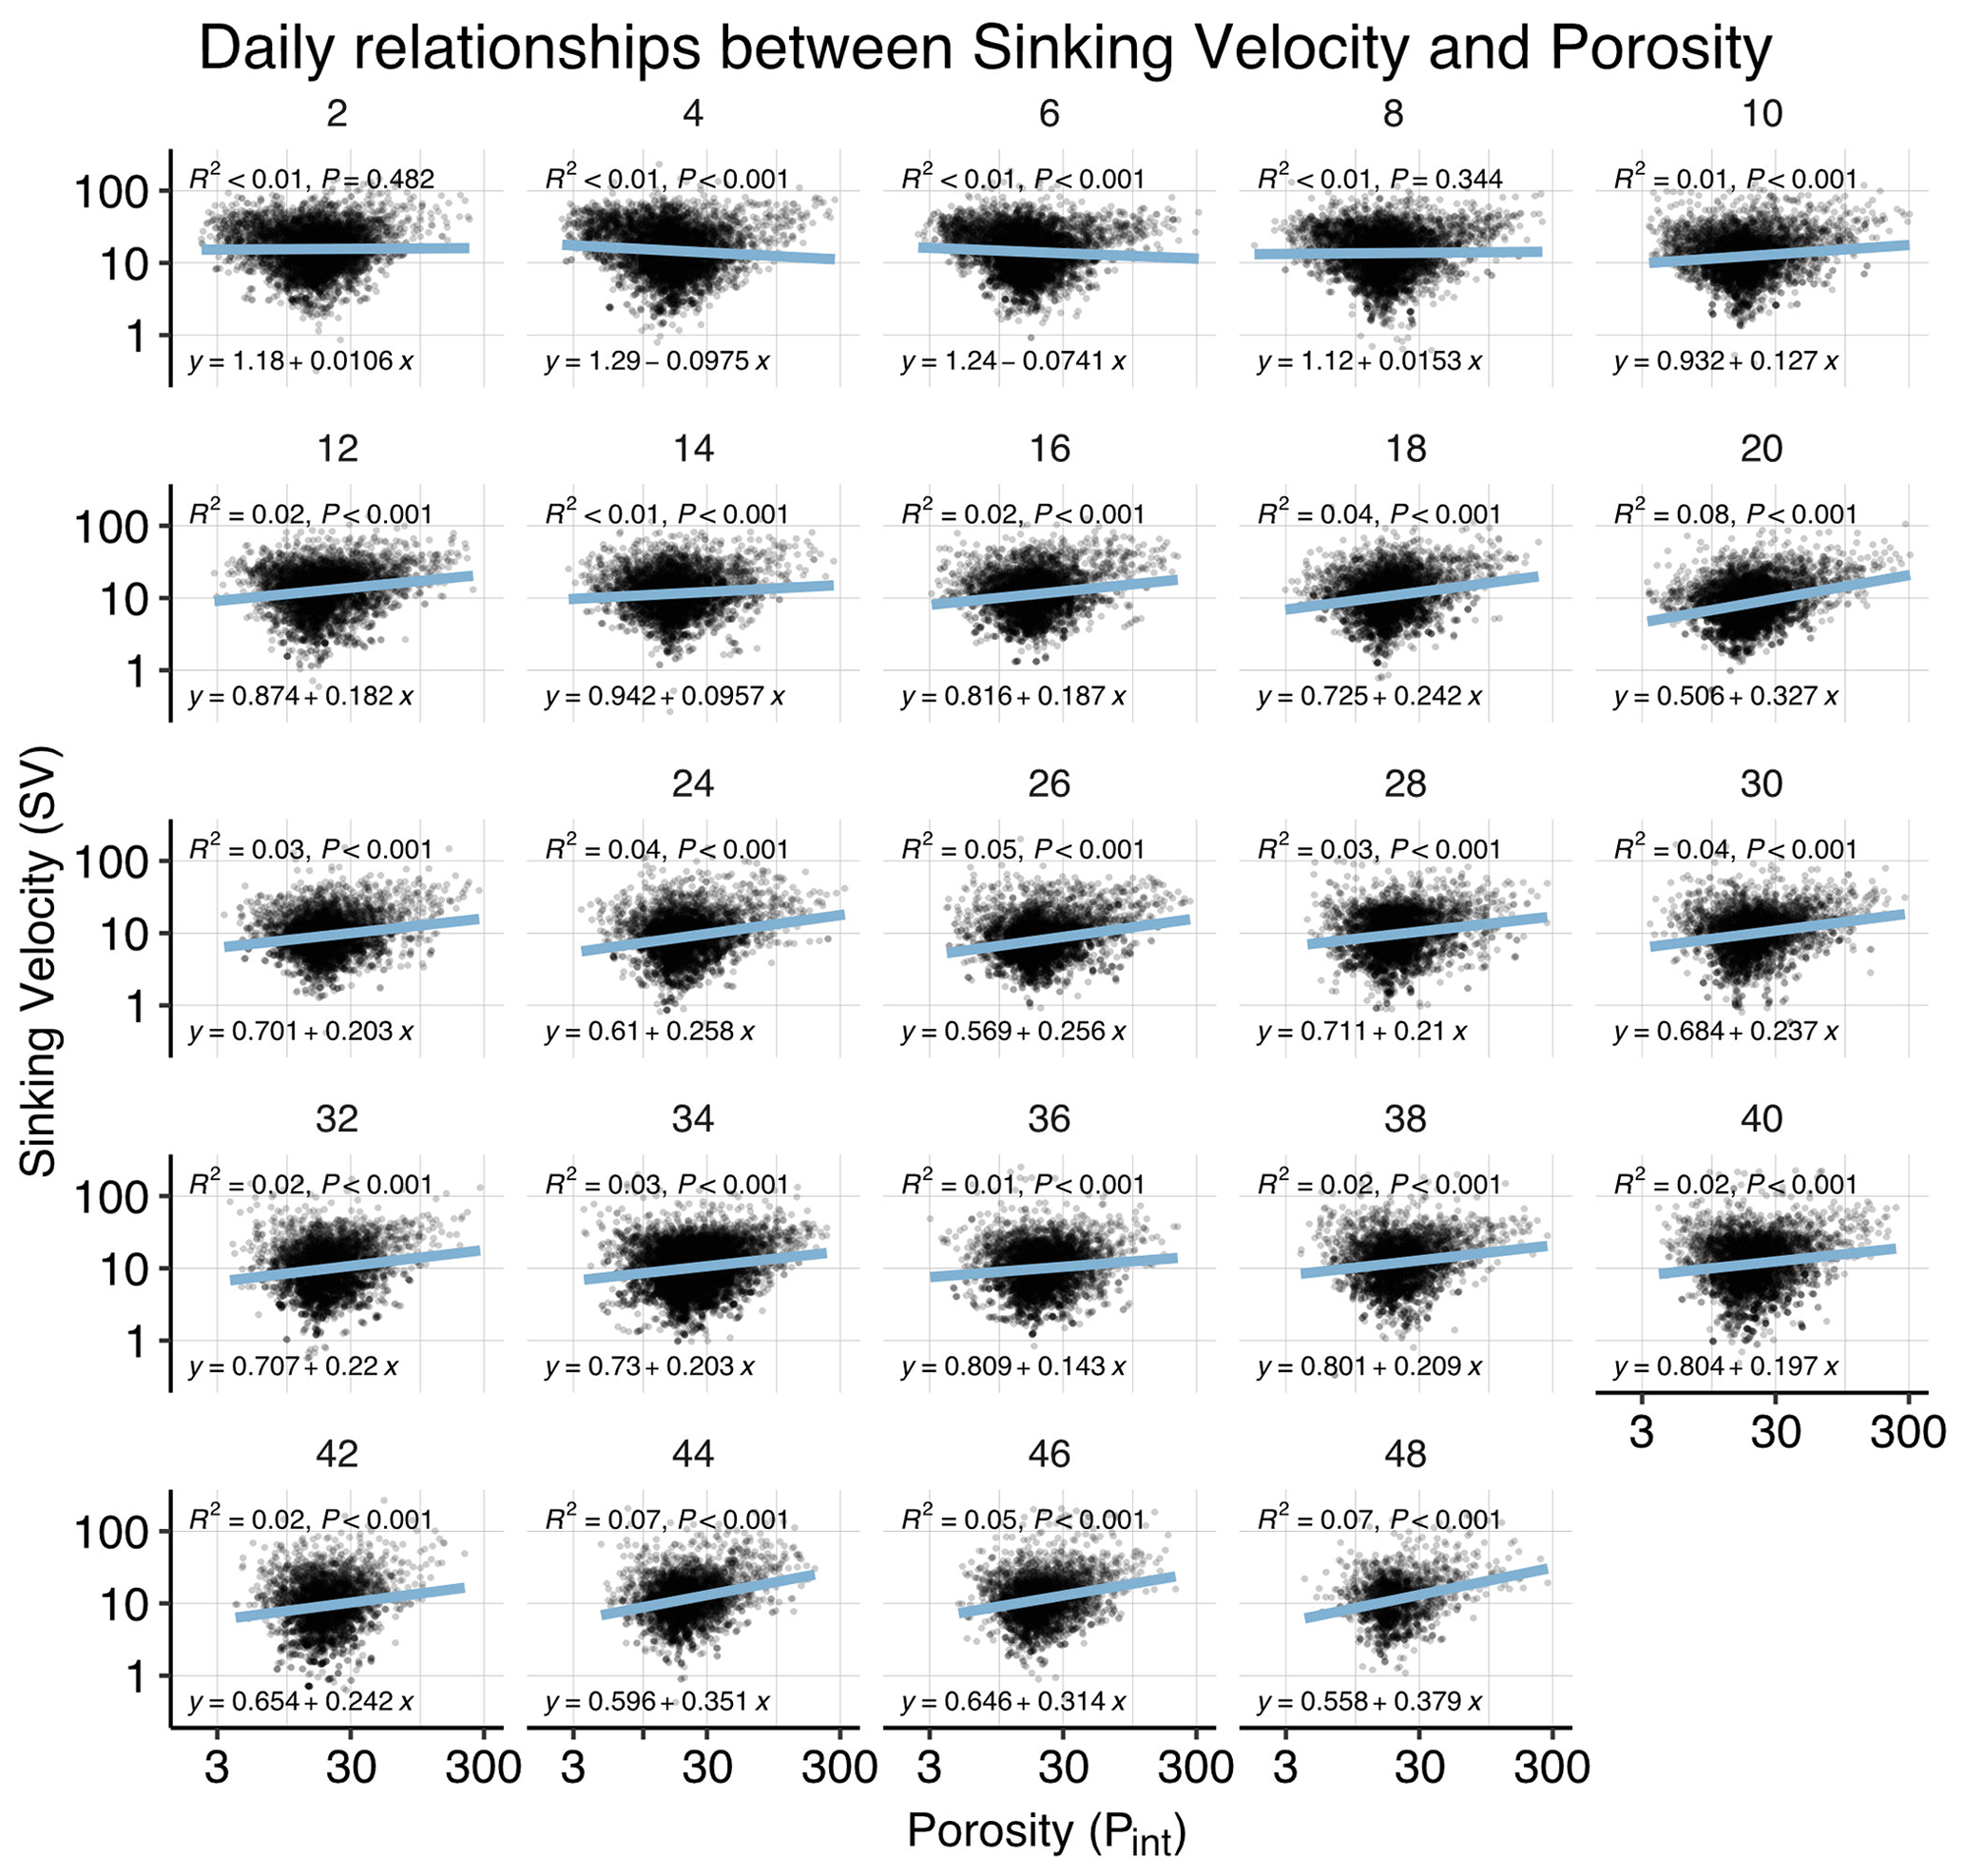
Figure B4Correlations between sinking velocity and particle porosity over time. Each panel shows data of all mesocosms for 1 experimental day, including a linear regression with test statistics and model formula. Related model output: Table A3 and Fig. 4b.
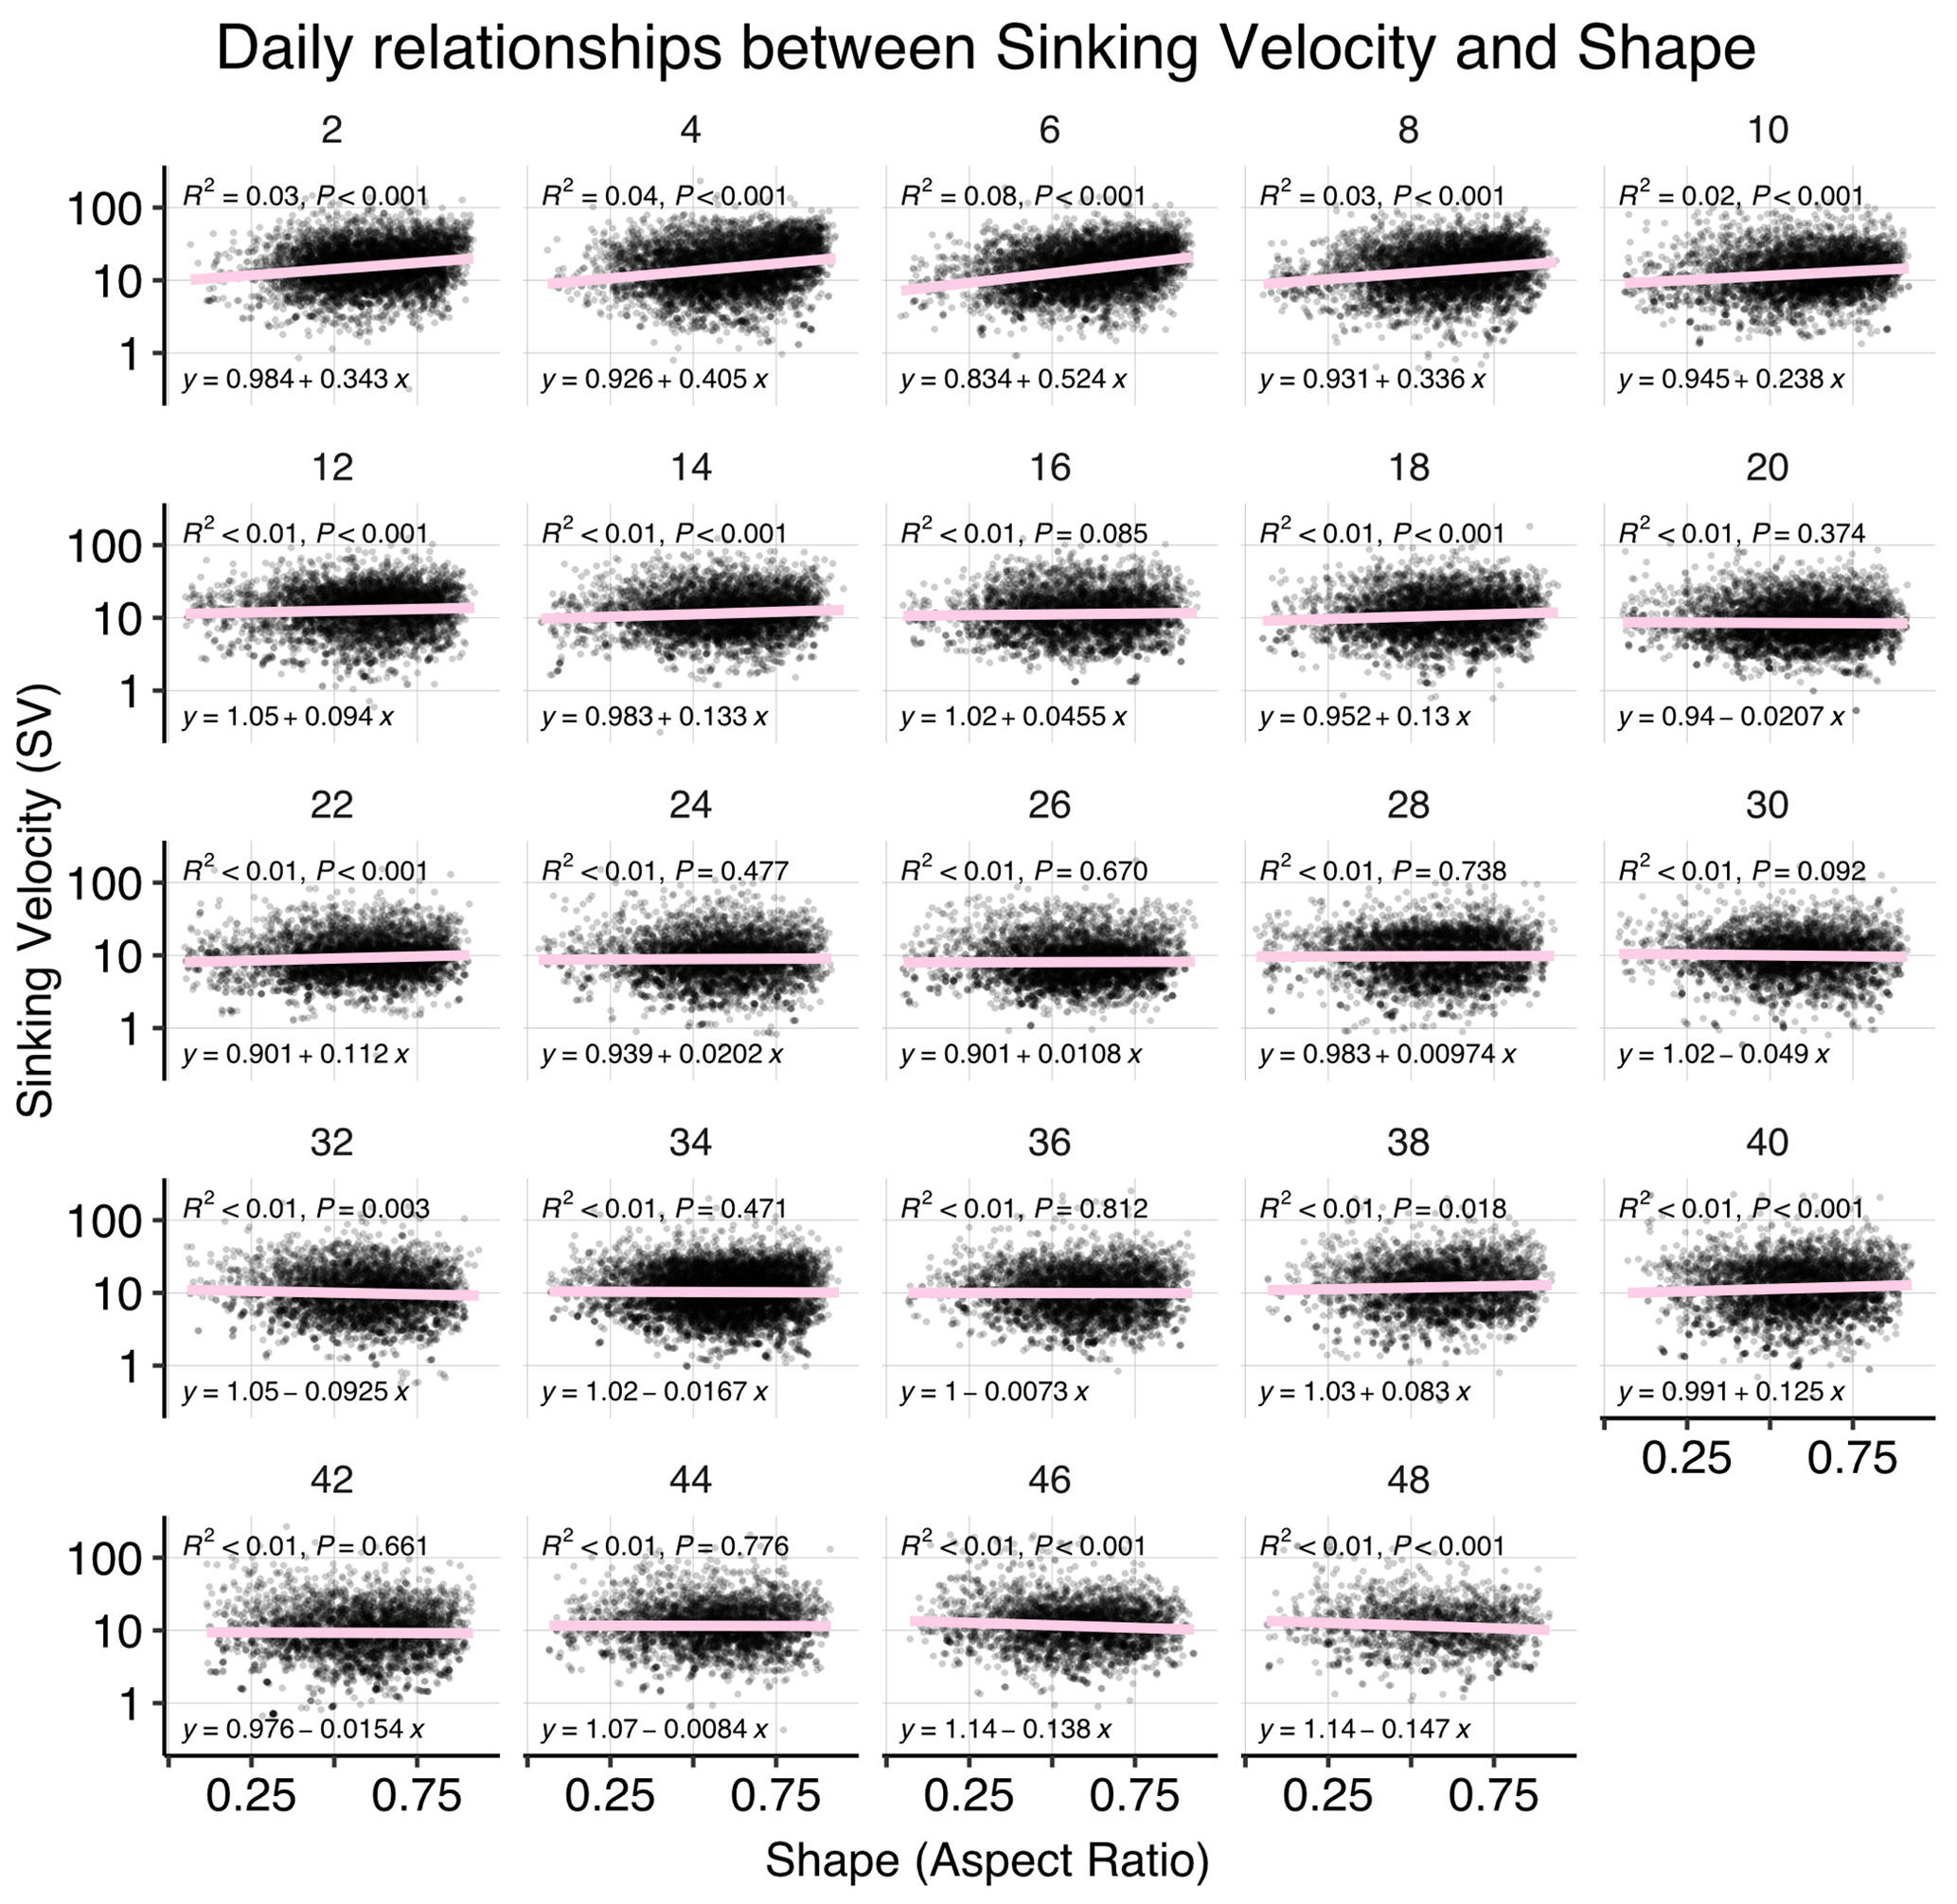
Figure B5Correlations between sinking velocity and particle size over time. Each panel shows data of all mesocosms for 1 experimental day, including a linear regression with test statistics and model formula. Related model output: Table A3 and Fig. 4b.
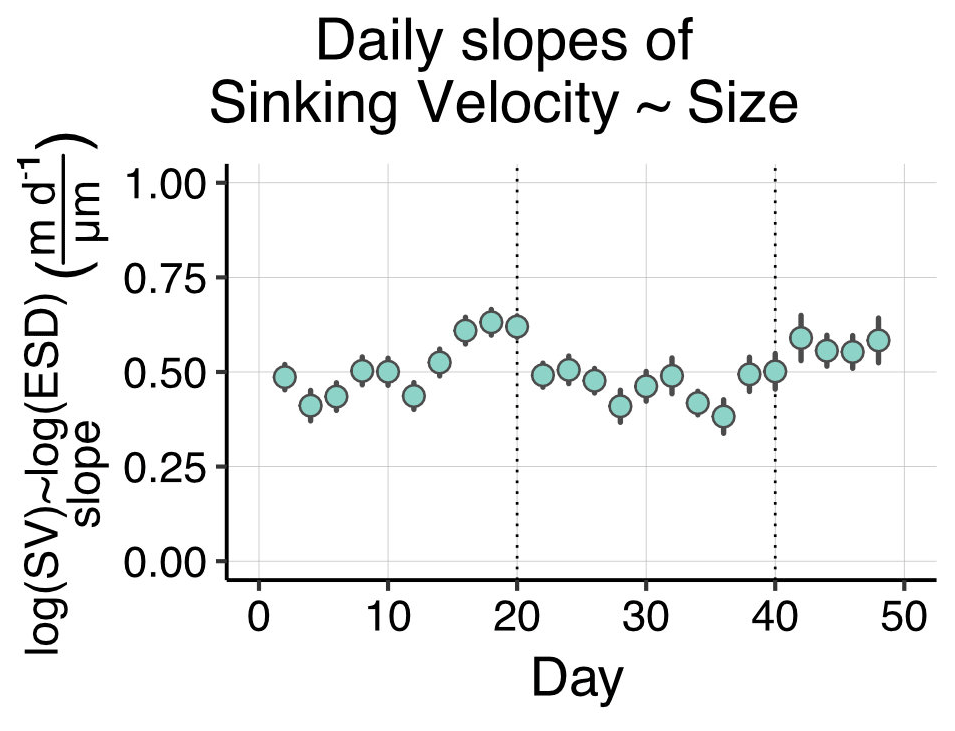
Figure B6Temporal development of slopes from daily linear regressions modelling sinking velocity (SV) as a function of particle size (ESD). Error bars depict confidence intervals, and the data points correspond to the slopes of the model formulas in Fig. B3.
The data included in this paper are now available in the PANGAEA data repository under https://doi.pangaea.de/10.1594/PANGAEA.948573 (Baumann et al., 2023a) and https://doi.pangaea.de/10.1594/PANGAEA.948574 (Baumann et al., 2023b).
LTB, AJP and UR designed the experiment. PS, LTB, FM, AJP and UR contributed to the sampling. MB, LTB, SG, AJP and JT analysed the data. MB wrote the paper with comments from all co-authors.
The contact author has declared that none of the authors has any competing interests.
Publisher’s note: Copernicus Publications remains neutral with regard to jurisdictional claims in published maps and institutional affiliations.
This article is part of the special issue “Ecological and biogeochemical functioning of the coastal upwelling system off Peru: an in situ mesocosm study”. It is not associated with a conference.
We thank all the participants of the KOSMOS Peru 2017 study for their efforts in mesocosm sampling and maintenance. We want to thank, in particular, Tim Boxhammer for the biogeochemical sampling and processing of the sediment trap material. The employees of the IMARPE institute deserve a special thanks for all the kinds of support they have provided us with during the planning, preparation and execution of this study. We are also thankful to Club Náutico del Centro Naval for hosting part of our laboratories and offices. This work has been carried out in the framework of the cooperation agreement between IMARPE and GEOMAR through the German Federal Ministry of Education and Research (BMBF) project ASLAEL 12-016 and the national project Integrated Study of the Upwelling System off Peru developed by the Directorate of Oceanography and Climate Change of IMARPE, PPR 137 CONCYTEC.
This study was funded by the Collaborative
Research Centre SFB 754 Climate-Biogeochemistry Interactions in the Tropical
Ocean financed by the German Research Foundation (DFG). Additional funds
were provided by the EU project AQUACOSM via the European Union's Horizon
2020 research and innovation programme under grand agreement no. 731065 and
through the Leibniz Award 2012, granted to Ulf Riebesell.
The article processing charges for this open-access publication were covered by the GEOMAR Helmholtz Centre for Ocean Research Kiel.
This paper was edited by Hans-Peter Grossart and reviewed by Emmanuel C. Laurenceau-Cornec, Emma Cavan and Sven Tobias-Hunefeld.
Alldredge, A. L. and Crocker, K. M.: Why do sinking mucilage aggregates accumulate in the water column?, Sci. Total Environ., 165, 15–22, https://doi.org/10.1016/0048-9697(95)04539-D, 1995.
Alldredge, A. L. and Gotschalk, C.: In situ settling behavior of marine snow, Limnol. Oceanogr., 33, 339–351, https://doi.org/10.4319/lo.1988.33.3.0339, 1988.
Armstrong, R. A., Peterson, M. L., Lee, C., and Wakeham, S. G.: Settling velocity spectra and the ballast ratio hypothesis, Deep-Sea Res. Pt. II, 56, 1470–1478, https://doi.org/10.1016/j.dsr2.2008.11.032, 2009.
Ayón Dejo, P., Pinedo Arteaga, E. L., Schukat, A., Taucher, J., Kiko, R., Hauss, H., Dorschner, S., Hagen, W., Segura-Noguera, M., and Lischka, S.: Zooplankton community succession and trophic links during a mesocosm experiment in the coastal upwelling off Callao Bay (Peru), Biogeosciences, 20, 945–969, https://doi.org/10.5194/bg-20-945-2023, 2023.
Bach, L. T., Riebesell, U., Sett, S., Febiri, S., Rzepka, P., and Schulz, K. G.: An approach for particle sinking velocity measurements in the 3–400 µm size range and considerations on the effect of temperature on sinking rates, Mar. Biol., 159, 1853–1864, https://doi.org/10.1007/s00227-012-1945-2, 2012.
Bach, L. T., Boxhammer, T., Larsen, A., Hildebrandt, N., Schulz, K. G., and Riebesell, U.: Influence of plankton community structure on the sinking velocity of marine aggregates: Sinking velocity of marine aggregates, Global Biogeochem. Cy., 30, 1145–1165, https://doi.org/10.1002/2016GB005372, 2016.
Bach, L. T., Stange, P., Taucher, J., Achterberg, E. P., Algueró-Muñiz, M., Horn, H., Esposito, M., and Riebesell, U.: The Influence of Plankton Community Structure on Sinking Velocity and Remineralization Rate of Marine Aggregates, Global Biogeochem. Cy., 33, 971–994, https://doi.org/10.1029/2019GB006256, 2019.
Bach, L. T., Paul, A. J., Boxhammer, T., von der Esch, E., Graco, M., Schulz, K. G., Achterberg, E., Aguayo, P., Arístegui, J., Ayón, P., Baños, I., Bernales, A., Boegeholz, A. S., Chavez, F., Chavez, G., Chen, S.-M., Doering, K., Filella, A., Fischer, M., Grasse, P., Haunost, M., Hennke, J., Hernández-Hernández, N., Hopwood, M., Igarza, M., Kalter, V., Kittu, L., Kohnert, P., Ledesma, J., Lieberum, C., Lischka, S., Löscher, C., Ludwig, A., Mendoza, U., Meyer, J., Meyer, J., Minutolo, F., Ortiz Cortes, J., Piiparinen, J., Sforna, C., Spilling, K., Sanchez, S., Spisla, C., Sswat, M., Zavala Moreira, M., and Riebesell, U.: Factors controlling plankton community production, export flux, and particulate matter stoichiometry in the coastal upwelling system off Peru, Biogeosciences, 17, 4831–4852, https://doi.org/10.5194/bg-17-4831-2020, 2020.
Barlow, R. G., Cummings, D. G., and Gibb, S. W.: Improved resolution of mono- and divinyl chlorophylls a and b and zeaxanthin and lutein in phytoplankton extracts using reverse phase C-8 HPLC, Mar. Ecol. Prog. Ser., 161, 303–307, https://doi.org/10.3354/meps161303, 1997.
Bates, D., Mächler, M., Bolker, B., and Walker, S.: Fitting Linear Mixed-Effects Models Using lme4, J. Stat. Soft., 67, 1–48, https://doi.org/10.18637/jss.v067.i01, 2015.
Baumann, M., Taucher, J., Paul, A. J., Heinemann, M., Vanharanta, M., Bach, L. T., Spilling, K., Ortiz, J., Arístegui, J., Hernández-Hernández, N., Baños, I., and Riebesell, U.: Effect of Intensity and Mode of Artificial Upwelling on Particle Flux and Carbon Export, Front. Mar. Sci., 8, 742142, https://doi.org/10.3389/fmars.2021.742142, 2021.
Baumann, M., Paul, A. J., Taucher, J., Bach, L. T., Goldenberg, S. U., Stange, P., Minutolo, F., and Riebesell, U.: KOSMOS 2017 Peru mesocosm study: export flux and particle sinking velocities, PANGAEA [data set], https://doi.pangaea.de/10.1594/PANGAEA.948573 (last access: 28 June 2023), 2023a.
Baumann, M., Paul, A. J., Taucher, J., Bach, L. T., Goldenberg, S. U., Stange, P., Minutolo, F., and Riebesell, U.: KOSMOS 2017 Peru mesocosm study: single particle measurements of sinking velocity and physical properties. PANGAEA [data set], https://doi.pangaea.de/10.1594/PANGAEA.948574 (last access: 28 June 2023), 2023b.
Boxhammer, T., Bach, L. T., Czerny, J., and Riebesell, U.: Technical note: Sampling and processing of mesocosm sediment trap material for quantitative biogeochemical analysis, Biogeosciences, 13, 2849–2858, https://doi.org/10.5194/bg-13-2849-2016, 2016.
Boxhammer, T., Bach, L. T., Sswat, M., and Riebesell, U.: Orni-eutrophication by Inca terns (Larosterna inca) during the KOSMOS study 2017 in the coastal upwelling system off Peru, OceanRep, GEOMAR, https://doi.org/10.3289/ORNI_EUTROPHICATION, 2019.
Cael, B. B., Cavan, E. L., and Britten, G. L.: Reconciling the Size-Dependence of Marine Particle Sinking Speed, Geophys. Res. Lett., 48, e2020GL091771, https://doi.org/10.1029/2020GL091771, 2021.
Cavan, E. L., Giering, S. L. C., Wolff, G. A., Trimmer, M., and Sanders, R.: Alternative Particle Formation Pathways in the Eastern Tropical North Pacific's Biological Carbon Pump, J. Geophys. Res.-Biogeo., 123, 2198–2211, https://doi.org/10.1029/2018JG004392, 2018.
Chavez, F. P. and Messié, M.: A comparison of Eastern Boundary Upwelling Ecosystems, Prog. Oceanogr., 83, 80–96, https://doi.org/10.1016/j.pocean.2009.07.032, 2009.
Dey, S., Zeeshan Ali, S., and Padhi, E.: Terminal fall velocity: the legacy of Stokes from the perspective of fluvial hydraulics, Proc. R. Soc. A., 475, 20190277, https://doi.org/10.1098/rspa.2019.0277, 2019.
Diercks, A.-R. and Asper, V. L.: In situ settling speeds of marine snow aggregates below the mixed layer: Black Sea and Gulf of Mexico, Deep-Sea Res. Pt. I, 44, 385–398, https://doi.org/10.1016/S0967-0637(96)00104-5, 1997.
DiTullio, G. R., Geesey, M. E., Maucher, J. M., Alm, M. B., Riseman, S. F., and Bruland, K. W.: Influence of iron on algal community composition and physiological status in the Peru upwelling system, Limnol. Oceanogr., 50, 1887–1907, https://doi.org/10.4319/lo.2005.50.6.1887, 2005.
Durkin, C. A., Buesseler, K. O., Cetinić, I., Estapa, M. L., Kelly, R. P., and Omand, M. M.: A Visual Tour of Carbon Export by Sinking Particles, Global Biogeochem. Cy., 35, e2021GB006985, https://doi.org/10.1029/2021gb006985, 2021.
Giering, S. L. C., Cavan, E. L., Basedow, S. L., Briggs, N., Burd, A. B., Darroch, L. J., Guidi, L., Irisson, J.-O., Iversen, M. H., Kiko, R., Lindsay, D., Marcolin, C. R., McDonnell, A. M. P., Möller, K. O., Passow, U., Thomalla, S., Trull, T. W., and Waite, A. M.: Sinking Organic Particles in the Ocean – Flux Estimates From in situ Optical Devices, Front. Mar. Sci., 6, 834, https://doi.org/10.3389/fmars.2019.00834, 2020.
González, H. E., Daneri, G., Iriarte, J. L., Yannicelli, B., Menschel, E., Barría, C., Pantoja, S., and Lizárraga, L.: Carbon fluxes within the epipelagic zone of the Humboldt Current System off Chile: The significance of euphausiids and diatoms as key functional groups for the biological pump, Prog. Oceanogr., 83, 217–227, https://doi.org/10.1016/j.pocean.2009.07.036, 2009.
Guidi, L., Stemmann, L., Jackson, G. A., Ibanez, F., Claustre, H., Legendre, L., Picheral, M., and Gorskya, G.: Effects of phytoplankton community on production, size, and export of large aggregates: A world-ocean analysis, Limnol. Oceanogr., 54, 1951–1963, https://doi.org/10.4319/lo.2009.54.6.1951, 2009.
Hansen, H. P. and Koroleff, F.: Determination of nutrients, in: Methods of Seawater Analysis, Third, Completely Revised and Extended Edition, WILEY-VCH Verlag GmbH, 159–228, Online ISBN: 9783527613984, Print ISBN: 9783527295890, 1999.
Iversen, M. H. and Lampitt, R. S.: Size does not matter after all: No evidence for a size-sinking relationship for marine snow, Prog. Oceanogr., 189, 102445, https://doi.org/10.1016/j.pocean.2020.102445, 2020.
Iversen, M. H., Nowald, N., Ploug, H., Jackson, G. A., and Fischer, G.: High resolution profiles of vertical particulate organic matter export off Cape Blanc, Mauritania: Degradation processes and ballasting effects, Deep-Sea Res. Pt. I, 57, 771–784, https://doi.org/10.1016/j.dsr.2010.03.007, 2010.
Kalvelage, T., Lavik, G., Lam, P., Contreras, S., Arteaga, L., Löscher, C. R., Oschlies, A., Paulmier, A., Stramma, L., and Kuypers, M. M. M.: Nitrogen cycling driven by organic matter export in the South Pacific oxygen minimum zone, Nat. Geosci., 6, 228–234, https://doi.org/10.1594/pangaea.843461, 2013.
Kämpf, J. and Chapman, P.: Upwelling Systems of the World, Springer International Publishing, Cham, 433 pp., https://doi.org/10.1007/978-3-319-42524-5, 2016.
Karstensen, J., Stramma, L., and Visbeck, M.: Oxygen minimum zones in the eastern tropical Atlantic and Pacific oceans, Prog. Oceanogr., 77, 331–350, https://doi.org/10.1016/j.pocean.2007.05.009, 2008.
Karthäuser, C., Ahmerkamp, S., Marchant, H. K., Bristow, L. A., Hauss, H., Iversen, M. H., Kiko, R., Maerz, J., Lavik, G., and Kuypers, M. M. M.: Small sinking particles control anammox rates in the Peruvian oxygen minimum zone, Nat. Commun., 12, 3235, https://doi.org/10.1038/s41467-021-23340-4, 2021.
Khatiwala, S., Tanhua, T., Mikaloff Fletcher, S., Gerber, M., Doney, S. C., Graven, H. D., Gruber, N., McKinley, G. A., Murata, A., Ríos, A. F., and Sabine, C. L.: Global ocean storage of anthropogenic carbon, Biogeosciences, 10, 2169–2191, https://doi.org/10.5194/bg-10-2169-2013, 2013.
Klaas, C. and Archer, D.: Association of sinking organic matter with various types of mineral ballast in the deep sea: Implications for the rain ratio, Global Biogeochem. Cy., 16, 1116, https://doi.org/10.1029/2001gb001765, 2002.
Kuznetsova, A., Brockhoff, P. B., and Christensen, R. H. B.: lmerTest Package: Tests in Linear Mixed Effects Models, J. Stat. Soft., 82, 1–26, https://doi.org/10.18637/jss.v082.i13, 2017.
Laurenceau-Cornec, E. C., Trull, T. W., Davies, D. M., Bray, S. G., Doran, J., Planchon, F., Carlotti, F., Jouandet, M.-P., Cavagna, A.-J., Waite, A. M., and Blain, S.: The relative importance of phytoplankton aggregates and zooplankton fecal pellets to carbon export: insights from free-drifting sediment trap deployments in naturally iron-fertilised waters near the Kerguelen Plateau, Biogeosciences, 12, 1007–1027, https://doi.org/10.5194/bg-12-1007-2015, 2015.
Laurenceau-Cornec, E. C., Le Moigne, F. A. C., Gallinari, M., Moriceau, B., Toullec, J., Iversen, M. H., Engel, A., and De La Rocha, C. L.: New guidelines for the application of Stokes' models to the sinking velocity of marine aggregates, Limnol. Oceanogr., 65, 1264–1285, https://doi.org/10.1002/lno.11388, 2020.
Lüdecke, D.: sjstats: Statistical Functions for Regression Models. (0.17.2), Zenodo, https://doi.org/10.5281/zenodo.1489175, 2018.
Lüdecke, D., Ben-Shachar, M., Patil, I., Waggoner, P., and Makowski, D.: performance: An R Package for Assessment, Comparison and Testing of Statistical Models, J. Open Source Soft., 6, 3139, https://doi.org/10.21105/joss.03139, 2021.
Mackey, M. D., Mackey, D. J., Higgins, H. W., and Wright, S. W.: CHEMTAX – a program for estimating class abundances from chemical markers: application to HPLC measurements of phytoplankton, Mar. Ecol. Prog. Ser., 144, 265–283, https://doi.org/10.3354/meps144265, 1996.
McDonnell, A. M. P. and Buesseler, K. O.: Variability in the average sinking velocity of marine particles, Limnol. Oceanogr., 55, 2085–2096, https://doi.org/10.4319/lo.2010.55.5.2085, 2010.
McDonnell, A. M. P., Boyd, P. W., and Buesseler, K. O.: Effects of sinking velocities and microbial respiration rates on the attenuation of particulate carbon fluxes through the mesopelagic zone, Global Biogeochem. Cy., 29 175–193, https://doi.org/10.1002/2014gb004935, 2015.
Otero, X. L., De La Peña-Lastra, S., Pérez-Alberti, A., Ferreira, T. O., and Huerta-Diaz, M. A.: Seabird colonies as important global drivers in the nitrogen and phosphorus cycles, Nat. Commun., 9, 246, https://doi.org/10.1038/s41467-017-02446-8, 2018.
Paul, A. P., Bach, L. T., Schulz, K. G., Boxhammer, T., Czerny, J., Achterberg, E. P., Hellemann, D., Trense, Y., Nausch, M., Sswat, M., and Riebesell, U.: Effect of elevated CO2 on organic matter pools and fluxes in a summer Baltic Sea plankton community, Biogeosciences, 12, 6181–6203, https://doi.org/10.5194/bg-12-6181-2015, 2015.
Pennington, J. T., Mahoney, K. L., Kuwahara, V. S., Kolber, D. D., Calienes, R., and Chavez, F. P.: Primary production in the eastern tropical Pacific: A review, Prog. Oceanogr., 69, 285–317, https://doi.org/10.1016/j.pocean.2006.03.012, 2006.
R Core Team: R: A language and environment for statistical computing. R Foundation for Statistical Computing, version 4.1.2, Vienna, Austria, https://www.R-project.org/ (last access: 30 June 2023), 2021.
Riebesell, U., Czerny, J., von Bröckel, K., Boxhammer, T., Büdenbender, J., Deckelnick, M., Fischer, M., Hoffmann, D., Krug, S. A., Lentz, U., Ludwig, A., Muche, R., and Schulz, K. G.: Technical Note: A mobile sea-going mesocosm system – new opportunities for ocean change research, Biogeosciences, 10, 1835–1847, https://doi.org/10.5194/bg-10-1835-2013, 2013.
Ristow, G. H.: Wall correction factor for sinking cylinders in fluids, Phys. Rev. E, 55, 2808–2813, https://doi.org/10.1103/PhysRevE.55.2808, 1997.
Sharp, J. H.: Improved analysis for “particulate” organic carbon and nitrogen from seawater, Limnol. Oceanogr., 19, 984–989, https://doi.org/10.4319/lo.1974.19.6.0984, 1974.
Smetacek, V., Klaas, C., Strass, V., Assmy, P., Montresor, M., Cisewski, B., Savoye, N., Webb, A., d'Ovidio, F., Arrieta, J. M., Bathmann, U., Bellerby, R. G. J., Berg, G. M., Croot, P., Gonzalez, S. F., Henjes, J., Herndl, G. J., Hoffmann, L. J., Leach, H., Losch, M., Mills, M. M., Neill, C., Peeken, I., Röttgers, R., Sachs, O., Sauter, E., Schmidt, M. M., Schwarz, J. N., Terbrüggen, A., and Wolf-Gladrow, D.: Deep carbon export from a Southern Ocean iron-fertilized diatom bloom, Nature, 487, 313–319, https://doi.org/10.1038/nature11229, 2012.
Steinberg, D. K. and Landry, M. R.: Zooplankton and the Ocean Carbon Cycle, Annu. Rev. Mar. Sci., 9, 413–444, https://doi.org/10.1146/annurev-marine-010814-015924, 2017.
Stokes, G. G.: On the Effect of the Internal Friction of Fluids on the Motion of Pendulums, Transactions of the Cambridge Philosophical Society, 9, 8–106, 1851.
Turner, J. T.: Zooplankton fecal pellets, marine snow, phytodetritus and the ocean's biological pump, Prog. Oceanogr., 130, 205–248, https://doi.org/10.1016/j.pocean.2014.08.005, 2015.
Wickham, H., Averick, M., Bryan, J., Chang, W., D'Agostino McGowan, L., François, R., Grolemund, G., Hayes, A., Henry, L., Hester, J., Kuhn, M., Pedersen, T. L., Miller, E., Bache, S. M., Müller, K., Ooms, J., Robinson, D., Seidel, D. P., Spinu, V., Takahashi, K., Vaughan, D., Wilke, C., Woo, K., and Hiroaki, Y.: Welcome to the tidyverse, J. Open Source Softw., 4, 1686, https://doi.org/10.21105/joss.01686, 2019.
Williams, J. R. and Giering, S. L. C.: In Situ Particle Measurements Deemphasize the Role of Size in Governing the Sinking Velocity of Marine Particles, Geophys. Res. Lett., 49, e2022GL099563, https://doi.org/10.1029/2022GL099563, 2022.