the Creative Commons Attribution 4.0 License.
the Creative Commons Attribution 4.0 License.
 | 21 Jul 2023
A multi-phase biogeochemical model for mitigating earthquake-induced liquefaction via microbially induced desaturation and calcium carbonate precipitation
Andre van Turnhout
Edward Kavazanjian Jr.
Leon A. van Paassen
Bruce Rittmann
A next-generation biogeochemical model was developed to explore the impact of the native water source on microbially induced desaturation and precipitation (MIDP) via denitrification. MIDP is a non-disruptive, nature-based ground improvement technique that offers the promise of cost-effective mitigation of earthquake-induced soil liquefaction under and adjacent to existing structures. MIDP leverages native soil bacteria to reduce the potential for liquefaction triggering in the short term through biogenic gas generation (treatment completed within hours to days) and over the longer term through calcium carbonate precipitation (treatment completed in weeks to months). This next-generation biogeochemical model expands earlier modeling to consider multi-phase speciation, bacterial competition, inhibition, and precipitation. The biogeochemical model was used to explore the impact of varying treatment recipes on MIDP products and by-products in a natural seawater environment. The case study presented herein demonstrates the importance of optimizing treatment recipes to minimize unwanted by-products (e.g., H2S production) or incomplete denitrification (e.g., nitrate and nitrite accumulation).
- Article
(904 KB) - Full-text XML
-
Supplement
(976 KB) - BibTeX
- EndNote


Microbially induced desaturation and precipitation (MIDP) is a biogeotechnical technique that takes advantage of native subsurface denitrifying bacteria to mitigate earthquake-induced soil liquefaction (O'Donnell et al., 2017a, b; Pham et al., 2018). MIDP mitigates liquefaction in two ways: generation of nitrogen gas (N2) and mineral precipitation (usually calcium carbonate, CaCO3). The impact of MIDP on the soil system is illustrated in Fig. 1. The generated N2 desaturates the soil, increasing its compressibility and reducing the increase in pore water pressure during cyclic loading, which is the root cause of earthquake-induced liquefaction. Carbonate precipitation increases the soil strength, thereby increasing the intensity of earthquake sharing necessary to trigger liquefaction. A primary benefit of MIDP for liquefaction mitigation is that, being non-disruptive, it can be used underneath existing structures (O'Donnell et al., 2017a; Hall, 2021). Trillions of dollars of existing infrastructure is at risk due to the potential for liquefaction, and currently that risk cannot be mitigated in a cost-effective way. MIDP is currently being evaluated at different experimental scales as a solution to this problem (O'Donnell et al., 2017a, b; Moug et al., 2022).
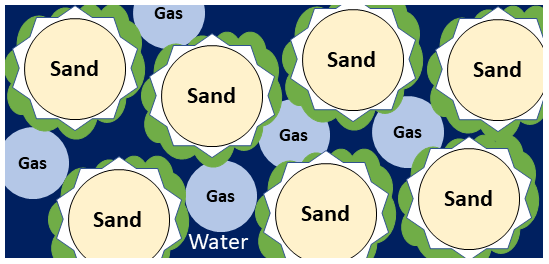
Figure 1Pore-scale illustration of MIDP in water (dark blue)-saturated sand (light yellow), detailing the gas (light blue), calcium carbonate (white), and biomass (green) production.
For environmental and economic reasons, we assume that local source water will be used to prepare the MIDP treatment solution (i.e., dissolve the substrates needed to induce denitrification) in practice. Therefore, in developing this technique we must consider how naturally occurring constituents in the source water may affect denitrification. For example, a competing electron acceptor (e.g., sulfate) may consume the electron donor (e.g., acetate), leading to incomplete denitrification and the formation of unwanted products (e.g., hydrogen sulfide). In addition, the biogeochemical reactions during MIDP result in changes to alkalinity and pH that may alter process kinetics and final MIDP products.
To quantify the impact of source-water composition and to investigate how complex biogeochemical interactions occur during field application, we developed a next-generation biogeochemical model of MIDP. This mathematical model expands upon previous modeling of MIDP, which did not consider the impact of source water on MIDP or the impact of MIDP on the aqueous subsurface environment (Pham, 2017; O'Donnell et al., 2019). Our next-generation MIDP model includes all essential biogeochemical processes based on the constituents commonly observed in the natural groundwater environments, substrates added to stimulate MIDP, and mechanisms that lead to desaturation and precipitation: e.g., N2-gas formation, acid–base speciation, and CaCO3 precipitation. Since MIDP often is deployed in coastal areas (due to the prevalence of liquefiable soil deposits in this environment), we include conditions typical for coastal seawater in our model.
The next-generation model builds upon previous MIDP models (Pham, 2017; O'Donnell et al., 2019) but broadens the range of processes considered by the model. Our next-generation model considers microbial growth and decay, alternative microbial metabolic processes, gas production, mineral-solids' production, alkalinity and pH, microbial inhibition, and desaturation and precipitation in both fresh water and coastal environments. A comparison of the components and processes considered by the two earlier MIDP models and our next-generation model is provided in Table S1 in the Supplement.
The next-generation model was constructed in MATLAB (Little and Moler, 2017), and the code and necessary files are publicly available online at https://doi.org/10.5281/zenodo.7410676. The modeling equations (e.g., microbial growth, CaCO3 precipitation, and biogenic gas evolution) were programmed within the original, publicly available van Turnhout toolbox, a general-form mechanistic batch model for environmental systems that considers species in the gas, liquid, and solid phases (van Turnhout et al., 2016). The van Turnhout toolbox is a program that includes a system of ordinary differential equations that model biogeochemical reactions. The van Turnhout toolbox is coupled with ORCHESTRA, an extensive database of established geochemical equilibria based on MINTEQ, to simulate chemical speciation during said modeling (Meeussen, 2003). The MIDP-specific biogeochemical model components (i.e., stoichiometry, type of inhibition and kinetics, potential chemical species) were specified in an input spreadsheet that the program accesses. The degree of saturation and percent (by weight) of mineral precipitation were calculated outside of the van Turnhout toolbox using model results, as discussed in Sect. 3.2 of this paper.
The toolbox's logic flow and calculation sequence are as follows (Meeussen, 2003; van Turnhout et al., 2016), using H2CO3, HCO, CO, H+, and OH− to illustrate the process for the carbonate system.
At t=0, the program loads the input concentrations' file, which includes the concentration of all total species (e.g., H2CO3 representing DIC, H+) and the stoichiometry for metabolic and kinetic reactions: e.g.,
Ordinary differential equations are used to determine compound consumption and production based on the reaction stoichiometry and kinetic equations (e.g., precipitation, biotransformation, and mass transfer) at each time step. For example, the graphic in Fig. 2 illustrates that, as C2H3O is consumed from microbial consumption, H2CO3 is produced.
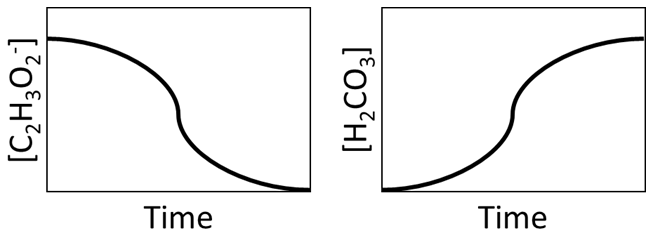
Figure 2Illustration of consumption of the consumption of C2H3O and production of H2CO3 during MIDP.
At each time step, the following set of linear equations is solved to determine the relative derived concentrations of [H2CO3], , , [H+], and [OH−] from H2CO3 produced in the previous steps. This is done in the ORCHESTRA biochemical module.
For the mass balance equations, the left side of the equation is the total dissolved inorganic carbon, H2CO3, from the stoichiometry described in steps 1 and 2. The right side shows the derived concentrations of species as a result of speciation, and these are indicated with square brackets.
Electroneutrality principles were considered such that all potentially produced charged species related to this balance were included.
Acid equilibrium for H2CO3:
Acid equilibrium for :
Water equilibrium:
pH is calculated based on the derived H+ concentration based on solving simultaneously.
While the carbonate system is used here as an example, this stepwise process is used for all acid–base species and considers the total system set of reactions and species to achieve equilibrium. The total system electroneutrality considered in the model for all considered species is as follows:
The compounds listed above are defined in the input spreadsheet as possible species. The model then uses ORCHESTRA to determine the concentration of each species based on the biogeochemical reactions and system equilibrium.
Denitrification is a multi-step process of nitrogen-species reduction. During each reduction step, energy and biomass are produced when paired with oxidation of an electron donor that produces a thermodynamically favorable reduction-oxidation (redox) reaction. The four steps of nitrogen reduction in denitrification conform to the following reduction half reactions, each consuming two or one electron equivalent (e−) (Rittmann and McCarty, 2020).
Nitrate reduction to nitrite:
Nitrite reduction to nitric oxide:
Nitric oxide reduction to nitrous oxide:
Nitrous oxide reduction to dinitrogen:
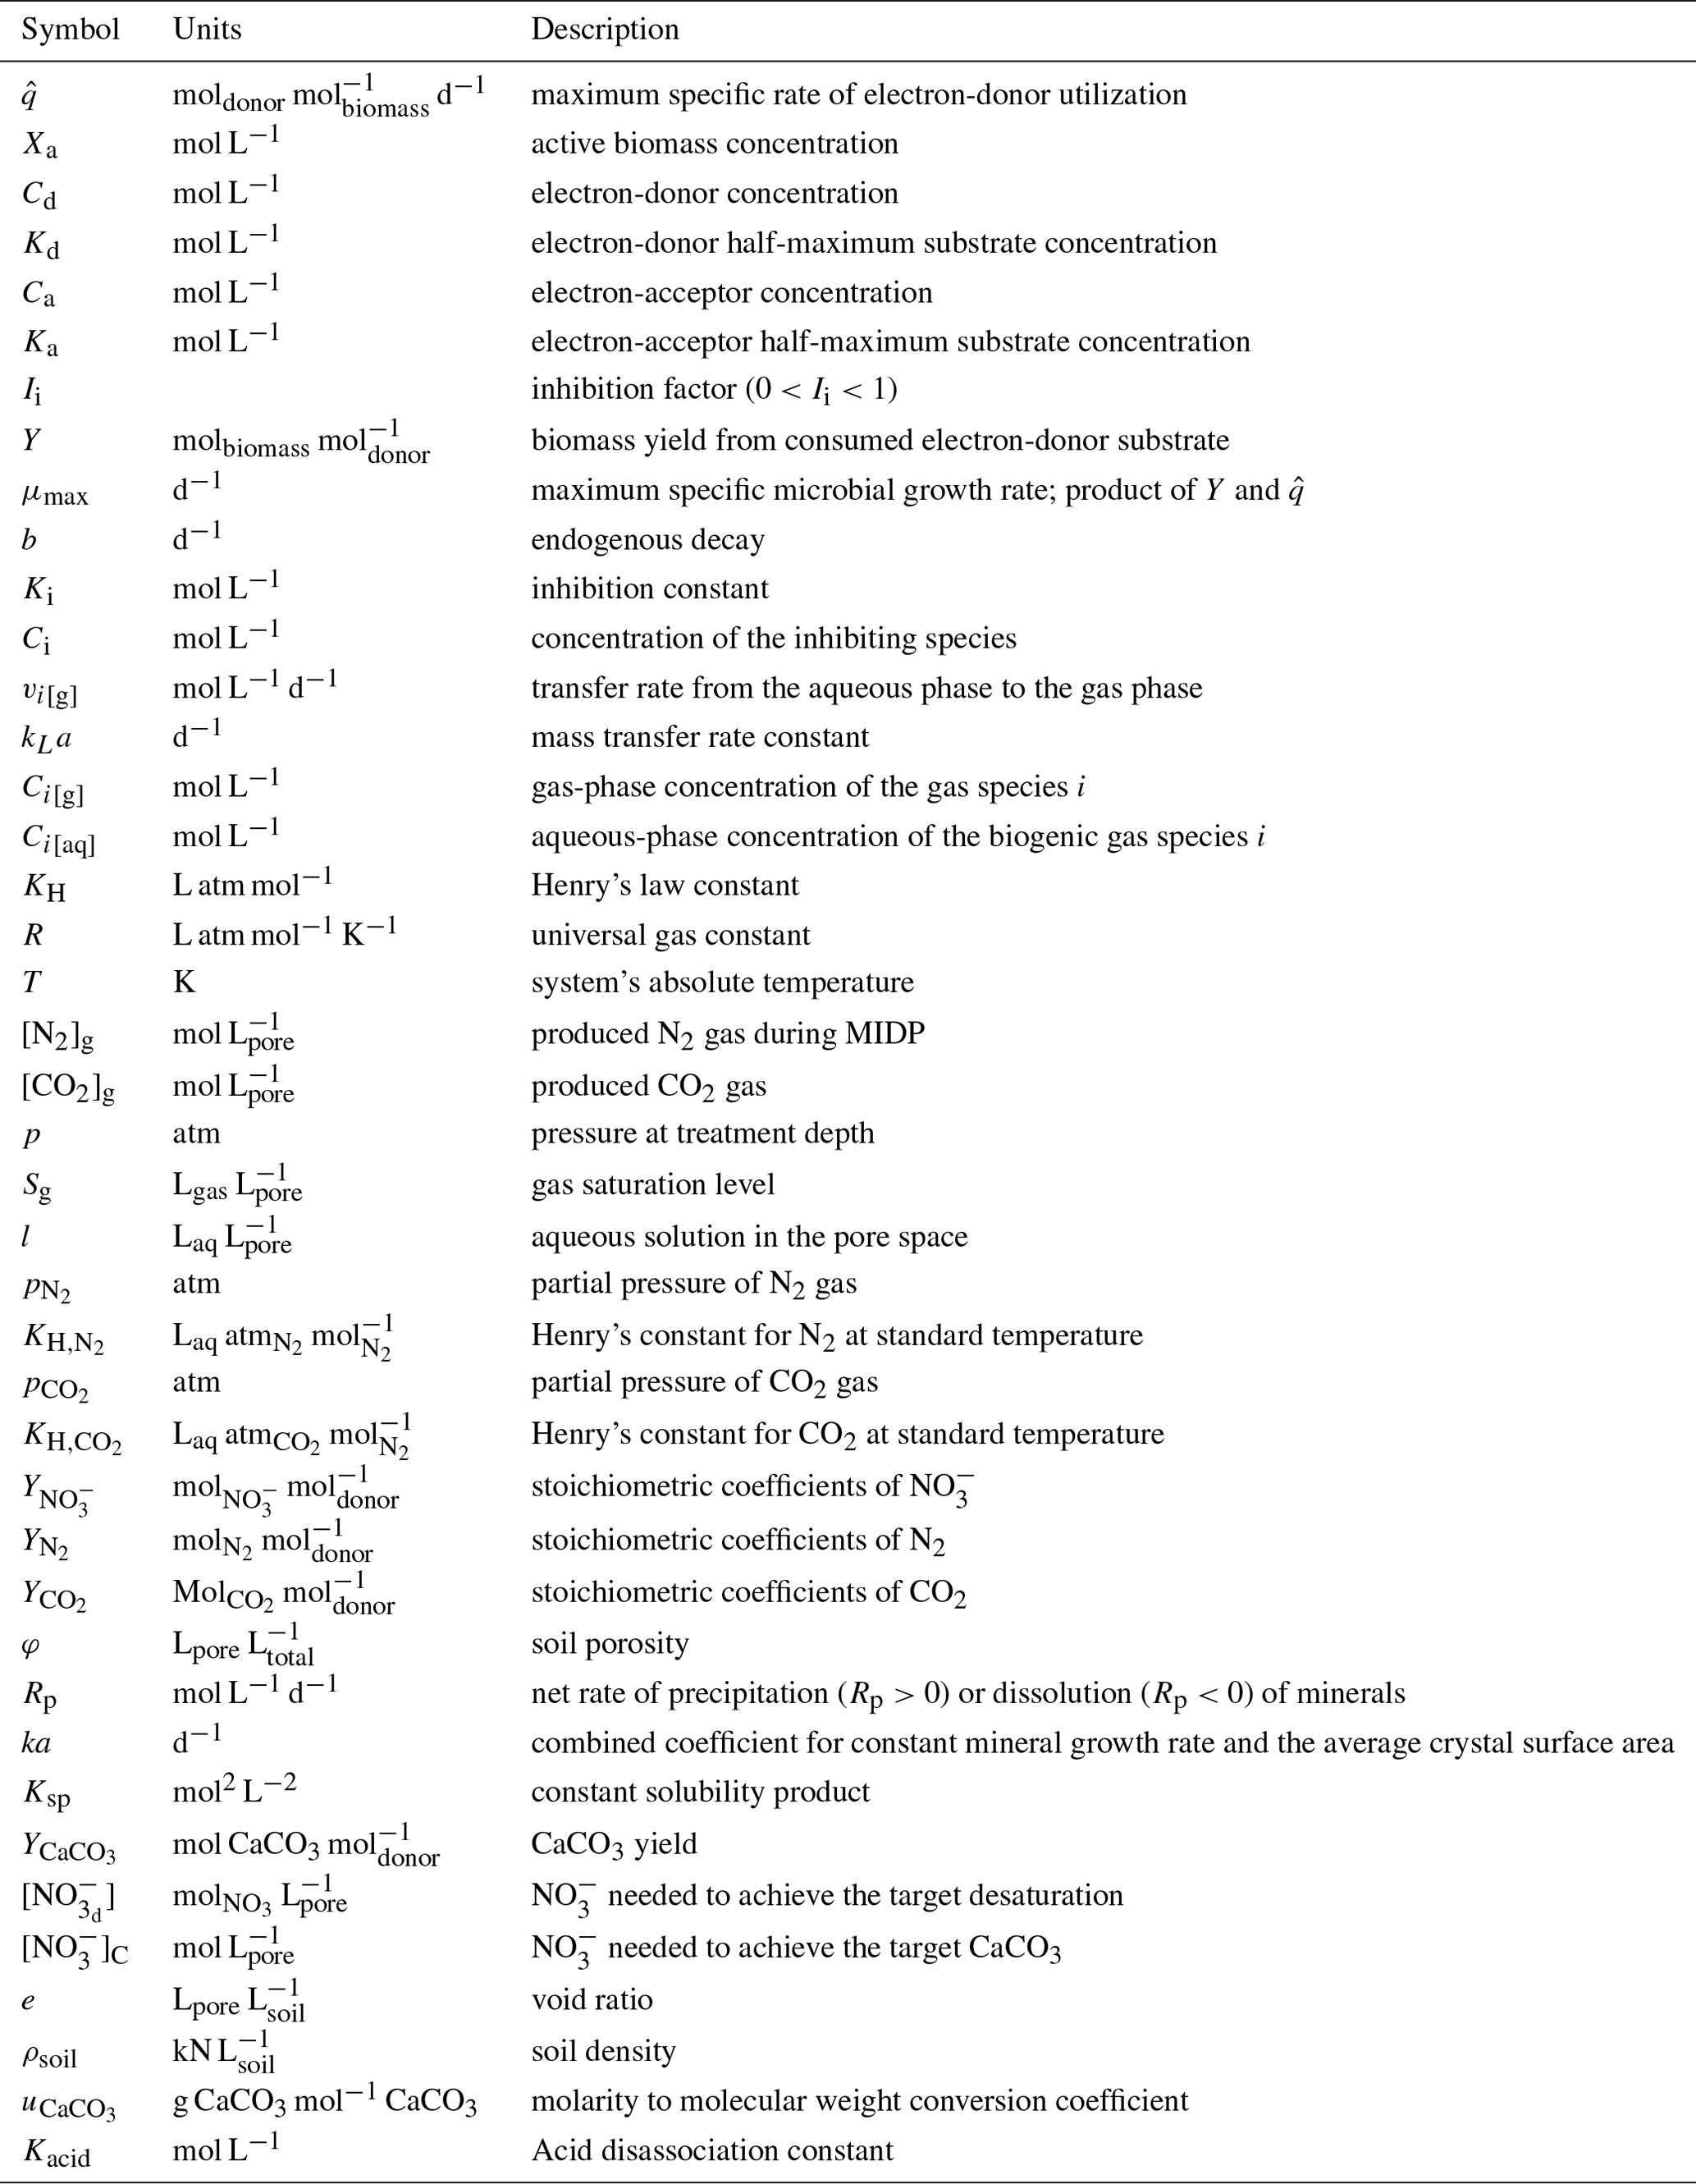
In the model developed herein, the four steps were simplified to two steps, nitrate to nitrite and nitrite to dinitrogen gas. The reductions of nitric oxide and nitrous oxide are assumed to occur completely, as they are thermodynamically favorable (found in the Supplement). In contrast, the accumulation of NO must be considered explicitly because it is a denitrification inhibition “bottleneck” and presents a risk to human health (Pham et al., 2018; Almeida et al., 1995). The variables for the equations used in the model described in the next several sections are detailed in Table 1.
Table 1Notation, units, and description for variables used in the biogeochemical model.
3.1 Microbial metabolism, growth, and decay
The processes within the model follow Monod kinetics, represented as multiplicative dual-substrate limitation (O'Donnell et al., 2019; Bae and Rittmann, 1996).
Equation (1) considers the electron-donor substrate (Cd) and three electron-acceptor substrates (Ca): NO and NO for denitrifying bacteria and SO for sulfate-reducing bacteria. For preliminary analysis, we assumed an initial denitrifier biomass concentration of 0.5 mmol L−1 and sulfate-reducing biomass concentration of 0.25 mmol L−1. The values of the constants (, Kd, and Ka) are in the Supplement, along with the derivations of said parameters based on Rittmann and McCarty (2020). The Supplement also includes preliminary model results, assuming a reduced initial denitrifier biomass concentration of 0.05 mmol L−1 and sulfate-reducing biomass concentration of 0.025 mmol L−1. The comparison of the findings detailed in Sect. 4, the results section of this paper, and those found in the Supplement illustrate the influence of the initial biomass concentration on the model results. The main impact of lowering the initial biomass concentration was a delayed start-up time for the microbiological processes, though the trends remained the same for all modeled scenarios. These derivations were used to determine reaction stoichiometry, true yield (Y), and μmax (maximum specific growth rate) for all electron-donor and electron-acceptor pairs and the nitrogen source. The values of the kinetic and stoichiometric parameters are detailed in Table 2. The inhibition factor Ii is described in a later section of this paper.
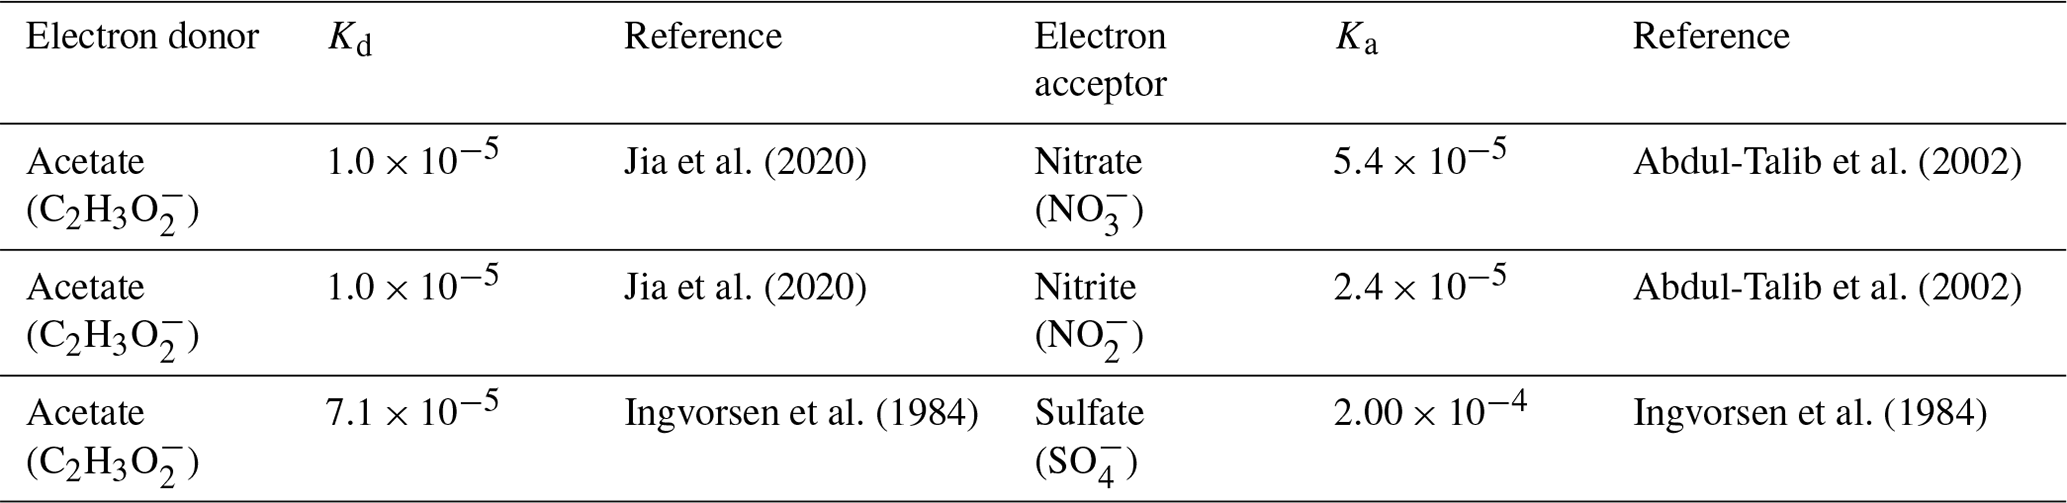
Values of half-maximum-rate concentrations (Kd and Ka) in the literature show variability for each electron-donor and electron-acceptor pair due to the wide range of environments of the microorganisms (e.g., sediment, estuarine water, wastewater) and the high degree of diversity of microorganisms able to carry out these reactions (Abdul-Talib et al., 2002; Papaspyrou et al., 2014; Vavilin and Rytov, 2015). Table 3 details the constants we used as representative values for each Kd and Ka (for Eq. 1) based on relevant electron-donor and electron-acceptor pairs and sources of those values. While these values are not specific to a coastal seawater environment, they have been experimentally validated.
Table 2Reaction stoichiometry, yield (Y), and maximum specific growth rates (μmax) expected during MIDP, considering acetate to be the electron donor and natural electron acceptors. Units for all parameters are in Table 1.
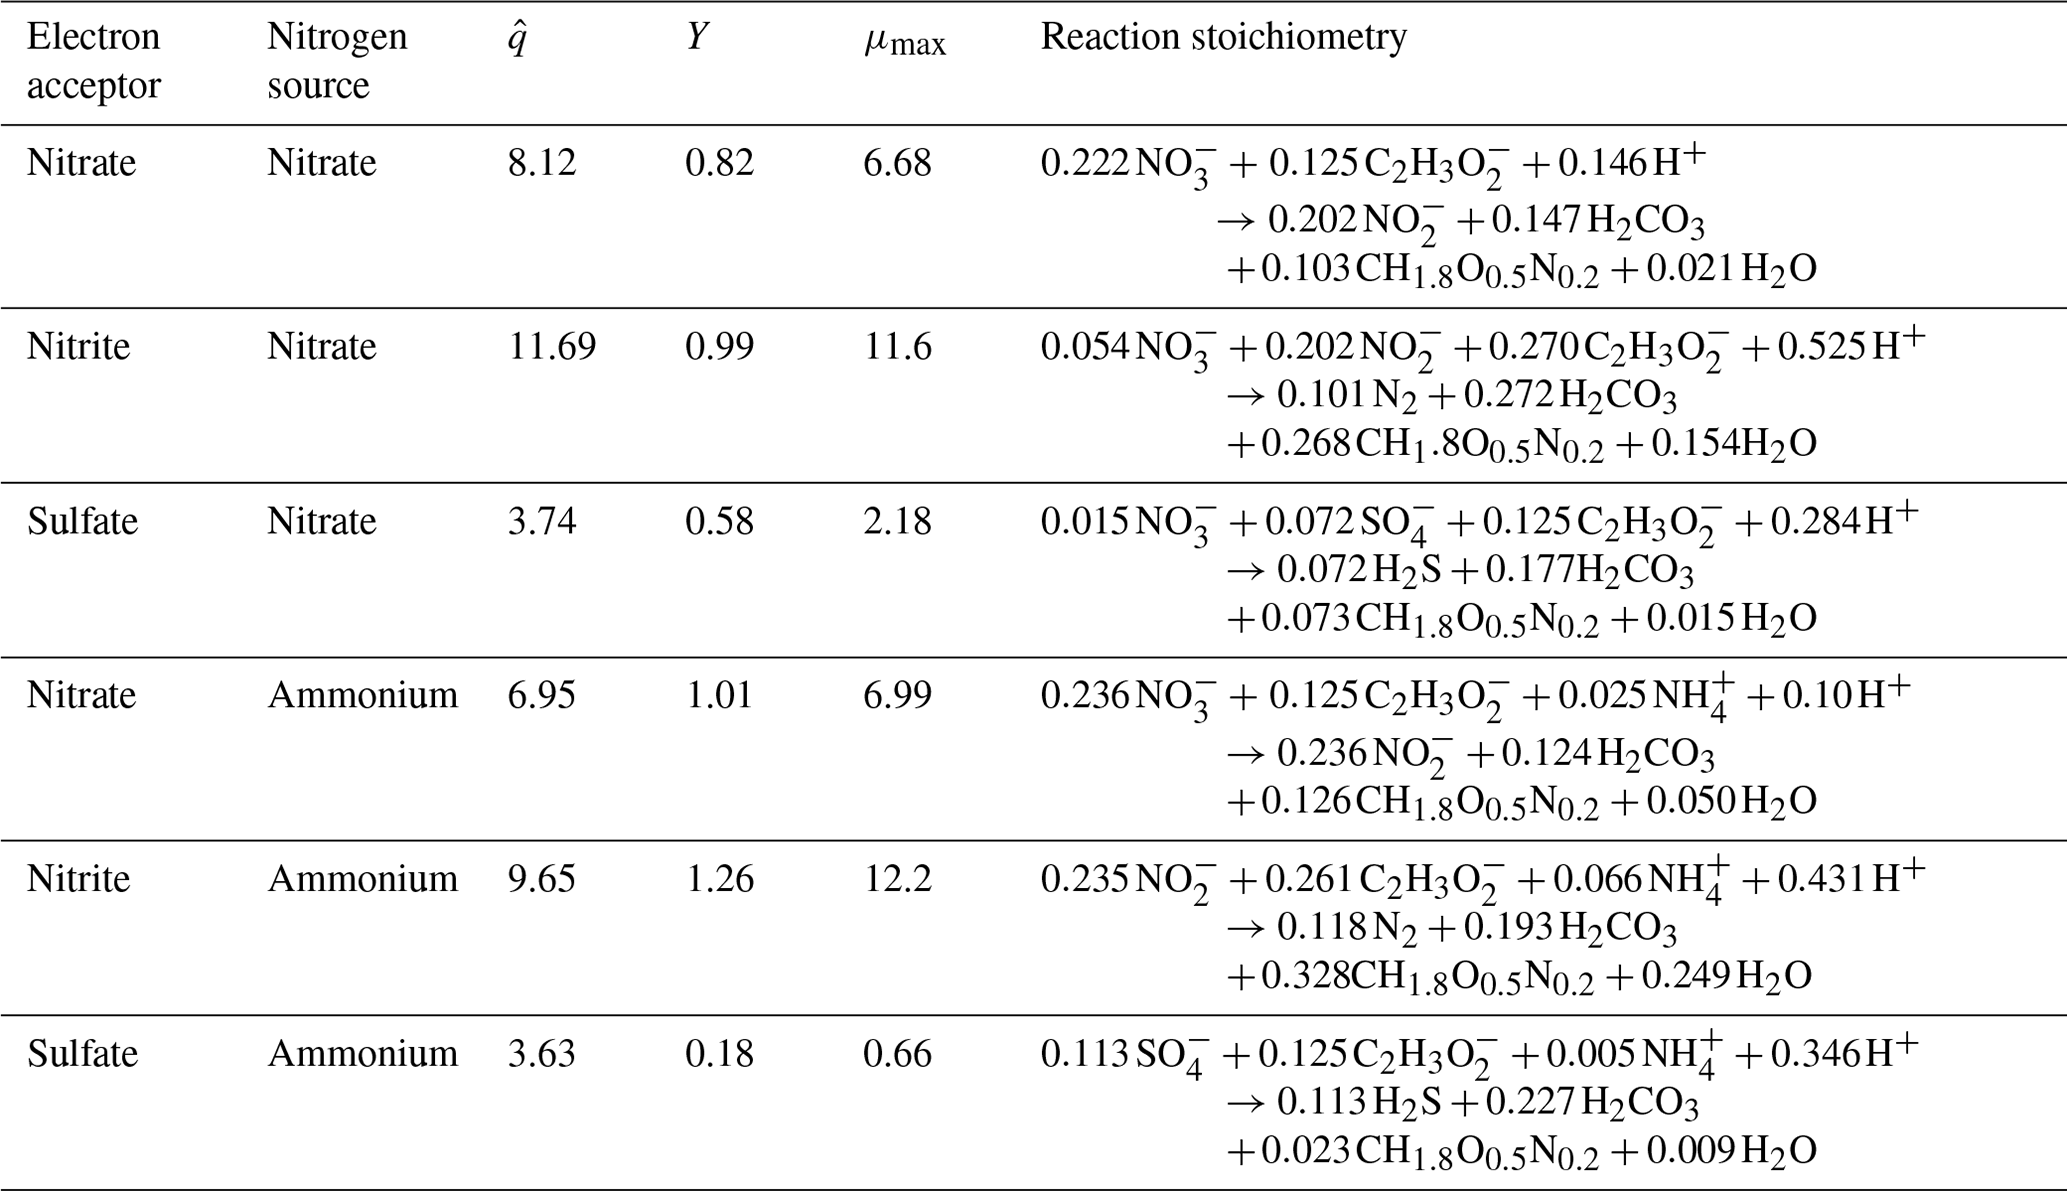
Table 3Half-maximum-rate concentrations, Kd and Ka, used for each electron-donor and electron-acceptor pair.
Microbial growth within the model is represented via reaction kinetics and stoichiometry expressed in Eq. (2):
Biomass yields (Y) are listed in Table 2. For sulfate-reducing bacteria, b was set to 0.03 d−1, whereas it was set to 0.05 d−1 for denitrifiers (Rittmann and McCarty, 2020). As a result of decay, NH is released and can serve as a nitrogen source for denitrification. Since NH is thermodynamically favorable over NO as a nitrogen source, it is used first before NO during denitrification using a user-defined switch. We used the inhibition function described in Sect. 3.2 as the switch to interrupt biomass from using NO as the nitrogen source in the presence of NH. Decay involves endogenous respiration, and we assumed that 80 % of decayed biomass is available as an acetate for metabolism, while 20 % becomes inert biomass (Rittmann and McCarty, 2020). The stoichiometry for decay is
3.2 Inhibition
The van Turnhout toolbox has the capability to model different inhibition mechanisms, but we only used non-competitive inhibition during denitrification because the enzymes that perform nitrate, nitrite, and sulfate reduction are different and not self-inhibitory (Glass and Silverstein, 1998). Denitrification inhibition, which slows nitrate and nitrite reduction rates (Glass et al., 1997), was included for the reduction of nitrate to nitrite and nitrite to N2 gas. Ii is a general term for inhibition of either step, with i indicating which reaction. The form of Ii, shown in Eq. (3) is for non-competitive inhibition, and the inhibition coefficients for each inhibitor are found in Table 4:
Table 4Non-competitive inhibition coefficients (Ki).
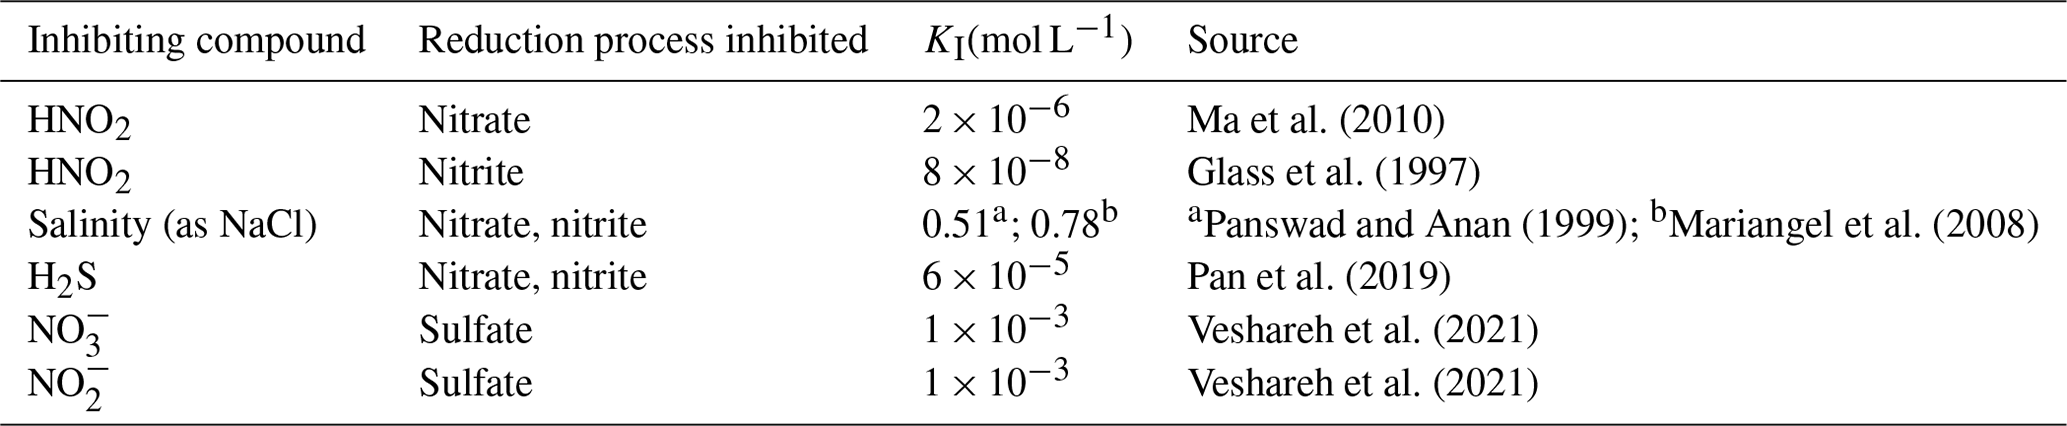
a Unacclimated environments were DI and drinking water. b Acclimated environments were groundwater and seawater.
Although several inhibitors could affect MIDP, HNO2 is the most important inhibitor of the MIDP process (Lilja and Johnson, 2016). Significant inhibition (95 % rate reduction) of overall denitrification has been reported at 0.04 mg HNO2 L−1, which primarily impacted the intermediate NO reduction step (Glass et al., 1997; Abeling and Seyfried, 1992), and a 60 % decrease in NO reduction at 0.08 mg HNO2 L−1 was also reported (Ma et al., 2010). Within the model, HNO2 inhibits NO and NO reduction using different inhibition coefficients (Table 4). The inhibition by HNO2 is driven by pH speciation because NO is dominant at a pH of 3.4 and higher and HNO2 is negligible for pH ≥ 7.6. However, only a small concentration of HNO2 can have a significant impact on denitrification, which underscores the importance of pH and the accumulation of the intermediate NO.
Inhibition between nitrate and nitrite reductions has been identified, with the presence of nitrate having a larger effect on nitrite reduction than nitrite on nitrate reduction (Lilja and Johnson, 2016; Glass et al., 1997; Almeida et al., 1995; Soto et al., 2007). Nitrite accumulation increases in the presence of nitrate until nitrate is depleted, such that nitrite reduction becomes the dominant process (Glass and Silverstein, 1998). When only nitrite remains, the rate of nitrite reduction increases. However, others have described that, as long as the electrons are adequately provided by the electron donor, competitive inhibition between nitrate and nitrite reductions is not significant (Soto et al., 2007; Ma et al., 2010; van den Berg et al., 2017). Therefore, the model does not include competitive inhibition, although it naturally includes competition for the electron donor between nitrate and nitrite reductions through thermodynamic favorability of nitrate reduction over nitrite reduction.
The model applies different non-competitive inhibition constants for salinity (as NaCl) for nitrate and nitrite reduction because nitrite reduction is more sensitive to salinity than nitrate. Because the magnitude of inhibition depends on experimental conditions and adaptation of the microorganisms, the value of Ki may differ for local conditions (Krishna Rao and Gnanam, 1990).
Hydrogen sulfide (H2S) also can be inhibitory to denitrification (Pan et al., 2019). Nitrate, nitrite, and N2O reductions have been inhibited by H2S, though the extent and sensitivity of reduction in the presence of H2S was experiment-dependent (Senga et al., 2006; Pan et al., 2013; Tugtas and Pavlostathis, 2007; Liang et al., 2020; Cardoso et al., 2006). Within the model, one aqueous-phase H2S-inhibition constant was used for both NO and NO reduction steps.
A pH < 6 can significantly slow denitrification (Glass and Silverstein, 1998) by inhibiting enzyme activity (Šimek and Cooper, 2002) and microbial growth (Estuardo et al., 2008). When the pH goes higher than 8, enzyme activity also can be impeded, leading to reduced denitrification rates or incomplete denitrification. Incidents of a high pH often are temporary, as CaCO3 precipitation in MIDP buffers the pH (Salek et al., 2015). The benefit of including a pH-inhibition function when predicting denitrification has been demonstrated, but the values of their governing parameters are environment-specific and require fitting (Estuardo et al., 2008). Within the model, we only considered the indirect net effect of pH through HNO2 inhibition, which does not require environment-specific parameters because the concentration of HNO2 is automatically calculated within the model structure.
3.3 Biogenic gas production
O'Donnell et al. (2019) considered the production of N2 and CO2 during denitrification but did not consider the varying subsurface stresses that would influence phase transfer. The relative concentrations of the produced biogenic gas can affect the distribution of gas at depth, since the gases have different solubilities, as well as different stoichiometries for electron-donor consumption.
Our next-generation MIDP model includes mass-transfer kinetics for transfers of N2, CO2, and H2S from the aqueous phase to the gas phase (or from the gas phase). We considered gas-phase transfer kinetics because assuming instantaneous gas-phase transfer clearly would be an oversimplification, based on the review on mass transfer of biologically driven gas production completed by Kraakman et al. (2011). N2, CO2, and H2S concentrations were modeled in the aqueous and gas phases. The rate of transfer of a gaseous compound from the aqueous phase to (or from) the gas phase, vi[g], depends on the gas's degree of super-saturation and a mass-transfer-rate coefficient (Salek et al., 2015):
We assigned kLa values for N2, CO2, and H2S of 1 d−1 (Shin et al., 2003), though the values can vary widely based on porous-medium conditions and temperature. We did not include pore-scale kinetics. The aqueous concentrations of CO2 and H2S depend on the pH, as described below.
The biogenic gas volume needed to achieve a target level of desaturation (Sg) by N2 ([N2]g) and CO2 ([CO2]g) was determined by
in which p was assumed to be equal to the sum of the hydraulic pressure at the treatment depth (7.6 m in an upcoming example) and the atmospheric pressure. Gas-phase H2S was not included in the desaturation calculations because its solubility is much higher than N2 and CO2.
Equation (6) describes the amount of input NO required for desaturation by N2 and CO2 ([NO], mol L) at the deepest target treatment depth, which is the lowest depth of the treated zone. The depth increases the pressure ( and ) and the needed amount of gas production to exceed the solubility threshold ( and ) and enter the gas phase, according to Henry's law. The equation considers the amount of gas needed to overcome the solubility threshold to achieve the target level of desaturation (Hall et al., 2018; Pham, 2017):
was set to 1600 and to 29 (L atm mol−1). We determine the amount of nitrate needed to achieve target desaturation levels at the lowest depth because greater depth requires a higher concentration of gas to achieve target desaturation levels, as the pressures are at their respective maxima.
Equation (7) was used to determine the biogenic gas volume (Vg, Lgas L),
3.4 Solids' precipitation and dissolution
Calcium carbonate precipitation occurs when dissolved inorganic carbon (DIC), produced from microbial substrate conversion of the electron donor, exceeds the solubility of CaCO3 for the concentration of Ca2+ present. The stoichiometry for CaCO3 precipitation is
At the beginning of each run, the concentration of species available for precipitation is calculated as their dissolved form as discussed in Sect. 2, and then solids' precipitation is determined. The van Turnhout toolbox considers precipitation based on equilibrium calculations from the ORCHESTRA module (Meeussen, 2003). This assumption is valid when the rates of precipitation and dissolution of minerals are much faster than the phase transfer between the aqueous and solid phases (Salek et al., 2015). Previous MIDP modeling did not consider precipitation kinetics but assumed instantaneous equilibrium (Pham, 2017; O'Donnell et al., 2019). Instantaneous equilibrium may be an over-simplification for environmental conditions (Singurindy et al., 2004) in which the mechanisms of crystal nucleation, crystal growth, and mass transfer of reactants to the contact point of crystal growth are important (Rittmann et al., 2002). Therefore, we included precipitation and dissolution kinetics in the next-generation model.
The model considers first-order precipitation and dissolution kinetics with respect to the Ca2+ and CO concentrations (Rittmann et al., 2002; Chou et al., 1989):
Ksp was set to mol2 L−2 at 25 ∘C for CaCO3. ka is a combined kinetic coefficient because it is difficult to separate mass transfer kinetics, crystal growth rate, and solid surface area (Rittmann et al., 2002; Spanos and Koutsoukos, 1998; Rittmann et al., 2003). ka can have a large range depending on the environment and the ease of establishing precipitation nucleation points. We assumed ka was 100 d−1, though this value should be used as a fitting parameter subject to experimental validation. Precipitation was implemented using the van Turnhout toolbox's method for biochemical reactions, ka was specified as a reaction rate, and Ksp was among the governing input parameters.
Equation (9) was used to determine the amount of substrate needed to achieve a target precipitation level, which is determined by the ratio between mass of precipitated CaCO3 and mass of the soil solids ([CaCO3], kg CaCO3 kg soil−1).
The stoichiometric coefficients considered the total amount of input NO and produced H2CO3 for the total assumed two-step denitrification process. The DIC available for precipitation to provide is estimated based on pH-driven speciation at each time step.
While we only considered calcium carbonate precipitation, the model has the flexibility to model precipitation of other minerals. The user would need to add in separate equations to model precipitation kinetics based on the reactants, desired products, and the ka and Ksp values appropriate for the desired precipitation reaction and product.
3.5 Determining pH
Because pH governs the concentration of important aqueous species based on acid–base speciation, the pH influences many of the geochemical reactions involved in MIDP. The pH was determined using the geochemical equilibrium software ORCHESTRA, which is part of the van Turnhout toolbox. ORCHESTRA uses a mass balance on all species within the system and the products of rate-dependent processes as a function of time (i.e., kinetic, biogeochemical, and phase transfer processes). At each time step, the program performs a mass balance on all complexed species and their fate (e.g., transformed through microbial processes, precipitation, gas-phase transfer) (van Turnhout et al., 2016; Meeussen, 2003).
To demonstrate the capabilities of the model, we illustrate MIDP behavior when targeting desaturation for liquefaction mitigation in a coastal geochemical environment. In this case study, we demonstrate the impact of precipitation on biochemical reactions and the resulting multi-phase products and by-products resulting from MIDP and other environmental biogeochemical processes (e.g., sulfate reduction). However, we only consider desaturation as a target treatment mechanism and do not model an MIDP treatment recipe optimized for precipitation as a liquefaction-mitigation mechanism.
Table 5 details the chemical characteristics used to simulate coastal groundwater conditions, which were assumed to have the same characteristic of seawater due to intrusion (hereafter, referred to as “seawater”). The treatment substrate was added to the baseline level of these components. Table 5 does not reflect the varying concentrations of calcium acetate and calcium nitrate used in the treatment recipes, which are described later. We based the target treatment zone's soil properties on a case study of microbial desaturation via denitrification in Portland, Oregon, presented by Moug et al. (2022). The deepest target treatment depth was 7.6 m. We assumed typical values of total unit weight, dry density, and porosity for uniform clean sand for the soil (Christopher et al., 2006): total unit weight of 19.5 kN m−3 (dry unit weight of 15.6 kN m−3; bulk density of 1950 kg m−3) and porosity of 0.39.
Table 5Chemical characteristics assumed for a coastal seawater environment.
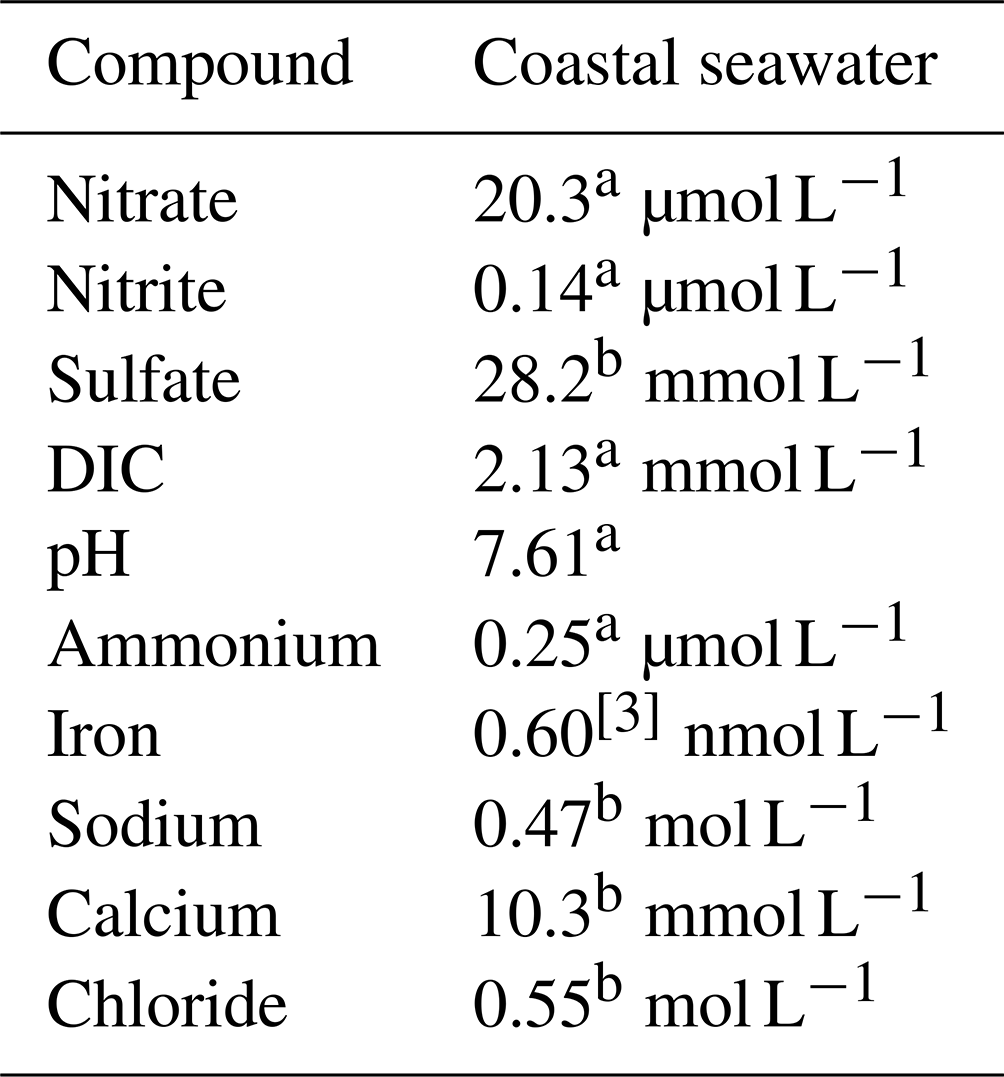
a Average of measured values (Alin et al., 2017). b Reference composition of “standard seawater” from and calculated for pH = 7.61 for acid–base species (Millero et al., 2008; European Commission, Directorate General for Research, 2011). c Bruland et al. (2001).
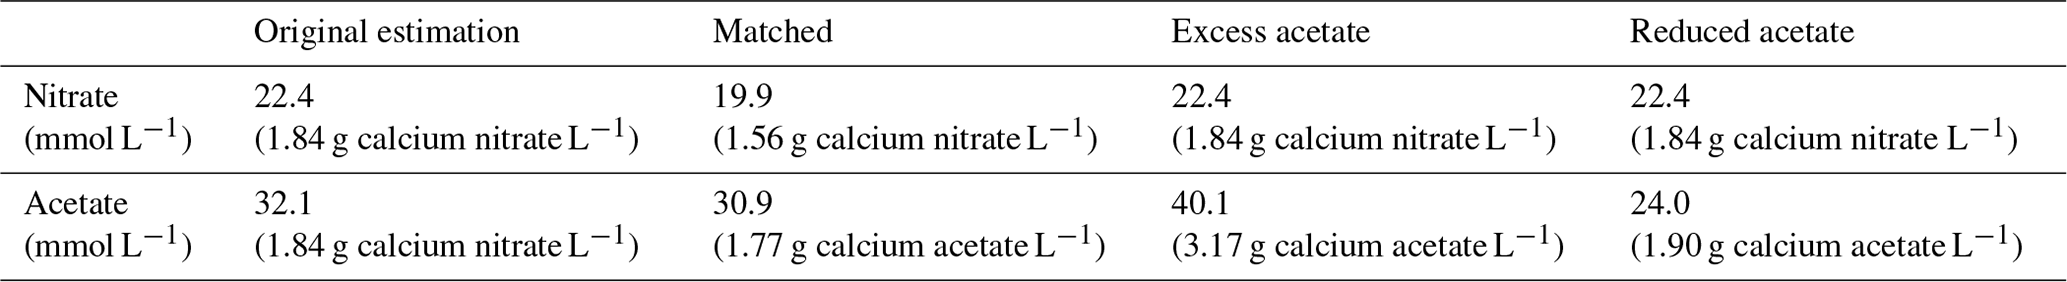
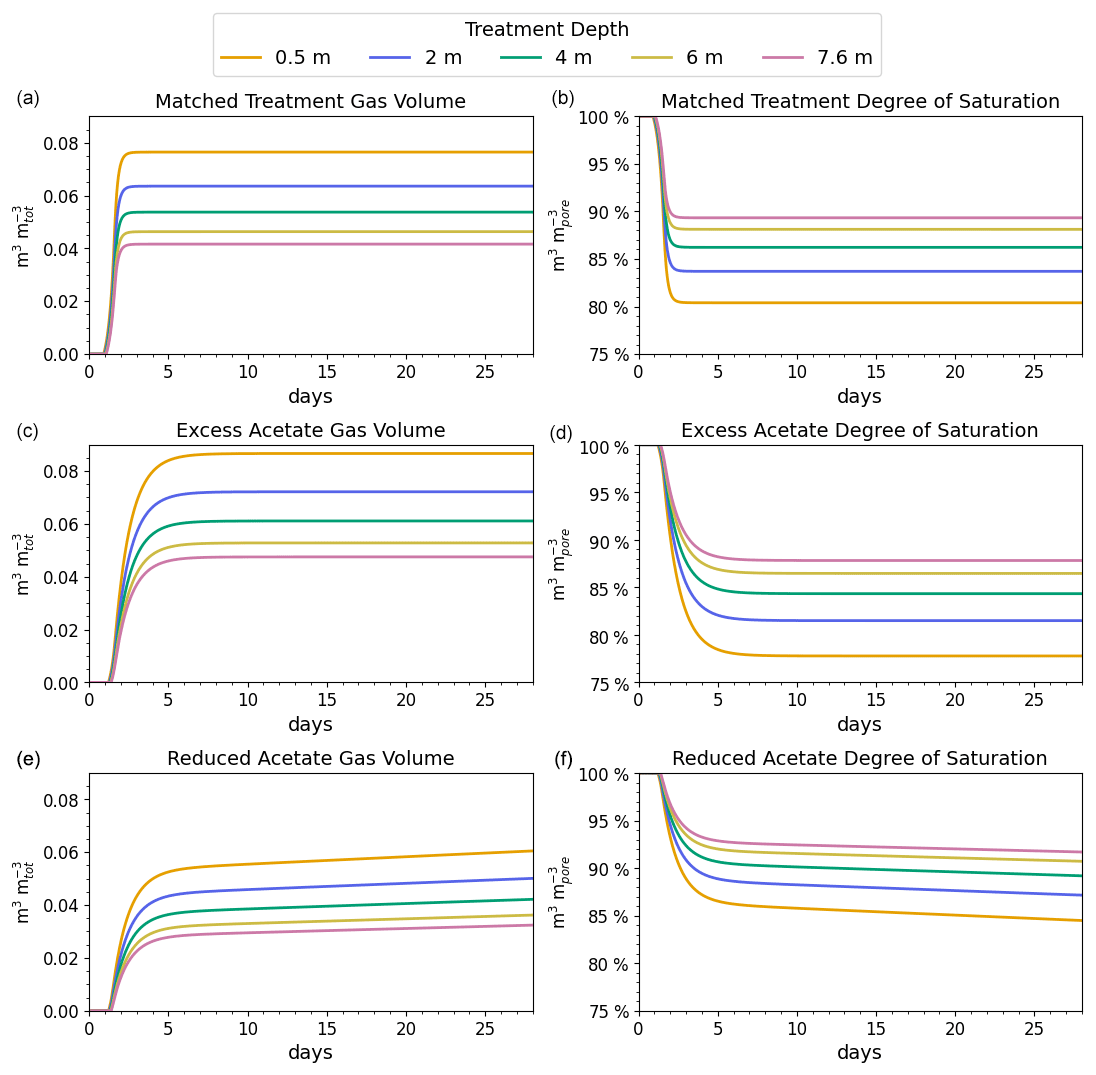
Figure 3Gas volumes normalized to the total soil volume (a, c, e) and degree of saturation by depth (b, d, f) for the simulated coastal seawater conditions. The desaturation target was 10 % or a saturation ratio of 90 %.
The reported desaturation levels required to increase the cyclic shear resistance for liquefaction mitigation range between 2 % and 10 % (He and Chu, 2014; O'Donnell et al., 2017a). We chose 10 %, which is at the high end of the mitigation range but well below the desaturation level at which gas starts to migrate upward or spread laterally, reported to occur at 20 % for poorly graded (i.e., uniform) fine sands (Pham, 2017).
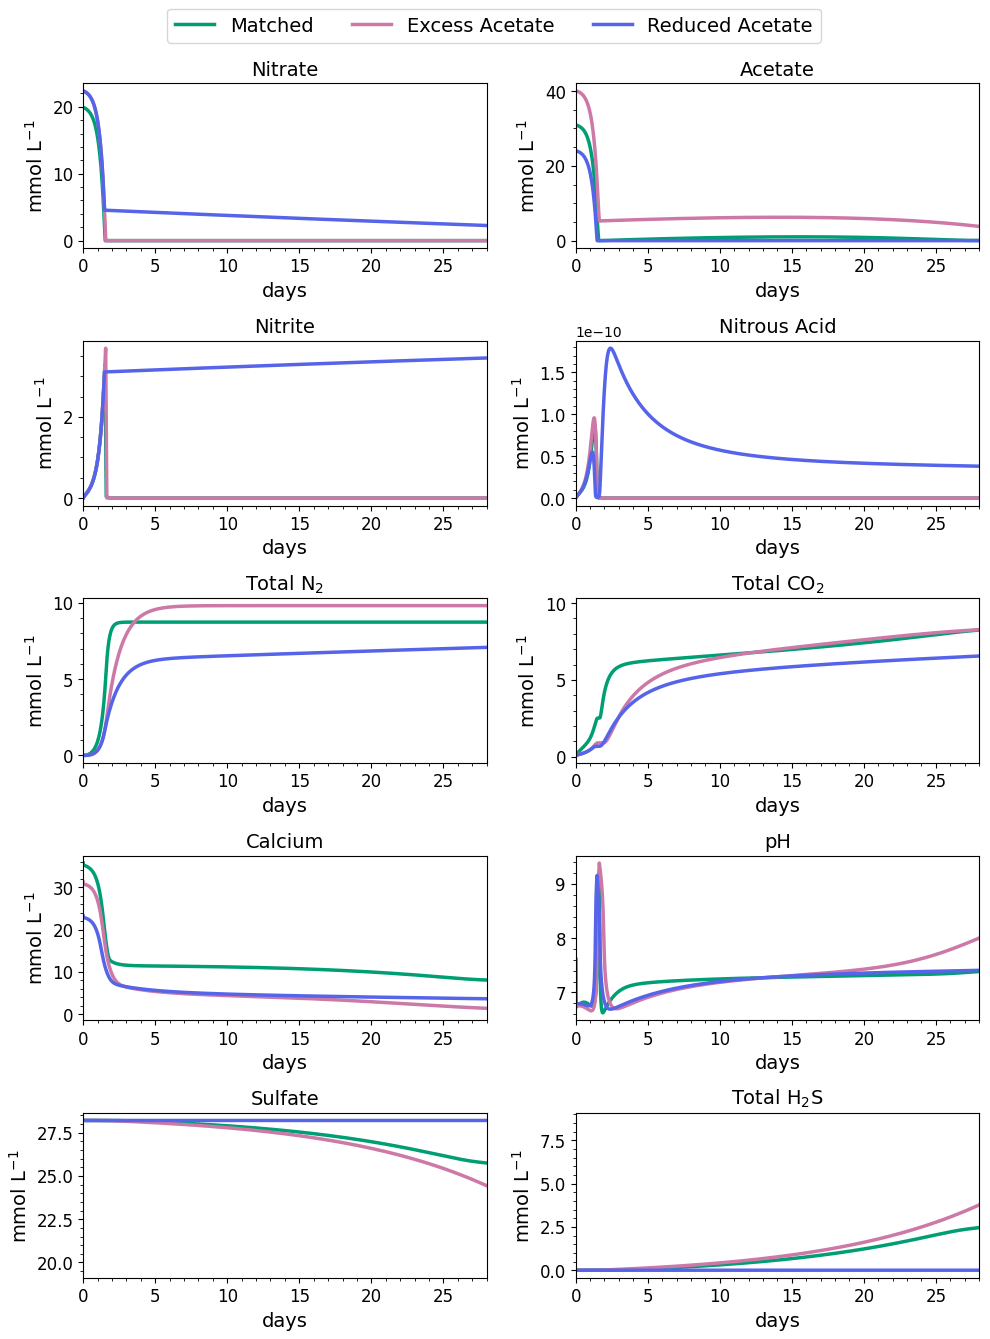
Figure 4Water-quality results for 28 d of MIDP in coastal seawater conditions targeting a desaturation level of 10 % in three different treatment recipes: empirically matched, 25 % excess acetate, and 25 % reduced acetate.
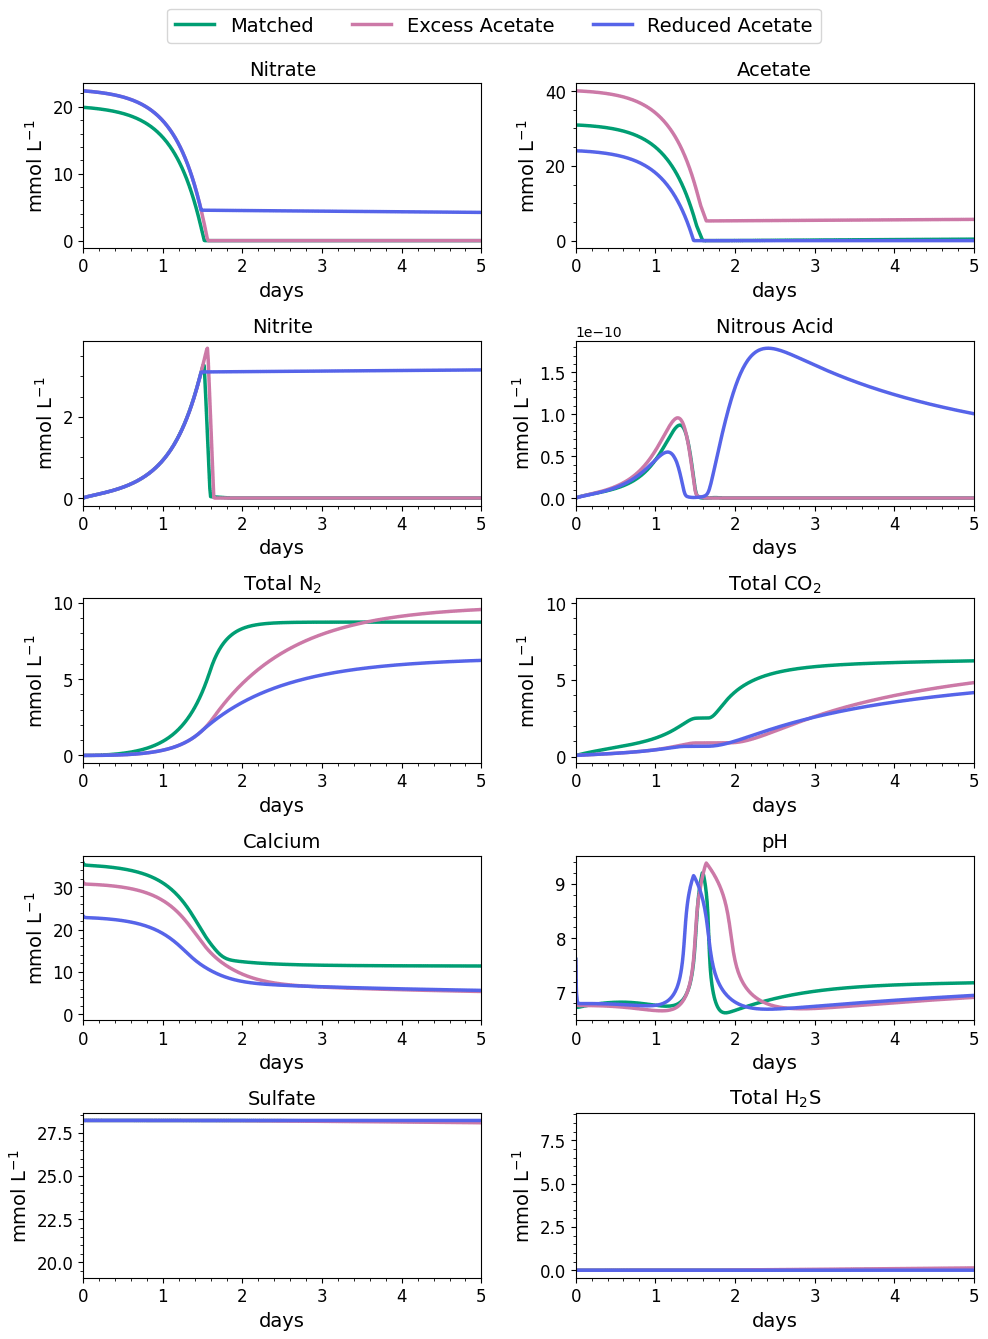
Figure 5Water-quality results for the first 3 d of MIDP in coastal seawater conditions targeting a desaturation level of 10 % in three different treatment recipes: empirically matched, 25 % excess acetate, and 25 % reduced acetate.
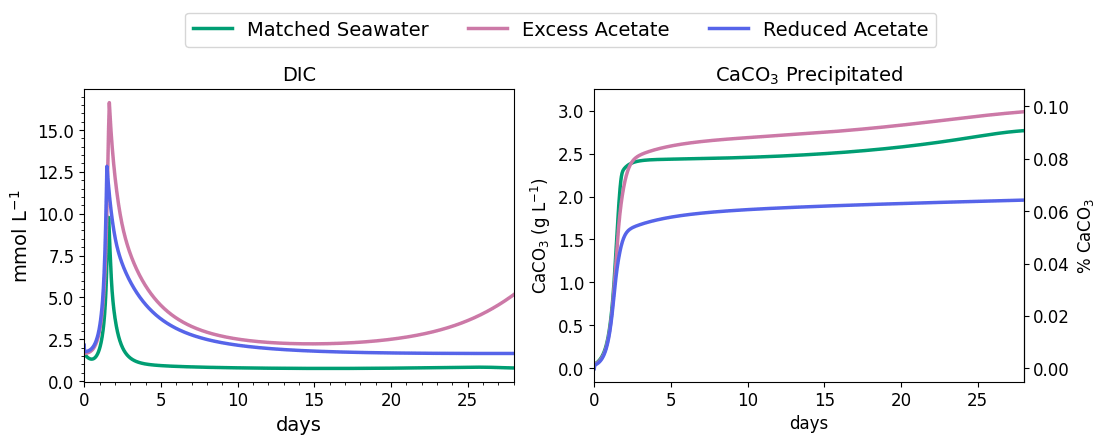
Figure 6DIC concentration and CaCO3 precipitated during the first 3 d of MIDP in coastal seawater conditions targeting a desaturation level of 10 %.
Following Eq. (5), 7.10 mmol L−1 of total N2 gas is required to meet a minimum target desaturation level of 10 % throughout the entire treatment zone (assuming only desaturation via N2 gas). To meet the target desaturation, we estimated the treatment recipe to be 22.4 mmol L−1 of nitrate (1.84 g calcium nitrate L−1) and 32.1 mmol L−1 of acetate (2.54 g calcium acetate L−1) using Eq. (6). However, based on background levels of nitrate and nitrite and the use of released ammonium as a nitrogen source, these levels were adjusted to establish the treatment recipe detailed in Table 6. The adjusted values were set to result in complete denitrification (i.e., no residual nitrate or nitrite that relies on bacterial decay as the electron donor) and to not exceed 0.1 mmol L−1 of acetate after complete denitrification. We compared the impact of varying the input levels of acetate (as calcium acetate) on the MIDP treatment to the matched treatment recipe. We tested the impact of addition of an extra 25 % of acetate over our original estimations, referred to as the “excess acetate” treatment recipe, and 25 % less acetate from our original estimation, referred to as the “reduced acetate” treatment recipe. For the excess- and reduced-acetate comparisons, we did not adjust the input levels of nitrate (as calcium nitrate) from our original estimations of 22.4 mmol L−1 (1.84 g calcium nitrate L−1). We assumed that each treatment recipe was added in one application (i.e., not in a continuous flow-through manner).
The results of the matched treatment recipe on the subsurface gas volume and saturation profile are shown in the top two panels of Fig. 3. For the coastal seawater conditions, the target desaturation level of 10 % at 7.6 m (or a degree of saturation of 90 %) was achieved by N2 generation in approximately 2.0 d. The amount of CO2 produced did not reach its saturation threshold, and CO2 did not contribute to desaturation at any of the modeled depths. The difference in volume of gas at the different levels is due to the increase in hydrostatic pressure with depth.
The middle panels of Fig. 3 indicate that adding excess acetate increased the degree of saturation at 7.6 m, which is shown by less than 90 % saturation at 7.6 m. In contrast, the bottom two panels show that adding less acetate slowed N2 generation so that 90 % saturation was not reached at 7.6 m in 60 d.
The impacts of the different MIDP treatment recipes on water quality are shown in Fig. 4, and the initial 5 d of treatment for each modeled scenario is highlighted in Fig. 5. With the matched-treatment recipe, almost all nitrate and nitrite were consumed by 1.6 d, and less than 10−4 mol L−1 of acetate remained (Fig. 5). Nitrite accumulation was transient and modest (3.3 mM at its peak); thus, complete denitrification was achieved with this treatment recipe for coastal seawater conditions (Fig. 5). After 1.6 d, sulfate reduction began and continued to occur, driven by microbial endogenous respiration, at a small rate that resulted in the production of more total CO2 and total H2S than the matched treatment over time (Fig. 4).
With the excess-acetate recipe, all the nitrate was completely reduced, although small, transient accumulations of nitrite and nitrous acid occurred (Fig. 5). As expected, not all the acetate was consumed with the excess-acetate recipe, and the remaining acetate led to sulfate reduction and the highest amount of produced H2S of the three modeled scenarios (Fig. 4). Additional N2 was produced because of the higher amounts of nitrate in the treatment recipe, leading to a level of desaturation at 7.6 m that exceeded the target 10 % value.
For the reduced-acetate test, approximately 20 % of the input nitrate remained after all the acetate was consumed, and this residual nitrate was slowly utilized beyond 1.5 d through biomass endogenous decay (Fig. 4). The peak amount of accumulated nitrite was not as high as the other conditions because of the overall limited nitrate reduction, but some nitrite accumulation remained throughout the modeled 28 d due to the lack of acetate. The dip and quick increase in nitrous acid around 1.5 to 1.7 d (Fig. 5) were due to the shift in electron donor from input acetate to bacterial decay. Not enough electron donor was available to reduce all of the input nitrate and the accumulated nitrite after 28 d (Fig. 4), even though bacterial decay caused added denitrification. N2 produced in the reduced-acetate condition did not meet the 10 % desaturation threshold at 7.6 m at the end of the 28 d modeled period.
Nitrite reduction produced most of the base, which is demonstrated by the spike in pH after 1 and 1.4 d in all scenarios (Fig. 5), when the rate of nitrite reduction was at its maximum in each treatment. In the matched case, the pH returned to being circumneutral after 1.8 d due to the precipitation of CaCO3, which consumes base. This trend is reinforced by rapid Ca2+ consumption in the early treatment time period (Fig. 5), along with production of CaCO3 in the first ∼ 2 d, shown in the right panel of Fig. 6. DIC production in the excess-acetate treatment lagged the matched recipe and was slightly quicker in the reduced-acetate case, which also is seen with the pH trends in Figs. 4 and 5. However, the overall consumption of DIC and subsequent precipitation were slower in the excess- and reduced-acetate treatments, which correspond to the longer time for the pH to reach approximately neutral levels. The additional CaCO3 precipitated with the excess acetate resulted from the excess of input calcium, since acetate was added as calcium acetate.
Microbial decay coupled to sulfate reduction also produced more DIC (left panel of Fig. 6), promoting additional CaCO3 precipitation after the completion of denitrification (after day 2 in Fig. 6). In the excess-acetate and matched treatments, an increase in DIC after 15 d was due to the increased rate of sulfate reduction because of the additional electron donor (Fig. 4).
In summary, the simulations show that the matched-acetate recipe optimized MIDP treatment targeted at desaturation for coastal seawater conditions by maximizing the desired outcome (i.e., N2 production for desaturation) while minimizing undesired by-products (e.g., nitrite and nitrous-oxide accumulation from incomplete denitrification, residual acetate, and H2S from sulfate reduction).
The next-generation biogeochemical model expanded our previous biogeochemical models for MIDP by considering microbial stoichiometry and kinetics for two steps of denitrification and for sulfate reduction. The next-generation model also includes gas–liquid mass-transfer kinetics for N2 and CO2, CaCO3 precipitation kinetics, microbial competition, and inhibition by HNO2, salinity, and sulfide. Model simulations demonstrated that adding nitrate and acetate using a properly matched recipe led to rapid desaturation without causing unwanted outcomes: incomplete desaturation and accumulations of nitrite and nitrous oxide with too little acetate or residual acetate and accelerated H2S generation with excess acetate. The model can be used to optimize treatment recipes for maximizing desaturation or precipitation in most subsurface groundwater environments for liquefaction mitigation. However, field data describing the environmental biogeochemical characteristics (e.g., pH, background chemical concentrations) for the most optimized results are necessary to understand the potential biogeochemical reactions and processes that may impact MIDP and, subsequently, liquefaction mitigation.
The next-generation model was constructed in MATLAB, and the code and necessary files are publicly available online at https://doi.org/10.5281/zenodo.7410676 (CC 4.0; Hall et al., 2022).
The raw data files used during modeling, produced by the model described herein, can be found at https://doi.org/10.5281/zenodo.8122138 (Hall et al., 2023).
The supplement related to this article is available online at: https://doi.org/10.5194/bg-20-2903-2023-supplement.
CAH and AvT co-developed the model. CAH drafted the first version of this paper with input from AvT, LAvP, EK Jr., and BR.
The contact author has declared that none of the authors has any competing interests.
Any opinions, findings and conclusions
or recommendations expressed in this paper are those of the authors and not
of the NSF.
Publisher’s note: Copernicus Publications remains neutral with regard to jurisdictional claims in published maps and institutional affiliations.
This research has been supported by the National Science Foundation (NSF) Engineering Research Center (ERC) within the Division of Engineering Education and Centers (grant no. ERC-1449501).
This paper was edited by Tina Treude and reviewed by Albert Valocchi and one anonymous referee.
Abdul-Talib, S., Hvitved-Jacobsen, T., Vollertsen, J., and Ujang, Z.: Half saturation constants for nitrate and nitrite by in-sewer anoxic transformations of wastewater organic matter, Water Sci. Technol., 46, 185–92, 2002.
Abeling, U. and Seyfried, C. F.: Anaerobic-Aerobic Treatment of High-Strength Ammonium Waste-Water – Nitrogen Removal via Nitrite, Water Sci. Technol., 26, 1007–1015, 1992.
Alin, S. R., Feely, R. A., Hales, B., Byrne, R. H., Cochlan, W., Liu, X., and Greeley, D.: Dissolved inorganic carbon, total alkalinity, pH on total scale, and other variables collected from profile and discrete sample observations using CTD, Niskin bottle, and other instruments from NOAA Ship Ronald H. Brown in the U.S. West Coast California Current System from 2016-05-08 to 2016-06-06 (NCEI Accession 0169412), NOAA National Centers for Environmental Information [data set], https://doi.org/10.7289/v5v40shg, 2017.
Almeida, J. S., Julio, S. M., Reis, M. A. M., and Carrondo, M. J. T.: Nitrite Inhibition of Denitrification by Pseudomonas-Fluorescens, Biotechnol. Bioeng., 46, 194–201, https://doi.org/10.1002/bit.260460303, 1995.
Bae, W. and Rittmann, B. E.: A structured model of dual-limitation kinetics, Biotechnol. Bioeng., 49, 683–689, https://doi.org/10.1002/(SICI)1097-0290(19960320)49:6<683::AID-BIT10>3.0.CO;2-7, 1996.
Bruland, K. W., Rue, E. L., and Smith, G. J.: Iron and macronutrients in California coastal upwelling regimes: Implications for diatom blooms, Limnol. Oceanogr., 46, 1661–1674, https://doi.org/10.4319/lo.2001.46.7.1661, 2001.
Cardoso, R. B., Sierra-Alvarez, R., Rowlette, P., Flores, E. R., Gómez, J., and Field, J. A.: Sulfide oxidation under chemolithoautotrophic denitrifying conditions, Biotechnol. Bioeng., 95, 1148–1157, https://doi.org/10.1002/bit.21084, 2006.
Chou, L., Garrels, R. M., and Wollast, R.: Comparative study of the kinetics and mechanisms of dissolution of carbonate minerals, Chem. Geol., 78, 268-282, https://doi.org/10.1016/0009-2541(89)90063-6, 1989.
Christopher, B., Schwartz, C., and Boudreau, R.: Chapter 5.0 Geotechnical Inputs For Pavement Design, in: Geotechnical Aspects of Pavements Reference Manual, U.S. Department of Transportation Federal Highway Administration, https://www.fhwa.dot.gov/engineering/geotech/pubs/05037/ (last access: 6 July 2023), 2006.
Estuardo, C., Marti, M. C., Huilinir, C., Lillo, E. A., and von Bennewitz, M. R.: Improvement of nitrate and nitrite reduction rates prediction, Electron. J. Biotechn., 11, 3, http://www.ejbiotechnology.info/index.php/ejbiotechnology/article/view/v11n3-6 (last access: 6 July 2023), 2008.
European Commission, Directorate General for Research: Guide to best practices for ocean acidification research and data reporting, Publications Office, LU, https://www.iaea.org/sites/default/files/18/06/oa-guide-to-best-practices.pdf (last access: 6 July 2023), 2011.
Glass, C. and Silverstein, J.: Denitrification kinetics of high nitrate concentration water: pH effect on inhibition and nitrite accumulation, Water Res., 32, 831–839, https://doi.org/10.1016/s0043-1354(97)00260-1, 1998.
Glass, C., Silverstein, J., and Oh, J.: Inhibition of denitrification in activated sludge by nitrite, Water Environ. Res., 69, 1086–1093, https://doi.org/10.2175/106143097x125803, 1997.
Hall, C., van Paassen, L., Rittmann, B., Kavazanjian, E., DeJong, J., and Wilson, D.: Predicting desaturation by biogenic gas formation via denitrification during centrifugal loading, 7th International Conference on Unsaturated Soils, 3–5 August 2018, Hong Kong, China, https://www.issmge.org/publications/publication/predicting-desaturation-by-biogenic-gas-formation-via-denitrification-during-centrifugal-loading (last access: 6 July 2023), 2018.
Hall, C., van Turnhout, A., van Paassen, L., Kavazanjian, E., and Rittmann, B.: Multi-phase Biogeochemical Model for Microbially Induced Desaturation and Precipitation (1.0), Zenodo [code], https://doi.org/10.5281/zenodo.7410676, 2022.
Hall, C. A.: Biogeochemical Modeling of Microbially Induced Desaturation and Precipitation, PhD thesis, Arizona State University, United States – Arizona, 189 pp., https://hdl.handle.net/2286/R.2.N.161397 (last access: 6 July 2023), 2021.
Hall, C. A., van Turnhout, A., van Paassen, L., Kavazanjian, E., and Rittmann, B.: Data for A multi-phase biogeochemical model for mitigating earthquake-induced liquefaction via microbially induced desaturation and calcium carbonate precipitation (1.0), Zenodo [data set], https://doi.org/10.5281/zenodo.8122138, 2023.
He, J. and Chu, J.: Undrained Responses of Microbially Desaturated Sand under Monotonic Loading, J. Geotech. Geoenviron. 140, 04014003, https://doi.org/10.1061/(ASCE)GT.1943-5606.0001082, 2014.
Ingvorsen, K., Zehnder, A. J. B., and Jørgensen, B. B.: Kinetics of Sulfate and Acetate Uptake by Desulfobacter postgatei, Appl. Environ. Microb., 47, 403–408, https://doi.org/10.1128/aem.47.2.403-408.1984, 1984.
Jia, M., Winkler, M. K. H., and Volcke, E. I. P.: Elucidating the Competition between Heterotrophic Denitrification and DNRA Using the Resource-Ratio Theory, Environ. Sci. Technol., 54, 13953–13962, https://doi.org/10.1021/acs.est.0c01776, 2020.
Kraakman, N. J. R., Rocha-Rios, J., and van Loosdrecht, M. C. M.: Review of mass transfer aspects for biological gas treatment, Appl. Microbiol. Biotechnol., 91, 873–886, https://doi.org/10.1007/s00253-011-3365-5, 2011.
Krishna Rao, R. and Gnanam, A.: Inhibition of nitrate and nitrite reductase activities by salinity stress in Sorghum vulgare, Phytochemistry, 29, 1047–1049, https://doi.org/10.1016/0031-9422(90)85400-A, 1990.
Liang, Z., Sun, J., Zhan, C., Wu, S., Zhang, L., and Jiang, F.: Effects of sulfide on mixotrophic denitrification by Thauera-dominated denitrifying sludge, Environ. Sci.-Wat. Res., 6, 1186–1195, https://doi.org/10.1039/C9EW01014A, 2020.
Lilja, E. E. and Johnson, D. R.: Segregating metabolic processes into different microbial cells accelerates the consumption of inhibitory substrates, ISME J., 10, 1568–1578, https://doi.org/10.1038/ismej.2015.243, 2016.
Little, J. and Moler, C.: Matlab, Mathworks, https://www.mathworks.com/ (last access: 6 July 2023), 2017.
Ma, J., Yang, Q., Wang, S. Y., Wang, L., Takigawa, A., and Peng, Y. Z.: Effect of free nitrous acid as inhibitors on nitrate reduction by a biological nutrient removal sludge, J. Hazard. Mater., 175, 518–523, https://doi.org/10.1016/j.jhazmat.2009.10.036, 2010.
Mariangel, L., Aspe, E., Marti, M. C., and Roeckel, M.: The effect of sodium chloride on the denitrification of saline fishery wastewaters, Environ. Technol., 29, 871–879, https://doi.org/10.1080/09593330802015318, 2008.
Meeussen, J. C. L.: ORCHESTRA: An object-oriented framework for implementing chemical equilibrium models, Environ. Sci. Technol., 37, 1175–1182, https://doi.org/10.1021/es025597s, 2003.
Millero, F. J., Feistel, R., Wright, D. G., and McDougall, T. J.: The composition of Standard Seawater and the definition of the Reference-Composition Salinity Scale, Deep-Sea Res. Pt. I, 55, 50–72, https://doi.org/10.1016/j.dsr.2007.10.001, 2008.
Moug, D. M., Sorenson, K. R., Khosravifar, A., Preciado, M., Stallings Young, E., van Paassen, L., Kavazanjian, E., Zhang, B., Stokoe, K. H., Menq, F. M., and Wang, Y.: Field Trials of Microbially Induced Desaturation in Low-Plasticity Silt, J. Geotech. Geoenviron., 148, 05022005, https://doi.org/10.1061/(ASCE)GT.1943-5606.0002890, 2022.
O'Donnell, S. T., Rittmann, B. E., and Kavazanjian, E.: MIDP: Liquefaction Mitigation via Microbial Denitrification as a Two-Stage Process. I: Desaturation, J. Geotech. Geoenviron., 143, 04017094, https://doi.org/10.1061/(asce)gt.1943-5606.0001818, 2017a.
O'Donnell, S. T., Kavazanjian, E., and Rittmann, B. E.: MIDP: Liquefaction Mitigation via Microbial Denitrification as a Two-Stage Process. II: MICP, J. Geotech. Geoenviron., 143, 04017095, https://doi.org/10.1061/(asce)gt.1943-5606.0001806, 2017b.
O'Donnell, S. T., Hall, C. A., Kavazanjian, E., and Rittmann, B. E.: Biogeochemical Model for Soil Improvement by Denitrification, J. Geotech. Geoenviron., 145, 04019091, https://doi.org/10.1061/(asce)gt.1943-5606.0002126, 2019.
Pan, Y., Ye, L., and Yuan, Z.: Effect of H2S on N2O reduction and accumulation during denitrification by methanol utilizing denitrifiers, Environ. Sci. Technol., 47, 8408–8415, https://doi.org/10.1021/es401632r, 2013.
Pan, Y., Liu, Y., Wang, D., and Ni, B.-J.: Modeling effects of H2S on electron competition among nitrogen oxide reduction and N2O accumulation during denitrification, Environ. Sci.-Wat. Res., 5, 533–542, https://doi.org/10.1039/C8EW00873F, 2019.
Panswad, T. and Anan, C.: Specific oxygen, ammonia, and nitrate uptake rates of a biological nutrient removal process treating elevated salinity wastewater, Bioresource Technol., 70, 237–243, https://doi.org/10.1016/S0960-8524(99)00041-3, 1999.
Papaspyrou, S., Smith, C. J., Dong, L. F., Whitby, C., Dumbrell, A. J., and Nedwell, D. B.: Nitrate Reduction Functional Genes and Nitrate Reduction Potentials Persist in Deeper Estuarine Sediments. Why?, PLOS ONE, 9, e94111, https://doi.org/10.1371/journal.pone.0094111, 2014.
Pham, V.: Bio-based ground improvement through Microbial Induced Desaturation and Precipitation (MIDP), Delft University of Technology, https://doi.org/10.4233/UUID:3997066A-0AD6-4DE2-9C79-E5E474BAE20F, 2017.
Pham, V. P., van Paassen, L. A., van der Star, W. R. L., and Heimovaara, T. J.: Evaluating Strategies to Improve Process Efficiency of Denitrification-Based MICP, J. Geotech. Geoenviron., 144, 04018049, https://doi.org/10.1061/(asce)gt.1943-5606.0001909, 2018.
Rittmann, B. and McCarty, P.: Environmental Biotechnology: Principles and Applications, McGraw-Hill Companies, Incorporated, ISBN 9781260441604, 2020.
Rittmann, B. E., Banaszak, J. E., VanBriesen, J. M., and Reed, D. T.: Mathematical modeling of precipitationand dissolution reactions in microbiological systems, Biodegradation, 13, 239–250, https://doi.org/10.1023/A:1021225321263, 2002.
Rittmann, B. E., Banaszak, J. E., Cooke, A., and Rowe, R. K.: Biogeochemical Evaluation of Mechanisms Controlling CaCO3(s) Precipitation in Landfill Leachate-Collection Systems, J. Environ. Eng., 129, 723–730, https://doi.org/10.1061/(ASCE)0733-9372(2003)129:8(723), 2003.
Salek, S. S., van Turnhout, A. G., Kleerebezem, R., and van Loosdrecht, M. C. M.: pH control in biological systems using calcium carbonate, Biotechnol. Bioeng., 112, 905–913, https://doi.org/10.1002/bit.25506, 2015.
Senga, Y., Mochida, K., Fukumori, R., Okamoto, N., and Seike, Y.: N2O accumulation in estuarine and coastal sediments: The influence of H2S on dissimilatory nitrate reduction, Estua. Coast Shelf S., 67, 231–238, https://doi.org/10.1016/j.ecss.2005.11.021, 2006.
Shin, W. S., Park, J. C., and Pardue, J. H.: Oxygen dynamics in petroleum hydrocarbon contaminated salt marsh soils: III. A rate model, Environ. Technol., 24, 831–843, https://doi.org/10.1080/09593330309385620, 2003.
Šimek, M. and Cooper, J. E.: The influence of soil pH on denitrification: progress towards the understanding of this interaction over the last 50 years, Eur. J. Soil Sci., 53, 345–354, https://doi.org/10.1046/j.1365-2389.2002.00461.x, 2002.
Singurindy, O., Berkowitz, B., and Lowell, R. P.: Carbonate dissolution and precipitation in coastal environments: Laboratory analysis and theoretical consideration, Water Resour. Res., 40, W04401, https://doi.org/10.1029/2003wr002651, 2004.
Soto, O., Aspé, E., and Roeckel, M.: Kinetics of cross-inhibited denitrification of a high load wastewater, Enzyme Microb. Tech., 40, 1627–1634, https://doi.org/10.1016/j.enzmictec.2006.11.014, 2007.
Spanos, N. and Koutsoukos, P. G.: Kinetics of Precipitation of Calcium Carbonate in Alkaline pH at Constant Supersaturation. Spontaneous and Seeded Growth, J. Phys. Chem. B, 102, 6679–6684, https://doi.org/10.1021/jp981171h, 1998.
Tugtas, A. E. and Pavlostathis, S. G.: Effect of sulfide on nitrate reduction in mixed methanogenic cultures, Biotechnol. Bioeng., 97, 1448–1459, https://doi.org/10.1002/bit.21338, 2007.
van den Berg, E. M., Rombouts, J. L., Kuenen, J. G., Kleerebezem, R., and van Loosdrecht, M. C. M.: Role of nitrite in the competition between denitrification and DNRA in a chemostat enrichment culture, AMB Express, 7, 91, https://doi.org/10.1186/s13568-017-0398-x, 2017.
van Turnhout, A. G., Kleerebezem, R., and Heimovaara, T. J.: A toolbox to find the best mechanistic model to predict the behavior of environmental systems, Environ. Modell. Softw., 83, 344–355, https://doi.org/10.1016/j.envsoft.2016.05.002, 2016.
Vavilin, V. A. and Rytov, S. V.: Nitrate denitrification with nitrite or nitrous oxide as intermediate products: Stoichiometry, kinetics and dynamics of stable isotope signatures, Chemosphere, 134, 417–26, https://doi.org/10.1016/j.chemosphere.2015.04.091, 2015.
Veshareh, M. J., Kjeldsen, K. U., Findlay, A. J., Nick, H. M., Røy, H., and Marietou, A.: Nitrite is a more efficient inhibitor of microbial sulfate reduction in oil reservoirs compared to nitrate and perchlorate: A laboratory and field-scale simulation study, Int. Biodeter. Biodegr., 157, 105154, https://doi.org/10.1016/j.ibiod.2020.105154, 2021.