the Creative Commons Attribution 4.0 License.
the Creative Commons Attribution 4.0 License.
 | 19 Jan 2023
Nutrient release and flux dynamics of CO2, CH4, and N2O in a coastal peatland driven by actively induced rewetting with brackish water from the Baltic Sea
Daniel L. Pönisch
Anne Breznikar
Cordula N. Gutekunst
Gerald Jurasinski
Maren Voss
Gregor Rehder
The rewetting of drained peatlands supports long-term nutrient removal in addition to reducing emissions of carbon dioxide (CO2) and nitrous oxide (N2O). However, rewetting may lead to short-term nutrient leaching into adjacent water and high methane (CH4) emissions. The consequences of rewetting with brackish water on nutrient and greenhouse gas (GHG) fluxes remain unclear, although beneficial effects such as lower CH4 emissions seem likely. Therefore, we studied the actively induced rewetting of a coastal peatland with brackish water, by comparing pre- and post-rewetting data from the peatland and the adjacent bay.
Both the potential transport of nutrients into adjacent coastal water and the shift in GHG fluxes (CO2, CH4, and N2O) accompanying the change from drained to inundated conditions were analyzed based on measurements of the surface water concentrations of nutrients (dissolved inorganic nitrogen, DIN, and phosphate, PO), oxygen (O2), components of the CO2 system, CH4, and N2O together with manual closed-chamber measurements of GHG fluxes.
Our results revealed higher nutrient concentrations in the rewetted peatland than in the adjacent bay, indicating that nutrients leached out of the peat and were exported to the bay. A comparison of DIN concentrations of the bay with those of an unaffected reference station showed a significant increase after rewetting. The maximum estimated nutrient export (mean ± 95 % confidence level) out of the peatland was calculated to be 33.8 ± 9.6 t yr−1 for DIN-N and 0.24 ± 0.29 t yr−1 for PO4-P, depending on the endmember (bay vs. reference station).
The peatland was also a source of GHG in the first year after rewetting. However, the spatial and temporal variability decreased, and high CH4 emissions, as reported for freshwater rewetting, did not occur. CO2 fluxes (mean ± SD) decreased slightly from 0.29 ± 0.82 g m−2 h−1 (pre-rewetting) to 0.26 ± 0.29 g m−2 h−1 (post-rewetting). The availability of organic matter (OM) and dissolved nutrients were likely the most important drivers of continued CO2 production. Pre-rewetting CH4 fluxes ranged from 0.13 ± 1.01 mg m−2 h−1 (drained land site) to 11.4 ± 37.5 mg m−2 h−1 (ditch). After rewetting, CH4 fluxes on the formerly dry land increased by 1 order of magnitude (1.74 ± 7.59 mg m−2 h−1), whereas fluxes from the former ditch decreased to 8.5 ± 26.9 mg m−2 h−1. These comparatively low CH4 fluxes can likely be attributed to the suppression of methanogenesis and oxidation of CH4 by the available O2 and sulfate in the rewetted peatland, which serve as alternative electron acceptors. The post-rewetting N2O flux was low, with an annual mean of 0.02 ± 0.07 mg m−2 h−1.
Our results suggest that rewetted coastal peatlands could account for high, currently unmonitored, nutrient inputs into adjacent coastal water, at least on a short timescale such as a few years. However, rewetting with brackish water may decrease GHG emissions and might be favored over freshwater rewetting in order to reduce CH4 emissions.
- Article
(6463 KB) - Full-text XML
- BibTeX
- EndNote


Pristine peatlands are natural sinks for nutrients, in particular nitrate (NO), and greenhouse gases (GHGs) such as mostly carbon dioxide (CO2) and occasionally nitrous oxide (N2O; Martikainen et al., 1993; Regina et al., 1996; Strack, 2008; Kaat and Joosten, 2009). Globally, peatlands store up to 550 Gt of carbon (C), which is twice the C stock of the total forest biomass (Moore et al., 1998; Joosten and Clarke, 2002; Kaat and Joosten, 2009).
The drainage of peatlands leads to the mineralization of the topmost peat layer and the accumulation of nutrients (Smolders et al., 2006; Geurts et al., 2010). After rewetting, peatlands can therefore be sources of nutrients, especially ammonium (NH) and phosphate (PO; Lamers et al., 2002; Duhamel et al., 2017). Conversely, due to the anoxic conditions in the water-saturated peat, rewetted peatlands can also act as nutrient sinks, mainly for NO (Fisher and Acreman, 2004). Whether rewetting leads to nutrient release or uptake is, besides other factors, controlled by the degree of peat decomposition (Zak and Gelbrecht, 2007; Cabezas et al., 2012), the water level (Duhamel et al., 2017), and the salinity (Liu and Lennartz, 2019). Nutrient release is highest in strongly degraded peat in formerly drained peatlands (Zak and Gelbrecht, 2007; Cabezas et al., 2012). Therefore, removal of the topsoil before rewetting has been recommended as a measure to greatly reduce the release of PO and nitrogen (N; Harpenslager et al., 2015; Zak et al., 2017). However, nutrient release from peat after rewetting has mostly been assessed in laboratory and incubation studies. To our knowledge, field data on nutrient leaching and potential exports to adjacent waters are lacking.
The GHG exchange of peatlands is strongly influenced by the prevailing biogeochemical and physical conditions, which, in turn, are largely determined by vegetation and the water level and, thus, the ratio of oxic and anoxic conditions (Kaat and Joosten, 2009). In drained peatlands, the low water table enables the aerobic decomposition of peat, which is accompanied by increased CO2 emissions (Joosten and Clarke, 2002). In rewetted peatlands, CO2 emissions are regulated by photosynthesis, decomposition, and temperature within the upper oxygen-rich soil layer and the overlying water column (Parish, 2008; Oertel et al., 2016). In the anoxic water-saturated zones, the formerly oxygen-induced decomposition of organic matter (OM) is slowed down and relies on alternative terminal electron acceptors (TEAs), such as NO, manganese (Mn4+), iron (Fe3+), and sulfate (SO), leading to lowered CO2 emissions (Strack, 2008; Dean et al., 2018). However, methanogenesis, as the last step in the mineralization of OM and a depletion of TEAs, may become more important in anoxic zones.
Methane (CH4) emissions in drained peatlands are virtually negligible at water levels <20 cm below the surface (Jurasinski et al., 2016). Although CH4 is formed in anoxic zones via methanogenesis, most of it is oxidized as it passes through the oxic soil layer (Kaat and Joosten, 2009; Dean et al., 2018). Consequently, drained peatlands are a minor source of atmospheric CH4. In rewetted peatlands, CH4 is microbially produced in water-saturated, anoxic soil layers, mainly by archaea, when all other TEAs are depleted (Schönheit et al., 1982; Oremland, 1988; Segers and Kengen, 1998), so that rewetted peatlands are often significant sources of CH4 (Hahn et al., 2015). However, in coastal peatlands that receive marine water and therefore SO, the contribution of methanogenesis might be reduced, as methanogenic archaea are out-competed by sulfate-reducing bacteria (SRB; Bartlett et al., 1987; Capone and Kiene, 1988; Oremland, 1988; Jørgensen, 2006). Additionally, any CH4 produced may be oxidized by anaerobic methane oxidation coupled to SO reduction (e.g., Boetius et al., 2000).
N2O is an intermediate in microbial processes, mostly involving nitrification, denitrification, and nitrifier denitrification (Kool et al., 2011). In degraded peatlands, all of these processes are fueled by the accumulated nutrients. Drained peatlands can be weak (Martikainen et al., 1993) or strong sources of N2O (Liu et al., 2019), depending mainly on the climate zone and land use (Petersen et al., 2012; Leppelt et al., 2014). Rewetted, and thus water-saturated, peat usually acts as a N2O sink over long-term scales, due to the formation of anoxic zones where N2O is consumed (Strack, 2008). However, rewetting can at least temporarily increase the N2O production and thus its release into the atmosphere due to the high nutrient availability in strongly degraded peat, which enables higher rates of nitrification and denitrification (Moseman-Valtierra et al., 2011; Chmura et al., 2016; Roughan et al., 2018).
In temperate latitudes, coastal peatlands are widespread at the interface between marine and terrestrial ecosystems. However, for many coastal peatlands, the sinking of their ground level due to degradation and peat shrinkage over decades has made them vulnerable to rising sea level and sinking coasts (Jurasinski et al., 2018). In Mecklenburg-Vorpommern (northeastern Germany), currently drained coastal peatlands along the low-lying coastline cover an area of ∼ 360–400 km2 (Bockholt, 1985; Holz et al., 1996). Nowadays, peatlands are rewetted to restore their habitat function and biodiversity, thereby preventing CO2 and N2O emissions and, in the long-term, reestablishing their C and N storage capacity (Strack, 2008; Zielinski et al., 2018).
Coastal drained peatlands may be rewetted in different ways, depending on the available water source. The rewetting can consist of permanent flooding with freshwater (from groundwater or rivers), episodical inundations with brackish water, and permanent brackish water flooding. While the effects of freshwater rewetting (Richert et al., 2000; Hogan et al., 2004; Zak and Gelbrecht, 2007) and episodical inundations with brackish water on nutrient dynamics and GHG have been investigated (Chmura et al., 2011; Neubauer et al., 2013; Hahn et al., 2015; Koebsch et al., 2019), less is known about the impact of permanent brackish water flooding.
In this study we examined the immediate effects of rewetting with brackish water on the nutrient (NO), nitrite (NO), NH, and PO), and GHG fluxes (CO2, CH4, and N2O) in a low-lying, highly degraded coastal peatland at the German Baltic Sea coast, by comparing pre- and post-rewetting conditions. Due to the unique formation of a permanent brackish water column above formerly drained peat, this is the first study to combine marine shallow water and terrestrial peatland research. We investigated how the rewetting with brackish water affects (1) nutrient leaching and the potential transport from a nutrient-enriched, flooded peatland to the adjacent bay driven by frequent water exchange, (2) the GHG dynamics in the surface water within the first year after rewetting, and (3) the GHG fluxes along the transition from drained to inundated conditions.
2.1 Study area
The study area is a low-lying, highly degraded coastal peatland that had been transformed from a drained, agriculturally used polder to a brackish wetland. The Polder Drammendorf (referred to in the following as “peatland”) is located at the northeastern German Baltic Sea coast, on the western part of the island of Rügen (Mecklenburg-Vorpommern, Germany), bordering on the Kubitzer Bodden (Fig. 1). The climate is oceanic, with a mean annual air temperature of 9.1 ∘C and a mean annual precipitation amount of 626 mm (Deutscher Wetterdienst, DWD, 1991–2020). The central Kubitzer Bodden has a mean surface water temperature of 11.4 ± 6.6 ∘C and a mean surface salinity of 8.5 ± 1.4 (referred to in the following as “central bay”; data retrieved from a monitoring station of the Landesamt für Umwelt, Naturschutz und Geologie Mecklenburg Vorpommern (LUNG MV), 2006–2020; 54.40∘ N, 13.11∘ E; Fig. 1b). For comparison, the Arkona Basin, the nearby open Baltic Sea basin to the north of the island of Rügen that influences the water in the Kubitzer Bodden, has a mean surface water temperature of 10.2 ± 5.6 ∘C and a mean surface salinity of 8.0 ± 0.5 (MARNET; data originate from the Leibniz Institute for Baltic Sea Research, Warnemünde, Germany, 2006–2020; 54.88∘ N, 13.86∘ E).
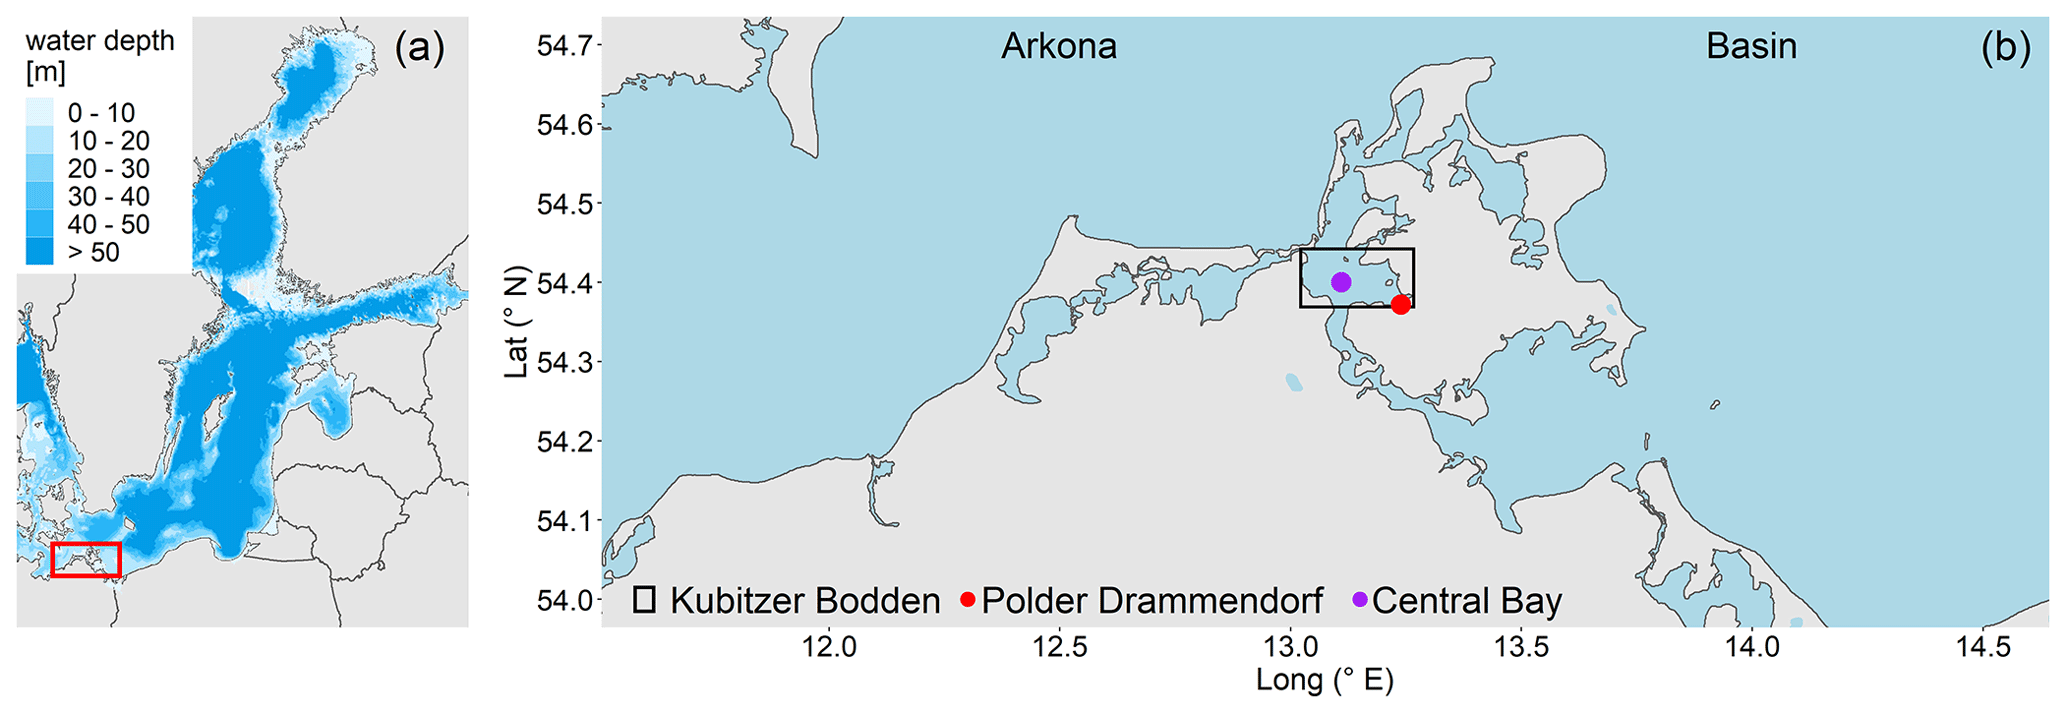
Figure 1(a) Overview of the study area located in the southern Baltic Sea. (b) Coastline of northeastern Germany in Mecklenburg-Vorpommern and the study area location (Polder Drammendorf, in red) on the island of Rügen, bordering on the Kubitzer Bodden, where a monitoring station served as reference (central bay, in purple). The Kubitzer Bodden is connected with the Arkona Basin to the north. Bathymetry refers to Seifert et al. (2001), and borders were retrieved from National Oceanic And Atmospheric Administration (NOAA) and National Centers For Environmental Information (NCEI).
Like most peatlands in northern Germany, Drammendorf was artificially drained for agricultural use (pasture and grassland) in the 1960s by establishing a sandy dike and an extensive ditch system that affected an area of ∼ 2.2 km2. The northwestern part (mostly mineral soil at a higher elevation) served as grassland, while the northeastern part was used for agriculture ,with seasonal fertilizer application, only until the 1990s (100 kg N ha−1 yr−1). The southern compartment (organic soil) provided an area for cattle grazing (∼ 30 cows). The topsoil of the central part consists of up to 50–70 cm highly degraded peat (Brisch, 2015), classified as H7 according to the von Post humification scale (Wang et al., 2021). This highly degraded topsoil layer was not removed prior to rewetting. Underneath the degraded topsoil is a well-preserved peat layer with a thickness of ∼ 100 cm. Peat deposits of up to 220 cm thickness are largest in the western part, near the former dike. The long-lasting drainage and ongoing peat degradation have led to the formation of a local land depression with an average soil elevation of around −0.5 m above sea level (m a.s.l.). To control the water expansion after rewetting, a new dike was built in the southern part before flooding (Fig. 2a). Additionally, a drainage ditch that receives water from the catchment was rebuilt, and a new pumping station was installed. A significant input of nutrients from this additional water supply can be excluded due to the low pumping activity and the absence of a permanent hydrological connection to the study area (Wasser- und Bodenverband Rügen (WBV), T. Schulze, personal communication, 2020).
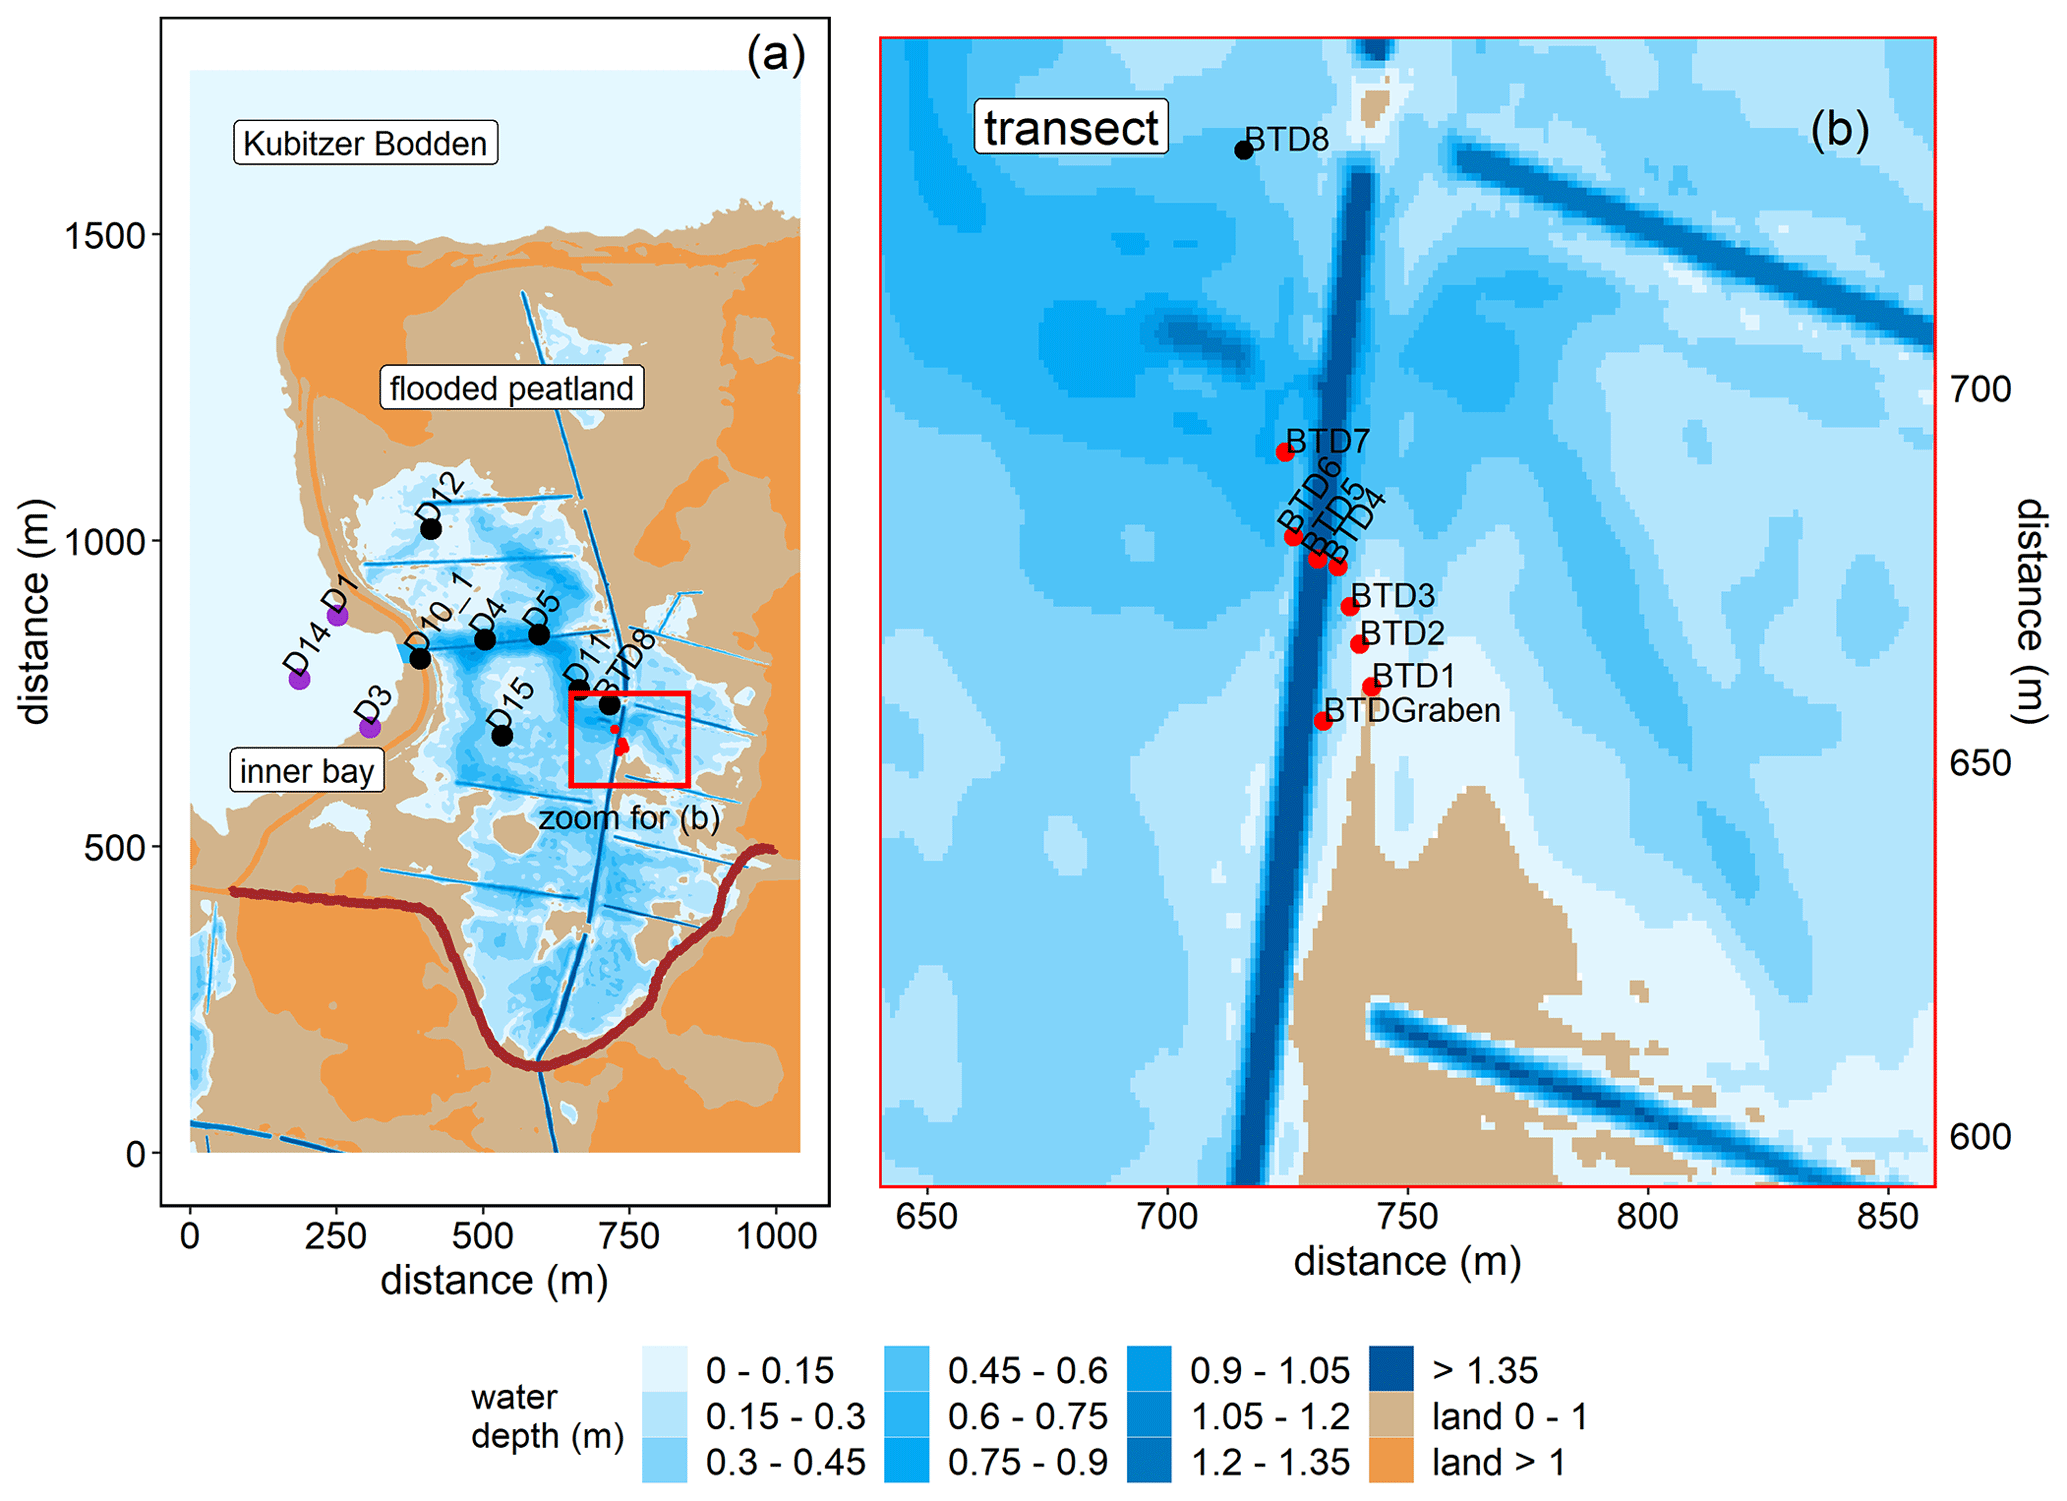
Figure 2Topography of the study area and overview of the stations in the inner bay (purple), the flooded peatland (black), and along the transect of the GHG flux measurements (red). (a) Water coverage is shown at mean sea level. The new dike is shown in dark red. (b) Transect stations that were sampled for atmospheric chamber-based GHG flux measurements (before and after rewetting) and for surface water GHG concentration measurements (after rewetting). Data from station BTD7 were used for a comparison of the chamber-based measurements with the calculated air–sea fluxes after rewetting. Topography data retrieved from the Landesamt für innere Verwaltung MV, Amt für Geoinformation, Vermessungs- und Katasterwesen, Fachbereich Geodatenbereitstellung.
The area was rewetted by the targeted removal of a 20 m wide dike section in November 2019 that caused the immediate flooding of the low-lying area behind the dike. The newly built channel represents the only permanent hydrological connection between the peatland and the Kubitzer Bodden that allows major surface water exchanges. The remaining section of the dike (∼ 650 m) was removed down to the surface elevation level and is hence only flooded at very high water levels.
The restored area covers ∼ 0.8 km2 in total and is characterized by a permanently water-covered area of ∼ 0.5 km2, with a mean water depth of ∼ 0.5 m, compared to 1.0–1.5 m in the Kubitzer Bodden. The extent of the inundated area depends directly on the water level of the Baltic Sea, which is highly dynamic despite the absence of regular tides (Fig. A1 in Appendix A). Therefore, minor changes in the water level lead to major changes in the water-covered area. For instance, if the water level rises from −0.5 to +0.5 m a.s.l., then the water-covered area increases from 0.08 to 0.7 km2 (Figs. A2, A3). The ditch system was only partly removed, and hence, some deeper areas with water depths of up to 4 m remained. It is noteworthy that in the first months after rewetting, former grassland and ditch vegetation (Elymus repens L. (Gould), known as couch grass and Phragmites australis (Cav.) Trin. ex Steud., known as the common reed) almost completely died out, and the cover of emergent macrophytes was then negligible. However, Phragmites australis was able to grow back during the growing season and expanded especially around the ditches.
2.2 Sampling
2.2.1 Surface water sampling
Before rewetting, surface water samples for nutrients (NO, NO, NH, and PO) and chlorophyll a were collected from the inner Kubitzer Bodden (referred to in the following as “inner bay”) at station D1 (Fig. 2a) and irregularly at a second station right in front of the now-removed dike section, which was abandoned after rewetting and therefore merged with station D1. Environmental variables (water temperature, dissolved oxygen (O2), and salinity) were measured on site. Both stations were reached from the land, and sampling was conducted monthly from June to November 2019, except for the month of August.
After rewetting, surface water samples were collected with a small boat, and the sampled variables were extended for the concentrations of GHGs (CO2, CH4, and N2O) and dissolved organic carbon (DOC). The first sampling took place 1 week after the dike removal. Sampling was continued over 1 year (25 sampling dates until December 2020) at weekly (December 2019 to January 2020) or biweekly (February 2020 to September 2020, except for August) intervals. From October 2020 to December 2020, sampling was conducted monthly. In the inner bay, three stations (D1, D3, and D14) were sampled, and in the flooded peatland, six stations (D4, D5, D11, D12, D15, and BTD8) were sampled (Fig. 2a). The inner bay station D14 was sampled from March 2020 onwards. DOC sampling started in April 2020. For the air–sea gas exchange calculation, data from station D10_1, located in the channel, were also included.
Moreover, surface water samples for the analysis of GHG concentrations (CO2, CH4, and N2O) were sampled at eight stations along a transect (Fig. 2b). This sampling was carried out simultaneously with the sampling described in Sect. 2.2.2 to link the GHG air–sea exchange calculations based on surface water samples with chamber-based flux measurements.
Surface water temperature, O2, and salinity were measured directly in the field using a Hach HQ40D multimeter (Hach Lange GmbH, Germany) equipped with two outdoor electrodes (LDO10105 and CDC40105). Depending on the prevailing water depth, additional measurements were conducted in the peatland 15 cm above the soil surface (excluding the ditches) on 22 of the 25 sampling dates. The precision of the electrodes was ±0.3 ∘C, ±0.8 %, and ±0.1 for temperature, O2 saturation, and salinity, respectively.
Surface water samples were taken using a horizontal 7 L Niskin bottle to sample the upper 20 cm of the water column. These included 250 mL subsamples for CH4/N2O analysis (bottles capped with butyl rubber stoppers and crimp-sealed), analysis of the CO2 system (one bottle each for total CO2 (CT), total alkalinity (AT), and pH) and 15 mL subsamples for the analysis of nutrients and DOC. Water for chlorophyll a determination was taken using 3 L canisters.
In the laboratory, CH4/N2O and CO2 samples were poisoned with 500 and 200 µL of saturated HgCl2, respectively, and stored in the dark at 4 ∘C until analysis. Subsamples for nutrients and DOC were filtered in the field with pre-combusted (450 ∘C for 4 h) 0.7 µm glass fiber filters (GF/F, Whatman®) and stored at −20 ∘C. Samples for chlorophyll a were filtered in the laboratory with non-combusted 0.7 µm glass fiber filters (GF/F, Whatman®) and also stored at −20 ∘C.
2.2.2 Chamber-based atmospheric GHG flux sampling for CO2 and CH4
Starting in June 2019, nearly 6 months before rewetting, GHG exchange was regularly measured using dynamic closed chambers (Livingston and Hutchinson, 1995) along a transect representing a soil humidity gradient (Fig. 2b). The measurements were conducted twice a month for a total of 11 sampling days at six peatland stations and two additional stations in the north–south-oriented main ditch. Each station was sampled up to eight times per sampling day, resulting in overall 418 CO2 and 184 CH4 pre-rewetting flux measurements.
For each measurement, the chambers were placed on permanently installed collars and connected through an airtight seal, with a closure period between 180 and 300 s. Between the measurements, chambers were lifted to vent them until atmospheric GHG concentrations were reached. To ensure coverage of photosynthetic and respiration activity, CO2 measurements on the terrestrial peatland were conducted using opaque and transparent chambers for NEE (net ecosystem exchange) and Reco (ecosystem respiration) determination, respectively. To cover a broad spectrum of solar radiation, two additional measurements were conducted with cloth-covered transparent chambers, resulting in a reduced photosynthetically active photon flux density (PPFD). The GHG concentrations of the ditch stations were determined in three consecutive measurements with floating opaque chambers placed on the water surface. Changes in GHG concentrations in the chamber headspace were measured using a portable laser-based analyzer (Picarro GasScouter G4301, Santa Clara, USA, LI-820, LI-COR Biosciences, Lincoln, USA, and an ultraportable greenhouse gas analyzer (UGGA), Los Gatos Research Inc., Mountain View, CA, USA).
After rewetting, the stations along the transect covered a gradient of ground elevations, including stations that fell dry at low water levels and stations that remained permanently flooded. Atmospheric GHG fluxes were measured twice a month using floating opaque chambers positioned above the same sampling locations of the flooded peatland. Since the flooding caused most plants to die, and almost all measurement locations were covered by water during the study period, we reduced the number of NEE measurements with transparent chambers to stations and days with a low water table. Approximately six measurements per station were made during 23 sampling days between December 2019 and December 2020, with a total of 698 CO2 and 482 CH4 fluxes determined during the post-rewetting year.
2.3 Data processing, statistics, and definition of seasons and means
Data analysis and visualization were performed using R (R Core Team, 2021) and the packages tidyverse (Wickham et al., 2019), lubridate (Grolemund and Wickham, 2011), patchwork (Pedersen, 2020), car (Fox and Weisberg, 2019), and flux (Jurasinski et al., 2014). The relationships between environmental variables, nutrient concentrations, and GHG concentrations/fluxes were investigated in linear regression analyses. The significance level was set to p<0.05.
To describe temporal patterns during the entire sampling period, we defined two pre- and four post-rewetting periods, roughly corresponding to seasons (Table 1). For a direct comparison between the pre- and post-rewetting periods, we compared nutrient and GHG flux data from summer and autumn 2019 with those from summer and autumn 2020 (Table 3) by using the Mann–Whitney U test.

We analyzed the data among the respective peatland and inner bay stations in order to verify the use of means for each sampling site (peatland and inner bay separately) and date. The difference between spatial (sampling stations of either site) and temporal (sampling seasons) data variability was tested by using a two-way analysis of variance (ANOVA) and showed a higher temporal variability (p<0.05). Therefore, we decided to combine the stations within the peatland and within the inner bay, respectively, to report mean values and standard deviations (single values can be found in the published data set). The two-way ANOVA was also used to identify seasonal differences between the peatland and the inner bay (Table 2).
At station D3, in the inner bay, the pH, CH4, and pCO2 values differed significantly from those of the remaining stations of the inner bay during the year after rewetting (ANOVA; Kruskal–Wallis test). Since the differences in water temperature, salinity, and O2 were not significant, we decided to include the data from D3 for these variables to obtain a larger data pool for the inner bay and to exclude D3 for all other variables. The exclusion was conducted because variables such as pH, CH4, and pCO2 are related to biological activity which can vary, while the more physically influenced variables (temperature, salinity, and O2) are rather constant.
2.4 Nutrients (NO, NO, NH, PO), chlorophyll a, and DOC
2.4.1 Analysis
Nutrient analyses were carried out according to standard photometric methods (Grasshoff et al., 2009) by using a continuous segmented flow analyzer (SEAL Analytical QuAAtro, SEAL Analytical GmbH, Norderstedt, Germany). Detection limits were 0.2 µM for NO, 0.05 µM for NO, 0.5 µM for NH, and 0.1 µM for PO. Measurements of the nutrient concentrations were partly below the detection limit for the peatland, the inner bay, and the central bay (https://doi.org/10.12754/data-2022-0003, Pönisch and Breznikar, 2022). For such measurements below the detection limit, using the actual values of these measurements is recommended (e.g., Fiedler et al., 2022) to achieve a robust statistical analysis. Since these data were not available, we decided to use randomly generated values between 0 and the respective detection limit with a uniform distribution for these measurements.
Chlorophyll a was extracted from glass fiber filters (GF/F, Whatman®) by incubation with 96 % ethanol for 3 h and analyzed afterwards by using a fluorometer (TURNER 10-AU-005, Turner Designs, Inc., San José, USA) at 670 nm, according to Wasmund et al. (2006). DOC was analyzed after high-temperature combustion, using a multi 2100S instrument (Analytik Jena GmbH, Jena, Germany) and detected by non-dispersive infrared spectrometry according to ISO 20236, ISO 8245 I, and EN 1484.
2.4.2 Use of reference data from a monitoring station
Coastal nutrient data (NO, NO, NH, and PO concentrations) from a monitoring station in the Kubitzer Bodden (central bay; Fig. 1b), ∼ 15 km away from the study area, were obtained as reference. Monitoring data from 2016 to 2020 were included. These data were used (1) to compare them with nutrient concentrations from the inner bay before and after rewetting to detect potentially higher concentrations resulting from nutrient leaching within the peatland and a subsequent export into the inner bay and (2) to calculate the total possible export out of the peatland (Sect. 2.4.3) by using the monitoring station as a second, unaffected, endmember besides the inner bay, which is by contrast potentially affected by the rewetting. Due to transformations and potential losses along the way to the monitoring station, especially of the nitrogen species, the calculated total possible exports are meant to be maximum estimates.
2.4.3 Nutrient transport calculation (DIN-N and PO4-P)
To calculate the bulk exchanges of dissolved inorganic nitrogen (DIN-N) and PO4-P between the flooded peatland and the inner bay/central bay, the water level was transformed to water volume by creating a hypsographic curve with increments of 0.1 m and a resolution of 1 × 1 m (Fig. A3). Water level data from a nearby monitoring station (Barhöft; 54.43∘ N, 13.03∘ E) and topography data with a resolution of 1 × 1 m were obtained from the Wasserstraßen- und Schifffahrtsamt Ostsee (WSA) and the Landesamt für innere Verwaltung MV, respectively. To ensure that the water level data of the monitoring station were valid for the peatland, the water level data of the latter, measured between August and December 2020, were compared with the data from the monitoring station, which showed a strong correlation (rs=0.95; p<0.001; 15 min intervals; data not shown).
A water level of −1.6 m a.s.l., as the lowest recorded water level within the last 25 years, was used as the starting point to derive the cumulative water volumes of the peatland. The water volumes were then assigned to the corresponding water levels to finally calculate the water volume changes (Q; in m3 s−1), according to Eq. (1):
where V is the water volume and t the time. Positive volume changes (Q>0) indicate an inflow of water into the peatland, and vice versa. For each season, the mean inflow (Qin) and outflow (Qout) volumes were calculated, according to Eqs. (2) and (3):
where ΔT denotes the season length. Note that Qout is negative. Seasonal mean values of nutrient concentrations (DIN and PO) were calculated and converted from micromoles per liter (µM) to kilograms per cubic meter (kg m−3) by using the molecular masses of the basic elements N and P to derive DIN-N and PO4-P. After the conversion, nutrient masses of the peatland (cpeatland) and the inner bay (cIB) vs. peatland and central bay (cCB), respectively, were multiplied by Qout and Qin and integrated to calculate the net nutrient transport (NNT, in tonnes, equivalent to megagrams), according to Eqs. (4) and (5):
Negative values indicate a net nutrient export from the peatland into the inner bay/central bay, and positive values display a net nutrient import into the peatland. Uncertainty ranges for the seasonal NNT (uNNT, as the 95 % confidence level) were calculated by using an error propagation, according to Eq. (6):
where terms with u denote the respective 95 % confidence level. To derive the annual uncertainty range of the NNT, all seasonal errors were added up.
2.5 GHG concentrations and fluxes
2.5.1 Inorganic carbon system analysis
Directly measured variables (CT, AT, and pH)
The inorganic carbon system was determined by analyzing the total CO2 (CT), total alkalinity (AT), and pH of the water samples. CT was measured with an automated infrared inorganic carbon analyzer (AIRICA, serial no. 027; MARIANDA, Kiel, Germany). The system acidifies a discrete sample volume (phosphoric acid, 10 %), whereby the inorganic carbon species of CT are shifted to CO2(g). A carrier gas stream (99.999 % N2) transfers the gaseous components to a Peltier device and a Nafion® drying tube (Perma Pure Nafion®, ANSYCO GmbH, Karlsruhe, Germany) to remove water residues. The produced CO2(g) is detected by an infrared detector (LI-7000; LI-COR Environmental GmbH, Bad Homburg, Germany). Certified reference materials (CRMs; Scripps Institution of Oceanography, University of California, San Diego, USA; Dickson et al., 2003) were used for calibration. Triplicate measurements were conducted for each sample, and a precision of ±5 µmol kg−1 was achieved.
AT was measured by potentiometric titration (glass electrode type LL, Electrode Plus, 6.0262.100; Metrohm AG, Filderstadt, Germany) in the open-cell configuration, after Dickson et al. (2007). The system was calibrated with the same CRMs as used for CT and resulted in the same precision.
The pH was analyzed spectrophotometrically using the pH-sensitive indicator dye metacresol purple (mCP, 2 mM; CONTROS Systems & Solutions GmbH, Kiel, Germany). The measurement principle and instrumental setup are described elsewhere (Dickson et al., 2007; Carter et al., 2013). In brief, absorption was measured using the Agilent 8453 UV-visible spectroscopy system (Agilent Technologies, Waldbronn, Germany); pH parameterization for brackish water was calculated following Müller and Rehder (2018). Quality control was performed by measuring buffer solutions (salinity of 20) prepared according to Müller et al. (2018). An external buffer solution with a salinity of 35 (Scripps Institution of Oceanography, University of California, San Diego, USA) was additionally used. All pH values are reported given on the total scale (pHT).
Calculated variables
The CO2 partial pressure in the water phase (pCO2), the value of which was required for the CO2 air–water flux calculations (Sect. 2.5.3), was calculated from CT and pH using the R packages seacarb (Gattuso et al., 2019), with K1 and K2 from Millero (2010), Ks from Dickson (1990), and Kf from Dickson and Riley (1979). CT and pH were preferred because non-oceanic components, in particularly organic acid-base systems, contribute significantly to AT (Kuliński et al., 2014). AT was also calculated from CT and pH and the values compared with measured values, thus revealing the magnitude of the contributions of those components to AT.
2.5.2 Dissolved CH4 and N2O concentration analysis
Dissolved CH4 and N2O concentrations were determined by gas chromatography on an Agilent 7890B instrument (Agilent Technologies, Santa Clara, USA) coupled to a flame ionization detector (FID) and an electron capture detector (ECD). A purge-and-trap technique, explained in detail in Sabbaghzadeh et al. (2021), was used. In brief, a helium gas stream was used to purge 10 mL of seawater to extract volatile compounds. The gas stream passed through a purifier (VICI – Valco Instruments Co. Inc., Houston, USA) and was dried using a Nafion® tube (Perma Pure Nafion®, ANSYCO GmbH, Karlsruhe, Germany) and a SICAPENT® tube (Merck KGaA, Darmstadt, Germany). The relevant compounds were enriched by cryofocusing on a trap filled with HayeSep D® (CS – Chromatographie Service GmbH, Langerwehe, Germany) maintained at −120 ∘C using an ethanol/nitrogen cooling bath. After 10 min of heating in a 95 ∘C water bath, the compounds were desorbed and separated by two capillary columns linked to the detectors by a Deans Switch (Pönisch, 2018).
For quality control, a calibration standard (gas composition of 9.9379 ± 0.0159 ppm CH4 and 1982.07 ± 3.77 ppb N2O, where ppm is parts per million, and ppb is parts per billion) was measured daily before and after the sample measurements; the standard deviation was <1 %. The calibration range was adjusted using multi-loop injection of the calibration gas to ensure that the samples were within the limits of the calibration. The standard was recalibrated according to high-precision standards (ICOS-CAL, Max Planck Institute, Jena, Germany).
2.5.3 GHG flux calculations
Atmospheric fluxes based on closed-chamber measurements
CO2 and CH4 fluxes were calculated using the ideal gas law (Livingston and Hutchinson, 1995), as formulated in Eq. (7):
where F is the GHG flux (g m−2 h−1), M is the molar mass of the gas (g mol−1), p is the standard air pressure (101 300 Pa), V is the chamber volume (m3), R is the gas constant (m3 Pa K−1 mol−1), T is the temperature in the chamber (K), A is the surface area of the measurement collar (m2), and is the change in concentration over time. The latter was derived from the slope of a linear regression based on the medians of the gas concentrations. The atmospheric sign convention was applied; thus, positive fluxes indicated a release of GHG by the soil and negative fluxes GHG uptake by the soil. The fluxes were estimated using the function fluxx() from the R package flux (Jurasinski et al., 2022) and the SLP (slope based, i.e., median-based regression; Komsta, 2019) method. Outlier identification (using a histogram) resulted in the exclusion of CO2 fluxes which were smaller than −2.5 and larger than 4 g m−2 h−1. Similarly, CH4 fluxes larger than 200 mg m−2 h−1 were discarded due to a high risk of capturing ebullition-based CH4 emissions instead of diffusive fluxes.
Atmospheric fluxes based on air–sea gas exchange parameterization (velocity k model)
The air–sea gas exchange (F; g m−2 h−1) is a function of the gas transfer velocity (k) and the concentration difference between the bulk liquid (Cw) and the top of the liquid boundary layer adjacent to the atmosphere (Ca). It was calculated as reported in Wanninkhof (2014) and as shown in Eq. (8):
where k was derived from an empirical relationship between a coefficient of gas transfer (0.251) and the wind speed 〈U2〉 (Wanninkhof, 2014) and Schmidt number (Sc), as expressed by Eq. (9):
Wind speeds originated from the nearby (∼ 15 km away) monitoring station of Putbus and were measured at 10 m height (DWD; 54.3643∘ N, 13.4771∘ E; WMO-ID 10093). The average wind speed was defined in this study as ±3 h from midday because the wind speed over 24 h was lowest at night and highest at midday and because sampling was usually conducted within the selected time interval. The Schmidt number was approximated by a linear interpolation between the freshwater and seawater values. Atmospheric equilibrium conditions (Ca) were calculated using the atmospheric data for CO2 and CH4 obtained from the ICOS station of Utö (Finnish Meteorological Institute, Helsinki). Due to the seasonal changes in the atmospheric dry molar fraction of CO2 and CH4, mean values for each season were computed. For N2O, the atmospheric dry mole fraction from the station of Mace Head was selected (National University of Ireland, Galway; data from the NOAA Global Monitoring Laboratory (GML) carbon cycle cooperative global air sampling network; Dlugokencky et al., 2019a, b). A mean value of the atmospheric N2O concentration during the investigation period was calculated due to its minor seasonality. Equilibrium concentrations were then calculated using the solubility coefficient (K0) from Weiss and Price (1980). We acknowledge that the air–sea exchange model we used (Wanninkhof, 2014) was developed for open-ocean waters and is a questionable approach for deriving fluxes in small enclosed areas such as our study area. However, the lack of an appropriate parameterization and the convincing result of the comparison of our two approaches (see below and Appendix C) justify our approach.
Comparability of two independent approaches to atmospheric flux determination
We evaluated the comparability of the two previously described methods by comparing the results of a representative station (BTD7) for each post-rewetting season. The comparison showed no significant differences between the fluxes of CO2 and CH4 derived with the different methods, and therefore, it seems appropriate to combine the fluxes for each GHG into one pooled post-rewetting data set. The pooled post-rewetting flux values were compared with the pre-rewetting values to investigate the effect of rewetting on CH4 and CO2 fluxes (Table 3). For more details concerning the comparability assessment, see Appendix C. Due to the large variability and the pooling of chamber-based measurements with k model data, the GHG fluxes after rewetting are hardly suitable for upscaling, and thus, the single values in the published data should be used.
3.1 Surface water properties (temperature, salinity, O2, DOC, and chlorophyll a)
In the first year after rewetting, there were no significant differences between the peatland and the inner bay with respect to surface water temperature, salinity, and O2 saturation (Fig. 3a–c; Table 2), suggesting a pronounced water exchange between the peatland and the inner bay that was driven by frequent changes in the water level (Fig. A1). Additionally, no significant differences between summer and autumn 2019 and summer and autumn 2020 were found in the inner bay.
Temperature and salinity measurements near the peat surface showed no significant differences between the surface and bottom water over the year (nsurface=140; nbottom=86; data not shown), which suggested that vertical exchange processes and mixing were highly pronounced. However, a significant difference in O2 saturation between the surface and bottom water in summer (p<0.01) indicated that local and temporary gradients are possible.

Figure 3Time series of the mean (a) temperature, (b) salinity, (c) O2 saturation, (d) DOC concentration, and (e) chlorophyll a concentration (± standard deviation) in the surface water from June 2019 to December 2020. Data from the flooded peatland (n=6) are shown in blue and data from the inner bay (n=2 or 3, as explained in Sect. 2.3) in black. The vertical black line indicates the rewetting event.
DOC concentrations were significantly higher in the peatland than in the inner bay in spring and summer, with the highest concentration (∼ 30 mg L−1) measured in the peatland (Fig. 3d; Table 2). Chlorophyll a concentrations after rewetting showed clear seasonal and spatial differences, with significantly higher concentrations in the peatland in spring and summer (max ∼ 125 µg L−1; Fig. 3e; Table 2). A comparison of pre- and post-rewetting chlorophyll a concentrations in the inner bay in summer and autumn showed higher concentrations after rewetting (pre-rewetting concentrations of 2.5 ± 0.9 µg L−1; post-rewetting concentrations of 15.4 ± 11.5 µg L−1).
Table 2Seasonal comparison of the surface water means (± standard deviation) in the peatland (Peat) as opposed to the inner bay (Bay) for all in situ variables. The number of observations is shown in parentheses, and significant seasonal differences (p<0.05) between the inner bay and the peatland are indicated in bold.
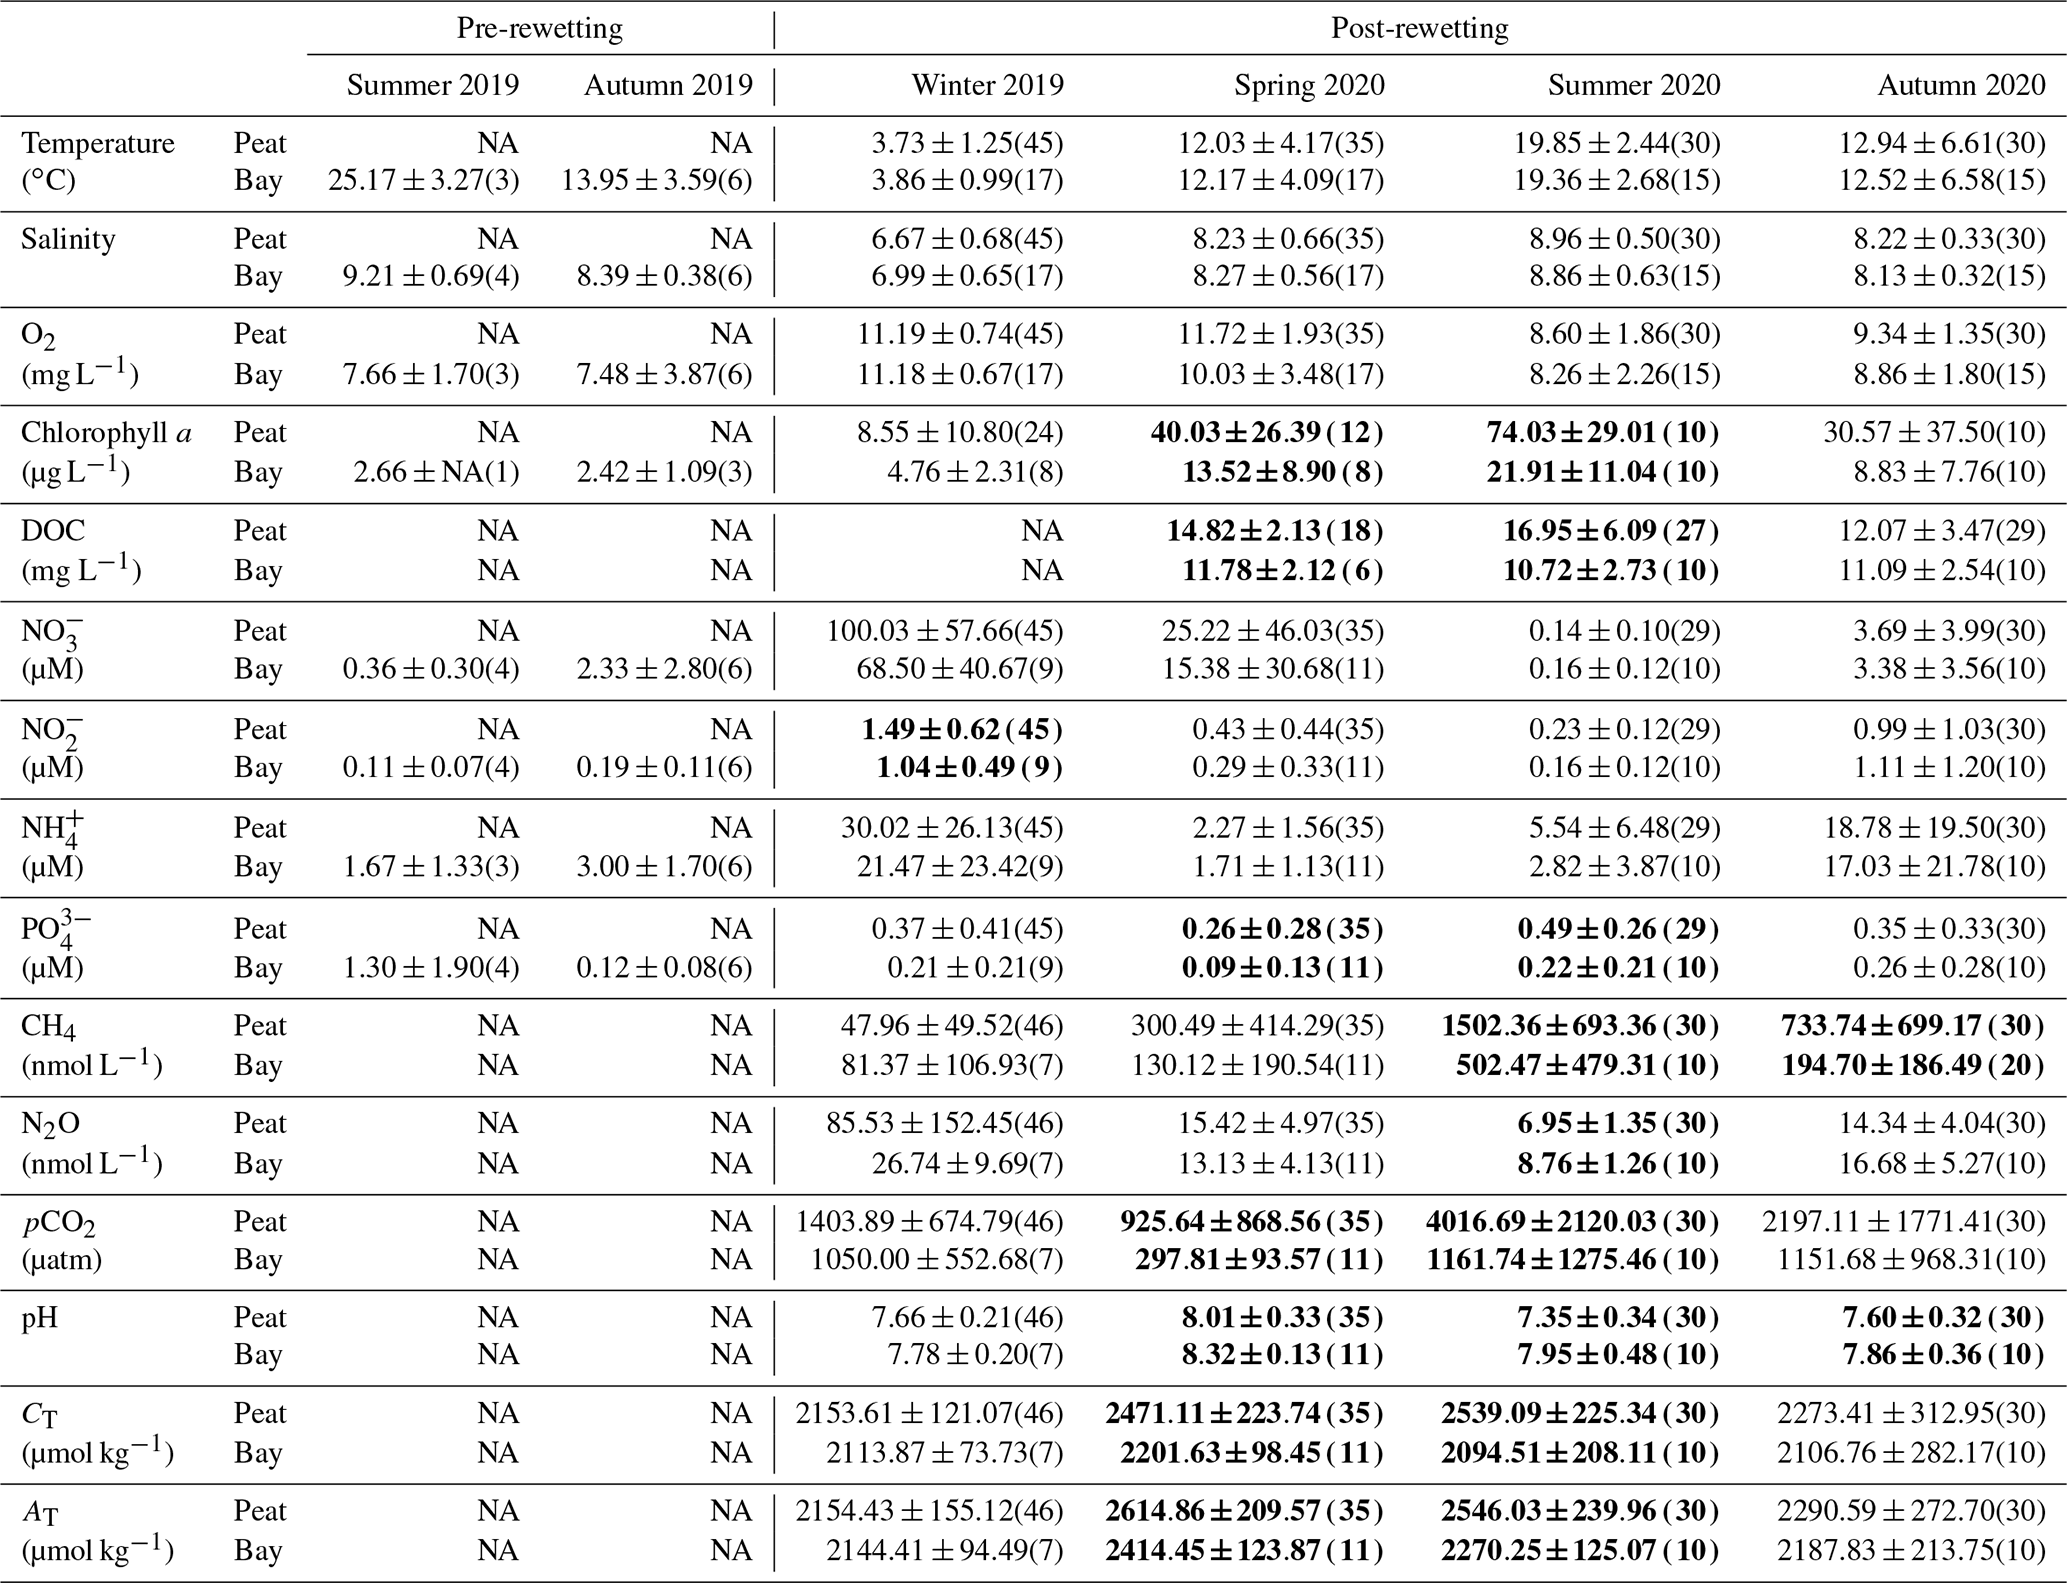
NA – not available.
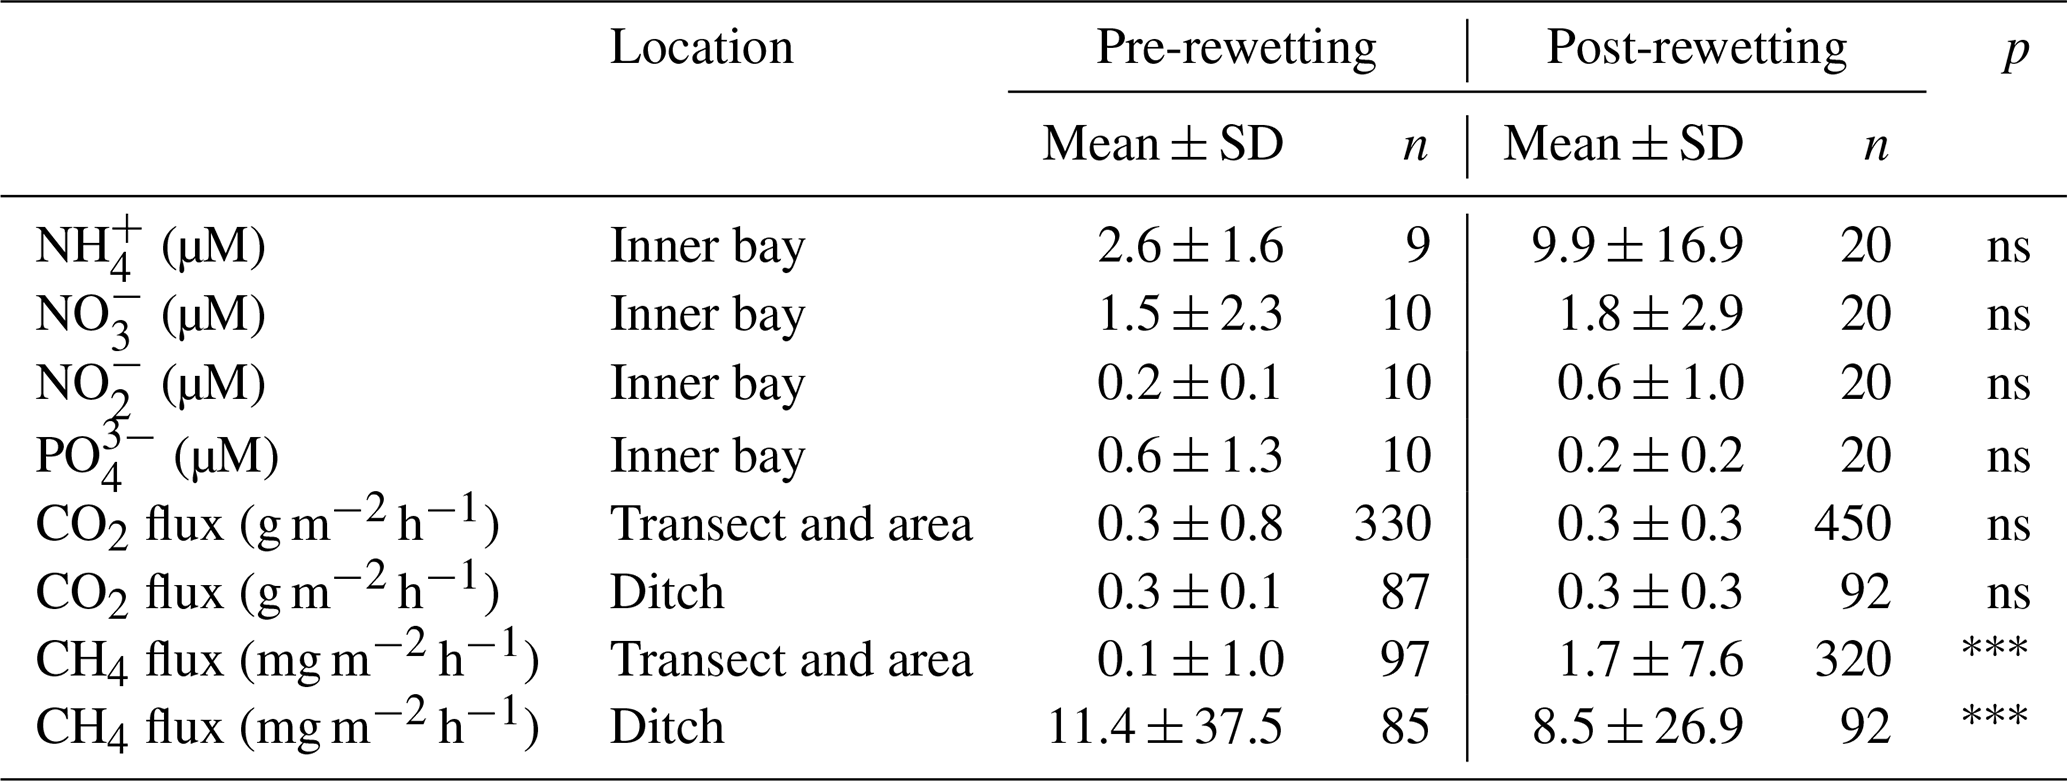
Table 3Statistical comparison of pre- and post-rewetting nutrient concentrations and GHG fluxes. For pre- and post-rewetting phases, summer and autumn seasons were used (June to November 2019 and 2020, respectively). Nutrient concentrations are compared for the inner bay and GHG fluxes for the peatland site. The triple asterisks and ns indicate p<0.001 and not significant, respectively.
3.2 Nutrients (NO, NO, NH, and PO)
3.2.1 Pre- and post-rewetting spatiotemporal dynamics and comparison with a nearby monitoring station
In the inner bay, all N nutrient concentrations were substantially higher at the first sampling after rewetting than prior to rewetting, while PO concentrations were only slightly higher post-rewetting (Fig. 4). This increase in N nutrients led to a drastic increase in the N : P ratio from ∼ 73 in autumn 2019 before rewetting to ∼ 1600 shortly after rewetting in winter 2019. A comparison of the same pre- and post-rewetting seasons (summer and autumn 2019/2020) showed generally higher N nutrient concentrations in the inner bay after rewetting, which could not be confirmed statistically (Mann–Whitney U test; Table 3).
During winter, all N nutrients were high in the peatland and inner bay. After a rapid decrease in spring, N nutrient concentrations reached their lowest values during summer, with NH and NO increasing in autumn again. PO concentrations followed a different pattern, with the highest concentrations determined in summer and fewer fluctuations over the year.
The spatial differences in nutrient concentrations between the inner bay and the peatland after rewetting varied greatly between the nutrient species. From the N nutrients, only NO concentrations were significantly higher once in winter, shortly after rewetting, whereas NH and NO concentrations showed no significant differences in any season (Table 2). Significantly higher PO concentrations in the peatland occurred during spring and summer (p<0.05). Some significant correlations between nutrient species were found (Fig. D1), especially between NO/NH and NO/NO, both in the peatland and the inner bay.
Nutrient concentrations of the monitoring station (central bay) showed a low interannual variability during the years 2016–2020 and often lower concentrations than the inner bay (Fig. 5). A detailed comparison of nutrient data from the monitoring station with those from the inner bay showed that, before rewetting, only the NH concentrations were significantly higher in the inner bay. After rewetting, NO and NO concentrations in the inner bay increased and were significantly higher than in the central bay (p<0.001 and p<0.05, respectively). In spring, N nutrient concentrations were similar at the two locations, whereas in summer, all N nutrients were significantly higher in the inner bay (p<0.01). In autumn, NO and NH concentrations increased again and, thus, showed significantly higher concentrations in the inner bay. PO again followed a pattern different to that of the N nutrients. Shortly before rewetting, its concentrations in the inner bay were significantly lower than those in the central bay (p<0.05). After rewetting, PO concentrations showed no significant differences in any season.

Figure 4Time series of the mean (a) PO, (b) NO, (c) NO, and (d) NH concentrations (± standard deviation) in the surface water from June 2019 to December 2020. Data from the flooded peatland (n=6) are shown in blue and data from the inner bay (until 11 March 2020, n=1; thereafter, n=2) in black. The vertical black line indicates the rewetting event.

Figure 5Seasonal nutrient concentrations of (a) NO, (b) NH, (c) NO, and (d) PO at the nearby monitoring station (central bay, red) and in the inner bay (inner bay, blue) from pre- to post-rewetting. The vertical black line indicates the rewetting event. Note that 5-year data (2016–2020) are shown for the central bay (see Sect. 2.4.2). ns is for not significant, and the asterisks denote the following: * p<0.05, p<0.01, and p<0.001.
3.2.2 Nutrient export from the rewetted peatland into the inner bay
The rewetted peatland was a net source of DIN-N and PO4-P for the inner bay (Table B1 in Appendix B). During the first year after rewetting, 10.8 ± 17.4 t yr−1 DIN-N and 0.24 ± 0.29 t yr−1 PO4-P were exported into the inner bay (given as mean ± 95 % confidence level, equivalent to Mg yr−1). DIN-N export was highest during the winter directly after rewetting (8.6 ± 9.9 t) and lowest during summer (0.3 ± 0.5 t). DIN-N and PO4-P were only exported from the peatland into the inner bay in all seasons.
N nutrient concentrations showed a gradient from the peatland through the inner bay to the central bay. Therefore, nutrient data from the central bay were also taken into account to estimate the total possible export from the peatland to the sea. This resulted in an estimated total net export of 33.8 ± 9.6 t yr−1 DIN-N. In contrast to the comparison of the peatland and the inner bay, PO4-P was once imported from the central bay into the peatland in autumn (0.03 ± 0.10 t). Additionally, it was noticeable that the PO4-P concentrations in the central bay were permanently higher than in the inner bay, leading to a lower annual export of 0.09 ± 0.32 t yr−1 PO4-P.
3.3 GHG in the surface water after rewetting
3.3.1 Inorganic C system
During the winter after rewetting, the differences in the CO2 system (CT, AT, pH, and pCO2) between the inner bay and the peatland were not significant (Figs. 6, 7a). All variables increased slightly until spring, coinciding with a slight increase in salinity over the same period. From spring onwards, however, the components of the CO2 system followed contrasting patterns, with CT and AT remaining relatively constant in the inner bay but reaching significantly higher values in the peatland (p<0.05), including maximum values in summer (Table 2). The pH also showed significant seasonal differences, with lower values and a minimum in summer in the peatland (p<0.05). CT and AT values in the inner bay and in the peatland aligned in autumn, whereas the pH remained significantly different (p<0.05). The mean pCO2 (calculated from CT and pH) of the surface water in winter was 1050.0 ± 55.7 µatm in the inner bay and 1403.9 ± 674.8 µatm in the peatland (Fig. 7a). The pCO2 values were highest during the first few weeks after inundation and then steadily decreased, with the lowest mean values occurring in spring (peatland) and summer (inner bay). The summer was characterized by high pCO2 values in general, including earlier and stronger increases in the peatland than in the inner bay that resulted in significant differences in spring and summer (p<0.05 for both seasons). pCO2 values were highest in summer, with 4016.7 ± 2120.0 µatm (peatland) and 1161.7 ± 1275.5 µatm (inner bay; Table 2). In October, all of the examined CO2 quantities had a short-term inversion of the prevailing pattern.
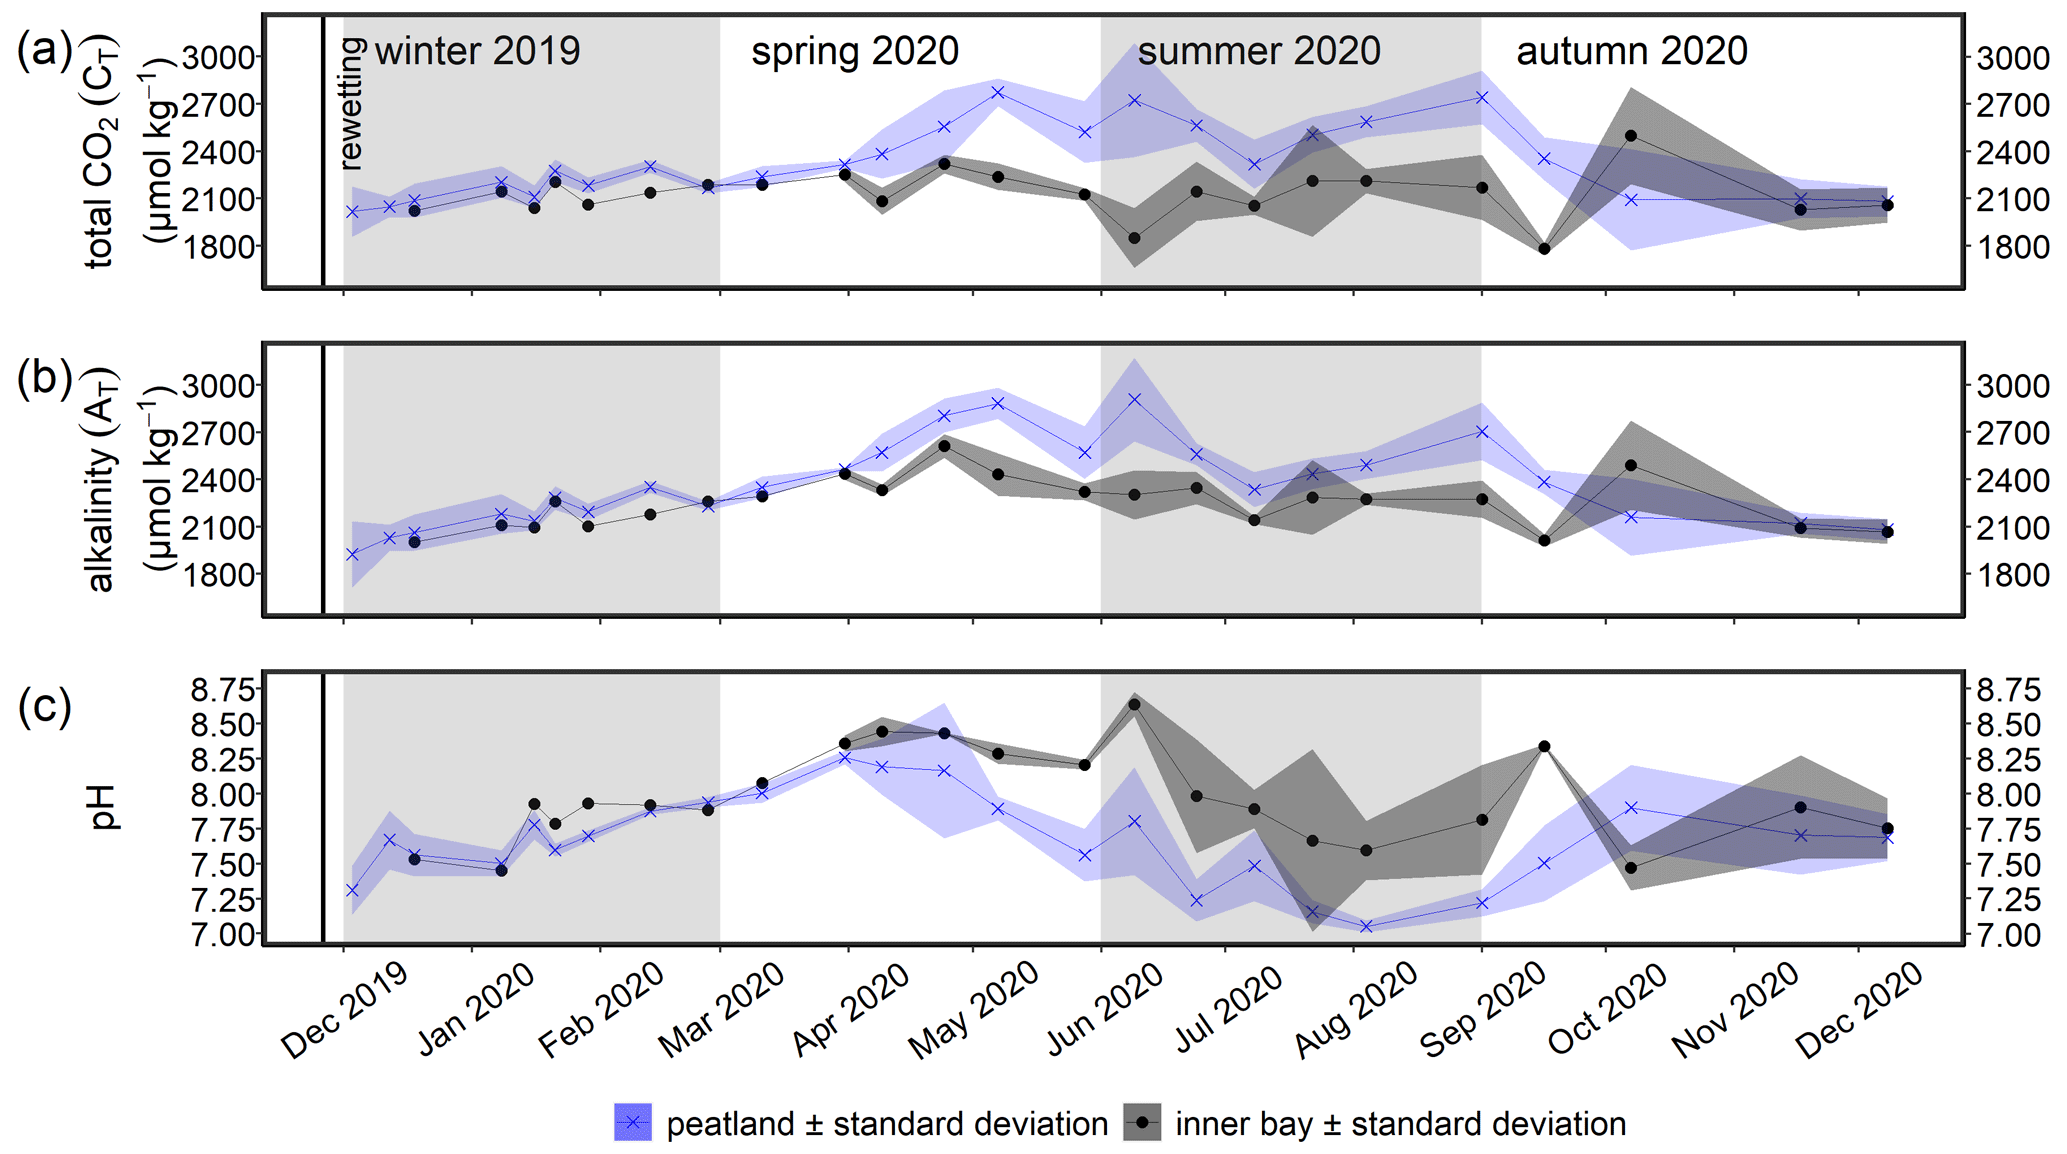
Figure 6Time series of the mean (a) total CO2 (CT), (b) total alkalinity (AT), and (c) pH (± standard deviation) in the surface water after rewetting, as measured from December 2019 to December 2020. Data from the flooded peatland (n=6) are shown in blue and data from the inner bay (until 11 March 2020, n=1; thereafter, n=2) in black. The vertical black line indicates the rewetting event.
3.3.2 CH4
During the first few months after flooding (in winter), the CH4 concentrations in both the inner bay and the peatland were low and did not differ significantly (Fig. 7b; Table 2), i.e., 48.0 ± 49.5 nmol L−1 (peatland) and 81.4 ± 107.0 nmol L−1 (inner bay). From mid-spring onwards, CH4 concentrations in the inner bay and the peatland increased such that, during summer and autumn 2020, the differences at the two areas were significant (p<0.05). Mean CH4 values were highest in summer and amounted to 1502.4 ± 693.4 nmol L−1 in the peatland and 502.5 ± 479.3 nmol L−1 in the inner bay. Furthermore, the peatland was characterized by a considerable short-term variability in spring and summer, which is expressed in four peaks representing elevated concentrations. A positive significant correlation (rs=0.73; n=72; p<0.001) was found in the peatland between the surface water CH4 concentrations and a water temperature >10 ∘C but not <10 ∘C.
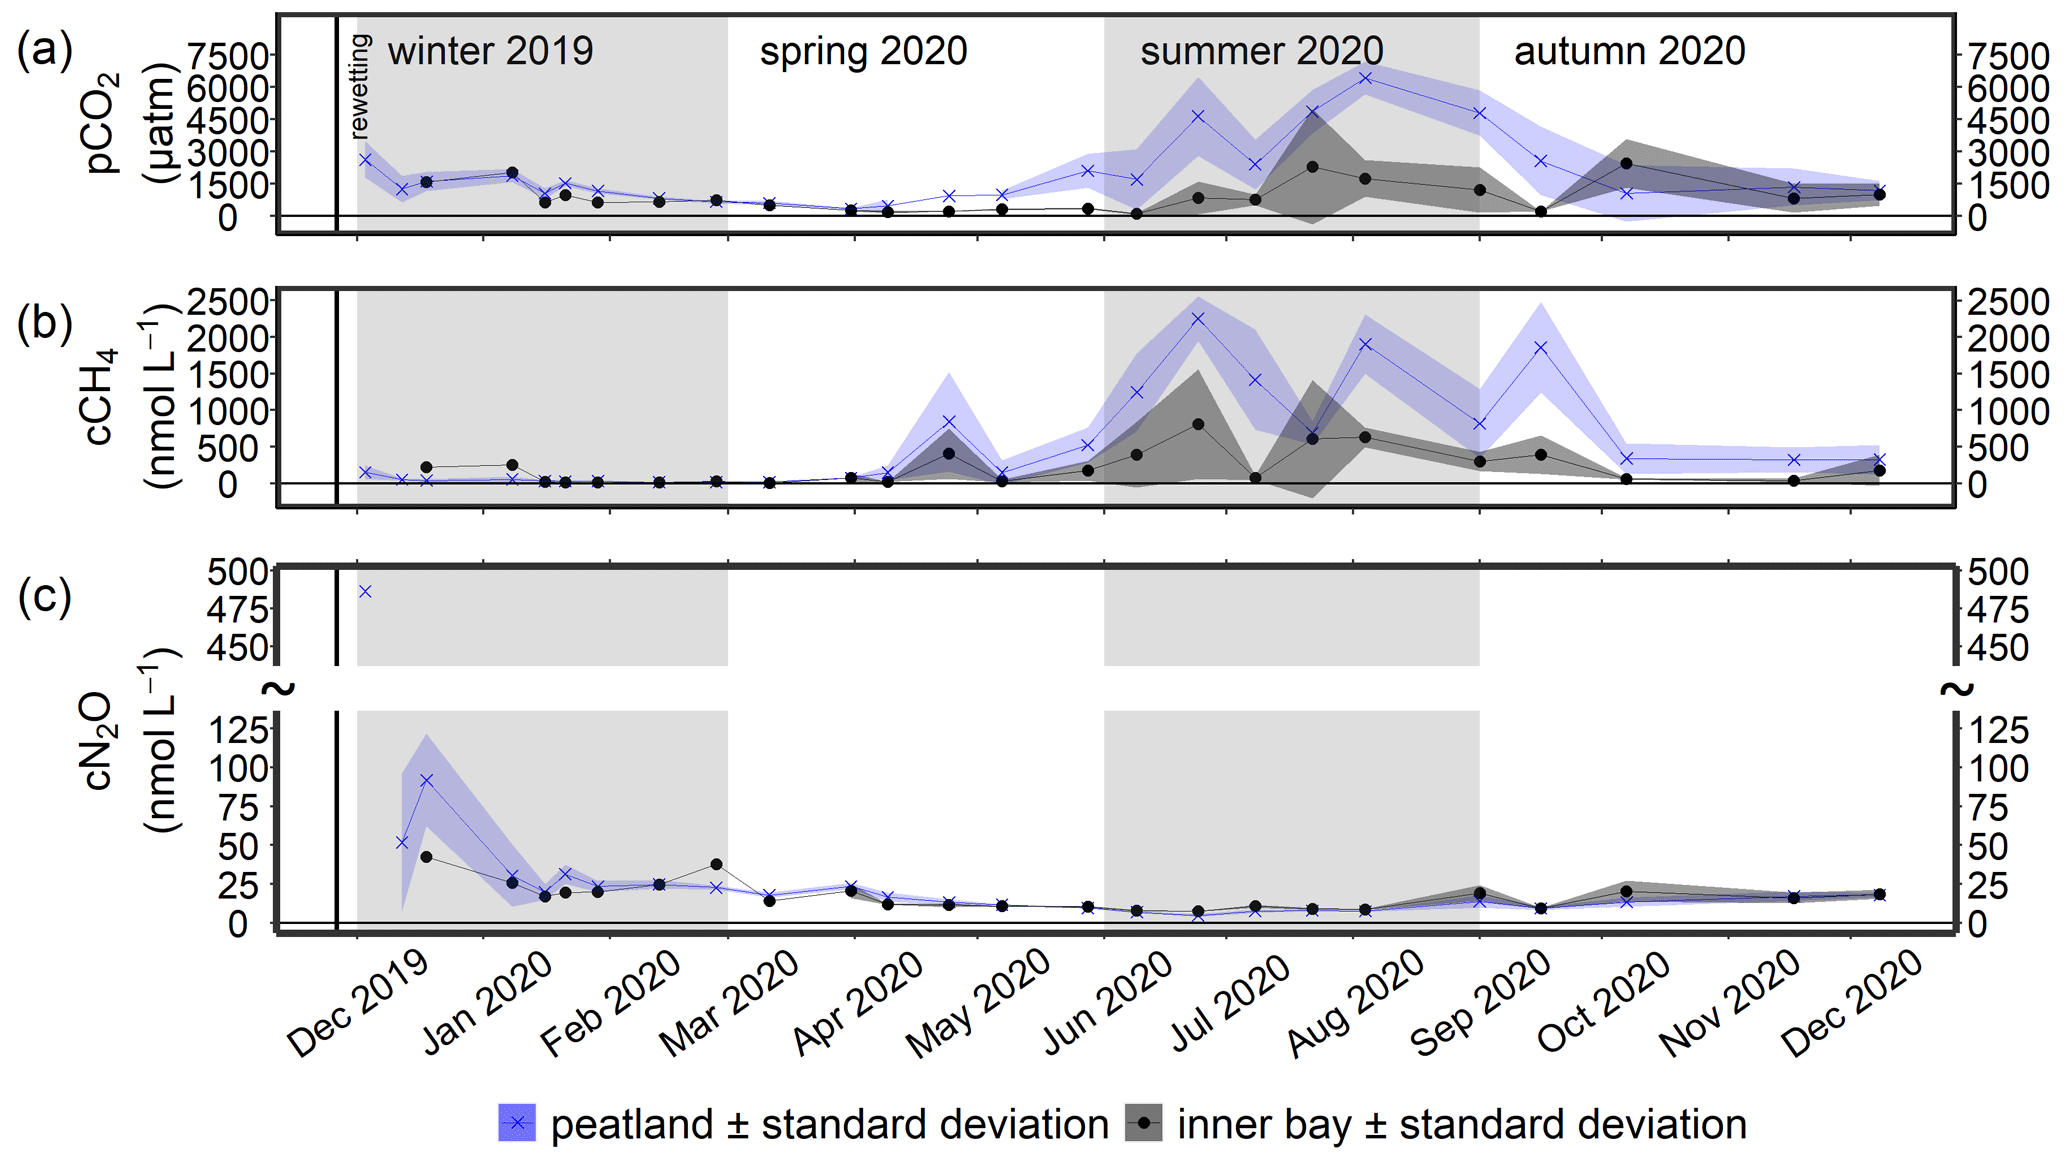
Figure 7Time series of the mean (a) pCO2, (b) CH4 concentration (cCH4), and (c) N2O concentration (cN2O; ± standard deviation) after rewetting in the surface water from December 2019 to December 2020. Data from the flooded peatland (n=6) are shown in blue and data from the inner bay (until 11 March 2020, n=1; thereafter, n=2) in black. The vertical black line indicates the rewetting event.
3.3.3 N2O
The highest N2O concentration of 486.3 nmol L−1 was measured in the peatland 1 week after rewetting (Fig. 7c), followed by 4–5 weeks of still-elevated N2O concentrations between 19.9 and 91.8 nmol L−1. During winter, significant positive correlations were determined in the peatland between N2O and NH (rs=0.61; n=45; p<0.001) and between N2O and NO (rs=0.46; n=45; p<0.01). From spring onwards, N2O decreased rapidly, both in the peatland and the inner bay, with the lowest values of 4.7 to 7.9 nmol L−1 reached in summer. Other positive correlations of N2O with N nutrients in the peatland included NO (rs=0.74; n=35; p<0.001) and NO (rs=0.70; n=35; p<0.001) in spring and all N species in autumn (NO has rs=0.85, n=30, and p<0.001; NO has rs=0.70, n=30, and p<0.001; NH has rs=0.80, n=30, and p<0.001).
Spatial differences in N2O concentrations between the inner bay and the peatland were low and not significant in winter, spring, or autumn, whereas significantly lower concentrations were measured in the peatland during summer (Table 2).
3.4 Pre- and post-rewetting GHG fluxes (CO2, CH4, and N2O)
Terrestrial CO2 fluxes before rewetting, during summer and autumn 2019, were highly variable, ranging from −3.3 to 3.0 g m−2 h−1, with a mean ± SD of 0.29 ± 0.82 g m−2 h−1 (Fig. 8a). Within the ditch, pre-rewetting CO2 fluxes ranged from −0.008 to 0.6 g m−2 h−1 but, on average, were comparable with the fluxes determined at the terrestrial (dry) surface.
After rewetting, formerly terrestrial CO2 fluxes decreased in amplitude (−0.5 to 1.4 g m−2 h−1), while the summer and autumn averages were unchanged compared to the pre-rewetting fluxes (Table 3). In the ditch, the mean and minimum post-rewetting CO2 fluxes were within the range of those determined before rewetting (mean of 0.26 ± 0.29 g m−2 h−1; min of −0.02 g m−2 h−1), but the maximum flux (1.1 g m−2 h−1) was almost twice as high as the pre-rewetting ditch flux (max of 0.6 g m−2 h−1).
Pre-rewetting CH4 fluxes (mean ± SD) in summer and autumn 2019 varied between −0.9 and 8.4 mg m−2 h−1 (terrestrial) and −1.1 and 193.6 mg m−2 h−1 (drainage ditch; Fig. 8b). While mean terrestrial CH4 fluxes were 0.13 ± 1.01 mg m−2 h−1, the mean ditch fluxes were 11.4 ± 37.5 mg m−2 h−1. In summer and autumn 2020, after rewetting, average CH4 fluxes on formerly terrestrial land increased slightly but significantly (1.74 ± 7.59 mg m−2 h−1), whereas in the ditch they decreased considerably (8.5 ± 26.9 mg m−2 h−1). Flux amplitudes at the ditch station before and after rewetting were comparable.
Data on N2O fluxes are available only for the post-rewetting period. The rewetted peatland was a small source of N2O, with an annual mean (± SD) flux of 0.02 ± 0.07 mg m−2 h−1 in the first year after rewetting (Fig. 8c). The highest N2O flux of 0.4 mg m−2 h−1 occurred 1 week after rewetting, followed by lower N2O fluxes between 0.007 and 0.2 mg m−2 h−1 within the following 4–5 weeks. Afterwards, N2O fluxes remained constantly close to zero. Negative fluxes, indicating N2O uptake, were measured only in summer.
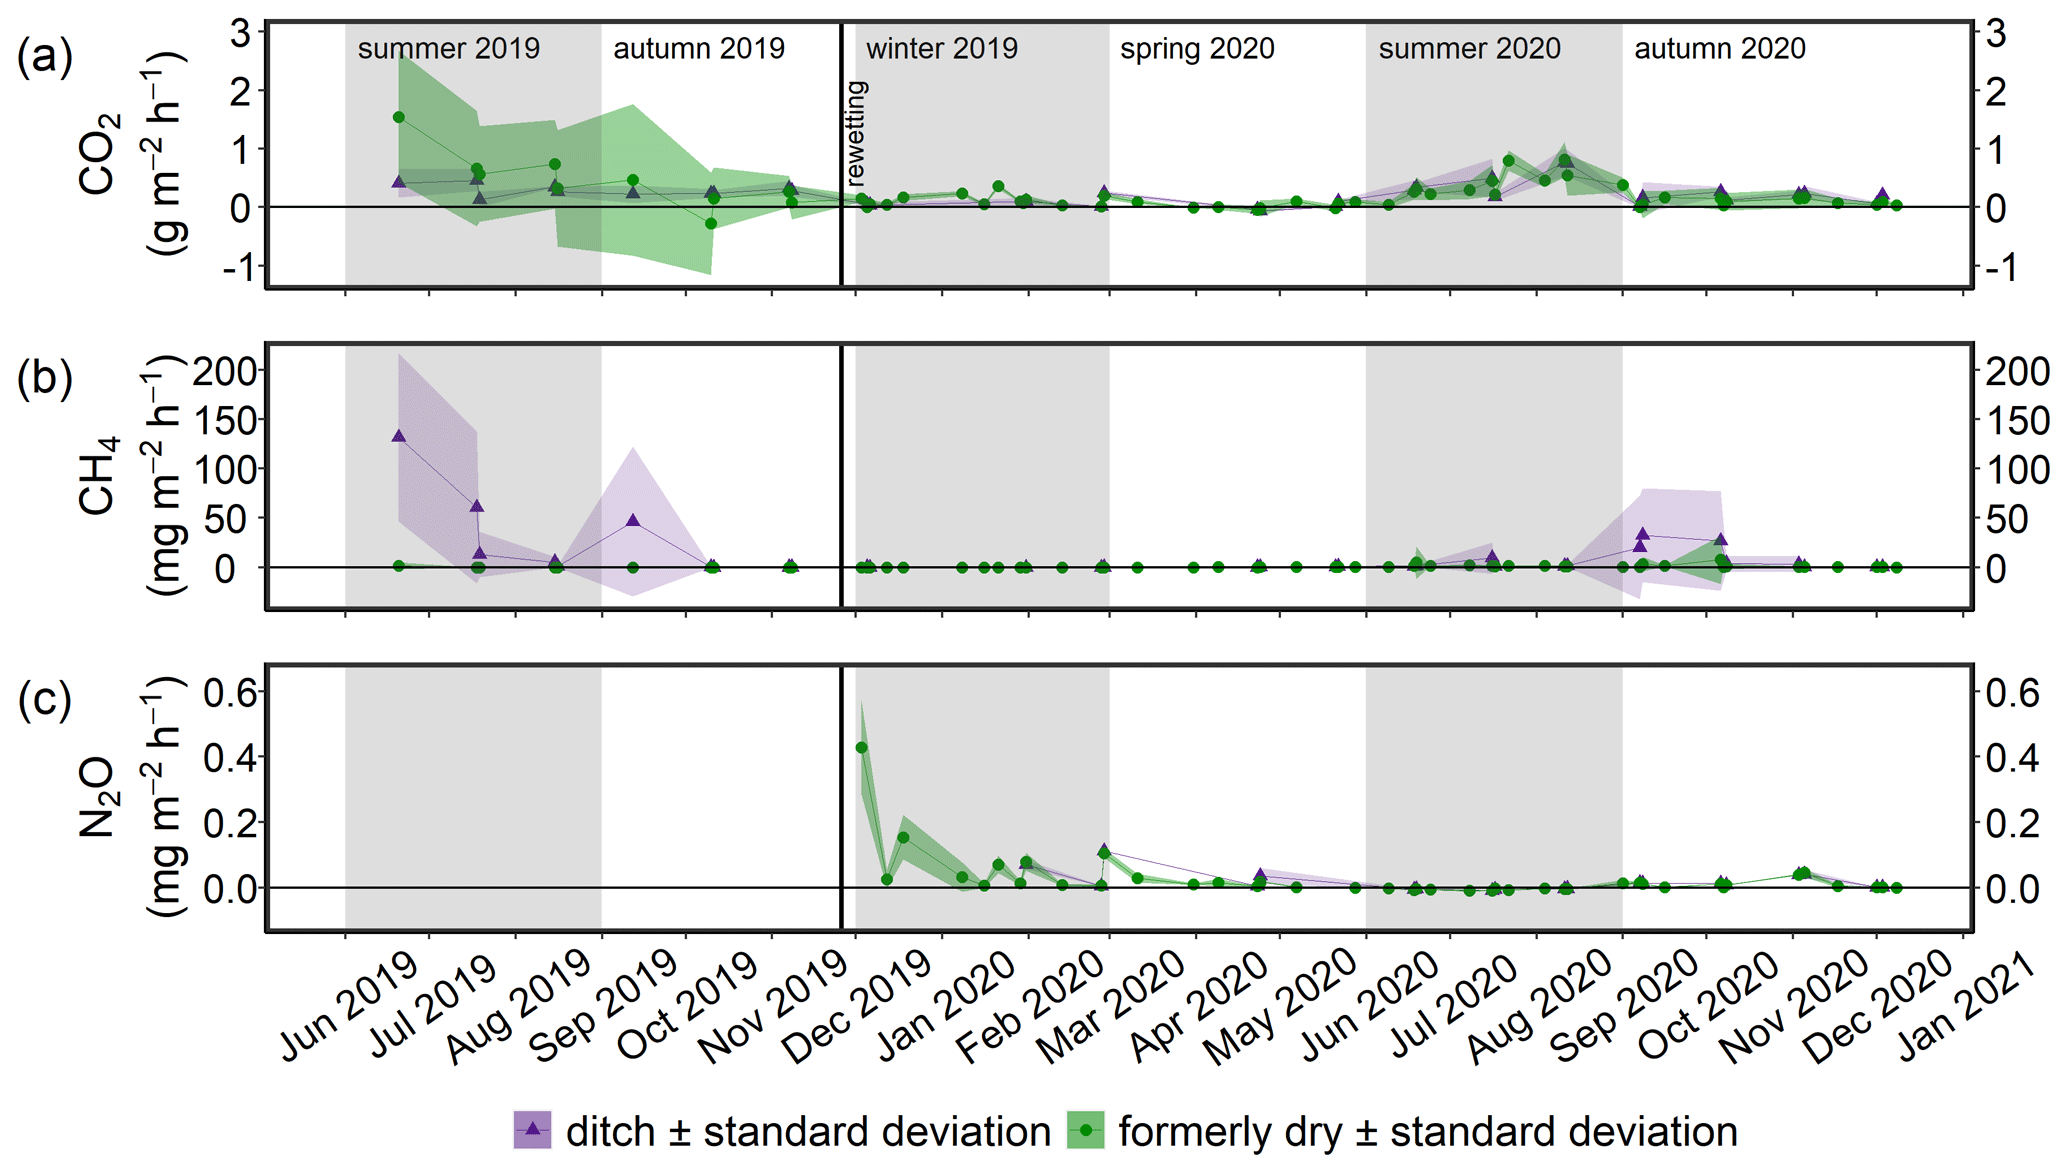
Figure 8Time series of the mean (a) CO2, (b) CH4, and (c) N2O fluxes (± standard deviation) from June 2019 to December 2020. Fluxes of the permanently wet drainage ditch are shown in purple and those derived from the two methods employed in this study in green. The vertical black line indicates the rewetting event.
4.1 Nutrient dynamics and export
The seasonal dynamics of the nutrients followed a typical course over the year. Thus, after rewetting, NH, NO, and NO concentrations in the water column were high in winter and autumn, which is typically due to the mineralization of OM followed by nitrification (Voss et al., 2010). By contrast, the low DIN concentrations during spring and summer reflected the consumption of nutrients by plants and phytoplankton. The very high chlorophyll a concentration (up to 125 µg L−1) in the peatland indicated the presence of a highly phototrophic community, likely driven by the higher availability of nutrients compared to the inner bay. Due to these distinct seasonal differences with the lowest nutrient concentrations in spring and summer, a rewetting within these seasons would probably be more beneficial to reduce a potential nutrient export into the inner bay, at least during the first few months after rewetting.
To assess whether the flooded peatland served as a nutrient source for the inner bay, nutrient concentrations of the peatland were compared with those of the inner bay and of an unaffected monitoring station (central bay) and showed generally higher mean concentrations. Due to drainage, the mineralization of upper peat layers can lead to an accumulation of nutrients within the soil (Zak and Gelbrecht, 2007; Cabezas et al., 2012). After rewetting, nutrient concentrations in the porewater and ultimately in the overlying water increase (van de Riet et al., 2013; Harpenslager et al., 2015; Zak et al., 2017). The leaching of nutrients is driven by concentration differences across the soil–water interface, but it is also dependent on factors such as salinity (Rysgaard et al., 1999; Steinmuller and Chambers, 2018), the oxygen availability in the soil (Lennartz and Liu, 2019), and the effects of the latter on microbial processes (Burgin and Groffman, 2012), as well as on the degree of peat decomposition (Cabezas et al., 2012). For instance, highly degraded peat, such as at our study area, can store and release more nutrients than less degraded peat (Cabezas et al., 2012), meaning that the highly degraded peat of our study area was prone to leaching high amounts of nutrients. Occasional measurements of porewater nutrient concentrations in the peat of our study area revealed DIN and PO concentrations up to 1 order of magnitude higher than those in the surface water (Anne Breznikar, unpublished data), providing further support for the leaching of nutrients out of the peatland and into the inner bay.
The estimated annual nutrient exports (mean ± 95 % confidence level) from the peatland of 10.8 ± 17.4 t yr−1 DIN-N and 0.24 ± 0.29 t yr−1 PO4-P (peatland/inner bay) and 33.8 ± 9.6 t yr−1 DIN-N and 0.09 ± 0.32 t yr−1 PO4-P (peatland/central bay) were high, given the small size of the flooded peatland (∼ 0.5 km2 at 0 m a.s.l.). For comparison, the Warnow, a small river that flows into the Baltic Sea near the city of Rostock, Mecklenburg-Vorpommern, draining an area of ∼ 3300 km2, had a mean annual DIN-N and PO4-P export of 1200 ± 500 and 19.9 ± 7.6 t yr−1, respectively, over the last 25 years (HELCOM, 2019). Therefore, the total nutrient export from the flooded peatland to the inner bay and to the central bay in the first year after rewetting accounted for ∼ 1 % and ∼ 3 %, respectively, of the annual DIN-N and PO4-P loads of the Warnow. When normalized to the same dimensions, our study area exported 21.6–67.6 t DIN-N km−2 yr−1 and 0.18–0.48 t PO4-P km−2 yr−1, whereas the Warnow exported only 0.36 t DIN-N km−2 yr−1 and 0.01 t PO4-P km−2 yr−1.
However, we also want to briefly address the reasons for the high uncertainty range of our calculated nutrient exports. First, they derive from high fluctuating nutrient concentrations in the surface water within the seasons. This is also visible in the high standard deviations (Table 2). Therefore, the 95 % confidence level of the nutrient exports is high and reflects the natural dynamic. Second, we conducted default error propagation during the export calculation which leads to even higher ranges on top of the high natural dynamic.
Compared to the Warnow river, it is noticeable that the range of uncertainties is highly different for the two sources. While our uncertainties are mostly higher and in the same order of magnitude compared to the means, the uncertainties in the river data are 1 order of magnitude lower. This is likely due to the different timescales of the two data sets. Our export data were generated by taking only the first post-rewetting year into account in which the system was still in a transition state and, thus, very dynamic nutrient concentrations were found. The uncertainties in the river exports were generated by using 25 years of data, leading to lower uncertainties than using data from only 1 year, and they were calculated as the standard deviation and not as 95 % confidence level, as was done for the exports of our study site. Therefore, this has to be considered when their uncertainty ranges are compared directly. Nevertheless, our results highlight the importance of currently still-unmonitored and small, independent draining areas along the coastline of the Baltic Sea, in particular those that become intentionally flooded (HELCOM, 2019).
4.2 Assessment of the GHG dynamics
4.2.1 CO2
The carbon system in our study area is governed by a variety of processes (e.g., Wolf-Gladrow et al., 2007; Kuliński et al., 2017; Schneider and Müller, 2018). CT and AT were transported with the brackish water from the central bay and ultimately from the Arkona Basin. Additional alkalinity can be added either by a supply of freshwater, which in the southwestern Baltic Sea is characterized by higher alkalinities than the brackish or even saltwater endmember (Beldowski et al., 2010; Müller et al., 2016), or can be introduced by mineralization processes from the seafloor in the inner bay and the flooded peatland. Primary production (i.e., carbon fixation) will decrease CT, lower the pCO2, and increase pH during the formation of organic matter. The mineralization of OM from various sources (new primary production, mineralization of the inundated former vegetation, and from the underlying peat) will enhance CT and AT concentrations, increase pCO2, and decrease pH. Air–sea exchange during our study is fostered by a pCO2 that is above atmospheric levels throughout the year, except for a short period in spring in the inner bay and the peatland, where outgassing of CO2 occurred, resulting in lower pCO2 and a decrease in CT.
We observed the following three main developments in the surface water CO2 system and air–sea flux pattern: (i) in winter 2019/2020, the CO2 system hardly differed between the peatland and the inner bay; (ii) from spring to autumn, there were significant differences in the CO2 system between the peatland and the inner bay, with higher pCO2, CT, and AT values and lower pH in the peatland coinciding with an enrichment in chlorophyll a; and (iii) overall, the first post-rewetting year showed sustained high but less variable CO2 fluxes compared to pre-rewetting conditions. In the following, we will discuss these three observations and put them into context.
Initial post-rewetting CO2 dynamics
The first weeks after the rewetting were characterized by high nutrient concentrations, a continuous increase in AT, CT, and pH and a decrease in pCO2 (Figs. 4, 6, 7). The increase in CT and AT coincided with a steady increase in salinity (Fig. 3), which is in line with a general increase in AT with increasing salinity that is known for the western Baltic Sea (e.g., Kuliński et al., 2022).
Still, the AT values at the given salinity were higher in the inner bay and the peatland than would be expected from a linear AT–S relationship found for surface waters in the open Baltic Sea from the central Gotland sea to the Kattegat (Beldowski et al., 2010; Müller et al., 2016). Thus, the high AT in the inner bay and peatland were likely associated with local carbonate (CaCO3) weathering from terrestrial sources and/or a transport by groundwater (Schneider and Müller, 2018). CT and AT values during this period were consistently higher by ∼ 70–80 µmol kg−1 in the peatland than in the inner bay, consistent with enhanced leaching from the recently inundated peat. Besides, local CaCO3 weathering and local anoxic processes, such as SO reduction, may have increased the AT in the submerged soil and finally contributed to higher AT values compared to the inner bay.
The oversaturation in pCO2 and potentially the excess leaching of alkalinity from the soil might have contributed to the decrease in pCO2 and increase in pH in the peatland in winter 2019/2020. This was apparently reinforced by a short episode of primary production between the middle and end of January, indicated by a steeper decline in the pCO2 and a steeper pH increase. This coincided with a short increase in chlorophyll a (∼ 30 µg L−1) and a slight intermittent increase in the surface water temperatures (Fig. 3). This short, unusually early productive period might have resulted from the high nutrient availability induced by the rewetting of the peatland (Sect. 3.2.1), in particular the high NH levels, which simultaneously showed a sharp intermittent minimum.
The predominance of production and mineralization shaped the productive period (spring to autumn)
In late winter and the first half of spring, pCO2 continuously decreased in the peatland and in the inner bay. The lowest pCO2 was measured between March and May and coincided with enhanced chlorophyll a concentrations and a high availability of nutrients in the peatland and in the inner bay, which decreased until mid-spring. This resulted in a slight CO2 uptake in the peatland of −0.005 g m−2 h−1 for a short period of time, so that spring was the only season in which pCO2 was, on average, below atmospheric concentrations in the inner bay (Fig. 8). This finding can be attributed to the onset of the productive period, at still-moderate surface water temperatures below 10 ∘C until mid-April. During this period, productivity clearly exceeded mineralization, as suggested by the decreasing pCO2 and increasing pH, despite rising temperatures, and increasing O2 oversaturation in the surface waters. These trends were slightly more pronounced in the peatland than in the inner bay, in accordance with higher nutrient concentrations available for production.
From mid-spring until late summer, the peatland was characterized by increased pCO2 and a variable CO2 system together with high mean chlorophyll a concentrations of up to 106.0 µg L−1. N nutrients were very low, and the system was clearly nitrogen limited, with only slightly elevated NH concentrations in late summer (Figs. 3, 4). Furthermore, the O2 saturation shifted from over- to undersaturated conditions. These observations suggest that the peatland and the inner bay were characterized by simultaneous production and mineralization processes from mid-spring until autumn that kept the N nutrients (except for PO) low. Mineralization of OM in the water column, sediment, and soil dominated over production, leading to the observed high pCO2, lowered pH, and enhanced AT and CT concentrations. Mineralization during this period was more pronounced in the peatland than in the inner bay, leading to the higher pCO2, AT, and CT values in the peatland, and a stronger and more pronounced reduction in the pH. This stronger mineralization, in particular in the warm summer months, also led to higher DOC concentrations in summer, with a maximum in June/July coinciding with maximum surface water temperatures. The enhanced mineralization in the peatland was likely fueled by higher OM availability from high decomposition rates of fresh plant substrate from inundated plant residuals (Glatzel et al., 2008; Hahn-Schöfl et al., 2011). In addition, aerobic and anaerobic oxidation of CH4, which was produced in anoxic zones, might have led to increased CO2 production, especially during increased water temperatures (e.g., Treude et al., 2005; Dean et al., 2018), due to the availability of SO and O2.
The calculated AT (from CT and pH) in the peatland was consistently lower than the measured AT, with a difference in the range of 55–122 µmol kg−1 and thus of 2.7 %–4.7 % (data not shown). This difference was higher than in the Baltic Sea, where the contribution of organic AT is estimated to be 1.5 %–3.5 % (Kuliński et al., 2014). Due to closer vicinity to the coast and the high amount of degradable OM, this higher contribution of organic AT was to be expected. The highest discrepancy between measured AT values and those calculated from pH and CT occur in early summer, simultaneous with the highest values in DOC, in particular in the peatland (Fig. 3). This suggests that the organic AT related to the occurrence of DOC (and thus dissolved organic matter, DOM), contributed to the excess of AT. The higher DOM formation in summer in the peatland might partly explain the difference in AT between the inner bay and the peatland.
Brackish water flooding caused sustained high, but less variable, CO2 fluxes
The amplitude of the CO2 fluxes from formerly drained parts of the study area decreased after rewetting with brackish water, while the amplitude of CO2 fluxes from the ditch (inundated after flooding but with deeper, probably incompletely exchanged water) did not differ strongly before and after rewetting (Fig. 8). An increased water table is the main driver for the reduction in CO2 emissions on formerly drained locations. A similar scenario has been reported for terrestrial sites (Bubier et al., 2003; Strack, 2008). In a nearby coastal peatland, both photosynthesis and ecosystem respiration were strongly reduced after rewetting (Koebsch et al., 2013). The rewetting of our study area probably caused a die-back of the highly productive grassland vegetation, which most likely led to a reduction in the CO2 flux amplitude.
Average summer/autumn CO2 fluxes after rewetting had a mean of 0.26 ± 0.29 g m−2 h−1 and thus remained relatively high compared to those fluxes from 2019. They were also higher than the fluxes determined in studies of shallow coastal or near-shore waters in the northwestern Bornholm sea, of up to 0.01 g m−2 h−1 (Thomas and Schneider, 1999), or the Bothnian Bay, of around ∼ 0.0007 g m−2 h−1 (Löffler et al., 2012). In a nearby coastal fen recently influenced by brackish water inflow, ecosystem respiration was 2 orders of magnitude lower (Koebsch et al., 2020) compared to our study site, where the ongoing decomposition of submerged substrate from plant residuals and the fresh soil may have fueled the continuously high CO2 fluxes in the first year after rewetting (Hahn-Schöfl et al., 2011). The mineralization of OM from primary production driven by the high initial nutrient availability, and aerobic and anaerobic oxidation (Dean et al., 2018) of easily degradable substrates or CH4, might have additionally contributed to these CO2 fluxes. We expect that CO2 emissions will further decrease, likely because substrates become exhausted, and a novel ecosystem will be established (Kreyling et al., 2021), with developing algae fostering CO2 fixation.
4.2.2 CH4
We observed the following three main developments in surface water methane concentrations and flux patterns: (i) a short-term, very moderate increase in CH4 concentrations directly after rewetting in winter 2019/2020, (ii) an increase in the CH4 concentrations, mainly from spring to autumn, that was significantly higher and more variable in the peatland than in the inner bay and correlated with water temperature, and (iii) in the first year after rewetting, much lower CH4 fluxes than reported for nearby peatlands rewetted by freshwater. These three observations are discussed and put into context in the following.
Short-term, moderate increase in the CH4 concentrations in the winter after rewetting
The measurements in winter, immediately after rewetting, showed a short-term but moderate increase in the CH4 concentrations (Fig. 7). The rewetting resulted in the inundation of the degraded peat and the remaining vegetation. Therefore, it is assumed that methanogenesis was not limited by the availability of high-quality OM, which is often a major controlling factor (Heyer and Berger, 2000; Parish, 2008) and likely originated from the decomposition of the residual plant material. However, since CH4 concentration remained low, a temperature control is assumed, which has been frequently described in the literature. A major control of temperature has been reported, for example, for a nearby shallow coastal area of the Baltic Sea, between the islands of Rügen and Hiddensee, where low CH4 emission rates and variability were found together with low temperatures (Heyer and Berger, 2000).
The rewetting transported water with a salinity of 6–7.4 into the peatland, such that there were no significant differences in salinity compared to the inner bay in winter (the same as for temperature; Table 2). Thus, sulfate reached the peatland immediately after rewetting. As a terminal electron acceptor (TEA), SO promotes the activity of sulfate-reducing bacteria (SRB), which outcompete methane-producing microorganisms (methanogens) for substrates (Segers and Kengen, 1998; Jørgensen, 2006; Segarra et al., 2013). This process was shown to play an important role in flat brackish water systems (e.g., Heyer and Berger, 2000). The availability of other TEAs, such as NO that had high concentrations of ∼ 100 ± 58 µM in our study, could have further suppressed methanogenesis (Table 2; Jørgensen, 2006). Beside competitive mineralization, aerobic and anaerobic CH4 oxidation may have reduced the CH4 concentrations (Heyer and Berger, 2000; Reeburgh, 2007; Knittel and Boetius, 2009; Steinle et al., 2017), supported by the effective exchange of water masses. Overall, the rewetting with brackish water during the cold winter season apparently inhibited methanogenesis and/or facilitated effective CH4 oxidation, resulting in low CH4 concentrations and a small CH4 flux into the atmosphere.
Increased and variable CH4 concentrations during the vegetation period
The temperature increase from spring to autumn was accompanied by elevated, albeit variable, CH4 concentrations. Temperature is of crucial importance for controlling the CH4 cycle in shallow coastal brackish water (Bange et al., 1998; Heyer and Berger, 2000) and in the North Sea (e.g., Borges et al., 2018). Similar relationships have been described for wetlands, e.g., for permanently inundated wetlands (e.g., Koebsch et al., 2015) and in a peatland close to our study site during the first year after rewetting (Hahn et al., 2015). Accordingly, CH4 concentrations in the peatland (rs=0.75; n=74; p<0.05) and the inner bay (rs=0.55; n=29; p<0.05) also correlated significantly and positively with temperature. In the study of Heyer and Berger (2000), the temperature range influenced the temporal variability in CH4 emissions, which were highest in late spring. Since the temperature range in the peatland of our study was variable (e.g., maximum difference of ∼ 6 ∘C between samplings), with the highest values between spring and autumn (7.4–23.1 ∘C), this variability may have strongly contributed to the observed CH4 dynamics.
The peatland and the inner bay were clearly influenced by the same hydrographic conditions, evidenced by their very similar salinities and temperatures. However, the peatland showed higher CH4 concentrations from spring to late autumn, likely due to the high availability of OM, as described by Heyer and Berger (2000) and Bange et al. (1998). Incubation experiments of a degraded fen grassland demonstrated the accumulation of fresh plant litter in a new sediment layer after flooding that resulted in high rates of CH4 and CO2 production (Hahn-Schöfl et al., 2011). A further potential driver of OM availability is the sedimentation of freshly produced OM originating from primary production, as described for shallow areas in the Baltic Sea (Bange et al., 1998) and for a shallow bight in the North Sea, which in the latter led to a yearly peak in the seasonal CH4 cycle (Borges et al., 2018). Although our observations were not made in OM-poor sediments, an impact of freshly produced OM on enhanced CH4 concentrations in the OM-rich Drammendorf peatland is possible, given the significant positive correlation of the surface CH4 concentrations and the chlorophyll a concentration (rs=0.41; n=56; p<0.05).
Brackish water rewetting and low CH4 emissions
Despite the high surface water CH4 concentrations in the peatland and their inter-seasonal and spatial variability, rewetting with brackish water resulted in CH4 emissions being considerably lower than those from temperate fens rewetted with freshwater, where CH4 emissions strongly increased (Augustin and Chojnicki, 2008; Couwenberg et al., 2011; Hahn et al., 2015; Franz et al., 2016; Jurasinski et al., 2016).
At our study site, although average CH4 fluxes on formerly terrestrial locations increased significantly by 1 order of magnitude after rewetting, the overall increase from 0.13 ± 1.01 to 1.74 ± 7.59 mg m−2 h−1 (Fig. 8) was lower than that reported for freshwater rewetted fens under similar climatological boundary conditions (e.g., Hahn et al., 2015; Franz et al., 2016). Even several years after rewetting, the annual CH4 budgets of a shallow lake on a formerly drained fen varied between 13.2 and 52.6 g m−2 yr−1 (Franz et al., 2016), which corresponds to approximately 1.5 to 6.0 mg m−2 h−1. Our CH4 fluxes were also lower than the emissions reported from coastal near-shallow waters of the Baltic Sea, where fluxes of 39.9–104.2 mg m−2 h−1 were measured in June/July (Heyer and Berger, 2000). For the same months, mean CH4 fluxes at the formerly dry stations in our study site were 0.5–4.9 mg m−2 h−1. However, compared to CH4 fluxes from continental shelves (0.015–0.024 mg m−2 h−1; adapted from Bange et al., 1994), the fluxes of our study site were 2 orders of magnitude higher. Despite the low average fluxes, emission peaks could be distinguished with the highest flux from the now inundated ditch of 149.2 mg m−2 h−1 in September 2020 and 108.3 mg m−2 h−1 in October 2020. While these values were still lower than the maximum value of 243.0 mg m−2 h−1 reported by Heyer and Berger (2000), it is important to stress that our study site was already a source of CH4 in its drained state, especially within the drainage ditch, where CH4 fluxes were comparable to the ∼ 0.2 mg m−2 h−1 reported from undrained fens (Danevèiè et al., 2010).
The lower CH4 emissions of the brackish rewetted Drammendorf peatland might be attributed to the availability of TEAs, especially SO, which (1) may have contributed to a suppression in methanogenesis by competitive inhibition (Segers and Kengen, 1998; Jørgensen, 2006; Segarra et al., 2013) or (2) fostered the anaerobic oxidation of methane (AOM) as an effective pathway to reduce CH4 emissions and by (3) fast aerobic CH4 oxidation mediated by oxygen-rich water. The high variability in CH4 concentrations may also be related to changing rates of AOM, as the process is sensitive to the introduction of O2 mediated by sporadic wind-driven resuspension (Treude et al., 2005). Since our study area was shallow and likely experiences regular wind-driven resuspension, spatially and temporally dynamic AOM can be assumed. The low CH4 fluxes suggested that effective aerobic and anaerobic oxidation of CH4 likely occurred. Moreover, higher CH4 concentrations in the peatland compared to the inner bay in combination with the high lateral water exchange due to frequent changes in the water level (Fig. A3) might have driven a net advective export of CH4-enriched water to the inner bay. This would have further contributed to the low peatland CH4 emissions and the observed high variability.
While CH4 production and emission were likely prevented by rewetting with oxygen-rich, sulfate-containing brackish water, the possibility remains that the total CH4 release was underestimated by insufficient accounting for ebullition. In the marine environment, bubble-mediated transport is attributed to gassy sediments and an effective mechanism of vertical CH4 migration (e.g., Borges et al., 2016). Although neither of the methods used to determine CH4 fluxes specifically account for ebullition, we estimated that 6.9 % of all analyzed chamber-based fluxes were partly bubble influenced. We estimated this percentage by counting the measurements which showed irregular data points in graphical depiction but did not influence the linear slope. We observed further that, in another 9.6 % of the chamber-based flux measurements, the CH4 concentration patterns indicated ebullition (flux measurements with exponential slope, which was clearly steeper than the linear regression of the majority of data points), but these were not accounted for in the final calculations of diffusive fluxes. Thus, given that only 16.5 % of the chamber-based flux measurements indicated bubble-mediated CH4 transport, and in almost half of those cases, the resulting perturbation was small and was included in the flux amplitude, the magnitude of the ebullition-driven underestimation of our flux estimates is considered to be small.
In summary, the increase in CH4 concentrations after rewetting in winter was small, short-lived, and associated with the die-back of plants. CH4 fluxes in the first year after rewetting remained relatively low and were lower than typical of post-rewetting conditions. They also followed a seasonal pattern common for shallow organic-rich systems, with a strong correlation with temperature in spring and summer. We anticipate that continuing reduction in OM availability after the initial die-back of vegetation will likely lead to a further decrease in CH4 emissions in subsequent years.
4.2.3 N2O
The rewetted peatland was a source of N2O in the first year after rewetting, although the mean annual N2O flux of 0.02 ± 0.07 mg m−2 h−1 was very low (Fig. 8). This was expected since a permanent inundation leads to anoxic conditions in the peat, preventing the production of N2O by nitrification, in addition to denitrification, due to the lack of NO (e.g., Succow and Joosten, 2001; Strack, 2008). However, the range of post-rewetting N2O fluxes in the first 3 months (winter) was clearly much larger than during the rest of the year, which indicated that N2O was strongly and immediately affected by the rewetting, as shown elsewhere (Goldberg et al., 2010; Jørgensen and Elberling, 2012). The highest N2O flux (0.4 mg m−2 h−1) and the highest NH concentration (78.0 µM) was measured 1 week after rewetting and a significant positive correlation between these two variables was found in winter (rs=0.61, n=45, p<0.001). Additionally, N2O had a significantly positive correlation with NO in winter (rs=0.46, n=45, p<0.01), whereas no correlation with NO was found. The accumulation of N2O, and also of NO and NO, can generally be interpreted as a result of shifting O2 conditions in the freshly inundated ecosystem, such that incomplete process chains of, for example, nitrification and denitrification were favored (Rassamee et al., 2011). However, it seems likely that the high N2O concentrations in winter originated from nitrification due to the correlations of N2O with its substrate (NH) and its main accumulating intermediate product (NO), in addition to a trend of increasing NO concentrations throughout the winter.
During late spring and early summer, an undersaturation of the surface water with N2O, compared to the atmosphere, pointed to consumption within suboxic/anoxic zones of the peat. Consumption in the surface water was unlikely because anoxic conditions were never found near the peat surface. The undersaturation of N2O a few months after rewetting evidenced the change in O2 conditions in the peat, from oxic to hypoxic/anoxic, turning the rewetted peatland into an N2O sink, at least temporarily. This change was likely driven by the higher availability of fresh OM (measured as chlorophyll a) in the peatland compared to the inner bay, finally leading to significantly lower N2O concentrations in the peatland in summer (p<0.001; Table 2).
Previously reported N2O fluxes in drained peatlands range from 0.002 to 0.45 mg m−2 h−1, with a clear trend towards higher fluxes in fertilized or naturally N-rich areas (Flessa et al., 1998; Glatzel and Stahr, 2001; Augustin, 2003; Strack, 2008; Minkkinen et al., 2020). Augustin et al. (1998) examined multiple degraded fens in Mecklenburg-Vorpommern and Brandenburg (Germany) and calculated N2O fluxes of 0.04 to 0.10 mg m−2 h−1 in extensively and intensively used fen grasslands, respectively (Augustin et al., 1998). N2O fluxes in drained peatlands result from a low water level which allows the permanent penetration of atmospheric oxygen into the peat to fuel N2O-producing processes that are dependent on oxygen (Martikainen et al., 1993; Regina et al., 1999). As the water level in our study site was permanently below the soil surface before rewetting, it is likely that the drained peat was a source of N2O. The mean post-rewetting N2O flux determined in our study area (0.02 ± 0.07 mg m−2 h−1) is in the lower range of reported fluxes from drained peatlands. Therefore, as shown in other studies (Succow and Joosten, 2001; Minkkinen et al., 2020), the rewetting probably led to a reduction in N2O fluxes, since they were likely high before the rewetting.
In general, the N2O fluxes in rewetted peatlands are in the same range as fluxes from pristine ones (Minkkinen et al., 2020), indicating that rewetting is a very effective measure to reduce N2O emissions to natural levels. The literature values range from up to 0.01–0.02 mg m−2 h−1, for rewetted and undrained boreal peatlands (Minkkinen et al., 2020), respectively, to 0.08 mg m−2 h−1, for a rewetted riparian wetland near a freshwater meadow (Kandel et al., 2019). Although it is difficult to compare the N2O fluxes determined in this study with those from other sites with different salinity, hydrology, and history of use, our mean annual post-rewetting value is in the lower range of N2O fluxes previously reported for rewetted and pristine peatlands.
The effects of rewetting a drained coastal peatland with brackish water in winter and the subsequent formation of a permanently inundated area were studied over 1 year.
We found a strong pulse of DIN leaching out of the peat, followed by the transport of DIN into the inner bay that resulted in a high export, especially in winter, when compared to the Warnow, a nearby river. However, due to a rapid decrease in nutrient concentrations in spring, the nutrient export after a rewetting in spring or summer would likely be lower compared to rewetting in winter, at least during the first few months thereafter.
Furthermore, CO2 concentrations and emissions seem to remain relatively high after the rewetting with brackish water compared to the dry conditions before rewetting. This was likely driven by the high OM availability from the residual vegetation and also by the high rate of primary production in the water column. However, the flux amplitude decreased after rewetting and, thus, peak emissions during the vegetation period were prevented. The lack of a strong increase in CH4 emissions in the first year after rewetting with brackish water, in contrast to nearby areas rewetted with freshwater, suggests that especially during the colder months, rewetting with brackish water or seawater would minimize CH4 emissions and thus maximize the effect on integrated GHG emission reduction. Moreover, a rapid elevation of the water level, which occurred at our study site, will promote the oxidation of peat-derived CH4 in the water column. Future CH4 emissions will depend on processes, such as the development of vegetation, and will likely decrease. According to the literature, dry peatlands were found to be rather large sources of N2O due to their drainage for agricultural use. However, the permanent inundation of our study site led to a rapid decrease in N2O emissions and converted the peatland into a N2O sink during summer, with fluxes similar to pristine peatlands.
With the ongoing formation of salt grass meadows, livestock farming at our study area can and will continue. However, the area's use has not hindered its positive development towards an ecosystem with the potential to eventually become a carbon and nutrient sink in the future. We expect that both the nutrient export and GHG emissions will slowly decrease due to a shrinking reservoir of substrates. Nonetheless, because degraded peat is both nutrient- and OM-enriched, this decrease will occur slowly, given that the topsoil was not removed prior to flooding to diminish nutrients and OM, as was demonstrated by other studies. Whether or not the area will act as a C sink in the future depends on the success and speed of the establishment of vascular vegetation and its burial in the anoxic parts of the sediment.
Nutrient export from peatlands and the re-establishment of the nutrient and C sequestration functions of highly degraded coastal peatlands after rewetting are complex processes whose elucidation requires long-term investigations. The pronounced seasonal dynamics highlight the need for approaches that include a high temporal resolution, such as that achieved with sensor-based or eddy-supported measurements.
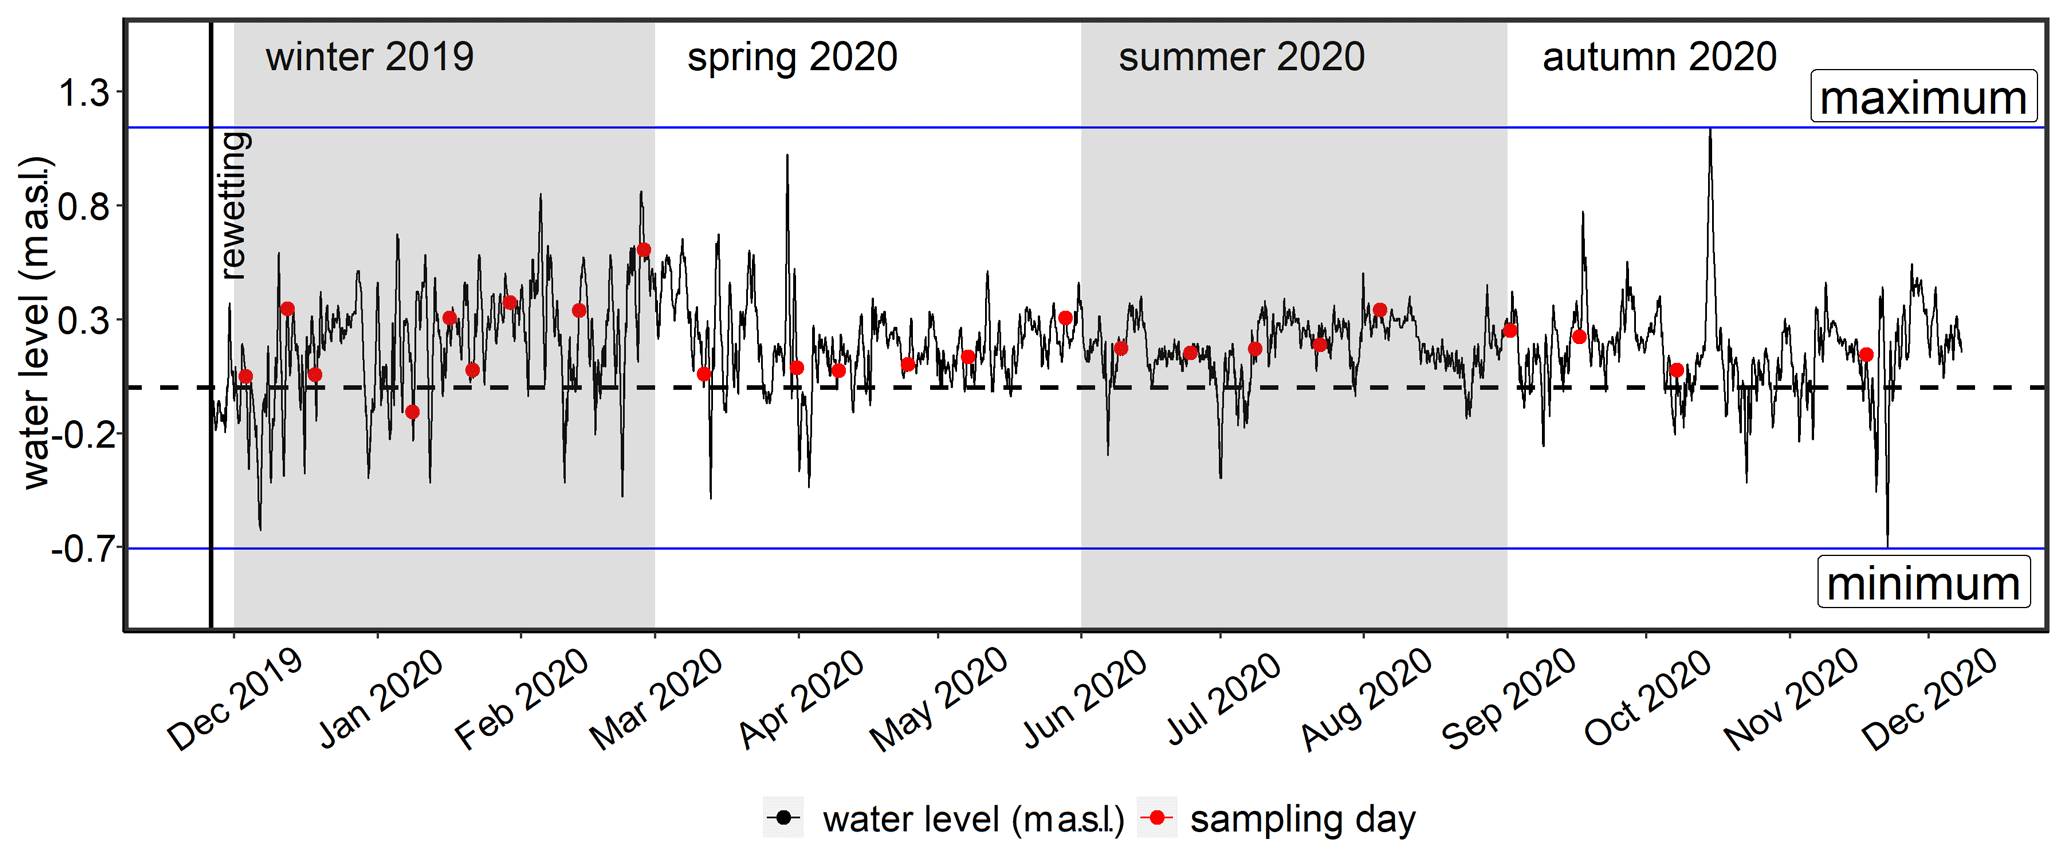
Figure A1Water level data from the monitoring station Barhöft (Wasserstraßen- und Schifffahrtsamt Ostsee), representing the Kubitzer Bodden, from the beginning of rewetting (26 November 2019) until the end of the investigation period. The red dots indicate the sampling days. The dashed horizontal line represents 0 m a.s.l. The minimum and maximum water levels of the investigation period are shown by the blue horizontal lines (−0.7 and 1.1 m a.s.l., respectively). See also Figs. A2 and A3.
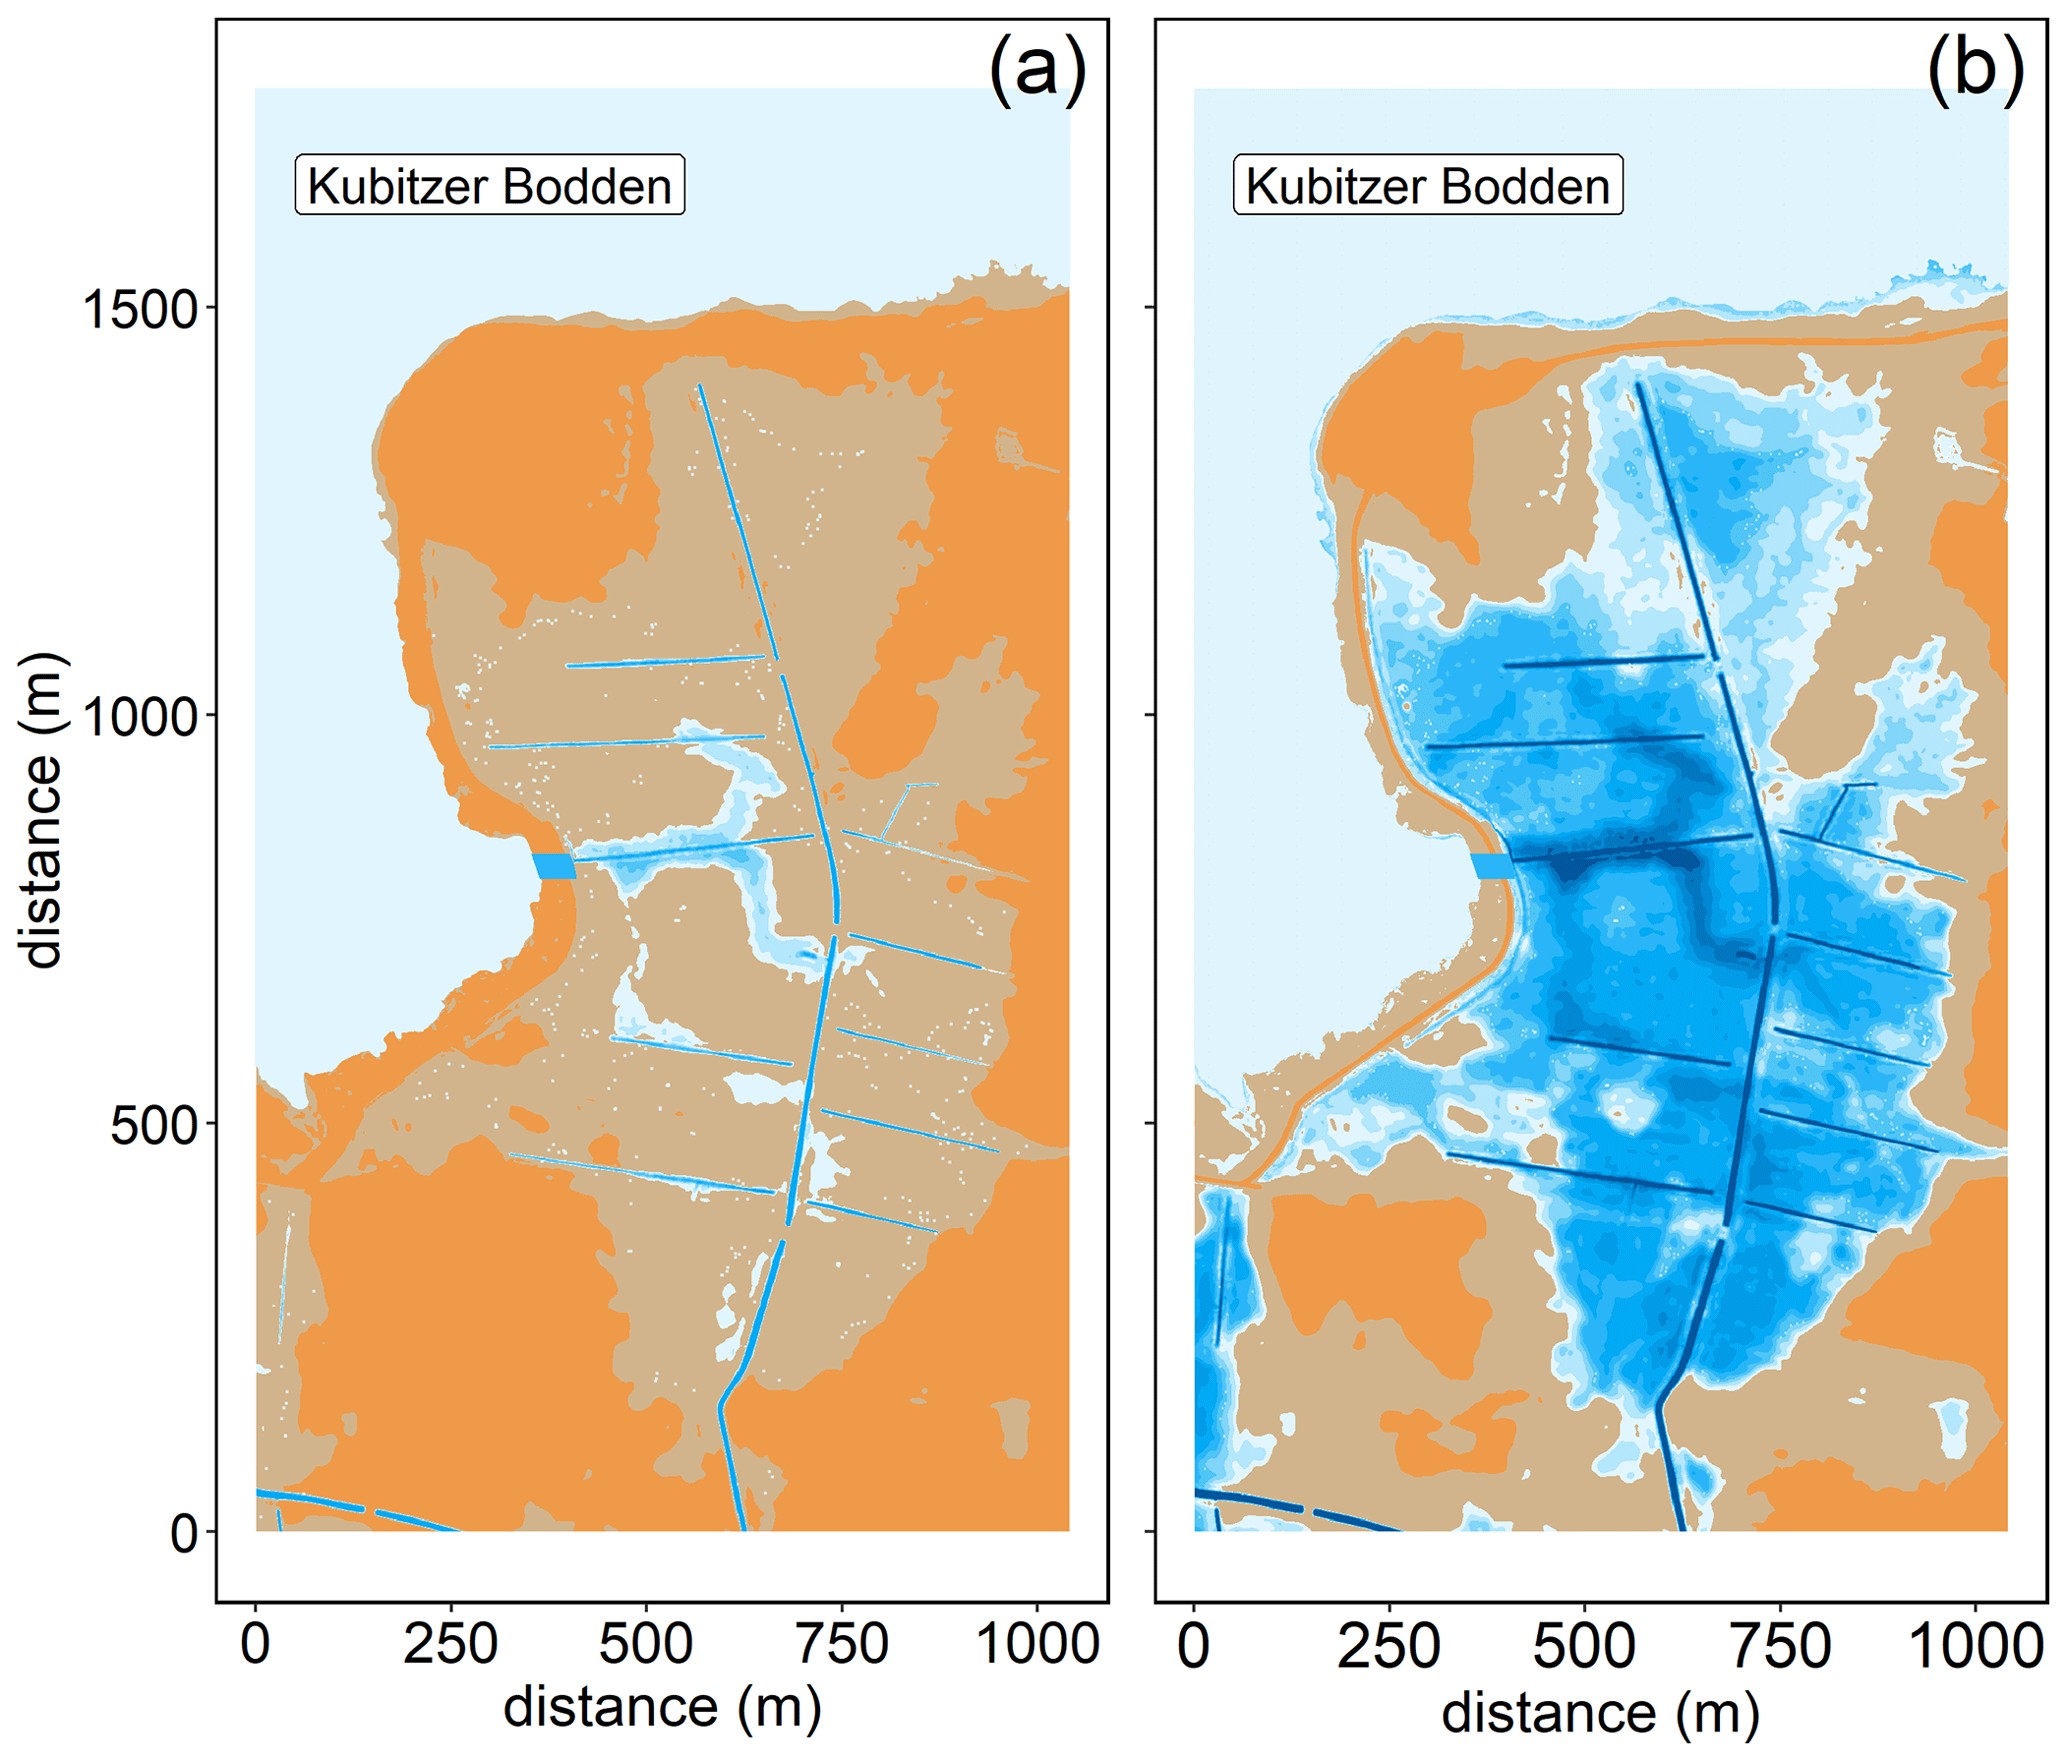
Figure A2The changing water level and its effect on the water coverage of the study area is shown for (a) −0.5 m a.s.l. and (b) 0.5 m a.s.l. Topography data are retrieved from the Landesamt für innere Verwaltung Mecklenburg-Vorpommern, Amt für Geoinformation, Vermessungs- und Katasterwesen, Fachbereich Geodatenbereitstellung.

Figure A3Hypsographic curve of the study area in increments of 0.1 m. The red dots represent the observed range of the water level during the study. For a water level time series during the sampling period, see Fig. A1.
Table B1Mean seasonal water volume exchanges (; m3 s−1) and nutrient masses (kg m−3) in the inner bay (cIB), central bay (cCB), peatland (cpeatland), and the resulting net nutrient transport (NNT; in tonnes) for DIN-N and PO4-P. Negative values of NNT indicate an export from the peatland into the inner bay/central bay, and vice versa. All errors are given as the 95 % confidence level.
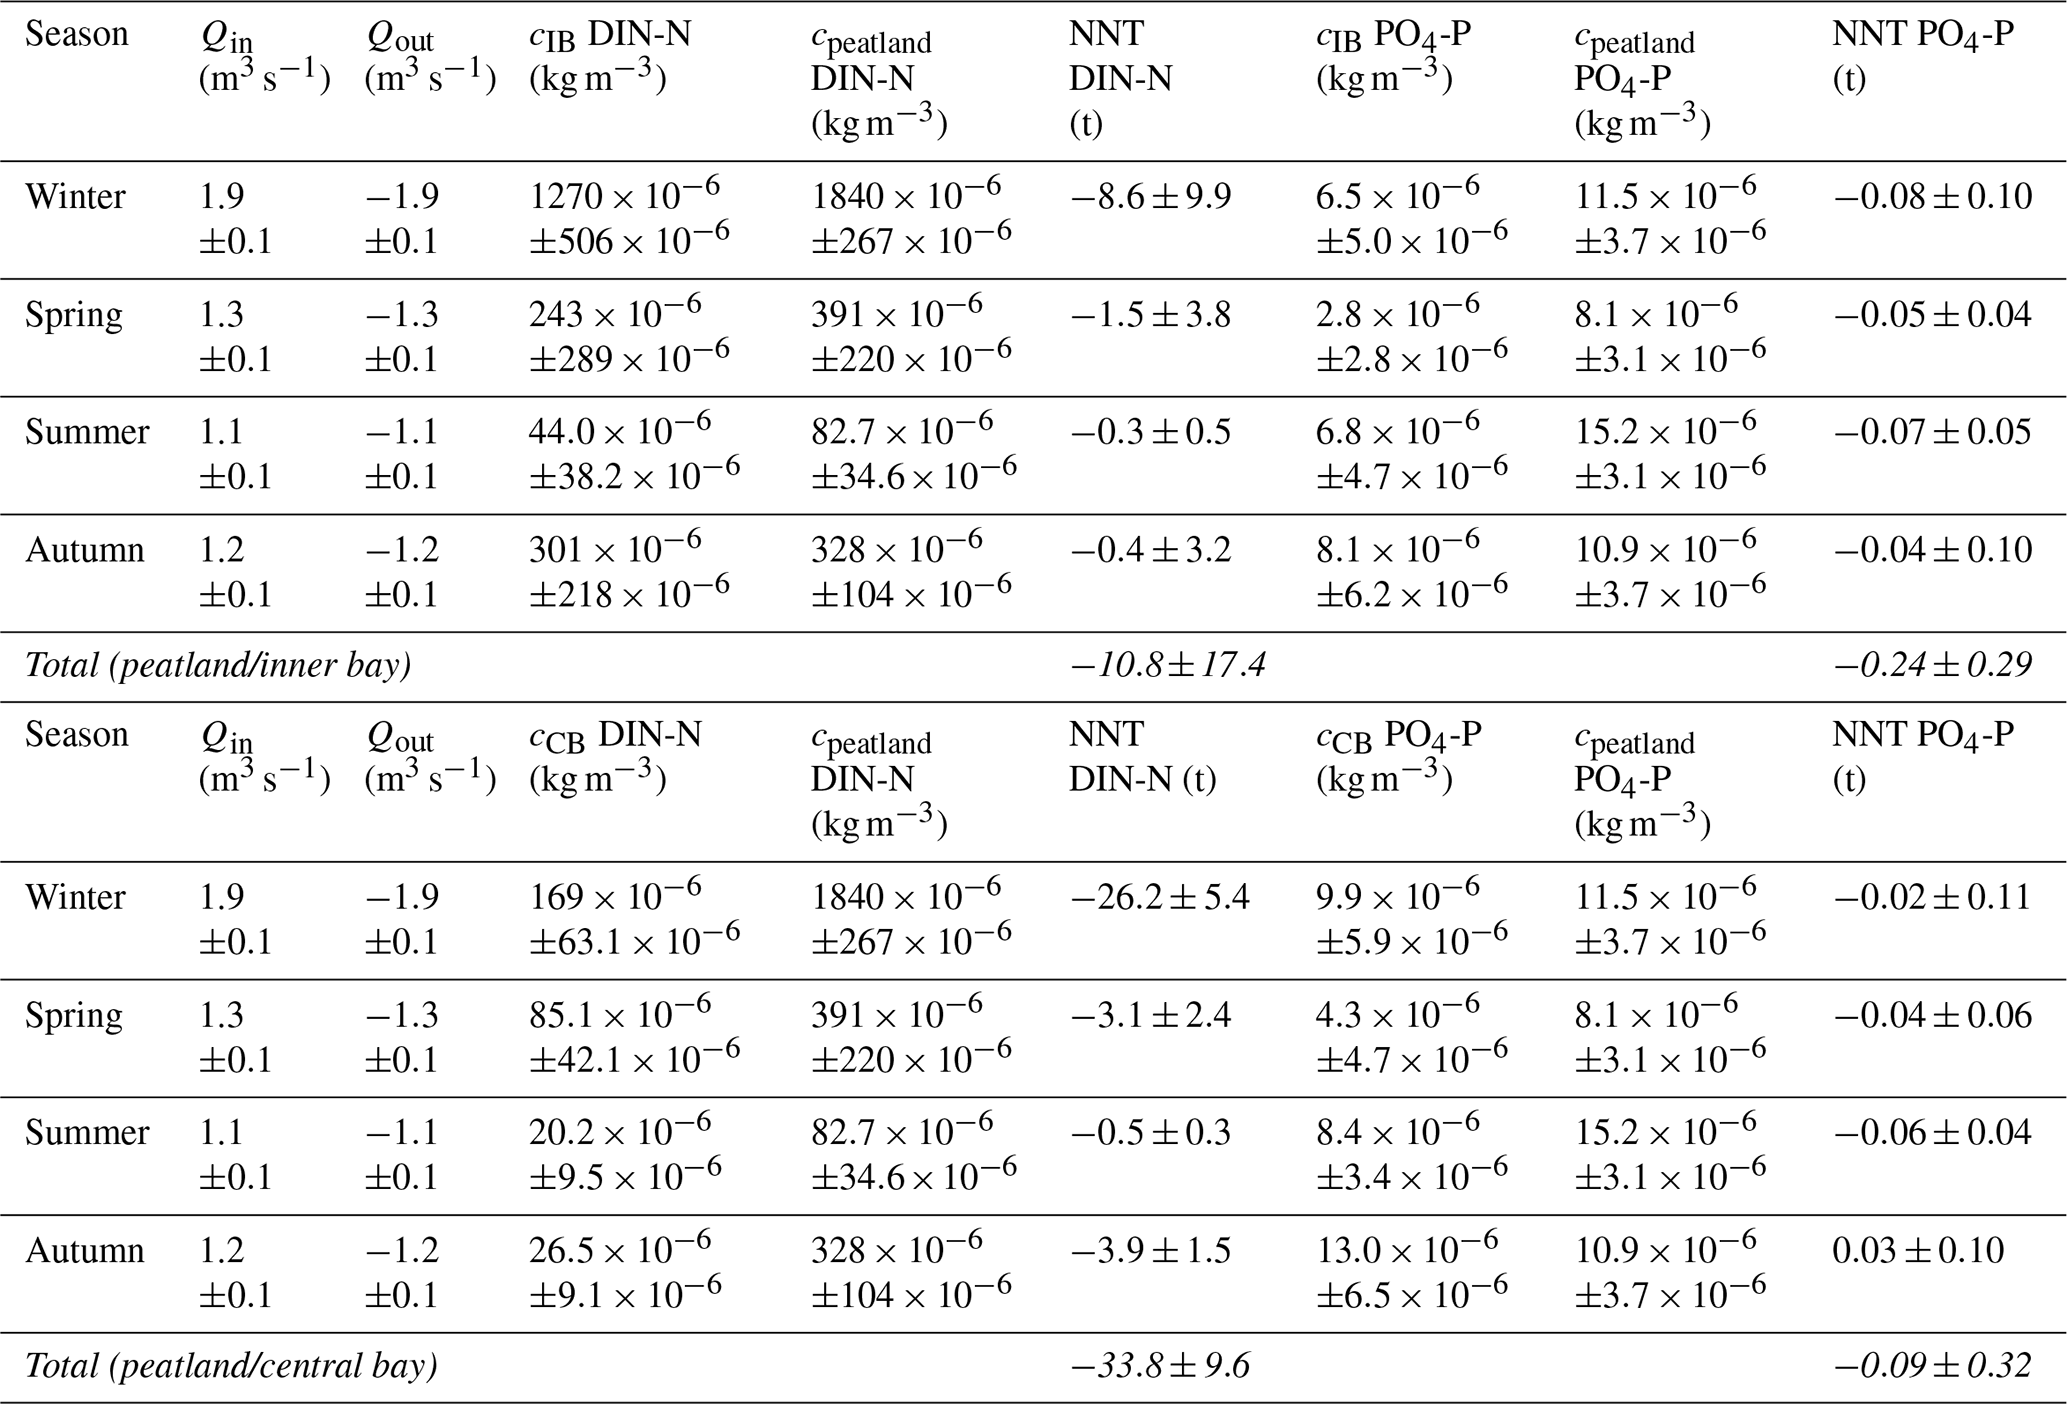
Since the gas transfer velocity k model (Sect. 2.5.3) requires a water–air interface and thus cannot be applied to dry conditions, atmospheric flux measurements obtained by manual closed-chambers along a representative transect (Fig. 2b) were available to determine pre-rewetting GHG fluxes (CO2 and CH4). After rewetting, data from manual closed chambers (transect) and from surface water sampling for the k model (transect and peatland stations) were used. The two methodologies were applied at the same locations along the transect only after rewetting (Table C1).
To evaluate the inter-comparability of the flux estimates obtained with the two methods, the results from station BTD7 were compared for each post-rewetting season (Fig. C1). Data from this station were chosen because it was permanently flooded after rewetting and thus assured a valid baseline for comparison. The dynamics of the CO2 fluxes determined by the two methods were the same and thus did not differ significantly in any of the seasons (Kruskal–Wallis test; p>0.05).
CH4 fluxes also did not differ significantly, except in autumn (Kruskal–Wallis test; p<0.001), when the average flux calculated according to the two methods differed by a factor of 2.7. However, the data of the k model had less impact, due to the smaller number of measurements (n=6). Given the smaller data set compared to that of the closed chambers (n=17), the same statistical analysis was conducted without a seasonal division. The results showed no significant differences in the two methods for CH4 fluxes (Kruskal–Wallis test; CO2 and CH4). Therefore, it was deemed appropriate to combine the flux estimation methods for each GHG into one post-rewetting data set, as this allowed the consideration of a broader range of possible flux amplitudes. In addition, the post-rewetting data acquired along the transect were pooled with data distributed throughout the peatland area. Although the area covered by the transect was smaller than that covered by the k-model data from the peatland, such that pooling of the post-rewetting-data risked spatial bias, two positive effects of pooling were identified. (1) The transect stations were representative of the entire area after flooding because they covered a water level gradient (several centimeters to >2 m in the ditch) that coincided with the conditions of the peatland stations. (2) The transect stations represented a large heterogeneity in the peatland before rewetting that decreased post-rewetting. This was also evident from the CO2 flux measurements, which showed a high variability (data not shown) at each station before rewetting. After rewetting, there was less variability, such that the stations became more similar in their atmospheric C exchange patterns, likely due to the mixing patterns triggered by lateral exchange with the Baltic Sea (Sect. 3.1). Largely similar conditions were therefore assumed at all stations within the peatland.
The pooled post-rewetting flux values were compared with the pre-rewetting values to investigate the direct effect of rewetting on CH4 and CO2 fluxes.
Table C1Overview of the methods used to determine the atmospheric GHG fluxes.

a Inter-methodological comparison at station BTD7. b Formed the data representing post-rewetting fluxes.
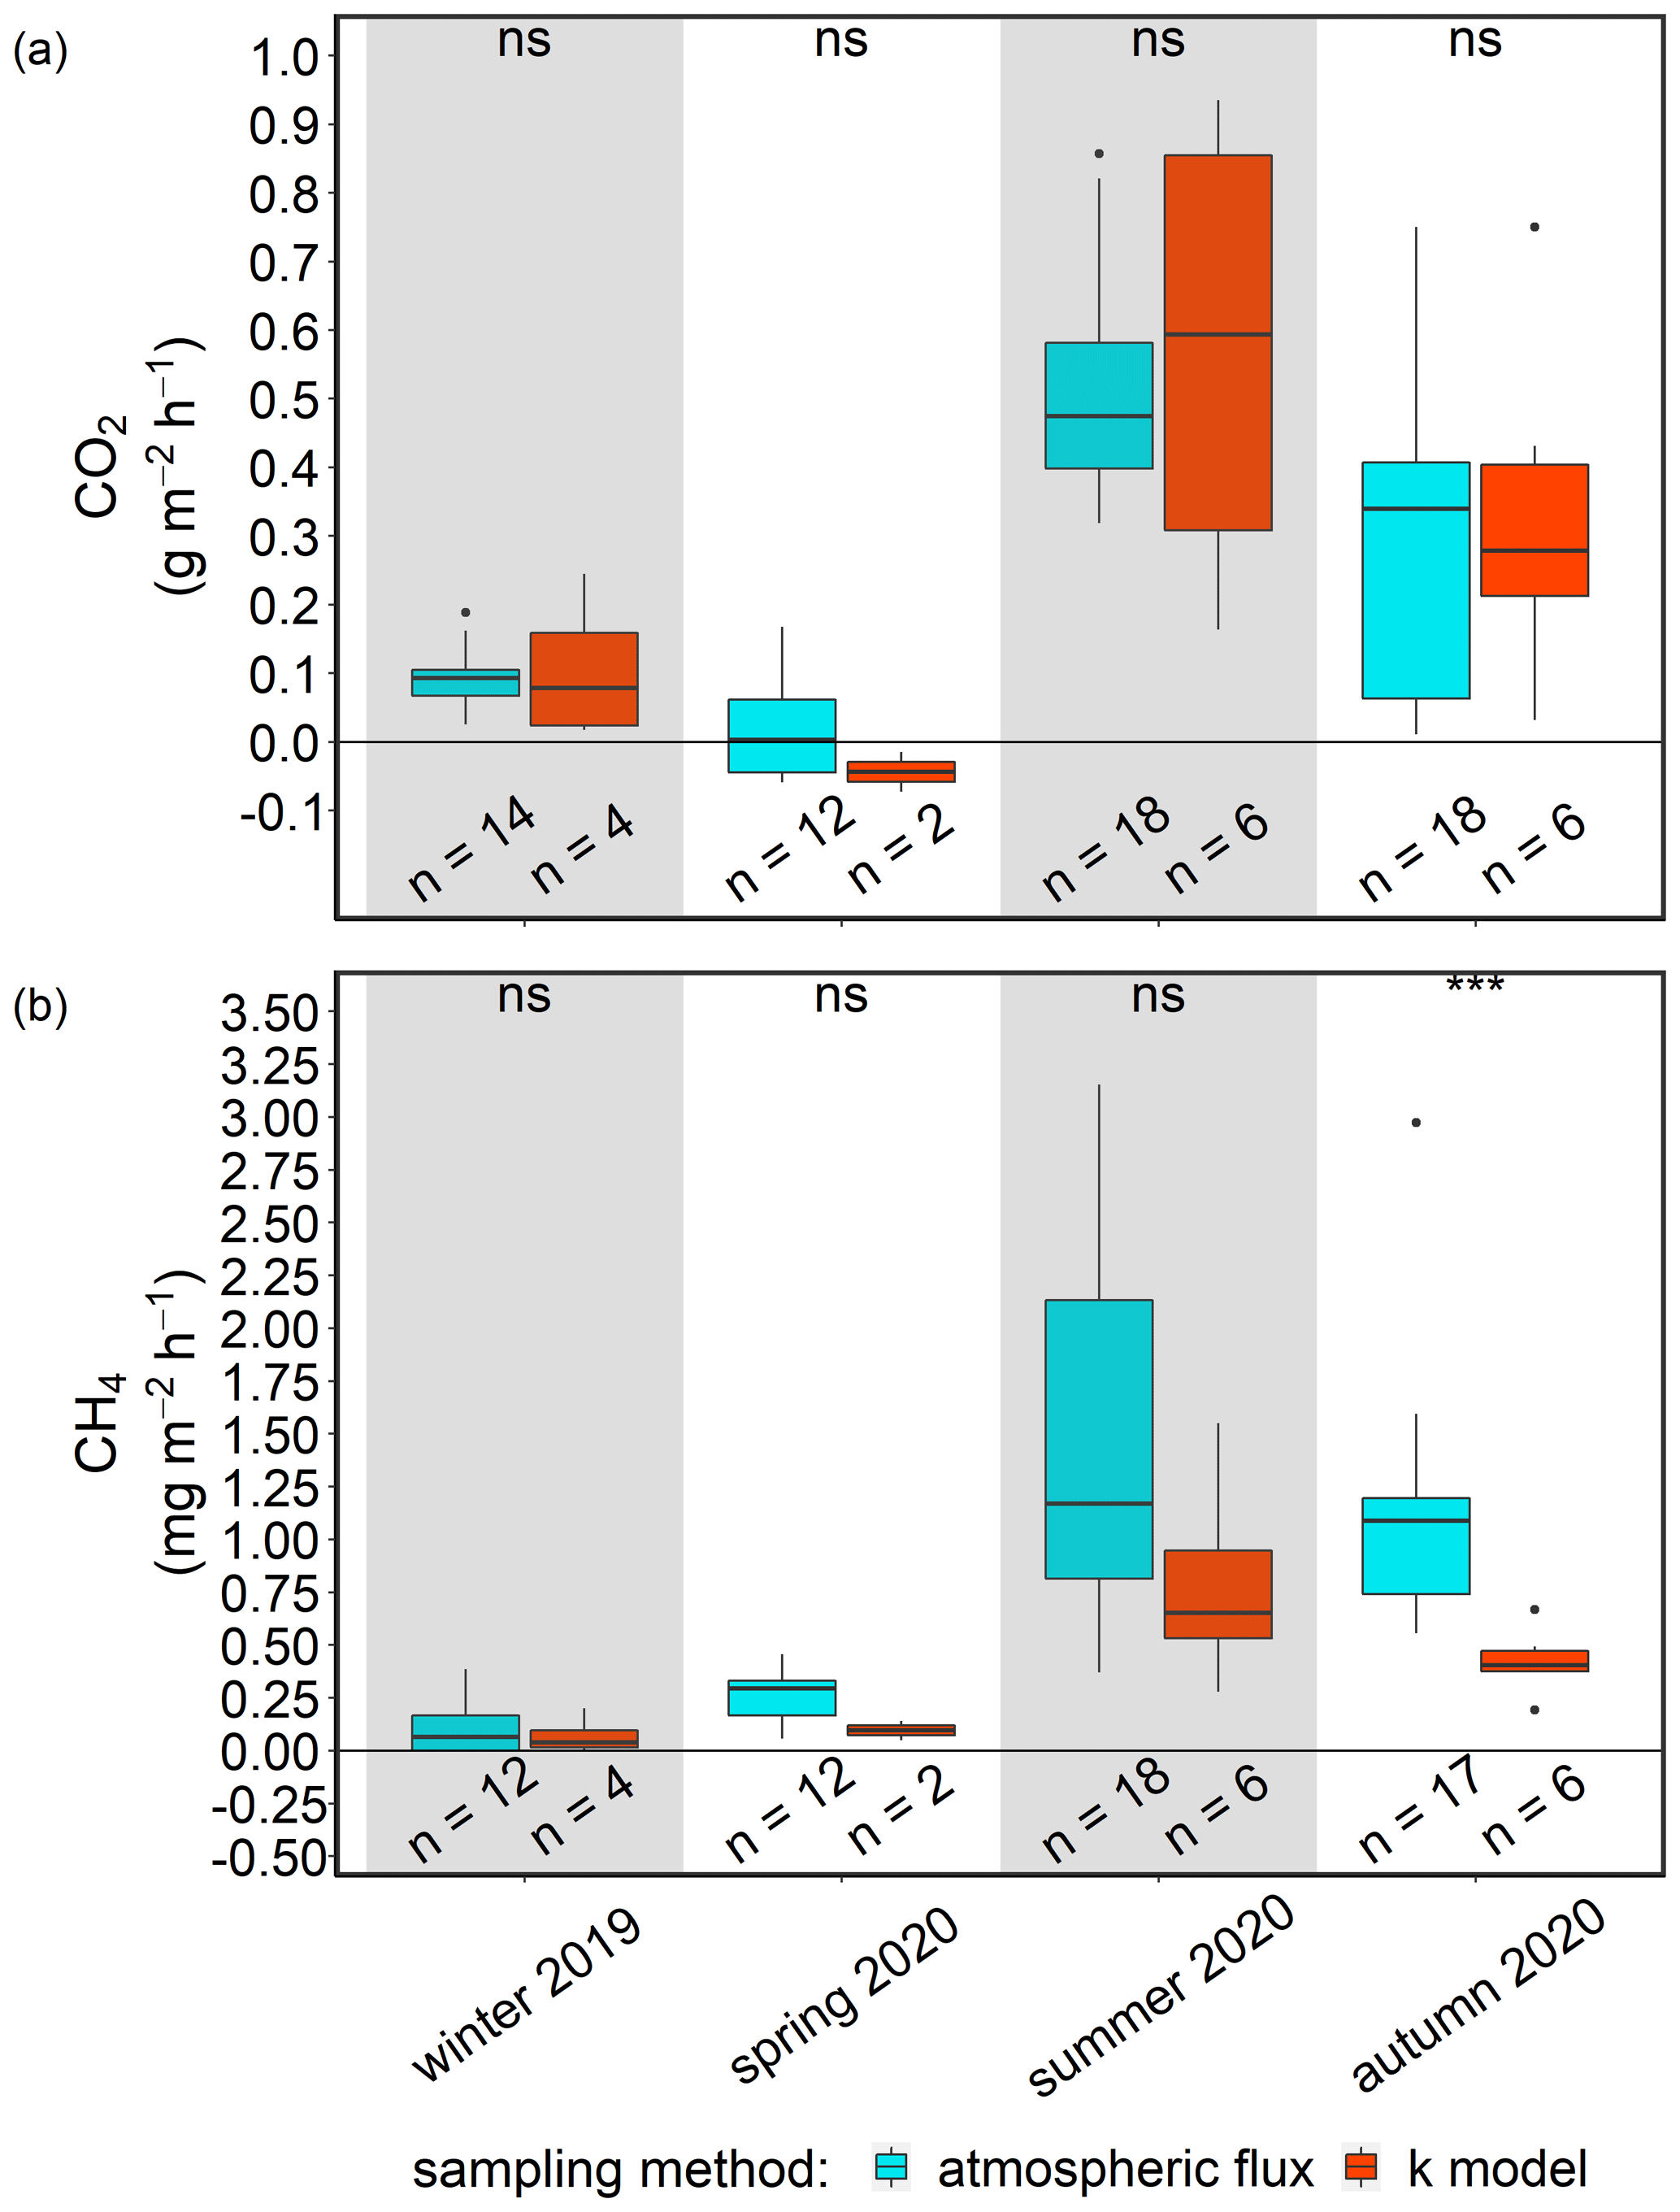
Figure C1Seasonal post-rewetting fluxes of (a) CO2 and (b) CH4 at station BTD7, which is part of the GHG flux transect. Chamber-based atmospheric GHG fluxes are shown in blue and air–sea GHG fluxes from the k model in red. The methodological comparisons within seasons are based on a significance level of p<0.05. ns is for not significant, and the triple asterisks mean p<0.001.
Cross-plots with linear regression analyses were generated for nutrients (NH, NO, NO, and PO) and DOC concentrations across all seasons to investigate potential correlations (Fig. D1). Significant correlations are shown with red asterisks (p<0.05).
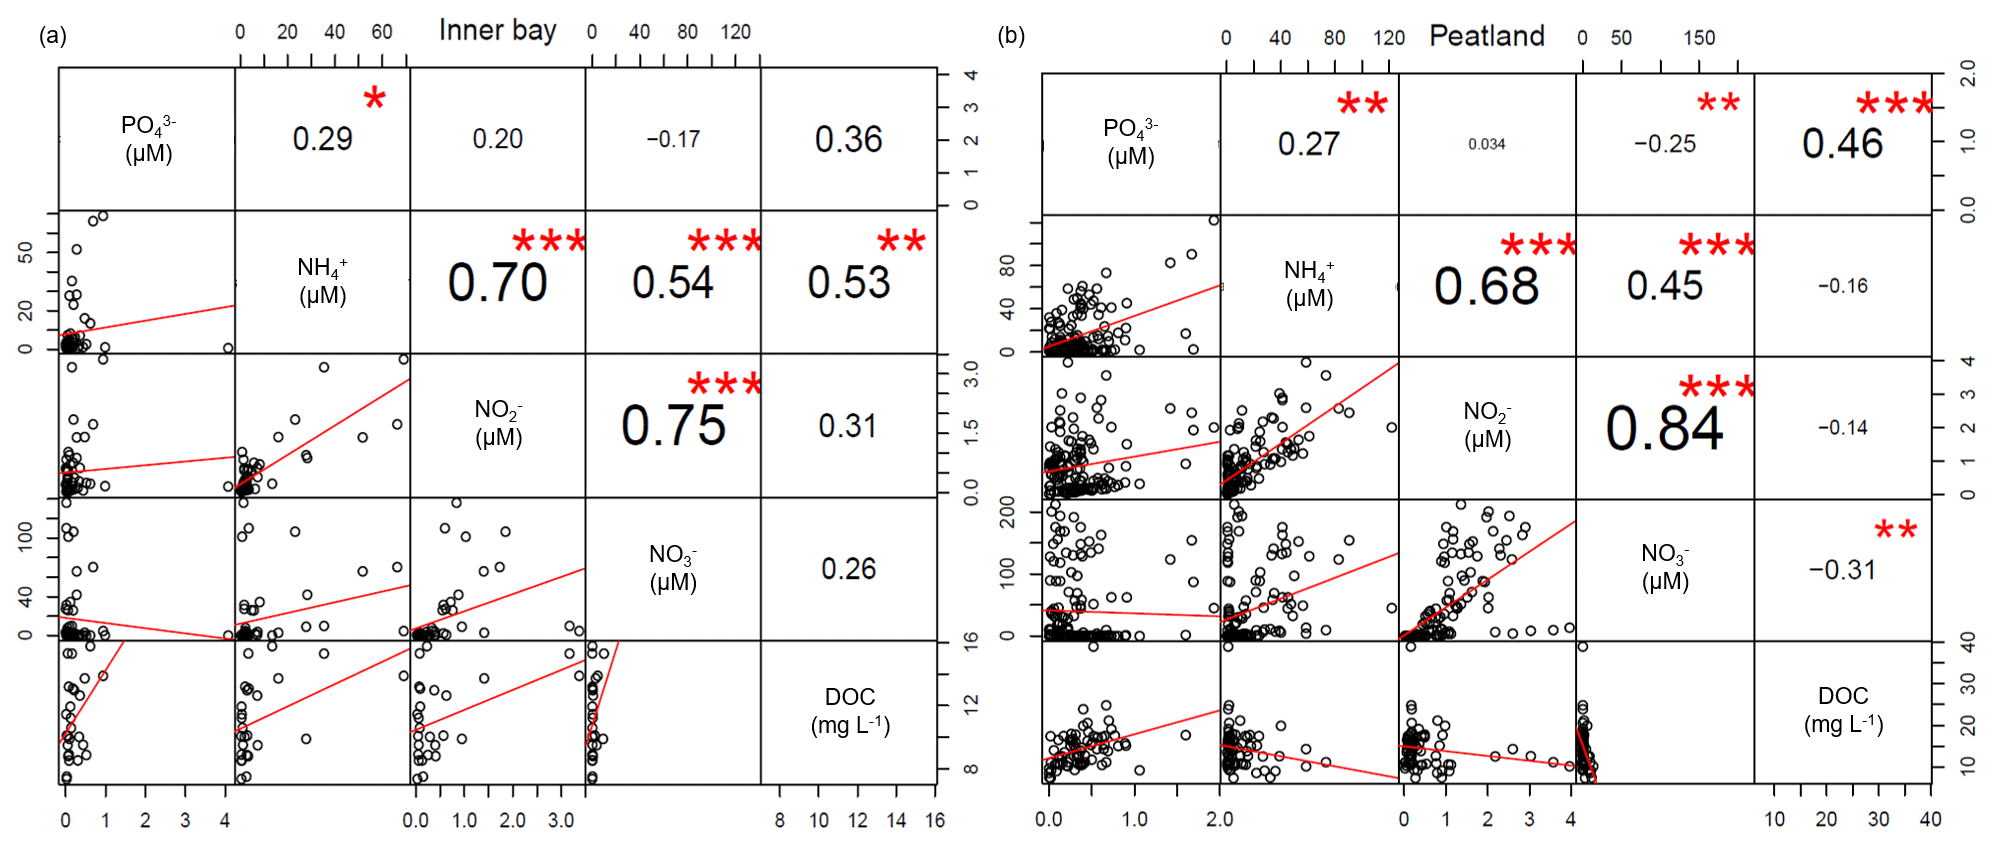
Figure D1Cross-plots of the measured nutrients (NH, NO, NO, and PO) and DOC concentrations in (a) the inner bay and (b) peatland across all seasons. Significant correlations are indicated by asterisks.
The raw data used in this study are archived at https://doi.org/10.12754/data-2022-0003 (Pönisch and Breznikar, 2022). The calculated GHG emission data used in this study are archived at https://doi.org/10.12754/data-2022-0004 (Pönisch and Gutekunst, 2022).
All authors designed the concept of the study. DLP, AB and CNG conducted the fieldwork, data analysis, and interpretation. DLP and AB wrote the first draft. DLP created the figures and organized the data. AB conducted the statistical analysis. CNG wrote sections of the paper. All authors contributed to the revision and approved the submitted version of this work.
The contact author has declared that none of the authors has any competing interests.
Publisher’s note: Copernicus Publications remains neutral with regard to jurisdictional claims in published maps and institutional affiliations.
The authors would like to thank Cindy Hoppe and Henning Sack, for their great support during the fieldwork, Lara Prelle, Petra Mutinova, and the Biologische Station Zingst (all at the University of Rostock), for providing and measuring some additional nutrient data, Christian Burmeister, Stefan Otto (both at IOW), and Stefan Köhler (University of Rostock), for their technical laboratory assistance, and Joachim Dippner, Marvin Lorenz, and Christiane Hassenrück (all at IOW), for their help on the nutrient export calculation and statistical analyses, respectively. Bita Sabbaghzadeh and Oliver Schmale (both at IOW) provided valuable feedback on the paper. We are grateful to the Ostseestiftung and especially to Rasmus Klöpper, who guided the cooperation required for the project and provided valuable data on the study area. We thank Sascha Klatt, for information on the study area and especially for technical support during fieldwork. We also thank the Wasserstraßen- und Schifffahrtsamt Ostsee (WSA Ostsee) for water level data, the Landesamt für innere Verwaltung Mecklenburg-Vorpommern (LAiV MV), Fachbereich Geodatenbereitstellung, for topography data, the Landesamt für Umwelt, Naturschutz und Geologie Mecklenburg-Vorpommern (LUNG MV), and especially Mario von Weber, for nutrient monitoring data, and the DWD for meteorological data. Finally, we would like to thank our editor, Carolin Löscher, and the reviewers, for a fair and pleasant review process.
This study was conducted within the framework of the Research Training Group “Baltic TRANSCOAST” funded by the DFG (Deutsche Forschungsgemeinschaft; grant no. GRK 2000; https://www.baltic-transcoast.uni-rostock.de, last access: 5 May 2022). This is Baltic TRANSCOAST publication no. GRK2000/0062. Anne Breznikar has been funded by a doctoral scholarship from the Deutsche Bundesstiftung Umwelt (DBU; grant no. 20018/559).
This paper was edited by Carolin Löscher and reviewed by three anonymous referees.
Augustin, J. (Ed.): Gaseous emissions from constructed wetlands and (re)flooded meadows, in: International Conference: Constructed and Riverine Wetlands for Optimal Control of Wastewater at Catchment Scale, edited by: Mander, Ü., Vohla, C., and Poom, A., Tartu Univ. Press, ISBN 9985-4-0356-8, 2003.
Augustin, J. and Chojnicki, B.: Austausch von klimarelevanten Spurengasen, Klimawirkung und Kohlenstoffdynamik in den ersten Jahren nach Wiedervernässung von degradiertem Niedermoorgrünland, Berichte des Leibniz-Institut für Gewässerökologie und Binnenfischerei, edited by: Gelbrecht, J., Zak, D., and Augustin, J., 50–61, 2008.
Augustin, J., Merbach, W., Steffens, L., and Snelinski, B.: Nitrous Oxide Fluxes Of Disturbed Minerotrophic Peatlands, Agribiol. Res., 51, 47–57, 1998.
Bange, H. W., Bartell, U. H., Rapsomanikis, S., and Andreae, M. O.: Methane in the Baltic and North Seas and a reassessment of the marine emissions of methane, Global Biogeochem. Cy., 8, 465–480, https://doi.org/10.1029/94GB02181, 1994.
Bange, H. W., Dahlke, S., Ramesh, R., Meyer-Reil, L.-A., Rapsomanikis, S., and Andreae, M. O.: Seasonal Study of Methane and Nitrous Oxide in the Coastal Waters of the Southern Baltic Sea, Estuar. Coast. Shelf S., 47, 807–817, https://doi.org/10.1006/ecss.1998.0397, 1998.
Bartlett, K. B., Bartlett, D. S., Harriss, R. C., and Sebacher, D. I.: Methane emissions along a salt marsh salinity gradient, Biogeochemistry, 4, 183–202, https://doi.org/10.1007/BF02187365, 1987.
Beldowski, J., Löffler, A., Schneider, B., and Joensuu, L.: Distribution and biogeochemical control of total CO2 and total alkalinity in the Baltic Sea, J. Marine Syst., 81, 252–259, https://doi.org/10.1016/j.jmarsys.2009.12.020, 2010.
Bockholt, R.: Flächen-. Ertrags- und Problemanalyse des Überschwemmungsgrünlandes der Ostsee-, Bodden- und Haffgewässer, Forschungsbericht Universität Rostock, 17, 1985.
Boetius, A., Ravenschlag, K., Schubert, C. J., Rickert, D., Widdel, F., Gieseke, A., Amann, R., Jørgensen, B. B., Witte, U., and Pfannkuche, O.: A marine microbial consortium apparently mediating anaerobic oxidation of methane, Nature, 407, 623–626, https://doi.org/10.1038/35036572, 2000.
Borges, A. V., Champenois, W., Gypens, N., Delille, B., and Harlay, J.: Massive marine methane emissions from near-shore shallow coastal areas, Sci. Rep.-UK, 6, 27908, https://doi.org/10.1038/srep27908, 2016.
Borges, A. V., Speeckaert, G., Champenois, W., Scranton, M. I., and Gypens, N.: Productivity and Temperature as Drivers of Seasonal and Spatial Variations of Dissolved Methane in the Southern Bight of the North Sea, Ecosystems, 21, 583–599, https://doi.org/10.1007/s10021-017-0171-7, 2018.
Brisch, A.: Erkundung von Torfmächtigkeit und Vegetation in zwei potenziellen Wiedervernässungsgebieten bei Rambin und Grosow (Rügen), expert opinion commissioned by and available at the Naturschutzstiftung Deutsche Ostsee, 2015.
Bubier, J., Crill, P., Mosedale, A., Frolking, S., and Linder, E.: Peatland responses to varying interannual moisture conditions as measured by automatic CO2 chambers, Global Biogeochem. Cy., 17, 1–35, https://doi.org/10.1029/2002GB001946, 2003.
Burgin, A. J. and Groffman, P. M.: Soil O2 controls denitrification rates and N2O yield in a riparian wetland, J. Geophys. Res., 117, 1–15, https://doi.org/10.1029/2011JG001799, 2012.
Cabezas, A., Gelbrecht, J., Zwirnmann, E., Barth, M., and Zak, D.: Effects of degree of peat decomposition, loading rate and temperature on dissolved nitrogen turnover in rewetted fens, Soil Biol. Biochem., 48, 182–191, https://doi.org/10.1016/j.soilbio.2012.01.027, 2012.
Capone, D. G. and Kiene, R. P.: Comparison of microbial dynamics in marine and freshwater sediments: Contrasts in anaerobic carbon catabolism, Limnol. Oceangr., 33, 725–749, https://doi.org/10.4319/lo.1988.33.4part2.0725, 1988.
Carter, B. R., Radich, J. A., Doyle, H. L., and Dickson, A. G.: An automated system for spectrophotometric seawater pH measurements, Limnol. Oceanogr.-Meth., 11, 16–27, https://doi.org/10.4319/lom.2013.11.16, 2013.
Chmura, G. L., Kellman, L., and Guntenspergen, G. R.: The greenhouse gas flux and potential global warming feedbacks of a northern macrotidal and microtidal salt marsh, Environ. Res. Lett., 6, 1–6, https://doi.org/10.1088/1748-9326/6/4/044016, 2011.
Chmura, G. L., Kellman, L., van Ardenne, L., and Guntenspergen, G. R.: Greenhouse Gas Fluxes from Salt Marshes Exposed to Chronic Nutrient Enrichment, PloS one, 11, 1–13, https://doi.org/10.1371/journal.pone.0149937, 2016.
Couwenberg, J., Thiele, A., Tanneberger, F., Augustin, J., Bärisch, S., Dubovik, D., Liashchynskaya, N., Michaelis, D., Minke, M., Skuratovich, A., and Joosten, H.: Assessing greenhouse gas emissions from peatlands using vegetation as a proxy, Hydrobiologia, 674, 67–89, https://doi.org/10.1007/s10750-011-0729-x, 2011.
Danevèiè, T., Mandic-Mulec, I., Stres, B., Stopar, D., and Hacin, J.: Emissions of CO2, CH4 and N2O from Southern European peatlands, Soil Biol. Biochem., 42, 1437–1446, https://doi.org/10.1016/j.soilbio.2010.05.004, 2010.
Dean, J. F., Middelburg, J. J., Röckmann, T., Aerts, R., Blauw, L. G., Egger, M., Jetten, M. S. M., Jong, A. E. E. de, Meisel, O. H., Rasigraf, O., Slomp, C. P., in't Zandt, M. H., and Dolman, A. J.: Methane Feedbacks to the Global Climate System in a Warmer World, Rev. Geophys., 56, 207–250, https://doi.org/10.1002/2017RG000559, 2018.
Dickson, A. and Riley, J.: The estimation of acid dissociation constants in seawater media from potentionmetric titrations with strong base. I. The ionic product of water – Kw, Mar. Chem., 7, 89–99, https://doi.org/10.1016/0304-4203(79)90001-X, 1979.
Dickson, A. G.: Standard potential of the reaction: AgCl(s) + H2(g) = Ag(s) + HCl(aq), and the standard acidity constant of the ion HSO in synthetic sea water from 273.15 to 318.15 K, J. Chem. Thermodyn., 22, 113–127, https://doi.org/10.1016/0021-9614(90)90074-Z, 1990.
Dickson, A. G., Afghan, J. D., and Anderson, G. C.: Reference materials for oceanic CO2 analysis: a method for the certification of total alkalinity, Mar. Chem., 80, 185–197, https://doi.org/10.1016/S0304-4203(02)00133-0, 2003.
Dickson, A. G., Sabine, C. L., and Christian, J. R. (Eds.): Guide to best practices for ocean CO2 measurements, North Pacific Marine Science Organization, ISBN 1-897176-07-4, 2007.
Dlugokencky, E., Crotwell, A., Mund, J., Crotwell, M., and Thoning, K.: Atmospheric Methane Dry Air Mole Fractions from the NOAA ESRL Carbon Cycle Cooperative Global Air Sampling Network, 1983–2018, https://doi.org/10.15138/VNCZ-M766, 2019a.
Dlugokencky, E., Crotwell, A., Mund, J., Crotwell, M., and Thoning, K.: Atmospheric Methane Dry Air Mole Fractions from the NOAA ESRL Carbon Cycle Cooperative Global Air Sampling Network, 1983–2018, https://doi.org/10.15138/wkgj-f215, 2019b.
Duhamel, S., Nogaro, G., and Steinman, A. D.: Effects of water level fluctuation and sediment–water nutrient exchange on phosphorus biogeochemistry in two coastal wetlands, Aquat. Sci., 79, 57–72, https://doi.org/10.1007/s00027-016-0479-y, 2017.
Fiedler, J., Fuß, R., Glatzel, S., Hagemann, U., Huth, V., Jordan, S., Jurasinski, G., Kutzbach, L., Maier, M., Schäfer, K., Weber, T., and Weymann, D.: Best Practice Guideline Measurement of carbon dioxide, methane and nitrous oxide fluxes between soil-vegetation-systems and the atmosphere using non-steady state chambers, Deutsche Bodenkundliche Gesellschaft, Arbeitsgruppe Bodengase, Göttingen, 70 pp., https://doi.org/10.23689/fidgeo-5422, 2022.
Fisher, J. and Acreman, M. C.: Wetland nutrient removal: a review of the evidence, Hydrol. Earth Syst. Sci., 8, 673–685, https://doi.org/10.5194/hess-8-673-2004, 2004.
Flessa, H., Wild, U., Klemisch, M., and Pfadenhauer, J.: Nitrous oxide and methane fluxes from organic soils under agriculture, Eur. J. Soil Sci., 49, 327–335, 1998.
Fox, J. and Weisberg, S.: An {R} Companion to Applied Regression, 3rd Edn., Thousand Oaks CA, Sage, https://socialsciences.mcmaster.ca/jfox/Books/Companion/ (last access: 3 April 2022), 2019.
Franz, D., Koebsch, F., Larmanou, E., Augustin, J., and Sachs, T.: High net CO2 and CH4 release at a eutrophic shallow lake on a formerly drained fen, Biogeosciences, 13, 3051–3070, https://doi.org/10.5194/bg-13-3051-2016, 2016.
Gattuso, J.-P., Epitalon, J.-M., Lavigne, H., and Orr, J.: seacarb: Seawater Carbonate Chemistry), R package version 3.2.15, https://CRAN.R-project.org/, https://CRAN.R-project.org/package=seacarb (last access: 6 February 2022), 2019.
Geurts, J. J. M., Smolders, A. J. P., Banach, A. M., van de Graaf, J. P. M., Roelofs, J. G. M., and Lamers, L. P. M.: The interaction between decomposition, net N and P mineralization and their mobilization to the surface water in fens, Water Res., 44, 3487–3495, https://doi.org/10.1016/j.watres.2010.03.030, 2010.
Glatzel, S. and Stahr, K.: Methane and nitrous oxide exchange in differently fertilised grassland in southern Germany, Plant Soil, 231, 21–35, 2001.
Glatzel, S., Forbrich, I., Krüger, C., Lemke, S., and Gerold, G.: Small scale controls of greenhouse gas release under elevated N deposition rates in a restoring peat bog in NW Germany, Biogeosciences, 5, 925–935, https://doi.org/10.5194/bg-5-925-2008, 2008.
Goldberg, S. D., Knorr, K.-H., Blodau, C., Lischeid, G., and Gebauer, G.: Impact of altering the water table height of an acidic fen on N2O and NO fluxes and soil concentrations, Glob. Change Biol., 16, 220–233, https://doi.org/10.1111/j.1365-2486.2009.02015.x, 2010.
Grasshoff, K., Kremling, K., and Ehrhardt, M. (Eds.): Methods of Seawater Analysis, Wiley-VCH, ISBN 3-527-29589-5, 2009.
Grolemund, G. and Wickham, H.: Dates and Times Made Easy with lubridate, J. Stat. Softw., 40, 1–25, https://doi.org/10.18637/jss.v040.i03, 2011.
Hahn, J., Köhler, S., Glatzel, S., and Jurasinski, G.: Methane Exchange in a Coastal Fen in the First Year after Flooding-A Systems Shift, PloS one, 10, 1–25, https://doi.org/10.1371/journal.pone.0140657, 2015.
Hahn-Schöfl, M., Zak, D., Minke, M., Gelbrecht, J., Augustin, J., and Freibauer, A.: Organic sediment formed during inundation of a degraded fen grassland emits large fluxes of CH4 and CO2, Biogeosciences, 8, 1539–1550, https://doi.org/10.5194/bg-8-1539-2011, 2011.
Harpenslager, S. F., van den Elzen, E., Kox, M. A., Smolders, A. J., Ettwig, K. F., and Lamers, L. P.: Rewetting former agricultural peatlands: Topsoil removal as a prerequisite to avoid strong nutrient and greenhouse gas emissions, Ecol. Eng., 84, 159–168, https://doi.org/10.1016/j.ecoleng.2015.08.002, 2015.
HELCOM: HELCOM Guidelines for the annual and periodical compilation and reporting of waterborne pollution inputs to the Baltic Sea (PLC-Water), HELCOM, http://nest.su.se/helcom_plc/ (last access: 17 December 2021), 2019.
Heyer, J. and Berger, U.: Methane Emission from the Coastal Area in the Southern Baltic Sea, Estuar. Coast. Shelf S., 51, 13–30, https://doi.org/10.1006/ecss.2000.0616, 2000.
Hogan, D. M., Jordan, T. E., and Walbridge, M. R.: Phosphorus retention and soil organic carbon in restored and natural freshwater wetlands, Wetlands, 24, 573–585, https://doi.org/10.1672/0277-5212(2004)024[0573:PRASOC]2.0.CO;2, 2004.
Holz, R., Herrmann, C., and Müller-Motzfeld, G.: Vom Polder zum Ausdeichungsgebiet: Das Projekt Karrendorfer Wiesen und die Zukunft der Küstenüberflutungsgebiete in Mecklenburg-Vorpommern, Natur und Naturschutz in MV, Schriftenreihe des Institutes für Landschaftsökologie und Naturschutz Greifswald, Band 32, 1996.
Joosten, H. and Clarke, D.: Wise use of mires and peatlands, Background and principles including a framework for decision-making, International Mire Conservation Group and International Peat Society, ISBN 951-97744-8-3, 2002.
Jørgensen, B. B.: Bacteria and Marine Biogeochemistry, in: Marine Geochemistry, Springer Nature, 169–206, edited by: Schulz, H. D. and Zabel, M., https://doi.org/10.1007/3-540-32144-6_5, 2006.
Jørgensen, C. J. and Elberling, B.: Effects of flooding-induced N2O production, consumption and emission dynamics on the annual N2O emission budget in wetland soil, Soil Biol. Biochem., 53, 9–17, https://doi.org/10.1016/j.soilbio.2012.05.005, 2012.
Jurasinski, G., Günther, A. B., Huth, V., Couwenberg, J., and Glatzel, S.: Ecosystem services provided by paludiculture – greenhouse gas emissions. in: Paludiculture – productive use of wet peatlands, edited by: Wichtmann, W., Schröder, C., and Joosten, H., Schweizerbart Scientific Publishers, Stuttgart, 79–94, 2016.
Jurasinski, G., Koebsch, F., Guenther, A., and Beetz, S.: flux: Flux Rate Calculation from Dynamic Closed Chamber Measurements, R package version 0.3-0.1, https://CRAN.R-project.org/package=flux, last access: 12 April 2022.
Jurasinski, G., Janssen, M., Voss, M., Böttcher, M. E., Brede, M., Burchard, H., Forster, S., Gosch, L., Gräwe, U., Gründling-Pfaff, S., Haider, F., Ibenthal, M., Karow, N., Karsten, U., Kreuzburg, M., Lange, X., Leinweber, P., Massmann, G., Ptak, T., Rezanezhad, F., Rehder, G., Romoth, K., Schade, H., Schubert, H., Schulz-Vogt, H., Sokolova, I. M., Strehse, R., Unger, V., Westphal, J., and Lennartz, B.: Understanding the Coastal Ecocline: Assessing Sea–Land Interactions at Non-tidal, Low-Lying Coasts Through Interdisciplinary Research, Front. Mar. Sci., 5, 342, https://doi.org/10.3389/fmars.2018.00342, 2018.
Kaat, A. and Joosten, H.: Factbook for UNFCCC policies on peat carbon emissions, Wetlands International, 2009.
Kandel, T. P., Lærke, P. E., Hoffmann, C. C., and Elsgaard, L.: Complete annual CO2, CH4, and N2O balance of a temperate riparian wetland 12 years after rewetting, Ecol. Eng., 127, 527–535, https://doi.org/10.1016/j.ecoleng.2017.12.019, 2019.
Knittel, K. and Boetius, A.: Anaerobic oxidation of methane: progress with an unknown process, Annu. Rev. Microbiol., 63, 311–334, https://doi.org/10.1146/annurev.micro.61.080706.093130, 2009.
Koebsch, F., Glatzel, S., Hofmann, J., Forbrich, I., and Jurasinski, G.: CO2 exchange of a temperate fen during the conversion from moderately rewetting to flooding, J. Geophys. Res.-Biogeo., 118, 940–950, https://doi.org/10.1002/jgrg.20069, 2013.
Koebsch, F., Jurasinski, G., Koch, M., Hofmann, J., and Glatzel, S.: Controls for multi-scale temporal variation in ecosystem methane exchange during the growing season of a permanently inundated fen, Agr. Forest Meteorol., 204, 94–105, https://doi.org/10.1016/j.agrformet.2015.02.002, 2015.
Koebsch, F., Winkel, M., Liebner, S., Liu, B., Westphal, J., Schmiedinger, I., Spitzy, A., Gehre, M., Jurasinski, G., Köhler, S., Unger, V., Koch, M., Sachs, T., and Böttcher, M. E.: Sulfate deprivation triggers high methane production in a disturbed and rewetted coastal peatland, Biogeosciences, 16, 1937–1953, https://doi.org/10.5194/bg-16-1937-2019, 2019.
Koebsch, F., Gottschalk, P., Beyer, F., Wille, C., Jurasinski, G., and Sachs, T.: The impact of occasional drought periods on vegetation spread and greenhouse gas exchange in rewetted fens, Philos. T. Roy. Soc. B, 375, 20190685, https://doi.org/10.1098/rstb.2019.0685, 2020.
Komsta, L.: mblm: Median-Based Linear Models, R package version 0.12.1, https://CRAN.R-project.org/package=mblm (last access: 12 April 2022), 2019.
Kool, D. M., Dolfing, J., Wrage, N., and van Groenigen, J. W.: Nitrifier denitrification as a distinct and significant source of nitrous oxide from soil, Soil Biol. Biochem., 43, 174–178, https://doi.org/10.1016/j.soilbio.2010.09.030, 2011.
Kreyling, J., Tanneberger, F., Jansen, F., van der Linden, S., Aggenbach, C., Blüml, V., Couwenberg, J., Emsens, W.-J., Joosten, H., Klimkowska, A., Kotowski, W., Kozub, L., Lennartz, B., Liczner, Y., Liu, H., Michaelis, D., Oehmke, C., Parakenings, K., Pleyl, E., Poyda, A., Raabe, S., Röhl, M., Rücker, K., Schneider, A., Schrautzer, J., Schröder, C., Schug, F., Seeber, E., Thiel, F., Thiele, S., Tiemeyer, B., Timmermann, T., Urich, T., van Diggelen, R., Vegelin, K., Verbruggen, E., Wilmking, M., Wrage-Mönnig, N., Wołejko, L., Zak, D., and Jurasinski, G.: Rewetting does not return drained fen peatlands to their old selves, Nat. Commun., 12, 5693, https://doi.org/10.1038/s41467-021-25619-y, 2021.
Kuliński, K., Schneider, B., Hammer, K., Machulik, U., and Schulz-Bull, D.: The influence of dissolved organic matter on the acid–base system of the Baltic Sea, J. Marine Syst., 132, 106–115, https://doi.org/10.1016/j.jmarsys.2014.01.011, 2014.
Kuliński, K., Schneider, B., Szymczycha, B., and Stokowski, M.: Structure and functioning of the acid–base system in the Baltic Sea, Earth Syst. Dynam., 8, 1107–1120, https://doi.org/10.5194/esd-8-1107-2017, 2017.
Kuliński, K., Rehder, G., Asmala, E., Bartosova, A., Carstensen, J., Gustafsson, B., Hall, P. O. J., Humborg, C., Jilbert, T., Jürgens, K., Meier, H. E. M., Müller-Karulis, B., Naumann, M., Olesen, J. E., Savchuk, O., Schramm, A., Slomp, C. P., Sofiev, M., Sobek, A., Szymczycha, B., and Undeman, E.: Biogeochemical functioning of the Baltic Sea, Earth Syst. Dynam., 13, 633–685, https://doi.org/10.5194/esd-13-633-2022, 2022.
Lamers, L. P., Smolders, A. J., and Roelofs, J. G.: The restoration of fens in the Netherlands, Hydrobiologia, 478, 107–130, https://doi.org/10.1023/A:1021022529475, 2002.
Lennartz, B. and Liu, H.: Hydraulic Functions of Peat Soils and Ecosystem Service, Front. Environ. Sci., 7, 92, https://doi.org/10.3389/fenvs.2019.00092, 2019.
Leppelt, T., Dechow, R., Gebbert, S., Freibauer, A., Lohila, A., Augustin, J., Drösler, M., Fiedler, S., Glatzel, S., Höper, H., Järveoja, J., Lærke, P. E., Maljanen, M., Mander, Ü., Mäkiranta, P., Minkkinen, K., Ojanen, P., Regina, K., and Strömgren, M.: Nitrous oxide emission budgets and land-use-driven hotspots for organic soils in Europe, Biogeosciences, 11, 6595–6612, https://doi.org/10.5194/bg-11-6595-2014, 2014.
Liu, H. and Lennartz, B.: Short Term Effects of Salinization on Compound Release from Drained and Restored Coastal Wetlands, Water, 11, 1549, https://doi.org/10.3390/w11081549, 2019.
Liu, H., Zak, D., Rezanezhad, F., and Lennartz, B.: Soil degradation determines release of nitrous oxide and dissolved organic carbon from peatlands, Environ. Res. Lett., 14, 94009, https://doi.org/10.1088/1748-9326/ab3947, 2019.
Livingston, G. P. and Hutchinson, G.: Enclosure-based measurement of trace gas exchange: applications and sources of error, in: Biogenic trace gases: measuring emissions from soil and water, edited by: Matson, P. A. and Harris, R. C., Blackwell Science Ltd., Oxford, UK, 14–51, 1995.
Löffler, A., Schneider, B., Perttilä, M., and Rehder, G.: Air–sea CO2 exchange in the Gulf of Bothnia, Baltic Sea, Cont. Shelf Res., 37, 46–56, https://doi.org/10.1016/j.csr.2012.02.002, 2012.
Martikainen, P. J., Nykänen, H., Crill, P., and Silvola, J.: Effect of a lowered water table on nitrous oxide fluxes from northern peatlands, Nature, 366, 51–53, https://doi.org/10.1038/366051a0, 1993.
Millero, F. J.: Carbonate constants for estuarine waters, Mar. Freshwater Res., 61, 139–142, https://doi.org/10.1071/MF09254, 2010.
Minkkinen, K., Ojanen, P., Koskinen, M., and Penttilä, T.: Nitrous oxide emissions of undrained, forestry-drained, and rewetted boreal peatlands, Forest Ecol. Manag., 478, 118494, https://doi.org/10.1016/j.foreco.2020.118494, 2020.
Moore, T. R., Roulet, N. T., and Waddington, J. M.: Uncertainty in Predicting the Effect of Climatic Change on the Carbon Cycling of Canadian Peatlands, Climatic Change, 40, 229–245, https://doi.org/10.1023/A:1005408719297, 1998.
Moseman-Valtierra, S., Gonzalez, R., Kroeger, K. D., Tang, J., Chao, W. C., Crusius, J., Bratton, J., Green, A., and Shelton, J.: Short-term nitrogen additions can shift a coastal wetland from a sink to a source of N2O, Atmos. Environ., 45, 4390–4397, https://doi.org/10.1016/j.atmosenv.2011.05.046, 2011.
Müller, J. D. and Rehder, G.: Metrology of pH Measurements in Brackish Waters – Part 2: Experimental Characterization of Purified meta-Cresol Purple for Spectrophotometric pHT Measurements, Front. Mar. Sci., 5, 177, https://doi.org/10.3389/fmars.2018.00177, 2018.
Müller, J. D., Schneider, B., and Rehder, G.: Long-term alkalinity trends in the Baltic Sea and their implications for CO2-induced acidification, Limnol. Oceangr., 61, 1984–2002, https://doi.org/10.1002/lno.10349, 2016.
Müller, J. D., Bastkowski, F., Sander, B., Seitz, S., Turner, D. R., Dickson, A. G., and Rehder, G.: Metrology for pH Measurements in Brackish Waters – Part 1: Extending Electrochemical pHT Measurements of TRIS Buffers to Salinities 5–20, Front. Mar. Sci., 5, 176, https://doi.org/10.3389/fmars.2018.00176, 2018.
Neubauer, S. C., Franklin, R. B., and Berrier, D. J.: Saltwater intrusion into tidal freshwater marshes alters the biogeochemical processing of organic carbon, Biogeosciences, 10, 8171–8183, https://doi.org/10.5194/bg-10-8171-2013, 2013.
Oertel, C., Matschullat, J., Zurba, K., Zimmermann, F., and Erasmi, S.: Greenhouse gas emissions from soils – A review, Geochemistry, 76, 327–352, https://doi.org/10.1016/j.chemer.2016.04.002, 2016.
Oremland, R. S. (Ed.): The biogeochemistry of methanogenic bacteria, in: The biology of microorganisms, Wiley, New York, http://pubs.er.usgs.gov/publication/70198767 (last access: 17 February 2022), 1988.
Parish, F.: Assessment on peatlands, biodiversity and climate change, Main report, Global Environment Centre, Kuala Lumpur & Wetlands International, Wageningen, ISBN 978-983-43751-0-2, 2008.
Pedersen, T. L.: patchwork: The Composer of Plots, R package version 1.1.1, https://CRAN.R-project.org/package=patchwork (last access: 27 October 2021), 2020.
Petersen, S. O., Hoffmann, C. C., Schäfer, C.-M., Blicher-Mathiesen, G., Elsgaard, L., Kristensen, K., Larsen, S. E., Torp, S. B., and Greve, M. H.: Annual emissions of CH4 and N2O, and ecosystem respiration, from eight organic soils in Western Denmark managed by agriculture, Biogeosciences, 9, 403–422, https://doi.org/10.5194/bg-9-403-2012, 2012.
Pönisch, D. L.: Methodenentwicklung und -anwendung zur Analytik von Methan und Lachgas in Seewasser, Leibniz Institute for Baltic Sea Research Warnemünde (IOW), Master thesis, 2018.
Pönisch, D. L. and Breznikar, A.: Supplementary data of the discrete water sampling used in the publication “Nutrient release and flux dynamics of CO2, CH4, and N2O in a coastal peatland driven by actively induced rewetting with brackish water from the Baltic Sea”, IOW [data set], https://doi.org/10.12754/data-2022-0003, 2022.
Pönisch, D. L. and Gutekunst, C. N.: Supplementary data for greenhouse gas emissions used in the publication “Nutrient release and flux dynamics of CO2, CH4, and N2O in a coastal peatland driven by actively induced rewetting with brackish water from the Baltic Sea”, IOW [data set], https://doi.org/10.12754/data-2022-0004, 2022.
Rassamee, V., Sattayatewa, C., Pagilla, K., and Chandran, K.: Effect of oxic and anoxic conditions on nitrous oxide emissions from nitrification and denitrification processes, Biotechnol. Bioeng., 108, 2036–2045, https://doi.org/10.1002/bit.23147, 2011.
R Core Team : R: A language and environment for statistical computing, R Foundation for Statistical Computing, Vienna, Austria, https://www.R-project.org/ (last access: 10 January 2023), 2021.
Reeburgh, W. S.: Oceanic methane biogeochemistry, Chem. Rev., 107, 486–513, https://doi.org/10.1021/cr050362v, 2007.
Regina, K., Nykänen, H., Silvola, J., and Martikainen, P. J.: Fluxes of nitrous oxide from boreal peatlands as affected by peatland type, water table level and nitrification capacity, Biogeochemistry, 35, 401–418, https://doi.org/10.1007/BF02183033, 1996.
Regina, K., Silvola, J., and Martikainen, P. J.: Short-term effects of changing water table on N2O fluxes from peat monoliths from natural and drained boreal peatlands, Glob. Change Biol., 5, 183–189, https://doi.org/10.1046/j.1365-2486.1999.00217.x, 1999.
Richert, M., Dietrich, O., Koppisch, D., and Roth, S.: The Influence of Rewetting on Vegetation Development and Decomposition in a Degraded Fen, Restor Ecology, 8, 186–195, https://doi.org/10.1046/j.1526-100x.2000.80026.x, 2000.
Roughan, B. L., Kellman, L., Smith, E., and Chmura, G. L.: Nitrous oxide emissions could reduce the blue carbon value of marshes on eutrophic estuaries, Environ. Res. Lett., 13, 44034, https://doi.org/10.1088/1748-9326/aab63c, 2018.
Rysgaard, S., Thastum, P., Dalsgaard, T., Christensen, P. B., Sloth, N. P., and Rysgaard, S.: Effects of Salinity on NH Adsorption Capacity, Nitrification, and Denitrification in Danish Estuarine Sediments, Estuaries, 22, 21–30, https://doi.org/10.2307/1352923, 1999.
Sabbaghzadeh, B., Arévalo-Martínez, D. L., Glockzin, M., Otto, S., and Rehder, G.: Meridional and Cross-Shelf Variability of N2O and CH4 in the Eastern-South Atlantic, J. Geophys. Res.-Oceans, 126, e2020JC016878, https://doi.org/10.1029/2020JC016878, 2021.
Schneider, B. and Müller, J. D. (Eds.): Biogeochemical Transformations in the Baltic Sea, Springer International Publishing AG, Springer Oceanography, https://doi.org/10.1007/978-3-319-61699-5, 2018.
Schönheit, P., Kristjansson, J. K., and Thauer, R. K.: Kinetic mechanism for the ability of sulfate reducers to out-compete methanogens for acetate, Arch. Microbiol., 132, 285–288, 1982.
Segarra, K. E., Comerford, C., Slaughter, J., and Joye, S. B.: Impact of electron acceptor availability on the anaerobic oxidation of methane in coastal freshwater and brackish wetland sediments, Geochim. Cosmochim. Ac., 115, 15–30, https://doi.org/10.1016/j.gca.2013.03.029, 2013.
Segers, R. and Kengen, S.: Methane production as a function of anaerobic carbon mineralization: A process model, Soil Biol. Biochem., 30, 1107–1117, https://doi.org/10.1016/S0038-0717(97)00198-3, 1998.
Seifert, T., Tauber, F., and Kayser, B.: A high resolution spherical grid topography of the Baltic Sea, 2nd Edn., Baltic Sea Science Congress, 25–29 November 2001, Stockholm, Poster #147, 2001.
Smolders, A. J. P., Lamers, L. P. M., Lucassen, E. C. H. E. T., van der Velde, G., and Roelofs, J. G. M.: Internal eutrophication: How it works and what to do about it – a review, Chem. Ecol., 22, 93–111, https://doi.org/10.1080/02757540600579730, 2006.
Steinle, L., Maltby, J., Treude, T., Kock, A., Bange, H. W., Engbersen, N., Zopfi, J., Lehmann, M. F., and Niemann, H.: Effects of low oxygen concentrations on aerobic methane oxidation in seasonally hypoxic coastal waters, Biogeosciences, 14, 1631–1645, https://doi.org/10.5194/bg-14-1631-2017, 2017.
Steinmuller, H. E. and Chambers, L. G.: Can Saltwater Intrusion Accelerate Nutrient Export from Freshwater Wetland Soils? An Experimental Approach, Soil Sci. Soc. Am. j., 82, 283–292, https://doi.org/10.2136/sssaj2017.05.0162, 2018.
Strack, M. (Ed.): Peatlands and climate change, Internat. Peat Soc., ISBN 978-952-99401-1-0, 2008.
Succow, M. and Joosten, H. (Eds.): Landschaftsökologische Moorkunde, E. Schweizerbart'sche Verlagsbuchhandlung (Nägele u. Obermiller), ISBN 978-3-510-65198-6, 2001.
Thomas, H. and Schneider, B.: The seasonal cycle of carbon dioxide in Baltic Sea surface waters, J. Marine Syst., 22, 53–67, https://doi.org/10.1016/S0924-7963(99)00030-5, 1999.
Treude, T., Krüger, M., Boetius, A., and Jørgensen, B. B.: Environmental control on anaerobic oxidation of methane in the gassy sediments of Eckernförde Bay (German Baltic), Limnol. Oceangr., 50, 1771–1786, https://doi.org/10.4319/lo.2005.50.6.1771, 2005.
van de Riet, B. P., Hefting, M. M., and Verhoeven, J. T. A.: Rewetting Drained Peat Meadows: Risks and Benefits in Terms of Nutrient Release and Greenhouse Gas Exchange, Water Air Soil Pollut., 224, 1440, https://doi.org/10.1007/s11270-013-1440-5, 2013.
Voss, M., Deutsch, B., Liskow, I., Pastuszak, M., Schulte, U., and Sitek, S.: Nitrogen retention in the Szczecin Lagoon, Baltic Sea, Isot. Environ. Healt. S., 46, 355–369, https://doi.org/10.1080/10256016.2010.503895, 2010.
Wang, M., Liu, H., and Lennartz, B.: Microtopography effects on carbon accumulation and nutrient release from rewetted coastal wetlands, AGU Fall Meeting 2021, New Orleans, LA, 13–17 December 2021, id. B55D-1237, 2021.
Wanninkhof, R.: Relationship between wind speed and gas exchange over the ocean revisited, Limnol. Oceanogr.-Meth., 12, 351–362, https://doi.org/10.4319/lom.2014.12.351, 2014.
Wasmund, N., Topp, I., and Schories, D.: Optimising the storage and extraction of chlorophyll samples, Oceanologia, 48, 125–144, 2006.
Weiss, R. F. and Price, B. A.: Nitrous oxide solubility in water and seawater, Mar. Chem., 8, 347–359, https://doi.org/10.1016/0304-4203(80)90024-9, 1980.
Wickham, H., Averick, M., Bryan, J., Chang, W., McGowan, L. D., François, R., Grolemund, G., Hayes, A., Henry, L., Hester, J., Kuhn, M., Pedersen, T. L., Miller, E., Bache, S. M., Müller, K., Ooms, J., Robinson, D., Seidel, D. P., Spinu, V., Takahashi, K., Vaughan, D., Wilke, C., Woo, K., and Yutani, H.: Welcome to the tidyverse, Journal of Open Source Software, 4, 1686, https://doi.org/10.21105/joss.01686, 2019.
Wolf-Gladrow, D. A., Zeebe, R. E., Klaas, C., Körtzinger, A., and Dickson, A. G.: Total alkalinity: The explicit conservative expression and its application to biogeochemical processes, Mar. Chem., 106, 287–300, https://doi.org/10.1016/j.marchem.2007.01.006, 2007.
Zak, D. and Gelbrecht, J.: The mobilisation of phosphorus, organic carbon and ammonium in the initial stage of fen rewetting (a case study from NE Germany), Biogeochemistry, 85, 141–151, https://doi.org/10.1007/s10533-007-9122-2, 2007.
Zak, D., Meyer, N., Cabezas, A., Gelbrecht, J., Mauersberger, R., Tiemeyer, B., Wagner, C., and McInnes, R.: Topsoil removal to minimize internal eutrophication in rewetted peatlands and to protect downstream systems against phosphorus pollution: A case study from NE Germany, Ecol. Eng., 103, 488–496, https://doi.org/10.1016/j.ecoleng.2015.12.030, 2017.
Zielinski, T., Sagan, I., and Surosz, W. (Eds.): Interdisciplinary Approaches for Sustainable Development Goals, Springer International Publishing, https://doi.org/10.1007/978-3-319-71788-3, 2018.
- Abstract
- Introduction
- Material and methods
- Results
- Discussion
- Conclusions and outlook
- Appendix A: Study area
- Appendix B: Nutrient export calculation
- Appendix C: Comparability of two independent approaches to atmospheric flux determination
- Appendix D: Nutrient cross-plots
- Data availability
- Author contributions
- Competing interests
- Disclaimer
- Acknowledgements
- Financial support
- Review statement
- References