the Creative Commons Attribution 4.0 License.
the Creative Commons Attribution 4.0 License.
 | 31 Jul 2023
Potassium limitation of forest productivity – Part 2: CASTANEA-MAESPA-K shows a reduction in photosynthesis rather than a stoichiometric limitation of tissue formation
Guerric le Maire
Jean-Paul Laclau
Joannès Guillemot
Yann Nouvellon
Nicolas Delpierre
Potassium (K) availability constrains forest productivity. Brazilian eucalypt plantations are a good example of the K limitation of wood production. Here, we built upon a previously described model (CASTANEA-MAESPA-K) and used it to understand whether the simulated decline in C source under K deficiency was sufficient to explain the K limitation of wood productivity in Brazilian eucalypt plantations. We developed allocation schemes for both C and K and included these in CASTANEA-MAESPA-K. Neither direct limitations of the C-sink activity nor direct modifications of the C allocation by K availability were included in the model. Simulation results show that the model was successful in replicating the observed patterns of wood productivity limitation by K deficiency. Simulations also show that the response of net primary productivity (NPP) is not linear with increasing K fertilisation. Simulated stem carbon use and water use efficiencies decreased with decreasing levels of K availability. Simulating a direct stoichiometric limitation of NPP or wood growth was not necessary to reproduce the observed decline of productivity under K limitation, suggesting that K stoichiometric plasticity could be different to that of N and P. Confirming previous results from the literature, the model simulated an intense recirculation of K in the trees, suggesting that retranslocation processes were essential for tree functioning. Optimal K fertilisation levels calculated by the model were similar to nutritional recommendations currently applied in Brazilian eucalypt plantations, paving the way for validation of the model at a larger scale and of this approach for developing decision-making tools to improve fertilisation practices.
- Article
(2718 KB) - Full-text XML
- Companion paper
-
Supplement
(691 KB) - BibTeX
- EndNote


Fertilisation trials in tropical eucalypt plantations have been conducted over multiple rotations (Laclau et al., 2010; Battie-Laclau et al., 2016; Gazola et al., 2019; Gonçalves, 2000). These experiments have shown that nutrients can strongly affect tree growth in these highly productive stands. These nutrient limitations can be explained in part by low nutrient supplies from highly weathered soils and in part by the large exports of nutrients with trunk wood (every 6–7 years) from the stands. The frequent export of trunk wood in these fast-growing plantations leads to the export of massive amounts of nutrients that are immobilised in wood (Cornut et al., 2021). In commercial plantations, this issue is solved through the use of fertilisers (NPK, dolomitic lime, and micro-nutrients).
Potassium (K) has been identified as the most limiting nutrient for wood productivity in many omission trials (Gonçalves, 2000; Rocha et al., 2019). Potassium nutrition impacts wood growth through different physiological mechanisms that have been reviewed in detail (Sardans and Peñuelas, 2015; Cornut et al., 2021). In brief, K deficiency is known to depress the assimilation of carbon by the plant (C-source processes, gross primary production), as well as the allocation and use of carbon by the plant for growth (C-sink processes, net primary production).
The study of the limitation of gross primary production (GPP, C source) by K deficiency was explored at the stand level in Part 1 (Cornut et al., 2023) of this series of two papers, using a coupled C–H2O–K mechanistic model (CASTANEA-MAESPA-K). The simulations showed a strong response of GPP to K deficiency. The GPP in the simulated K omission stand was less than half of that in the simulated fertilised stand (Table 2, Cornut et al., 2022). These results were consistent with previous measurements (Epron et al., 2012) and modelling work (Christina et al., 2018). The strong response of GPP to K availability was due to a reduction in leaf area index and in the photosynthetic capacity per unit area of leaf. The reduction in canopy area was due in part to a slight reduction in leaf production, in part to a decrease in individual leaf area, and in part to a strong decrease in leaf lifespan (Fig. 4, Cornut et al., 2022). The reduction in the photosynthetic capacity of the canopy was associated with the appearance of leaf symptoms in the K-deficient (oK) stand. The impact of symptom area on leaf photosynthetic capacity was sufficient to explain most of the reduction in leaf-scale assimilation in the unfertilised case. A decrease of WUEGPP (ratio of GPP to transpiration) in the simulated oK stand was also simulated. A sensitivity analysis of the model parameters showed that competition between the organs (trunk, branches, bark, and roots) and leaves for K access had an important impact on GPP in the oK stand (the leaf-to-phloem resorption resistance, Rleaf→phloem; Fig. 7 in Cornut et al., 2022). This underlined the need for a precise understanding of K circulation and stoichiometry in the plant.
The impact of K deficiency on net primary productivity (NPP) is a widely observed phenomenon in non-planted forests (Tripler et al., 2006; Baribault et al., 2012) and in planted-forest omission experiments (Laclau et al., 2010; Battie-Laclau et al., 2016; Gazola et al., 2019). While a negative effect of K deficiency on GPP is well documented, the magnitude of its contribution to the decrease in trunk NPP remains unclear. Potassium deficiency also impacts phloem mobility (Epron et al., 2016; Marschner et al., 1996), as well as the loading and unloading of sugars into and from the phloem (Doman and Geiger, 1979; Cakmak et al., 1994; Dreyer et al., 2017). Furthermore, various processes have been described that could explain a sink limitation of tree growth under K deficiency: it could directly impact organ growth by stoichiometric limitation through its role as an enzyme co-factor or its effect on cell turgor pressure (Battie-Laclau et al., 2013), which is necessary for tissue expansion (Lockhart, 1965; Muller et al., 2011; Pantin et al., 2012). The present paper focuses on the simulation of the relationship between soil K availability and the NPP of all the main tree organs.
The objectives of the present study were to understand the following:
-
the impact of K deficiency on the NPP of a Brazilian eucalypt stand representative of large areas of commercial eucalypt plantations
-
whether the influence of K availability on GPP is sufficient to explain the differences in wood productivity between K-fertilised and K-deficient stands
-
the link between C partitioning and K availability in the plant–soil system
-
which parts of the K cycle are the most critical to simulate accurately the consequences of K limitation on wood productivity
-
if K:C stoichiometry can contribute to explaining the observed patterns of organ NPP.
We have built on the results related to the K–GPP relationship previously obtained. To this end, the C and K allocation schemes of CASTANEA-MAESPA-K were adapted to Brazilian eucalypt stands. The model was evaluated against data obtained in a K fertilisation–omission experiment (Cornut et al., 2023). To test the hypothesis of sink limitation of wood NPP, the parsimony principle was applied. In other words, we mean that we did not introduce more processes in the model if those that were already included could explain the observed patterns. Since the model did not include any explicit sink limitation process, if it was able to replicate observed productivity patterns, that meant that C-source limitation was sufficient to explain wood productivity limitation by K deficiency.
2.1 Study site
A split-plot fertilisation trial was installed at the Itatinga experimental station (23∘02′49′′ S and 48∘38′17′′ W; 860 m a.s.l; University of São Paulo-ESALQ). The precipitation was, on average, 1430 mm yr−1, with a drier season between June and September, and the mean annual temperature was 19.3°C. The trial was established on June 2010 for 6 years. The planted clone was a fast growing Eucalyptus grandis. The experimental design was described in detail in Battie‐Laclau et al. (2014). Six treatments (three fertilisation regimes crossed with two water regimes) were applied in three blocks. In the present study, we focus on the +K and oK treatments with an undisturbed rainfall regime: a non-limiting K fertilisation (+K) with 17.55 gK m−2 applied as KCl; 3.3 gP m−2 and 200 g m−2 of dolomitic lime and trace elements at planting and 12 gN m−2 at 3 months of age; and an omission treatment (oK) where all fertilisation was applied as in the +K treatment, except the KCl.
The concentrations of N, P, and K (as well as of Ca and Mg) in the organs (leaves, trunks, branches, and roots) were measured at an annual time step in eight individual trees of each fertilisation treatment and were upscaled to the whole stand using allometric relationships. Biomass and nutrient contents were calculated (using upscaling) from inventories, biomass, and nutrient concentration measurements performed in each fertilisation treatment at years 1, 2, 3, 4, 5, and 6 after planting. Atmospheric deposition (0.55 gK m−2 yr−1) was measured in a nearby experiment from Laclau et al. (2010).
2.2 CASTANEA-MAESPA-K model
CASTANEA-MAESPA-K (Cornut et al., 2023) is a coupled C–H2O–K mechanistic model that simulates forest growth at the stand level. The original CASTANEA model (Dufrêne et al., 2005), generally used to simulate temperate forest stands, was adapted to tropical eucalypt plantations. It was merged with the MAESPA model (Duursma and Medlyn, 2012; Christina et al., 2017). since it does not simulate the water–plant–atmosphere hydraulic continuum natively and since the assumption of a fixed root depth made by CASTANEA did not hold true in the studied system (Christina et al., 2011). More information on the construction of the CASTANEA-MAESPA-K model and a overview schematic can be found in Part 1 (Cornut et al., 2023) of this two-part paper.
Here, we focused on NPP (for GPP, see Cornut et al., 2022), which led to us concentrating our efforts on the C and K allocation models (Fig. 1). All the sub-models (leaf cohorts, external K cycling, uptake) described in Part 1 (Cornut et al., 2022) were re-used, albeit sometimes with different parameter values (Table S1–S2 in the Supplement), since the simulated experimental sites were different. While used implicitly in the modelling work of the companion paper (to be able to simulate K fluxes), the new modules simulating the carbon allocation, the availability of K for organ growth, and the remobilisation of K from organs developed for this work are presented below.
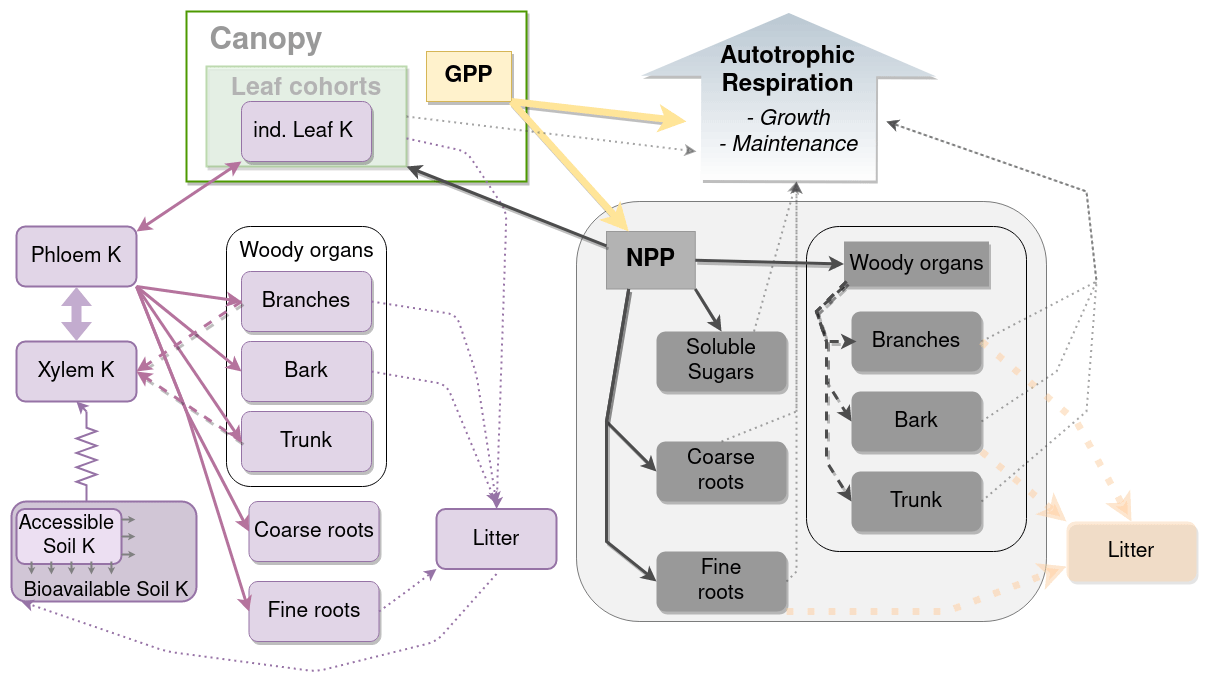
Figure 1Schematic representation of K balance in the tree and its link with the allocation model. Purple boxes are K state variables, while purple arrows are K fluxes. Dashed purple arrows are remobilisation fluxes. The K uptake flux simulated with a simple Ohm's law form is represented with resistance symbols. Grey boxes represent C biomasses. Dark-grey arrows represent the allocation of NPP to the different organs. Thin dotted grey arrows represent the influence of the organ biomass on respiration.
2.3 Carbon allocation
In the CASTANEA model, carbon of assimilates was allocated to organ growth and soluble sugars (SSs) after a part of it was released to the atmosphere through maintenance respiration and growth respiration processes. SSs are not localised in the model which, for the carbon part, has no topology. So SSs are hypothesised to be part of the phloem and other tissues, indistinctly. This is different from the K content of the plant that we localised in either the organs or the semi-explicit phloem and xylem saps.
In the model, leaves had priority over other organs with regards to the allocation of carbon. This means that carbon was firstly allocated to leaves, and what was left could be allocated to the other organs. Leaf production in the model was driven by the increase in tree height (see Cornut et al., 2022, and Eq. 8 below). The parameters used here were fitted using experimental data from the +K stand. Leaf growth could, however, be limited if the demand for growth was higher than the available C in the SS compartment. The growth of all other organs was a fraction of the daily NPP minus leaf biomass production (Fig. 1). The allocation coefficients of each organ, except those of leaves (i.e. fine roots, coarse roots, woody organs), were calculated at a daily time step and were the result of NPP and allometric relationships among organs.
2.3.1 Soluble sugars
The optimal biomass of whole-tree SSs () was a function of woody organ biomass (Eq. S1 in the Supplement). The allocation coefficient to SSs with a target value corresponding to this optimal biomass was calculated as follows:
where GSS (unitless) is the allocation coefficient of SSs, BSS (gC m−2) is the biomass of SSs, (unitless) is the maximum allocation coefficient of SSs, (gC m−2) is the optimal biomass of SSs, and pSS is the sensitivity of the response of the allocation coefficient to soluble-sugar deficiency. The values of the parameters of this function were chosen to ensure realistic values of SSs. Measurement-based parameterisation was impossible since no whole-tree SS measurements were conducted in eucalypts at these sites.
2.3.2 Roots
In accordance with experiment evidence in the fertilisation experiments, the allocation coefficient of coarse roots, GCR (unitless), was set to a constant,
The allocation coefficient of carbon to fine roots, GFR (unitless), was similar to that of Marsden et al. (2013). It used a target function, where the fine-root target biomass was a function of leaf area index:
where GCR and GSS (unitless) are the allocation coefficients of coarse roots (Eq. 2) and SSs (Eq. 1) respectively, BFR (gC m−2) is the fine-root biomass, λ (gC m) is the conversion coefficient between leaf area and target root biomass, L (m m) is the leaf area index of the stand, and pFR is a sensitivity parameter.
2.3.3 Woody organs
The remaining C available after allocation of NPP to leaves, roots, and SSs was allocated to the woody organs (trunk, branches and bark):
where GW (unitless) is the allocation coefficient to woody organs; and GFR, GCR, and GSS are the allocation to fine roots (Eq. 3), coarse roots (Eq. 2), and soluble sugars (Eq. 1) respectively.
The C allocated to woody organs was then distributed to the different woody organs (trunk, branches, and bark) using allometric relationships.
Parameters of the function linking the allocation of woody NPP to branches in the function of total woody biomass were fitted on experimental data. The following equation was used in the model:
where GBr (unitless) is the ratio of woody NPP allocated to branch production, and Btrunk, BBr, and Bbark are the biomasses (gC m−2) of the trunk, branches, and bark respectively.
Following experimental data, the allocation of woody NPP to bark was considered to be constant.
All the C remaining after allocation of woody NPP to the bark and the branches was used for trunk wood production.
The increase in height was a function of trunk biomass. The relationship was fitted in the +K stand using biomass and inventory data (Fig. S1 in the Supplement):
where H (m) is the height of the stand, and Btrunk (gC m−2) is the biomass of the trunk.
2.4 Autotrophic respiration fluxes
2.4.1 Growth respiration
Organ growth was calculated at a daily time step. In the base CASTANEA model, growth respiration was calculated using the daily growth of the organ and the associated construction cost (Dufrêne et al., 2005). In this study, the construction cost of trunk wood was based on the age of the plantation following Ryan et al. (2009):
where GRCtrunk (gC gC−1) is the growth respiration cost associated with 1 gC of trunk wood increment, and age (days) refers to the age of the plantation. Due to the lack of available data, the growth respiration for other organs used values identical to those used in Dufrêne et al. (2005).
The daily growth respiration associated with each respective organ was the following:
, where GRorgan (gC m−2 d−1) is the growth respiration of the organ, GRCorgan (gC gC−1) is the growth respiration cost of the organ, and ΔBorgan (gC m−2 d−1) is the daily growth in the biomass of the organ.
2.4.2 Maintenance respiration
The hourly maintenance respiration for all organs (except leaves, which had a respiration rate based on their vertical position in the canopy; Christina et al., 2015) was a function of their respective respiration rate per nitrogen unit (see below), nitrogen content, and surface temperature (Dufrêne et al., 2005).
Firstly the respiration rates per unit biomass were calculated. For the trunk, we used data from Ryan et al. (2009) to calculate the maintenance respiration rate per unit biomass as a function of trunk biomass:
where MRNtrunk (gC gN−1 h−1) is the respiration rate of the trunk per nitrogen unit at a reference temperature of 25 ∘C, Btrunk is the trunk biomass in gC m−2, (gC gN−1 h−1) is the minimum rate of respiration per unit nitrogen, (gC.gN−1 h−1) is the maximum rate of respiration per unit nitrogen, and (gN−1 h−1) is the slope between trunk biomass and respiration rate per nitrogen unit. Values for these parameters are reported in Table S2 in the Supplement. The respiration rate per nitrogen unit of the roots (MRNR) and branches (MRNBr) was assumed to be equal to twice the MRNtrunk.
Assuming a C content of 50 %, the N content of roots was fixed at 0.0050 gN gC−1, since no variation was visible in the experimental data. The N content of branches and trunks was a decreasing exponential function of their respective biomasses that was calibrated using experimental data as follows (Fig. S2 in the Supplement):
where Ntrunk and Nbranches are the respective N concentrations (gN gC−1) of the trunk and the branches, and Btrunk and Bbranches are the respective biomasses (gC m−2) of the branches and the trunk. The N content of leaves and bark was not simulated, since N content did not influence the respiration of leaves in our model and since bark had no maintenance respiration.
Following Dufrêne et al. (2005), the maintenance respiration of an organ (except leaves, see below) was
where RMorgan (gC h−1 m−2) is the respiration rate of the organ, Borgan (gC m−2) is the biomass of the organ, MRNorgan is the respiration rate per unit nitrogen (gC gN−1 h−1, Eq. 11), Norgan (gN gC−1) is the N concentration of the organ, and Q10 is the exponential relationship between the respiration rates and temperature.
The maintenance respiration of leaves was their dark respiration (inhibited during the day), Rd, and the values measured in K-fertilised trees in a nearby site (Eucflux) were used (Fig. S1 in Christina et al., 2017).
2.5 Organ turnover
With the exception of the coarse roots and the trunk, the organs (branches, bark, fine roots) were subject to turnover. Branches, bark, fine roots, and leaves each had lifespans.
In simulations, the theoretical (independent of K limitation effects) leaf lifespan (LLS) was considered to be constant throughout the rotation. This option was chosen because we were unable to mechanistically model the observed variations in leaf lifespan. The realised lifespan of leaves was influenced by their K status (leaves fell when their K concentration was below a certain threshold; see Sect. 2.5.3 in Cornut et al., 2022). We assumed that the lifespans of bark (BarkLS, Fig. S3b in the Supplement), branches (BrLS, Fig. S3a in the Supplement), and fine roots (FRLS, Lambais et al. (2017)) depended on neither tree age nor the nutritional status of the organs.
The necromass of most organs was added to the litter pool. On the other hand, dead branches were added to the dead-branch pool. The dead-branch pool represented the branches that stay attached to the tree after senescence. The dead-branch pool had a specific turnover rate.
Resorption of K took place during the senescence of leaves (Cornut et al., 2022) and branches (Fig. S4a in the Supplement). K remobilised from these two organs was added to the phloem sap K pool. While the resorption rate for leaves was dependent on the nutritional status of the tree and their theoretical lifespan, it was fixed for branches.
2.6 K allocation
The allocation of K to organs was a function of the optimal K concentration of newly formed organ tissue, organ NPP, and K availability in the tree. Firstly, organ NPP was calculated by allocating part of GPP to the organs after subtracting the respiration. Then, the total K quantity required was calculated by multiplying the growth of each organ by its optimal K concentration (the concentration of newly formed organs in the fully fertilised stand). If the quantity of available K in the phloem sap was inferior to the demand, K allocation to the organs was limited without affecting C allocation to the organ's growth. This was equivalent to flexible stoichiometry in other models.
where KNPP (gK m−2 d−1) is the quantity of K necessary for optimal stoichiometry of newly formed organ biomass, NPPorg (gC m−2 d−1) is the daily net primary production minus the allocation to the leaves, K (gK gC−1) is the optimal concentration of the considered organ (Eqs. 17–19), and Gorg is the allocation coefficient of that organ (Eqs. 2–4).
The quantity of available K was a function of K content in the phloem sap and the minimal quantity of K in the phloem sap (Cornut et al. 2022):
where Kavailable (gK m−2 d−1) is the amount of K available for organ growth, Kphloem (gK m−2) is the amount of K in the phloem sap, K (gK m−2) is the minimal amount of K in the phloem sap (Cornut et al., 2022), and Δt (days) is the time step (1 d in our simulations).
The limitation of K allocation to newly formed organ nutrient content was simply the ratio between available K and K demand:
where Kavailable is from Eq. (15), KNPP (gK m−2 d−1) is the amount of K needed for optimal stoichiometry of newly formed woody organs (Eq. 14), and (gK m−2 d−1) is the leaf growth K demand (Cornut et al., 2023). The cycle of K in the leaves is described in Cornut et al. (2022), since it is an integral part of the canopy cohort model.
2.6.1 Trunk wood
Due to the continuous phenology of tropical eucalypt trees, K dynamics in trunk wood were simulated through daily cohorts of trunk wood. This was also the preferred modelling choice, since it provided a mechanistic explanation for trunk wood remobilisation throughout trunk wood ageing (that we considered to be leaching of K from sapwood into the xylem sap). The trunk NPP was allocated daily to a newly formed cohort of trunk wood. In parallel, the optimal K concentration of newly formed trunk wood ([K]) was constant and equal to the maximum trunk wood concentration measured by the fertilisation experiment (Fig. S5 in the Supplement). The realised concentration of newly formed trunk wood was a function of the optimal K concentration of newly formed trunk wood and the strength of K supply limitation; i.e. the K content of cohort i at its creation was the following:
where (gK m−2 d−1) is the flux of K to the cohort i at the time of its creation, [K] (gK gC−1) is the optimal concentration of newly formed trunk wood, Lim is the limitation by K availability (Eq. 16), and NPPtrunk (gC m−2 d−1) is the daily trunk wood increment.
2.6.2 Branches
The optimal K concentration of newly formed branches was a function of the branch biomass,
where [K] is the K concentration of the newly formed branches in gK gC−1, and BBr is the branch biomass in gC m−2. This decreasing function was fitted on experimental nutrient content and biomass data collected in the fertilised plots.
2.6.3 Bark
The optimal K concentration of newly formed bark was a function of the bark biomass,
where [K] is the K concentration of the newly formed bark in gK gC−1, and BBark is the bark biomass in gC m−2. The parameters for this function were fitted on experimental data collected in the fertilised plots. No remobilisation was considered for bark, since there no measurements were available.
2.6.4 Roots
The optimal K concentration (in gK gC−1) of coarse ([K]) and fine roots ([K]) was a fixed value independent of tree age or biomass. Due to the absence of data regarding this process, the model did not simulate remobilisation from roots. The K content of dead fine roots was added to the K litter pool, which in turn leached into the soil available K and could be taken up by other living roots.
2.7 K remobilisation and turnover
2.7.1 Branches
Before falling as litter to the ground, branches that die stay attached some months to the tree. Whenever dead branches are mentioned, we mean dead branches still attached to the trunk. During branch death, part of the branch K was remobilised into Kxylem. The remobilisation efficiency (RKBranch, Eq. 20) was considered to be constant and was calculated using the difference between the dead-branch and live-branch K concentration in experimental data. The value of remobilisation rate used in the model was calculated based on the K remobilisation rate of branches during the first year of the rotation to avoid including the impact of leaching from dead branches (Fig. S4 in the Supplement). Indeed, we postulated that the dead branches present in the first year of the rotation were younger than those present at later stages, reducing the potential for leaching flux and the impact on branch K remobilisation calculations. Leaching fluxes from dead branches remaining attached to the tree trunk were assumed to be linearly related to the duration of time a dead branch remained on the tree.
2.7.2 Trunk
Since the K concentration of the total trunk tissue decreases with trunk biomass, it was necessary to implement trunk wood K remobilisation in the model. A model where the remobilisation rate was dependent on trunk wood production was the best suited for this task, since it showed the best fit with experimental data when compared to a model where remobilisation was independent of trunk wood production. The following equation was used:
where K (gK m−2 d−1) is the remobilisation of K from the cohort i, K (gK m−2) is the K mineralomass of the trunk wood cohort i, TKtrunk (gC−1 m2) is the remobilisation rate per unit of trunk wood production, and NPPtrunk (gC m−2 d−1) is the daily trunk increment. Remobilised K was allocated to Kxylem. If the K concentration of the cohort ([K]) was lower than a threshold value [K] (gK gC−1), there was no remobilisation (K). The threshold, [K], was determined from the minimum asymptote of the relationship between trunk wood biomass and trunk wood K concentration in the fertilisation experiment (Fig. S5 in the Supplement). This measured value was assumed to be the minimum concentration of a cohort, since it was assumed that, at a high-enough wood biomass, the proportion of K associated with newly formed wood to the total wood K content was negligible (Augusto et al., 2000). This meant that the measured concentration of trunk wood as a whole was similar to the minimum concentration of K in the trunk at high-enough trunk biomass.
2.7.3 Total remobilisation in woody organs
Total remobilisation was the flux of K from the woody organs to the xylem. It was calculated as the following:
where Kremob (gK m−2 d−1) was the total remobilisation flux, Ktrunk→xylem (gK m−2 d−1) the remobilisation rate of wood, RKbranches (unitless) the remobilisation rate of dying branches and K (gK m−2 d−1) the flux of K from living branches to dead branches.
2.8 Simulations
The simulation initialisations were conducted to resemble as closely as possible the omission experiment. Simulations in the fully fertilised treatment (+K) were initialised with the same fertilisation values as the fertilised control in the experiment (i.e. 17.5 gK m−2), corresponding to a one-time application of fertiliser at planting. Simulations in the K omission treatment (oK) shared the same initialisation, except that the fertiliser pool was initialised with 0 gK.
To investigate the effects of a fertilisation gradient, 10 initialisation values of K pools spanning from no input (in oK) to 17.5 gK (+K) were chosen.
To test whether the fertilisation regime could have an impact on tree productivity, the following two fertilisation regimes were simulated: one where the K dose was brought all at once (as in the experiment) and one where the same K fertiliser dose was broken up into four sub-doses that were temporally spaced (equivalent to the Eucflux experiment; Cornut et al., 2022).
2.9 Analysis
To test the accuracy of the model prediction, the root-mean-square errors of the simulations' output variables were calculated using measurements at the experimental site. The mean of the three experimental blocks (there were three blocks per experimental treatment) was used. To normalise this metric and to have a relative root-mean-square error, the RMSE was divided by the measured mean throughout the rotation of the considered output variable.
To describe the response of resource use efficiency (RUE) to different levels of K availability, we used the following metrics.
2.9.1 Carbon use efficiency
The carbon use efficiencies (CUE) were calculated as the considered simulated C flux summed over the whole rotation (CUENPP for NPP and CUEtrunk for trunk NPP) divided by the simulated GPP flux summed over the whole rotation (De Lucia et al., 2007). It is in fact a measure of the proportion of assimilated carbon that was used for forming tissue, i.e. not re-emitted through autotrophic respiration.
2.9.2 Water use efficiency
The water use efficiencies of NPP (WUENPP), trunk NPP (WUEtrunk), and GPP (WUEGPP) were calculated by dividing the total NPP, trunk NPP, and GPP respectively by the amount of transpired water during the period over which NPP, trunk NPP, and GPP were calculated (here the whole rotation).
2.9.3 Potassium use efficiency
Potassium use efficiencies of GPP (KUEGPP), total NPP (KUENPP), and trunk NPP (KUEtrunk) were calculated by dividing the respective C flux by the maximum amount of K that was immobilised in the plant during the rotation. For example, in the case of (KUENPP),
where KUENPP (gC gK−1) is the K use efficiency of total NPP, k is the number of days in the rotation (days), NPPt (gC m−2) is the daily NPP of the rotation, and K (gK m−2) is the maximum of K that was immobilised in the plant during the rotation (the maximum of total simulated plant K during the rotation). For calculating KUEGPP and KUEtrunk, the numerator of the above fraction can be replaced by GPP or NPPtrunk respectively. There are many alternative ways to calculate nutrient use efficiencies in forests (Turner and Lambert, 2014). Here, we decided to use total K immobilisation instead of uptake, since circulation of K in the system was high, and we think that the maximum amount of K accumulated in standing biomass is a more relevant representation of total system K demand. Indeed, the maximum K accumulated in standing biomass is a proxy of the amount of K necessary in the system and along the rotation for the plant considering its biomass. In systems where there is less restitution to the soil, it would be equivalent to the soil nutrient uptake.
2.9.4 Fertiliser use efficiency
Fertiliser use efficiencies were computed as the difference of cumulated NPP between the simulated K omission stand (oK) and stands simulated with different K fertilisation levels, divided by the amount of K fertiliser added. This allowed us to compute the growth gain in carbon per unit of K fertiliser used as follows:
where FUE (gC gK−1) is the fertiliser use efficiency of NPP for a given level of fertilisation, k is the number of days in the rotation (days), NPPf (gC m−2 d−1) is the daily NPP of the currently considered stand, NPPoK (gC m−2 d−1) is the NPP of the K omission stand, and K (gK m−2 d−1) is the amount of K fertiliser that was added at day i in the considered stand. To obtain FUEGPP or FUEtrunk, this relationship can be applied to either GPP or NPPtrunk respectively.
3.1 Prediction of changes in NPP caused by GPP
The model was capable of replicating most of the NPP and biomass differences between the +K and oK stands (Fig. 2). In the +K stand, the 5-year yearly averaged GPP, NPP, and trunk NPP (NPPtrunk) fluxes were respectively 3966, 1990, and 1159 gC m−2 yr−1. In the oK stand, they were respectively 1781, 715, and 414 gC m−2 yr−1. The GPP, NPP, and NPPtrunk were respectively 55 %, 64 %, and 70 % lower in the oK stand compared to in the +K stand. The reduction in GPP was in line with what was simulated at the Eucflux site (Table 3 of Cornut et al., 2022) and GPP estimations using the total below-ground carbon allocation (TBCA) method applied to C stocks and C fluxes measured throughout the rotation in our experiment (not shown; Giardina and Ryan, 2002). The reduction of NPPtrunk was comparable to data (Fig. 2b). The same could be said for the bark (Fig. 2d) and the branches (Fig. 2f). This led to simulated biomasses in line with measurements in the +K and oK stands for branches (Fig. 2e), bark (Fig. 2c), and the trunk (Fig. 2a). In the +K stand, the RMSEs (and normalised RMSEs in parentheses) of the simulated trunk, branches, bark, leaves, and total aboveground biomass were respectively 385 gC m−2 (12 %), 50 gC m−2 (17 %), 34 gC m−2 (9 %), 48 gC m−2 (19 %), and 363 gC m−2 (9 %). In the oK stand, they were respectively 155 gC m−2 (16 %), 48 gC m−2 (37 %), 25 gC m−2 (17 %), 31 gC m−2 (26 %), and 193 gC m−2 (15 %). The errors of the simulations relative to measured values of total aboveground biomass at month 59 after planting were an underestimation of 24 gC m−2 (−1 %) in the +K stand and an overestimation of 161 gC m−2 (6 %) in the oK stand. This overestimation of aboveground biomass was concurrent to an underestimation of root biomass (Fig. 2i).
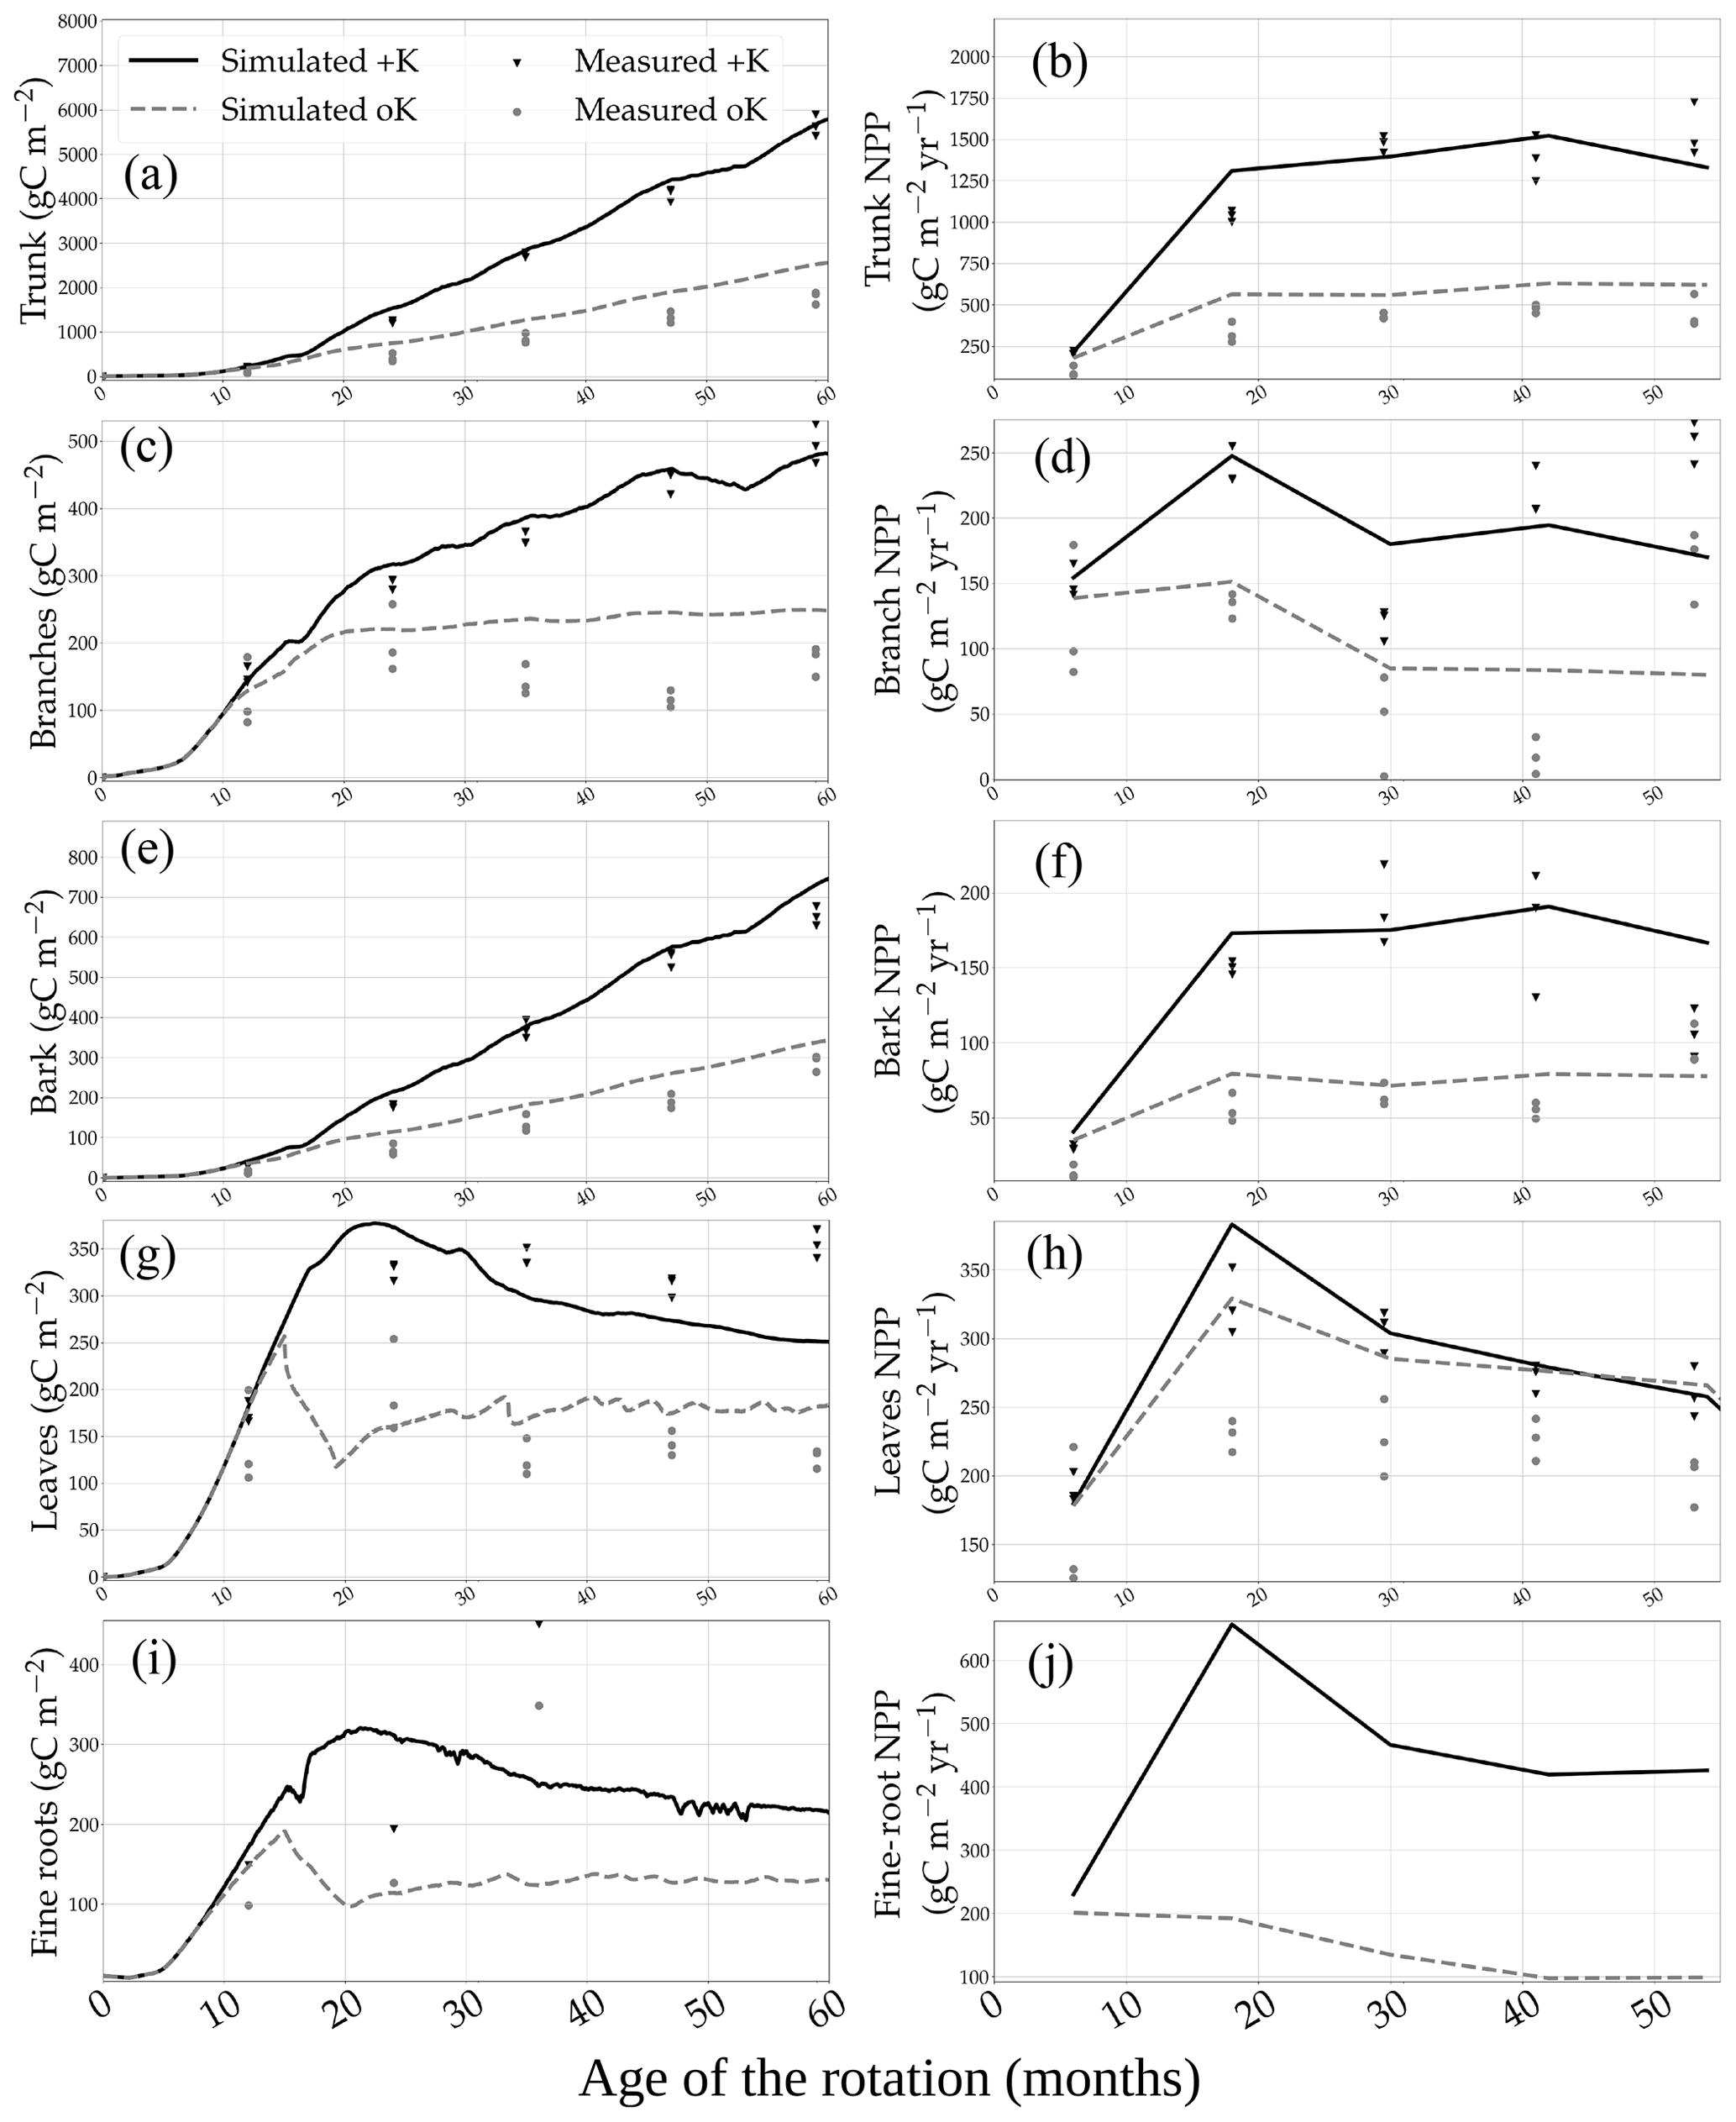
Figure 2Measured and simulated biomass of the different organs in two contrasted K availability scenarios (no K fertilisation, oK, and full K fertilisation, +K) in (a) trunk, (c) bark, (e) branches, (g) leaves, and (i) fine roots. In the right column are the respective measured and simulated annual NPP of each of the following organs: (b) trunk, (d) bark, (f) branches, (h) leaves, and (j) fine roots.
3.2 Consequences of K addition for C allocation patterns within trees
The model allowed the study of allocation in the trees under different K fertilisation regimes. The simulated allocation patterns did not differ greatly between the fertilised and omission stands (Fig. 3a). However, simulated CUENPP was reduced by 23 % in the omission stand (Fig. S6b in the Supplement; 0.40 vs. 0.52). The ratio of wood productivity to GPP (CUEtrunk) was reduced by the same proportion (21 %), showing that the reduction of NPPtrunk followed the same dynamic as the total NPP. Moreover, the difference in CUENPP between the two fertilisation treatments increased throughout the rotation (a 2 % difference the first year and a 17 % difference the fifth year). The trend was similar for CUEtrunk. The difference in CUENPP between the two treatments was mainly due to a relative increase of maintenance respiration in the oK stand, where it accounted for 48 % of the GPP compared to 34 % in the +K stand. For CUEtrunk, this was further amplified by leaf NPP representing 13 % of GPP in oK compared to 7 % in +K.
The model was also capable of simulating the response of the different carbon fluxes, along the stand rotation, to a gradient of initial K fertilisation (Fig. 3b). It showed that the responses of GPP, NPP, and wood productivity to fertilisation all saturated at around 11 gK m−2 for a 5-year rotation. The simulated carbon fluxes did not show any sensitivity to the fertilisation application regime (one- or four-time application; Fig. S6a in the Supplement). The simulations conducted with the one-time application at planting compared with the same amount of K split into four applications at months 0, 3, 10, and 20 after planting showed little to no difference in GPP, NPP, and NPPtrunk (Fig. S6a in the Supplement). The wood productivity was similar in all fertilisation treatments in the first year of the rotation (Fig. 3). This result was in contrast to experimental data that show that the relative difference in organ NPP appears early in the rotation (Laclau et al., 2009). While the response of CUENPP resembled a linear function before it saturated at a fertilisation of 11 gK m−2, the response of CUEtrunk followed a non-linear response (Fig. S6b in the Supplement) by increasing from 0 to 2 gK m−2 of fertilisation added as KCl fertiliser, saturating between 2 and 4 gK m−2 and increasing linearly between 4 and 11 gK m−2.
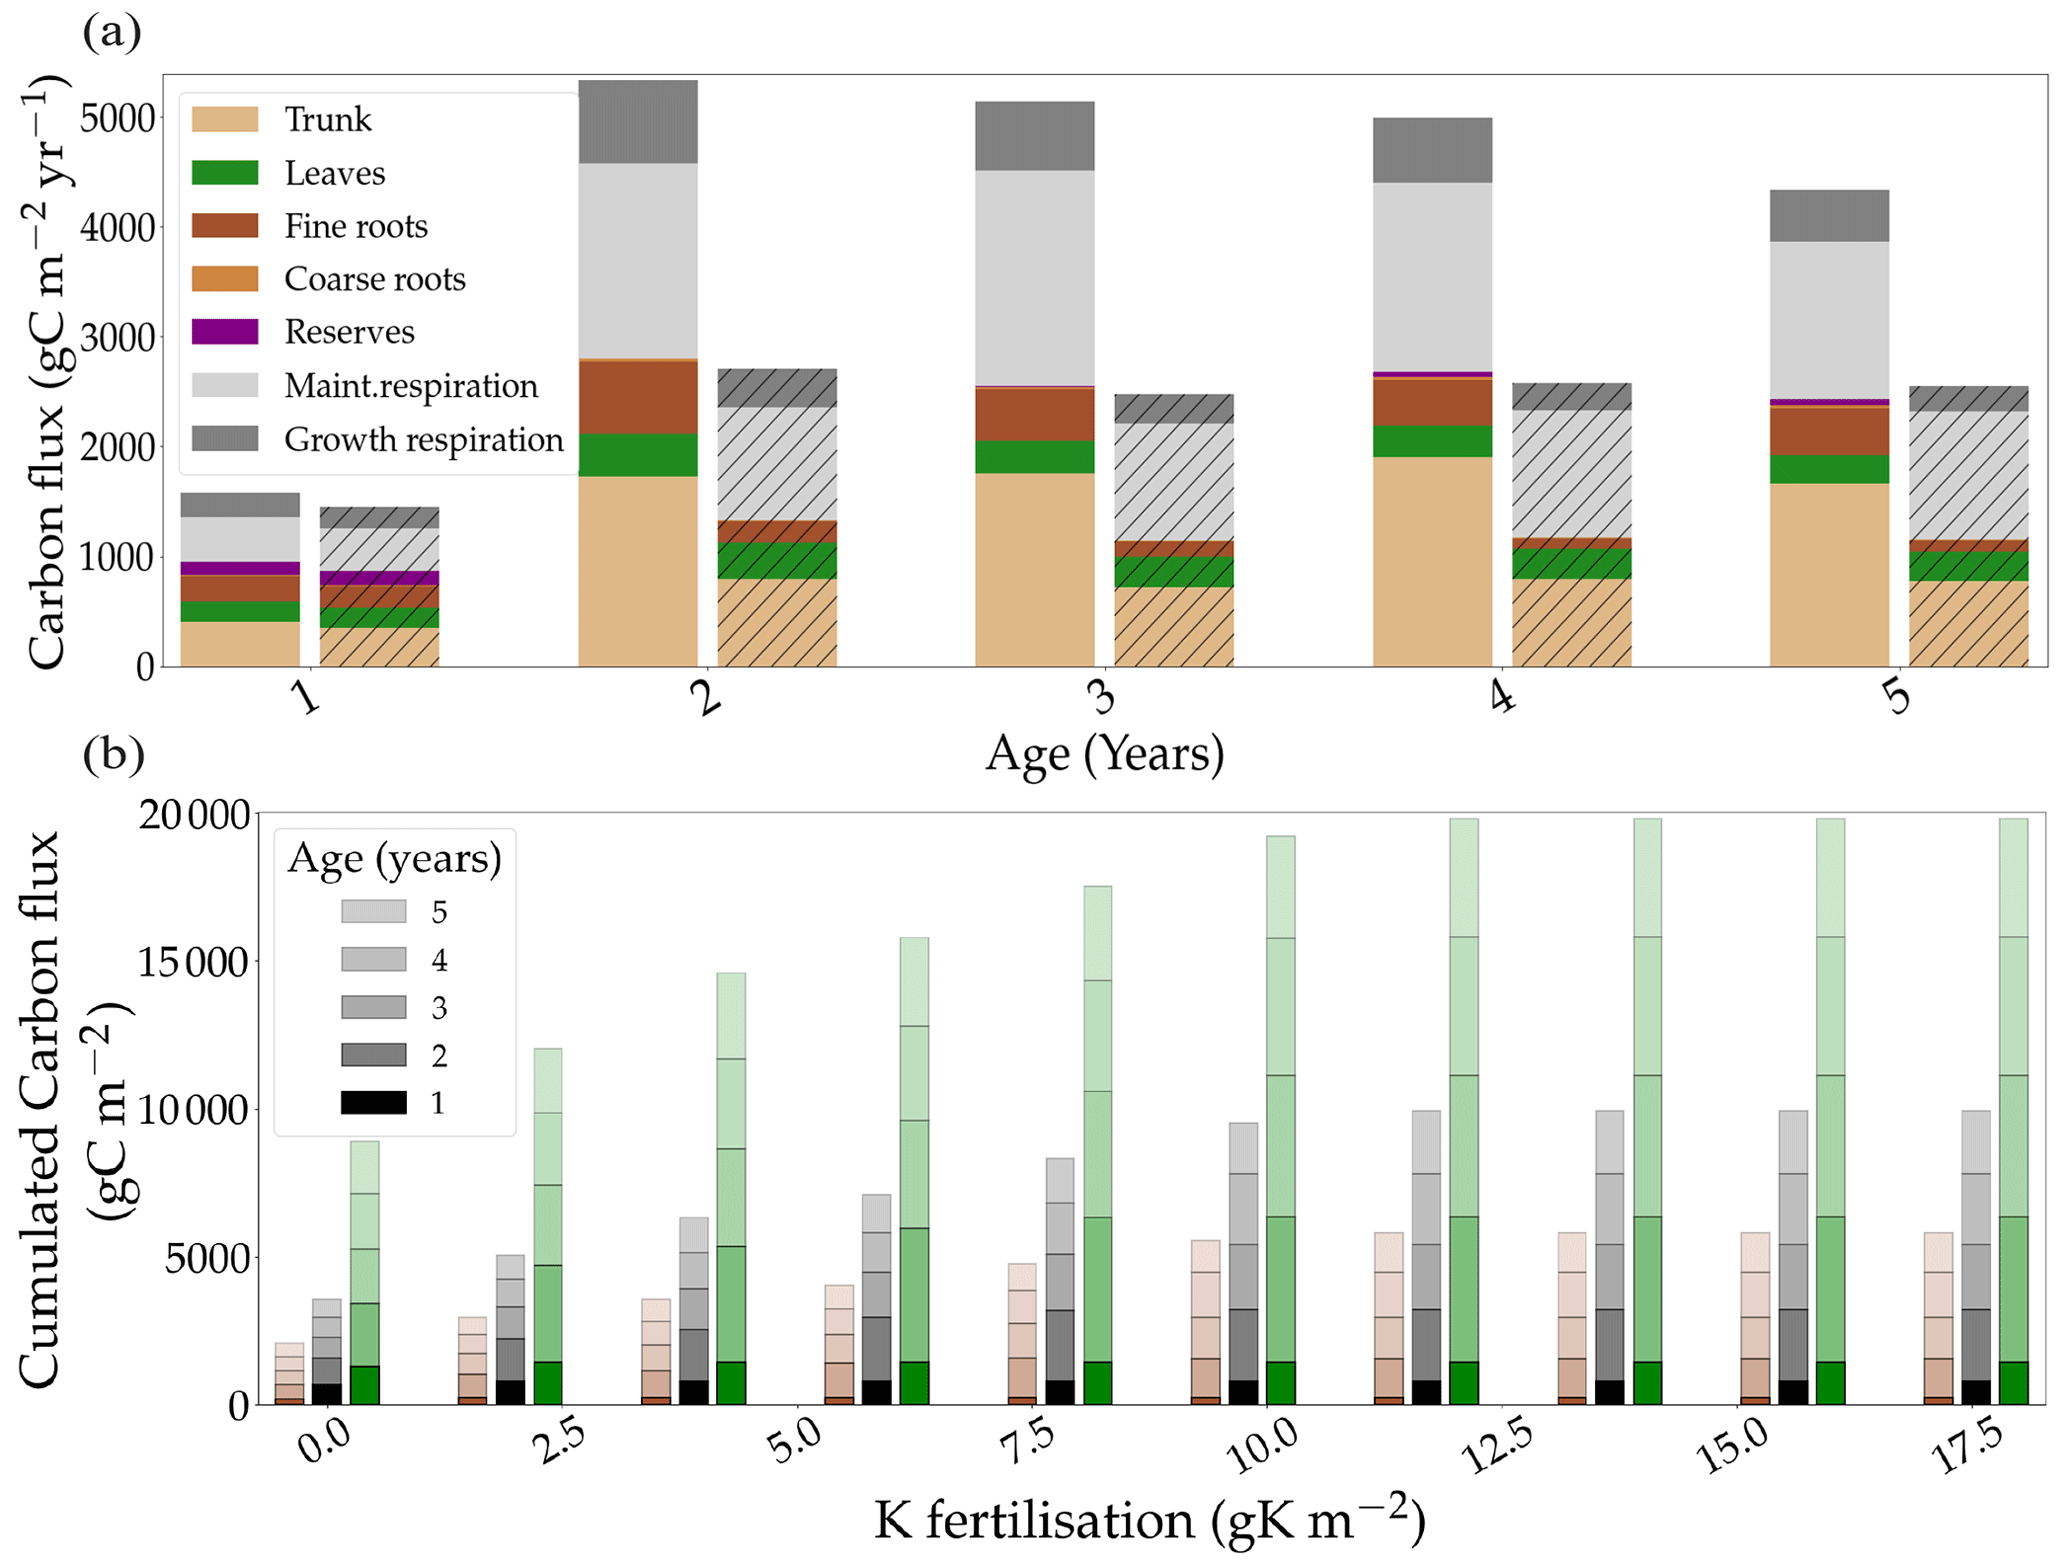
Figure 3(a) The simulated allocation of assimilated carbon to the different organs and respiration fluxes in two contrasting fertilisation conditions: +K and oK (hatched). (b) The response of simulated carbon fluxes, cumulated over 5 years, to different fertilisation levels. Total GPP is in green, total NPP is in black, and trunk NPP is in brown.
3.3 K cycling in the trees
The model showed that the main sinks of K in both the +K and oK stands were located in the woody organs (trunk, bark, and branches). Despite the remobilisation of K in the trunk, the quantity of K immobilised in the trunk increased linearly with time in both treatments (Fig. 4), thus constituting an important K sink.
The theoretical minimum concentration of K in the xylem sap (assuming no recirculating K) of our trees was calculated by dividing the daily simulated flux of K that circulated in the xylem sap (uptake, wood, and branch remobilisation) by the simulated transpiration flux of each day. The mean simulated minimum xylem sap K concentration over the course of a rotation was 0.30 mM (0.012 gK L−1) in the fully fertilised stand and 0.11 mM (0.004 gK L−1) in the K omission stand. When including the K content of the phloem sap and leaf resorption (which means the total circulating K in the tree) in this calculation, the values were 1.66 mM (0.065 gK L−1) and 0.46 mM (0.018 gK L−1) respectively.
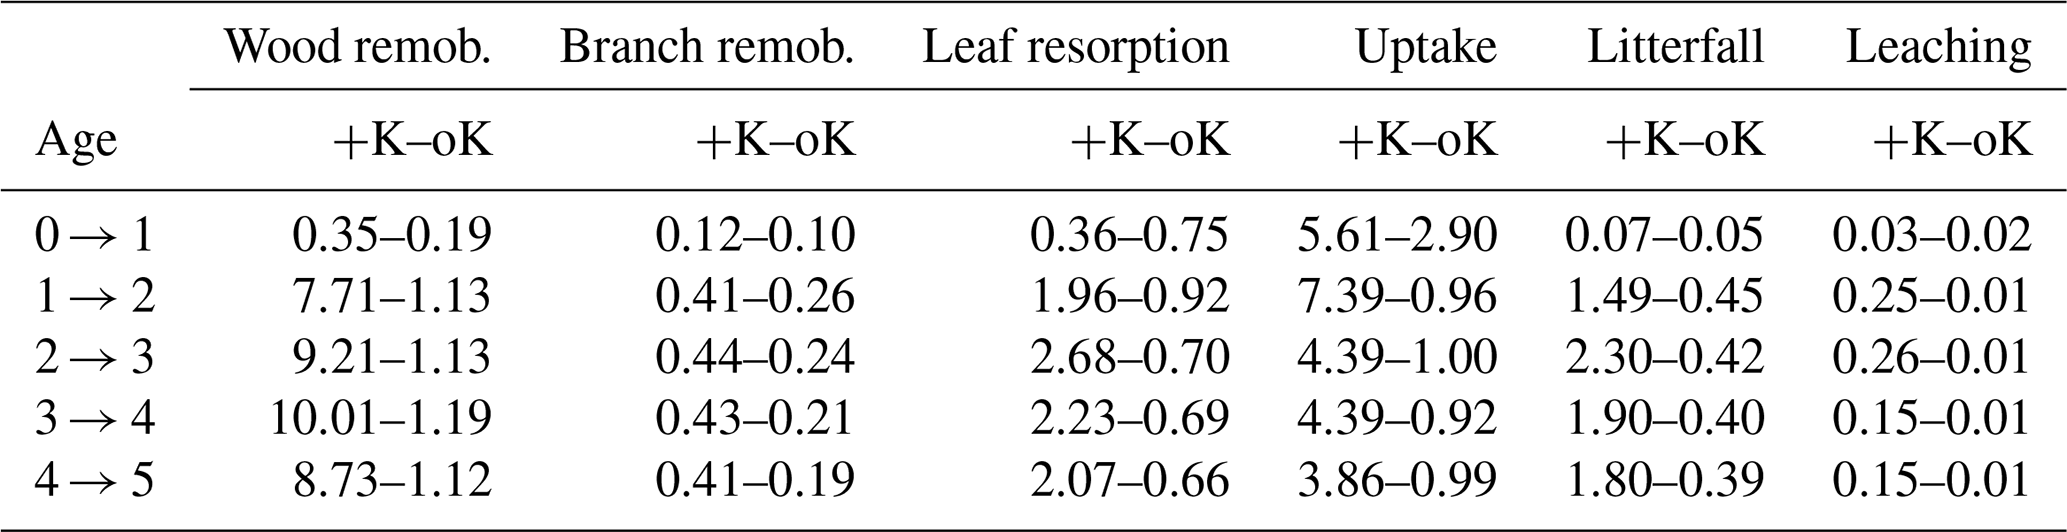
The simulation of internal and external K fluxes in the system (Table 1) showed that, in the fully fertilised and K omission stands, wood remobilisation represented the most important flux of K. Implementing this in the model, this process of K remobilisation from wood increased the model accuracy substantially (not shown here) by buffering the amount of K available for organ growth. When added to branch and leaf resorption, the total amount of K remobilised represented 1.8 times the K uptake in the fertilised stand versus 1.4 times the K uptake in the omission stand. In the simulated oK stand, K uptake was very similar to the sum of the litterfall, leaching, and atmospheric deposition fluxes in all but the first year of the rotation (Table 1). The deposition flux represented more than 50 % of the uptake flux in these K-deficient conditions. Moreover, in the K omission stand, an increase of the simulated weathering flux from 0 to 0.3 gK m−2 yr−1 (in the range of possible values; see Cornut et al., 2021) led to an increase of 23 %, 28 %, and 30 % of the rotation-cumulated GPP, NPP, and NPPtrunk respectively. This showed that small differences in K input can lead to big differences in outcome for wood productivity.
The difference in the K flux of canopy leaching between the two simulated stands (much lower in the omission stand, Table 1) was in line with results obtained on eucalypt plantations at K-rich and K-deficient sites (Laclau et al., 2010). This was the result of lower leaf K concentration and supports the validity of the leaching model used here (Cornut et al., 2022).
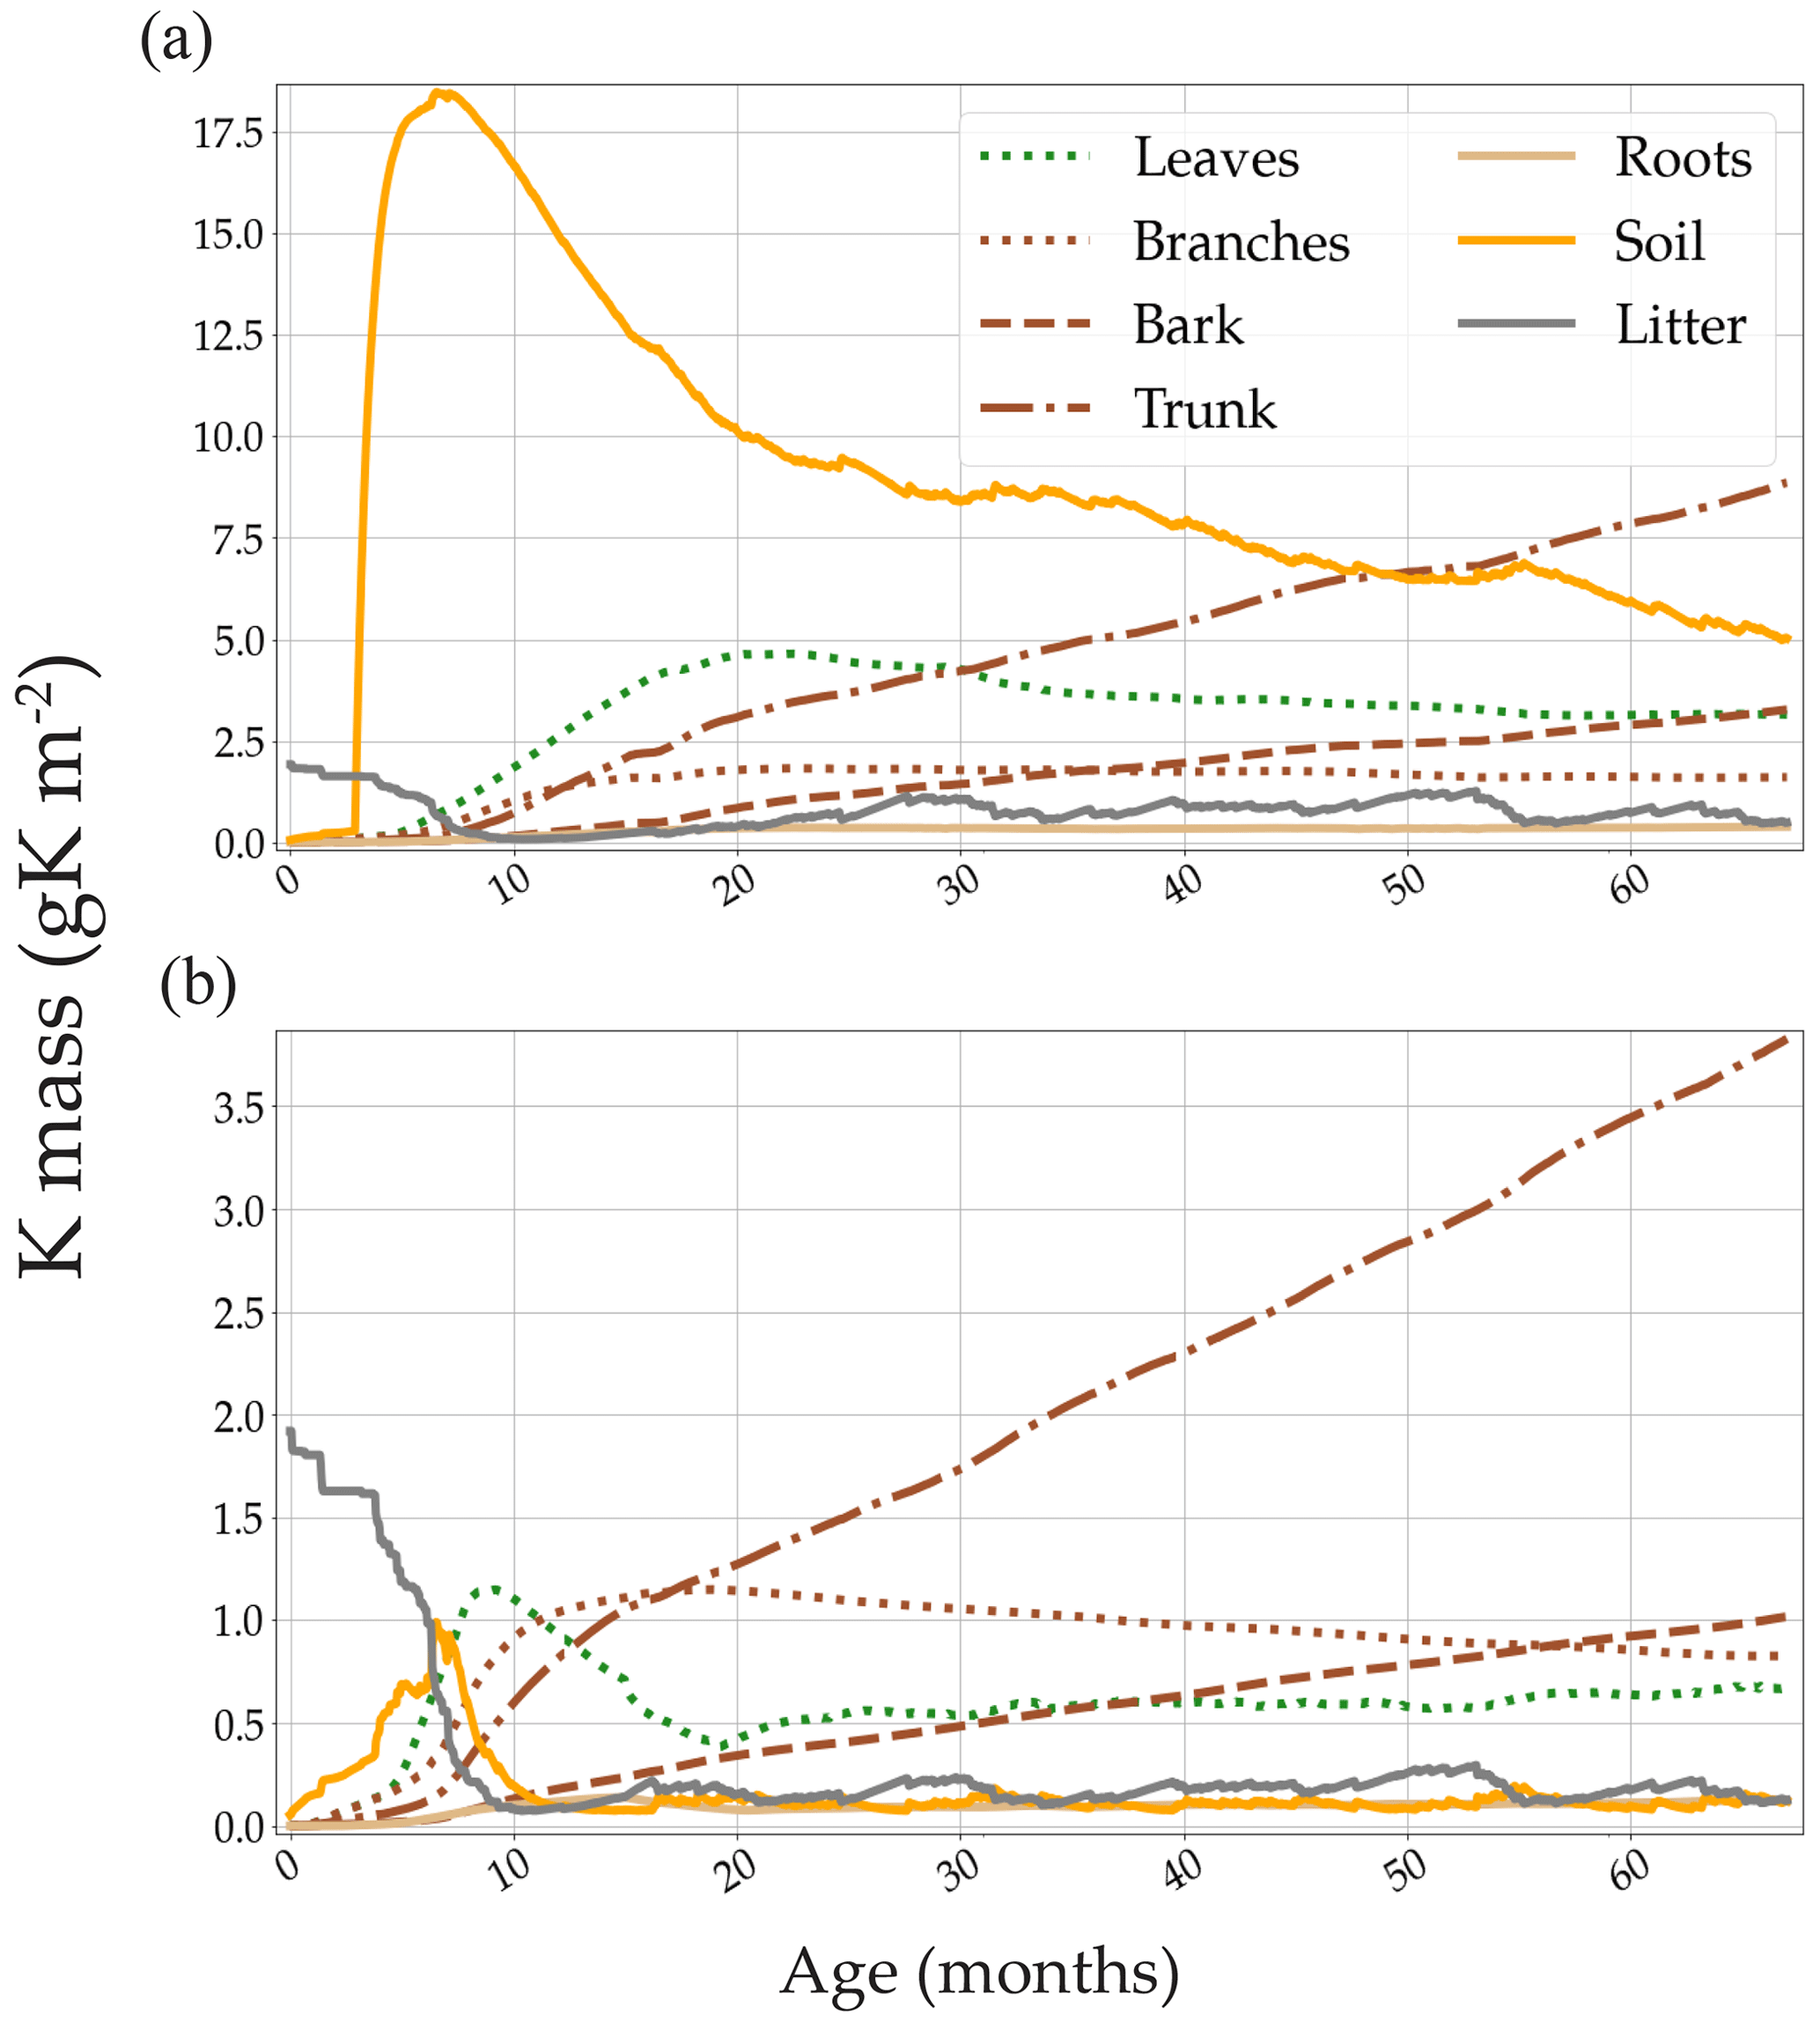
Figure 4Simulated K mass of all the compartments containing K. Two contrasted K availability scenarios are displayed: (a) high fertilisation (+K in the main text) and (b) no K fertilisation (oK in the main text). Note the differences in the y-axis scale. The large amount of K present in the litter compartment (solid grey line) at the beginning of the rotation was measured in the plots at planting (forest floor + aboveground harvest residues).
Table 1Simulated yearly fluxes of K (in gK m−2 yr−1) in a fully fertilised treatment (+K) and in a K omission treatment (oK). This table contains both internal fluxes (wood, branch, and leaf remobilisations) and exchange fluxes (uptake, litterfall, and canopy leaching). The constant atmospheric deposition flux (0.5 gK m−2 yr−1) is not shown.
3.4 Water and potassium use efficiencies
Omission of K fertiliser decreased stand transpiration by 51 %. The reduction (13 %) of simulated GPP water use efficiency (WUEGPP) between the +K (0.0035 gCGPP gH2O−1) and oK (0.0031 gCGPP gH2O−1) stands was comparable to results obtained at the Eucflux site (Cornut et al., 2022). On the other hand, simulated WUENPP showed a much stronger response to K deficiency. The reduction was on the order of 33 %, with WUENPP at 0.0018 and 0.0012 gC gH2O−1 in the +K stand and oK stand respectively. The simulated water use efficiency of trunk wood was also reduced by 32 % in oK relative to +K. The WUEtrunk values in the +K and oK stands were respectively 0.0011 and 0.0007 gC gH2O−1.
In the following paragraph, potassium use efficiency (KUE) is understood as the ratio of accumulated carbon flux at the end of the rotation to the maximum value of K immobilised in the tree. The simulated KUEGPP values were 1281 and 1994 gC gK in the +K and oK stands respectively. In contrast, the simulated KUENPP and KUEtrunk only increased by 19 % (owing to decreased CUE in the oK stand) between the +K and oK stands. The simulated KUEtrunk values were 387 and 462 gC gK in the +K and oK stands respectively (656 and 784 respectively for KUENPP).
FUE generally decreased with increasing fertilisation (Fig. S7 in the Supplement). However, a two-slope relationship was apparent: at low levels of fertilisation, increases in fertilisation led to strong increases in NPP. However, for high amounts of fertiliser applied, wood production per unit of K declined. At intermediate levels of fertilisation (between 6 to 10 gK m2), the FUE was almost constant or slightly increased. However, at higher levels of initial fertilisation, the FUE linearly decreased (consequence of a stable NPP with linearly increasing fertilisation, Fig. 3b).
3.5 Stoichiometry of organs
The new model of trunk wood growth and K remobilisation was validated by the simulated concentrations that were in line with experimental measurements in both the fully fertilised and the K omission treatments (Fig. 5a) without the need for additional forcing. However, the simulated concentration of K in branches (Fig. 5b) was overestimated in the oK compared to measurements. The model was unable to replicate the difference in terms of K concentration in branches between the +K and oK stands at the beginning of the rotation. Branches, while having a small biomass compared to the trunk, were an important K stock in the simulated oK stand (Fig. 4b), and it was the most important K stock at the beginning of the oK rotation. Measurements of K concentration in branches were highly variable at lower branch biomass (Fig. 5b). The mean K concentrations in the total tree biomass were 0.0048 gK gDM−1 in the +K stand and 0.0030 gK gDM−1 in the oK stand. This corresponded to a decrease of 36 % of the K concentration in the oK stand relative to the +K stand. This revealed that total plant stoichiometric flexibility was high in the model, in accordance with measurements.
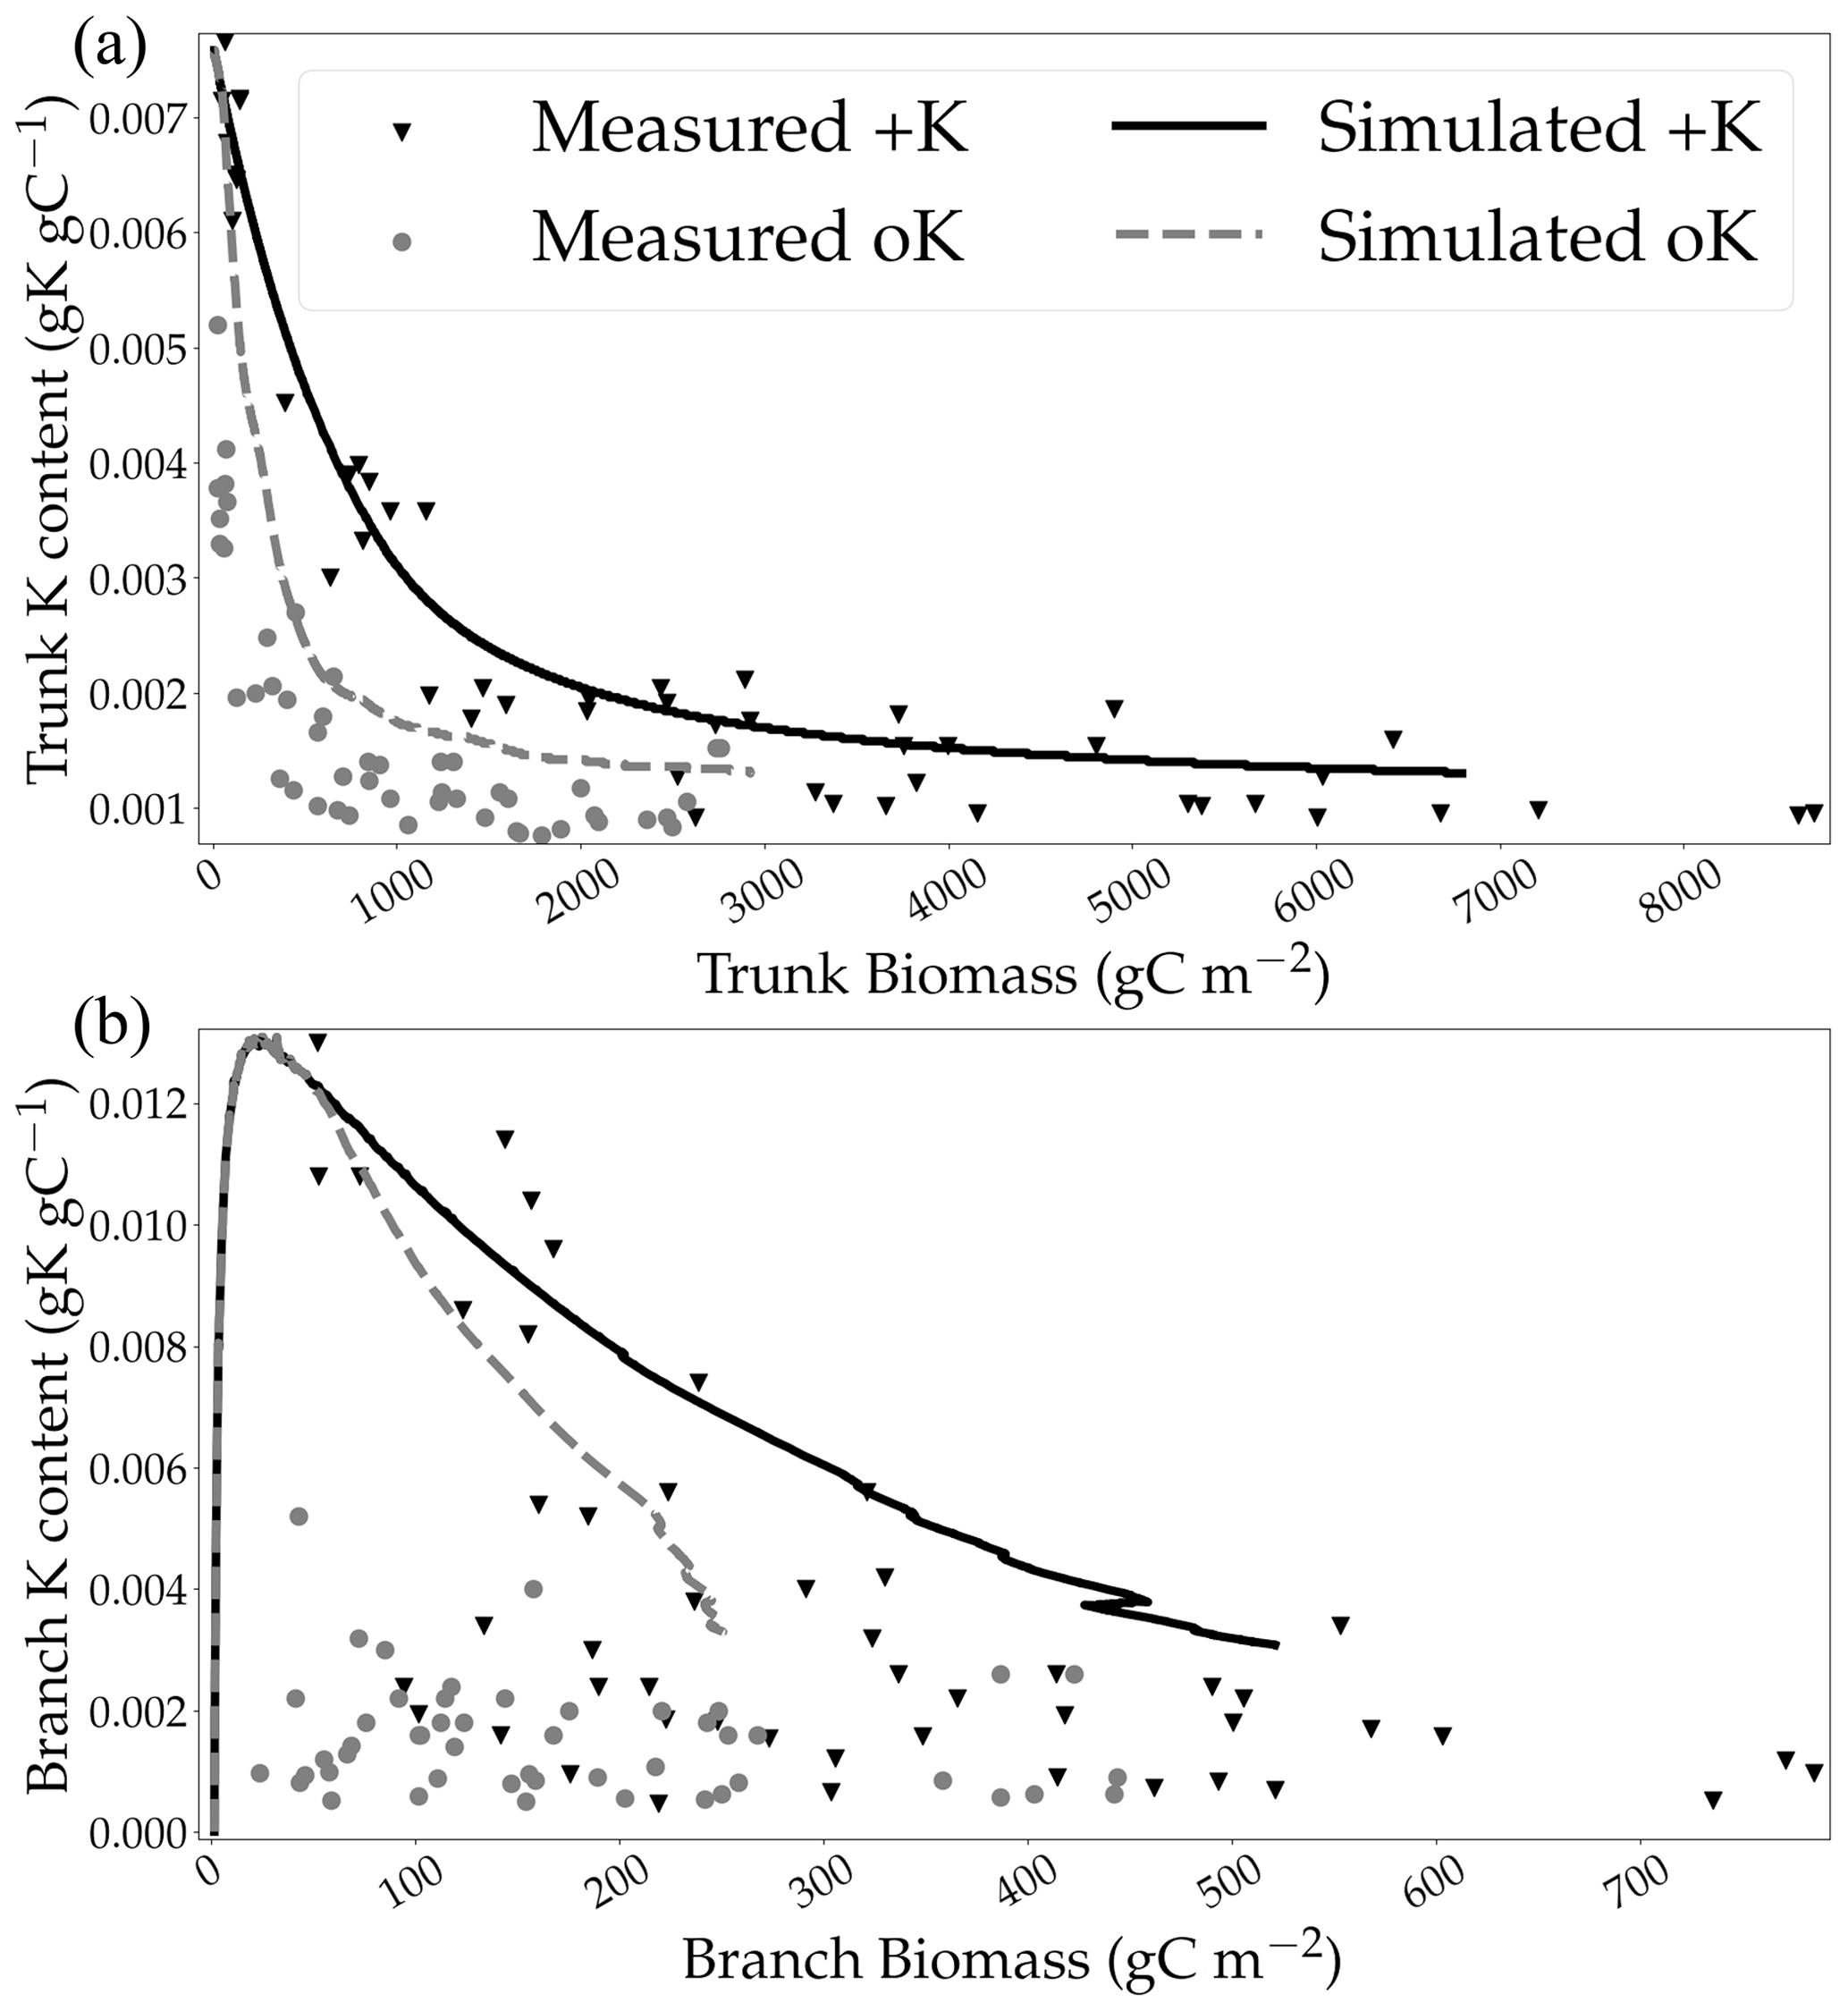
Figure 5Simulated concentrations of K in stem wood (a) and branches (b) in two contrasting K availability scenarios compared to measurements conducted in the fertilisation experiment at Itatinga.
4.1 GPP limitation of NPP and partitioning of photosynthates
The CASTANEA-MAESPA-K model was largely successful in reproducing the limitation of wood productivity induced by K deficiency (Fig. 2). This makes it the first mechanistic model to simulate the interaction between the K cycle and forest NPP. Combined with the fact that partitioning in the model was not directly impacted by K availability, there was no mechanism through which K directly impacted carbon allocation to wood, which suggests that the limitation of wood productivity in the absence of K fertilisation was mainly due to GPP limitation. However, the consequences of K deficiency were higher for NPP than for GPP. This was due to a decrease in CUENPP at low levels of fertilisation. This is similar to the general trend for world forests, which is a decrease in forests' biomass-production–GPP ratio (a proxy for CUE) with decreasing fertility (Vicca et al., 2012). Here, the partitioning of GPP to the different organs was not strongly affected by K availability (except for leaves, going from 7 % of NPP in +K to 13 % of NPP in oK). The reduced CUENPP was mainly the result of an increased autotrophic respiration in proportion to the biomass of organs mirroring the increase in the ratio of ecosystem respiration to GPP in nutrient-poor forests (Fernández-Martínez et al., 2014). While the relationship between GPP and net ecosystem productivity was not significant for low-fertility forest sites in this meta-analysis, this was not the case for GPP and NPP in our study.
Only simulated fine-root biomasses were underestimated in both the +K and oK stands (Fig. 2i). This suggests that simulating a root target biomass that is a function of leaf area (Marsden et al., 2013) might not be appropriate in this instance (since the shape of the root biomass curve during the rotation is qualitatively different). One other cause could be a misestimation of root lifespan, since measurements of fine-root turnover have yielded a wide range of values (Jourdan et al., 2008; Lambais et al., 2017). The estimation of fine-root turnover had also been a constraint in simulating N mineralisation rates in Australian eucalypt stands with the G'DAY model (Corbeels et al., 2005). The values of GPP that were simulated here (a mean of 3986 gC m−2 yr−1 in +K and 1709 gC m−2 yr−1 in oK) were in the high range of values expected for terrestrial ecosystems (Baldocchi and Penuelas, 2019; Luyssaert et al., 2007), especially considering these values were a 6-year mean that included the first year after planting. They were similar to values estimated using TBCA measurements in highly productive eucalypt plantations (Ryan et al., 2004, 2010) and in clonal experiments at the Eucflux site (unpublished data; see Cornut et al., 2022 for the site description).
The K fertilisation level at which K limitation was totally alleviated in simulations (Fig. 3b) was similar to the 12 gK m−2 of fertilisation that is commonly added to commercial eucalypt plantations in Brazil (Cornut et al., 2021).
4.2 Water and potassium use efficiency is affected by K availability
The simulated RUEs of NPP and NPPtrunk were strongly affected by K availability (modelled here as a change in fertilisation levels). Variations of WUEtrunk are in line with experimental results that showed a decrease in WUEtrunk in the K omission stand at the Itatinga site (Battie-Laclau et al., 2016). While simulated WUEtrunk was 33 % lower in oK than in +K, measurements showed a decrease of 37 % (Battie-Laclau et al., 2016). This confirms the relevance of a model-based approach in studying the effect of K availability on WUEtrunk. However, the model diverged from measurements in the same stands at the end of the stand rotation (from 4 to 6 years after planting) that showed that the WUEtrunk of the K omission stand was reduced by 75 % as compared to the WUEtrunk of the +K stand (Asensio et al., 2020), while CASTANEA-MAESPA-K only showed a reduction of 39 % of WUEtrunk between these two stands at this age. Since the trunk NPP simulated by the model agreed with measurements (Fig. 2b) and the model simulated a reduction in transpiration consistent with different approaches (Cornut et al., 2022), WUEtrunk in the oK stand might have been underestimated by the measurements presented in Asensio et al. (2020).
The changes in both KUE and FUE along a K fertilisation gradient showed some interesting results. While K fertilisation strongly decreased KUE for GPP, the effects on NPP and trunk NPP were weaker as a result of increases in the respective CUEs (Fig. S7 in the Supplement). FUE results demonstrate that the response of wood productivity is not a linear function of fertilisation and that, at low levels of fertilisation, small increases in K fertilisation levels produce a strong increase in NPP. Simulated NPP was maximal with the highest fertiliser amount; however, the trend is asymptotical, with more than 95 % of trunk NPP (Fig. 3b) already having reached around 10 gK m−2, a value commonly applied in commercial eucalypt plantations managed with this soil type. Partitioning of the K fertilisation in only one or in several amounts did not changed the wood production, considering that no deep leaching occurs in these systems, in agreement with the conclusions of field studies measuring soil solution chemistry in deep soil layers (Laclau et al., 2010).
4.3 Circulation of K in the plant and stoichiometry
Our work pinpointed the importance of a plant K circulation model. The total remobilisation flux of K from the branches, the trunk, and the leaves was higher than the K uptake in the soil at all fertilisation levels. In C–N (Zaehle et al., 2010; Thum et al., 2019) or C–N–P (Goll et al., 2017) coupled models, stoichiometry of organs can be a direct limiter of organ growth. A strong effect of stoichiometry on soil organic matter decomposition has also been historically used in models of organic matter decomposition in soils (Parton et al., 1988). While such mechanisms were not considered in our modelling approach (organ K concentration is allowed to vary unconstrained), the reduction in NPP was enough to compensate for the reduction in K availability such that the simulated stoichiometries of organs do not vary more than they do in the measurements (Fig. S5 in the Supplement). The stoichiometric flexibility of trees could be higher for K than for N and P. This is consistent with observations of wood K content, which depends mainly on abiotic conditions, while P wood content depends mainly on the species (Bauters et al., 2022). Our model suggests that leaves have a higher stoichiometric flexibility than wood (not shown here), in agreement with observations in a Mediterranean forest environment (Sardans et al., 2012). However, the model failed at reproducing the patterns of stoichiometric plasticity (variability in K concentration of organs) that were observed in between the woody organs, particularly in branches (measurements show high stoichiometric flexibility in branches). This suggests that organs can differ in K homeostasis. The failure of the model to reproduce stoichiometric flexibilities in wood and bark (not shown here) could potentially have had an influence on the amount of K available for leaf expansion, thus overestimating the K limitation on canopy surface and leaf functioning. This is further exacerbated by the large amount of K stored in the bark and in the branches in the simulated K omission stand, especially when the model showed a strong K limitation in leaves (between the 10th and 20th months after planting).
The simulated amount of K immobilised in the trunk at the end of the rotation in the +K stand was 1 order of magnitude lower than what is observed in tropical forests (Bauters et al., 2022). This is due to a low total biomass in planted forests managed in short rotation compared to a in natural forest, since the simulated K concentrations in the trunk were in the range of values reported in old-growth tropical forests. The yearly increase in the amount of K stored in the trunk was in the range of observed values (see Fig. 1 in Bauters et al., 2022) for both the oK and +K stands. This suggests that tropical eucalypt plantations could be a relevant model system for certain parts of the K cycle. The quantity of K that was allocated daily to wood and remobilised gradually (see Eq. 7) acted as a buffer that prevented an overestimation of K limitation once K in the soil reached very low values. This shows that wood can act as a storage organ for K and can alleviate low uptake of K under drought (Sardans and Peñuelas, 2007; Touche et al., 2022) or in planted forests only fertilised at planting and growing in K-poor soils.
While the K trunk remobilisation fluxes were higher in our model than what was previously calculated using other methods (a mean of 7.6 gK m−2 yr−1 vs. 2.7 gK m−2 yr−1 in Sette et al., 2013), the amount of K that transited in the xylem sap every day was low considering the magnitude of the sap flow in the xylem for tree transpiration. This led to very low xylem sap K concentrations if a flux of K from phloem sap to xylem sap was not considered. Since values of xylem sap K concentrations measured on different plants are 1 order of magnitude higher (Nardini et al., 2010; Siebrecht et al., 2003), our results suggest that either xylem sap K concentrations are very variable between plants or an intense recirculation of K between xylem and phloem is taking place. The first hypothesis is consistent with evidence from temperate conifers that show a variation of 1 order of magnitude (the lower bound is similar to values calculated from our simulations) in terms of xylem sap K concentration during the growing season (Losso et al., 2018). However, the last hypothesis seems more plausible, since K is necessary to maintain xylem hydraulic conductivity (Oddo et al., 2011; Nardini et al., 2011) and, considering a transfer of K from phloem sap to xylem sap, the calculated K xylem sap concentrations are more in line with measurements from the literature. It also supports evidence that K+ ions are an essential part of many processes at the plant level (Dreyer and Michard, 2020), e.g. energy source (Dreyer et al., 2017), counter ion for NO, signalling (Anschütz et al., 2014), and protection against abiotic stress (Cakmak, 2005). The intense recirculation of K between xylem and phloem serves as a way to maintain homeostasis. The order of magnitude of this recirculation would have to be determined experimentally. Previous measurements have shown that up to 25 % of K+ ions are recirculated in tomato plants (Armstrong and Kirkby, 1979) and up to 50 % are recirculated in Ricinus communis seedlings (Marschnert et al., 1997). Results from our model suggest that the figure could be higher in eucalypt trees (maybe owing to remobilisation from wood absent in tomato plants).
The results shown here show the relevance of using a mechanistic model to explore the links between K availability and forest NPP. Our model was able to reproduce results from fertilisation experiments with a good degree of accuracy while also being able to simulate an availability gradient in K. The model allowed us to formulate the following conclusions:
-
The decrease in GPP caused by K deficiency explained most of the difference in wood productivity between K-rich and K-deficient stands. There was no need for a direct modification of the partitioning process or stoichiometric limitations to explain the observed patterns of productivity.
-
Potassium use efficiency for the production of wood increases with diminishing K availability, suggesting that the trees are able to compensate for lower K content in tissues through reduced carbon use efficiency.
-
The major importance of external inputs (weathering and deposition mainly) already observed in GPP simulations (Cornut et al., 2022) is also critical for the ecosystem's NPP.
-
The internal K fluxes in the trees that provide buffering against temporally localised K limitations are important and contribute to explaining why an adequate K supply limited to the early stage of the development of trees can be sufficient to sustain high NPPs over the entire rotation in planted forests growing in highly weathered soils.
Data are not freely available due to the private funding of experimental sites but are available upon request.
The supplement related to this article is available online at: https://doi.org/10.5194/bg-20-3119-2023-supplement.
IC carried out the development of the model and wrote the original draft of the paper. ND and GlM supervised the work, participated in the conceptualisation of the model, and reviewed the original draft of the paper. JPL, YN, and JG participated in the acquisition of the data and reviewed the original draft of the paper. All the authors provided critical feedback and helped shape the research, analysis, and paper.
The contact author has declared that none of the authors has any competing interests.
Publisher’s note: Copernicus Publications remains neutral with regard to jurisdictional claims in published maps and institutional affiliations.
This article is part of the special issue “Ecosystem experiments as a window to future carbon, water, and nutrient cycling in terrestrial ecosystems”. It is not associated with a conference.
Ivan Cornut was funded by the ANR under the Investissements d'avenir programme with the grant reference no. ANR-16-CONV-0003 (CLAND) and by the Centre de coopération Internationale en Recherche Agronomique pour le Développement (CIRAD).
The data acquired on eucalyptus stands at Itatinga station, Brazil, and partly re-analysed here were funded by the Universidade de São Paulo, CIRAD, the Agence Nationale de la Recherche (MACACC project no. ANR-13-AGRO-0005, Viabilité et Adaptation des Ecosystèmes Productifs, Territoires et Ressources face aux Changements Globaux AGROBIOSPHERE 2013 program), the Agropolis Foundation (programme Investissements d'avenir, project no. ANR-10-LabX-0001-01), and the Brazilian state (Programa de Cooperacão internacional capes/Fundacão AGROPOLIS 017/2013). We are grateful to the staff at the Itatinga Experimental Station, particularly Rildo Moreira e Moreira (Esalq, USP) and Eder Araujo da Silva for their technical support. We thank the two anonymous reviewers for their thorough evaluation of the paper and relevant remarks that helped greatly in improving the article.
This research has been supported by the Agence Nationale de la Recherche (grant no. ANR-16-CONV-0003).
This paper was edited by Silvia Caldararu and reviewed by two anonymous referees.
Anschütz, U., Becker, D., and Shabala, S.: Going beyond nutrition: Regulation of potassium homoeostasis as a common denominator of plant adaptive responses to environment, J. Plant Physiol., 171, 670–687, https://doi.org/10.1016/j.jplph.2014.01.009, 2014. a
Armstrong, M. J. and Kirkby, E. A.: Estimation of Potassium Recirculation in Tomato Plants by Comparison of the Rates of Potassium and Calcium Accumulation in the Tops with Their Fluxes in the Xylem Stream, Plant Physiol., 63, 1143–1148, https://doi.org/10.1104/pp.63.6.1143, 1979. a
Asensio, V., Domec, J.-C., Nouvellon, Y., Laclau, J.-P., Bouillet, J.-P., Jordan-Meille, L., Lavres, J., Rojas, J. D., Guillemot, J., and Abreu-Junior, C. H.: Potassium fertilization increases hydraulic redistribution and water use efficiency for stemwood production in Eucalyptus grandis plantations, Environ. Exp. Bot., 176, 104085, https://doi.org/10.1016/j.envexpbot.2020.104085, 2020. a, b
Augusto, L., Ranger, J., Ponette, Q., and Rapp, M.: Relationships between forest tree species, stand production and stand nutrient amount, Ann. Forest Sci., 57, 313–324, https://doi.org/10.1051/forest:2000122, 2000. a
Baldocchi, D. and Penuelas, J.: The physics and ecology of mining carbon dioxide from the atmosphere by ecosystems, Glob. Change Biol., 25, 1191–1197, https://doi.org/10.1111/gcb.14559, 2019. a
Baribault, T. W., Kobe, R. K., and Finley, A. O.: Tropical tree growth is correlated with soil phosphorus, potassium, and calcium, though not for legumes, Ecol. Monogr., 82, 189–203, https://doi.org/10.1890/11-1013.1, 2012. a
Battie-Laclau, P., Laclau, J.-P., Piccolo, M. d. C., Arenque, B. C., Beri, C., Mietton, L., Muniz, M. R. A., Jordan-Meille, L., Buckeridge, M. S., Nouvellon, Y., Ranger, J., and Bouillet, J.-P.: Influence of potassium and sodium nutrition on leaf area components in Eucalyptus grandis trees, Plant Soil, 371, 19–35, https://doi.org/10.1007/s11104-013-1663-7, 2013. a
Battie‐Laclau, P., Laclau, J.-P., Domec, J.-C., Christina, M., Bouillet, J.-P., Piccolo, M. d. C., Gonçalves, J. L. d. M., Moreira, R. M. e., Krusche, A. V., Bouvet, J.-M., and Nouvellon, Y.: Effects of potassium and sodium supply on drought-adaptive mechanisms in Eucalyptus grandis plantations, New Phytol., 203, 401–413, https://doi.org/10.1111/nph.12810, 2014. a
Battie-Laclau, P., Delgado-Rojas, J. S., Christina, M., Nouvellon, Y., Bouillet, J.-P., Piccolo, M. d. C., Moreira, M. Z., Gonçalves, J. L. d. M., Roupsard, O., and Laclau, J.-P.: Potassium fertilization increases water-use efficiency for stem biomass production without affecting intrinsic water-use efficiency in Eucalyptus grandis plantations, Forest Ecol. Manag., 364, 77–89, https://doi.org/10.1016/j.foreco.2016.01.004, 2016. a, b, c, d
Bauters, M., Grau, O., Doetterl, S., Heineman, K. D., Dalling, J. W., Prada, C. M., Griepentrog, M., Malhi, Y., Riutta, T., Scalon, M., Oliveras, I., Inagawa, T., Majalap, N., Beeckman, H., Van den Bulcke, J., Perring, M. P., Dourdain, A., Hérault, B., Vermeir, P., Makelele, I. A., Fernández, P. R., Sardans, J., Peñuelas, J., and Janssens, I. A.: Tropical wood stores substantial amounts of nutrients, but we have limited understanding why, Biotropica, 54, 596–606, https://doi.org/10.1111/btp.13069, 2022. a, b, c
Cakmak, I.: The role of potassium in alleviating detrimental effects of abiotic stresses in plants, J. Plant Nutr. Soil Sc., 168, 521–530, https://doi.org/10.1002/jpln.200420485, 2005. a
Cakmak, I., Hengeler, C., and Marschner, H.: Changes in phloem export of sucrose in leaves in response to phosphorus, potassium and magnesium deficiency in bean plants, J. Exp. Bot., 45, 1251–1257, https://doi.org/10.1093/jxb/45.9.1251, 1994. a
Christina, M., Laclau, J.-P., Gonçalves, J. L. M., Jourdan, C., Nouvellon, Y., and Bouillet, J.-P.: Almost symmetrical vertical growth rates above and below ground in one of the world's most productive forests, Ecosphere, 2, 1–10, https://doi.org/10.1890/ES10-00158.1, 2011. a
Christina, M., Maire, G. L., Battie‐Laclau, P., Nouvellon, Y., Bouillet, J.-P., Jourdan, C., Gonçalves, J. L. d. M., and Laclau, J.-P.: Measured and modeled interactive effects of potassium deficiency and water deficit on gross primary productivity and light‐use efficiency in Eucalyptus grandis plantations, Glob. Change Biol., 21, 2022–2039, https://doi.org/10.1111/gcb.12817, 2015. a
Christina, M., Nouvellon, Y., Laclau, J.-P., Stape, J. L., Bouillet, J.-P., Lambais, G. R., and Maire, G. l.: Importance of deep water uptake in tropical eucalypt forest, Funct. Ecol., 31, 509–519, https://doi.org/10.1111/1365-2435.12727, 2017. a
Christina, M., le Maire, G., Nouvellon, Y., Vezy, R., Bordon, B., Battie-Laclau, P., Gonçalves, J. L. M., Delgado-Rojas, J. S., Bouillet, J. P., and Laclau, J. P.: Simulating the effects of different potassium and water supply regimes on soil water content and water table depth over a rotation of a tropical Eucalyptus grandis plantation, Forest Ecol. Manag., 418, 4–14, https://doi.org/10.1016/j.foreco.2017.12.048, 2018. a
Corbeels, M., McMurtrie, R. E., Pepper, D. A., and O’Connell, A. M.: A process-based model of nitrogen cycling in forest plantations: Part II. Simulating growth and nitrogen mineralisation of Eucalyptus globulus plantations in south-western Australia, Ecol. Model., 187, 449–474, https://doi.org/10.1016/j.ecolmodel.2005.07.004, 2005. a
Cornut, I., Le Maire, G., Laclau, J.-P., Guillemot, J., Mareschal, L., Nouvellon, Y., and Delpierre, N.: Potassium limitation of wood productivity: A review of elementary processes and ways forward to modelling illustrated by Eucalyptus plantations, Forest Ecol. Manag., 494, 119275, https://doi.org/10.1016/j.foreco.2021.119275, 2021. a, b, c, d
Cornut, I., Delpierre, N., Laclau, J.-P., Guillemot, J., Nouvellon, Y., Campoe, O., Stape, J. L., Fernanda Santos, V., and le Maire, G.: Potassium limitation of forest productivity – Part 1: A mechanistic model simulating the effects of potassium availability on canopy carbon and water fluxes in tropical eucalypt stands, Biogeosciences, 20, 3093–3117, https://doi.org/10.5194/bg-20-3093-2023, 2023. a, b, c, d, e
De Lucia, E. H., Drake, J. E., Thomas, R. B., and Gonzalez‐Meler, M.: Forest carbon use efficiency: is respiration a constant fraction of gross primary production?, Glob. Change Biol., 13, 1157–1167, https://doi.org/10.1111/j.1365-2486.2007.01365.x, 2007. a
Doman, D. C. and Geiger, D. R.: Effect of Exogenously Supplied Foliar Potassium on Phloem Loading in Beta vulgaris L., Plant Physiol., 64, 528–533, https://doi.org/10.1104/pp.64.4.528, 1979. a
Dreyer, I. and Michard, E.: High- and Low-Affinity Transport in Plants From a Thermodynamic Point of View, Front. Plant Sci., 10, 1797, https://doi.org/10.3389/fpls.2019.01797, 2020. a
Dreyer, I., Gomez‐Porras, J. L., and Riedelsberger, J.: The potassium battery: a mobile energy source for transport processes in plant vascular tissues, New Phytol., 216, 1049–1053, https://doi.org/10.1111/nph.14667, 2017. a, b
Dufrêne, E., Davi, H., François, C., Maire, G. l., Dantec, V. L., and Granier, A.: Modelling carbon and water cycles in a beech forest: Part I: Model description and uncertainty analysis on modelled NEE, Ecol. Model., 185, 407–436, https://doi.org/10.1016/j.ecolmodel.2005.01.004, 2005. a, b, c, d, e
Duursma, R. A. and Medlyn, B. E.: MAESPA: a model to study interactions between water limitation, environmental drivers and vegetation function at tree and stand levels, with an example application to [CO2] × drought interactions, Geosci. Model Dev., 5, 919–940, https://doi.org/10.5194/gmd-5-919-2012, 2012. a
Epron, D., Laclau, J.-P., Almeida, J. C. R., Gonçalves, J. L. M., Ponton, S., Sette, C. R., Delgado-Rojas, J. S., Bouillet, J.-P., and Nouvellon, Y.: Do changes in carbon allocation account for the growth response to potassium and sodium applications in tropical Eucalyptus plantations?, Tree Physiol., 32, 667–679, https://doi.org/10.1093/treephys/tpr107, 2012. a
Epron, D., Cabral, O. M. R., Laclau, J.-P., Dannoura, M., Packer, A. P., Plain, C., Battie-Laclau, P., Moreira, M. Z., Trivelin, P. C. O., Bouillet, J.-P., Gérant, D., and Nouvellon, Y.: In situ 13CO2 pulse labelling of field-grown eucalypt trees revealed the effects of potassium nutrition and throughfall exclusion on phloem transport of photosynthetic carbon, Tree Physiol., 36, 6–21, https://doi.org/10.1093/treephys/tpv090, 2016. a
Fernández-Martínez, M., Vicca, S., Janssens, I. A., Sardans, J., Luyssaert, S., Campioli, M., Chapin III, F. S., Ciais, P., Malhi, Y., Obersteiner, M., Papale, D., Piao, S. L., Reichstein, M., Rodà, F., and Peñuelas, J.: Nutrient availability as the key regulator of global forest carbon balance, Nat. Clim. Change, 4, 471–476, https://doi.org/10.1038/nclimate2177, 2014. a
Gazola, R. d. N., Buzetti, S., Teixeira Filho, M. C. M., Gazola, R. P. D., Celestrino, T. d. S., Silva, A. C. d., Silva, P. H. M. d., Gazola, R. d. N., Buzetti, S., Teixeira Filho, M. C. M., Gazola, R. P. D., Celestrino, T. d. S., Silva, A. C. d., and Silva, P. H. M. d.: Potassium Fertilization of Eucalyptus in an Entisol in Low-Elevation Cerrado, Rev. Bras. Cienc. Solo, 43, e0180085, https://doi.org/10.1590/18069657rbcs20180085, 2019. a, b
Giardina, C. P. and Ryan, M. G.: Total Belowground Carbon Allocation in a Fast-growing Eucalyptus Plantation Estimated Using a Carbon Balance Approach, Ecosystems, 5, 487–499, https://doi.org/10.1007/s10021-002-0130-8, 2002. a
Goll, D. S., Vuichard, N., Maignan, F., Jornet-Puig, A., Sardans, J., Violette, A., Peng, S., Sun, Y., Kvakic, M., Guimberteau, M., Guenet, B., Zaehle, S., Penuelas, J., Janssens, I., and Ciais, P.: A representation of the phosphorus cycle for ORCHIDEE (revision 4520), Geosci. Model Dev., 10, 3745–3770, https://doi.org/10.5194/gmd-10-3745-2017, 2017. a
Gonçalves, J. L. d. M.: Nutrição e fertilização florestal, IPEF, ISBN: 9788590135814, 2000. a, b
Jourdan, C., Silva, E. V., Gonçalves, J. L. M., Ranger, J., Moreira, R. M., and Laclau, J. P.: Fine root production and turnover in Brazilian Eucalyptus plantations under contrasting nitrogen fertilization regimes, Forest Ecol. Manag., 256, 396–404, https://doi.org/10.1016/j.foreco.2008.04.034, 2008. a
Laclau, J.-P., Almeida, J. C. R., Gonçalves, J. L. M., Saint-André, L., Ventura, M., Ranger, J., Moreira, R. M., and Nouvellon, Y.: Influence of nitrogen and potassium fertilization on leaf lifespan and allocation of above-ground growth in Eucalyptus plantations, Tree Physiol., 29, 111–124, https://doi.org/10.1093/treephys/tpn010, 2009. a
Laclau, J.-P., Ranger, J., de Moraes Gonçalves, J. L., Maquère, V., Krusche, A. V., M’Bou, A. T., Nouvellon, Y., Saint-André, L., Bouillet, J.-P., de Cassia Piccolo, M., and Deleporte, P.: Biogeochemical cycles of nutrients in tropical Eucalyptus plantations, Forest Ecol. Manag., 259, 1771–1785, https://doi.org/10.1016/j.foreco.2009.06.010, 2010. a, b, c, d, e
Lambais, G. R., Jourdan, C., de Cássia Piccolo, M., Germon, A., Pinheiro, R. C., Nouvellon, Y., Stape, J. L., Campoe, O. C., Robin, A., Bouillet, J.-P., le Maire, G., and Laclau, J.-P.: Contrasting phenology of Eucalyptus grandis fine roots in upper and very deep soil layers in Brazil, Plant Soil, 421, 301–318, https://doi.org/10.1007/s11104-017-3460-1, 2017. a, b
Lockhart, J. A.: An analysis of irreversible plant cell elongation, J. Theor. Biol., 8, 264–275, https://doi.org/10.1016/0022-5193(65)90077-9, 1965. a
Losso, A., Nardini, A., Dämon, B., and Mayr, S.: Xylem sap chemistry: seasonal changes in timberline conifers Pinus cembra, Picea abies, and Larix decidua, Biol. Plantarum, 62, 157–165, https://doi.org/10.1007/s10535-017-0755-2, 2018. a
Luyssaert, S., Inglima, I., Jung, M., Richardson, A. D., Reichstein, M., Papale, D., Piao, S. L., Schulze, E.-D., Wingate, L., Matteucci, G., Aragao, L., Aubinet, M., Beer, C., Bernhofer, C., Black, K. G., Bonal, D., Bonnefond, J.-M., Chambers, J., Ciais, P., Cook, B., Davis, K. J., Dolman, A. J., Gielen, B., Goulden, M., Grace, J., Granier, A., Grelle, A., Griffis, T., Grünwald, T., Guidolotti, G., Hanson, P. J., Harding, R., Hollinger, D. Y., Hutyra, L. R., Kolari, P., Kruijt, B., Kutsch, W., Lagergren, F., Laurila, T., Law, B. E., Maire, G. L., Lindroth, A., Loustau, D., Malhi, Y., Mateus, J., Migliavacca, M., Misson, L., Montagnani, L., Moncrieff, J., Moors, E., Munger, J. W., Nikinmaa, E., Ollinger, S. V., Pita, G., Rebmann, C., Roupsard, O., Saigusa, N., Sanz, M. J., Seufert, G., Sierra, C., Smith, M.-L., Tang, J., Valentini, R., Vesala, T., and Janssens, I. A.: CO2 balance of boreal, temperate, and tropical forests derived from a global database, Glob. Change Biol., 13, 2509–2537, https://doi.org/10.1111/j.1365-2486.2007.01439.x, 2007. a
Marschner, H., Kirkby, E. A., and Cakmak, I.: Effect of mineral nutritional status on shoot – root partitioning of photoassimilates and cycling of mineral nutrients, J. Exp. Bot., 47, 1255–1263, 1996. a
Marschnert, H., Kirkby, E. A., and Engels, C.: Importance of Cycling and Recycling of Mineral Nutrients within Plants for Growth and Development, Bot. Acta, 110, 265–273, https://doi.org/10.1111/j.1438-8677.1997.tb00639.x, 1997. a
Marsden, C., Nouvellon, Y., Laclau, J.-P., Corbeels, M., McMurtrie, R. E., Stape, J. L., Epron, D., and le Maire, G.: Modifying the G’DAY process-based model to simulate the spatial variability of Eucalyptus plantation growth on deep tropical soils, Forest Ecol. Manag., 301, 112–128, https://doi.org/10.1016/j.foreco.2012.10.039, 2013. a, b
Muller, B., Pantin, F., Génard, M., Turc, O., Freixes, S., Piques, M., and Gibon, Y.: Water deficits uncouple growth from photosynthesis, increase C content, and modify the relationships between C and growth in sink organs, J. Exp. Bot., 62, 1715–1729, https://doi.org/10.1093/jxb/erq438, 2011. a
Nardini, A., Grego, F., Trifilò, P., and Salleo, S.: Changes of xylem sap ionic content and stem hydraulics in response to irradiance in Laurus nobilis, Tree Physiol., 30, 628–635, https://doi.org/10.1093/treephys/tpq017, 2010. a
Nardini, A., Salleo, S., and Jansen, S.: More than just a vulnerable pipeline: xylem physiology in the light of ion-mediated regulation of plant water transport, J. Exp. Bot., 62, 4701–4718, https://doi.org/10.1093/jxb/err208, 2011. a
Oddo, E., Inzerillo, S., La Bella, F., Grisafi, F., Salleo, S., Nardini, A., and Goldstein, G.: Short-term effects of potassium fertilization on the hydraulic conductance of Laurus nobilis L., Tree Physiol., 31, 131–138, https://doi.org/10.1093/treephys/tpq115, 2011. a
Pantin, F., Simonneau, T., and Muller, B.: Coming of leaf age: control of growth by hydraulics and metabolics during leaf ontogeny, New Phytol., 196, 349–366, https://doi.org/10.1111/j.1469-8137.2012.04273.x, 2012. a
Parton, W. J., Stewart, J. W. B., and Cole, C. V.: Dynamics of C, N, P and S in grassland soils: a model, Biogeochemistry, 5, 109–131, https://doi.org/10.1007/BF02180320, 1988. a
Rocha, J. H. T., Gonçalves, J. L. d. M., Ferraz, A. d. V., Poiati, D. A., Arthur Junior, J. C., and Hubner, A.: Growth dynamics and productivity of an Eucalyptus grandis plantation under omission of N, P, K Ca and Mg over two crop rotation, Forest Ecol. Manag., 447, 158–168, https://doi.org/10.1016/j.foreco.2019.05.060, 2019. a
Ryan, M. G., Binkley, D., Fownes, J. H., Giardina, C. P., and Senock, R. S.: An Experimental Test of the Causes of Forest Growth Decline with Stand Age, Ecol. Monogr., 74, 393–414, https://doi.org/10.1890/03-4037, 2004. a
Ryan, M. G., Cavaleri, M. A., Almeida, A. C., Penchel, R., Senock, R. S., and Luiz Stape, J.: Wood CO2 efflux and foliar respiration for Eucalyptus in Hawaii and Brazil, Tree Physiol., 29, 1213–1222, https://doi.org/10.1093/treephys/tpp059, 2009. a, b
Ryan, M. G., Stape, J. L., Binkley, D., Fonseca, S., Loos, R. A., Takahashi, E. N., Silva, C. R., Silva, S. R., Hakamada, R. E., Ferreira, J. M., Lima, A. M. N., Gava, J. L., Leite, F. P., Andrade, H. B., Alves, J. M., and Silva, G. G. C.: Factors controlling Eucalyptus productivity: How water availability and stand structure alter production and carbon allocation, Forest Ecol. Manag., 259, 1695–1703, https://doi.org/10.1016/j.foreco.2010.01.013, 2010. a
Sardans, J. and Peñuelas, J.: Drought changes phosphorus and potassium accumulation patterns in an evergreen Mediterranean forest, Funct. Ecol., 21, 191–201, https://doi.org/10.1111/j.1365-2435.2007.01247.x, 2007. a
Sardans, J. and Peñuelas, J.: Potassium: a neglected nutrient in global change: Potassium stoichiometry and global change, Global Ecol. Biogeogr., 24, 261–275, https://doi.org/10.1111/geb.12259, 2015. a
Sardans, J., Peñuelas, J., Coll, M., Vayreda, J., and Rivas-Ubach, A.: Stoichiometry of potassium is largely determined by water availability and growth in Catalonian forests, Funct. Ecol., 26, 1077–1089, https://doi.org/10.1111/j.1365-2435.2012.02023.x, 2012. a
Sette, C. R., Laclau, J.-P., Tomazello Filho, M., Moreira, R. M., Bouillet, J.-P., Ranger, J., and Almeida, J. C. R.: Source-driven remobilizations of nutrients within stem wood in Eucalyptusgrandis plantations, Trees, 27, 827–839, https://doi.org/10.1007/s00468-012-0837-x, 2013. a
Siebrecht, S., Herdel, K., Schurr, U., and Tischner, R.: Nutrient translocation in the xylem of poplar? diurnal variations and spatial distribution along the shoot axis, Planta, 217, 783–793, https://doi.org/10.1007/s00425-003-1041-4, 2003. a
Thum, T., Caldararu, S., Engel, J., Kern, M., Pallandt, M., Schnur, R., Yu, L., and Zaehle, S.: A new model of the coupled carbon, nitrogen, and phosphorus cycles in the terrestrial biosphere (QUINCY v1.0; revision 1996), Geosci. Model Dev., 12, 4781–4802, https://doi.org/10.5194/gmd-12-4781-2019, 2019. a
Touche, J., Calvaruso, C., De Donato, P., and Turpault, M.: Five successive years of rainfall exclusion induce nutritional stress in a mature beech stand, Forest Ecol. Manag., 507, 119987, https://doi.org/10.1016/j.foreco.2021.119987, 2022. a
Tripler, C. E., Kaushal, S. S., Likens, G. E., and Walter, M. T.: Patterns in potassium dynamics in forest ecosystems, Ecol. Lett., 9, 451–466, https://doi.org/10.1111/j.1461-0248.2006.00891.x, 2006. a
Turner, J. and Lambert, M. J.: Analysis of nutrient use efficiency (NUE) in Eucalyptus pilularis forests, Austr. J. Bot., 62, 558–569, https://doi.org/10.1071/BT14162, 2014. a
Vicca, S., Luyssaert, S., Peñuelas, J., Campioli, M., Chapin III, F. S., Ciais, P., Heinemeyer, A., Högberg, P., Kutsch, W. L., Law, B. E., Malhi, Y., Papale, D., Piao, S. L., Reichstein, M., Schulze, E. D., and Janssens, I. A.: Fertile forests produce biomass more efficiently, Ecol. Lett., 15, 520–526, https://doi.org/10.1111/j.1461-0248.2012.01775.x, 2012. a
Zaehle, S., Friend, A. D., Friedlingstein, P., Dentener, F., Peylin, P., and Schulz, M.: Carbon and nitrogen cycle dynamics in the O-CN land surface model: 2. Role of the nitrogen cycle in the historical terrestrial carbon balance, Global Biogeochem. Cy., 24, 1, https://doi.org/10.1029/2009GB003522, 2010. a