the Creative Commons Attribution 4.0 License.
the Creative Commons Attribution 4.0 License.
 | 19 Jan 2023
Nitrite cycling in the primary nitrite maxima of the eastern tropical North Pacific
Colette L. Kelly
Margaret R. Mulholland
Karen L. Casciotti
The primary nitrite maximum (PNM) is a ubiquitous feature of the upper ocean, where nitrite accumulates in a sharp peak at the base of the euphotic zone. This feature is situated where many chemical and hydrographic properties have strong gradients and the activities of several microbial processes overlap. Near the PNM, four major microbial processes are active in nitrite cycling: ammonia oxidation, nitrite oxidation, nitrate reduction and nitrite uptake. The first two processes are mediated by the nitrifying archaeal/bacterial community, while the second two processes are primarily conducted by phytoplankton. The overlapping spatial habitats and substrate requirements for these microbes have made understanding the formation and maintenance of the PNM difficult. In this work, we leverage high-resolution nutrient and hydrographic data and direct rate measurements of the four microbial processes to assess the controls on the PNM in the eastern tropical North Pacific (ETNP). The depths of the nitrite maxima showed strong correlations with several water column features (e.g., top of the nitracline, top of the oxycline, depth of the chlorophyll maximum), whereas the maximum concentration of nitrite correlated weakly with only a few water column features (e.g., nitrate concentration at the nitrite maximum). The balance between microbial production and consumption of nitrite was a poor predictor of the concentration of the nitrite maximum, but rate measurements showed that nitrification was a major source of nitrite in the ETNP, while phytoplankton release occasionally accounted for large nitrite contributions near the coast. The temporal mismatch between rate measurements and nitrite standing stocks suggests that studies of the PNM across multiple timescales are necessary.
- Article
(6507 KB) - Full-text XML
-
Supplement
(2816 KB) - BibTeX
- EndNote


Nitrogen (N) availability often controls ocean primary productivity through its role as a limiting nutrient (Zehr and Ward, 2002). In marine systems, nitrate makes up over 88 % of the bioavailable (“fixed”) N pool, with dissolved organic N representing the next largest pool of fixed N (Gruber, 2008). However, the vertical distributions of these species render them unavailable to many of the microbes that require them. For example, nitrate is depleted in euphotic surface waters where primary production is confined but abundant in waters below the euphotic zone. Other inorganic fixed N species, e.g., nitrite and ammonium, are present in smaller quantities, and their production and consumption are tightly coupled in the marine environment. In the upper ocean, the nitracline demarcates a spatial transition where nitrate, nitrite and ammonium may all be available to microbes simultaneously. In particular, the primary nitrite maximum (PNM) is a ubiquitous feature of the upper ocean. In the Pacific Ocean, the median nitrite concentration across PNM features is 237 nM (Olsen et al., 2020; Key et al., 2015), although concentrations as high as 2.8 µM have been reported (Brandhorst, 1958; Carlucci et al., 1970; Dore and Karl, 1996; Wada and Hattori, 1972). In addition, nitrite can be present throughout the entire surface water column (Lomas and Lipschultz, 2006; Zakem et al., 2018). The accumulation of nitrite at the PNM occurs at a depth horizon where dynamic N cycling occurs, and it can appear and disappear within the span of only 25 m. The PNM location generally coincides not only with the top of the nitracline, but also with the depth of the oxycline, the depth of the chlorophyll maximum, and just below or coincident with an ammonium maximum near the base of the euphotic zone (Dore and Karl, 1996; Herbland and Voituriez, 1979; Holligan et al., 1984; Kiefer et al., 1976; Zafiriou et al., 1992; Zakem et al., 2018). The consistent strong spatial relationships between nitrite, nitrate and chlorophyll concentrations hint at a relationship between these environmental parameters and nitrite production, but it does not provide a clear mechanism.
Because the PNM sits at a depth where many environmental parameters and microbial N transformations are in transition, determining the exact controls on nitrite accumulation in the PNM remains difficult (Lomas and Lipschultz, 2006; Wan et al., 2021; Zakem et al., 2018; Wan et al., 2018). Near the PNM, the three main microbial groups involved in nitrite cycling are ammonia oxidizers, nitrite oxidizers and phytoplankton. Nitrification comprises the oxidation of ammonia to nitrate with nitrite as an intermediate. Archaeal ammonia oxidizers dominate the oxidation of ammonia to nitrite (Francis et al., 2007, 2005; Mincer et al., 2007; Santoro et al., 2010; Schleper et al., 2005), while bacterial nitrite oxidizers convert nitrite to nitrate (Lücker et al., 2010, 2013; Watson and Waterbury, 1971; Ward and Carlucci, 1985). Many phytoplankton can also both produce and consume nitrite. Traditionally, phytoplankton are thought to be consumers of inorganic N, but it is now well documented that they also release inorganic N, including nitrite (Al-Qutob et al., 2002; Collos, 1998, 1982a; Lomas and Glibert, 2000). Nitrification and photosynthesis can co-occur near the depth of the PNM, so the extent to which they contribute to PNM formation and what factors influence the magnitude and depth of the PNM depends on how these microbes interact and transform nitrogen and how microbial physiologies respond to gradients in environmental conditions (Ward et al., 1989).
The combination of each microbial group's physiological responses to environmental parameters controls the vertical profiles of concentrations of different N species and leads to accumulation of nitrite at the PNM. Imbalance between the two steps of nitrification has been used to explain nitrite accumulation; variations in light levels may cause differential photoinhibition or differential recovery from photoinhibition of nitrite oxidizers leading to accumulation of nitrite (Guerrero and Jones, 1996; Olson, 1981). Ammonia-oxidizing bacteria are less sensitive to light, have quicker recovery times to light stress, and are active at higher rates under light stress compared to nitrite-oxidizing bacteria (Guerrero and Jones, 1996; Olson, 1981). Recent studies focusing specifically on the numerically dominant ammonia-oxidizing archaea (AOA) have shown high variation in light tolerance across AOA phylotypes, which may explain the lack of strong light inhibition of ammonia oxidation in some studies (Horak et al., 2018; Merbt et al., 2012; Smith et al., 2014). Additionally, nitrification rates are substrate-dependent and constrained to places and times when ammonia and nitrite are both available (Martens-Habbena et al., 2009). Nitrite is also taken up by phytoplankton, but this process is thought to be light dependent (Lomas and Glibert, 2000; Mulholland and Lomas, 2008). Nitrite release from phytoplankton is also well documented in culture studies (Al-Qutob et al., 2002; Collos, 1998), but it is still unclear whether nitrite release occurs during incomplete nitrate reduction under low-light conditions when energy for its complete assimilation is limited, under fluctuating high-light conditions as a photoprotective mechanism, or as a stress response to high light levels (Collos, 1982b; Kiefer et al., 1976; Lomas and Glibert, 1999, 2000; Wada and Hattori, 1971).
Accumulation of nitrite occurs when the rate of its production exceeds that of its loss via consumption or diffusion. Thus, the presence of the PNM is an indicator of conditions where production and consumption of nitrite are, or have recently been, imbalanced (Hattori and Wada, 1971). The accumulation of nitrite in the PNM may provide valuable insight into the balance of relative rates of microbial nitrite cycling in the upper ocean, as it indicates a zone where biologically mediated processes are not in balance and may be experiencing differential inhibition or limitation. Rarely are the four major microbial processes related to PNM formation (ammonia oxidation, nitrite oxidation, nitrate reduction and nitrite uptake) measured simultaneously in the field. The few paired rate measurements that exist tend to show that ammonia oxidation rates exceed nitrite oxidation rates in the PNM, suggesting nitrite oxidation is the rate limiting step in the reaction pair and a potential mechanism for nitrite accumulation (Beman et al., 2013; Schaefer and Hollibaugh, 2017; Füssel et al., 2012; Peng et al., 2015; Santoro et al., 2013; Ward et al., 1982). However, the lack of paired measurements focused on the sharp PNM boundaries limits our understanding of the coupling between the two steps of nitrification or other processes affecting nitrite accumulation across these depths. Higher-resolution paired measurements will allow us to investigate how environmental gradients create vertical zonation in the relative rates of nitrite-cycling processes that lead to nitrite accumulation within narrow depth horizons. Previous investigations of the PNM have typically focused on nitrifier communities or phytoplankton communities separately, although it is understood that the niches of these communities overlap and that both may contribute to nitrite accumulation. The studies that have measured both phytoplankton and nitrifier processes (Mackey et al., 2011; Santoro et al., 2013; Wan et al., 2018; Ward, 2005) support the idea that physiological constraints and competitive interactions between these groups drive resource use and nitrite accumulation (Smith et al., 2014; Wan et al., 2021; Zakem et al., 2018).
Understanding the controls on rates of co-occurring nitrite cycling processes will help clarify the distributions of microbial activity and how relative rates of these processes may change due to future environmental perturbations. For example, understanding the controls on and patterns of nitrification in the surface ocean is critical for understanding new production, as estimates suggest more than 30 % of oceanic primary production is supported by nitrate supplied by nitrification in the euphotic zone (Santoro et al., 2010; Ward et al., 1989; Yool et al., 2007). In addition, the relative contributions of nitrification and phytoplankton activity to the formation of the PNM may also be important for understanding the potential for nitrous oxide formation in the surface ocean (Burlacot et al., 2020; Kelly et al., 2021; Plouviez et al., 2019; Santoro et al., 2011).
To investigate the relative contributions of nitrification and phytoplankton processes to net accumulation of nitrite at the PNM feature, we measured rates of four microbially mediated nitrite cycling processes (ammonia oxidation, nitrite oxidation, nitrate reduction and nitrite uptake) in vertical profiles through the PNM. We analyzed spatial and regional variations in environmental conditions and water column features associated with the PNM, as well as the rates of nitrite production and consumption.
2.1 Hydrography and nutrient analyses
This study is based on data collected from four cruises to the eastern tropical North Pacific Ocean (ETNP) between April 2016 and June 2018 (RB1603 – R/V Ronald Brown, April 2016; SKQ201617s – R/V Sikuliaq, December 2016; SR1805 – R/V Sally Ride, April 2018; and FK180624 – R/V Falkor, June 2018; Fig. 1). The ETNP hosts one of the largest oceanic oxygen deficient zones (ODZs) and is a region of active nitrogen cycling. Oxygen concentrations decline precipitously from saturated surface water concentrations to nanomolar levels across the oxycline in much of the study area (Cline and Richards, 1972), with oxygen deficient waters beginning as shallow as 15 m at some coastal stations. This study focused on nitrite cycling in the upper water column near the PNM, and all rate data were collected in oxygenated waters in or above the oxycline.
Fifty-three stations were occupied during these cruises, and hydrographic observations of temperature, salinity, and oxygen were made using a CTD package (RB1603 – Sea-Bird SBE 11+ CTD, SKQ201617s/SR1805/FK180624 – Sea-Bird SBE 911+ CTD). Fluorescence and photosynthetically active radiation (PAR) measurements were measured at a subset of stations (RB1603 – LI-COR Biospherical Photosynthetically Active Radiation Sensor/SeaPoint Chlorophyll Fluorometer). Discrete water samples were collected from Niskin bottles mounted to the CTD rosette to measure dissolved inorganic N concentrations. Nitrite and ammonium concentration measurements were typically made immediately on board the ship, while samples for nitrate concentration measurements were 0.22 µm filtered and frozen in 60 mL HDPE bottles for analysis at a shore-based laboratory. During the 2016 cruise, a pump profiling system (PPS; as described in Codispoti et al., 1991) was also deployed with a separate CTD package (Seabird SBE19+, WetStar Fluorometer) at all 16 stations.
For all cruises, nitrite concentrations were measured colorimetrically with a detection limit of ∼ 200 nM (Strickland and Parsons, 1972). Briefly, 5 mL of sample water from each Niskin bottle was reacted with 200 µL each of sulfanilamide and N-(1-NAPHTHYL)ethylenediamine reagents, and absorbance at 543 nm was measured after a 10 min reaction time and converted to concentration using a standard curve, with an overall precision of ±0.006 µM. Ammonium concentrations were measured shipboard using a fluorometric method after derivatization with ortho-phthaldialdehyde (OPA) reagent (Holmes et al., 1999). Samples and standards were reacted with OPA for ∼ 8 h at 4 ∘C in the dark before measurement. Detection limit for this ammonia method was 30 nM. In 2016, samples for nitrate plus nitrite were collected from discrete depths using Niskin bottles mounted to a CTD rosette and analyzed shipboard using an Astoria Pacific autoanalyzer according to the manufacturer's specifications using standard colorimetric methods (Strickland and Parsons, 1972). In 2017, nitrate-plus-nitrite samples were analyzed using standard colorimetric methods on a Technicon Autoanalyzer at the University of Washington. In 2018, nitrate plus nitrite was measured after Cd reduction using a WestCo SmartChem 200 Discrete Analyzer at Stanford University, with an overall precision of ±0.6 µM and detection limit of 85 nM (Miller and Miller, 1988; Rajaković et al., 2012). Nitrate concentrations were calculated by subtracting nitrite from the concentration of nitrate plus nitrite for all cruises. During the 2016 cruise (RB1603), cast water from the PPS was pumped directly through a fast repetition rate fluorometer (FRRF) for chlorophyll a fluorescence measurements and then to an Alpkem Astoria-Pacific rapid-flow analysis system for near-continuous profiles of nitrate, nitrite, and ammonium concentrations at one measurement per second and binned to every meter (Holmes et al., 1999; Sakamoto et al., 1990; Strickland and Parsons, 1972).
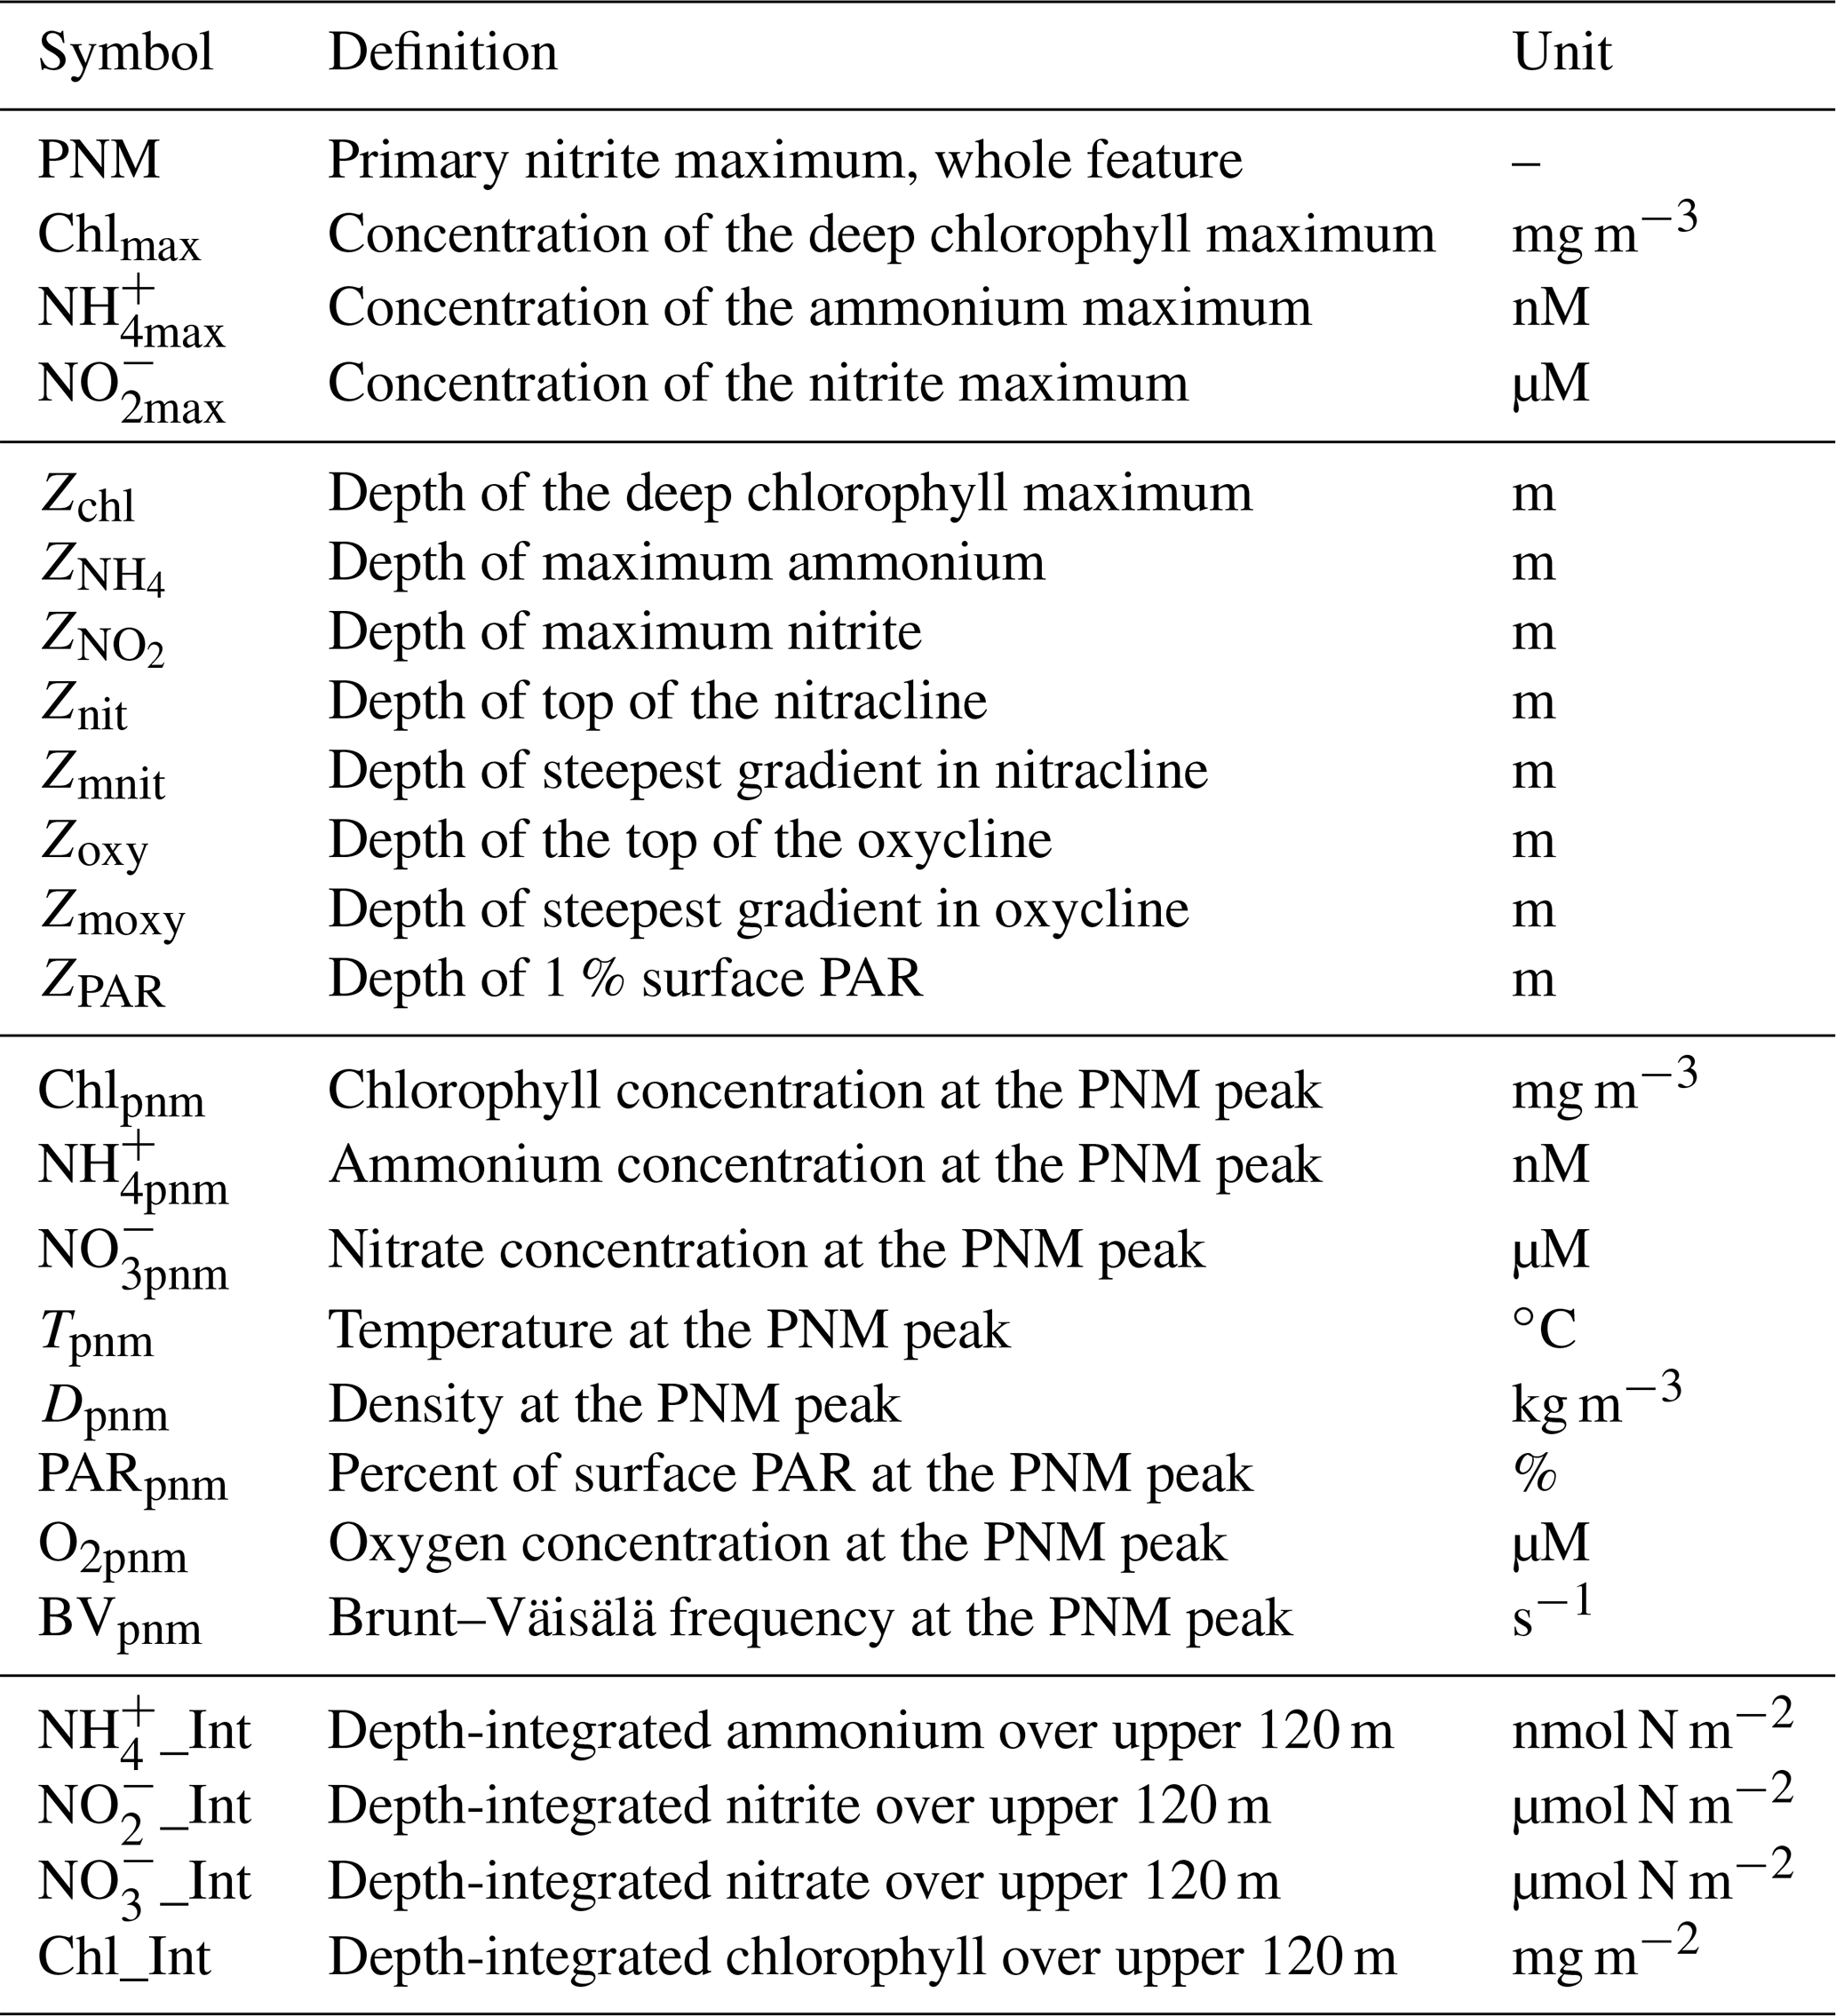
Water column profiles were analyzed to determine station-specific water column features (Tables 1 and S1 in the Supplement). The depth of the top of the nitracline (Znit) was identified as depth at which nitrate concentration increased by 1 µM compared to a reference depth of 20 m (Cornec et al., 2021). In addition, the standard nitracline depth (Zmnit) was identified as where the nitrate gradient was steepest. Similarly, the top of the oxycline (Zoxy) was identified as the depth at which oxygen concentration decreased by 5 µM relative to the concentration at a depth of 20 m. The standard oxycline depth (Zmoxy) was where the oxygen gradient was steepest. Other station-specific water column features included the depth and concentration of the nitrite maximum (m and µM, respectively), the depth and concentration of the chlorophyll maximum (m and mg m−3, respectively), the depth and concentration of the ammonium maximum (m and nM, respectively), and the depth at which 1 % of the surface photosynthetically active radiance (PAR) was present (m). Concentrations/characteristics of these variables at the depth of the nitrite maximum were also calculated (e.g., nitrate concentration (NO), chlorophyll concentration (Chlpnm), ammonium concentration (NH), oxygen concentration (O2pnm), temperature (Tpnm), density (Dpnm), percent of surface PAR (PARpnm)). The Brunt–Väisälä frequency (BVpnm) was calculated at the PNM nitrite maximum (±8 m) using the equation , where g is the acceleration due to gravity (m s−2), z is depth (m) and ρ is density (kg m−3). Depth-integrated concentrations of nitrate, nitrite, and ammonium (µmol N m−2) were calculated for the euphotic zone (upper 120 m), capturing the entirety of the PNM feature.
Table 1Water column feature abbreviations, definitions and units.
2.2 Nitrite cycling rates
Rates of ammonia oxidation, nitrite oxidation, nitrate reduction and nitrite uptake were measured at 12 of the 53 stations occupied over four cruises from 2016–2018 (Fig. 1a), including five stations from 2016, two stations in 2017 and five stations in 2018. At each of these stations during a pre-dawn cast, 3–4 depths near the PNM were sampled based on real-time CTD fluorescence data during the downcast, targeting depths both within the chlorophyll maximum and on the upslope and downslope of its peak (Table S2). When available, nitrite profiles from previous casts were consulted to guide sampling based on the location of the PNM within the chlorophyll maximum.
From each depth, six clear 500 mL polycarbonate (PC) Nalgene bottles were triple-rinsed and filled directly from the Niskin bottle for light incubations. Additionally, six 500 mL or 1 L amber high-density polyethylene (HDPE) Nalgene bottles were triple-rinsed and filled for paired dark incubations. One of three 15N-labeled nitrogen substrates (K15NO3 enriched at 99.5 atm %, Na15NO2 enriched at 98.8 atm % or 15NH4Cl enriched at 99.5 atm %) was added to duplicate bottles to achieve enrichments of 200 nM 15N. High tracer enrichment in samples with low ambient concentrations may lead to enhancement of rates, which are best characterized as potential rates; care must be taken when interpreting results. After gentle mixing, a 60 mL subsample was syringe-filtered (0.22 µm pore size Sterivex) to determine initial concentration and 15N enrichment of the substrate pool. Approximately 10 mL was used for shipboard measurement of the initial concentrations of total nitrite or ammonium (ambient concentration plus 15N-labeled DIN addition). The remaining 50 mL was frozen at −20 ∘C in a 60 mL HDPE bottle for measurement of total nitrate concentration and isotopic enrichment in a shore-based laboratory.
Each incubation bottle was placed in a deck-board incubator that approximated the ambient light level from the sample collection depth, achieved using neutral density screening. The percent PAR in the incubators was recorded using a submersible LI-COR PAR meter or an in situ HOBO light and temperature logger (∼ 1 %, ∼ 4 %, ∼ 20 % surface PAR). Incubators were plumbed with flow-through surface seawater to maintain a consistent water temperature. However, surface water temperatures were often significantly warmer than those at collection depth and could have biased some of the incubation results. Subsamples were collected from each incubation bottle after approximately 8, 16 and 24 h. Samples were syringe-filtered (0.22 µm pore size Sterivex) and frozen in 60 mL HDPE bottles for nutrient and isotope analysis in a shore-based laboratory. At the end of the incubation (24 h), the remaining ∼ 300 mL of water in each replicate bottles was combined in order to maximize the amount of nitrogen available for isotope analysis. Sample water was filtered onto a pre-combusted (450 ∘C for >4 h) GF/F (0.7 µm) filter; the filter was folded and placed into a cryovial and stored at −80 ∘C for later analysis of particulate δ15N at the University of Hawaii Isotope Lab. All seawater samples were stored frozen until the time of isotopic analysis. Incubation bottles were acid washed and re-used for experiments using the same 15N substrate.
2.3 Isotope analysis and rate calculations
For estimates of ammonia oxidation, nitrite oxidation and nitrate reduction rates, samples collected from each time point were analyzed for 15N enrichment of the respective product pool (Table 2). For each sample, the product was converted to nitrous oxide either by bacterial (P. aureofaciens) conversion using the denitrifier method (McIlvin and Casciotti, 2011; Sigman et al., 2001) or chemical conversion using the azide method (McIlvin and Altabet, 2005). Isotopic analysis via the denitrifier method was used for measurement of 15NOx (i.e., 15NO + 15NO) in ammonia oxidation and nitrite oxidation experiments. Measurements of nitrite oxidation required pre-treatment of samples to remove any remaining 15N–NO2 prior to analysis of δ15N–NO3 (Granger and Sigman, 2009). Briefly, 10 mL of each sample was treated with 100 µL of 4 % sulfamic acid in 10 % hydrochloric acid for 15 min, after which the pH was neutralized using 85 µL of 2 M sodium hydroxide before proceeding with denitrifier method. Samples were prepared in volumes targeting 20 nmol nitrate. The azide method was used to prepare nitrite produced from nitrate reduction experiments for isotopic analysis (McIlvin and Altabet, 2005). Nitrite was converted to nitrous oxide by incubating for ∼ 30 min with a 2 M sodium azide solution in 20 % acetic acid. The reaction was neutralized with 6 M sodium hydroxide prior to isotope analysis. Since nitrite product concentrations were low (<2 µM), a significant portion of the nitrite in the samples was newly created from 15N-labeled nitrate; thus carrier nitrite (5–10 nmol) of known isotope value was added to dilute the 15N enrichment and increase overall concentration of nitrite in the samples before isotopic analysis. Samples were analyzed in volumes targeting 10 nmol of nitrite.
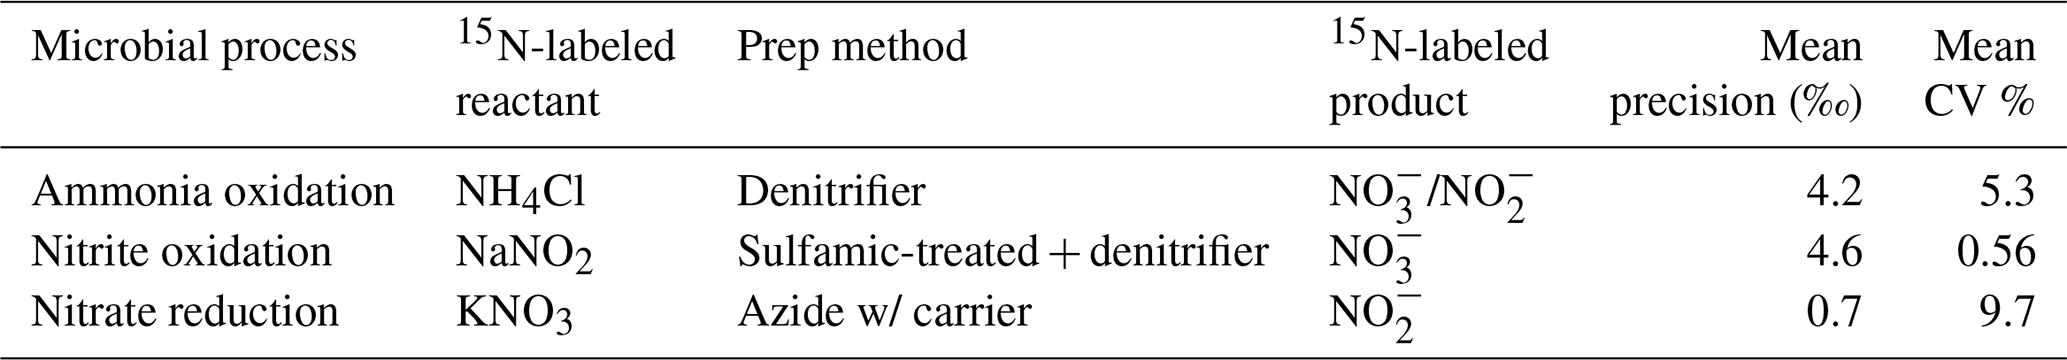
The isotopic composition of the nitrous oxide produced from each sample was measured in the Casciotti Laboratory at Stanford University using an isotope ratio mass spectrometer (Thermo-Finnigan DeltaPLUS XP) fitted with a custom purge-and-trap gas purification and concentration system (McIlvin and Casciotti, 2011). Each set of nine samples was bracketed with international reference materials to correct for instrument drift and sample size and to calibrate isotope values. USGS32, USGS34 and USGS35 (Böhlke et al., 2003) were used to calibrate nitrate isotope analyses, and RSIL-N23, N7373 and N10219 (Casciotti et al., 2007) were used to calibrate nitrite isotope analyses. For nitrate reduction samples, additional mass balance corrections were made to correct for the addition of nitrite carrier to the product pool before calculation of rates. The denitrifier method for natural abundance nitrate isotope analyses typically has a precision of better than 0.5 ‰ for δ15N (McIlvin and Casciotti, 2011; Sigman et al., 2001), although standard deviations are often higher for isotopically enriched samples. Here, the mean analytical precision of δ15N–NOx, δ15N–NO and δ15N–NO measurements of 15N-labeled samples were ±4.2 ‰, ±4.6 ‰ and ±0.7 ‰, respectively, corresponding to mean coefficient of variance (CV %) of 5.3 %, 0.56 % and 9.7 %, respectively (Table 2).
Table 2Nitrite cycling reactant and product pools as analyzed by isotope rate mass spectrometry.
Rate calculations were made by tracking the increase in product 15N over the incubation period (Ward, 1985). For ammonia oxidation the equation is as follows:
where Δ[15NOx]t8−t0 is the change in product 15NOx concentration between the start of the incubation and the 8 h time point (nM), 15F is the fractional abundance of 15N in the NH3 substrate at the start of the incubation period (where 15F = 15N (15N + 14N)), and Δt is the change in time (hours). While the initial 15N in the substrate pool was directly measured at time zero for use in rate calculations, the addition of 200 nM 15N tracer led to variable fractional abundance of 15N in the substrate pool across experiments, which was calculated from ambient and tracer substrate concentrations. Paired dark and light incubation samples were used to convert hourly rates to daily rates using a simple assumption of a 12 h light : 12 h dark daily cycle. The ammonia oxidation rate, , is thus reported in units of nM N d−1. A similar equation was used to calculate nitrite oxidation and nitrate reduction rates, substituting the appropriate substrate and product species for each process (Table 2). Some dark incubation data were not available for nitrate reduction measurements in 2016, so those daily rates were calculated using 24 h light incubated rates and may be overestimates. The 16 and 24 h time point samples were analyzed but not used to calculate rates as experiments showed non-linear trends after 8 h of incubation due to substrate depletion. Based on a threshold increase in product δ15N compared to the initial product, a theoretical detection limit was calculated to estimate the rate we can reasonably expect to discern from zero (Santoro et al., 2013). This calculation is sensitive to the δ15N of the substrate pool, the concentration of the product pool and the CV % for δ15N measurements. The threshold for detectable change in product δ15N was approximated using the maximum CV % for each experiment. For example, if the standard deviation in replicates for a sample with a δ15N of 25 ‰ was ±0.6, a CV % of 2.4 % was used as the theoretical detectable difference between initial and final 15N enrichment in the product pool. Where available, the maximum CV % for each experimental unit was used to calculate the theoretical limit of detection for each depth (Table S2b). The mean theoretical detection limits for ammonia oxidation, nitrite oxidation and nitrate reduction were 0.5, 6.9 and 0.9 nM d−1, respectively. Experimental bottle duplicates were conducted for most rate measurements, and those standard deviations are reported with the final rate data (Table S2b).
Filters from nitrite uptake rate experiments were dried overnight and packed in tin capsules before shipment to the Biogeochemical Stable Isotope Facility at the University of Hawaii, where samples were analyzed on a Thermo Scientific Delta V Advantage isotope ratio mass spectrometer coupled to a Costech Instruments elemental analyzer. Rate calculations relied on 15N enrichment of the particulate organic nitrogen over the 24 h incubation period as in Dugdale and Goering (1967). Uptake rates were calculated according to Dugdale and Wilkerson (1986) where the initial 15N fractional abundance of the reactant pool was calculated assuming 0.3663 for the 15N fractional abundance of the ambient substrate pool and 98.8 atm % 15N–NO of the isotope tracer addition. Nitrite uptake rates may be underestimated due to dilution of the substrate pool via regeneration over the 24 incubation period and loss of tracer to unmeasured DON pools (Bronk et al., 1994; Glibert et al., 2019). No correction was made for possible rate enhancement due to tracer addition (Dugdale and Wilkerson, 1986).
2.4 Multiple linear regression analysis
Multiple linear regression (MLR) models were built to assess the environmental variables that influence the depth and magnitude of the PNM feature in the ETNP. The first set of MLR models (“full” models) used semi-continuous measurements (temperature, density, oxygen, chlorophyll fluorescence, PAR, nitrate, nitrite and ammonium) from CTD/PPS casts collected at 16 stations on the 2016 cruise to predict nitrite concentration. Nitrate, nitrite and ammonium data were natural-log transformed to satisfy normal distribution assumptions of the multiple linear regression analyses. Using the R package leaps, the model was optimized using a best-subsets selection of the full variable set to maximize R2 and minimize root mean squared error for each potential model size using 10-fold cross validation to calculate test error for each sized model (optimization led to selection of 19 variables out of 27 possible explanatory variables – 7 main and 20 single interactions terms) (Lumley, 2020). The model size that minimized test error was selected, and a best-subsets selection method was used to determine the optimal variable coefficients. MLR coefficients from the optimized models were then used to predict nitrite concentration for station depth profiles in the ETNP. Three variations on the “full” model were made using data from (1) all stations, (2) a subset of coastal stations (6, 7, 8, and 9) and (3) a subset of offshore stations (13, 14, 15 and 16). Subsets of stations were selected as exemplary of the coastal and offshore regimes based on proximity to the coast, concentration of the chlorophyll maxima and nitracline depths. The selection criteria for coastal stations used in MLR construction included being close to a coastline, nitracline <40 m depth and chlorophyll maximum larger than 9.5 mg m−3. Offshore stations were selected based on furthest distance from a coastline. Not all stations proximal to the coastline were characterized as coastal (see Fig. 1) or included in the “coastal” subset used to train the model (Table S1a).
Using the same subsets of “coastal” and “offshore” stations, a second set of MLR models (“core” models) was built using a more limited set of core variables from the PPS data that focused on phytoplankton and nitrifier physiology and metabolism (chlorophyll, nitrate, ammonium, oxygen and percent PAR). These five environmental variables, their quadratic terms and single interaction terms were included for 20 parameters in total. This model experiment was constructed to assess the relative importance of these core variables between “coastal” and “offshore” regimes; therefore, no model size optimization was used to limit variables. Instead, optimized coefficients for all variables were determined, and variables that contributed less than 2 % of total R2 in both regional models were discarded. In two cases, a variable that was discarded from one regional model was added back to keep the variable list identical between both models for ease of comparison. For example, in the coastal “core” model, the quadratic term for chlorophyll contributed less than 2 % to total R2 but contributed greater than 2 % relative importance within the offshore “core” model and was therefore retained in both models. In the offshore “core” model, PAR was initially removed during the optimization processes because it contributed less than 2 % to model R2 but was ultimately retained because it contributed greater than 2 % relative importance within the coastal “core” model. The relative percent importance of each variable was calculated by iterative random-ordered removal of each variable to estimate percent contribution to total model R2 using the relaimpo package in R (Grömping, 2006).
3.1 PNM structure and environmental conditions
The typical PNM feature in the ETNP was a unimodal nitrite accumulation situated just below the chlorophyll maximum and at the top of the nitracline (e.g., Fig. 1b, c). The PNM feature can be described using characteristics of the nitrite profile (i.e., maximum nitrite concentration (µM) and depth of the nitrite maximum (m)) and an integrated nitrite quantity for the whole PNM feature. Although nitrite can seasonally accumulate all the way to the surface in some regions (Zakem et al., 2018), homogenous surface nitrite concentrations were not observed in this dataset. Across the ETNP study region, stations showed similar relative water column structures in the upper 200 m, although the exact depth and magnitude of features varied. Generally, the depth distribution of features from shallowest to deepest was the top of nitracline, the chlorophyll maximum, the ammonium maximum and then the nitrite maximum (Fig. 1b, c). This set of sequential features occurred near the base of the euphotic zone at most stations. Surface irradiance attenuated through the water column and the depth of 0.1 %–1 % surface PAR ranged between 25 and 150 m depth, with the deepest light penetration at offshore stations. The chlorophyll maximum was usually found around the 1 % surface PAR depth and within the nitracline. However, there was variation in how deep the chlorophyll maximum sat within the nitracline, as reflected in the amount of nitrate measured at the depth of the chlorophyll maximum (Table S1a). The depth of the nitrite maximum tended to occur within the downslope of the chlorophyll maximum. The depth horizon of the PNM was often narrow, with detectable nitrite concentrations spanning only 30 m in some cases.
The depth of maximum nitrite in the PNM shoaled from an average depth of 103 m at offshore stations to 21 m near the coast, closely following the shoaling nitracline. In density space, the depth of maximum nitrite fell within a narrower range, from 22.1 to 26.3 kg m−3, with a mean density across the study region of 24.1 kg m−3. The nitrite maxima had an average concentration of ∼ 600 nM and a range spanning 60–1520 nM. Two types of stations (“coastal” and “offshore”) were identified based on water column features. Coastal stations (e.g., 2016 PPS 6, 7, 8, 9) were within 160 km of the coastline and had higher concentrations of nitrite at the nitrite maxima, shallower depths of the maximum nitrite, more nitrate and slightly more chlorophyll and light at the depths of the maximum nitrite (Table S1a, b). Coastal stations also had shallower oxyclines, 1 % PAR depths, ammonium maxima and chlorophyll maxima compared to offshore stations. Depth-integrated chlorophyll, nitrate and ammonium in the upper 120 m were higher at coastal stations. Offshore stations (e.g., 2016 PPS 13, 14, 15, 16) had deeper nitraclines, smaller chlorophyll maxima and less light at the depth of the nitrite maxima.

Figure 1Map of the ETNP region showing stations included in this study from four cruises between 2016–2018 (a). Stations where rate measurements were made are marked with white stars. Pump profile data were collected at each station occupied during the 2016 cruise, and coastal stations are encircled in green. Mean water column profiles from example “coastal” stations (8 and 9) and example “offshore” stations (14 and 16) during the 2016 cruise (b, c). Dashed grey line depicts the depth at which dissolved oxygen concentrations declined below 3 µM.
3.2 Regressions with the nitrite maxima
There were no strong linear correlations between the concentrations of nitrite and other observed environmental variables in vertical profiles (chlorophyll, depth, density, oxygen, temperature, nitrate, ammonium). This is unsurprising since the variables with unimodal profiles (chlorophyll, ammonium) have concentration maxima that are offset vertically from the nitrite maximum, and features with other distributions (e.g., exponential) are not expected to have linear relationships with a unimodal nitrite profile. However, spatial relationships between environmental gradients are still observed in the quantity regressions; for example, the density regression clearly shows that the peak of the PNM feature consistently fell near the 24 kg m−3 isopycnal across the region in 2016.
To better match unimodal nitrite profiles with spatially offset and vertically non-unimodal environmental gradients, station-specific features were identified in the high-resolution 2016 PPS profiles and, where possible, in the CTD datasets (Table 1; e.g., NO and ). The strongest correlation (R2=0.50, p<0.01) appeared between NO (µM) and NO (Fig. 2c). The Brunt–Väisälä frequency (BV), related to water column stability, also had a strong positive correlation (R2=0.40, p<0.01) with NO (Fig. 2l). There were weaker correlations with other parameters such as Chlpnm (mg m−3), Chlmax (mg m−3), Tpnm (∘C) and O2pnm (µM) (R2=0.20, 0.23, 0.25, 0.29, respectively, all p<0.05) (Fig. 2a, b, h, f). Removing the outliers from the two chlorophyll regressions (Fig. 2a, b) did not improve the correlations (R2=0.06 and 0.09, respectively). The NO was not linearly correlated with PARpnm (%) or NH (nM) (Fig. 2g, d). The Chl_Int, NO_Int and NO_Int (excluding ODZ waters with O2 < 3 µM) were higher when NO was larger (Fig. 2i, j, k). The NO had a weak correlation with NH_Int (not shown; see Table S1c for Pearson correlations and p values). Inclusion of lower-resolution CTD casts from cruises in 2017/2018 decreased the strength of the linear correlations, likely because of larger error in determining the depths of water column features (e.g., , Znit) with larger (∼ 10 m) spacing between discrete measurements (Fig. S1a in the Supplement).
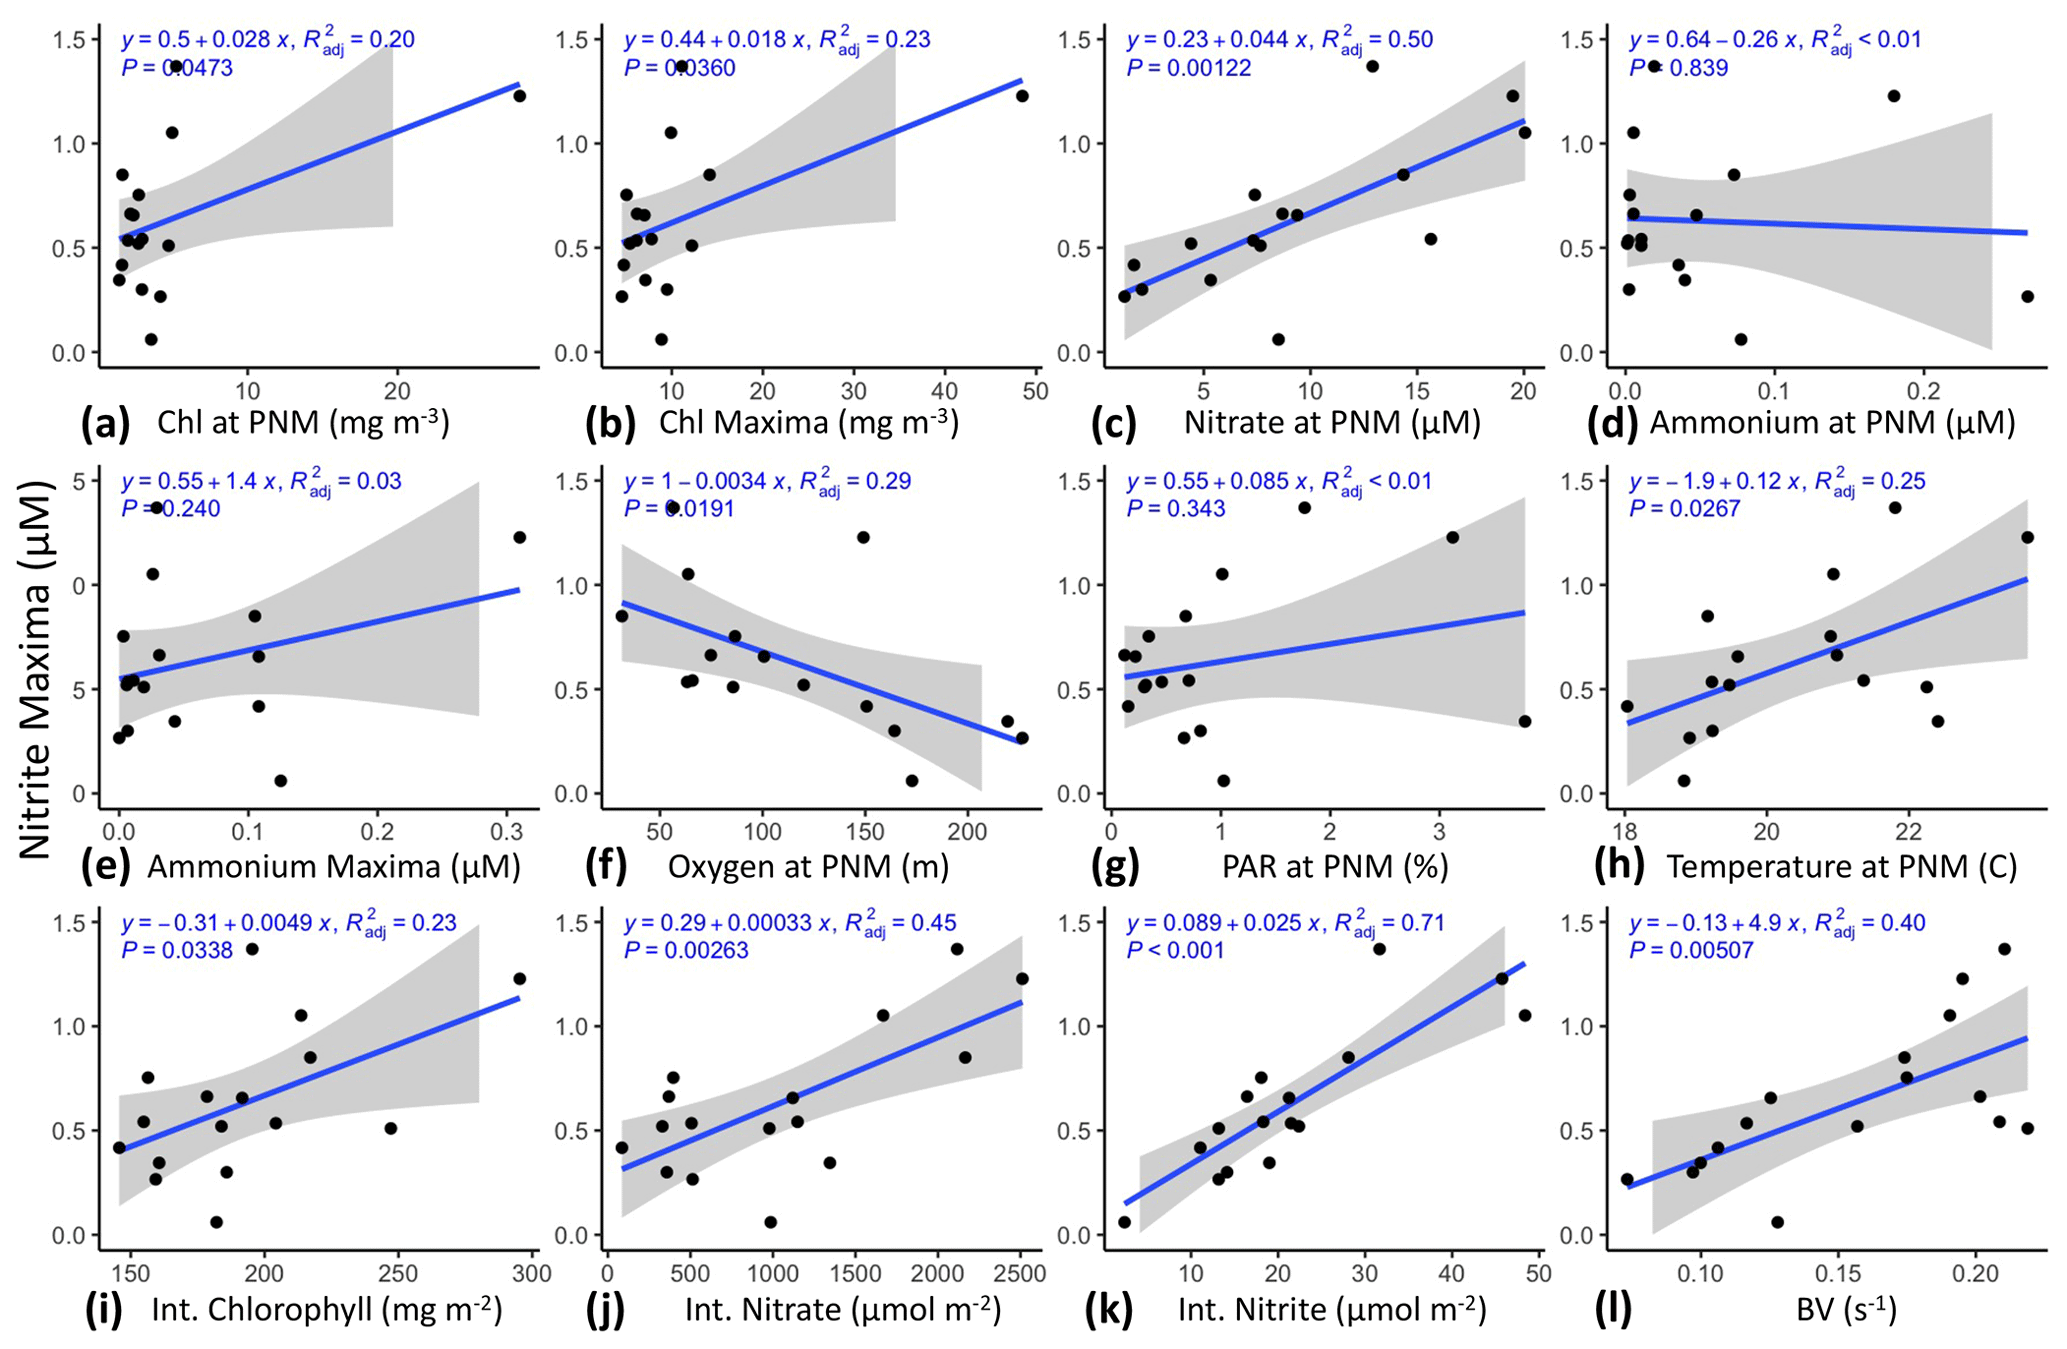
Figure 2Linear regressions of NO against maxima of other parameters, integrated amounts of chlorophyll and DIN, and Brunt–Väisälä frequencies using PPS station data from 2016 (n=16). Chlpnm (a), Chlmax (b), NO (c), NH (d), NH (e), O2pnm (f), PARpnm (g), Tpnm (h), Chl_Int (i), NO_Int (j), NO_Int (k), and BVpnm (l). PPS station data from 2016 (n=16). Shaded region shows standard error.
3.3 Regressions with depth of the nitrite maxima
The depth of the nitrite maximum at each station was also regressed against the depth of station-specific features (Fig. 3). All water column features showed strong linear correlations with the (Fig. 3a–h). The depth of the top of the nitracline and ZPAR had the strongest correlations with (R2=0.94, 0.85) (Fig. 3b, g). Correlations of with midpoint-calculated oxyclines and nitraclines were weaker, possibly because those features are less easily defined, or the steepness of these “clines” was still actively being shaped by the biological responses to changing physical and environmental forcing. The depth of the nitrite maxima tended to be related to the depths of other features and was not as strongly correlated with the magnitudes (concentrations) of any other feature (Fig. S2). However, and NO were mildly correlated (R2=0.22, p=0.039), with larger NO tending to occur at shallower depths. This correlation became insignificant when the CTD data were included (Fig. S1b). Integrated nitrate had a strong correlation with (R2=0.88, p<0.01), which is reflective of the depth of NO tracking with Znit. Depth-integrated chlorophyll and NO_Int had more moderate correlations with (R2=0.21, p=0.041 and R2=0.32, p=0.013, respectively). Depth-integrated ammonium concentrations did not correlate with the (see Table S1c for Pearson correlations and p values).
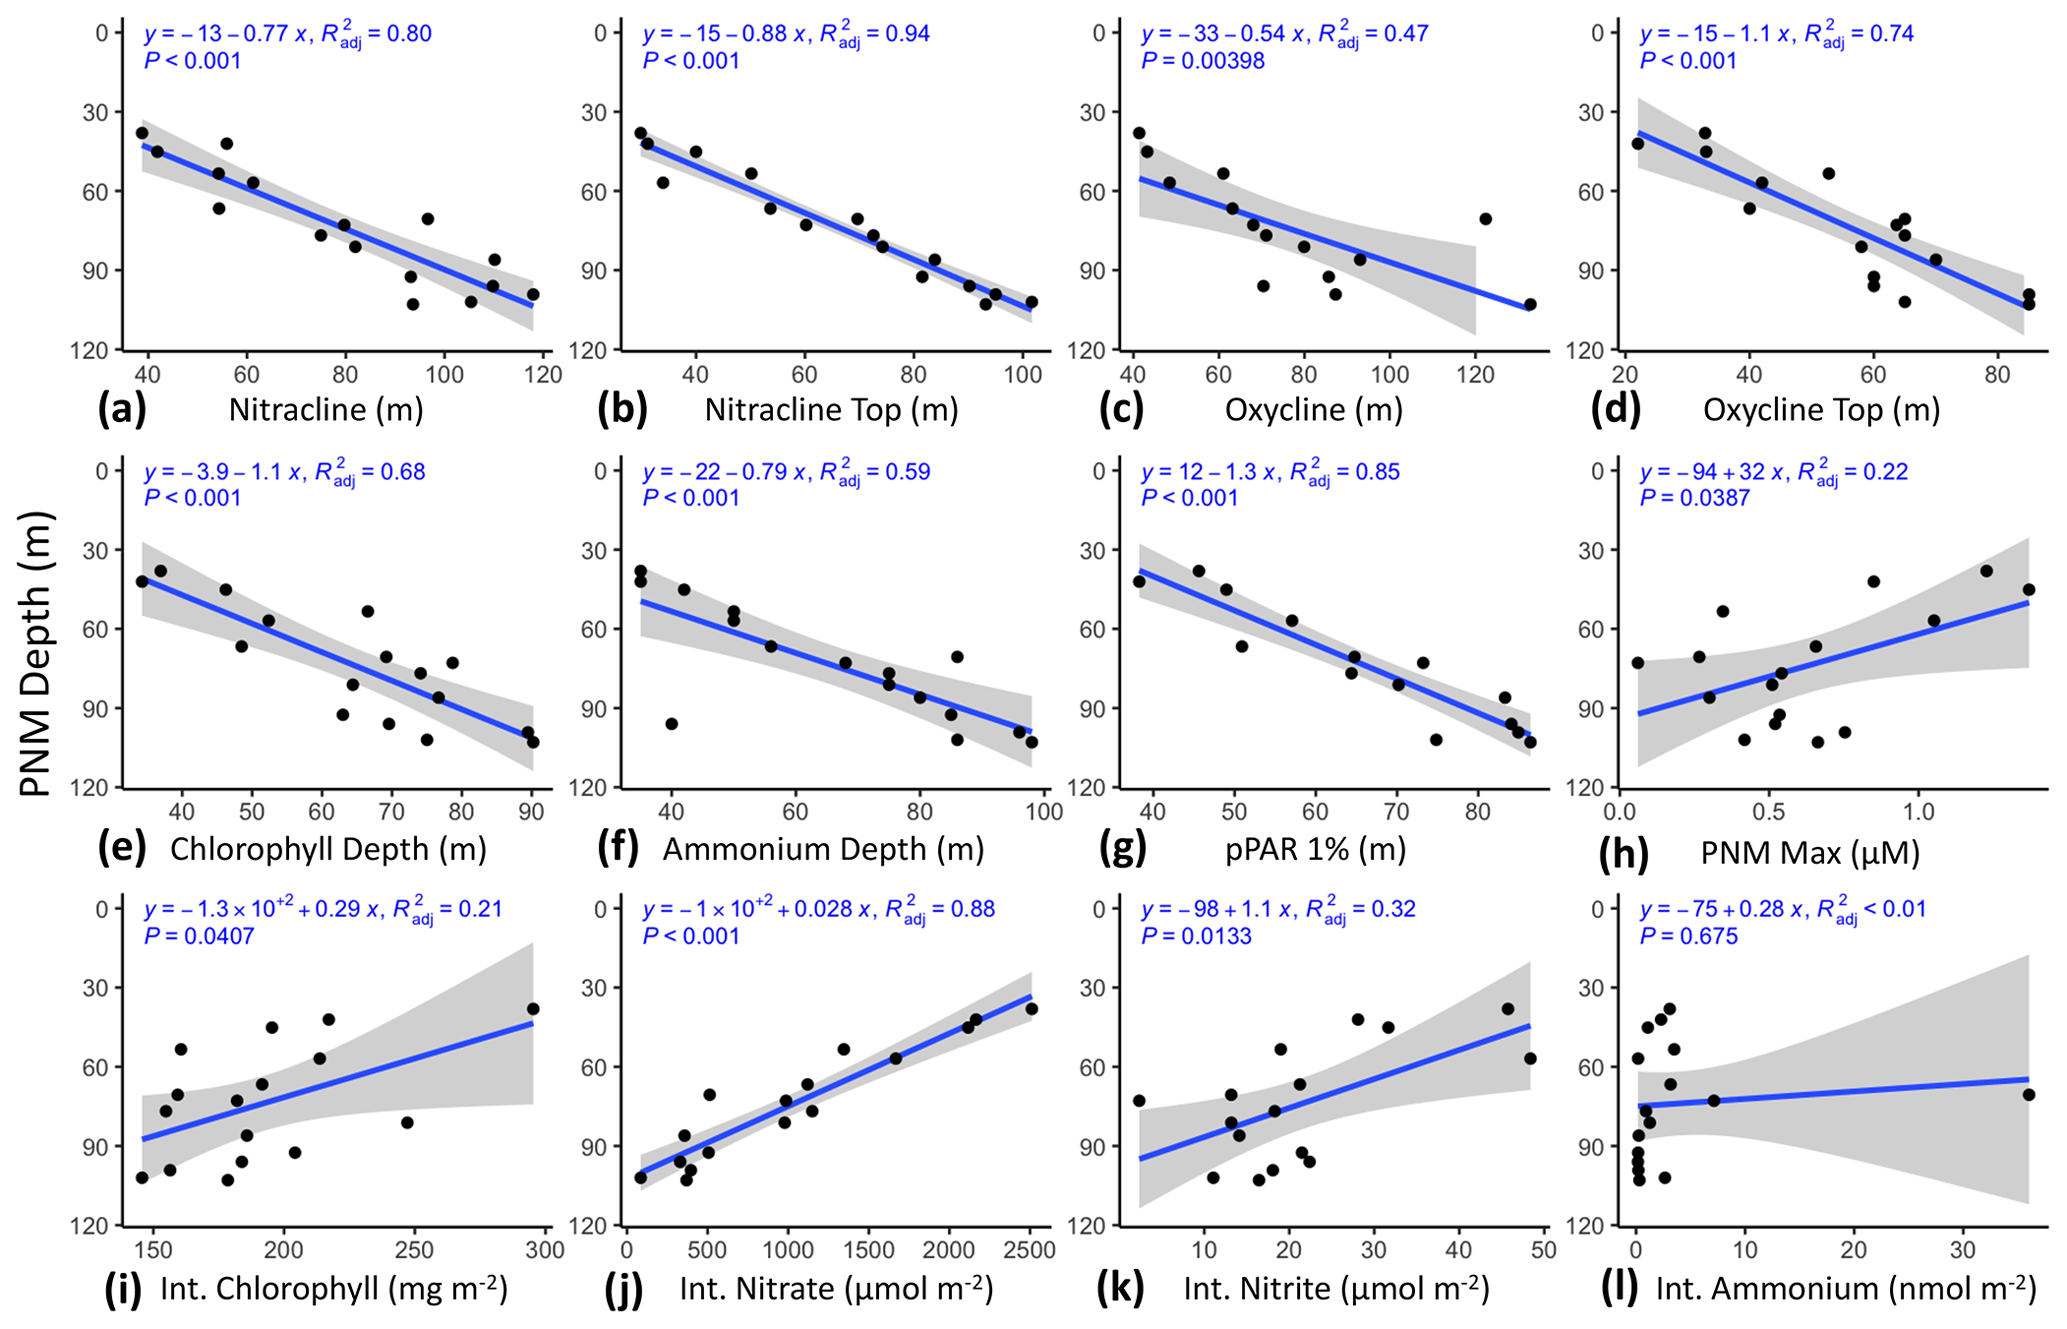
Figure 3Linear regression of against water column features from data collected during the 2016 cruise using the PPS. Depth of the nitrite maxima was regressed against (a) Zmnit, (b) Znit, (c) Zmoxy, (d) Zoxy, (e) Zchl, (f) , (g) ZPAR, (h) NO, (i) Chl_Int, (j) NO_Int, (k) NO_Int and (l) NH_Int. PPS station data from 2016 (n=16). Shaded region shows standard error.
3.4 Nitrite cycling rates
Rates of nitrite cycling determined for the four major nitrite cycling processes near the PNM were within the same range as previous measurements made in the ETNP region and along the adjacent California coast (Beman et al., 2008; Santoro et al., 2010, 2013; Ward et al., 1982). Within our dataset, the mean rates of ammonia oxidation and nitrite oxidation were similar to each other (24.3±3.6 and 19.5±3.4 nM d−1, respectively), although there was a large range in individual rate measurements across stations and depths, with maximum rates reaching 90.4 and 87.4 nM d−1 respectively. Rates of the two phytoplankton-dominated processes were generally lower and not as similar to each other, with a mean nitrate reduction rate of 6.1±1.9 nM d−1 and mean nitrite uptake rate of 19.0±5.3 nM d−1. However, nitrite uptake reached one of the highest rates measured, at 165 nM d−1, and the nitrate reduction rate reached 53.2 nM d−1 at a coastal station during the 2017 winter cruise. Comparison of mean nitrification rates between coastal and offshore stations did not show a significant difference (Table S2c). The pooled mean standard deviations across experimental bottle replicates for ammonia oxidation, nitrite oxidation and nitrate reduction were 3, 4.6 and 1 nM d−1, respectively (Table S2).
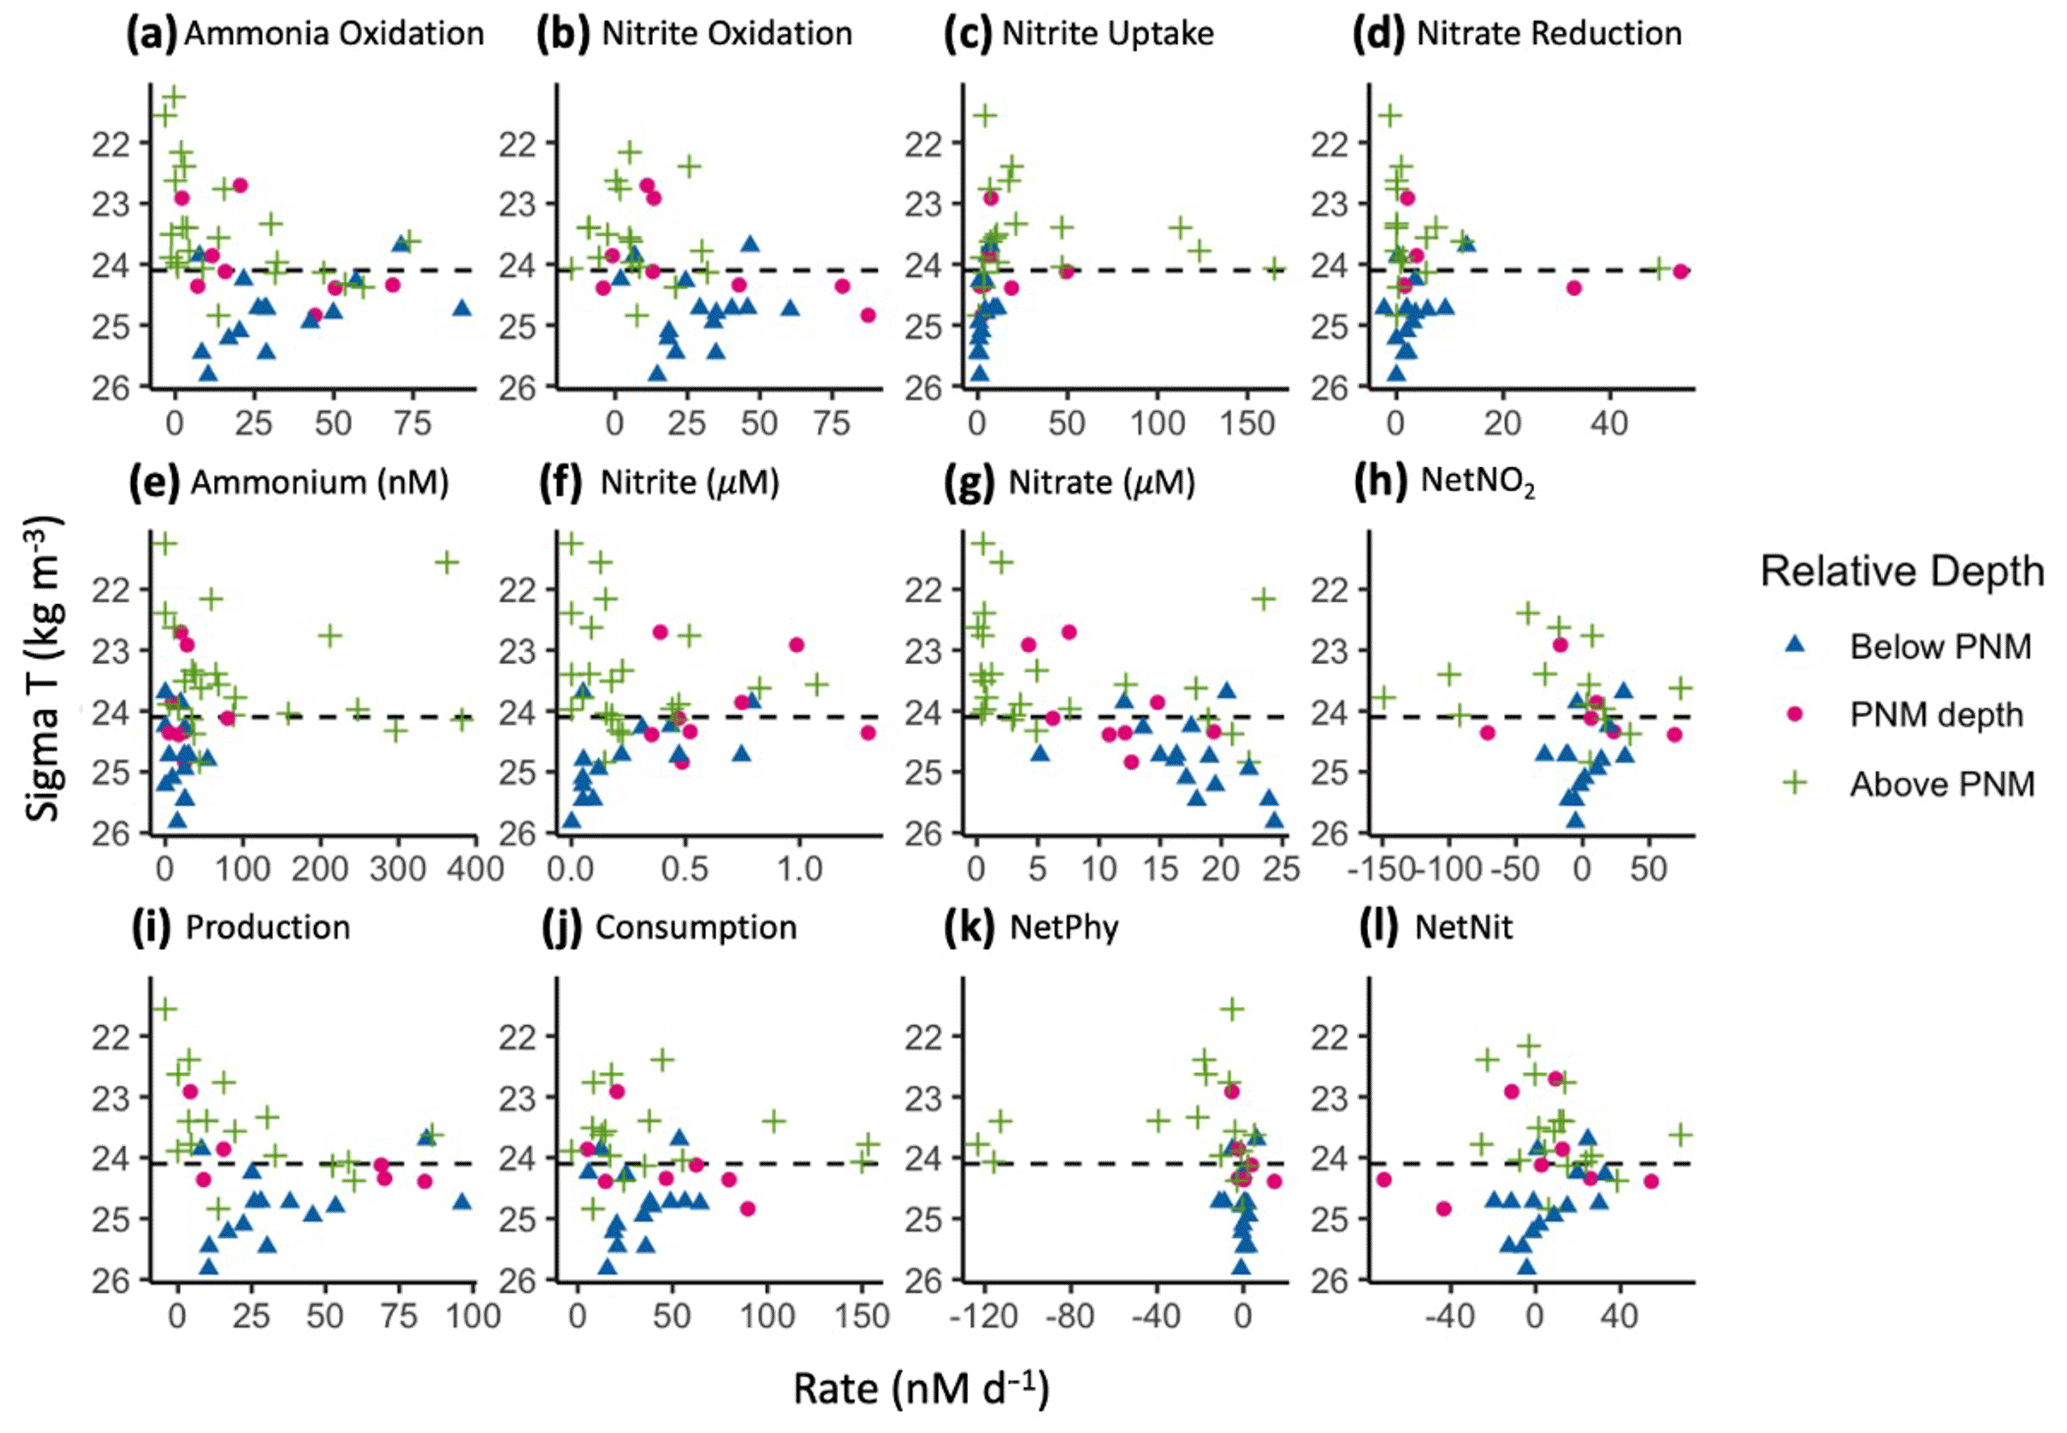
Figure 4Aggregated rate measurements from 2016–2018 with respect to density (ΣT, kg m−3): ammonia oxidation, nitrite oxidation, nitrite uptake and nitrate reduction (a–d, respectively) (nM d−1), ammonium (nM), nitrite and nitrate (µM), and net nitrite production (nM d−1) (e–h, respectively), and net production, net consumption, net nitrite production from phytoplankton and net nitrite production from nitrification (nM d−1) (i–l, respectively). Measurements are colored by relative depth to the station-specific depth of maximum nitrite: above the depth of maximum nitrite (green crosses), at the depth of maximum nitrite (magenta circles) or below the depth of the maximum nitrite (blue triangles). The mean isopycnal (24.1 kg m−3) for the ETNP nitrite maxima is marked as a horizontal dashed line.
When plotted in density space to aggregate data across years and stations, all processes showed rate maxima at a subsurface density layer (Fig. 4). Nitrifier processes (ammonia oxidation (Fig. 4a) and nitrite oxidation (Fig. 4b)) had maximal rates near, or just below, the average density layer for the nitrite maxima across this region (24.1 kg m−3). Nitrite uptake (Fig. 4c) and nitrate reduction (Fig. 4d) rates reached their maxima just above the mean nitrite maxima isopycnal. Nitrification rates were highest in the lower half of the nitracline, while phytoplankton-dominated processes (nitrite uptake and nitrate reduction) were highest on the upper slope of the nitracline where light was available and nitrite and ammonium concentrations were higher. While the highest activities of the two microbial groups were spatially segregated, within-group production and consumption processes had maxima at similar depths. All four rates formed vertically unimodal distributions, but there was still a large range in measured rates near the peaks with many rates close to zero.
Net nitrite production from nitrification (NetNit = ammonia oxidation – nitrite oxidation) ranged from −71.5 to 68.4 nM d−1 with a mean of 5.6 ± 3.6 nM d−1 (Fig. 4i). The majority of NetNit values were positive, and maximal rates were observed just below the mean nitrite maxima isopycnal. Negative NetNit values were driven by high nitrite oxidation values. Net nitrite production from phytoplankton-dominated processes (NetPhy = nitrate reduction − nitrite uptake) was typically low (mean nM d−1), with many negative values resulting from rates of nitrite uptake exceeding those of nitrate reduction (Fig. 4k). The largest negative values occurred above the mean nitrite maxima isopycnal, driven by high nitrite uptake rates where light concentrations were high and nitrate was low in the surface waters. Below the mean nitrite maxima isopycnal, NetPhy remained near zero because both nitrite uptake and nitrate reduction rates were low. The largest positive NetPhy value was at a coastal station (14.4 nM d−1), where nitrate reduction reached 33.1 nM d−1, but NetPhy was typically an order of magnitude smaller than NetNit.
The vertical distributions of total nitrite production (production = ammonia oxidation + nitrate reduction, Fig. 4i) and total nitrite consumption (consumption = nitrite oxidation and nitrite uptake, Fig. 4j) showed maximal rates near the mean nitrite maxima isopycnal (24.1 kg m−3). Total nitrite production peaked just below this, with a maximum value of 87 nM d−1. Total nitrite consumption peaked just above it, with a maximum value of 167 nM d−1. The higher consumption rates just above the mean nitrite maxima isopycnal were due to higher nitrite uptake rates, especially at coastal stations (Fig. 4c). There was a large range in rates of nitrite production and consumption processes, but mean values were of similar magnitude (26.4 and 39 nM d−1, respectively). Total net nitrite production (NetNO2, the difference between total production and total consumption) was highest near the PNM. Negative net nitrite production rates could be found both above and below the PNM, reflecting high nitrite uptake above the mean nitrite maxima isopycnal and high nitrite oxidation values below it (Fig. 4h). The mean of positive NetNO2 values was 16.7 nM d−1 (rates > −2 only, n=17), although mean NetNO2 was −6.3 nM d−1 when all data points were included. The maximum rate of NetNO2 was slightly higher than NetNit (73.5 vs. 68.4 nM d−1, respectively), but the peaks of the vertically unimodal distributions occurred at the same depths.
While the aggregated rates of NetNO2 peaked near the mean nitrite maxima isopycnal for the region, neither NetNO2 nor any individual rates were able to predict the observed nitrite concentrations. Simple linear regressions of each rate, or calculated net rates, against the quantity of nitrite did not show significance (Fig. S4). Limiting the regression to a single nitrite maximum and a single highest rate per station also did not show any linear correlation (Fig. S5). However, some qualitative patterns were noticeable, where the highest rates of phytoplankton-dominated processes occurred in samples with lower nitrite concentrations (shallower in the water column). The highest nitrite uptake rates (>25 nM d−1) appeared to co-occur with maximum nitrite concentrations below 500 nM. Conversely, when high nitrite concentrations were measured (>600 nM), nitrite uptake rates were low (never higher than 10 nM d−1). Nitrate reduction rates were also higher at lower nitrite concentrations. In addition, the highest ammonia oxidation rates (>40 nM d−1) were found where nitrite concentrations were <500 nM (Fig. S4). Interestingly, nitrite concentrations were highest (>600 nM) where ammonia oxidation rates were lower (<40 nM d−1). The highest nitrite concentrations were associated with waters having lower nitrite oxidation rates (<20 nM d−1), indicating a low rate of nitrite consumption. Thus, although nitrification was an important contributor to total nitrite production, the balance of processes was more important than the rate of any single process.
If we assume approximate steady state for PNM nitrite concentrations, rate measurements can be used to calculate a potential residence time for nitrite across the PNM feature. Using total nitrite production and nitrite concentrations, the mean residence time was 30.4 d, while the median residence time was 7.8 d. However, there was a wide range in residence times across all samples, particularly those from above the average nitrite maxima isopycnal for the region (Fig. S6a). Using total consumption rates in the calculation gave a slightly lower mean residence time for the region (20.3 d) but again had a large range in residence times above the mean nitrite maximum isopycnal (0.01–103.2 d) (Fig. S6c). Our estimates of average residence time using potential rates may be underestimated because of rate enhancement from tracer additions, and we are also likely missing an input/output term from physical mixing, which could have a larger influence in dynamic coastal waters compared to offshore. Comparing coastal and offshore stations, the estimated residence times are quite different between regimes (mean residence times of 17 and 53 d, respectively, and median residence times of 5.8 and 18.2 d, respectively) suggesting that coastal nitrite accumulations are turning over more quickly even with the limitations and assumptions of these calculations. The discrepancy in residence times calculated using the influx and outflux terms for the nitrite pool suggests that the PNM feature was most likely not in steady state (as also suggested by the high variation in measured rates across the PNM and inability of rates to correlate with observed nitrite accumulation), with differences in the dynamics above and below the nitrite maxima. Additional methods of estimating nitrite age, such as using variation in natural abundance nitrite isotopes, may provide more insight (Buchwald and Casciotti, 2013).
3.5 Contribution from nitrification
In considering the metabolisms responsible for accumulation of nitrite at the PNM, it is important to consider the distribution and magnitude of nitrite production processes vertically through the water column as well as their relative contributions to total nitrite production. At our sites in the ETNP, ammonia oxidation contributed over 70 % of the total nitrite production through most of the water column (Fig. 5a). The stations where ammonia oxidation contributed less to total nitrite production were typically coastal stations with low ammonia oxidation rates (e.g., <2 nM d−1) or with high nitrate reduction rates (>20 nM d−1). These results support the idea that both ammonia oxidation and nitrate reduction can contribute to nitrite production but show that the dominant source was ammonia oxidation at most stations, particularly at the depth of the nitrite maximum and below. For nitrite consumption, nitrite oxidation contributed greater than 70 % of total nitrite consumption below the mean density layer of the nitrite maxima. Above this density layer, the contribution to total nitrite consumption from nitrite oxidation became more variable, but with most values below 70 % due to more nitrite uptake. Particularly low contributions to total nitrite consumption from nitrite oxidation were seen above the depth of the nitrite maxima at coastal stations where nitrite uptake rates were highest. Potential decoupling of ammonia and nitrite oxidation could be seen in the upper water column, with NetNit peaking at the depth of the nitrite maxima (Fig. 4l), which is more difficult to discern in the individual ammonia oxidation and nitrite oxidation rates (Fig. 4a, b).
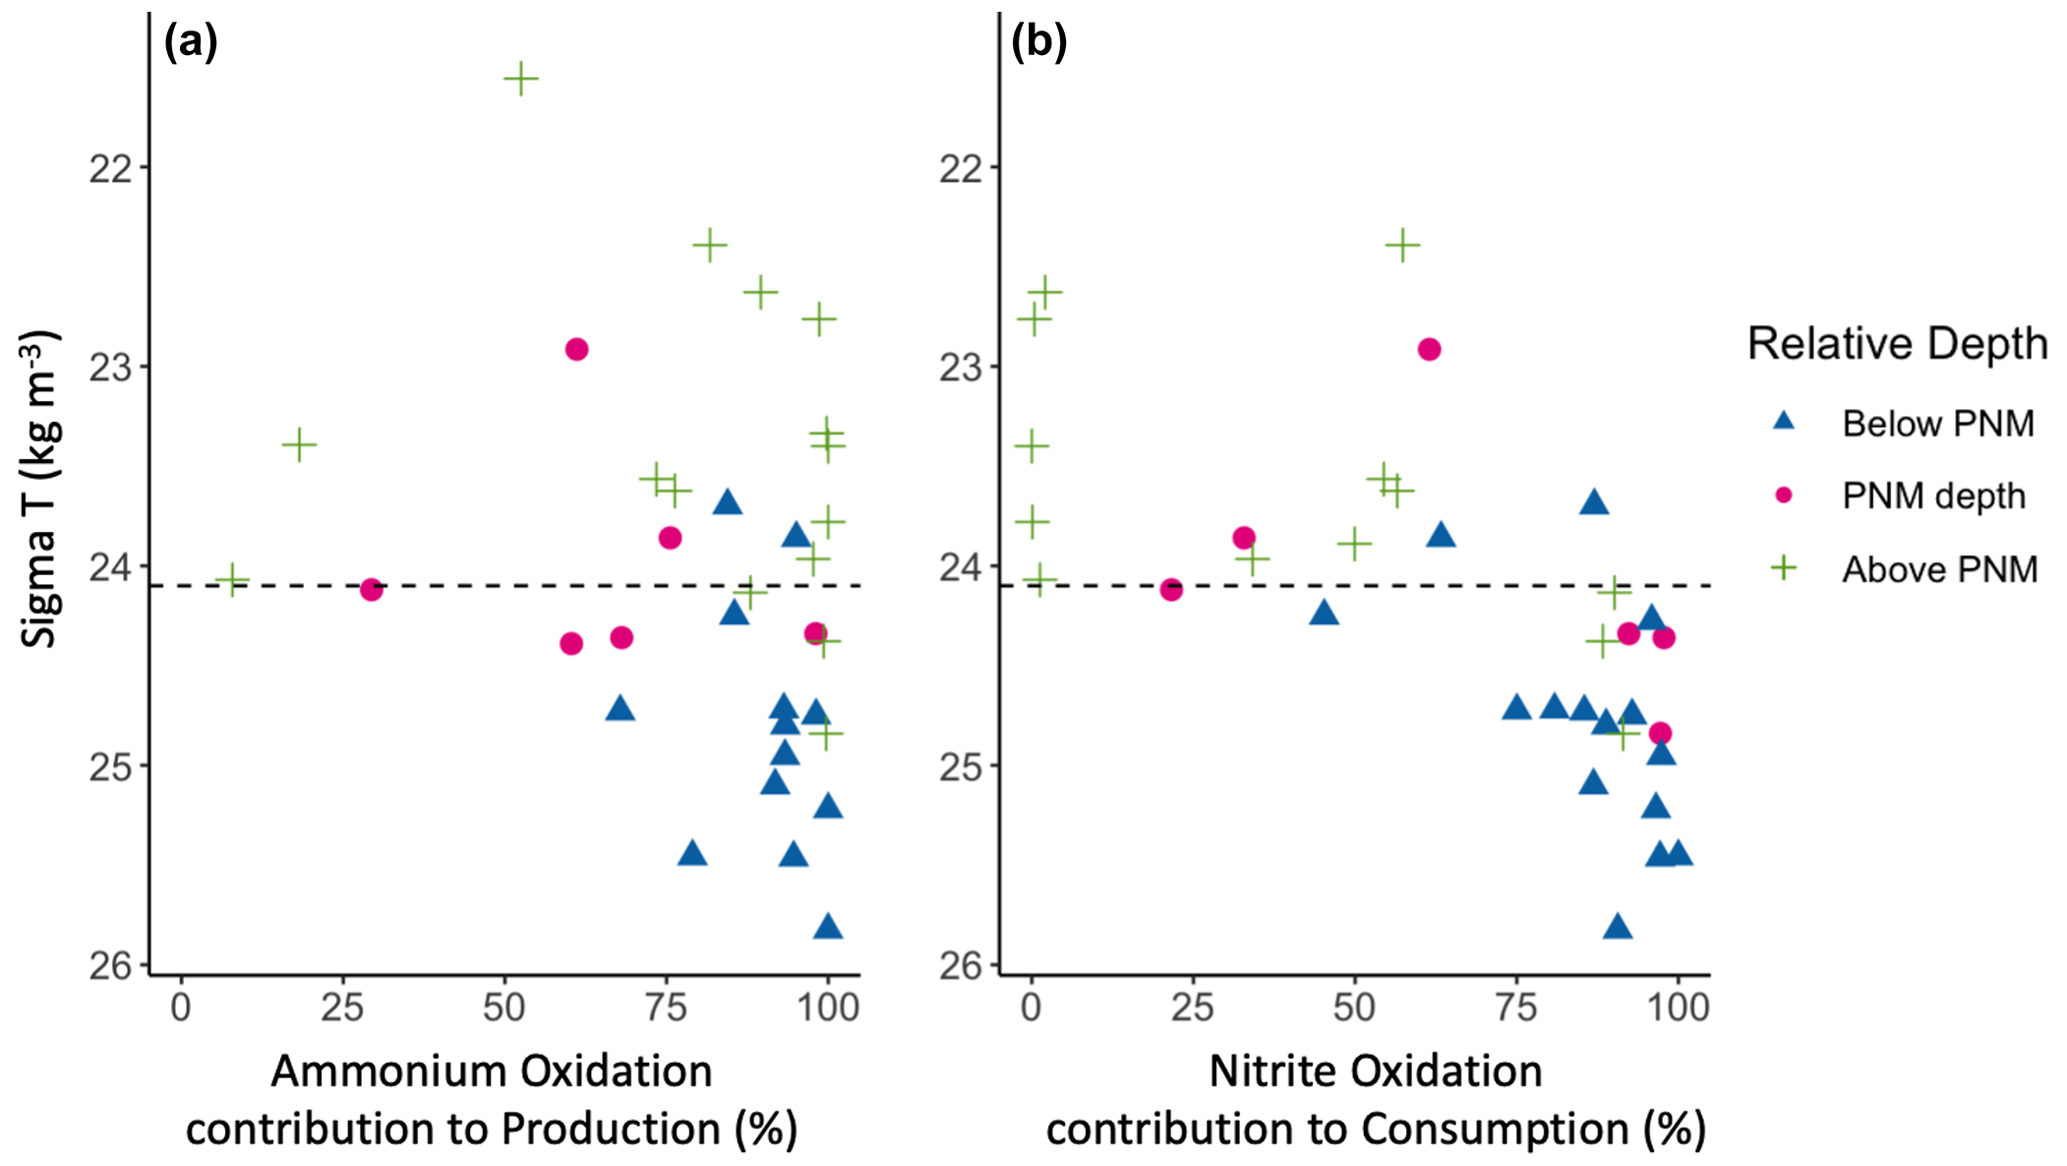
Figure 5Contributions of nitrification to total nitrite production (a) and total nitrite consumption (b) across density space. Measurements are colored by depth relative to the station-specific depth of maximum nitrite; above the depth of maximum nitrite (green crosses), at the depth of maximum nitrite (magenta circles) or below the depth of maximum nitrite (blue triangles). The mean ETNP nitrite maxima isopycnal (24.1 kg m−3) is marked as a horizontal dashed line.
3.6 Multiple linear regression analyses
3.6.1 “Full” model PNM predictions
Multiple linear regression analyses using all available variables (i.e., the “full” model) were able to predict the presence of a PNM at most stations when trained using all stations, the coastal station subset or the offshore station subset (Fig. S3). However, variables selected during optimization and the coefficients determined were not consistent across the three full models, and depth and size accuracy of nitrite predictions were highly variable (Tables S3, S4).
The all-station “full” model predicted the depth of the maximum nitrite well (mean depth error = 3.7 m) but underpredicted the concentration of the nitrite maxima by an average of 230 nM across all stations (after the extreme over-prediction of 15 µM at Station 8 was omitted) (Fig. S3, Table S4). Retraining the model using a subset of coastal stations improved fit for the training subset of stations (mean depth error 2.9 m) but was no longer applicable across other stations in the region (Fig. S3). When applied to non-coastal stations, the coastal “full” model overpredicted () the concentration of the nitrite maxima (except Stations 10, 11, 12), with an average overprediction for the whole region of ∼ 1.13 µM (Table S4). Similar results were found when the model retrained using the offshore subset of station. The offshore “full” model predicted the depth of maximum nitrite well for offshore stations, with a mean underprediction in depth of only 0.3 m (Fig. S3, Table S4), and underpredicted the concentration of the nitrite maximum at offshore stations by only 53 nM on average. The mean overprediction of nitrite concentration by the offshore “full” model applied across all stations was 855 µM, driven by an extreme overprediction at Station 8, which when excluded makes the mean size error only 1.23 µM.
This set of “full” variable models showed that there is enough information in the environmental data to make correlative predictions of nitrite profiles but also showed regional variability precludes a single model for the region. Additionally, investigating model variables and coefficients to gain insight on environmental controls of the PNM is difficult when different variables are used in each version of the model.
3.6.2 “Core” model PNM predictions
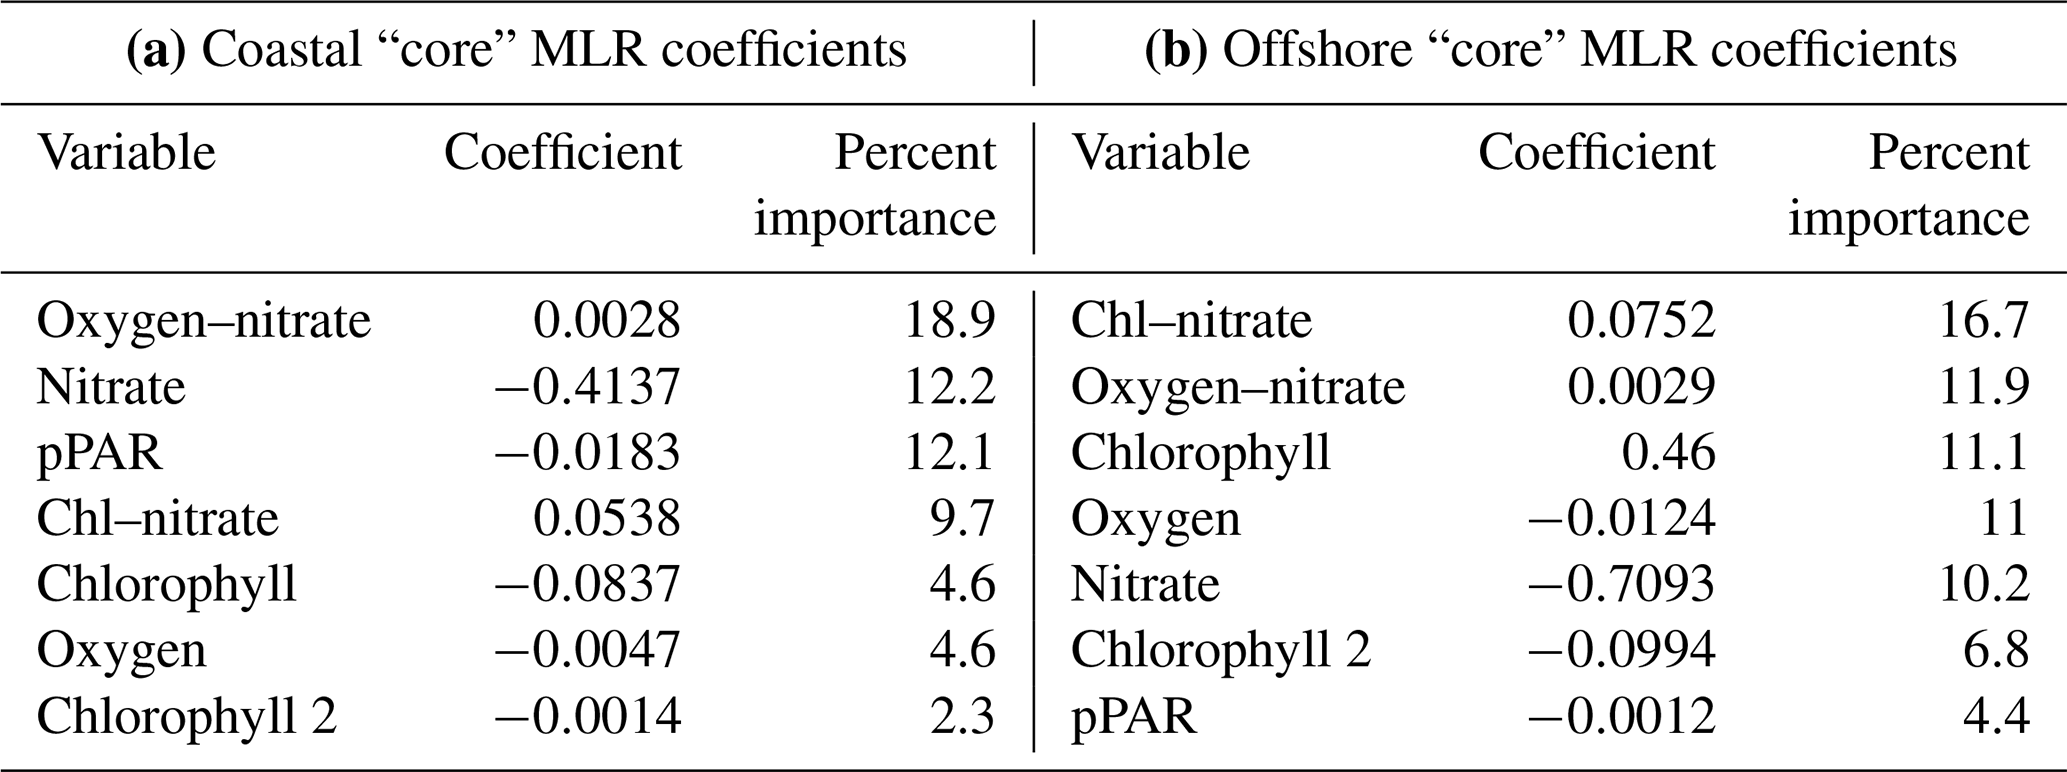
A subset of “core” variables was selected and applied in a second set of MLR analyses in order to directly compare the influence of each variable on nitrite concentration between two regions (coastal vs. offshore) (see Methods). The “core” models limited variables to those that had strong single linear regressions with depth and concentration of the nitrite maxima, and both the coastal and offshore models explained similar amounts of the total variance in nitrite concentration in their respective regions. Even though both models explained relatively similar amounts of variation in nitrite concentration and used the same limited suite of variables, different coefficients led to differing predicted nitrite profiles across stations (Fig. 6, Table 3). In the coastal region, the primary model components included nitrate and light, two environmental variables that are related to initiation of bloom conditions. The offshore model shifted importance slightly towards a stronger chlorophyll component and reduced the importance of light. In both regional models, nitrate was involved in explaining the most variance (40.8 % in the coastal model, 38.8 % in the offshore model).
Table 3Coefficients and relative importance from core models: coastal (a) and offshore (b).
In general, the coastal “core” model predicted the depth of the PNM well but was less accurate in predicting maximum nitrite concentration and peak shape (Fig. 6). The coastal “core” model underpredicted the depth of the nitrite maxima at coastal stations (−1.7 m) and underpredicted coastal nitrite maxima by an average of 208 nM, with a large range in error (−830 to +811 nM) (Table S5). Applying the coastal model to the full set of 16 stations showed that the coastal “core” model could either overpredict or underpredict the concentration of the nitrite maxima at non-coastal stations, in addition to predicting a wide PNM shape that extends deeper in the water column than observed (Fig. 6). The predicted depths of the nitrite maxima from the coastal model fit well with the depths of the observed nitrite maxima, with a mean depth overprediction of only 2.3 m; a single large outlier at Station 1 was observed, where PNM depth was overpredicted by 23.4 m (Fig. 6, Table S5).
The offshore “core” model also predicted the depth of the nitrite maxima well but less accurately predicted the concentration of the nitrite maxima (Fig. 6). The depths of the nitrite maxima at offshore stations were predicted to within 2.8 m, but concentrations of the nitrite maxima were underpredicted by 82 nM at offshore stations. Applying the offshore core model across all 16 stations was worse on average, giving predicted depths of maximum nitrite that were on average 5.5 m deeper than the observed depth, with a range in over- and underpredictions from 18.6 to 5.5 m respectively. The predicted concentrations of nitrite maxima were lower than observations by an average of 218 nM across the region (Table S5).
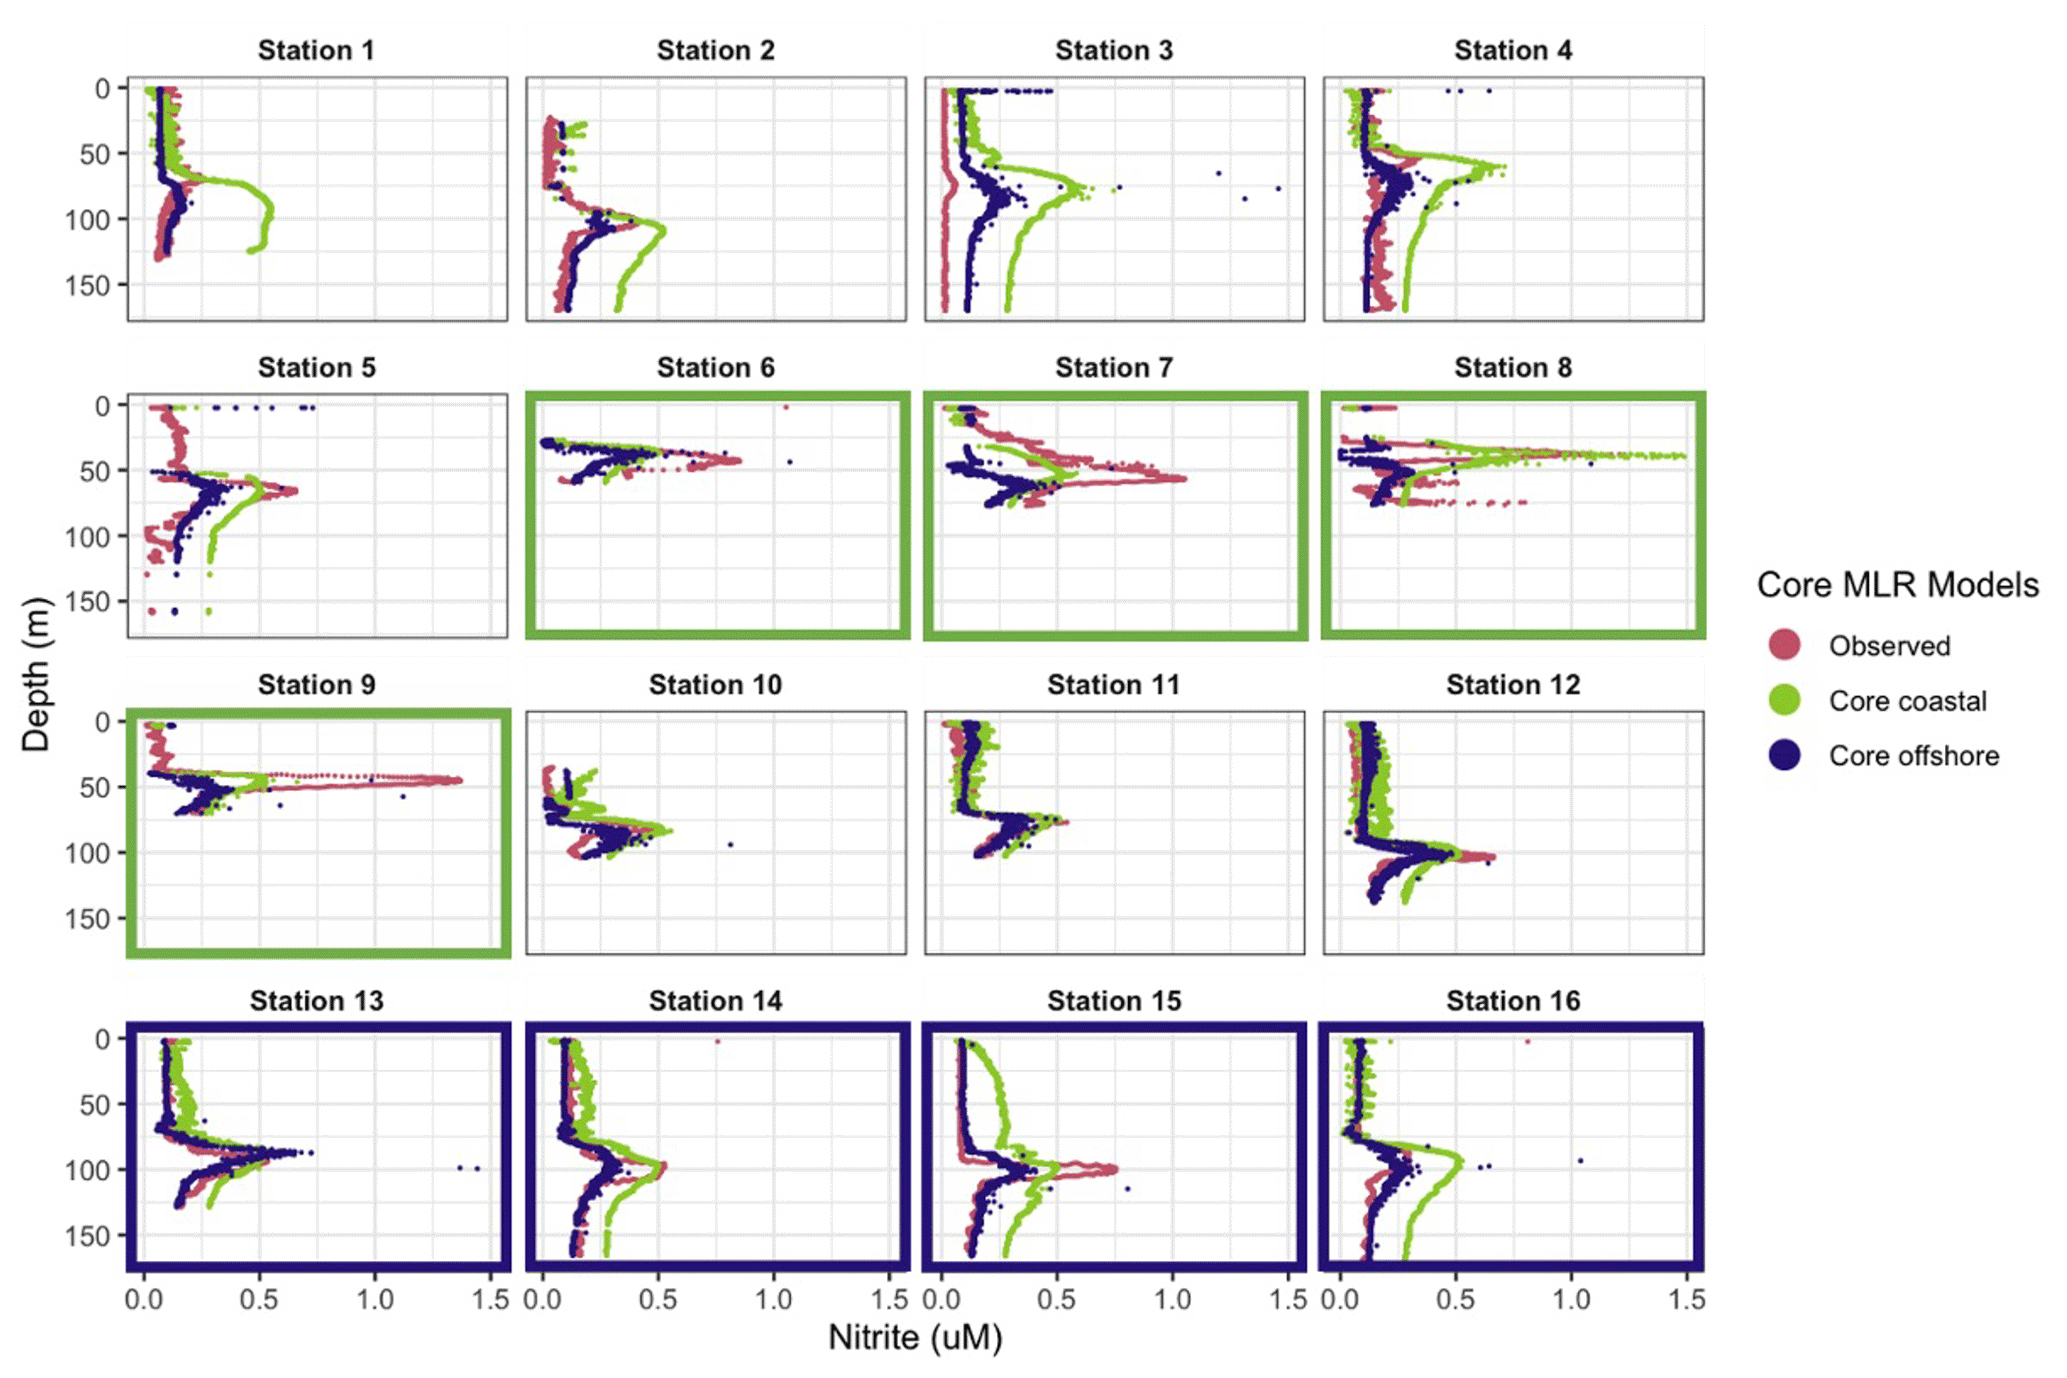
Figure 6Predicted nitrite profiles from “core” coastal MLR (green) and offshore MLR (blue). Observed nitrite profiles from PPS 2016 dataset (magenta). Panels of stations used to train the coastal model are traced in green, and panels for stations used to train the offshore model are traced in blue.
4.1 Vertical structure of nitrite accumulation
The same vertical sequence of water column features was seen at all ETNP stations, with the chlorophyll maximum lying above the ammonium maximum lying above the depth of the nitrite maximum at the top of the nitracline. These consistent spatial relationships between water column features suggest that there is a specific set of environmental conditions and biological agents that lead to the accumulation of nitrite. Linear regressions between depth of the nitrite maxima and the depth of other key water column features indeed showed strong correlations. Previous work has noted the connection of the depth of the nitrite maximum with the nitracline (Dore and Karl, 1996; Herbland and Voituriez, 1979; Lomas and Lipschultz, 2006; Meeder et al., 2012; Shiozaki et al., 2016; Vaccaro and Ryther, 1960) and with the chlorophyll maximum (Collos, 1998; French et al., 1983; Kiefer et al., 1976; Meeder et al., 2012), showing that these relationships are shared across multiple oceanic regimes. The environmental feature that correlated most strongly with the depth of the nitrite maximum in our dataset was the top of the nitracline, while the depth of the chlorophyll maximum, the depth of the ammonium maximum, the depth of 1 % PAR and the top of the oxycline also showed strong correlations, as illustrated by regression analysis (Fig. 3).
The strong covariance between multiple features provides some insight into the mechanisms that link the depth of the nitrite maximum to the environment. Nitrite-cycling microbes respond to the differences in environmental conditions above and below the PNM. In oligotrophic waters, such as those in the offshore ETNP, uptake of nutrients by phytoplankton maintains low levels of DIN in the upper euphotic zone as physical resupply is low. As light decreases with depth in the water column, active phytoplankton growth is diminished and ammonium and labile dissolved organic nitrogen are released due to grazing and decomposition, providing the low-light conditions, ammonium and reduced organic N substrates suitable for ammonia oxidation. Nitrite oxidizers utilize nitrite produced predominantly from ammonia oxidation to return nitrate to the system. Above the PNM, where light is available, there is enhanced potential for nitrite uptake by phytoplankton and nitrite does not accumulate. Below the PNM, there is a diminished supply of ammonium and nitrite oxidizers continue to consume low levels of nitrite produced through ammonia oxidation. At the depth of the nitrite maximum, production terms outweigh both spatially segregated loss terms – nitrite uptake and nitrite oxidation.
The production of nitrite at the PNM is linked to the vertical structuring of the upper water column qualities and is both directly and indirectly dependent on phytoplankton activity. It is directly related via the potential for phytoplankton to release nitrite under varying nitrate supply and light conditions and indirectly through ammonium supply provided to the ammonia-oxidizing community. Interestingly, the sequence of events that structures the nitracline at the base of the euphotic zone (nitrate and light availability → uptake of nitrate and phytoplankton growth → formation of the nitracline and oxycline = release of ammonium (and nitrite) → oxidation of ammonium by nitrifiers) is ordered similarly to the strength of the linear relationships with the depth of maximum nitrite (top of nitracline > %PAR > chlorophyll/oxycline > ammonium peak depth). The physical processes that change light and mixing environments initiate the conditions under which phytoplankton and nitrifiers establish their contributions to the PNM over time. The importance of the time component may help explain why there is variation in the strength of correlation between instantaneous environmental measurements and a PNM structure that may require weeks to form. Under more dynamic conditions (e.g., coastal upwelling), our observations are more likely to capture a larger range in scenarios, from initial upwelling to cessation of upwelling, making correlations between the depth of maximum nitrite and other water column features weaker.
4.2 Concentration of the nitrite maximum
While the depth of maximum nitrite is predictable based on features of the water column, the concentration of the nitrite maximum was more challenging to predict. In regressions of water column features against the concentration of the nitrite maximum, only the amount of nitrate at the nitrite maximum, the Brunt–Väisälä frequency and the amount of oxygen at the nitrite maximum had moderate linear relationships (R2=0.5, p<0.01, R2=0.4, p=0.016, R2=0.29, p=0.019), while the R2 values for the other regressions were smaller (R2<0.25) (Fig. 2). The connection between the nitrite maximum and nitrate concentration may reflect the sequence of events that structures the water column and forms the nitracline (described above). The presence of increased amounts of nitrate at the depth of larger nitrite maxima suggests that the phytoplankton have yet to deplete nitrate completely, and a large nitrite maximum is developing during active nitrate uptake at early bloom formation (Collos, 1982a; Meeder et al., 2012). At stations with a large nitrite maximum, there are also higher concentrations of nitrate at the chlorophyll maximum, although the chlorophyll maximum may still be small (i.e., early bloom). During this time, ammonium production from degrading and grazed phytoplankton as well as ammonia oxidation to nitrite may co-occur. Under these early bloom conditions there is potential to accumulate more nitrite due to increased rates of phytoplankton nitrate reduction, high rates of ammonia oxidation and/or decrease in loss terms. Controls on nitrate reduction rate and the potential for ammonium competition interactions between phytoplankton and ammonia oxidizers at nitrate replete depths will be discussed in relation to nitrite cycling rates.
The linear correlation between the larger nitrite maxima and stronger density gradients (higher Brunt–Väisälä values) suggests that decreased loss of nitrite via mixing could contribute to larger accumulation of nitrite at the maximum. However, degradation of the nitrite maximum by mixing would only move existing nitrite away from the peak depth, not remove it entirely from the water column.
We took two further approaches to understand the correlative disconnect between environmental conditions and nitrite maxima: (1) polynomial multiple regression analyses which allow multiple variables to co-explain the depth and concentration of the nitrite maxima and (2) making direct measurements of the microbial processes that mechanistically link environmental conditions to the nitrogen transformation rates leading to nitrite accumulation.
4.3 Predicting nitrite profiles from environmental dataset
The lack of strong linear correlations between maximum nitrite concentrations and any single feature may indicate that multiple conditions need to be met to produce large accumulations of nitrite. For example, earlier work has shown the largest seasonal nitrite maxima occur at the onset of the deep chlorophyll maximum, where multiple conditions are met – light is available and nitrate concentrations are still high (Mackey et al., 2011; Meeder et al., 2012).
Allowing for multiple environmental conditions to contribute, the “full” multilinear regression models are qualitatively able to capture the peak shape of the PNM feature using the variables provided, yet they are unable to fully explain nitrite concentration (Fig. S3). For example, the all-station “full” model explained 66 % of the overall variance in nitrite concentration, but the mean error in nitrite maximum predictions was 740 nM with a large range in errors across stations (−0.84 to 15.28 µM) (Table S4). This large uncertainty is not surprising, since environmental conditions vary across the ETNP, especially between coastal and offshore stations. The coastal and offshore nitrite maxima were typically found at similar densities (∼ 24.1 kg m−3), but at coastal stations the average depth of the nitrite maxima was 46 m shallower, the average nitrate concentration was 3 times higher, the average chlorophyll concentration was 3 times higher, average light was 3 times higher, oxygen was 25 % higher and ammonium concentrations were also higher (Table S1b). This suggests that the nitrite maxima at coastal and offshore type stations may be innately different, and possibly controlled by a different balance of mechanisms. The two “full” models built using coastal and offshore subsets were able to explain more of the total variance at those stations (R2=0.77 and 0.79, respectively).
The “core” models, where the variables included in the models were consistent between the coastal and offshore regimes, were also able to explain a significant portion of the variability in nitrite (R2 was 0.83 and 0.98, respectively). Nitrate was a key parameter in both models (Table 3). The smaller chlorophyll coefficients used to model nitrite maxima at coastal stations make the model less sensitive to large changes in chlorophyll, while the larger offshore coefficient suggests that small changes in chlorophyll offshore have more influence over the resulting nitrite predictions. While there was still significant error in the predicted depth and concentration of the nitrite maxima, the “core” model coefficients show patterns suggesting that nitrite accumulation occurs at depths where chlorophyll, nitrate and oxygen co-exist, corroborating the findings from the linear regression analyses that the depth of the chlorophyll maxima, nitracline top and oxycline top are individually important in determining the depth of the nitrite maximum (see Supplement for further comparison of coefficients).
Overall, while the nitrite accumulation in the PNM was predicted moderately well using the environmental conditions, especially when differentiating between coastal and offshore regimes, the environmental parameters alone were not able to fully predict nitrite concentrations. Variable physiological responses of the microbial populations involved with nitrite production and consumption provide a mechanism that integrates multiple environmental parameters into an observable nitrite accumulation.
4.4 Rates of nitrite cycling
Strong single variable correlations with depth of the nitrite maxima and mild correlations with concentration of nitrite at the nitrite maxima (with supportive findings from the MLR analyses) suggest that while the PNM feature is consistently linked to specific depths, the maximum concentration of nitrite in a given PNM may be modulated by more nuanced environmental timings and microbial physiologies. The two main biological mechanistic explanations for nitrite production at the PNM involve the microbial physiology of phytoplankton and nitrifying bacteria and archaea. The overlapping habitats and competition for DIN resources require that we consider both microbial groups in our understanding of PNM formation (Lomas and Lipschultz, 2006; Mackey et al., 2011; Smith et al., 2014; Wan et al., 2021, 2018; Zakem et al., 2018). This dataset provides insights into the relative roles of these processes via direct rate measurements of the four major nitrite cycling processes from the same source water. This allows both comparison of relative rates of each process within a community and the calculation of net rates of nitrite production around the PNM feature. Our expectation at the beginning of this study was that higher rates of nitrite production, or net nitrite production, would correspond to larger accumulations of nitrite. Our findings, however, revealed a more complex pattern where the instantaneous rates of gross or net nitrite production did not reflect the amount of accumulated nitrite. In other words, the imbalance in nitrite production and consumption can indicate whether nitrite concentrations are currently increasing or decreasing, but it provides less predictive power for the concentration of accumulated nitrite. Some of the discrepancy between rates and observed nitrite accumulation may also be attributable to potential enhancement of rates from tracer addition or nitrite production from other sources not captured in our tracer experiments.
The spatial distribution of measured rates through the water column showed peaks in each process near the PNM, but with slight variation in where the rate maxima fell relative to the nitrite maxima. The highest phytoplankton activity was located just above the PNM peak, while nitrification rates were highest near the PNM peak, a distribution seen in other nearby systems (Beman et al., 2012; Santoro et al., 2013). Although the aggregated data from the region showed these spatial segregations by microbial group, this was not always observed at an individual station. The highest rates of nitrification appear to be slightly skewed towards the lower slope of the PNM, but the depth of the nitrite maximum at many stations was determined from discrete measurements taken at ∼ 10 m resolution, so it is possible that the real maxima occurred between sampled depths. The PPS data allowed much more precise determination of the depth and peak size, although rate measurements were still limited to lower-resolution sampling.
The vertical distribution of nitrification has been theorized to be controlled by light inhibition, restricting nitrification to depths at the base of the euphotic zone (Olson, 1981). However, active nitrification has been observed in the sunlit surface ocean (Shiozaki et al., 2016; Ward, 2005; Ward et al., 1989), leading to new theories suggesting that ammonia oxidation is controlled by ammonium or nitrate availability shifting the competitive balance for ammonium acquisition away from phytoplankton and towards ammonia oxidizers (Smith et al., 2014; Wan et al., 2018; Xu et al., 2019). In this dataset, we did measure nitrification rates >2 nM d−1 at light levels of 25 %–30 % surface PAR at coastal stations, although there was a clear enhancement of nitrification rates at light levels below 5 % surface PAR. Although linear regressions of ammonia oxidation rate did not show a strong correlation with the nitrite maximum or the depth of maximum nitrite, there was a relationship between ammonia oxidation and both nitrate and light (Fig. 7). Similar to the data compiled in Wan et al. (2018), the highest ammonia oxidation rates were restricted to depths with higher nitrate concentrations and lower light levels. However, even when constraining the ammonia oxidation rate data to where there is both low-light and higher nitrate concentrations, measurements spanned the entire range of rates from 0–85 nM d−1, indicating that the conditions controlling the depth of the rate maxima do not guarantee high rates but simply facilitate the possibility of high rates. It should be noted that some of the highest rates were measured in source water with low ambient DIN concentrations, and it is possible that tracer addition relieved DIN limitation in some of these samples and enhanced the measured rates (Fig. S7). However, as these are bulk rates (per volume), we cannot differentiate between potential enhancement of rates due to our tracer addition versus different microbial abundances.
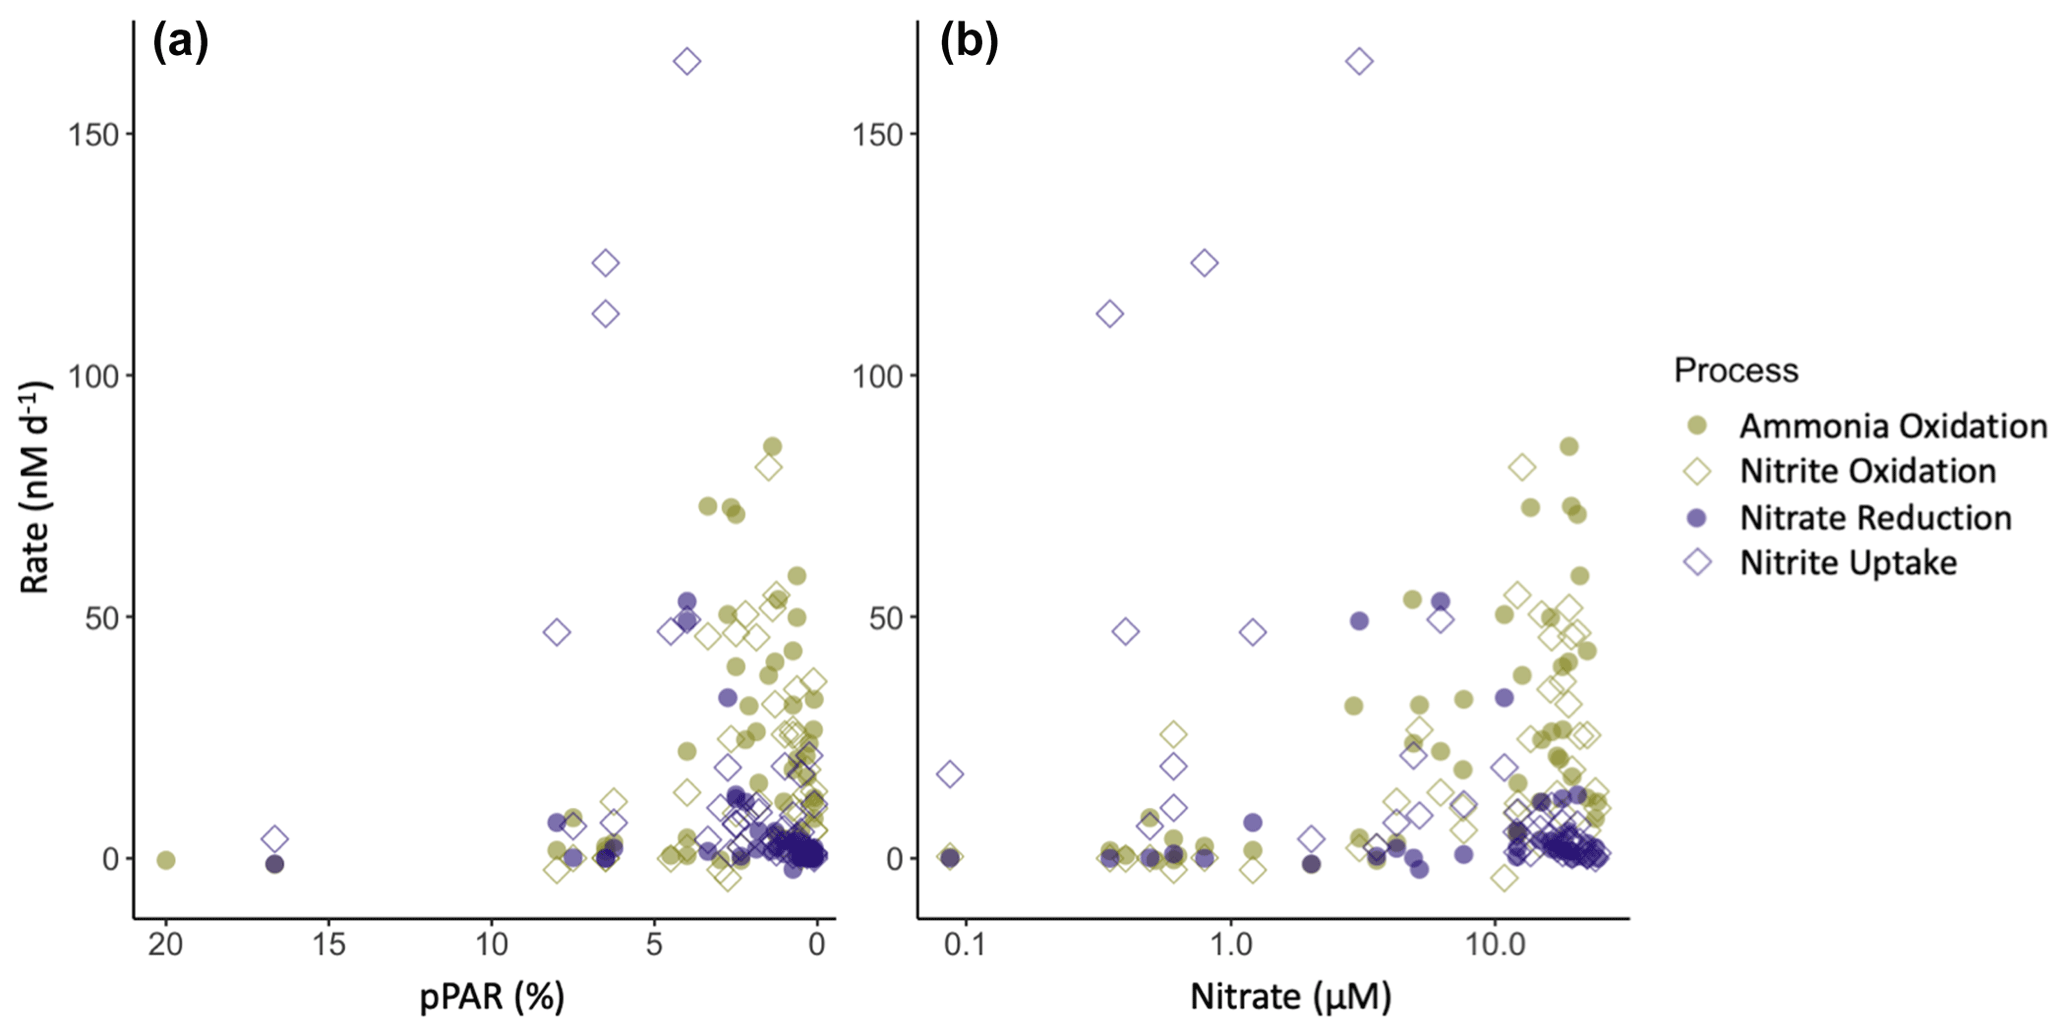
Figure 7Relationship between nitrite cycling rates and percent surface PAR (a) and nitrate concentration (b). Phytoplankton-dominated processes are shown in purple, and nitrifier processes are shown in green. Nitrite production processes are shown as filled circles, and nitrite consumption processes are open diamonds.
The individual rate measurements were not correlated with the amount of nitrite accumulated in the water column at a given depth (Fig. S4). Nor were the net rates (NetNit, NetPhy, NetNO2) able to explain observed nitrite concentrations. Although the vertical pattern in net nitrite production rates (NetNO2) showed a peak shape that was qualitatively similar to nitrite concentration, there was no linear relationship between NetNO2 and nitrite concentration (Figs. 4h, S4), suggesting that instantaneous rate measurements do not always represent time-integrated nitrite accumulation in the PNM. Because our measurements were of whole community rates, a variety of microbial processes may have remained active in the incubations alongside the process intended to be traced with 15N. For example, the 15N–NO produced via nitrate reduction is potentially acted upon by nitrite uptake and nitrite oxidation. This has the potential of leading to underestimation of nitrate reduction rates, especially where nitrite concentrations are low, and nitrite uptake and nitrite oxidation rates are large.
Nitrification rates were similar in magnitude between coastal and offshore stations (Table S2c), with the major differences in rate measurements between coastal and offshore stations found in the phytoplankton-dominated processes (nitrate reduction and nitrite uptake). The highest rates of phytoplankton activity were found at coastal stations and occurred primarily above the depth of the PNM. The distribution of measured activity lends support to the hypothesis that phytoplankton may outcompete nitrifiers for DIN sources above the nitrite maximum (Wan et al., 2018; Zakem et al., 2018). This proposed mechanism accounts for the correlations seen between lower light levels and higher ammonia oxidation because the top of the nitracline itself is a physical demarcation of the depth where phytoplankton co-requirements for light and nitrate are met. Previous work has also shown that the presence of nitrate can inhibit nitrite uptake by phytoplankton through competitive interactions (Eppley and Coatsworth, 1968; Raimbault, 1986) (Fig. 7b). This mechanism may provide a way to connect the presence of nitrate with a larger PNM that relies on prevention of nitrite loss, rather than an increase in nitrite production.
An additional loss term that could influence the size of the observed nitrite peak is diffusion, moving nitrite away from the depth of maximal net nitrite production. In addition to having shallow nitraclines and shallow chlorophyll maximum depths, as well as larger chlorophyll maxima and nitrite maxima, coastal stations also had the steepest density gradients near the PNM, making Brunt–Väisälä (BV) frequency correlate with the nitrite maxima in this dataset (p=0.005) (Figs. S9, 2l). The strong density gradients at the coastal stations (stations 6, 7, 8, 9) would inhibit mixing, potentially allowing for larger concentrations of nitrite to accumulate for a given rate of net nitrite production. This lack of mixing loss at coastal stations could partially explain why ammonia oxidation rates can remain similar between coastal and offshore stations (25.8±3.6 vs. 21.3±3.3 nM d−1) yet result in higher accumulated nitrite at a coastal PNM. Modeling efforts that are able to integrate both physical diffusion of nitrite and mixing around the PNM, as well as the influence of environmental fluctuations on microbial rates over longer timescales, may be more able to explain observed nitrite concentrations. Additional data from time-integrated approaches such as natural abundance nitrite isotopes would also contribute to estimating nitrite age in the PNM.
4.5 Different timescales inherent to observational patterns
Environmental features may not accurately predict the concentration of the nitrite maximum because of a time lag between environmental conditions measured at a station, the response of the microbial community, and the length of time needed to produce a PNM. Previous work has shown that a seasonal PNM can develop over 6 d in the Gulf of Aqaba (Mackey et al., 2011). In our study, a large range in net production rates was observed (∼ 0–86.9 nM d−1), leading to the potential for a PNM to develop in less than a day at some locations or as long as months at other stations. The four southern coastal stations (used to inform the coastal MLR) had the largest nitrite maxima measured in this study (with nitrite concentrations reaching 800–1400 nM). However, it is reasonable to expect that in dynamic coastal waters, upwelling and offshore transport of water would lead to shorter water residence times and less time for nitrite to accumulate in the PNM. Indeed, local surface current data from early April 2016 show the fastest currents occurring along the southern coastline (Fig. S8). However, even given these current velocities, nitrite accumulation over the span of days to weeks seems possible. Thus, our nitrite residence time calculations, on the order of days to months, are consistent with the residence time of water in the coastal environment, and other estimates of PNM residence times (Fig. S6). For example, ammonia oxidation measurements from the California Current System suggested an 18–470 d residence time for offshore stations and 40 d residence time for a coastal station (see full table in Santoro et al., 2013).
4.6 Spatiotemporal controls on the nitrite maximum
Previous work investigating the onset of the PNM has shown that nitrite concentrations are highest at the beginning of seasonal stratification when phytoplankton begin to bloom, suggesting that phytoplankton help provide the necessary conditions for nitrite accumulation (Al-Qutob et al., 2002; Mackey et al., 2011; Meeder et al., 2012; Vaccaro and Ryther, 1960). In Mackey et al. (2011), the onset of stratification initiates a phytoplankton bloom that begins to deplete surface nitrate and releases ammonia via phytoplankton degradation and zooplankton grazing. An accumulation of ammonium forms just below the chlorophyll maximum, which is subsequently followed by an accumulation of nitrite just below the ammonium peak. This continued stratification pattern supports the persistence of the emergent PNM feature, though the size of the nitrite maximum declines over the duration of the stratification period. The correlation between coastal upwelling and higher nitrite accumulation in the ETNP PNM may be controlled by similar mechanisms such as the high nitrite accumulation at the onset of seasonal stratification in other regions. Instead of a strongly seasonal onset of stratification, the ETNP stratification persists year-round but is modulated by upwelling along the coast.
At coastal stations in 2016, we saw high average concentrations of nitrate (16 µM) at the depth of the PNM due to upwelling conditions, while average nitrate concentrations at offshore PNMs were lower (5.9 µM). The positive correlation of nitrate concentration at the PNM peak with the concentration of the nitrite maximum (R2=0.5, p=0.01) suggests that upwelling nitrate is critical for larger nitrite maxima. The correlation found in the MLR analysis between the chlorophyll–nitrate interaction term and the nitrite maxima supports the idea that higher nitrite accumulation requires the presence of higher levels of nitrate within the chlorophyll bloom (Anderson and Roels, 1981). High variation in the correlation of nitrite maxima with chlorophyll, ammonium and nitrate may be due to how recently the chlorophyll bloom was initiated and whether it has had time to draw down available nitrate. However, these patterns do not identify whether the presence of nitrate drives nitrite production from phytoplankton directly, or indirectly, by stimulating ammonia oxidation.
Sequential decomposition of particulate organic nitrogen (PON) produces ammonium, then nitrite, and nitrate over time, and matches the spatial ordering of these species with depth in the water column (Meeder et al., 2012). In a stratified water column, the vertical transport of material may be slow enough to allow for a similar temporal degradation pattern to emerge across the pycnocline. The sequence is initiated by the blooming of phytoplankton, which is restricted to surface depths with adequate light and nitrate. In a coastal upwelling regime, the stratified water column is pushed up towards the surface, and this degradation sequence is modified by enhanced source PON from larger chlorophyll blooms. Larger pools of chlorophyll lead to larger accumulations of ammonium and nitrite. Based on the magnitude of net nitrite production, nitrifiers appear to have a larger potential for net nitrite production at ETNP PNMs. The association of nitrification rates with increasing nitrate concentration, which is not a required substrate for nitrification, indicates an indirect connection with phytoplankton activity which is typically dependent on nitrate availability. We suggest that changes in light and nitrate availability initiate a cascade of microbial processes that lead from production to degradation of phytoplankton-based PON, providing a substrate for ammonia oxidation. Enhanced phytoplankton productivity in this scenario should lead to higher rates of nitrite production via ammonia oxidation.
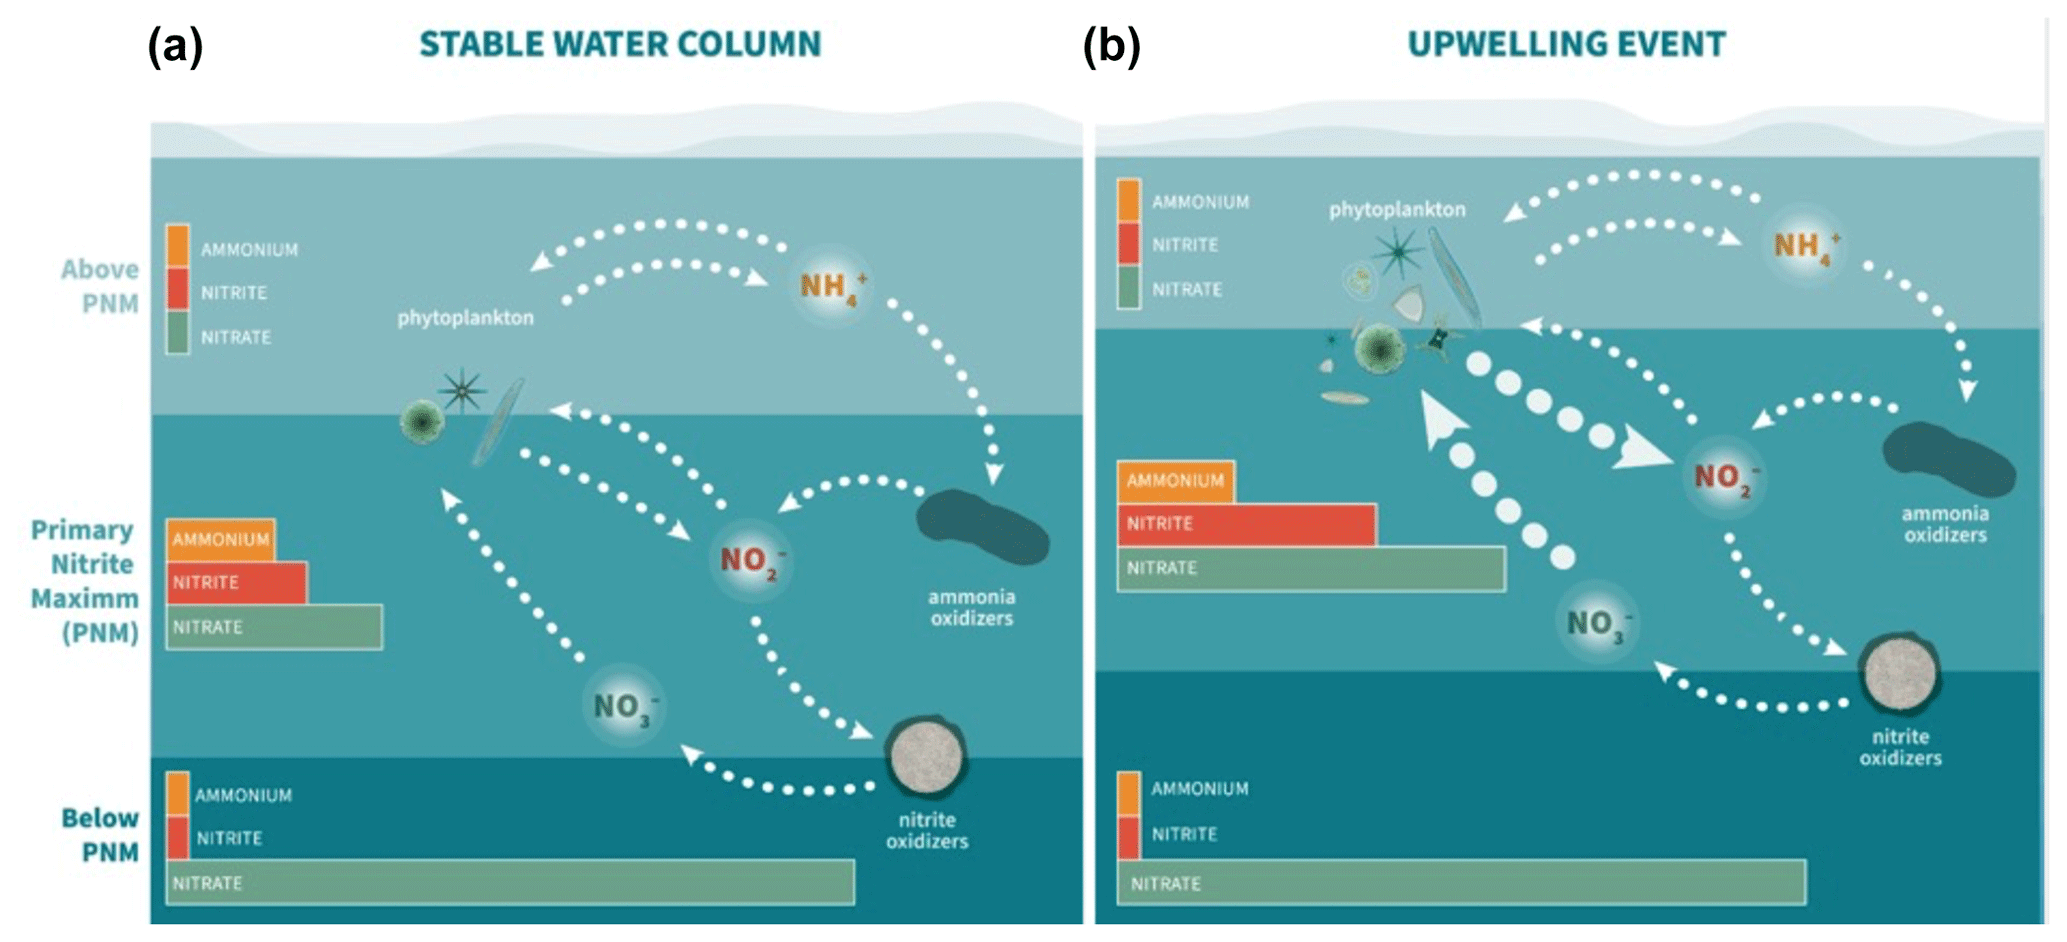
Figure 8Schematic of nitrite cycling processes and relative DIN pools near the PNM. Panel (a) depicts the offshore conditions, and panel (b) depicts early upwelling conditions that lead to bloom initiation and larger nitrite accumulations at the PNM.
Figure 8 places the findings in the current study in the context of the sequential physical and biological processes controlling the PNM feature in the ETNP. The schematic depicts a typical offshore PNM from our study region observed during stratified, stable water column conditions (Fig. 8a), in contrast to that observed during the onset of upwelling (Fig. 8b). In each case, the surface ocean is split into three layers: above, within and below the PNM, with the PNM sitting near the top of the nitracline. Phytoplankton control the availability and supply of DIN above the PNM, where high light allows for complete drawdown of DIN. In the stable water column (Fig. 8a), phytoplankton are present in a chlorophyll maximum that is small and stable just above the nitracline consisting of smaller eukaryotes and cyanobacteria (Legendre-Fixx, 2017). The chlorophyll maximum is small because there is no active upwelling, and the ambient nitrate at the chlorophyll maximum has been depleted to low concentrations. Phytoplankton fail to access deeper nitrogen supplies because light levels become inadequate at depth, so the chlorophyll maximum is balanced at the intersection of the dual requirements for light and upwardly diffused nitrate. A small ammonium peak develops just below the chlorophyll maximum, and just above the nitrite maximum, deriving from phytoplankton decomposition processes including grazer activity. The supply of ammonium is adequate to fuel an active nitrifier community in the PNM layer and below, with average rates of ammonia oxidation and nitrite oxidation near 20 nM d−1. The net imbalance in the two steps of nitrification is small (few nM d−1), contributing to the small yet stable accumulation of nitrite at the PNM. Contributions of nitrite from phytoplankton are minimal because they have drawn down surface nitrate and are subsisting at the edge of a well-established deep nitracline. Although the water column is stably stratified, the Brunt–Väisälä values are moderate.
During an upwelling event (Fig. 8b), an influx of nitrate-rich water into the euphotic zone initiates a phytoplankton bloom. We see evidence of early upwelling at coastal stations where nitrate concentrations at the chlorophyll maximum are not completely depleted (average 5.2 ± 3.6 µM), while nitrate at offshore station chlorophyll maxima is lower (average 0.6 ± 0.4 µM). With phytoplankton growth fueled by new nitrate, the ammonium concentration begins to increase via degradation and grazing, providing substrate for ammonia oxidizers. Rate measurements show a small increase in average ammonia oxidation rate at coastal stations compared to offshore stations (28±3.9 vs. 20.3±3.4 nM d−1, respectively). At some coastal stations, a more significant change in the concentration of the nitrite maximum may come from increased phytoplankton nitrite release. Previous work has documented up to ∼ 10 % of nitrate uptake can be released as nitrite in laboratory culture experiments, suggesting that locations with high nitrate uptake and active nitrate reduction have the potential for substantial nitrite release from phytoplankton (Collos, 1998). Additionally, the physical upwelling of deep water compresses density layers in the euphotic zone leading to higher Brunt–Väisälä frequencies and lower potential for nitrite diffusion away from the site of production, helping to explain larger nitrite maxima occurring at upwelling sites.
With nitrite production in the PNM predominantly linked to ammonia oxidation, this has potential implications for production of nitrous oxide in the upper water column of the ETNP. The ETNP is known to be an important source for atmospheric nitrous oxide (Babbin et al., 2020; Tian et al., 2020), with high accumulations of nitrous oxide in the near surface (Kelly et al., 2021; Monreal et al., 2022). Nitrous oxide production in the near-surface maximum has been linked to a combination of hybrid production from AOA, as well as bacterial denitrification (Kelly et al., 2021; Monreal et al., 2022; Trimmer et al., 2016). Thus, conditions that favor enhanced ammonia oxidation could also promote enhanced nitrous oxide production and emissions, thereby forming a link between stimulation of high primary productivity and high rates of nitrous oxide production and emission.
This study used both high-resolution environmental data and direct rate measurements of nitrite cycling processes to explore the factors contributing to PNM formation in ETNP. At our sites, there was a distinct and predictable depth where nitrite accumulated in a peak-shaped PNM feature. Linear regression and multivariate regression analysis with environmental data showed that the top of the nitracline and the top of the oxycline are two major indicators of the depth of the nitrite maximum. Rate measurements also showed distinct peaks in activity that corresponded well with the mean PNM isopycnal for the region. Ammonia oxidation was the dominant nitrite production process at most depths and stations, and nitrifier processes dominated nitrite cycling at and below the PNM. Phytoplankton processes were typically restricted to depths above the PNM, and we report only a handful of high nitrate reduction rates (>20 nM d−1) from coastal stations with higher chlorophyll and nitrate concentrations at the PNM. However, even where nitrite production from phytoplankton remains low, we suggest a sequential and competitive dependence of ammonia oxidation rates on phytoplankton processes. The importance of co-occurring environmental conditions and timing of microbial interactions should be considered in further work on what factors determine the formation of large nitrite maxima. For example, both nitrate and light availability may work together to control net nitrite production through sequential processes beginning with upwelling events. Microbial physiological responses remain important in connecting rates of activity to dynamic environmental conditions.
The multiple linear regression model analyses were based on best subset selection using the leaps package in R (Lumley, 2020). Specific code as applied to the 2016 ETNP dataset is available on the Stanford Digital Repository (https://doi.org/10.25740/bf589mh2984).
Cruise data from RB1603 can be accessed on bco-dmo (https://www.bco-dmo.org/ project/472492, last access: 1 December 2017, Mulholland and Jayakumar, 2017), and corresponding pump profiler data can be accessed on the Stanford Digital Repository (https://doi.org/10.25740/gd152nx8149, Travis et al., 2023).
The supplement related to this article is available online at: https://doi.org/10.5194/bg-20-325-2023-supplement.
Major data collection efforts, data processing/analysis and writing were conducted by NMT. Significant support during data collection was provided by CLK and MRM, with additional contributions during manuscript editing. KLC was instrumental in initial project design, laboratory analysis, data investigations and manuscript writing.
The contact author has declared that none of the authors has any competing interests.
Publisher’s note: Copernicus Publications remains neutral with regard to jurisdictional claims in published maps and institutional affiliations.
The authors acknowledge the captain and crew of the research vessels required to collect this dataset: R/V Ronald Brown, R/V Sikuliaq, R/V Sally Ride and R/V Falkor. We also acknowledge shipboard support from Marguerite Blum and Matt Forbes. Graphic design in Fig. 8 was done by Kate Matney.
This research was supported by U.S.-NSF grant OCE1657868 to Karen L. Casciotti.
This paper was edited by Carol Robinson and reviewed by Xianhui Sean Wan and one anonymous referee.
Al-Qutob, M., Häse, C., Tilzer, M. M., and Lazar, B.: Phytoplankton drives nitrite dynamics in the Gulf of Aqaba, Red Sea, Mar. Ecol.-Prog. Ser., 239, 233–239, https://doi.org/10.3354/meps239233, 2002.
Anderson, S. and Roels, O.: Effects of light intensity on nitrate and nitrite uptake and excretion by Chaetoceros curvisetus, Mar. Biol., 62, 257–261, https://doi.org/10.1007/BF00397692, 1981.
Babbin, A. R., Boles, E. L., Mühle, J., and Weiss, R. F.: On the natural spatio-temporal heterogeneity of South Pacific nitrous oxide, Nat. Commun., 11, 1–9, https://doi.org/10.1038/s41467-020-17509-6, 2020.
Beman, J. M., Popp, B. N., and Francis, C. A.: Molecular and biogeochemical evidence for ammonia oxidation by marine Crenarchaeota in the Gulf of California, ISME J., 2, 429–441, https://doi.org/10.1038/ismej.2007.118, 2008.
Beman, J. M., Popp, B. N., and Alford, S. E.: Quantification of ammonia oxidation rates and ammonia-oxidizing archaea and bacteria at high resolution in the Gulf of California and eastern tropical North Pacific Ocean, Limnol. Oceanogr., 57, 711–726, https://doi.org/10.4319/lo.2012.57.3.0711, 2012.
Beman, J. M., Shih, J. L., and Popp, B. N.: Nitrite oxidation in the upper water column and oxygen minimum zone of the eastern tropical North Pacific Ocean, ISME J., 7, 2192–2205, https://doi.org/10.1038/ismej.2013.96, 2013.
Böhlke, J. K., Mroczkowski, S. J., and Coplen, T. B.: Oxygen isotopes in nitrate: new reference materials for 18O:17O:16O measurements and observations on nitrate-water equilibration: Reference materials for O-isotopes in nitrate, Rapid Commun. Mass Sp., 17, 1835–1846, https://doi.org/10.1002/rcm.1123, 2003.
Brandhorst, W.: Nitrite Accumulation in the North-East Tropical Pacific, Nature, 182, 679–679, https://doi.org/10.1038/182679a0, 1958.
Bronk, D. A., Glibert, P. M., and Ward, B. B.: Nitrogen Uptake, Dissolved Organic Nitrogen Release, and New Production, Science, 265, 1843–1846, https://doi.org/10.1126/science.265.5180.1843, 1994.
Buchwald, C. and Casciotti, K. L.: Isotopic ratios of nitrite as tracers of the sources and age of oceanic nitrite, Nat. Geosci., 6, 308–313, https://doi.org/10.1038/NGEO1745, 2013.
Burlacot, A., Richaud, P., Gosset, A., Li-Beisson, Y., and Peltier, G.: Algal photosynthesis converts nitric oxide into nitrous oxide, P. Natl. Acad. Sci. USA, 117, 2704–2709, https://doi.org/10.1073/pnas.1915276117, 2020.
Carlucci, A. F., Hartwig, E. O., and Bowes, P. M.: Biological production of nitrite in seawater, Mar. Biol., 7, 161–166, https://doi.org/10.1007/BF00354921, 1970.
Casciotti, K. L., Böhlke, J. K., McIlvin, M. R., Mroczkowski, S. J., and Hannon, J. E.: Oxygen isotopes in nitrite: analysis, calibration, and equilibration, Anal. Chem., 79, 2427–2436, https://doi.org/10.1021/ac061598h, 2007.
Cline, J. D. and Richards, F. A.: Oxygen deficient conditions and nitrate reduction in the eastern tropical North Pacific Ocean, Limnol. Oceanogr., 17, 885–900, https://doi.org/10.4319/lo.1972.17.6.0885, 1972.
Codispoti, L. A., Friederich, G. E., Murray, J. W., and Sakamoto, C. M.: Chemical variability in the Black Sea: implications of continuous vertical profiles that penetrated the oxic/anoxic interface, Deep-Sea Res. Pt. A, 38, S691–S710, https://doi.org/10.1016/S0198-0149(10)80004-4, 1991.
Collos, Y.: Transient situations in nitrate assimilation by marine diatoms. 2. Changes in nitrate and nitrite following a nitrate perturbation, Limnol. Oceanogr., 27, 528–535, 1982a.
Collos, Y.: Transient situations in nitrate assimilation by marine diatoms. III. Short-term uncoupling of nitrate uptake and reduction, J. Exp. Mar. Biol. Ecol., 62, 285–295, https://doi.org/10.1016/0022-0981(82)90208-8, 1982b.
Collos, Y.: Nitrate uptake, nitrite release and uptake, and new production estimates, Mar. Ecol.-Prog. Ser., 171, 293–301, https://doi.org/10.3354/meps171293, 1998.
Cornec, M., Claustre, H., Mignot, A., Guidi, L., Lacour, L., Poteau, A., D'Ortenzio, F., Gentili, B., and Schmechtig, C.: Deep Chlorophyll Maxima in the Global Ocean: Occurrences, Drivers and Characteristics, Global Biogeochem. Cy., 35, e2020GB006759, https://doi.org/10.1029/2020GB006759, 2021.
Dore, J. E. and Karl, D. M.: Nitrite distributions and dynamics at Station ALOHA, Deep-Sea Res. Pt. II, 43, 385–402, https://doi.org/10.1016/0967-0645(95)00105-0, 1996.
Dugdale, R. and Goering, J.: Uptake of new and regenerated forms of nitrogen in primary productivity, Limnol. Oceanogr, 12, 196–206, https://doi.org/10.4319/lo.1967.12.2.0196, 1967.
Dugdale, R. and Wilkerson, F.: The use of 15N to measure nitrogen uptake in eutrophic oceans; experimental considerations1, 2, Limnol. Oceanogr., 31, 673–689, https://doi.org/10.4319/lo.1986.31.4.0673, 1986.
Eppley, R. W. and Coatsworth, J. L.: Uptake of nitrate and nitrite by Ditylum Brightwelli – Kinetics and mechanisms, J. Phycol., 4, 151–156, https://doi.org/10.1111/j.1529-8817.1968.tb04689.x, 1968.
Francis, C. A., Roberts, K. J., Beman, J. M., Santoro, A. E., and Oakley, B. B.: Ubiquity and diversity of ammonia-oxidizing archaea in water columns and sediments of the ocean, P. Natl. Acad. Sci. USA, 102, 14683–14688, https://doi.org/10.1073/pnas.0506625102, 2005.
Francis, C. A., Beman, J. M., and Kuypers, M. M. M.: New processes and players in the nitrogen cycle: the microbial ecology of anaerobic and archaeal ammonia oxidation, ISME J., 1, 19–27, https://doi.org/10.1038/ismej.2007.8, 2007.
French, D. P., Furnas, M. J., and Smayda, T. J.: Diel changes in nitrite concentration in the chlorophyll maximum in the Gulf of Mexico, Deep-Sea Res. Pt. A, 30, 707–722, https://doi.org/10.1073/pnas.0506625102, 1983.
Füssel, J., Lam, P., Lavik, G., Jensen, M. M., Holtappels, M., Günter, M., and Kuypers, M. M.: Nitrite oxidation in the Namibian oxygen minimum zone, ISME J., 6, 1200–1209, https://doi.org/10.1038/ismej.2011.178, 2012.
Glibert, P. M., Middelburg, J. J., McClelland, J. W., and Jake Vander Zanden, M.: Stable isotope tracers: Enriching our perspectives and questions on sources, fates, rates, and pathways of major elements in aquatic systems, Limnol. Oceanogr., 64, 950–981, https://doi.org/10.1002/lno.11087, 2019.
Granger, J. and Sigman, D. M.: Removal of nitrite with sulfamic acid for nitrate N and O isotope analysis with the denitrifier method, Rapid Commun. Mass Sp., 23, 3753–3762, https://doi.org/10.1002/rcm.4307, 2009.
Grömping, U.: relaimpo: Relative Importance of Regressors in Linear, R package version 2.2-6, CRAN [code], https://CRAN.R-project.org/package=relaimpo (last acess: 1 June 2022), 2006.
Gruber, N.: The marine nitrogen cycle: overview and challenges, Nitrogen in the Marine Environment, 2, 1–50, https://doi.org/10.1038/nature06592, 2008.
Guerrero, M. A. and Jones, R. D.: Photoinhibition of marine nitrifying bacteria. I. Wavelength-dependent response, Mar. Ecol.-Prog. Ser., 141, 183–192, https://doi.org/10.3354/meps141183, 1996.
Hattori, A. and Wada, E.: Nitrite distribution and its regulating processes in the equatorial Pacific Ocean, in: Deep Sea Research and Oceanographic Abstracts, 18, 557–568, https://doi.org/10.1016/0011-7471(71)90122-7, 1971.
Herbland, A. and Voituriez, B.: Hydrological structure analysis for estimating the primary production in the tropical Atlantic Ocean, J. Marine Res., 37, 87–101, 1979.
Holligan, P. M., Balch, W. M., and Yentsch, C. M.: The significance of subsurface chlorophyll, nitrite and ammonium maxima in relation to nitrogen for phytoplankton growth in stratified waters of the Gulf of Maine, J. Marine Res., 42, 1051–1073, https://doi.org/10.1357/002224084788520747, 1984.
Holmes, R. M., Aminot, A., Kérouel, R., Hooker, B. A., and Peterson, B. J.: A simple and precise method for measuring ammonium in marine and freshwater ecosystems, Can. J. Fish. Aquat. Sci., 56, 1801–1808, https://doi.org/10.1139/f99-128, 1999.
Horak, R. E. A., Qin, W., Bertagnolli, A. D., Nelson, A., Heal, K. R., Han, H., Heller, M., Schauer, A. J., Jeffrey, W. H., Armbrust, E. V., Moffett, J. W., Ingalls, A. E., Stahl, D. A., and Devol, A. H.: Relative impacts of light, temperature, and reactive oxygen on thaumarchaeal ammonia oxidation in the North Pacific Ocean, Limnol. Oceanogr., 63, 741–757, https://doi.org/10.1002/lno.10665, 2018.
Kelly, C. L., Travis, N. M., Baya, P. A., and Casciotti, K. L.: Quantifying Nitrous Oxide Cycling Regimes in the Eastern Tropical North Pacific Ocean With Isotopomer Analysis, Global Biogeochem. Cy., 35, e2020GB006637, https://doi.org/10.1029/2020GB006637, 2021.
Key, R. M., Olsen, A., Van Heuven, S., Lauvset, S. K., Velo, A., Lin, X., Schirnick, C., Kozyr, A., Tanhua, T., Hoppema, M., Jutterstrom, S., Steinfeldt, R., Jeansson, E., Ishi, M., Perez, F. F., and Suzuki, T.: Global Ocean Data Analysis Project, Version 2 (GLODAPv2), ORNL/CDIAC-162, ND-P093, GLODAP [data set], http://hdl.handle.net/10013/epic.46499 (last access: 1 June 2022), 2015.
Kiefer, D., Olson, R., and Holm-Hansen, O.: Another look at the nitrite and chlorophyll maxima in the central North Pacific, in: Deep Sea Research and Oceanographic Abstracts, 23, 1199–1208, https://doi.org/10.1016/0011-7471(76)90895-0, 1976.
Legendre-Fixx, M.: Drivers of phytoplankton community heterogeneity in the Eastern Tropical North Pacific, Undergraduate Thesis, University of Washington, http://hdl.handle.net/1773/39734 (last access: 1 June 2022), 2017.
Lomas, M. W. and Glibert, P. M.: Temperature regulation of nitrate uptake: A novel hypothesis about nitrate uptake and reduction in cool-water diatoms, Limnol. Oceanogr., 44, 556–572, https://doi.org/10.4319/lo.1999.44.3.0556, 1999.
Lomas, M. W. and Glibert, P. M.: Comparisons of nitrate uptake, storage, and reduction in marine diatoms and flagellates, J. Phycol., 36, 903–913, https://doi.org/10.1046/j.1529-8817.2000.99029.x, 2000.
Lomas, M. W. and Lipschultz, F.: Forming the primary nitrite maximum: Nitrifiers or phytoplankton?, Limnol. Oceanogr., 51, 2453–2467, https://doi.org/10.4319/lo.2006.51.5.2453, 2006.
Lumley, T. based on F. code by A. Miller.: leaps: Regression Subset Selection, R package version 3.1, CRAN [code], https://CRAN.R-project.org/package=leaps (last access: 1 June 2022), 2020.
Lücker, S., Wagner, M., Maixner, F., Pelletier, E., Koch, H., Vacherie, B., Rattei, T., Damsté, J. S. S., Spieck, E., Le Paslier, D., and Daims, H.: A Nitrospira metagenome illuminates the physiology and evolution of globally important nitrite-oxidizing bacteria, P. Natl. Acad. Sci. USA, 107, 13479–13484, https://doi.org/10.1073/pnas.1003860107, 2010.
Lücker, S., Nowka, B., Rattei, T., Spieck, E., and Daims, H.: The Genome of Nitrospina gracilis Illuminates the Metabolism and Evolution of the Major Marine Nitrite Oxidizer, Front. Microbiol., 4, 27, https://doi.org/10.3389/fmicb.2013.00027, 2013.
Mackey, K. R., Bristow, L., Parks, D. R., Altabet, M. A., Post, A. F., and Paytan, A.: The influence of light on nitrogen cycling and the primary nitrite maximum in a seasonally stratified sea, Prog. Ocean., 91, 545–560, https://doi.org/10.1016/j.pocean.2011.09.001, 2011.
Martens-Habbena, W., Berube, P. M., Urakawa, H., de la Torre, J. R., and Stahl, D. A.: Ammonia oxidation kinetics determine niche separation of nitrifying Archaea and Bacteria, Nature, 461, 976–979, https://doi.org/10.1038/nature08465, 2009.
McIlvin, M. R. and Altabet, M. A.: Chemical conversion of nitrate and nitrite to nitrous oxide for nitrogen and oxygen isotopic analysis in freshwater and seawater, Anal. Chem., 77, 5589–5595, https://doi.org/10.1021/ac050528s, 2005.
McIlvin, M. R. and Casciotti, K. L.: Technical updates to the bacterial method for nitrate isotopic analyses, Anal. Chem., 83, 1850–1856, https://doi.org/10.1021/ac1028984, 2011.
Meeder, E., Mackey, K. R., Paytan, A., Shaked, Y., Iluz, D., Stambler, N., Rivlin, T., Post, A. F., and Lazar, B.: Nitrite dynamics in the open ocean-clues from seasonal and diurnal variations, Mar. Ecol.-Prog. Ser., 453, 11–26, https://doi.org/10.3354/meps09525, 2012.
Merbt, S. N., Stahl, D. A., Casamayor, E. O., Martí, E., Nicol, G. W., and Prosser, J. I.: Differential photoinhibition of bacterial and archaeal ammonia oxidation, FEMS Microbiol. Lett., 327, 41–46, https://doi.org/10.1111/j.1574-6968.2011.02457.x, 2012.
Miller, J. C. and Miller, J. N.: Basic Statistical Methods for Analytical Chemistry Part 1. Statistics of Repeated Measurements A Review, Analyst, 113, 1351–1356, https://doi.org/10.1039/AN9881301351, 1988.
Mincer, T. J., Church, M. J., Taylor, L. T., Preston, C., Karl, D. M., and DeLong, E. F.: Quantitative distribution of presumptive archaeal and bacterial nitrifiers in Monterey Bay and the North Pacific Subtropical Gyre, Environ. Microbiol., 9, 1162–1175, https://doi.org/10.1111/j.1462-2920.2007.01239.x, 2007.
Monreal, P. J., Kelly, C. L., Travis, N. M., and Casciotti, K. L.: Identifying the Sources and Drivers of Nitrous Oxide Accumulation in the Eddy-Influenced Eastern Tropical North Pacific Oxygen-Deficient Zone, Global Biogeochem. Cy., 36, e2022GB007310, https://doi.org/10.1029/2022GB007310, 2022.
Mulholland, M. and Lomas, M.: Nitrogen uptake and assimilation, in: Nitrogen in the Marine Environment, edited by: Capone, D. G., Bronk, D. A., Mulholland, M., and Carpenter, E. J., Elsevier, San Diego, https://doi.org/10.1016/B978-0-12-372522-6.00007-4, 2008.
Mulholland, M. R. and Jayakumar, A.: Dinitrogen fixation rates and diazotrophic communities in contrasting oxygen regimes of the Eastern Pacific Ocean. Biological and Chemical Oceanography Data Management Office – BCO-DMO, Dataset version: Dec. 1 2017, [data set], https://www.bco-dmo.org/project/472492, last access: 1 December 2017.
Olsen, A., Lange, N., Key, R. M., Tanhua, T., Bittig, H. C., Kozyr, A., Álvarez, M., Azetsu-Scott, K., Becker, S., Brown, P. J., Carter, B. R., Cotrim da Cunha, L., Feely, R. A., van Heuven, S., Hoppema, M., Ishii, M., Jeansson, E., Jutterström, S., Landa, C. S., Lauvset, S. K., Michaelis, P., Murata, A., Pérez, F. F., Pfeil, B., Schirnick, C., Steinfeldt, R., Suzuki, T., Tilbrook, B., Velo, A., Wanninkhof, R., and Woosley, R. J.: An updated version of the global interior ocean biogeochemical data product, GLODAPv2.2020, Earth Syst. Sci. Data, 12, 3653–3678, https://doi.org/10.5194/essd-12-3653-2020, 2020.
Olson, R. J.: Differential photoinhibition of marine nitrifying bacteria: a possible mechanism for the formation of the primary nitrite maximum, J. Mar. Res., 39, 227–238, 1981.
Peng, X., Fuchsman, C. A., Jayakumar, A., Oleynik, S., Martens-Habbena, W., Devol, A. H., and Ward, B. B.: Ammonia and nitrite oxidation in the Eastern Tropical North Pacific: AMMONIA AND NITRITE OXIDATION IN ETNP, Global Biogeochem. Cy., 29, 2034–2049, https://doi.org/10.1002/2015GB005278, 2015.
Plouviez, M., Shilton, A., Packer, M. A., and Guieysse, B.: Nitrous oxide emissions from microalgae: potential pathways and significance, J. Appl. Phycol., 31, 1–8, https://doi.org/10.1007/s10811-018-1531-1, 2019.
Raimbault, P.: Effect of temperature on nitrite excretion by three marine diatoms during nitrate uptake, Mar. Biol., 92, 149–155, 1986.
Rajaković, L. V., Marković, D. D., Rajaković-Ognjanović, V. N., and Antanasijević, D. Z.: The approaches for estimation of limit of detection for ICP-MS trace analysis of arsenic, Talanta, 102, 79–87, 2012.
Sakamoto, C. M., Friederich, G. E., and Codispoti, L. A.: MBARI procedures for automated nutrient analyses using a modified Alpkem Series 300 Rapid Flow Analyzer, Technical Report No. 90-2, Monterey Bay Aquarium Research Institute, Monterey Bay, CA, http://hdl.handle.net/1834/19792 (last access: 1 June 2022), 1990.
Santoro, A. E., Casciotti, K. L., and Francis, C. A.: Activity, abundance and diversity of nitrifying archaea and bacteria in the central California Current, Environ. Microbiol., 12, 1989–2006, 2010.
Santoro, A. E., Buchwald, C., McIlvin, M. R., and Casciotti, K. L.: Isotopic signature of N2O produced by marine ammonia-oxidizing archaea, Science, 333, 1282–1285, 2011.
Santoro, A. E., Sakamoto, C. M., Smith, J. M., Plant, J. N., Gehman, A. L., Worden, A. Z., Johnson, K. S., Francis, C. A., and Casciotti, K. L.: Measurements of nitrite production in and around the primary nitrite maximum in the central California Current, Biogeosciences, 10, 7395–7410, https://doi.org/10.5194/bg-10-7395-2013, 2013.
Schaefer, S. C. and Hollibaugh, J. T.: Temperature Decouples Ammonium and Nitrite Oxidation in Coastal Waters, Environ. Sci. Technol., 51, 3157–3164, https://doi.org/10.1021/acs.est.6b03483, 2017.
Schleper, C., Jurgens, G., and Jonuscheit, M.: Genomic studies of uncultivated archaea, Nat. Rev. Microbiol., 3, 479–488, https://doi.org/10.1038/nrmicro1159, 2005.
Shiozaki, T., Ijichi, M., Isobe, K., Hashihama, F., Nakamura, K., Ehama, M., Hayashizaki, K., Takahashi, K., Hamasaki, K., and Furuya, K.: Nitrification and its influence on biogeochemical cycles from the equatorial Pacific to the Arctic Ocean, ISME J., 10, 2184, https://doi.org/10.1038/ismej.2016.18, 2016.
Sigman, D. M., Casciotti, K. L., Andreani, M., Barford, C., Galanter, M., and Böhlke, J. K.: A Bacterial Method for the Nitrogen Isotopic Analysis of Nitrate in Seawater and Freshwater, Anal. Chem., 73, 4145–4153, https://doi.org/10.1021/ac010088e, 2001.
Smith, J. M., Chavez, F. P., and Francis, C. A.: Ammonium uptake by phytoplankton regulates nitrification in the sunlit ocean, PloS one, 9, e108173, https://doi.org/10.1371/journal.pone.0108173, 2014.
Strickland, J. D. and Parsons, T. R.: A practical handbook of seawater analysis, 2nd ed., Fisheries Research Board of Canada, Ottowa, Canada, 310 pp., https://doi.org/10.25607/OBP-1791, 1972.
Tian, H., Xu, R., Canadell, J. G., Thompson, R. L., Winiwarter, W., Suntharalingam, P., Davidson, E. A., Ciais, P., Jackson, R. B., Janssens-Maenhout, G., Prather, M. J., Regnier, P., Pan, N., Pan, S., Peters, G. P., Shi, H., Tubiello, F. N., Zaehle, S., Zhou, F., Arneth, A., Battaglia, G., Berthet, S., Bopp, L., Bouwman, A. F., Buitenhuis, E. T., Chang, J., Chipperfield, M. P., Dangal, S. R. S., Dlugokencky, E., Elkins, J. W., Eyre, B. D., Fu, B., Hall, B., Ito, A., Joos, F., Krummel, P. B., Landolfi, A., Laruelle, G. G., Lauerwald, R., Li, W., Lienert, S., Maavara, T., MacLeod, M., Millet, D. B., Olin, S., Patra, P. K., Prinn, R. G., Raymond, P. A., Ruiz, D. J., van der Werf, G. R., Vuichard, N., Wang, J., Weiss, R. F., Wells, K. C., Wilson, C., Yang, J., and Yao, Y.: A comprehensive quantification of global nitrous oxide sources and sinks, Nature, 586, 248–256, https://doi.org/10.1038/s41586-020-2780-0, 2020.
Travis, N., Kelly, C., Mullholland, M., and Casciotti, K.: Pump cast data from R/V Ron Brown 2016 cruise (RB1603), Stanford Digital Repository, [data set], https://doi.org/10.25740/gd152nx8149, 2023.
Trimmer, M., Chronopoulou, P.-M., Maanoja, S. T., Upstill-Goddard, R. C., Kitidis, V., and Purdy, K. J.: Nitrous oxide as a function of oxygen and archaeal gene abundance in the North Pacific, Nat. Commun., 7, 13451, https://doi.org/10.1038/ncomms13451, 2016.
Vaccaro, R. F. and Ryther, J. H.: Marine Phytoplankton and the Distribution of Nitrite in the Sea*, ICES J. Mar. Sci., 25, 260–271, https://doi.org/10.1093/icesjms/25.3.260, 1960.
Wada, E. and Hattori, A.: Nitrite metabolism in the euphotic layer of the central North Pacific Ocean, Limnol. Oceanogr., 16, 766–772, 1971.
Wada, E. and Hattori, A.: Nitrite distribution and nitrate reduction in deep sea waters, Deep Sea Research and Oceanographic Abstracts, 19, 123–132, https://doi.org/10.1016/0011-7471(72)90044-7, 1972.
Wan, X. S., Sheng, H.-X., Dai, M., Zhang, Y., Shi, D., Trull, T. W., Zhu, Y., Lomas, M. W., and Kao, S.-J.: Ambient nitrate switches the ammonium consumption pathway in the euphotic ocean, Nat. Commun., 9, 915, https://doi.org/10.1038/s41467-018-03363-0, 2018.
Wan, X. S., Sheng, H., Dai, M., Church, M. J., Zou, W., Li, X., Hutchins, D. A., Ward, B. B., and Kao, S.: Phytoplankton-nitrifier interactions control the geographic distribution of nitrite in the upper ocean, Global Biogeochem. Cy., 35, e2021GB007072, https://doi.org/10.1029/2021GB007072, 2021.
Ward, B. and Carlucci, A.: Marine ammonia-and nitrite-oxidizing bacteria: serological diversity determined by immunofluorescence in culture and in the environment, Appl. Environ. Microbiol., 50, 194–201, https://doi.org/10.1128/aem.50.2.194-201.1985, 1985.
Ward, B. B.: Temporal variability in nitrification rates and related biogeochemical factors in Monterey Bay, California, USA, Mar. Ecol.-Prog. Ser., 292, 97–109, https://doi.org/10.3354/meps292097, 2005.
Ward, B. B., Olson, R. J., and Perry, M. J.: Microbial nitrification rates in the primary nitrite maximum off southern California, Deep-Sea Res. Pt. A, 29, 247–255, https://doi.org/10.1016/0198-0149(82)90112-1, 1982.
Ward, B. B., Kilpatrick, K. A., Renger, E. H., and Eppley, R. W.: Biological nitrogen cycling in the nitracline, Limnol. Oceanogr., 34, 493–513, https://doi.org/10.4319/lo.1989.34.3.0493, 1989.
Watson, S. W. and Waterbury, J. B.: Characteristics of two marine nitrite oxidizing bacteria, Nitrospina gracilis nov. gen. nov. sp. and Nitrococcus mobilis nov. gen. nov. sp., Arch. Mikrobiol., 77, 203–230, 1971.
Xu, M. N., Li, X., Shi, D., Zhang, Y., Dai, M., Huang, T., Glibert, P. M., and Kao, S.: Coupled effect of substrate and light on assimilation and oxidation of regenerated nitrogen in the euphotic ocean, Limnol. Oceanogr., 64, 1270–1283, https://doi.org/10.1002/lno.11114, 2019.
Yool, A., Martin, A. P., Fernández, C., and Clark, D. R.: The significance of nitrification for oceanic new production, Nature, 447, 999–1002, https://doi.org/10.1038/nature05885, 2007.
Zafiriou, O. C., Ball, L. A., and Hanley, Q.: Trace nitrite in oxic waters, Deep Sea Res., 39, 1329–1347, https://doi.org/10.1016/0198-0149(92)90072-2, 1992.
Zakem, E. J., Al-Haj, A., Church, M. J., van Dijken, G. L., Dutkiewicz, S., Foster, S. Q., Fulweiler, R. W., Mills, M. M., and Follows, M. J.: Ecological control of nitrite in the upper ocean, Nat. Commun., 9, 1206, https://doi.org/10.1038/s41467-018-03553-w, 2018.
Zehr, J. P. and Ward, B. B.: Nitrogen Cycling in the Ocean: New Perspectives on Processes and Paradigms, AEM, 68, 1015–1024, https://doi.org/10.1128/AEM.68.3.1015-1024.2002, 2002.