the Creative Commons Attribution 4.0 License.
the Creative Commons Attribution 4.0 License.
 | 18 Aug 2023
Alkalinity generation from carbonate weathering in a silicate-dominated headwater catchment at Iskorasfjellet, northern Norway
Hugues Lantuit
Michael Ernst Böttcher
Jens Hartmann
Antje Eulenburg
The weathering rate of carbonate minerals is several orders of magnitude higher than for silicate minerals. Therefore, small amounts of carbonate minerals have the potential to control the dissolved weathering loads in silicate-dominated catchments. Both weathering processes produce alkalinity under the consumption of CO2. Given that only alkalinity generation from silicate weathering is thought to be a long-term sink for CO2, a misattributed weathering source could lead to incorrect conclusions about long- and short-term CO2 fixation. In this study, we aimed to identify the weathering sources responsible for alkalinity generation and CO2 fixation across watershed scales in a degrading permafrost landscape in northern Norway, 68.7–70.5∘ N, and on a temporal scale, in a subarctic headwater catchment on the mountainside of Iskorasfjellet, characterized by sporadic permafrost and underlain mainly by silicates as the alkalinity-bearing lithology. By analyzing total alkalinity (AT) and dissolved inorganic carbon (DIC) concentrations, as well as the stable isotope signature of the latter (δ13C-DIC), in conjunction with dissolved cation and anion loads, we found that AT was almost entirely derived from weathering of the sparse carbonate minerals. We propose that in the headwater catchment the riparian zone is a hotspot area of AT generation and release due to its enhanced hydrological connectivity and that the weathering load contribution from the uphill catchment is limited by insufficient contact time of weathering agents and weatherable materials. By using stable water isotopes, it was possible to explain temporal variations in AT concentrations following a precipitation event due to surface runoff. In addition to carbonic acid, sulfuric acid, probably originating from oxidation of pyrite or reduced sulfur in wetlands or from acid deposition, is shown to be a potential corrosive reactant. An increased proportion of sulfuric acid as a potential weathering agent may have resulted in a decrease in AT. Therefore, carbonate weathering in the studied area should be considered not only as a short-term CO2 sink but also as a potential CO2 source. Finally, we found that AT increased with decreasing permafrost probability, and attributed this relation to an increased water storage capacity associated with increasing contact of weathering agent and rock surfaces and enhanced microbial activity. As both soil respiration and permafrost thaw are expected to increase with climate change, increasing the availability of weathering agents in the form of CO2 and water storage capacity, respectively, we suggest that future weathering rates and alkalinity generation will increase concomitantly in the study area.
- Article
(1706 KB) - Full-text XML
- BibTeX
- EndNote


Weathering of silicate rocks is thought to be the long-term sink (millions of years) for atmospheric CO2 (Berner et al., 1983; Garrels and Berner, 1983). Weathering of both carbonate and silicate rocks consumes atmospheric and soil CO2 and increases the alkalinity of the ocean. Carbonate and silicate weathering are thought to be in equilibrium with marine calcification over shorter timescales (< 10 000 years; Zeebe and Westbroek, 2003). Beyond the calcium carbonate compensation time, only silicate weathering acts as a long-term sink for atmospheric CO2, while carbonate weathering acts CO2-neutral (Berner et al., 1983; Garrels and Berner, 1983). Since only alkalinity produced by silicate weathering is thought to be a long-term CO2 sink, a misattributed weathering source could lead to incorrect conclusions about long- and short-term CO2 fixation. Global estimates (Gaillardet et al., 1999; Amiotte Suchet et al., 2003; Hartmann et al., 2009) attribute 49 %–63 % of CO2 consumption by terrestrial weathering to silicate rocks and the remainder to carbonate rocks. These studies rely on lithological maps and bulk river chemistry data used to infer whether CO2 consumption is due to silicate or carbonate weathering. However, some case and regional studies (Blum et al., 1998; White et al., 1999; Jacobson et al., 2002; Jacobson et al., 2003; Oliver et al., 2003; White et al., 2005; Moore et al., 2013; Jacobson et al., 2015) indicate that the global calculations relying on bulk river chemistry data may overestimate silicate weathering. Hartmann (2009) pointed out that interpretation of the molar ratio of Ca2+ Na+ may lead to incorrect attribution of CO2 drawdown to silicate weathering in predominantly silicate areas, which should instead be attributed to the weathering of accessory carbonate minerals. Hartmann (2009) calculated trace carbonate contribution for igneous rocks and silicate sediments for the Japanese archipelago and later applied the developed multi-lithological regression method globally (Hartmann et al., 2009). Especially silicate-dominated regions that are physically active, e.g., during glaciation and tectonism, or that exhibit early stages of weathering due to freshly deposited material or recent deglaciation or uplift, show high weathering loads of accessory carbonate minerals such as calcite, aragonite, and dolomite (Jacobson et al., 2002, 2003; White et al., 1999; Oliver et al., 2003; White et al., 2005; Moore et al., 2013; Jacobson et al., 2015). The weathering rate of carbonates is several orders of magnitude faster than the weathering rate of silicates (Lasaga, 1984; Stallard and Edmond, 1987; Jacobson et al., 2003); thus, dissolved inorganic carbon (DIC) is often controlled by carbonates (Liu et al., 2018).
DIC is composed of CO (i.e., the sum of dissolved CO2 and H2CO3), HCO, and CO, with the relative proportion of the DIC species depending on alkalinity and environmental conditions such as temperature. In fresh water, total alkalinity (AT), or acid-neutralizing capacity, is mainly composed of carbonate alkalinity (i.e., HCO and CO) and, to a lesser extent, hydroxide ions (OH−). At pH values between 7 and 9, the alkalinity concentration is approximately equal to the HCO concentration (∼95 % of the carbon in the water is in the form of HCO), as the equilibrium between CO, HCO, and CO in this pH range is strongly in favor of HCO (Stumm and Morgan, 1981). Alkalinity in the form of HCO is produced from the weathering of carbonate minerals (shown here for calcite) under the consumption of one equivalent of atmospheric and/or soil CO2 as follows:
Assuming that the weathering agent is not carbonic acid but other inorganic acids such as sulfuric and nitric acid and that carbonate is not present in excess but as accessory carbonates (Appelo et al., 1998), carbonate weathering (shown here for calcite weathering with sulfuric acid) releases CO2, thereby increasing the DIC concentration but not contributing to alkalinity generation (Berner and Berner, 1987; Marx et al., 2017a; Liu et al., 2018):
Sulfuric acid can be generated from the dissolution of sulfate-containing minerals, such as gypsum; the oxidation of sulfide minerals, such as pyrite; or the oxidation of reduced sulfur stores in wetlands (including permafrost). Furthermore, both sulfuric and nitric acid can be brought into the soil via acid deposition. Finally, nitric acid can also be produced from the oxidation of ammonium fertilizers or through nitrification of reduced nitrogen stores in wetlands (Marx et al., 2017a; Li et al., 2010).
While in carbonic-acid-induced carbonate weathering only one of the two equivalents of HCO is derived from atmospheric and/or soil CO2, in silicate weathering all HCO originates from CO2 (shown here for anorthite weathering, one of the three major types of feldspar):
When silicates are weathered by non-carbon-based acids, neither DIC nor AT is generated (shown here for anorthite weathering with sulfuric acid):
A valuable tool to distinguish between the sources of DIC in streams is the stable isotope composition of DIC, δ13C-DIC (Deines et al., 1974; Böttcher, 1999), which varies across a wide range, typically from +5 ‰ to −35 ‰ (Campeau et al., 2017). In addition to the abovementioned geogenic sources, DIC is also governed by biogenic sources, CO2 evasion, and in-stream processes (Kempe, 1982; Campeau et al., 2017). Biogenic DIC originates from autotrophic respiration, heterotrophic respiration, or organic matter mineralization (e.g., photo-oxidation of dissolved organic carbon (DOC)). In regions dominated by C3 plant vegetation, this biogenic DIC has a typical δ13C value of about −27 ‰ (O'Leary, 1988). When measured in soil solution, this value typically increases by 1 %–4 ‰ as dissolution and gas exchange across the soil–atmosphere interphase take place (Cerling et al., 1991; Davidson, 1995; Amundson et al., 1998). When carbonate minerals, which have a typical δ13C value of about 0 ‰ (Hoefs, 1973; Land, 1980), are weathered by soil-respired dissolved CO2 (about −24 ‰), the final DIC is at saturation with carbonate minerals and is characterized by an isotopic composition of about −12 ‰, considering evolution under conditions closed with reference to a CO2 gas phase in C3 vegetation-dominated catchments (Deines et al., 1974). C4-type vegetation leads to a shift towards heavier stable isotope values (Deines et al., 1974). When the weathering takes place by other inorganic acids, the resulting δ13C-DIC can even turn more positive to about −6 ‰ to −1 ‰ (Schaefer and Usdowski, 1987, 1992; Michaelis, 1992; Zolkos et al., 2020) and under extreme conditions reach the δ13C value of carbonate minerals of about 0 ‰ (Lehn et al., 2017). The actual isotope composition of DIC also depends on the boundary conditions (presence of biogenic CO2) during the groundwater evolution (Deines et al., 1974; Schaefer and Usdowski, 1987, 1992; Böttcher, 1999). DIC generated from carbonic-acid-induced silicate weathering has a typical δ13C value of about −24 ‰, as soil CO2 is the dominant source for DIC (Lehn et al., 2017; Purkamo et al., 2022), and fractionation between the aqueous and gas phase is small at low pH values (Deines et al., 1974).
When CO2 is degassed from the stream due to supersaturation, which is especially prominent in headwater catchments (Michaelis et al., 1985; Marx et al., 2017a), the remaining stream water DIC is enriched in 13C (Michaelis et al., 1985; Liu and Han, 2020). Equilibrium exchange fractionation between stream DIC and atmospheric CO2, which has a typical δ13C value of about −8 ‰ (Trolier et al., 1996), has the same effect on stream δ13C-DIC as CO2 outgassing (Michaelis et al., 1985; Liu and Han, 2020).
Finally, the δ13C-DIC values on flowing surface waters may also be influenced by in situ biogeochemical processes such as biological respiration, DOC photo-oxidation, photosynthesis, mixing with groundwater, and anaerobic metabolism (Campeau et al., 2017).
The general controls on chemical weathering are the availability of weatherable minerals, mainly provided by physical weathering of regolith, and the supply of weathering agents, i.e., acids (Raymond and Hamilton, 2018). In addition to carbonic acid, the main source of terrestrial weathering, organic acids from vegetation (mainly carboxylic acids) and strong inorganic acids (mainly sulfuric and nitric acid, derived from the oxidation of sulfides and ammonium, respectively; Raymond and Hamilton, 2018) drive the weathering reactions. However, to the best of our knowledge, there is not any study showing the effect of DOC on the weathering reaction. Further, to generate the soluble weathering products, favorable conditions such as high temperatures, abundant moisture, and high contact of mineral surfaces with water should prevail. Lastly, the hydrological transport of these solutes out of the weathering zone is another controlling factor (Raymond and Hamilton, 2018).
Feedback between the Earth's carbon cycle and terrestrial weathering was originally thought to be slow, and CO2 consumption by terrestrial weathering was thought to be at steady state since pre-industrial times (Walker et al., 1981; Berner et al., 1983). However, a global study (Goll et al., 2014) reported increased CO2 consumption since 1850, and regional studies (Li et al., 2008; Gislason et al., 2009; Raymond et al., 2008; Drake et al., 2018; Macpherson et al., 2019) found an increase in riverine alkalinity over the last decades and related this to changes in temperature, precipitation, vegetation, availability of acids, liming, or hydrologic flow conditions. Thawing permafrost in cold regions was also assumed, thereby advocating for a possibly rapid (decadal) feedback between climate and land-use change and riverine alkalinity generation upon terrestrial weathering. Especially carbonate weathering was found to strongly respond to contemporary environmental changes (Michaelis, 1992; Zeng et al., 2019). Besides the tropical region, northern high latitudes are expected in the future to experience enhanced carbonate weathering and thus a higher carbon sink function due to increased soil CO2 partial pressures and temperatures (Zeng et al., 2022). The drivers of the increased soil pCO2 are increased ecosystem productivity and soil respiration (Zeng et al., 2022). The aquifers and soils of Fennoscandia, however, are mainly composed of non-carbonate rocks (O'Nions et al., 1970; Hartmann and Moosdorf, 2012; Zeng et al., 2022), and therefore a response in terms of CO2 sequestration through weathering on environmental changes might be expected to be slow (Moosdorf et al., 2011).
Climate change is particularly accelerated in the Arctic, as reflected in the annually averaged near-surface air temperature, which increased by 0.71 ∘C per decade from 1979 to 2021, nearly 4 times faster than the global average (Rantanen et al., 2022). This rapid warming simultaneously affects permafrost, hydrology, soil carbon stores, and surface vegetation, with all of these processes having the potential to alter the generation of alkalinity (Drake et al., 2018). Permafrost thaw causes the Arctic terrestrial freshwater system to increase its connectivity between surface waters and deeper groundwater pathways (Striegl et al., 2005; Walvoord and Striegl, 2007) and may ultimately move from a surface water-dominated to a groundwater-dominated system (Frey and McClelland, 2009). Thawed soils allow for longer residence times of infiltrating surface water, thereby facilitating more contact with unweathered mineral surfaces and additional mixing with mineral-rich groundwater, resulting in higher-alkalinity fluxes (Drake et al., 2018). So far, studies about fast feedback between alkalinity generation from rock weathering and climate change in northern high latitudes have investigated the impact of a varying glacial cover (Gislason et al., 2009) or retrogressive thaw slumps (Zolkos et al., 2020) or focused on large Arctic river systems (Drake et al., 2018) and on subcatchments of the circumboreal (Tank et al., 2012). An in-depth study of the weathering processes in catchments of the silicate-rich Fennoscandian Shield in northern Norway, potentially influenced by a changing climate, which could lead to an enhanced alkalinity generation, is still missing.
Our aim in the present study is to identify the weathering pathways responsible for alkalinity generation in a small subarctic catchment on the mountainside of Iskorasfjellet in northern Norway that is mainly dominated by silicate minerals and characterized by sporadic permafrost during early fall 2020. In particular, we aimed at distinguishing between different weathering agents (dissolved CO2 vs. other acids) and different source minerals (silicate vs. carbonate) under different environmental forcings, thereby analyzing the potential factors for CO2 drawdown. In addition to the detailed analysis of the Gaskabohki watershed at Iskorasfjellet, we extended the investigation of controlling factors on alkalinity generation to several other catchments, some of which stretch as far as the Barents Sea with varying extent of permafrost, in order to establish broader implications and evaluate how climate change might provide feedback for CO2 sequestration in this subarctic region.
2.1 Study site
The Gaskabohki watershed (catchment area = 0.7 km2) is a headwater catchment located on the mountain slope of Iskorasfjellet, Karasjok municipality, northern Norway (Fig. 1). Iskorasfjellet is situated inland on the Finnmarksvidda plateau (300–500 m above mean sea level (a.m.s.l.), with local peaks rising above 600 m a.m.s.l.), which borders Finland to the south and east. The Finnmarksvidda plateau was completely covered by the Fennoscandian ice sheet during the Last Glacial Period (Olsen et al., 2013). In addition to being covered by the Fennoscandian ice sheet with an ice dome zone over Finland during the last stadial, the Finnmarksvidda was also covered by the Scandinavian ice sheets, which grew from the mountainous area of northwestern Sweden and from centers along the Caledonian mountain range in Norway during the Middle and Early Weichselian (Olsen, 1988; Olsen et al., 2013). Due to glacial activity, ground-moraine, glaciofluvial, and glaciolacustrine sediments were accumulated on the surface geology (Sollid et al., 1973). Various soil types are present on the Finnmarksvidda plateau: podzols with a thin to medium bleached layer, swamp soils, lithosols, ranker-like soils, and brown earth (Lag, 1983). Iskorasfjellet was deglaciated ∼ 10 900–10 800 cal yr BP (Stroeven et al., 2016). The Gaskabohki catchment is underlain by quartzite and arkose and in places with layers of different shales (NGU, 2022). Therefore, the alkalinity-bearing lithology is dominated by feldspar, with a minor contribution of calcite within the shales. Just before the outlet, however, a small area of partly calcareous quartz feldspar shale (0.5 % areal proportion of the entire catchment area) underlies the catchment. This area coincides with a wider riparian zone (Fig. 1d). Besides the main channel, drainage gullies are present which were dried out at the time of sampling in the fall.
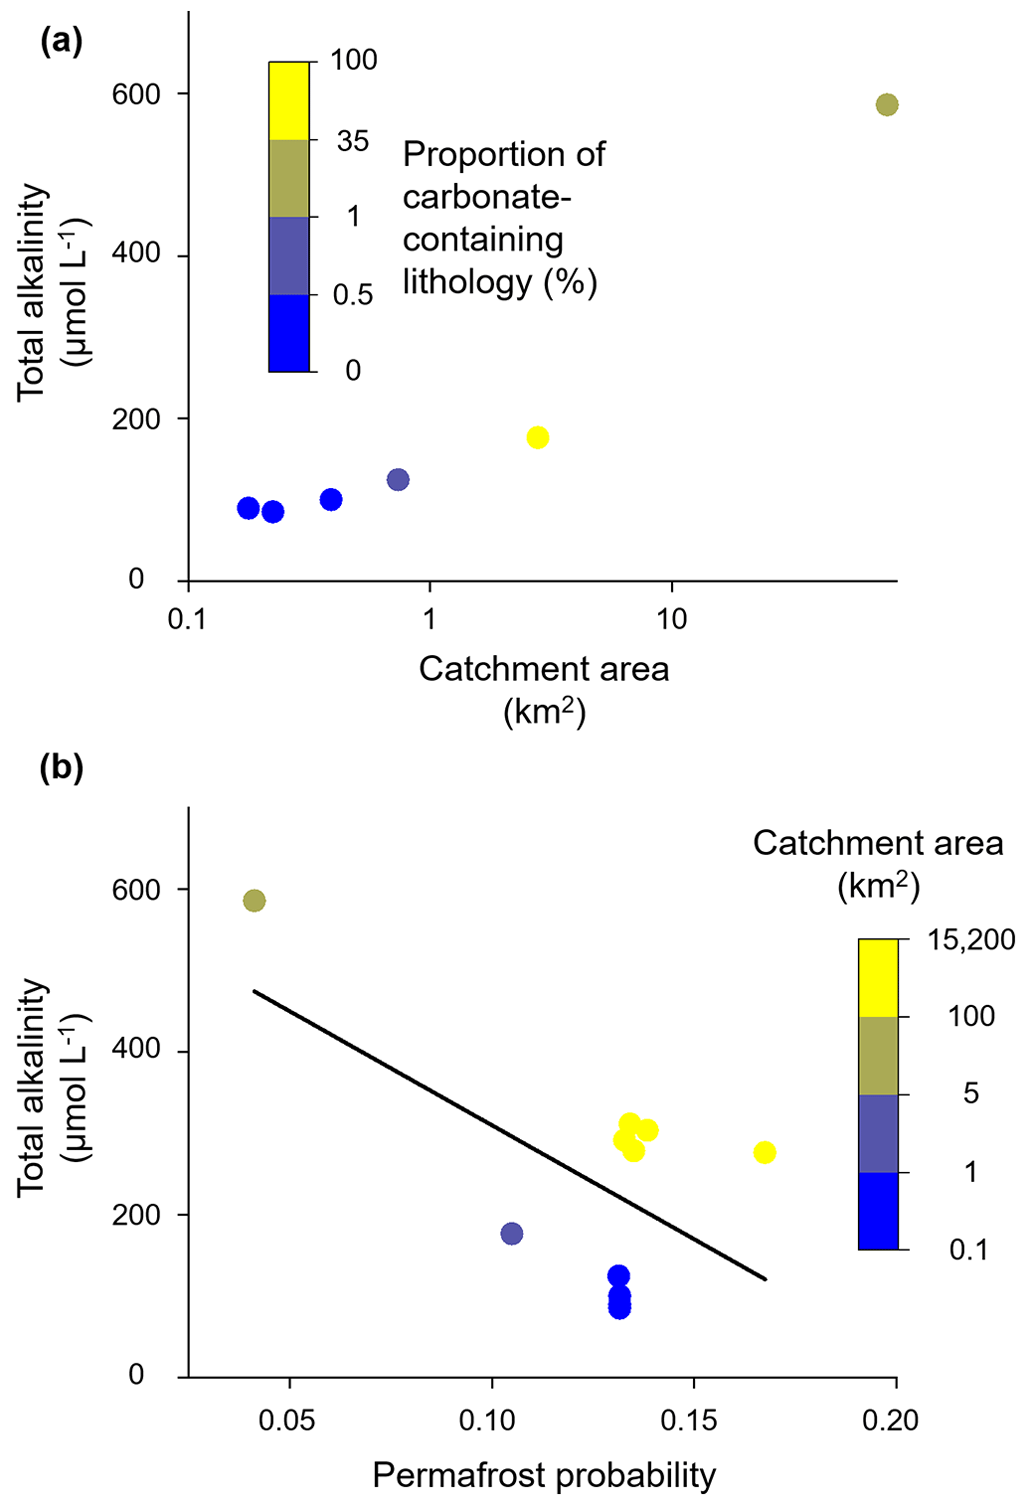
Figure 1Study area. (a) Location of all studied basins in Fennoscandia. The background map from Esri, HERE, Garmin, FAO, NOAA, and USGS (ESRI, 2022). (b) Zoom on the study area at Iskorasfjellet with the Báhkiljohka (Ba), Guovzilbohki (Gu), and Gaskabohki (Ga) catchments. The background map is the ArcGis web map “Topografisk Norgeskart” (ESRI, 2022). (c) Zoom on the Gaskabohki headwater catchment with sampling stations Ga1–Ga4 (Gaskabohki 1–Gaskabohki 4). The contour interval is 10 m. (d) Zoom on the outlet of the Gaskabohki catchment with the wider riparian zone overlapping with an area of partly calcareous quartz feldspar shale (carbonate-enriched rock).
From the top of the mountain at 644 m a.m.s.l., the landscape slopes down (∼ 3 % slope) to the Iskoras peat plateau at ∼ 380 m a.m.s.l. The peat began to form around 9800 cal yr BP in the form of wet fens, which were prevalent during most of the Holocene. Dry surface conditions associated with permafrost peat plateau aggradation developed around 950–100 cal yr BP, probably caused by the Little Ice Age cooling (Kjellman et al., 2018).
The Iskoras peat plateau is enclosed by the Báhkiljohka catchment (catchment area of 78 km2; Fig. 1b), which is underlain by an increased proportion of partly calcareous quartz feldspar shale (up to 34 % of areal carbonate extent; NGU, 2022) when compared to the Gaskabohki catchment (0.5 %). From Iskorasfjellet, the sampling area stretches out further northeast, following the larger rivers Karasjohka and Tana, until the Tanafjord. While the Báhkiljohka catchment is characterized by isolated patches of permafrost (catchment-average permafrost probability of 0.04), the Gaskabohki watershed and the rest of the studied area show sporadic permafrost (catchment-average permafrost probability of 0.10–0.17) (Obu et al., 2019). Permafrost probability is defined as the fraction of ensemble members (N= 200 for each 1 km2 grid cell) with a mean annual ground temperature of 0 ∘C or lower (Obu et al., 2019). Tundra vegetation (e.g., lichen crusts, Betula shrubs, and Empetrum nigrum ssp. hermaphroditum) dominates at Iskorasfjellet. Below an elevation of ∼ 570 m a.m.s.l., mountain birch (Betula pubescens ssp. czerepanovii) forest is also present.
The climate of Finnmarksvidda is continental. For 6 years (September 2014–August 2020, the longest continuous record at Iskorasfjellet), the mean summer (June–July–August) and winter (December–January–February) air temperatures were 8.7 and −9.3 ∘C, respectively (measured at the meteorological station at Iskorasfjellet, 591 m a.m.s.l., SN97710; Seklima, 2020). Compared to the air temperature normal (1961–1990), temperatures increased by 0.2 and 4.2 ∘C, respectively. The mean monthly precipitation sums during the summer and winter for the 6 years in question were 66 and 38 mm, respectively, which correspond to 117 % and 237 % of the monthly precipitation sum of the climate normal, respectively. The annual precipitation averaged over the 6 years from September 2017–August 2020 was 492 mm (measured at the meteorological station in Karasjok, 131 m a.m.s.l., SN97251, 20 km from Iskorasfjellet; Seklima, 2020). The mean daily snow depth during the snow season (October–May) was 29 cm (measured at the meteorological station at Iskorasfjellet, 591 m a.m.s.l., SN97710; Seklima, 2020).
During the sampling campaign in fall 2020, a precipitation sum of 7 mm was measured, which is about half of what was recorded over the same period averaged over the 6 years prior to sampling (Seklima, 2020). Thus, the fall of 2020 was comparatively dry. There was no snowfall, and the mean daily air temperature averaged over the sampling period was 3.9 ∘C, which is ∼ 2.7 ∘C higher than during the same fall period 2014–2019 (Seklima, 2020).
2.2 Water sampling
From 22 September to 6 October 2020, we collected water samples daily from the outlet of the Gaskabohki catchment (Ga; Fig. 1b–d) to investigate how DIC and AT may change under different environmental forcing (changing precipitation and temperature). We further sampled weekly (3×) at three stations upstream of the outlet to track the changes in the carbonate system with distance from the spring. All data can be accessed at https://doi.org/10.1594/PANGAEA.952905. Besides this temporal examination, we also expanded the investigation spatially and collected water samples from seven further catchments (Fig. 1a). These catchments included the Guovzilbohki headwater catchment (Gu; Fig. 1b), which shows similar topographic properties to the adjacent Gaskabohki watershed but a higher carbonate-to-silicate bedrock ratio; the Báhkiljohka catchment (Ba; Fig. 1b), which is characterized by the lowest permafrost probability; and five larger catchments (catchment area of 4900–15 000 km2). In this way, we were able to investigate further controlling factors (catchment area, roughness, permafrost probability, peatland cover, mean EVI (enhanced vegetation index), and bedrock lithology) on alkalinity generation.
At all sampling sites, we collected water samples for DIC and AT, δ13C-DIC, major elements, and stable water isotopes (δ18O-H2O and δ2H-H2O). For DIC and AT analysis, we collected the river water directly into 300 mL biological oxygen demand (BOD) bottles; added 300 µL of saturated mercury chloride solution; and sealed the bottles with ground-glass stoppers, Apiezon type M grease, and plastic caps (no headspace). For δ13C-DIC analysis, the solution was membrane filtered (0.45 µm pore widths) into 12 mL glass vials, 10 µL of saturated mercury chloride solution was added, and the vials were sealed with a septum without headspace. For cation measurements, we filtered the surface water (0.45 µm pore widths) into 50 mL acid-washed tubes and acidified the samples with 50 µL of concentrated trace-metal-grade HNO3. For anion measurements, we filtered (0.45 µm pore widths) the samples into 15 mL tubes, from which we later took an aliquot (∼ 1.5 mL) for stable water isotope analysis. All samples were stored in the dark at ambient temperature (∼ 1–10 ∘C). We measured stream temperature and electric conductivity using a precalibrated WTW Multi3430 with IDS TetraCon 925 and turbidity using a precalibrated HACH 2100Qis. Finally, at the outlet of the Gaskabohki catchment, we performed a discharge measurement once a day, at the same time as taking the water samples, by recording stream velocity using a Marsh-McBirney Model 2000 Flo-Mate portable flow meter at increments equal to ∼ 10 % of the stream width. By measuring the corresponding stream depth, we were able to calculate stream discharge from the product of stream velocity and cross-sectional area.
2.3 Hydrochemical analyses
We analyzed the AT concentration by performing a potentiometric titration using a Metrohm 888 Titrando with an Aquatrode pH probe. The recovery was ≥ 99 %. We used a Marianda VINDTA 3C (Versatile Instrument for the Determination of Titration Alkalinity) to determine the DIC concentration by coulometric titration. The precision was ±2 µmol L−1 (Shadwick et al., 2011). AT and DIC measurements were calibrated against certified reference materials (CRMs) provided by Andrew Dickson (Scripps Institution of Oceanography). We calculated pH and pCO2 by using the program CO2SYS (Pierrot et al., 2011); providing AT, DIC, and water temperature; and using the freshwater equilibrium constants from Millero (1979). The δ13C-DIC values were measured by means of continuous-flow isotope ratio monitoring mass spectrometry (CF-irmMS) using a Finnigan MAT 253 gas mass spectrometer coupled to a gas bench (GasBench II, Thermo Fisher Scientific) via a ConFlo IV continuous-flow interface following the procedure described by Winde et al. (2014). The precision of the δ13C-DIC analysis was better than ±0.1 ‰. Results are given vs. the VPDB (Vienna Pee Dee Belemnite) standard. Stable water isotopes (δ18O-H2O and δ2H-H2O) were measured by means of cavity ring-down spectroscopy (CRDS) using a Picarro L2140-I system. International and in-house standards were used to scale the water isotope measurements (Böttcher and Schmiedinger, 2021). Stable isotope results are given in the conventional δ notation vs. the VSMOW (Vienna Standard Mean Ocean Water) and had a precision of better than ±0.06 ‰ for oxygen and ±0.3 ‰ for hydrogen isotopes (Böttcher and Schmiedinger, 2021). All stable isotope data given in “ ‰” are equivalent to “mUr” (milli Urey; Brand and Coplen, 2012). Multielement composition (Al, Ba, Ca, Fe, K, Mg, Mn, Na, P, Si, Sr) was analyzed by inductively coupled plasma optical emission spectrometry (ICP-OES) using a Perkin Elmer Optima 8300DV spectrometer. We determined anion concentrations (Br−, Cl−, F−, NO, SO using a Thermo Fisher Scientific Dionex ICS-2100 ion chromatograph. The precision for multielement and anion analyses was ±10 %. The complete hydrochemical data set is available through PANGAEA at https://doi.org/10.1594/PANGAEA.952905.
2.4 Geospatial analyses
We delineated stream networks and watershed areas using the SAGA-GIS modules “Channel Network and Drainage Basins” and “Upslope Area” (Conrad et al., 2015) in QGIS 3.22.2 (QGIS.org, 2022) from the gridded digital elevation model ArcticDEM (Porter et al., 2018) and used ArcGIS Pro 2.8.0 (ESRI, 2022) to create the maps. While we used the full-resolution model (2 m) for the two small headwater catchments Gaskabohki and Guovzilbohki, we used the 32 m resolution one for the larger watersheds.
We calculated the catchments' mean values of terrain roughness, permafrost probability, peatland cover, enhanced vegetation index (EVI), and bedrock lithology. We computed terrain roughness, which is indicative of the potential for physical erosion (Riley et al., 1999), by using the GDAL (Geospatial Data Abstraction Library) tool “Roughness” (Rouault et al., 2022). We determined permafrost probability by using the Northern Hemisphere permafrost map based on TTOP (temperature at the top of the permafrost) modeling for 2000–2016 at 1 km2 scale, which performs well in sparsely vegetated tundra regions and mountains (Obu et al., 2019), reflecting our study region. We determined the areal proportion of peatland cover, including mires, from the peatland map of Europe (Tanneberger et al., 2017). EVI can serve as a proxy for vegetation productivity (Huete et al., 2002). We used the EVI of the MODIS vegetation index (VI) products, which is based on MODIS data with a resolution of 250 m from 6 October 2020 (Didan et al., 2015). We determined the lithological coverage of the smaller basins (Gaskabohki, Guovzilbohki, and Báhkiljohka) from the Norwegian bedrock map “Berggrunn N250” (NGU, 2022) by calculating the area of the individual rock types (e.g., quartzite) as a percentage of the total catchment area. For the comparison with the larger catchments, we used the global lithological map database GLiM, which contains 16 lithological classes (Hartmann and Moosdorf, 2012).
We determined the riparian zone in the Gaskabohki catchment by first calculating the slope per 2×2 m DEM cell and then, starting from the streambed, identifying all cells belonging to the riparian zone that had a slope less than 10∘ (gradient of 1:5.7). We chose slope as the main criterion for defining the riparian zone because Camporese et al. (2014) found that the primary control on the nonlinear catchment response to a rainfall–runoff event is exerted by topography.
2.5 Modeling of soil respiration
We used the streamCO2-DEGAS model by Polsenaere and Abril (2012) to calculate initial soil pCO2. The model first simulates the decrease in pCO2 and increase in δ13C-DIC that occur along the stream watercourse during degassing, starting from an assumed initial soil pCO2 and ending at the in situ pCO2 or δ13C-DIC. Subsequently, soil pCO2 is adjusted until pCO2 and δ13C-DIC simultaneously reach the in situ measured values. Soil organic matter isotopic composition and the isotopic fractionation of CO2 in the soil due to selective molecular diffusion of the gas through the soil pores are considered. The model is applicable for small, unproductive streams (assumption of insignificant primary production in the aquatic system) with acidic pH (4.6–7.2) and demands the input variables of AT, δ13C-DIC, pCO2, and stream temperature (Polsenaere and Abril, 2012). We assumed a proportion of non-carbon-based-acid-induced alkalinity generation of 0.2 and a proportion of in-stream respiration of 0. We also explored how alternative values for the proportion of non-carbon-based-acid-induced alkalinity generation and in-stream respiration would affect the calculations of the initial soil pCO2.
3.1 Weathering and alkalinity generation in the Gaskabohki catchment
During the study period of fall 2020, the Gaskabohki catchment showed a mean AT concentration (± standard deviation) of 125 (±5) µmol L−1 and a mean DIC concentration of 148 (±21) µmol L−1. As the Gaskabohki catchment is mainly underlain by quartzite and arkose, with the alkalinity-bearing mineral thus being feldspar, it is reasonable that the measured AT concentration exactly matches the concentration of 125 µmol L−1 that Meybeck (1987) found for catchments draining pure silicate bedrock, with more than 90 % of the samples taken during non-flood periods. However, we would like to point out that the catchments studied by Meybeck (1987) are from temperate regions, whereas ours are from Arctic regions.
3.1.1 Carbonic-acid-induced carbonate weathering dominates alkalinity generation
The mean sum of major cation concentrations (Na+, K+, Ca2+, Mg2+) in the Gaskabohki stream was 120 (±4) µmol L−1. This is consistent with the lower range found for rivers of the Canadian Shield in the Grenville Province (71–175 µmol L−1), which are characterized by a similar catchment geology (Millot et al., 2002). The average Ca2+ Na+ and Mg2+ Na+ molar ratios in the Gaskabohki stream were 0.74 (±0.05) and 0.49 (±0.02), respectively. These values are consistent with the ones found by Meybeck (1986) for quartz sand and sandstone watersheds and slightly higher than the ones calculated by Gaillardet et al. (1999) for the global silicate end-member. As we did not correct our data for precipitation due to the lack of rainwater composition data at the study site, these molar ratios are likely underestimated. Therefore, the weathering load would move closer to the carbonate end-member. In our data set, the highest Ca2+ Na+ molar ratios (up to 0.83) are associated with both the highest AT and the highest electrical conductivity values, indicating enhanced carbonate weathering. Considering that our ionic concentrations are not corrected for rainwater input, these elevated Ca2+ Na+ molar ratios, if corrected, should approach the molar ratio (Ca2+ Na+ > 1) reported by Oliva et al. (2004) for a weathering load that is extensively influenced by trace minerals such as calcite in high-elevation systems draining granitic environments.
The DIC system of the Gaskabohki catchment is neither completely kinetically controlled (mineral weathering reactions) nor completely equilibrium controlled (mixing with atmospheric and biotic CO2). It is controlled both by HCO production from carbonate weathering and by the CO2 pool in the soil (Fig. 2a). While the DIC system mainly consists of HCO ions (∼ 83 (±7) %), CO plays a minor role (∼ 16 (±9) %), and CO ions (∼ 1 (±3) %) are negligible. We found that AT increases linearly with electric conductivity (adjusted R2= 0.81), suggesting that the Gaskabohki catchment is mainly controlled by mineral weathering (Fig. 2b). We excluded the measurement with the highest daily precipitation sum of 4.7 mm (4.3 mm within 3 h) from the linear regression (Fig. 2b, i) because this measurement showed a distinctly higher δ18O-H2O value when compared to the other measurements, thus indicating the highest proportion of surface water. Furthermore, this measurement also showed a distinctly higher turbidity. As mineral weathering in headwater catchments is generally associated with groundwater inputs (Shin et al., 2011), we thought this exclusion reasonable. Other authors (Hill and Neal, 1997) explained decreases in AT associated with increases in electric conductivity with enhanced soil- and surface-derived components, such as nutrients and organic acids. We can also observe this in our data set, where we detected a nitrate signal in the samples which were taken during a day with rainfall or on up to 4 d that followed, before falling under the detection limit, indicating a hysteresis effect (Fig. 3).
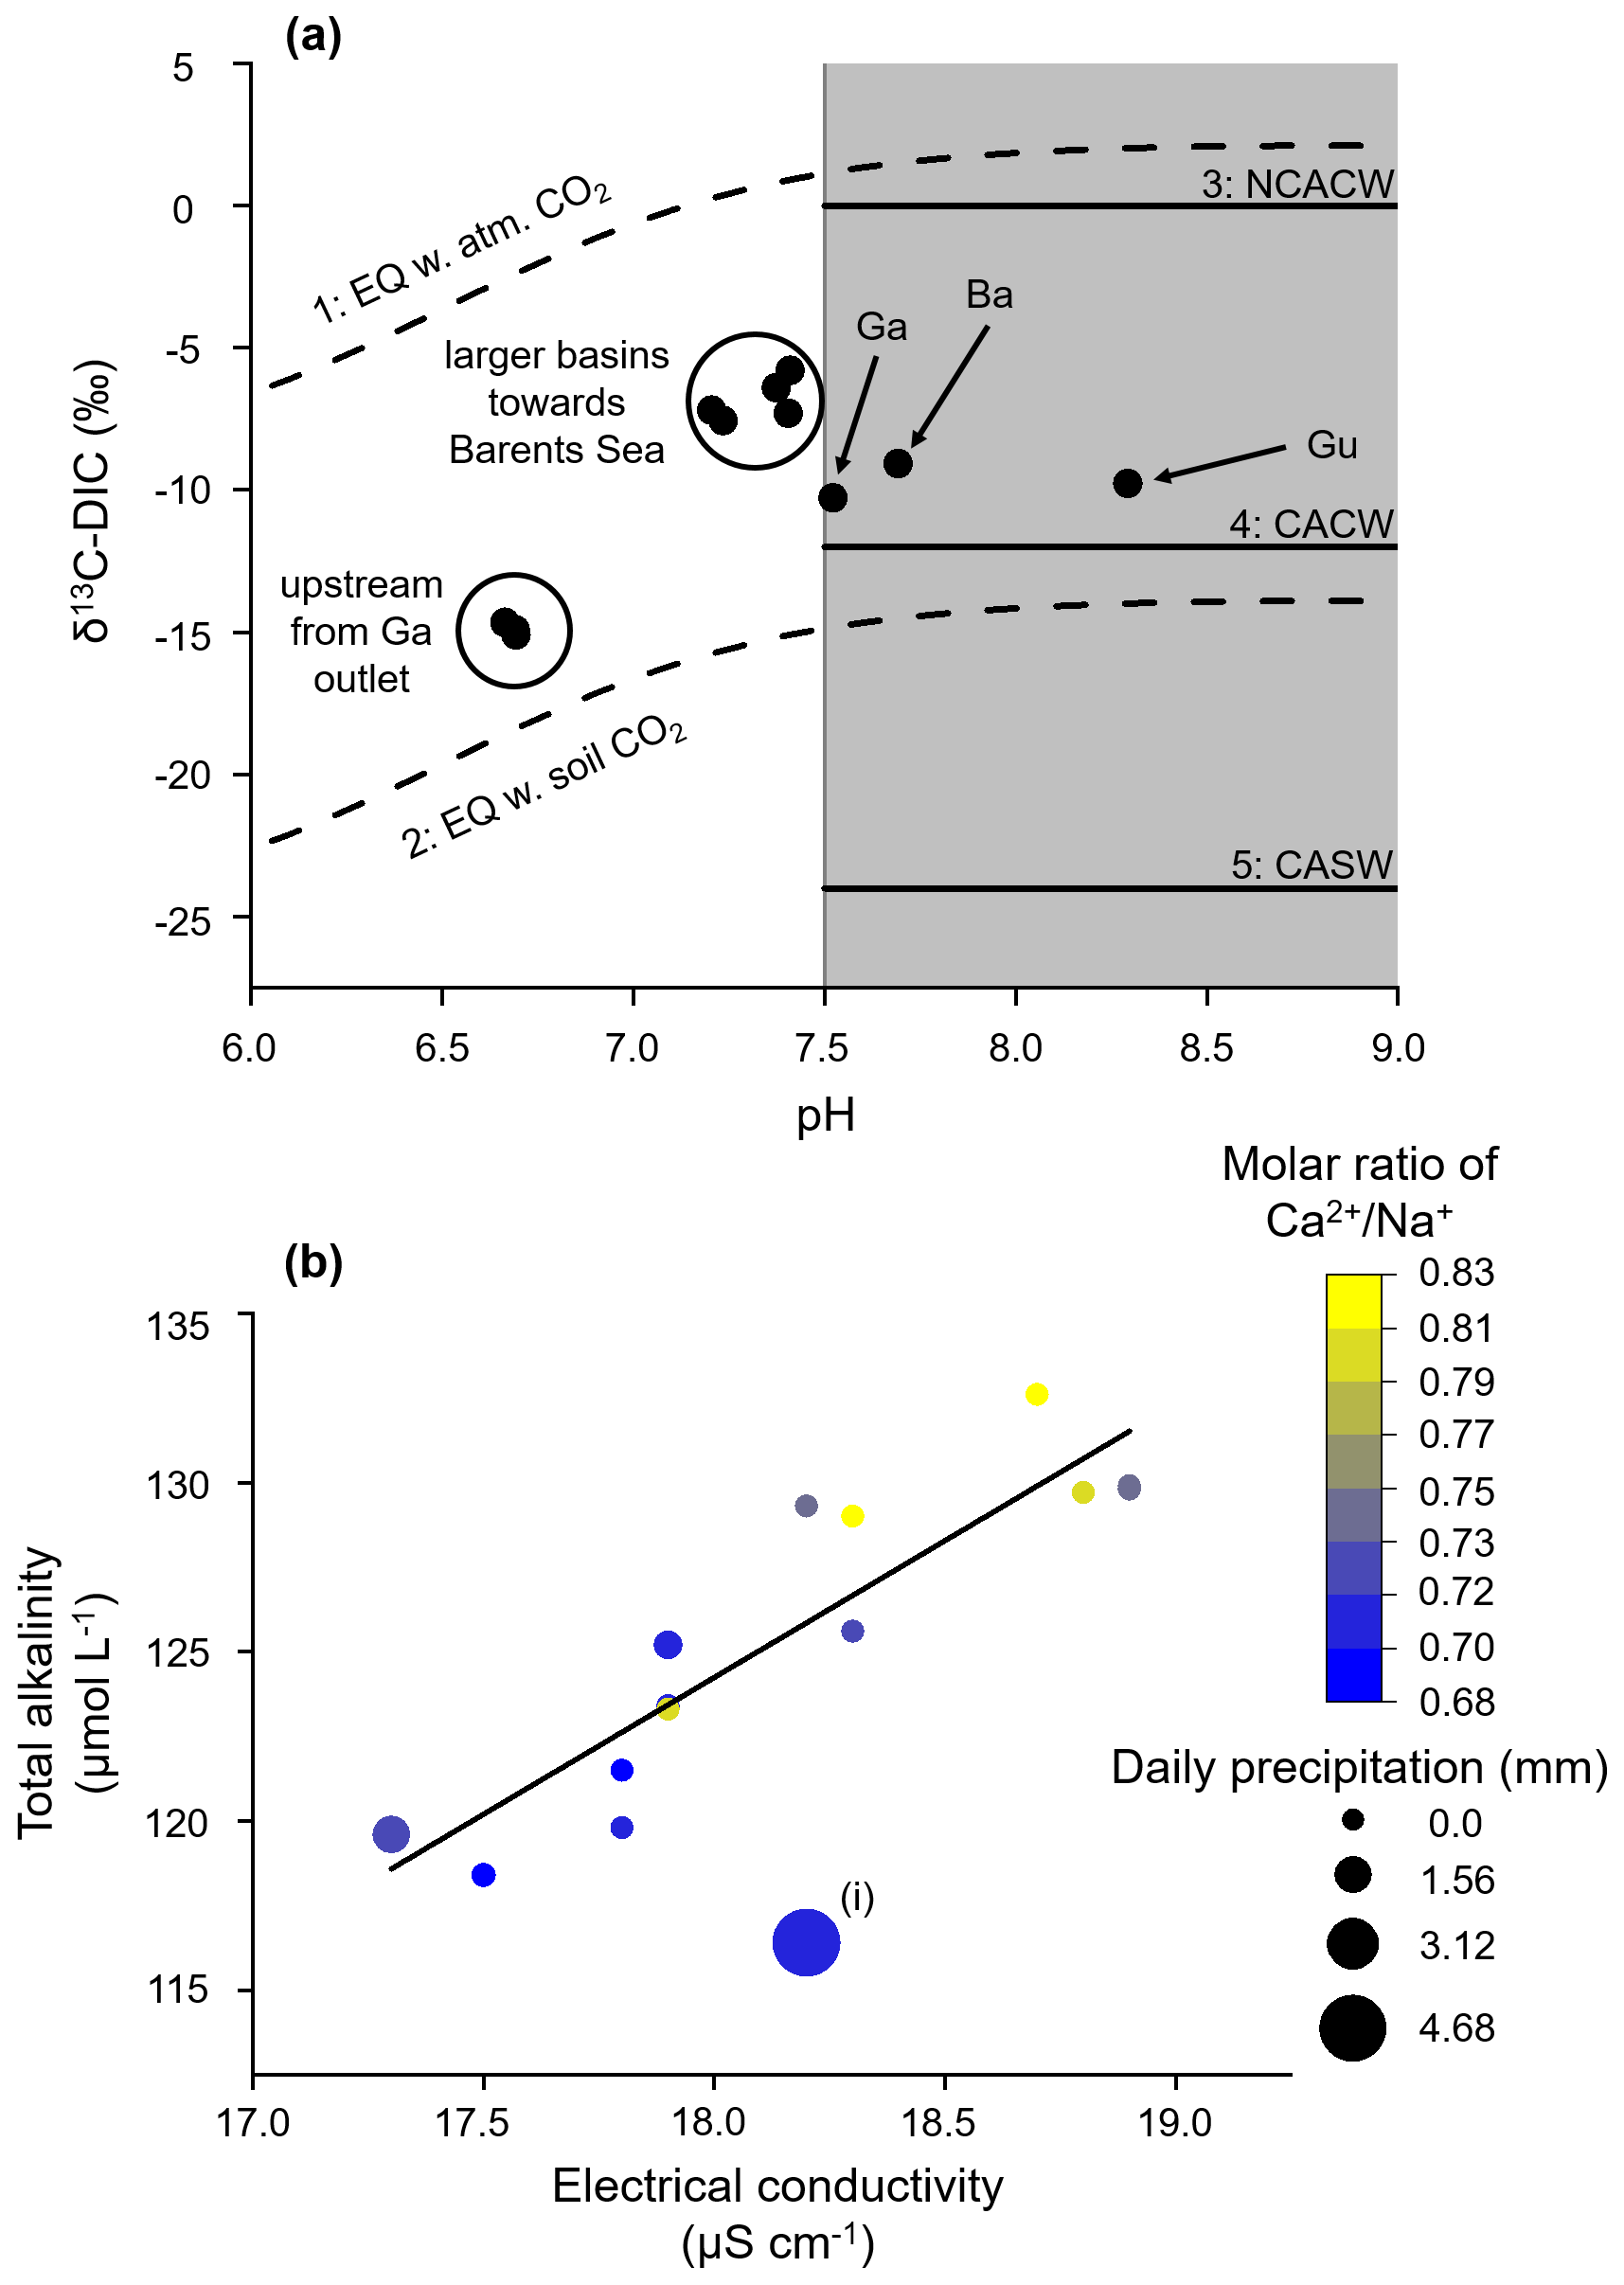
Figure 2Equilibrium vs. kinetically controlled systems. (a) If the pH of the stream water is below 7.5, then the DIC system is equilibrium controlled, meaning that the stream DIC is in equilibrium with a large pool of either atmospheric (1) or soil (2) CO2. The δ13C-DIC values (dashed lines) were calculated based on the temperature-dependent fractionation factors that partition the carbon isotopes among the DIC species (Zhang et al., 1995). If the pH is above 7.5, the DIC system is kinetically controlled and three weathering pathways can be identified. Depending on the δ13C-DIC value, the DIC originates from (3) NCACW (non-carbon-based-acid-induced carbonate weathering), (4) CACW (carbonic-acid-induced carbonate weathering), or (5) CASW (carbonic-acid-induced silicate weathering). Ga is the Gaskabohki catchment, Gu is the Guovzilbohki catchment, and Ba is the Báhkiljohka catchment. The figure was adjusted from Lehn et al. (2017). (b) AT as a function of electrical conductivity for the Gaskabohki catchment. The linear increase in AT with electrical conductivity indicates that mineral weathering is a major control in this catchment (y intercept µmol L−1 and slope coefficient = 8.1). (i) We excluded this data point from the linear regression, as it shows the highest δ18O-H2O value, thus indicating the highest proportion of surface water.
We assumed the δ13C-DIC endmember for carbonic-acid-induced carbonate weathering to be at about −12 ‰, as the vegetation at Iskorasfjellet is of C3 type characterized by a δ13C value of about −27 ‰ (Kjellman et al., 2018). With the diffusive fractionation in low-temperature waters, such as during fall in this subarctic region, causing a positive shift of about 3 ‰, the δ13C value of the CO2 pool would be about −24 ‰ (Deines et al., 1974; Michaelis et al., 1985; Zhang et al., 1995; Lehn et al., 2017). When dissolving carbonate minerals with a δ13C value of about 0 ‰, the resulting δ13C-DIC would thus be about −12 ‰. If the weathering agent is a non-carbon-based acid, the δ13C-DIC endmember for carbonate weathering will be about 0 ‰. As the mean δ13C-DIC of the Gaskabohki catchment was −10.3 (±1.3) ‰, we attribute the alkalinity generation in the basin entirely to the dissolution of accessory carbonate rock by carbonic acid generated from soil respiration. We suggest that the small deviation from the carbonic-acid-induced carbonate weathering δ13C-DIC endmember of −12 ‰ to slightly less negative values is caused by a small contribution from non-carbon-based-acid-induced carbonate weathering. We believe that the primary weathering agent of silicate minerals were non-carbon-based acids with no generation of DIC and AT.
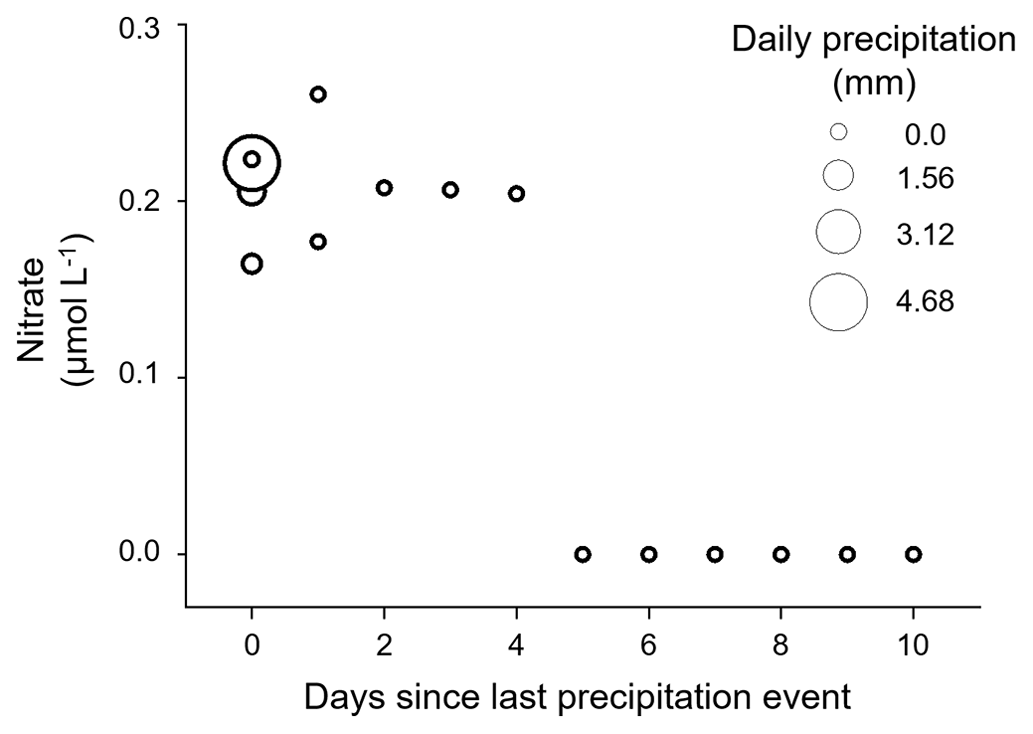
Figure 3A nitrate signal is associated with a precipitation event and the days that follow. On the fifth day after the last precipitation event, we could not detect any more nitrate.
3.1.2 Carbonate weathering by sulfuric acid decreases alkalinity concentration
During the study period, AT was positively correlated with the concentration sum of Ca2+ and Mg2+ (adjusted R2= 0.57, Fig. 4a), which further confirms that alkalinity is produced from carbonate weathering alone. For one equivalent of a divalent cation, we found about two equivalents of alkalinity in our samples, as would be expected from carbonic-acid-induced carbonate weathering (see Eq. 1). AT concentrations that fall below the regression line are associated with a high molar ratio of SO AT. We explain this with Ca2+ and Mg2+ originating from carbonate minerals that were dissolved by sulfuric acid. Thus, SO was generated instead of AT. An indicator of the presence of sulfuric acid in the Gaskabohki catchment is that we observed a negative alkalinity concentration at a theoretical electrical conductivity of 0 (according to the linear regression in Fig. 2b, y intercept = −21.2 µmol L−1). We believe that sulfuric acid balances this negative alkalinity in the Gaskabohki catchment. In addition to sulfuric acid, organic acids could act as weathering agents for the carbonate minerals. Sulfuric acid could be generated from the oxidation of pyrite or reduced sulfur in wetlands or be a remnant of acid rain deposition. Minor occurrences of pyrite are present in the upper parts of the Paleoproterozoic bedrock of the Fennoscandian Shield (Sandström and Tullborg, 2009). As our study area is situated on the Karasjok greenstone belt, which forms the westernmost unit in a Paleoproterozoic tectonic belt (Braathen and Davidsen, 2000), the generation of sulfuric acid by the oxidation of pyrite is a reasonable explanation. Another possibility for the generation of sulfuric acid could be the oxidation of reduced sulfur in wetlands (including permafrost) that accumulates during anoxic breakdown of organic matter. During dry periods or when permafrost thaws, reduced sulfur is oxidized to SO and then typically released into drainage waters during the next flushing event. Even though acid rain deposition has decreased considerably since the end of the last century in northern Norway (Aas et al., 2021), the recovery from acid deposition in deeper soil horizons may be highly delayed (Berger et al., 2016; Marx et al., 2017b). This delayed soil acidification was also observed in southern Sweden, where the B2 horizon did not reach its most acidic conditions until 2013, almost 25 years after the sulfur deposition began to decline (McGivney et al., 2019). Our studied area could be influenced by legacy acid rain distributed area-wide from coal burning or, under the assumption of long-distance transport of pollutants, by the emissions of SO2 from the smelters in Nikel and Zapoljarnij on the Kola Peninsula in Russia (the linear distance between these two sites and Iskorasfjellet is ∼ 200 km). A study of the Tibetan Plateau by Yuanrong et al. (2021) found that the sulfate concentration in glacial and permafrost streams was elevated compared to streams in other landscapes and explained this by condensed storage of acid deposition from long-distance transport during lower temperatures and a release during higher temperatures. Since the main wind directions on the Kola Peninsula in Russia are to the south and to the north (Chekushin et al., 1998) and the Russian smelters are located east of Iskorasfjellet, the sulfuric acid could presumably originate from pyrite oxidation and legacy acid rain deposition from coal burning.
The δ13C-DIC signal also reflects that two different weathering agents in the Gaskabohki catchment dissolve carbonate minerals. It shows a value of about −12 ‰ that is typical of carbonic-acid-induced carbonate weathering at a low molar ratio of SO AT (Fig. 4b). As the ratio increases, so does the δ13C-DIC, suggesting an increased proportion of sulfuric acid as the weathering agent of carbonate minerals. We found that a logistic function better fit the data than a linear regression (adjusted R2= 0.78 and 0.68, respectively), suggesting a change in weathering pathways. Therefore, regarding the CO2 budget impacted by terrestrial weathering, the catchment can switch from a complete CO2 sink to a partial CO2 source. Since the δ13C-DIC depends on the molar ratio of SO AT and shows no correlation to discharge (Pearson correlation coefficient r= 0.02, not significant at p < 0.01), indicative of turbulence, we assume that the influence of CO2 outgassing along the stream on the δ13C-DIC signal at the catchment outlet can be ignored.
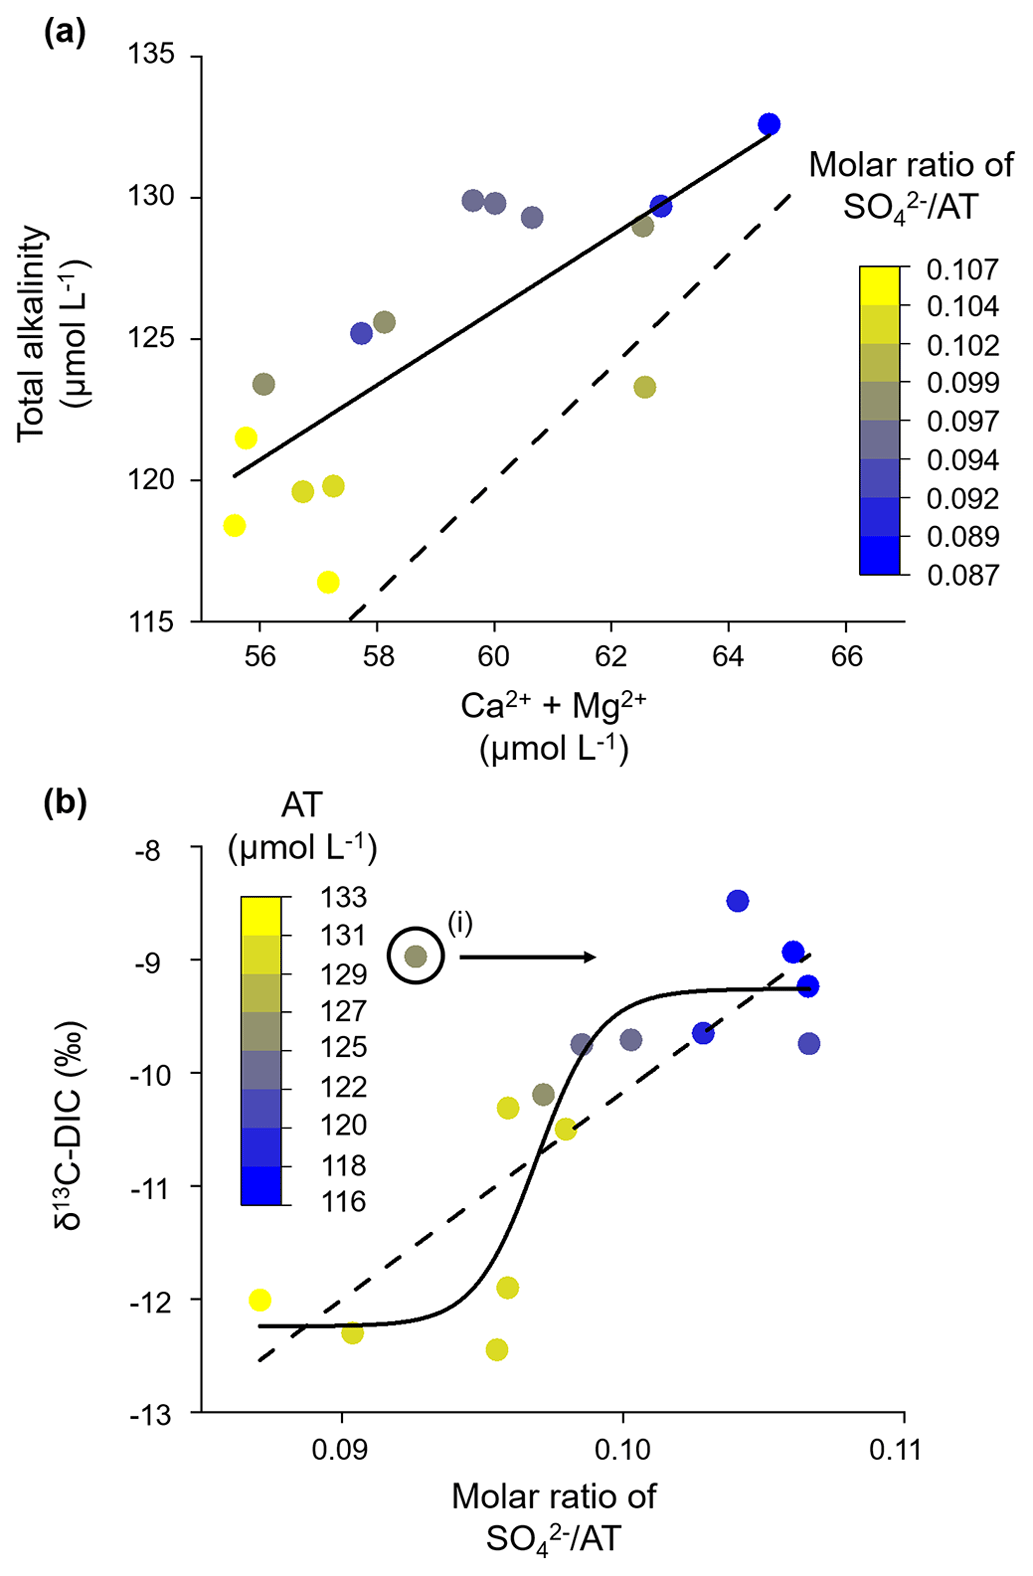
Figure 4Alkalinity generation from carbonic-acid-induced carbonate weathering. (a) AT increases linearly with the concentration sum of Ca2+ and Mg2+. At a constant concentration of divalent cations, AT decreases with increasing molar ratio of SO AT, indicating an increased proportion of carbonate weathering induced by sulfuric acid (release of divalent cations with no generation of alkalinity). The solid line shows linear regression (y intercept = 46.8 µmol L−1; slope coefficient = 1.3), and the dashed line represents the typical molar ratio of carbonic-acid-induced carbonate weathering of AT (Ca Mg2+) of 2:1. (b) The δ13C-DIC value increases with the molar ratio of SO AT. The logistic fit (solid line) yielded a higher adjusted R2 than the linear regression fit (dashed line: y intercept = -28.5 ‰; slope coefficient = 183.3), suggesting that a changeover of weathering pathways explains the δ13C-DIC signal better than a linear relationship. (i) We excluded this data point from both model fits because it has a high pH that likely results from in-stream photosynthesis.
We excluded the point with the highest pH (pH = 9.6) from both data fits, which was characterized by a high δ13C-DIC value and a low molar ratio of SO AT (see point (i) in Fig. 4b), as it most likely experienced in-stream photosynthesis, which would have lowered the SO AT molar ratio that was present when initially released into the stream. It is reasonable to assume the influence of photosynthesis because we collected this sample during the afternoon on a day with a long sunshine duration, which would be ideal conditions for photosynthesis (Fig. 5). In addition, the Gaskabohki stream experiences no or only minimal canopy shading. Therefore, it is likely that in-stream photosynthesis during the course of the day consumed most of the CO2 that was initially produced in the soil and released into the stream, increasing the pH and alkalinity.
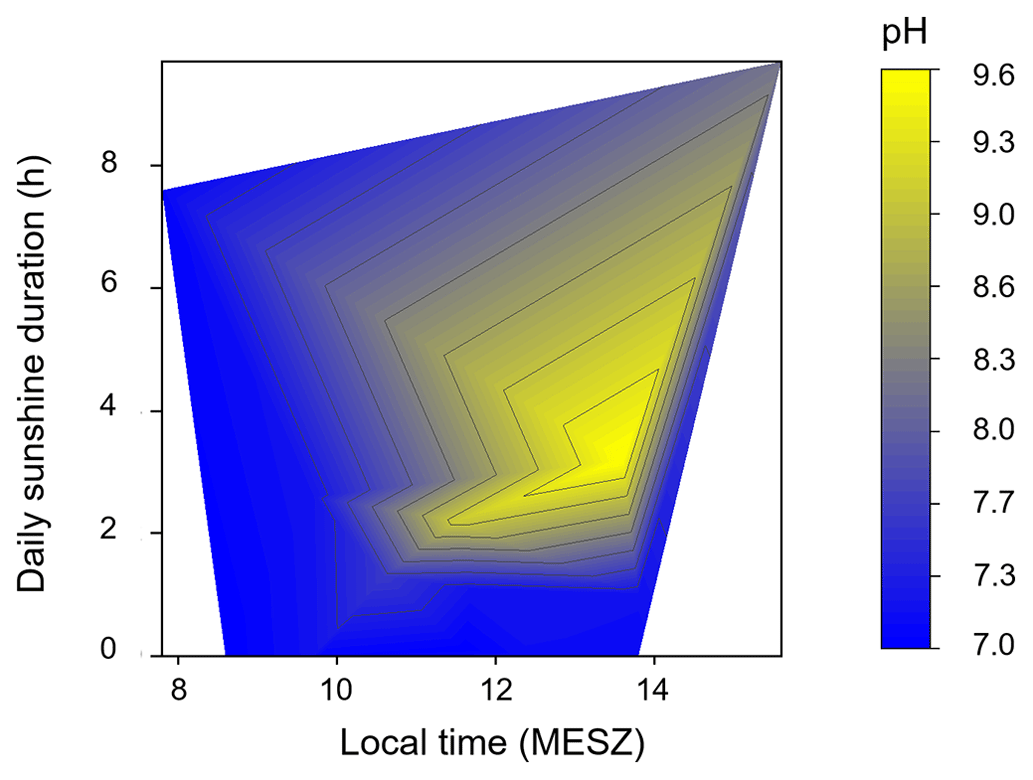
Figure 5Heatmap showing the pH for different sampling times and sunshine durations. A high pH was measured in samples that were taken in the afternoon on a day with a high sunshine duration, indicating in-stream photosynthesis. The pH of samples that were collected in the morning were not affected by a high sunshine duration.
3.1.3 Carbonate-dominated riparian zone controls alkalinity signal
We propose that the AT signal is driven by preferential contribution from two different groundwater sources dominated by different weathering processes. (i) The first source is governed by carbonate minerals being dissolved almost exclusively by carbonic acid, which results in high AT concentrations and a low δ13C-DIC value of about −12 ‰. (ii) The second source is governed by an increased proportion of sulfuric-acid-induced carbonate weathering in which CO2 and sulfate but no AT are produced and δ13C-DIC is shifted to higher values of about −9 ‰ (Fig. 4b). Samples that show an intermediate δ13C-DIC signal of about −11 ‰ to −9.5 ‰ represent a mixing of sources. We suggest that the first source (i) is situated in a wider riparian zone, ∼ 1 km downstream of the spring and thus close to the catchment outlet, representing a hotspot of alkalinity release, and the second source (ii) is stretched out upslope over the remainder of the catchment, representing ∼ 99 % of the entire catchment area.
While almost the entire catchment is underlain by silicates with only accessory calcite from shale as the alkalinity-bearing lithology, the downstream riparian zone coincides with bedrock of partly calcareous quartz feldspar shale. Therefore, the downstream riparian zone that crosses this carbonate-enriched bedrock in the lower reaches of the watershed (Fig. 1d) bears a greater potential for carbonate weathering. In addition to its advantageous lithological properties, we propose that the downstream riparian zone, if not disturbed by a precipitation event, dominates the alkalinity concentration of the Gaskabohki catchment due to an enhanced hydrological connectivity. Increased soil moisture and hydrological flow paths enable both the transport of weathering agent, in the form of soil-respired CO2, to the weatherable material and the transport of weathered products from the groundwater to the stream. That the weathering processes in the carbonate occurrences in the downstream riparian zone are mainly responsible for the alkalinity signal is also reflected in Fig. 2a. While the samples of the three upstream sampling stations, which are characterized by a narrow riparian zone underlain by silicate minerals, are equilibrium-controlled samples and show a low mean HCO CO2 molar ratio of 1.3–1.4, the samples from the catchment outlet, which includes the larger downstream riparian zone crossing through the carbonated-enriched bedrock, are kinetically controlled and show a higher mean HCO CO2 molar ratio of 4.9, indicating enhanced alkalinity generation. Li et al. (2013) also recognized that in the dry season the land cover in the riparian zone explained the major elements in the river much better than the land cover over the entire catchment.
3.1.4 Precipitation event temporarily reduces control of the riparian zone
We found that a larger precipitation event on the fourth day of sampling caused a drastic decrease in AT at the outlet of the catchment, reducing AT to 116 µmol L−1, the minimum value during our sampling campaign (Fig. 6a, “day 0” corresponds to the day of the precipitation event). We explain this as being due to a high proportion of surface water from precipitation that diluted the AT signal. This dilution effect can also be observed for the entire data set when plotting AT as a function of δ2H-H2O: AT generally decreased with increasing δ2H-H2O (Fig. 6b). When surface water mixes with the alkalinity-charged groundwater, the AT concentration measured in the stream is reduced.
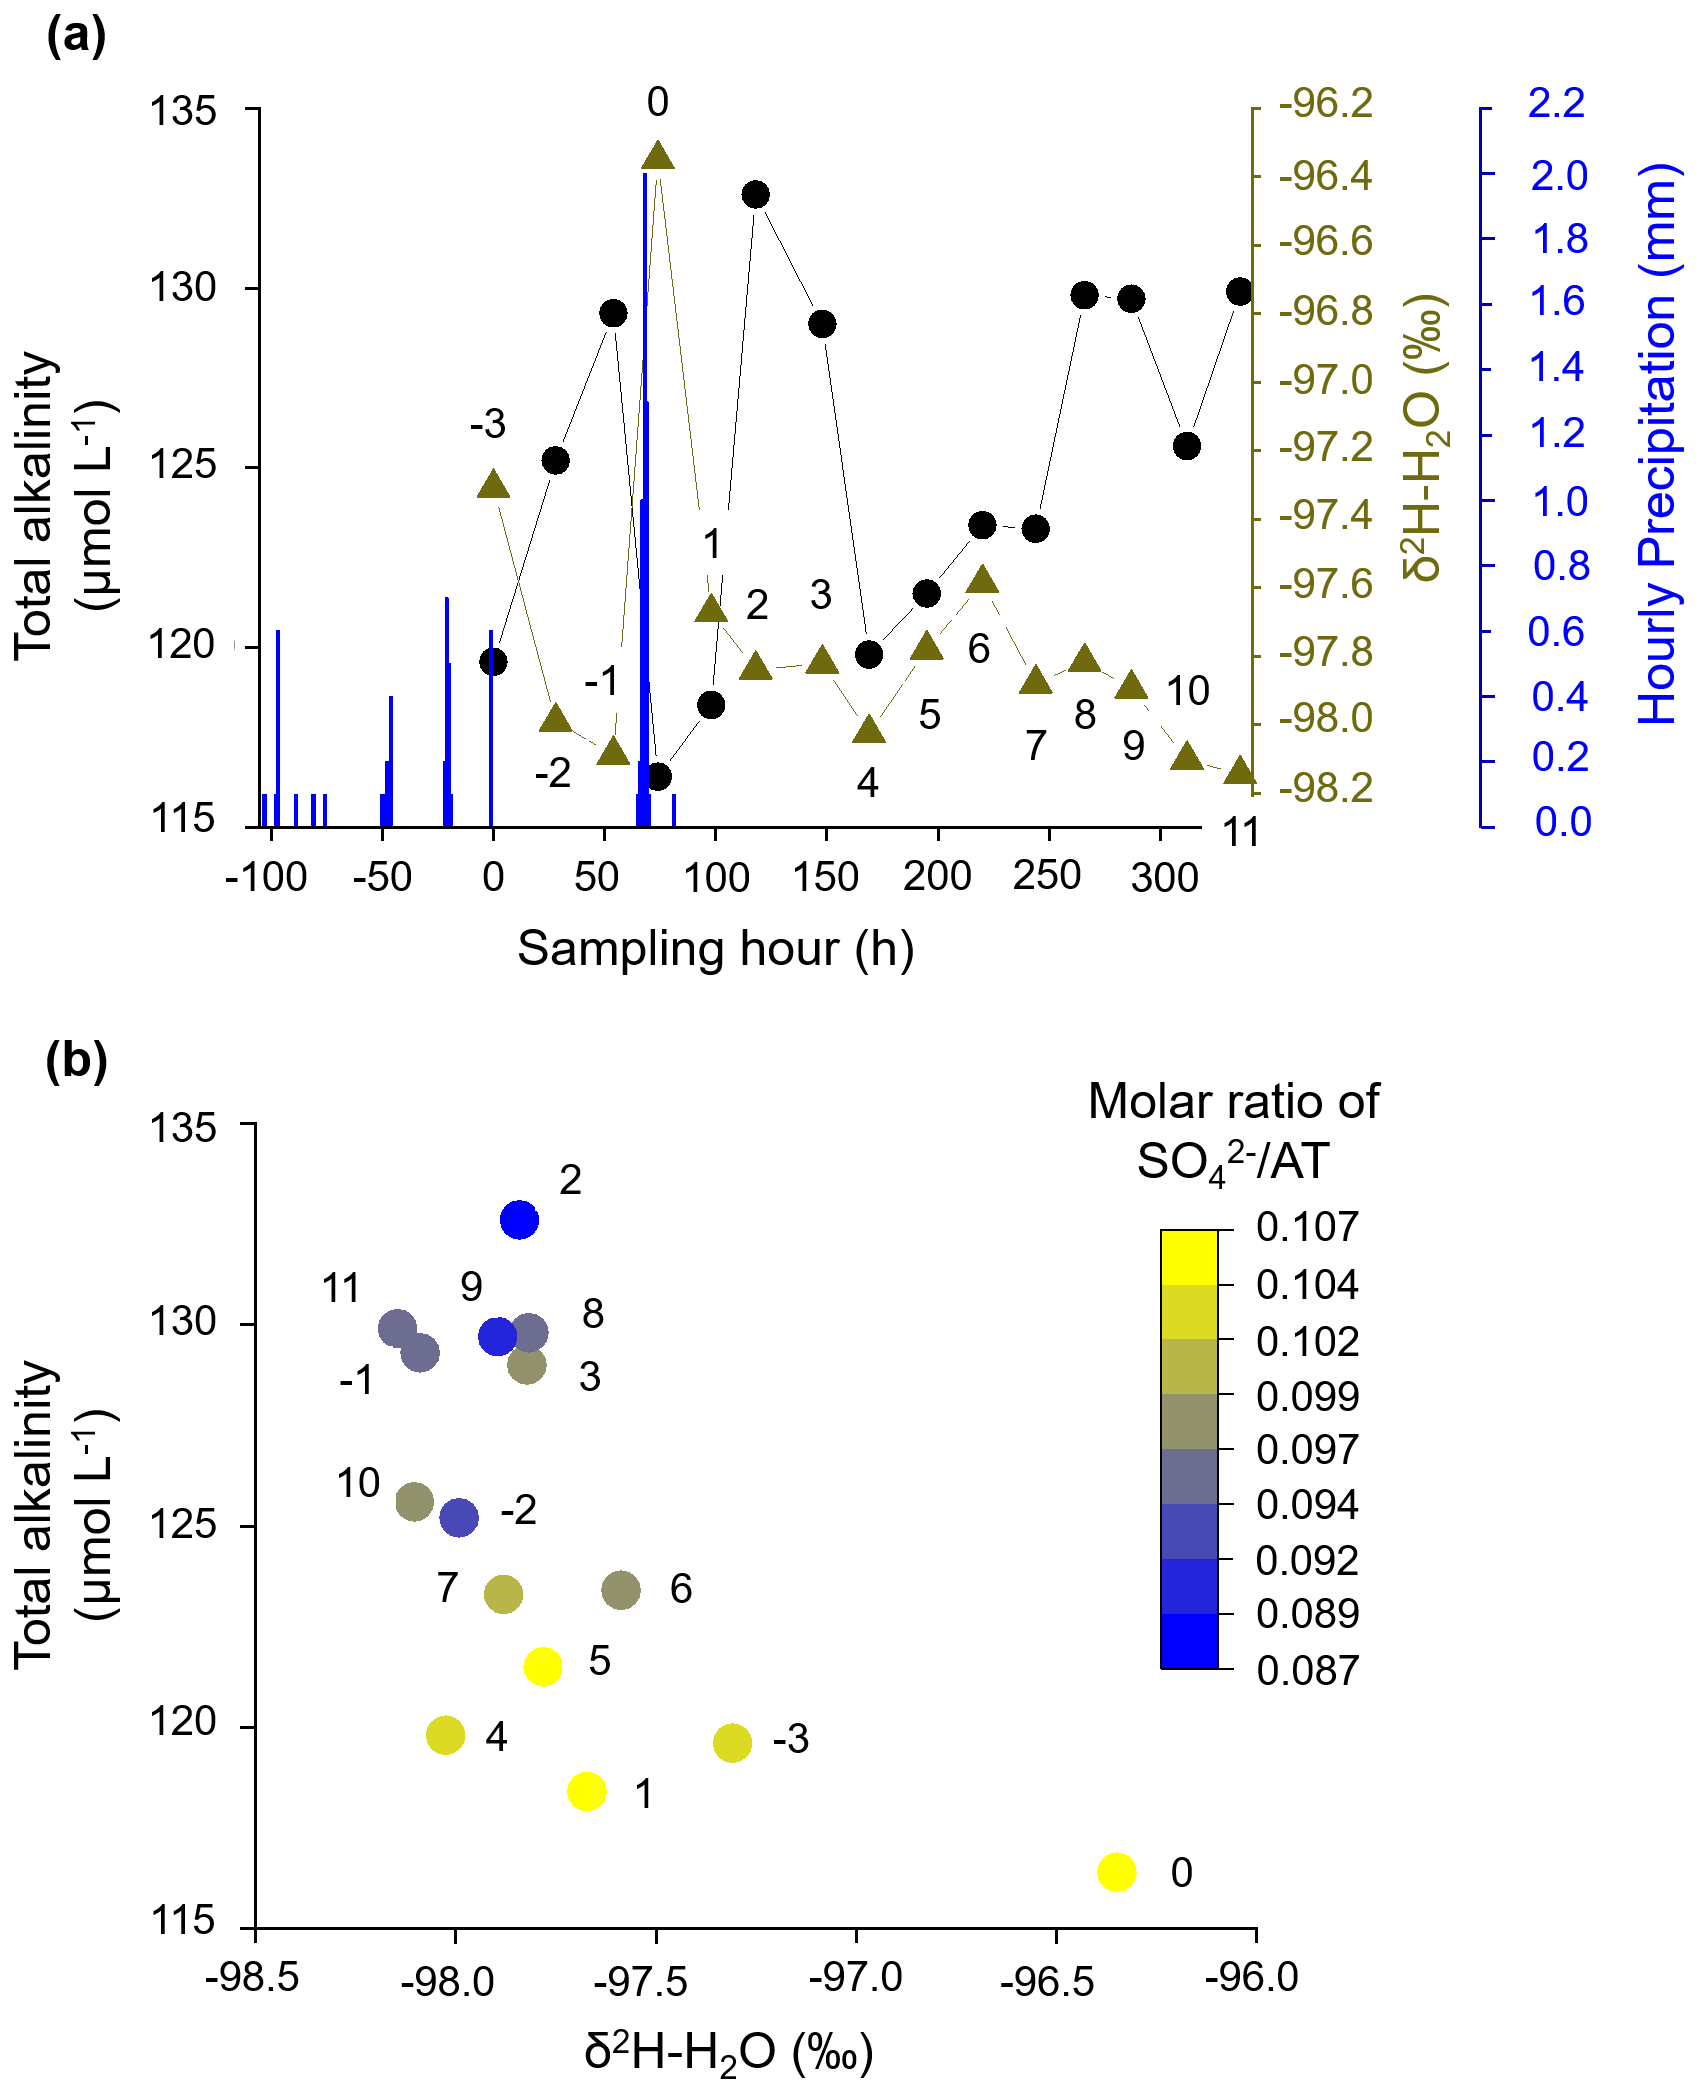
Figure 6Alkalinity concentration is influenced by precipitation. (a) Variation in AT, δ2H-H2O, and hourly precipitation over the course of the sampling campaign. (b) AT decreases with increasing δ2H-H2O, i.e., increasing contribution from surface water. At constant δ2H-H2O, AT decreases with increasing molar ratio of SO AT, indicating an increased contribution from the uphill catchment to the weathering load. Numbers next to data points show the number of days before (negative values) and after (positive values) the major rain event (0).
On the second day after the rain event (“day 2”), the AT concentration increased considerably up to 133 µmol L−1, the maximum value in our time series. This coincided with a minimum molar ratio of SO AT, indicating that groundwater from the downstream riparian zone is maximally distributed to the stream water without being diluted by other sources. Petrone et al. (2007) also found that saturated riparian soils and precipitation mainly influence the storm chemistry for a low-permafrost watershed.
After a fast initial surface water response to the precipitation event (“days 0 and 1”), alkalinity-charged groundwater from the downstream riparian zone dominated the stream water signal (“days 2 and 3”). Consequently, we describe the catchment storage–discharge relationship as a clockwise loop with streamflow responding faster than groundwater. On the fourth day after the precipitation event (“day 4”), the AT concentration is reduced once more to 120 µmol L−1. However, when compared to the last drop in the AT signal directly after the precipitation event (“day 0”), this decrease cannot be explained with dilution from direct surface water, as the δ2H-H2O stayed on a low level. We instead attribute this decrease in AT to an increased contribution from uphill groundwater flow, which is dominated by an increased proportion of sulfuric-acid-induced carbonate weathering, as the molar ratio of SO AT is high. The δ2H-H2O signal slightly increased again (“day 4–6”), indicating a delayed contribution from new water of the precipitation event. We suggest that some of the precipitation did not go directly to runoff but infiltrated the soil of the uphill catchment, mixed with old water, and created delayed runoff (“day 5 and 6”). Similarly, in a study about an Arctic watershed in northern Alaska, McNamara et al. (1997) reported that the storage capacity of the watershed increased in the ongoing thawing season and that in conjunction with this more new water entered the soil and mixed with old water, as opposed to going directly to runoff. Furthermore, this delayed contribution of uphill groundwater to the stream signal is related to generally larger timescales for subsurface processes. Myrabø (1997) and Camporese et al. (2014) found a similar hysteresis in the catchment storage–discharge relationship. For a riparian zone located in a deeply incised glacial till valley in Indiana, USA, Vidon (2012) reported a quick rise in the water table near the stream and a concomitant decrease in hillslope water contributions to the stream during a storm event. In general, shallower water tables, which characterize riparian zones, frequently respond much more strongly to water infiltration than deeper water tables (Meyboom, 1967). Moreover, for most storms, Vidon (2012) observed the development of a water table down-valley gradient. In our study, during the next days after the second decrease in AT (“days 5–8”), the AT signal slowly recovered, which coincided with a decrease in the molar ratio of SO AT, i.e., a declining influence from the uphill catchment (Fig. 6b).
In conclusion, we identify the downstream riparian zone and the hillslope as two key catchment units that exchange water with the stream, as was shown by other authors before (McGlynn and Seibert, 2003; McGlynn and McDonnell, 2003b, a). Usually, in headwater catchments, hillslopes are assumed to be the main contributor to streamflow (Seibert et al., 2009; McGuire and McDonnell, 2010; Vidon, 2012). In our data set, however, we observed that the riparian zone responded more quickly to the precipitation event, probably due to higher antecedent soil moisture and a shallower groundwater table. The stable water isotope composition of all our stream water samples only slightly deviates from the regional and global meteoric water lines (Fig. 7), indicating that the groundwater contribution to stream water most likely originated from shallow groundwater. The average isotopic composition of local precipitation closely reflects the isotopic compositions of shallow groundwater (Fritz et al., 1987). The fall of 2020 was comparatively dry, which may have resulted in particularly pronounced decoupling of uphill groundwater from the stream.
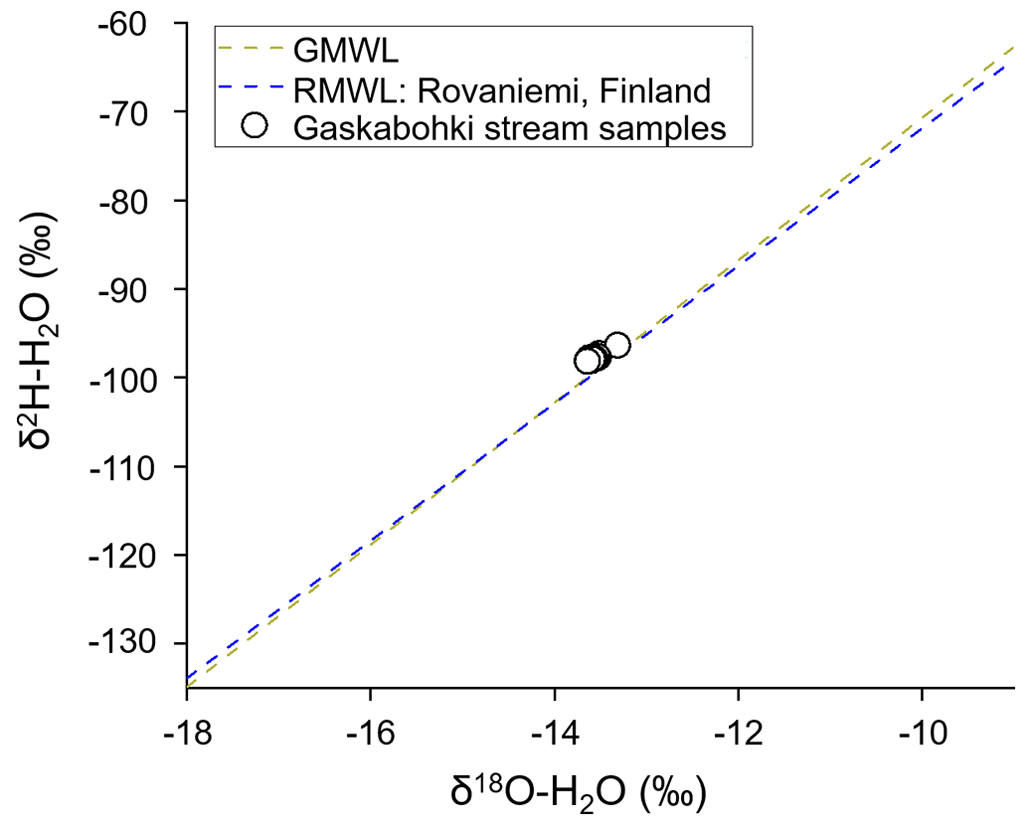
Figure 7Stable water isotope composition. The stable water isotope compositions of the Gaskabohki stream water samples plot closely to the global (GMWL) and regional (RMWL) meteoric water line. The RMWL line (y intercept = 5.6 ‰; slope coefficient = 7.7) is based on monthly integrated samples collected between January 2004 and December 2019 at the GNIP (Global Network of Isotopes in Precipitation) station in Rovaniemi, Finland (International Atomic Energy Agency, 2020).
On the 3 d prior to the major precipitation event (“days −3 to −1”), AT showed an increasing trend, while δ2H-H2O was decreasing. Even though the rainfall intensity on the first day of sampling was not as high as on the fourth day, a contribution of surface water was evident in the δ2H-H2O signal. Therefore, AT was comparatively low at the beginning of sampling, which is due to a longer, albeit less intense, rain period on a few days prior to the first day of sampling and thus dilution by surface water. This longer rain period most likely also activated the release of soil-stored nitrate into the stream, which lasted until the fourth day after the last day with rainfall (Fig. 3). This agrees with observations of Dingman (1971) over a small subarctic catchment with discontinuous permafrost in Alaska, where he found that streamflow recessions are dominated by a combination of throughflow under moss-covered parts of the basin and typical groundwater flow through the moss and soils.
3.1.5 Silicate weathering with minor alkalinity generation
Based on the δ13C-DIC signal and the Na (Ca Mg2+) and SO AT molar ratios (see below), we suggest that the products from silicate weathering originate to a large extent from sulfuric-acid-induced silicate weathering and are from groundwater of the uphill catchment upstream of the carbonate hotspot riparian zone. Accordingly, these products appear to have the same place of origin as the products from weathering of the accessory calcite minerals from shale, which are increasingly released by sulfuric-acid-induced weathering from the uphill catchment. Except for this downstream riparian zone, the entire catchment is underlain by silicates with only accessory calcite from shale as the alkalinity-bearing lithology. Based on the δ13C-DIC signal, silicate bedrock is dissolved by sulfuric acid alone, with no generation of DIC. However, some excess alkalinity remains when balancing AT with divalent cations (see dashed line in Fig. 4a, representing the typical molar ratio of carbonic-acid-induced carbonate weathering of AT (Ca2+ + Mg2+) of 2:1). Therefore, we assume that silicate rocks are also weathered by carbonic acid to a small extent. However, when carbonic acid becomes available through soil respiration, it preferentially reacts with the accessory carbonate minerals due to faster dissolution kinetics. Weathering of silicate rocks in the Gaskabohki catchment contributes only minimally to CO2 fixation. Interestingly, theoretical alkalinity production through carbonate weathering (dashed line) deviates most from actual production (solid line) at low concentration sums of Ca2+ and Mg2+ and high molar ratios of SO AT. These are the data points that we associate with increased groundwater contribution from the uphill catchment area, where silicate rock clearly dominates the composition of underlying bedrock over accessory carbonate from shales.
In Sect. 3.1.4, we used the molar ratio of SO AT as an indicator for the solute contribution from the uphill catchment to the stream water signal at the catchment outlet. This molar ratio is positively correlated with the molar ratio of Na (Ca2+ + Mg2+) (adjusted R2= 0.72), indicating that SO AT can also be used as a tracer for solute contributions from uphill silicate weathering (Fig. 8a). When the silicate cationic load increases in relation to the carbonate cationic load (Na (Ca Mg2+)), AT linearly decreases (adjusted R2= 0.65, Fig. 8b). As silicate bedrock is weathered by sulfuric acid, Na+ and SO are the main weathered products from silicate weathering in the groundwater in the uphill catchment, with no generation of AT.
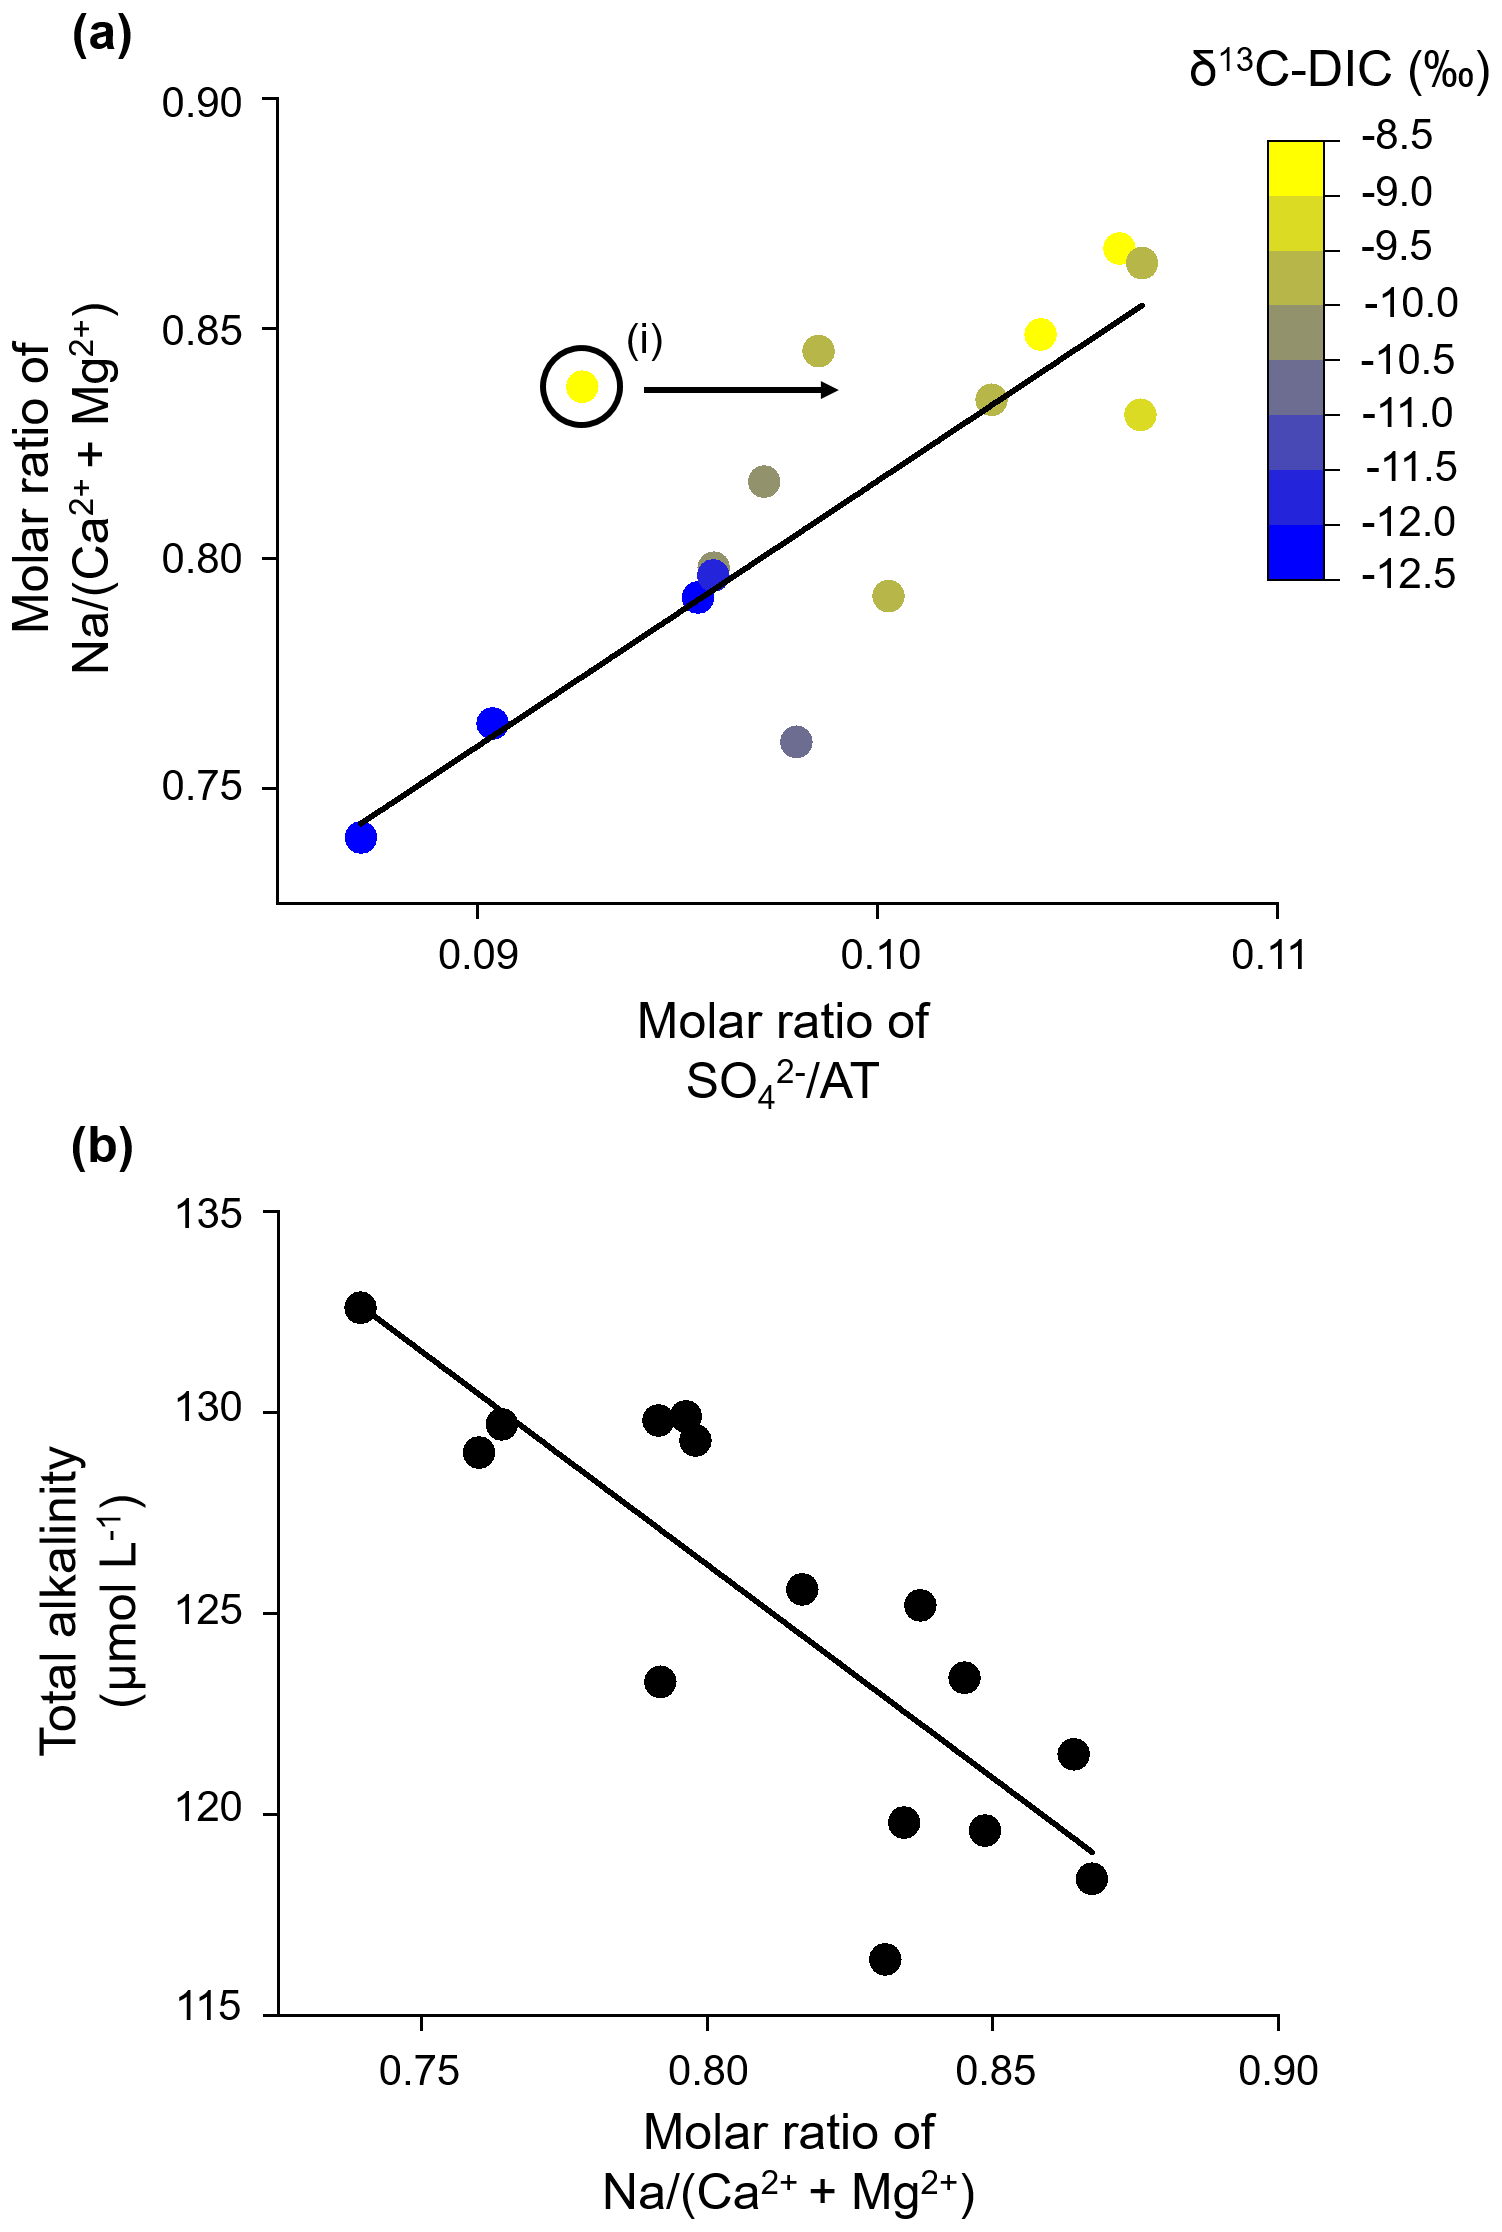
Figure 8Uphill silicate weathering. (a) The molar ratio of Na (Ca Mg2+) increases linearly with the molar ratio of SO AT, indicating that the uphill silicate cation load behaves similarly to the weathering load originating from sulfuric-acid-induced carbonate weathering. (i) We excluded this data point from the linear regression (y intercept = 0.24; slope coefficient = 5.8) because it has a high pH that likely results from in-stream photosynthesis. (b) AT decreases linearly with the molar ratio of Na (Ca Mg2+), indicating that AT is only minimally released from the weathering of the abundant silicate bedrock. Instead, sulfuric acid acts as the main weathering agent (linear regression: y intercept = 211.1 µmol L−1; slope coefficient = −106.1).
3.1.6 Availability of weathering agent
The Gaskabohki stream was on average undersaturated with CO2 (pCO2= 371 (±219) ppm) with respect to atmospheric pCO2 but reached a maximum pCO2 of 651 ppm. By investigating a global compilation of streams and rivers, Marx et al. (2017a) found that catchments with areas up to 500 km2 show consistently high maximum pCO2 values of ∼ 80 000 ppm. The maximum value we measured during the sampling period in fall 2020 was 2 orders of magnitude lower. This discrepancy can be explained by the fact that soil respiration in this subarctic region is generally lower compared to the global average, as annual soil respiration decreases with latitude (Warner et al., 2019). Furthermore, with decreased temperatures in the fall, soil respiration was reduced when compared to the summer, during which soil respiration is highly elevated. In a study about CO2 supersaturation in a temperate hardwood-forested catchment, soil pCO2 was modeled between 907 ppm in winter and 35 313 ppm in summer (Jones and Mulholland, 1998). Another study about soil respiration in permafrost-affected tundra and boreal ecosystems in Alaska and northwestern Canada also recognized the summer as the main period of annual soil respiration and calculated that summer months contributed to 58 % of the regional soil respiration, winter months contributed to 15 %, and the shoulder months contributed to 27 % (Watts et al., 2021).
As the mean pH at the “Gaskabohki 1” sampling station, located ∼ 700 m upstream of the outlet and ∼ 400 m downstream of the spring, was 6.7 (±0.0), and thus DIC was present in the form of CO from respiration of terrestrial organic matter and HCO from rock weathering, we were able to model the initial CO2 released from soils to surface waters according to the streamCO2-DEGAS model by Polsenaere and Abril (2012). We then used this modeled upstream soil pCO2 as a proxy for the entire Gaskabohki catchment, to which the streamCO2-DEGAS model could not be applied, as the mean pH at the outlet was 7.5 (±0.8); hence, most of DIC was only in the form of HCO. With a mean modeled soil pCO2 of 2009 (±471) ppm during fall 2020, the Gaskabohki catchment is characterized by a rather low soil respiration signal when compared to a basin with similar catchment characteristics but with an annual average temperature of 5.5 ∘C, situated in northern Czech Republic, which showed a modeled soil pCO2 of 1828–94 454 ppm during fall 2014 (Marx et al., 2018). Our mean modeled soil pCO2 was likely lower due to lower temperatures and less rainfall. When the assumed value for the proportion of non-carbon-based-acid-induced alkalinity generation is increased from 0.2 to 0.4, the modeled soil pCO2 decreases by 13 % to 1755 ppm. Thus, a moderate change in the assumed proportions of weathering agents results in a change in soil pCO2 that is within 1 standard deviation. We consider an even higher value than 0.4 to be unrealistic, since we were able to show that the alkalinity was generated from weathering by carbonic acid. A more pronounced effect on modeled soil pCO2 occurs when the assumed proportion of in-stream respiration is increased. When the value is raised from 0.1 to 0.4, modeled soil pCO2 increases by 52 % to 3044 ppm. This value is no longer within 1 standard deviation of the original assumed conditions. Compared to the variations in soil pCO2 determined by Marx et al. (2018) for the basin in the Czech Republic, the effect we found is small, and soil pCO2 remains at a comparatively low level.
These comparatively low values might explain why the abundant silicate bedrock is almost exclusively weathered by sulfuric acid instead of carbonic acid from soil respiration. When carbonic acid is available, it mainly reacts with the accessory carbonate in the shale layers due to more favorable reaction conditions. We propose that only in the riparian zone along the channel, where soil moisture is highest, is soil-respired CO2 efficiently transported down to the weathering zone.
When looking at individual pCO2 values in the stream at the “Gaskabohki 1” sampling station, we recognized that a precipitation event caused the highest pCO2, and when no rain fell, a higher temperature resulted in a higher pCO2. We explain this finding with precipitation causing an increased connectivity of CO2-rich soil solutions with the stream, comparable to the increased washout that we observed for soil-stored nitrate (Fig. 3), and higher temperatures causing increased soil respiration.
We propose that the in situ weathering rates of carbonate minerals by carbonic acid are moderately activated in the fall due to relatively low CO2 levels. We suggest that these rates are highest during the summer time, when soil respiration is most activated by elevated temperatures. During that time, groundwater concentrations of alkalinity from carbonic-acid-induced carbonate weathering should be highest. Therefore, we propose that the efficient hydrological flow paths in the downstream riparian zone facilitate the transport of soil CO2 to the weathering zone, being mainly responsible for maintaining high AT concentrations in the Gaskabohki stream.
3.2 Controlling factors on alkalinity across watershed scales
No rain fell on the 2 d on which we extended the sampling to the further catchments up to the Tanafjord. In addition, no precipitation was detected up to 7 d before. Thus, a dilution effect did not need to be considered. Accordingly, we compared the alkalinity concentration without further normalization, and an unconstrained investigation of the factors influencing alkalinity production should be granted.
3.2.1 Decreasing permafrost probability enhances hydrological connectivity
First, we will compare the three catchments, which are all situated on the mountainside of Iskorasfjellet: Gaskabohki, Báhkiljohka, and Guovzilbohki. Compared to the Gaskabohki catchment, the Báhkiljohka catchment shows a higher stream water pH, which therefore plots further to the right in Fig. 2a, moving more to the site of the end-members for kinetically controlled mineral weathering reactions. The Báhkiljohka catchment shows a larger catchment area and a lower permafrost probability than the Gaskabohki catchment (Table 1). Even more dominated by kinetically controlled mineral weathering reactions, however, is the Guovzilbohki catchment. This watershed is a headwater catchment like the Gaskabohki catchment. In contrast to the Gaskabohki catchment, whose bedrock area is only 0.5 % partly calcareous quartz feldspar shale, about half (54 %) of Guovzilbohki watershed is underlain by this carbonate-enriched bedrock. The Báhkiljohka catchment is characterized by an intermediate proportion (35 %) of carbonate-containing lithology. Even though the areal carbonate extent in the Báhkiljohka catchment is not as high as in the Guovzilbohki catchment, it shows the highest AT concentration of 586 µmol L−1 (Fig. 9a). We assume that if a certain level of carbonate-containing lithology is present in the catchment, catchment area and permafrost probability control alkalinity generation. This is evident when AT measured in all the catchments studied is plotted as a function of permafrost probability (Fig. 9b). AT linearly decreases with permafrost probability (adjusted R2= 0.28). Decreases in HCO flux with increasing permafrost probability were also observed by Tank et al. (2012) for a catchment across the circumboreal realm. While permafrost probability, lithology, and catchment area are first- and second-order controlling factors on alkalinity concentration, terrain roughness, EVI, and peat cover seem to play a subordinate role in our data set. However, we found that AT generally decreases with increasing terrain roughness and decreasing peat cover, with the Báhkiljohka catchment being an outlier in both correlations. Finally, we recognized a high degree of multicollinearity between permafrost probability and EVI (adjusted R2 when plotting EVI as a function of permafrost probability of 0.63).
Table 1Various catchment properties of the sampled streams and rivers.
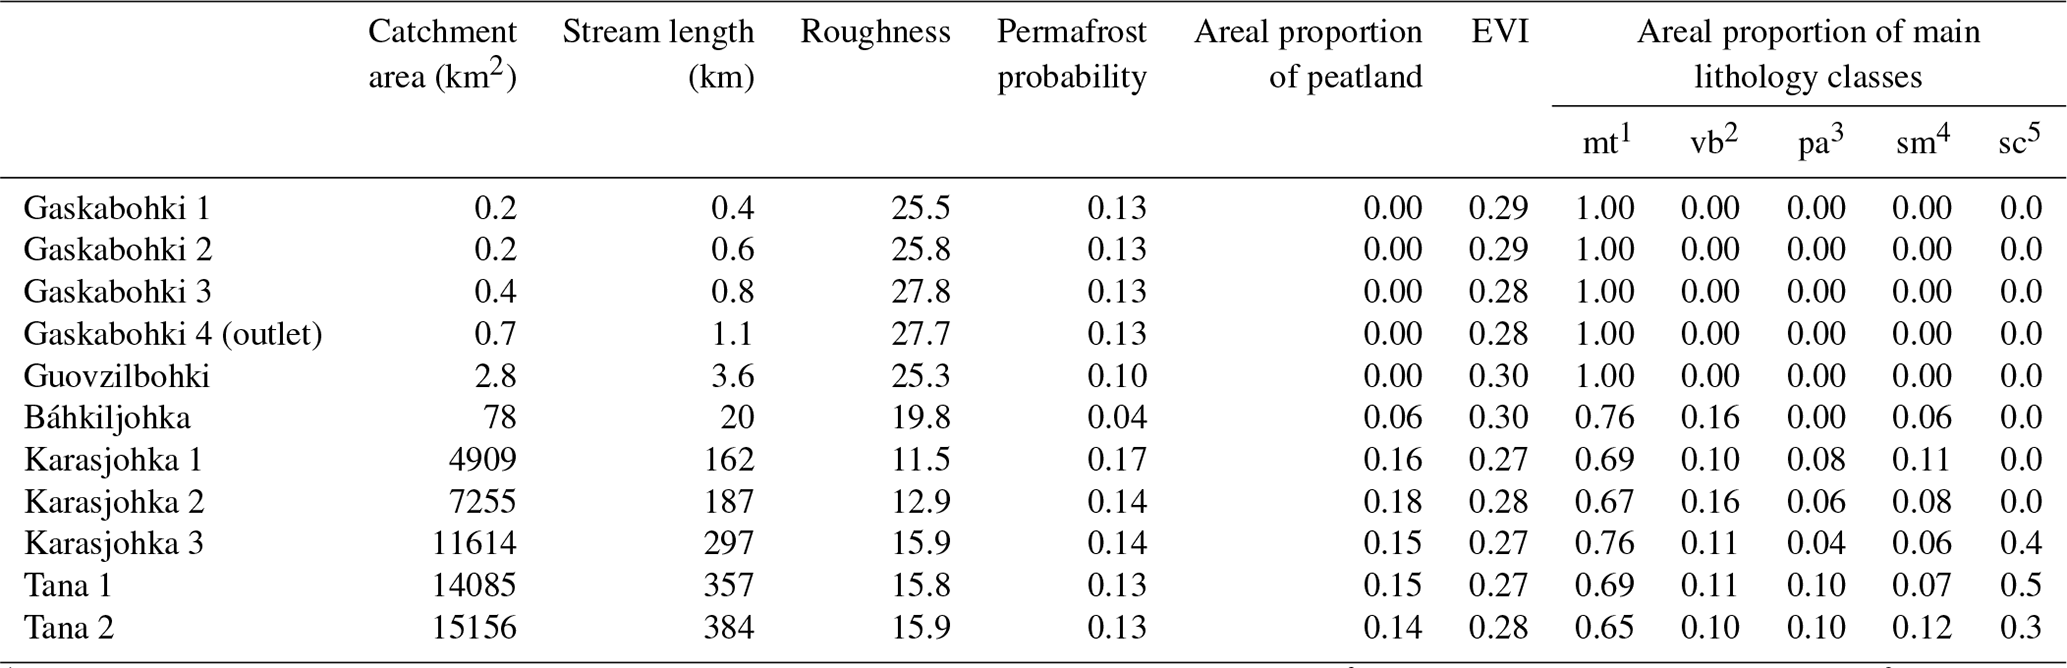
1 The abbreviation mt indicates metamorphics (“wide variety of rocks from shales to gneiss, from amphibolite to quartzite”). 2 The abbreviation vb indicates basalt-type rocks. 3 The abbreviation pa indicates plutonic rocks containing quartz. 4 The abbreviation sm indicates mixed sedimentary rocks (“carbonate is mentioned but not dominant”). 5 The abbreviation sc indicates carbonate sedimentary rocks (Hartmann and Moosdorf, 2012).
As discussed in Sect. 3.1 in detail for the Gaskabohki catchment, it seems that alkalinity generation is limited by the contact of weathering agent (CO2 from soil respiration) with weatherable material and the transport of the weathered products out of the weathering zone into the stream. In the Gaskabohki catchment, the saturated riparian zone facilitates this hydrological transport. In the Báhkiljohka catchment, which shows the highest AT concentration, the low permafrost probability is most likely responsible for enhanced hydrological connectivity. In another study about the effects of permafrost loss on discharge from a wetland-dominated, discontinuous permafrost basin, Stone et al. (2019) reported that total annual discharge from the channel fen decreased by 2.5 % for every 10 % decrease in permafrost area due to increased surface storage capacity, reduced runoff efficiency, and increased landscape evapotranspiration.
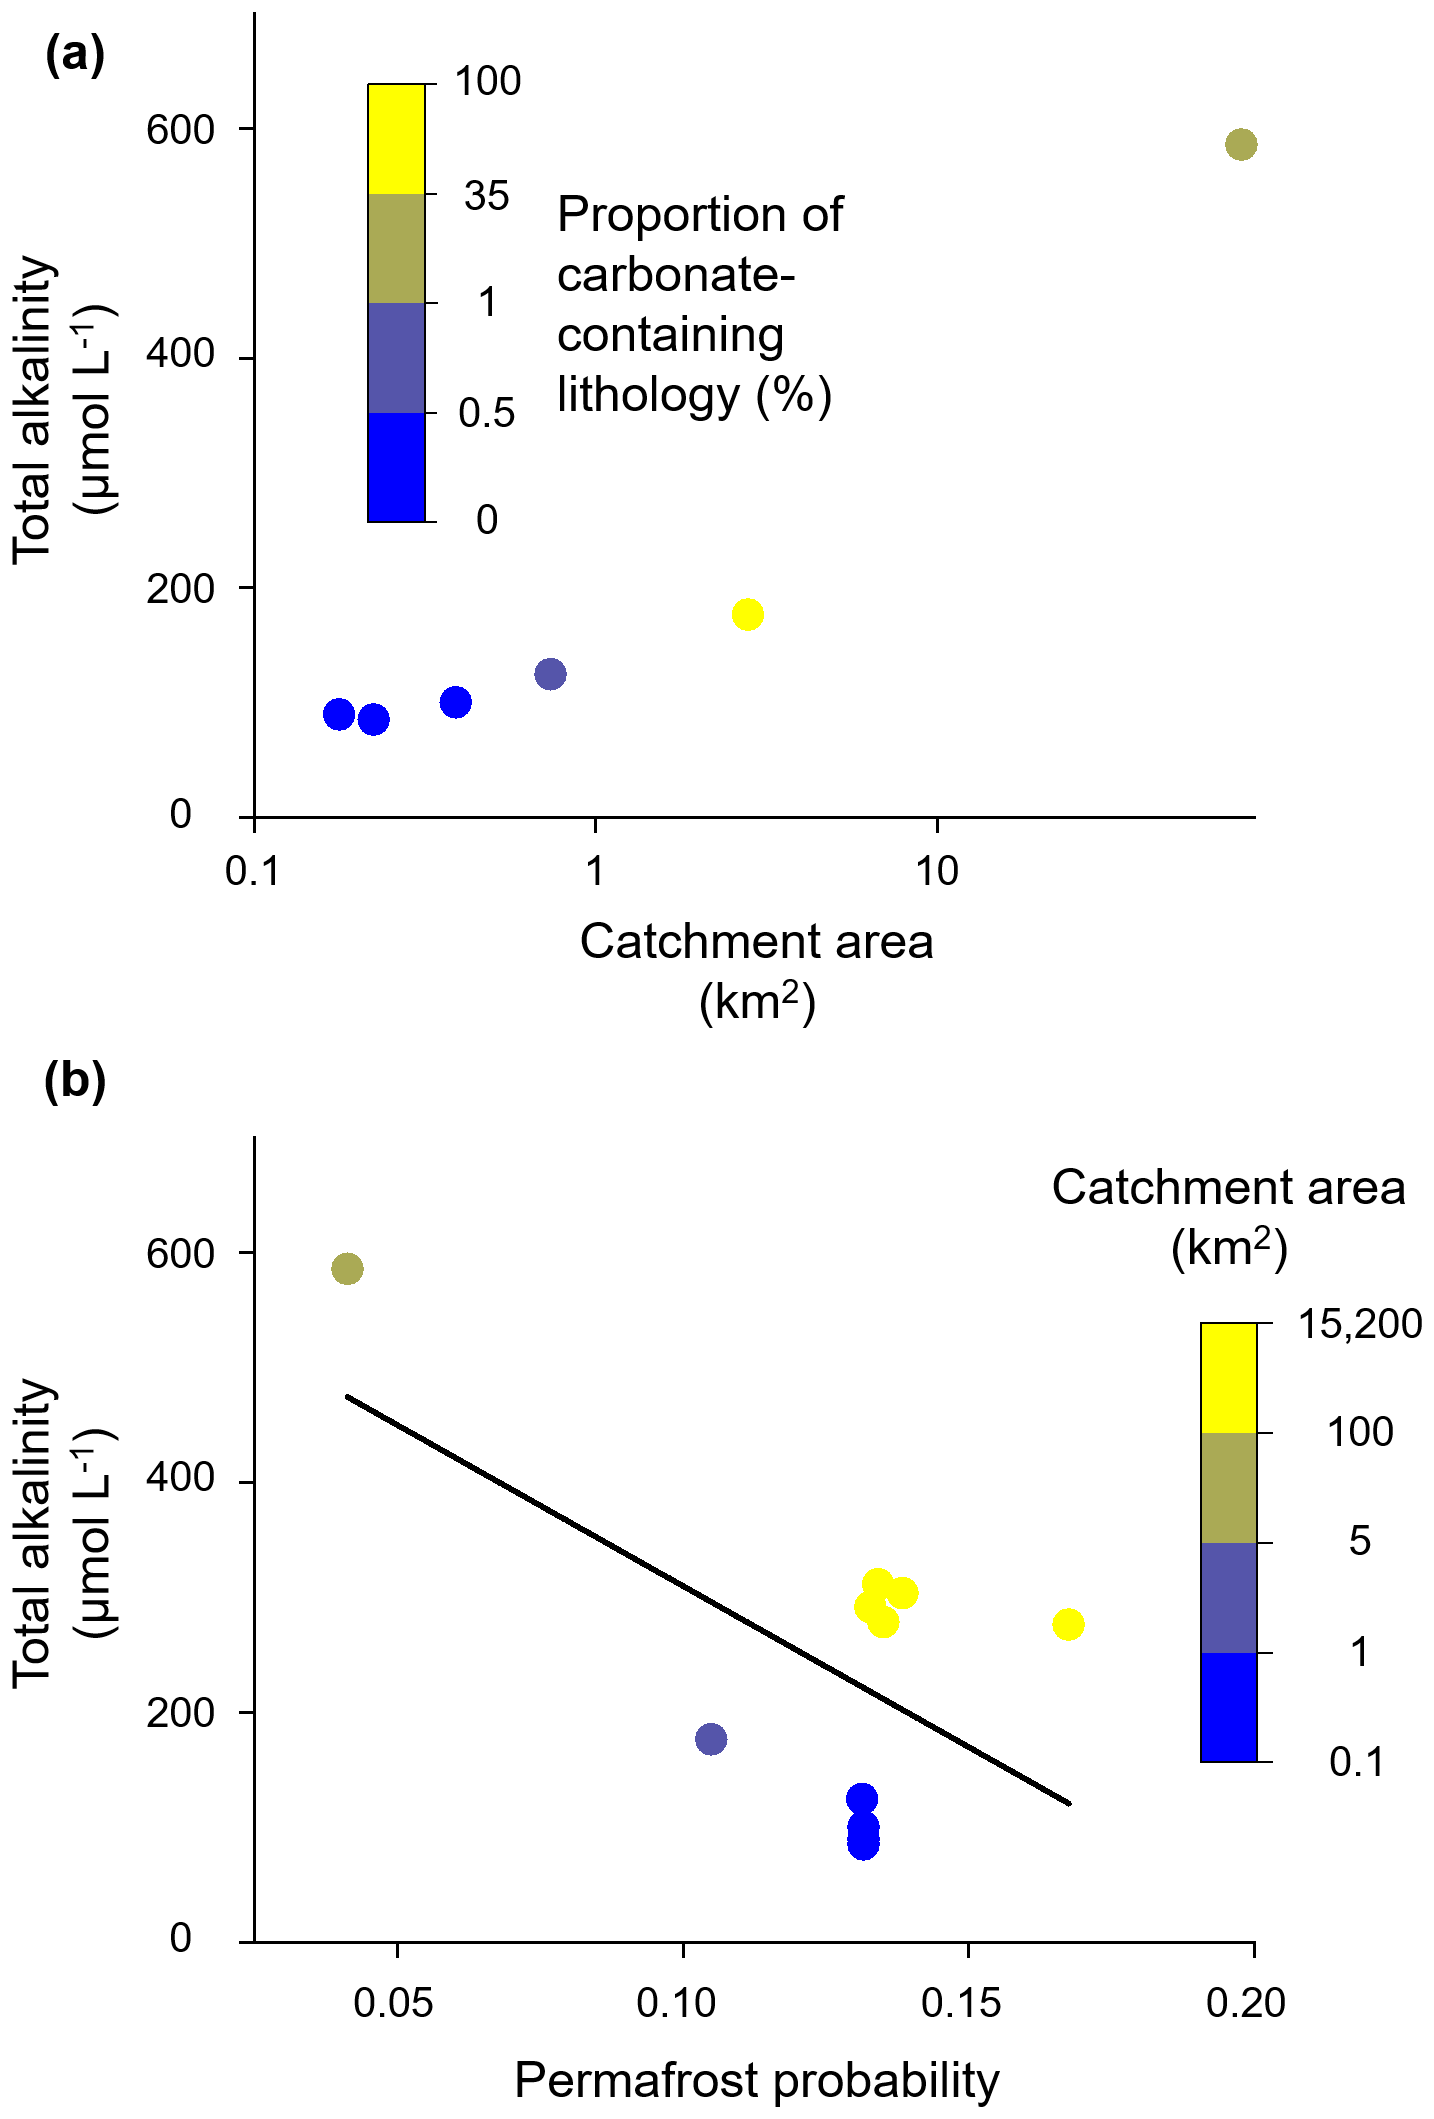
Figure 9Controlling factors on alkalinity concentration across watershed scales. (a) At Iskorasfjellet, AT increases with catchment area and the proportion of carbonate-containing lithology. (b) At a larger spatial scale, AT is controlled by permafrost probability, with a low permafrost probability being associated with a high AT concentration. At a similar permafrost probability, a larger catchment area yields a higher AT concentration (linear regression: y intercept = 590.0 µmol L−1; slope coefficient = −2800.6).
At constant permafrost probability and thus similar hydrological conditions, AT increases with catchment area. From the in-depth study of the Gaskabohki catchment, we found that a precipitation event resulted in the highest turbidity values, which we associate with increased sediment supply to the stream. Therefore, intense precipitation events have the potential to activate the fluvial transport of suspended sediment supply downstream. This new material, together with the surface water, most likely leaves the headwaters quickly. In the larger rivers downstream, however, this material can undergo several weathering cycles, increasing alkalinity. From decade-long hydrometeorological and biogeochemical observations of catchments in the High Arctic, Beel et al. (2021) deduced that increased late summer rainfall enhanced terrestrial–aquatic connectivity for dissolved and particulate material fluxes. Zolkos et al. (2020) showed that this particulate material, in their study on retrogressive thaw slumps, can rapidly weather during fluvial transport within runoff.
The DIC systems of the three small subcatchments situated within the Gaskabohki headwater catchment and the five larger catchments that drain into the Barents Sea are equilibrium controlled (Fig. 2a). However, while the DIC species of the three small catchments mix with biotic CO2, the DIC species of the five larger basins are instead in exchange with atmospheric CO2. For undisturbed headwater catchments on the Peel Plateau in Canada, Zolkos et al. (2020) also reported that stream chemistry reflected CO2 from soil respiration processes.
3.2.2 Alkalinity generation from carbonate weathering – from Iskorasfjellet to the Tanafjord
As we found in Sect. 3.1.2 for the Gaskabohki catchment on the temporal scale, AT also linearly increases on the spatial scale with the concentration sum of Ca2+ and Mg2+ (adjusted R2= 0.98; see Fig. 10a). Therefore, we propose that alkalinity is produced from carbonate weathering by carbonic acid in all basins that we studied – from Iskorasfjellet to the Tanafjord. While the Gaskabohki and Guovzilbohki headwater catchments with the two smallest concentration sums of Ca2+ and Mg2+ show the characteristic molar ratio of AT (Ca Mg2+) of 2:1, indicative for carbonate weathering by carbonic acid (see the dashed line in Fig. 10a), the larger catchments show a reduced molar ratio. This decrease coincides with an increase in the molar ratio of SO AT, suggesting that the carbonate minerals are increasingly dissolved by sulfuric acid. In addition to the Gaskabohki catchment, sulfuric acid appears to be present in the other basins because at a theoretical electrical conductivity of 0, the linear regression of AT as a function of electrical conductivity suggests a negative alkalinity (y intercept = −16.9 µmol L−1; adjusted R2= 0.99, Fig. 10b). Therefore, we assume that some of the divalent cations originate from sulfuric-acid-induced carbonate weathering with generation of CO2 and SO but not of AT. Thus, carbonate weathering in the studied region not only consumes CO2 but also releases CO2, albeit to a lesser extent. Carbonic-acid-induced silicate weathering does not appear to contribute to alkalinity generation and thus to CO2 sequestration (Fig. 2a), although silicate bedrock is generally more abundant in the study area than carbonate bedrock according to lithological maps (Table 1).
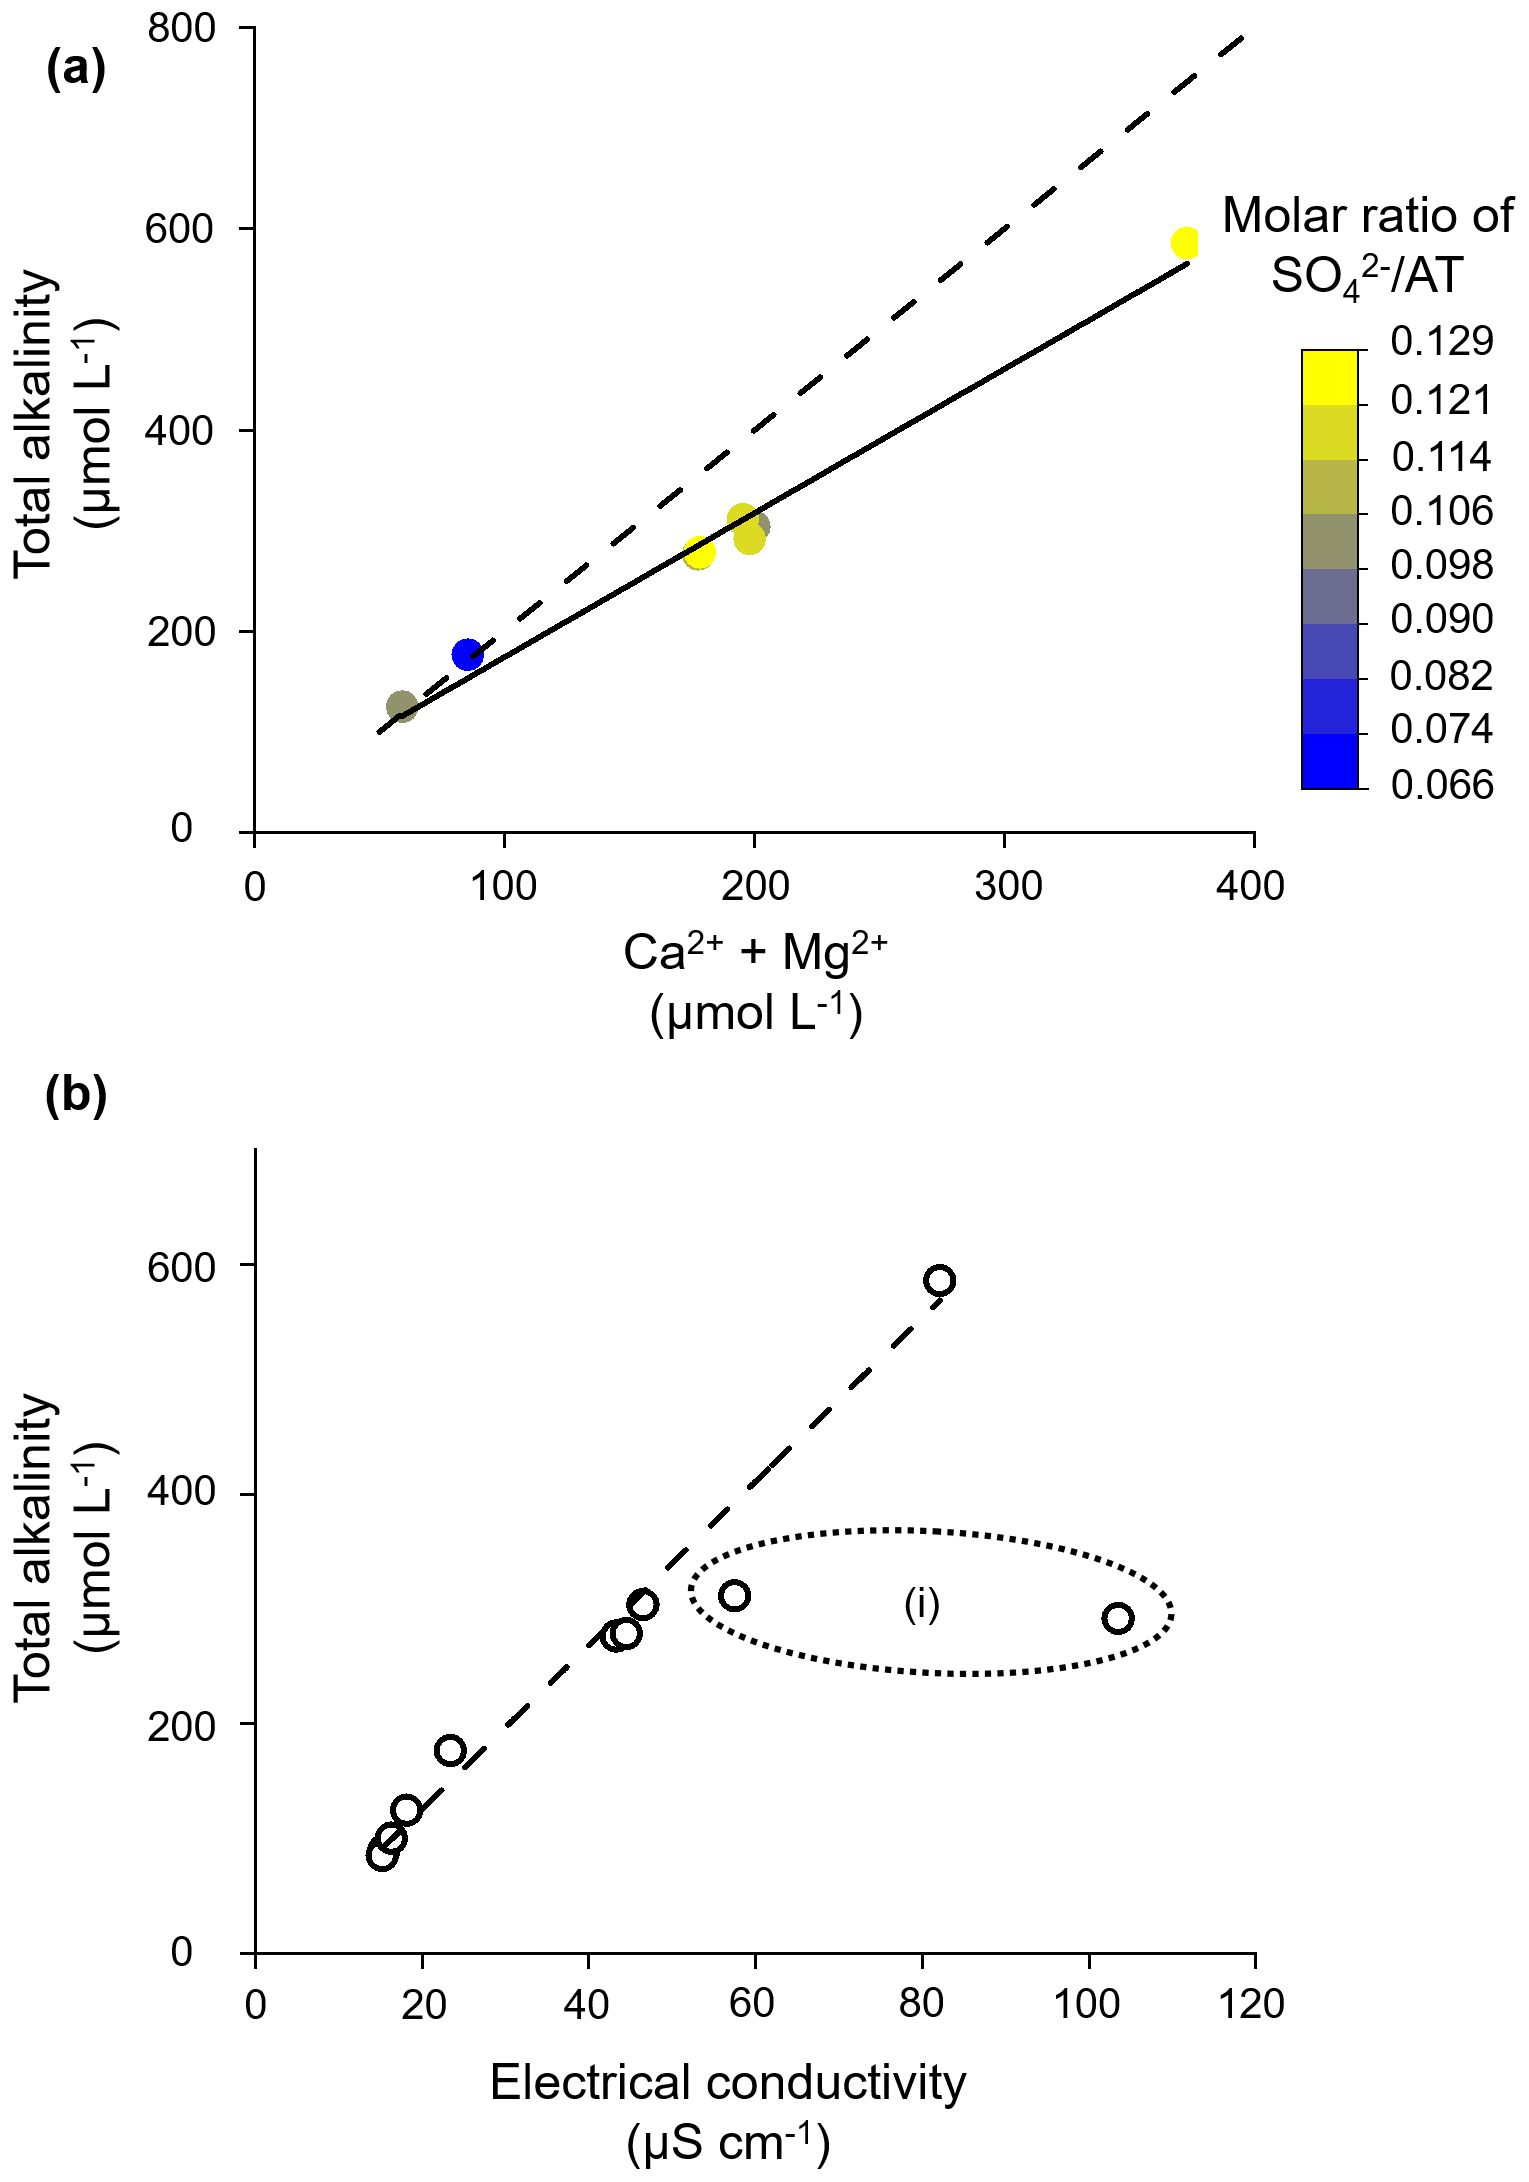
Figure 10Alkalinity generation from carbonate weathering across watershed scales. (a) AT increases linearly with the concentration sum of Ca2+ and Mg2+. The solid line shows linear regression (y intercept = 31.1 µmol L−1; slope coefficient = 1.4), and the dashed line represents the typical molar ratio of carbonic-acid-induced carbonate weathering of AT (Ca2+ + Mg2+) of 2:1. (b) AT increases linearly with electrical conductivity. (i) The dotted ellipse shows where we excluded these two data points from the linear regression (dashed line: y intercept = −19.9 µmol L−1; slope coefficient = 7.1), as they are characterized by distinctly higher Na+ and Cl− concentrations (https://doi.pangaea.de/10.1594/PANGAEA.952905), indicating an influence from the salty fjord and seawater close by.
In the present study it is shown that weathering of accessory carbonate dominates the alkalinity generation in a mainly silicate-dominated subarctic headwater catchment in northern Norway. The vast Fennoscandian Shield is generally underlain by silicates as the alkalinity-bearing rock type. An area of ∼ 20 000 km2 of the Fennoscandian Shield, however, is classified as metamorphic rocks with minor carbonate occurrences (Hartmann and Moosdorf, 2012), the same geology that dominates the Gaskabohki catchment. When transferring our results about the Gaskabohki catchment to the Fennoscandian Shield, we propose that alkalinity dynamics in this area are also drastically influenced by carbonate minerals, even though their occurrence may be low. Further, we have found that alkalinity generation by carbonate weathering greatly decreases when the proportion of sulfuric acid as the weathering agent increases. This was particularly evident in the larger catchments towards the Tanafjord.
For the Gaskabohki headwater catchment, we identified the weathering processes in the carbonate-enriched bedrock located in the lower reaches of the catchment as the main contributor to alkalinity in the stream. The efficient hydrological flow paths in this area appear to facilitate both the transport of soil-respired CO2 to the weathering zone and the transport of weathered products to the channel. When undisturbed, high alkalinity concentrations (∼ 130 µmol L−1) are maintained by the inflow of alkalinity-charged groundwater from the downstream hyporheic zone. However, after a precipitation event, the alkalinity concentration in the stream was reduced twice due to dilution: (1) immediately after the rain event, alkalinity was diluted by new surface water, and (2) after 4 to 7 d after the rain event, the signal was diluted again by a delayed contribution of uphill groundwater to the stream that contained reduced amounts of alkalinity.
Weathering of silicate rocks by carbonic acid, and hence long-term CO2 sequestration, seems to be limited by insufficient contact between the weathering agent (CO) and the mineral surface. We expect silicate weathering rates to increase in the Gaskabohki headwater catchment due to climate change in the future, as the permafrost extent is declining and the annual precipitation is increasing. These two trends will increase the water storage capacity, thereby increasing the contact time of weathering agents and weatherable materials. McNamara et al. (1997) suggested that as the thickness of the active layer in permafrost increases, not only will the hydrologic response of streams to precipitation inputs be attenuated due to greater water storage capacity but root and heterotrophic respiration will also increase as it occurs almost exclusively in this thawed layer. Therefore, we expect the availability of weathering agents in the form of carbonic acid to increase.
In conclusion, we expect an increase in alkalinity generation from carbonic-acid-induced silicate weathering in the Gaskabohki catchment in the future, although we believe the feedback to be slow, as silicate weathering rates are several orders of magnitude slower than carbonate weathering rates. We also propose that carbonic-acid-induced carbonate weathering is likely to increase. We suppose that alkalinity generation from carbonate weathering is responding faster to a changing climate. We believe that parts of the Fennoscandian Shield will experience a rapid weathering response of accessory carbonate minerals to climate change in the future, resulting in elevated alkalinity levels. Future long-term studies that include more seasons and groundwater sampling are required to confirm this hypothesis.
All data used in this study are available through PANGAEA at https://doi.org/10.1594/PANGAEA.952905 (Lehmann et al., 2022).
NL, HL, and HT designed the study. NL led the field research, coordinated laboratory analyses, and wrote the first draft of the manuscript. NL measured DIC concentration. AE measured cation and anion concentrations. MEB and JH contributed (isotope) analytical measurements and data interpretation. All authors contributed to manuscript writing and editing.
The contact author has declared that none of the authors has any competing interests.
Publisher's note: Copernicus Publications remains neutral with regard to jurisdictional claims in published maps and institutional affiliations.
We thank the German Federal Ministry of Education and Research (BMBF) for providing the funding for this project. Nele Lehmann and Helmuth Thomas were supported by “The Ocean's Alkalinity: Connecting geological and metabolic processes and timescales”, BMBF under “Make our Planet Great Again – German Research Initiative”, grant no. 57429828, implemented by the German Academic Exchange Service (DAAD). We thank Mascha Treblin and Lukas Detjen for their assistance in the field. Jens Hartmann wishes to thank Peggy Bartsch for measuring AT concentration.
This research has been supported by the Bundesministerium für Bildung und Forschung (grant no. 57429828).
The article processing charges for this open-access publication were covered by the Helmholtz-Zentrum Hereon.
This paper was edited by Aninda Mazumdar and reviewed by two anonymous referees.
Aas, W., Eckhardt, S., Fiebig, M., Solberg, S., Platt, S. M., Yttri, K. E., and Zwaaftink, C. G.: Monitoring of long-range transported air pollutants in Norway: NILU report 13/2021, Norwegian Environment Agency, Kjeller, ISBN 978-82-425-3040-0, 2021.
Amiotte Suchet, P., Probst, J.-L., and Ludwig, W.: Worldwide distribution of continental rock lithology: Implications for the atmospheric/soil CO2 uptake by continental weathering and alkalinity river transport to the oceans, Global Biogeochem. Cy., 17, 1038, https://doi.org/10.1029/2002GB001891, 2003.
Amundson, R., Stern, L., Baisden, T., and Wang, Y.: The isotopic composition of soil and soil-respired CO2, Geoderma, 82, 83–114, https://doi.org/10.1016/S0016-7061(97)00098-0, 1998.
Appelo, C., Verweij, E., and Schäfer, H.: A hydrogeochemical transport model for an oxidation experiment with pyrite/calcite/exchangers/organic matter containing sand, Appl. Geochem., 13, 257–268, https://doi.org/10.1016/S0883-2927(97)00070-X, 1998.
Beel, C. R., Heslop, J. K., Orwin, J. F., Pope, M. A., Schevers, A. J., Hung, J. K. Y., Lafrenière, M. J., and Lamoureux, S. F.: Emerging dominance of summer rainfall driving High Arctic terrestrial-aquatic connectivity, Nat. Commun., 12, 1448, https://doi.org/10.1038/s41467-021-21759-3, 2021.
Berger, T. W., Türtscher, S., Berger, P., and Lindebner, L.: A slight recovery of soils from Acid Rain over the last three decades is not reflected in the macro nutrition of beech (Fagus sylvatica) at 97 forest stands of the Vienna Woods, Environ. Pollut., 216, 624–635, https://doi.org/10.1016/j.envpol.2016.06.024, 2016.
Berner, E. K. and Berner, R. A.: The global water cycle: Geochemistry and environment, Prentice-Hall, Inc, Englewood Cliffs, 397 pp., ISBN 10 0133571955, 1987.
Berner, R. A., Lasaga, A. C., and Garrels, R. M.: The carbonate-silicate geochemical cycle and its effect on atmospheric carbon dioxide over the past 100 million years, Am. J. Sci., 283, 641–683, https://doi.org/10.2475/ajs.283.7.641, 1983.
Blum, J. D., Gazis, C. A., Jacobson, A. D., and Page Chamberlain, C.: Carbonate versus silicate weathering in the Raikhot watershed within the High Himalayan Crystalline Series, Geology, 26, 411, https://doi.org/10.1130/0091-7613(1998)026<0411:CVSWIT>2.3.CO;2, 1998.
Böttcher, M. E.: The Stable Isotopic Geochemistry of the Sulfur and Carbon Cycles in a Modern Karst Environment, Isot. Environ. Health S., 35, 39–61, https://doi.org/10.1080/10256019908234078, 1999.
Böttcher, M. E. and Schmiedinger, I.: The impact of temperature on the water isotope (2H 1H, 17O 16O, 18O 16O) fractionation upon transport through a low-density polyethylene membrane, Isot. Environ. Health S., 57, 183–192, https://doi.org/10.1080/10256016.2020.1845668, 2021.
Braathen, A. and Davidsen, B.: Structure and stratigraphy of the Palaeoproterozoic Karasjok Greenstone Belt, north Norway – regional implications, Norsk Geol. Tidsskr., 80, 33–50, https://doi.org/10.1080/002919600750042663, 2000.
Brand, W. A. and Coplen, T. B.: Stable isotope deltas: tiny, yet robust signatures in nature, Isot. Environ. Health S., 48, 393–409, https://doi.org/10.1080/10256016.2012.666977, 2012.
Campeau, A., Wallin, M. B., Giesler, R., Löfgren, S., Mörth, C.-M., Schiff, S., Venkiteswaran, J. J., and Bishop, K.: Multiple sources and sinks of dissolved inorganic carbon across Swedish streams, refocusing the lens of stable C isotopes, Sci. Rep., 7, 9158, https://doi.org/10.1038/s41598-017-09049-9, 2017.
Camporese, M., Penna, D., Borga, M., and Paniconi, C.: A field and modeling study of nonlinear storage-discharge dynamics for an Alpine headwater catchment, Water Resour. Res., 50, 806–822, https://doi.org/10.1002/2013WR013604, 2014.
Cerling, T. E., Solomon, D., Quade, J., and Bowman, J. R.: On the isotopic composition of carbon in soil carbon dioxide, Geochim. Cosmochim. Ac., 55, 3403–3405, https://doi.org/10.1016/0016-7037(91)90498-T, 1991.
Chekushin, V. A., Bogatyrev, I. V., Caritat, P. de, Niskavaara, H., and Reimann, C.: Annual atmospheric deposition of 16 elements in eight catchments of the central Barents region, Sci. Total Environ., 220, 95–114, https://doi.org/10.1016/S0048-9697(98)00247-2, 1998.
Conrad, O., Bechtel, B., Bock, M., Dietrich, H., Fischer, E., Gerlitz, L., Wehberg, J., Wichmann, V., and Böhner, J.: System for Automated Geoscientific Analyses (SAGA) v. 2.1.4, Geosci. Model Dev., 8, 1991–2007, https://doi.org/10.5194/gmd-8-1991-2015, 2015.
Davidson, G. R.: The stable isotopic composition and measurement of carbon in soil CO2, Geochim. Cosmochim. Ac., 59, 2485–2489, https://doi.org/10.1016/0016-7037(95)00143-3, 1995.
Deines, P., Langmuir, D., and Harmon, R. S.: Stable carbon isotope ratios and the existence of a gas phase in the evolution of carbonate ground waters, Geochim. Cosmochim. Ac., 38, 1147–1164, https://doi.org/10.1016/0016-7037(74)90010-6, 1974.
Didan, K., Munoz, A. B., Solano, R., and Huete, A.: MOD13Q1 v006: MODIS/Terra Vegetation Indices 16-Day L3 Global 250 m SIN Grid, Land Processes Distributed Active Archive Center (LP DAAC) [data set], https://doi.org/10.5067/MODIS/MOD13Q1.006, 2015.
Dingman, S. L.: Hydrology of the Glenn Creek watershed, Tanana River Basin, central Alaska: Res. Rep. 297, Cold Regions Research and Engineering Laboratory, Hanover, New Hampshire, USA, https://hdl.handle.net/11681/5740 (last access: 15 August 2022), 1971.
Drake, T. W., Tank, S. E., Zhulidov, A. V., Holmes, R. M., Gurtovaya, T., and Spencer, R. G. M.: Increasing Alkalinity Export from Large Russian Arctic Rivers, Environ. Sci. Technol., 52, 8302–8308, https://doi.org/10.1021/acs.est.8b01051, 2018.
ESRI: Environmental Systems Research Institute (ESRI): ArcGIS pro: Release 2.9, ESRI, Redlands, USA, 2022.
Frey, K. E. and McClelland, J. W.: Impacts of permafrost degradation on arctic river biogeochemistry, Hydrol. Process., 23, 169–182, https://doi.org/10.1002/hyp.7196, 2009.
Fritz, P., Drimmie, R. J., Frape, S. K., and O'Shea, K.: The isotopic composition of precipitation and groundwater in Canada, IAEA, International Atomic Energy Agency (IAEA), ISBN 92-0-040087-6, 1987.
Gaillardet, J., Dupré, B., Louvat, P., and Allègre, C. J.: Global silicate weathering and CO2 consumption rates deduced from the chemistry of large rivers, Chem. Geol., 159, 3–30, https://doi.org/10.1016/S0009-2541(99)00031-5, 1999.
Garrels, R. M. and Berner, R. A.: The Global Carbonate-Silicate Sedimentary System – Some Feedback Relations, in: Biomineralization and Biological Metal Accumulation, edited by: Westbroek, P. and De Jong, E. W., Springer Netherlands, Dordrecht, 73–87, ISBN 13 978-94-009-7946-8, 1983.
Gislason, S. R., Oelkers, E. H., Eiriksdottir, E. S., Kardjilov, M. I., Gisladottir, G., Sigfusson, B., Snorrason, A., Elefsen, S., Hardardottir, J., Torssander, P., and Oskarsson, N.: Direct evidence of the feedback between climate and weathering, Earth Planet. Sc. Lett., 277, 213–222, https://doi.org/10.1016/j.epsl.2008.10.018, 2009.
Goll, D. S., Moosdorf, N., Hartmann, J., and Brovkin, V.: Climate-driven changes in chemical weathering and associated phosphorus release since 1850: Implications for the land carbon balance, Geophys. Res. Lett., 41, 3553–3558, https://doi.org/10.1002/2014GL059471, 2014.
Hartmann, J.: Bicarbonate-fluxes and CO2-consumption by chemical weathering on the Japanese Archipelago – Application of a multi-lithological model framework, Chem. Geol., 265, 237–271, https://doi.org/10.1016/j.chemgeo.2009.03.024, 2009.
Hartmann, J. and Moosdorf, N.: The new global lithological map database GLiM: A representation of rock properties at the Earth surface, Geochem. Geophy. Geosys., 13, 119, https://doi.org/10.1029/2012GC004370, 2012.
Hartmann, J., Jansen, N., Dürr, H. H., Kempe, S., and Köhler, P.: Global CO2-consumption by chemical weathering: What is the contribution of highly active weathering regions?, Global Planet. Change, 69, 185–194, https://doi.org/10.1016/j.gloplacha.2009.07.007, 2009.
Hill, T. and Neal, C.: Spatial and temporal variation in pH, alkalinity and conductivity in surface runoff and groundwater for the Upper River Severn catchment, Hydrol. Earth Syst. Sci., 1, 697–715, https://doi.org/10.5194/hess-1-697-1997, 1997.
Hoefs, J.: Ein Beitrag zur Isotopengeochemie des Kohlenstoffs in magmatischen Gesteinen: A contribution on the isotope geochemistry of carbon in igneous rocks, Contrib. Mineral. Petr., 41, 277–300, https://doi.org/10.1007/BF00372168, 1973.
Huete, A., Didan, K., Miura, T., Rodriguez, E., Gao, X., and Ferreira, L.: Overview of the radiometric and biophysical performance of the MODIS vegetation indices, Remote Sens. Environ., 83, 195–213, https://doi.org/10.1016/S0034-4257(02)00096-2, 2002.
International Atomic Energy Agency: Global Network of Isotopes in Precipitation, The GNIP Database, https://nucleus.iaea.org/wiser (last access: 31 August 2022), 2020.
Jacobson, A. D., Blum, J. D., Chamberlain, C., Poage, M. A., and Sloan, V. F.: Ca Sr and Sr isotope systematics of a Himalayan glacial chronosequence: Carbonate versus silicate weathering rates as a function of landscape surface age, Geochim. Cosmochim. Ac., 66, 13–27, https://doi.org/10.1016/S0016-7037(01)00755-4, 2002.
Jacobson, A. D., Blum, J. D., Chamberlain, C., Craw, D., and Koons, P. O.: Climatic and tectonic controls on chemical weathering in the New Zealand Southern Alps, Geochim. Cosmochim. Ac., 67, 29–46, https://doi.org/10.1016/S0016-7037(02)01053-0, 2003.
Jacobson, A. D., Grace Andrews, M., Lehn, G. O., and Holmden, C.: Silicate versus carbonate weathering in Iceland: New insights from Ca isotopes, Earth Planet. Sc. Lett., 416, 132–142, https://doi.org/10.1016/j.epsl.2015.01.030, 2015.
Jones, J. B. and Mulholland, P. J.: Influence of drainage basin topography and elevation on carbon dioxide and methane supersaturation of stream water, Biogeochemistry, 40, 57–72, https://doi.org/10.1023/A:1005914121280, 1998.
Kempe, S.: Long-term records of CO2 pressure fluctuations in fresh waters, Mitt. Geol-Paläont. Inst. Univ. Hamburg; SCOPE/UNEP Sonderband, 52, 91–332, https://www.karstwanderweg.de/publika/gpi/52/116-120/index.htm (last access: 15 August 2022), 1982.
Kjellman, S. E., Axelsson, P. E., Etzelmüller, B., Westermann, S., and Sannel, A. B. K.: Holocene development of subarctic permafrost peatlands in Finnmark, northern Norway, Holocene, 28, 1855–1869, https://doi.org/10.1177/0959683618798126, 2018.
Lag, J.: Soil Map Norway – Jordbunnskart, Norges Landbrukshogskole, https://esdac.jrc.ec.europa.eu/content/soil-map-norway-jordbunnskart (last access: 15 August 2022), 1983.
Land, L. S.: The isotopic and trace element geochemistry of dolomite: the state of the art, in: Concepts and Models of Dolomitization, edited by: Zenger, D. H., Dunham, J. B., and Ethington, R. L., SEPM (Society for Sedimentary Geology), 87–110, ISBN 10 0918985080, 1980.
Lasaga, A. C.: Chemical kinetics of water-rock interactions, J. Geophys. Res., 89, 4009–4025, https://doi.org/10.1029/JB089iB06p04009, 1984.
Lehmann, N., Lantuit, H., Böttcher, M. E., Hartmann, J., and Thomas, H.: Alkalinity, DIC, δ13C-DIC, major and trace elements, and stable water isotopes data in water samples from a degrading permafrost landscape at subarctic Iskorasfjellet, northern Norway, PANGAEA [data set], https://doi.org/10.1594/PANGAEA.952905, 2022.
Lehn, G. O., Jacobson, A. D., Douglas, T. A., McClelland, J. W., Barker, A. J., and Khosh, M. S.: Constraining seasonal active layer dynamics and chemical weathering reactions occurring in North Slope Alaskan watersheds with major ion and isotope (δ34S, δ13CDIC, 87Sr 86Sr, δ44 40Ca, and δ44 / 42Ca) measurements, Geochim. Cosmochim. Ac., 217, 399–420, https://doi.org/10.1016/j.gca.2017.07.042, 2017.
Li, S., Xia, X., Tan, X., and Zhang, Q.: Effects of catchment and riparian landscape setting on water chemistry and seasonal evolution of water quality in the upper Han River basin, China, PloS one, 8, e53163, https://doi.org/10.1371/journal.pone.0053163, 2013.
Li, S.-L., Calmels, D., Han, G., Gaillardet, J., and Liu, C.-Q.: Sulfuric acid as an agent of carbonate weathering constrained by δ13CDIC: Examples from Southwest China, Earth Planet. Sc. Lett., 270, 189–199, https://doi.org/10.1016/j.epsl.2008.02.039, 2008.
Li, S.-L., Liu, C.-Q., Li, J., Lang, Y.-C., Ding, H., and Li, L.: Geochemistry of dissolved inorganic carbon and carbonate weathering in a small typical karstic catchment of Southwest China: Isotopic and chemical constraints, Chem. Geol., 277, 301–309, https://doi.org/10.1016/j.chemgeo.2010.08.013, 2010.
Liu, J. and Han, G.: Effects of chemical weathering and CO2 outgassing on δ13CDIC signals in a karst watershed, J. Hydrol., 589, 125192, https://doi.org/10.1016/j.jhydrol.2020.125192, 2020.
Liu, Z., Macpherson, G. L., Groves, C., Martin, J. B., Yuan, D., and Zeng, S.: Large and active CO2 uptake by coupled carbonate weathering, Earth-Sci. Rev., 182, 42–49, https://doi.org/10.1016/j.earscirev.2018.05.007, 2018.
Macpherson, G. L., Sullivan, P. L., Stotler, R. L., Norwood, B. S., Chudaev, O., Kharaka, Y., Harmon, R., Millot, R., and Shouakar-Stash, O.: Increasing groundwater CO2 in a mid-continent tallgrass prairie: Controlling factors, E3S Web Conf., 98, 6008, https://doi.org/10.1051/e3sconf/20199806008, 2019.
Marx, A., Dusek, J., Jankovec, J., Sanda, M., Vogel, T., van Geldern, R., Hartmann, J., and Barth, J. A. C.: A review of CO2 and associated carbon dynamics in headwater streams: A global perspective, Rev. Geophys., 55, 560–585, https://doi.org/10.1002/2016RG000547, 2017a.
Marx, A., Hintze, S., Sanda, M., Jankovec, J., Oulehle, F., Dusek, J., Vitvar, T., Vogel, T., van Geldern, R., and Barth, J. A. C.: Acid rain footprint three decades after peak deposition: Long-term recovery from pollutant sulphate in the Uhlirska catchment (Czech Republic), Sci. Total Environ., 598, 1037–1049, https://doi.org/10.1016/j.scitotenv.2017.04.109, 2017b.
Marx, A., Conrad, M., Aizinger, V., Prechtel, A., van Geldern, R., and Barth, J. A. C.: Groundwater data improve modelling of headwater stream CO2 outgassing with a stable DIC isotope approach, Biogeosciences, 15, 3093–3106, https://doi.org/10.5194/bg-15-3093-2018, 2018.
McGivney, E., Gustafsson, J. P., Belyazid, S., Zetterberg, T., and Löfgren, S.: Assessing the impact of acid rain and forest harvest intensity with the HD-MINTEQ model – soil chemistry of three Swedish conifer sites from 1880 to 2080, SOIL, 5, 63–77, https://doi.org/10.5194/soil-5-63-2019, 2019.
McGlynn, B. L. and McDonnell, J. J.: Quantifying the relative contributions of riparian and hillslope zones to catchment runoff, Water Resour. Res., 39, 211, https://doi.org/10.1029/2003WR002091, 2003a.
McGlynn, B. L. and McDonnell, J. J.: Role of discrete landscape units in controlling catchment dissolved organic carbon dynamics, Water Resour. Res., 39, 251, https://doi.org/10.1029/2002WR001525, 2003b.
McGlynn, B. L. and Seibert, J.: Distributed assessment of contributing area and riparian buffering along stream networks, Water Resour. Res., 39, 331, https://doi.org/10.1029/2002WR001521, 2003.
McGuire, K. J. and McDonnell, J. J.: Hydrological connectivity of hillslopes and streams: Characteristic time scales and nonlinearities, Water Resour. Res., 46, 400, https://doi.org/10.1029/2010WR009341, 2010.
McNamara, J. P., Kane, D. L., and Hinzman, L. D.: Hydrograph separations in an arctic watershed using mixing model and graphical techniques, Water Resour. Res., 33, 1707–1719, https://doi.org/10.1029/97WR01033, 1997.
Meybeck, M.: Composition chimique des ruisseaux non pollués en France. Chemical composition of headwater streams in France, sgeol, 39, 3–77, https://doi.org/10.3406/sgeol.1986.1719, 1986.
Meybeck, M.: Global chemical weathering of surficial rocks estimated from river dissolved loads, Am. J. Sci., 287, 401–428, https://doi.org/10.2475/ajs.287.5.401, 1987.
Meyboom, P.: Groundwater Studies in the Assiboine River Drainage Basin. Part II: Hydrolofic Characteristics of Phreatophytic Vegetation in South-Central Saskatchewan, Geological Survey of Canada, Ottawa, Canada, https://doi.org/10.4095/101495, 1967.
Michaelis, J.: Carbonate rock dissolution under intermediate system conditions, in: Progress in Hydrogeochemistry: Organics – Carbonate Systems – Silicate Systems – Microbiology – Models, edited by: Mattheß, G., Frimmel, F., Hirsch, P., Schulz, H. D., and Usdowski, E., Springer Berlin Heidelberg, Berlin, Heidelberg, 167–174, ISBN 13 978-3540540342, 1992.
Michaelis, J., Usdowski, E., and Menschel, G.: Partitioning of 13 C and 12 C on the degassing of CO2 and the precipitation of calcite; Rayleigh-type fractionation and a kinetic model, Am. J. Sci., 285, 318–327, https://doi.org/10.2475/ajs.285.4.318, 1985.
Millero, F. J.: The thermodynamics of the carbonate system in seawater, Geochim. Cosmochim. Ac., 43, 1651–1661, https://doi.org/10.1016/0016-7037(79)90184-4, 1979.
Millot, R., Gaillardet, J., Dupré, B., and Allègre, C. J.: The global control of silicate weathering rates and the coupling with physical erosion: new insights from rivers of the Canadian Shield, Earth Planet. Sc. Lett., 196, 83–98, https://doi.org/10.1016/S0012-821X(01)00599-4, 2002.
Moore, J., Jacobson, A. D., Holmden, C., and Craw, D.: Tracking the relationship between mountain uplift, silicate weathering, and long-term CO2 consumption with Ca isotopes: Southern Alps, New Zealand, Chem. Geol., 341, 110–127, https://doi.org/10.1016/j.chemgeo.2013.01.005, 2013.
Moosdorf, N., Hartmann, J., and Lauerwald, R.: Changes in dissolved silica mobilization into river systems draining North America until the period 2081–2100, J. Geochem. Explor., 110, 31–39, https://doi.org/10.1016/j.gexplo.2010.09.001, 2011.
Myrabø, S.: Temporal and spatial scale of response area and groundwater variation in Till, Hydrol. Process., 11, 1861–1880, https://doi.org/10.1002/(SICI)1099-1085(199711)11:14<1861::AID-HYP535>3.0.CO;2-P, 1997.
NGU: Berggrunn Data N250, Geological Survey of Norway, https://www.ngu.no/geologiske-kart/datasett (last access: 18 March 2022), 2022.
Obu, J., Westermann, S., Bartsch, A., Berdnikov, N., Christiansen, H. H., Dashtseren, A., Delaloye, R., Elberling, B., Etzelmüller, B., Kholodov, A., Khomutov, A., Kääb, A., Leibman, M. O., Lewkowicz, A. G., Panda, S. K., Romanovsky, V., Way, R. G., Westergaard-Nielsen, A., Wu, T., Yamkhin, J., and Zou, D.: Northern Hemisphere permafrost map based on TTOP modelling for 2000–2016 at 1 km2 scale, Earth-Sci. Rev., 193, 299–316, https://doi.org/10.1016/j.earscirev.2019.04.023, 2019.
O'Leary, M. H.: Carbon Isotopes in Photosynthesis, BioScience, 38, 328–336, https://doi.org/10.2307/1310735, 1988.
Oliva, P., Dupré, B., Martin, F., and Viers, J.: The role of trace minerals in chemical weathering in a high-elevation granitic watershed (Estibère, France): Chemical and mineralogical evidence, Geochim. Cosmochim. Ac., 68, 2223–2243, https://doi.org/10.1016/j.gca.2003.10.043, 2004.
Oliver, L., Harris, N., Bickle, M., Chapman, H., Dise, N., and Horstwood, M.: Silicate weathering rates decoupled from the 87Sr 86Sr ratio of the dissolved load during Himalayan erosion, Chem. Geol., 201, 119–139, https://doi.org/10.1016/S0009-2541(03)00236-5, 2003.
Olsen, L.: Stadials and interstadials during the Weichsel glackiation on Finnmarksvidda, northern Norway, Boreas, 17, 517–539, https://doi.org/10.1111/j.1502-3885.1988.tb00566.x, 1988.
Olsen, L., Fredin, O., and Olesen, O.: Quaternary Geology of Norway, Geological Survey of Norway Special Publication, 13, ISBN 978-82-7385-153-6, 2013.
O'Nions, R. K., Morton, R. D., and Batey, R.: Geological investigations in the Bamble sector of the Fennoscandian Shield South Norway.: I. The geology of eastern Bamble, Universitetsforlaget, Oslo, https://hdl.handle.net/11250/2674911 (last access: 15 August 2022), 1970.
Petrone, K. C., Hinzman, L. D., Shibata, H., Jones, J. B., and Boone, R. D.: The influence of fire and permafrost on sub-arctic stream chemistry during storms, Hydrol. Process., 21, 423–434, https://doi.org/10.1002/hyp.6247, 2007.
Pierrot, D. E., Wallace, D., and Lewis, E.: CO2SYS: MS Excel Program Developed for CO2 System Calculations, Carbon Dioxide Information Analysis Center, Oak Ridge National Laboratory, U.S. Department of Energy, Oak Ridge, USA, 2011.
Polsenaere, P. and Abril, G.: Modelling CO2 degassing from small acidic rivers using water pCO2, DIC and δ13C-DIC data, Geochim. Cosmochim. Ac., 91, 220–239, https://doi.org/10.1016/j.gca.2012.05.030, 2012.
Porter, C., Morin, P., Howat, I., Noh, M.-J., Bates, B., Peterman, K., Keesey, S., Schlenk, M., Gardiner, J., Tomko, K., Willis, M., Kelleher, C., Cloutier, M., Husby, E., Foga, S., Nakamura, H., Platson, M., Wethington Jr., M., Williamson, C., Bauer, G., Enos, J., Arnold, G., Kramer, W., Becker, P., Doshi, A., D'Souza, C., Cummens, P., Laurier, F., and Bojesen, M.: ArcticDEM, V1, Harvard Dataverse [data set], https://doi.org/10.7910/DVN/OHHUKH, 2018.
Purkamo, L., Ahn, C. M. E. von, Jilbert, T., Muniruzzaman, M., Bange, H. W., Jenner, A.-K., Böttcher, M. E., and Virtasalo, J. J.: Impact of submarine groundwater discharge on biogeochemistry and microbial communities in pockmarks, Geochim. Cosmochim. Ac., 334, 14–44, https://doi.org/10.1016/j.gca.2022.06.040, 2022.
QGIS.org: QGIS Geographic Information System, QGIS Association, http://www.qgis.org (last access: 8 October 2022), 2022.
Rantanen, M., Karpechko, A. Y., Lipponen, A., Nordling, K., Hyvärinen, O., Ruosteenoja, K., Vihma, T., and Laaksonen, A.: The Arctic has warmed nearly four times faster than the globe since 1979, Commun. Earth Environ., 3, 168, https://doi.org/10.1038/s43247-022-00498-3, 2022.
Raymond, P. A. and Hamilton, S. K.: Anthropogenic influences on riverine fluxes of dissolved inorganic carbon to the oceans, Limnol. Oceanogr. Lett., 3, 143–155, https://doi.org/10.1002/lol2.10069, 2018.
Raymond, P. A., Oh, N.-H., Turner, R. E., and Broussard, W.: Anthropogenically enhanced fluxes of water and carbon from the Mississippi River, Nature, 451, 449–452, https://doi.org/10.1038/nature06505, 2008.
Riley, S. J., DeGloria, S. D., and and Elliot, R.: A terrain ruggedness index that quantifies topographic heterogeneity, Intermountain Journal of Sciences, 5, 23–27, 1999.
Rouault, E., Warmerdam, F., Schwehr, K., Kiselev, A., Butler, H., £oskot, M., Szekeres, T., Tourigny, E., Landa, M., Miara, I., Elliston, B., Kumar, C., Plesea, L., Morissette, D., Jolma, A., and Dawson, N.: GDAL (v3.4.2), Zenodo [code], https://doi.org/10.5281/zenodo.6352176, 2022.
Sandström, B. and Tullborg, E.-L.: Episodic fluid migration in the Fennoscandian Shield recorded by stable isotopes, rare earth elements and fluid inclusions in fracture minerals at Forsmark, Sweden, Chem. Geol., 266, 126–142, https://doi.org/10.1016/j.chemgeo.2009.04.019, 2009.
Schaefer, K. W. and Usdowski, E.: Models for the dissolution of carbonate rocks and the carbon-13/carbon-12 evolution of carbonate groundwaters, Zeitschrift fuer Wasser- und Abwasser-Forschung, 20, 69–81, https://eurekamag.com/research/005/910/005910064.php (last access: 15 August 2022), 1987.
Schaefer, K. W. and Usdowski, E.: Application of stable carbon and sulfur isotope models to the development of ground water in a limestone-dolomite-anhydrite-gypsum area, in: Progress in Hydrogeochemistry: Organics – Carbonate Systems – Silicate Systems – Microbiology – Models, edited by: Mattheß, G., Frimmel, F., Hirsch, P., Schulz, H. D., and Usdowski, E., Springer Berlin Heidelberg, Berlin, Heidelberg, 157–163, ISBN 13 978-3540540342, 1992.
Seibert, J., Grabs, T., Köhler, S., Laudon, H., Winterdahl, M., and Bishop, K.: Linking soil- and stream-water chemistry based on a Riparian Flow-Concentration Integration Model, Hydrol. Earth Syst. Sci., 13, 2287–2297, https://doi.org/10.5194/hess-13-2287-2009, 2009.
Seklima: Observations and weather statistics, Norsk Klimaservicesenter, https://seklima.met.no/observations/ (last access: 31 August 2022), 2020.
Shadwick, E. H., Thomas, H., Gratton, Y., Leong, D., Moore, S. A., Papakyriakou, T., and Prowe, A.: Export of Pacific carbon through the Arctic Archipelago to the North Atlantic, Cont. Shelf Res., 31, 806–816, https://doi.org/10.1016/j.csr.2011.01.014, 2011.
Shin, W. J., Chung, G. S., Lee, D., and Lee, K. S.: Dissolved inorganic carbon export from carbonate and silicate catchments estimated from carbonate chemistry and δ13CDIC, Hydrol. Earth Syst. Sci., 15, 2551–2560, https://doi.org/10.5194/hess-15-2551-2011, 2011.
Sollid, J. L., Andersen, S., Hamre, N., Kjeldsen, O., Salvigsen, O., Sturød, S., Tveitå, T., and Wilhelmsen, A.: Deglaciation of Finnmark, North Norway, Norsk Geografisk Tidsskrift – Norwegian Journal of Geography, 27, 233–325, https://doi.org/10.1080/00291951.1973.9728306, 1973.
Stallard, R. F. and Edmond, J. M.: Geochemistry of the Amazon: 3. Weathering chemistry and limits to dissolved inputs, J. Geophys. Res., 92, 8293, https://doi.org/10.1029/JC092iC08p08293, 1987.
Stone, L. E., Fang, X., Haynes, K. M., Helbig, M., Pomeroy, J. W., Sonnentag, O., and Quinton, W. L.: Modelling the effects of permafrost loss on discharge from a wetland-dominated, discontinuous permafrost basin, Hydrol. Process., 33, 2607–2626, https://doi.org/10.1002/hyp.13546, 2019.
Striegl, R. G., Aiken, G. R., Dornblaser, M. M., Raymond, P. A., and Wickland, K. P.: A decrease in discharge-normalized DOC export by the Yukon River during summer through autumn, Geophys. Res. Lett., 32, 567, https://doi.org/10.1029/2005GL024413, 2005.
Stroeven, A. P., Hättestrand, C., Kleman, J., Heyman, J., Fabel, D., Fredin, O., Goodfellow, B. W., Harbor, J. M., Jansen, J. D., Olsen, L., Caffee, M. W., Fink, D., Lundqvist, J., Rosqvist, G. C., Strömberg, B., and Jansson, K. N.: Deglaciation of Fennoscandia, Quaternary Sci. Rev., 147, 91–121, https://doi.org/10.1016/j.quascirev.2015.09.016, 2016.
Stumm, W. and Morgan, J. J.: Aquatic chemistry an introduction chemical equilibria in natural water, 2nd ed., A Wiley – Interscience Publication, A Wiley-Interscience Publication, New York, 780 pp., ISBN 13 978-0471091738, 1981.
Tank, S. E., Frey, K. E., Striegl, R. G., Raymond, P. A., Holmes, R. M., McClelland, J. W., and Peterson, B. J.: Landscape-level controls on dissolved carbon flux from diverse catchments of the circumboreal, Global Biogeochem. Cy., 26, 323, https://doi.org/10.1029/2012GB004299, 2012.
Tanneberger, F., Tegetmeyer, C., Busse, S., Barthelmes, A., and and 55 others: The peatland map of Europe, Mires Peat, 19, 1–17, https://doi.org/10.19189/MaP.2016.OMB.264, 2017.
Trolier, M., White, J. W. C., Tans, P. P., Masarie, K. A., and Gemery, P. A.: Monitoring the isotopic composition of atmospheric CO2: Measurements from the NOAA Global Air Sampling Network, J. Geophys. Res., 101, 25897–25916, https://doi.org/10.1029/96JD02363, 1996.
Vidon, P.: Towards a better understanding of riparian zone water table response to precipitation: Surface water infiltration, hillslope contribution or pressure wave processes?, Hydrol. Process., 26, 3207–3215, https://doi.org/10.1002/hyp.8258, 2012.
Walker, J. C. G., Hays, P. B., and Kasting, J. F.: A negative feedback mechanism for the long-term stabilization of Earth's surface temperature, J. Geophys. Res., 86, 9776, https://doi.org/10.1029/JC086iC10p09776, 1981.
Walvoord, M. A. and Striegl, R. G.: Increased groundwater to stream discharge from permafrost thawing in the Yukon River basin: Potential impacts on lateral export of carbon and nitrogen, Geophys. Res. Lett., 34, L19401, https://doi.org/10.1029/2007GL030216, 2007.
Warner, D. L., Bond-Lamberty, B., Jian, J., Stell, E., and Vargas, R.: Spatial Predictions and Associated Uncertainty of Annual Soil Respiration at the Global Scale, Global Biogeochem. Cy., 33, 1733–1745, https://doi.org/10.1029/2019GB006264, 2019.
Watts, J. D., Natali, S. M., Minions, C., Risk, D., Arndt, K., Zona, D., Euskirchen, E. S., Rocha, A. V., Sonnentag, O., Helbig, M., Kalhori, A., Oechel, W., Ikawa, H., Ueyama, M., Suzuki, R., Kobayashi, H., Celis, G., Schuur, E. A. G., Humphreys, E., Kim, Y., Lee, B.-Y., Goetz, S., Madani, N., Schiferl, L. D., Commane, R., Kimball, J. S., Liu, Z., Torn, M. S., Potter, S., Wang, J. A., Jorgenson, M. T., Xiao, J., Li, X., and Edgar, C.: Soil respiration strongly offsets carbon uptake in Alaska and Northwest Canada, Environ. Res. Lett., 16, 84051, https://doi.org/10.1088/1748-9326/ac1222, 2021.
White, A. F., Bullen, T. D., Vivit, D. V., Schulz, M. S., and Clow, D. W.: The role of disseminated calcite in the chemical weathering of granitoid rocks, Geochim. Cosmochim. Ac., 63, 1939–1953, https://doi.org/10.1016/S0016-7037(99)00082-4, 1999.
White, A. F., Schulz, M. S., Lowenstern, J. B., Vivit, D. V., and Bullen, T. D.: The ubiquitous nature of accessory calcite in granitoid rocks: Implications for weathering, solute evolution, and petrogenesis, Geochim. Cosmochim. Ac., 69, 1455–1471, https://doi.org/10.1016/j.gca.2004.09.012, 2005.
Winde, V., Böttcher, M. E., Escher, P., Böning, P., Beck, M., Liebezeit, G., and Schneider, B.: Tidal and spatial variations of DI13C and aquatic chemistry in a temperate tidal basin during winter time, J. Marine Syst., 129, 396–404, https://doi.org/10.1016/j.jmarsys.2013.08.005, 2014.
Yuanrong, S., Ruihong, Y., Mingyang, T., Xiankun, Y., Lishan, R., Haizhu, H., Zhuangzhuang, Z., and Xixi, L.: Major ion chemistry in the headwater region of the Yellow River: Impact of land covers, Environ. Earth Sci., 80, 2637, https://doi.org/10.1007/s12665-021-09692-6, 2021.
Zeebe, R. E. and Westbroek, P.: A simple model for the CaCO 3 saturation state of the ocean: The “Strangelove,” the “Neritan,” and the “Cretan” Ocean, Geochem. Geophys. Geosyst., 4, 1104, https://doi.org/10.1029/2003GC000538, 2003.
Zeng, S., Liu, Z., and Kaufmann, G.: Sensitivity of the global carbonate weathering carbon-sink flux to climate and land-use changes, Nat. Commun., 10, 5749, https://doi.org/10.1038/s41467-019-13772-4, 2019.
Zeng, S., Kaufmann, G., and Liu, Z.: Natural and Anthropogenic Driving Forces of Carbonate Weathering and the Related Carbon Sink Flux: A Model Comparison Study at Global Scale, Global Biogeochem. Cy., 36, e2021GB007096, https://doi.org/10.1029/2021GB007096, 2022.
Zhang, J., Quay, P. D., and Wilbur, D. O.: Carbon isotope fractionation during gas-water exchange and dissolution of CO2, Geochim. Cosmochim. Ac., 59, 107–114, https://doi.org/10.1016/0016-7037(95)91550-D, 1995.
Zolkos, S., Tank, S. E., Striegl, R. G., Kokelj, S. V., Kokoszka, J., Estop-Aragonés, C., and Olefeldt, D.: Thermokarst amplifies fluvial inorganic carbon cycling and export across watershed scales on the Peel Plateau, Canada, Biogeosciences, 17, 5163–5182, https://doi.org/10.5194/bg-17-5163-2020, 2020.