the Creative Commons Attribution 4.0 License.
the Creative Commons Attribution 4.0 License.
 | 24 Aug 2023
Enabling a process-oriented hydro-biogeochemical model to simulate soil erosion and nutrient losses
Siqi Li
Bo Zhu
Xunhua Zheng
Pengcheng Hu
Shenghui Han
Jihui Fan
Tao Wang
Rui Wang
Kai Wang
Zhisheng Yao
Chunyan Liu
Wei Zhang
Yong Li
Water-induced erosion and associated particulate carbon (PC), particulate nitrogen (PN) and particulate phosphorus (PP) nutrient losses are vital parts of biogeochemical cycling. Identifying their intensity and distribution characteristics is of great significance for the control of soil and water loss and nitrogen/phosphorus nonpoint source pollution. This study incorporated modules of physical soil erosion and associated PC, PN and PP losses into a process-oriented hydro-biogeochemical model (Catchment Nutrients Management Model coupled with DeNitrification–DeComposition, CNMM-DNDC) to enable it to predict soil and water loss. The results indicated that the upgraded CNMM-DNDC (i) performed well in simulating the observed temporal dynamics and magnitudes of surface runoff, sediment and PN/PP yields in the lysimetric plot of the Jieliu catchment in Sichuan Province and (ii) successfully predicted the observed monthly dynamics and magnitudes of stream flow, sediment yield and PN yields at the catchment outlet, with significant univariate linear regressions and acceptable Nash–Sutcliffe indices higher than 0.74. The upgraded CNMM-DNDC demonstrated that a greater proportion of PN to total nitrogen (TN) during the period with large precipitation events and amounts than that during the drought period (16.2 %–26.6 % versus 2.3 %–12.4 %). The intensities of soil erosion and particulate nutrient yields in the Jieliu catchment were closely related to land use type in the following order: sloping cultivated upland (SU) > residential areas (RA) > forest land (FL). The scenario analysis demonstrated that high greenhouse gas (GHG) emissions scenarios provided a greater risk of soil erosion than did low GHG emissions scenarios and that land use change (i.e., from SU to FL) could help to mitigate soil and water loss accelerated by climate change in the future. The upgraded model was demonstrated to have the ability of predicting ecosystem productivity, hydrologic nitrogen loads, emissions of GHGs and pollutant gases, soil erosion and particulate nutrient yields, which renders it a potential decision support tool for soil erosion and nonpoint source pollution control coordinated with increasing production and reducing GHG and pollutant gases emissions in a catchment.
- Article
(5306 KB) - Full-text XML
-
Supplement
(2860 KB) - BibTeX
- EndNote


Water-induced erosion and associated particulate carbon (PC), particulate nitrogen (PN) and particulate phosphorus (PP) nutrient losses are among the primary threats leading to declines in soil fertility and increases in land degradation, channel sedimentation and eutrophication of downstream rivers and lakes (Berhe et al., 2018; Ekholm and Lehtoranta, 2012; Garcia-Ruiz et al., 2015). These global environmental issues are becoming serious (Ma et al., 2021; Yang et al., 2003). A previous study found that vulnerability to water-induced erosion increased in over 51 % of the globe’s surface in 2015 (Liu et al., 2019). Climate change and anthropogenic activities (such as land use change) are the two principal driving forces that have complicated and altered the hydrological cycle and water-induced erosion during recent decades (Piao et al., 2007; Zeng et al., 2015).
Quantitative assessments of water-induced soil erosion intensity and identification of its temporal and spatial distribution characteristics are of great importance for preventing soil and water loss and have attracted the attention of researchers (e.g., Jetten et al., 2003; Jiang et al., 2017; Panagos et al., 2015c). Lysimetric plot experiments have been developed as a direct field measurement method for the accurate quantification of surface runoff and water-induced erosion (e.g., Kosmas et al., 1997; Sumner et al., 1996; Zhu et al., 2009). However, in situ field measurement of water-induced soil erosion, with its high labor and financial costs, can only cover a small number of sampling units. It is unrealistic to expect direct field measurements to quantify water-induced erosion everywhere under various conditions.
Simulations of mathematical models are likely to compensate for the deficiency of direct field measurements on soil erosion. The Universal Soil Loss Equation (USLE; Wischmeier and Smith, 1978), its revised version (RUSLE; Renard et al., 1997) and its modified version (MUSLE; Williams, 1975) have been developed into widely used empirical mathematical models to directly calculate soil erosion based on rainfall, soil properties, topography, cover and management data. The USLE and RUSLE quantify only the various influencing factors that impact the soil loss associated with soil erosion, which is not directly related to the process of surface runoff and does not yet involve the specific process of sediment transport (Donovan, 2022; Meinen and Robinson, 2021). Fortunately, the physical process-based ROSE model, named after the developer (Rose et al., 1983), conceptualizes the soil erosion process by conceiving three continuous and simultaneous physical processes, including rainfall detachment, sediment entrainment and sediment deposition, thus providing good performance in estimating sediment yield at the plot scale. However, the ROSE model focuses only on the physical processes of water-induced erosion without engaging with the C and N cycles of the ecosystem. The Soil and Water Assessment Tool (SWAT; Arnold et al., 1998), a semi distributed hydrological model, incorporates the USLE or MUSLE to predict soil erosion at the level of hydrological response units, in which the routing of sediment transportation is not considered and the modeling of the biogeochemical element cycle is relatively simple and empirical (Ferrant et al., 2011; Pohlert et al., 2007). However, the transport of PC, PN and PP nutrients accompanied by water-induced erosion crucially depends on the carbon (C) and nitrogen (N) cycles of the ecosystems in a catchment. Previous research, which usually applied the elemental enrichment module in prediction, demonstrated that C, N and phosphorus (P) content in the eroded soil was richer than that in the surface soil (Sharpley, 1980). Therefore, knowledge of the coupling between the process-oriented hydro-biogeochemical model combined with the complex C and N cycles and the soil erosion model based on physical processes (e.g., ROSE) is essential to accurately predict soil erosion and associated PC, PN and PP nutrient transport. A recently developed hydro-biogeochemical model, Catchment Nutrients Management Model coupled with DeNitrification–DeComposition (CNMM-DNDC), by Zhang et al. (2018) might be a realistic tool in addressing the abovementioned problem. The CNMM-DNDC model introduces the complex C and N biogeochemical modules (including the modules of decomposition, nitrification, denitrification and fermentation) of a widely used biogeochemical model (DNDC; Li et al., 1992) into the distributed hydrological framework of the CNMM (Li et al., 2017). The adsorption–desorption, immobilization and transposition of elemental P in the CNMM-DNDC model originated from CNMM. The CNMM-DNDC model has been used to conduct a comprehensive simulation of complex hydrological and biogeochemical processes (such as ecosystem productivity, hydrologic N loads, gaseous N losses and greenhouse gas, GHG, emissions) of a subtropical catchment with various landscapes (Zhang et al., 2018), a model evaluation of nitrous oxide (N2O) and nitric oxide (NO) emissions from a subtropical tea plantation (W. Zhang et al., 2020), a model evaluation and regional simulation of nitrate leaching in the black soil region of northeast China (W. Zhang et al., 2021) and a comprehensive model modification and evaluation of NH3 volatilization from fertilized croplands (Li et al., 2022b). However, the CNMM-DNDC model still lacks the capacity to simulate the processes of soil erosion and associated PC, PN and PP nutrient transportation.
Therefore, we hypothesize that the accurate simulation of soil erosion and associated PC, PN and PP nutrient losses can be realized by incorporating the soil erosion physical model and the element enrichment module into the process-oriented hydro-biogeochemical model with complex C and N cycles. Based upon the above hypothesis, the objectives of this study were to (i) introduce the ROSE model (a physical soil erosion model) and the enrichment module of the particulate nutrients into the hydrological process of the CNMM-DNDC model; (ii) evaluate the performance of the CNMM-DNDC model in simulating the temporal and spatial distributions of soil erosion and associated PC, PN and PP transportation at the plot and catchment scales and (iii) investigate the impact of climate change and human activities (such as land use change) on the losses of soil and particulate nutrients through water-induced erosion.
2.1 Catchment description
The Jieliu catchment (31∘16′ N, 105∘28′ E, 400–600 m a.s.l.), located in Sichuan Province of southwest China (Zhu et al., 2009), was used for model calibration and validation. This catchment is situated in the upper reaches of the Yangtze River and has a typical subtropical monsoon climate. During the period from 2005 to 2018, the annual mean temperature was 16.7 ∘C, and the average annual precipitation was 720 mm, 75 % of which occurred during the period between June and September (http://yga.cern.ac.cn, last access: 26 July 2023). The soil in the catchment is dominated by Calcaric purple soil, classified as a Pup-Orthic Entisol in the Chinese Soil Taxonomy or as an Entisol in the U.S. Soil Taxonomy (Zhu et al., 2009). The total area of the Jieliu catchment is approximately 35 ha, and it is dominated by sloping cultivated upland (SU; 58 %), forest land (FL; 31 %) and village residential areas (RA; 10 %). The primary crops cultivated in the SU are maize (Zea mays L.), winter wheat (Triticum aestivum L.), rape (Brassica napus L.) and rice (Oryza sativa L.). N, P and potassium (K) fertilizers are applied at rates of 130–330 kg N ha−1 yr−1 (ammonium bicarbonate or urea), 72–162 kg P ha−1 yr−1 (calcium superphosphate) and 45–68 kg K ha−1 yr−1 (potassium chloride), respectively (Zhang et al., 2018). Four replicate lysimetric plots (an area of 8 m × 4 m with a slope gradient of 7 %, Fig. 1) were set to measure the surface runoff and the yields of the PN and PP (Zhu et al., 2009). To avoid unexpected seepage, each lysimetric plot was hydrologically isolated with cement-filled partition walls, which were inserted at least 60 cm into the bedrock. A conflux trough with a bucket was built in the topsoil to collect the surface runoff flow (Zhu et al., 2009).
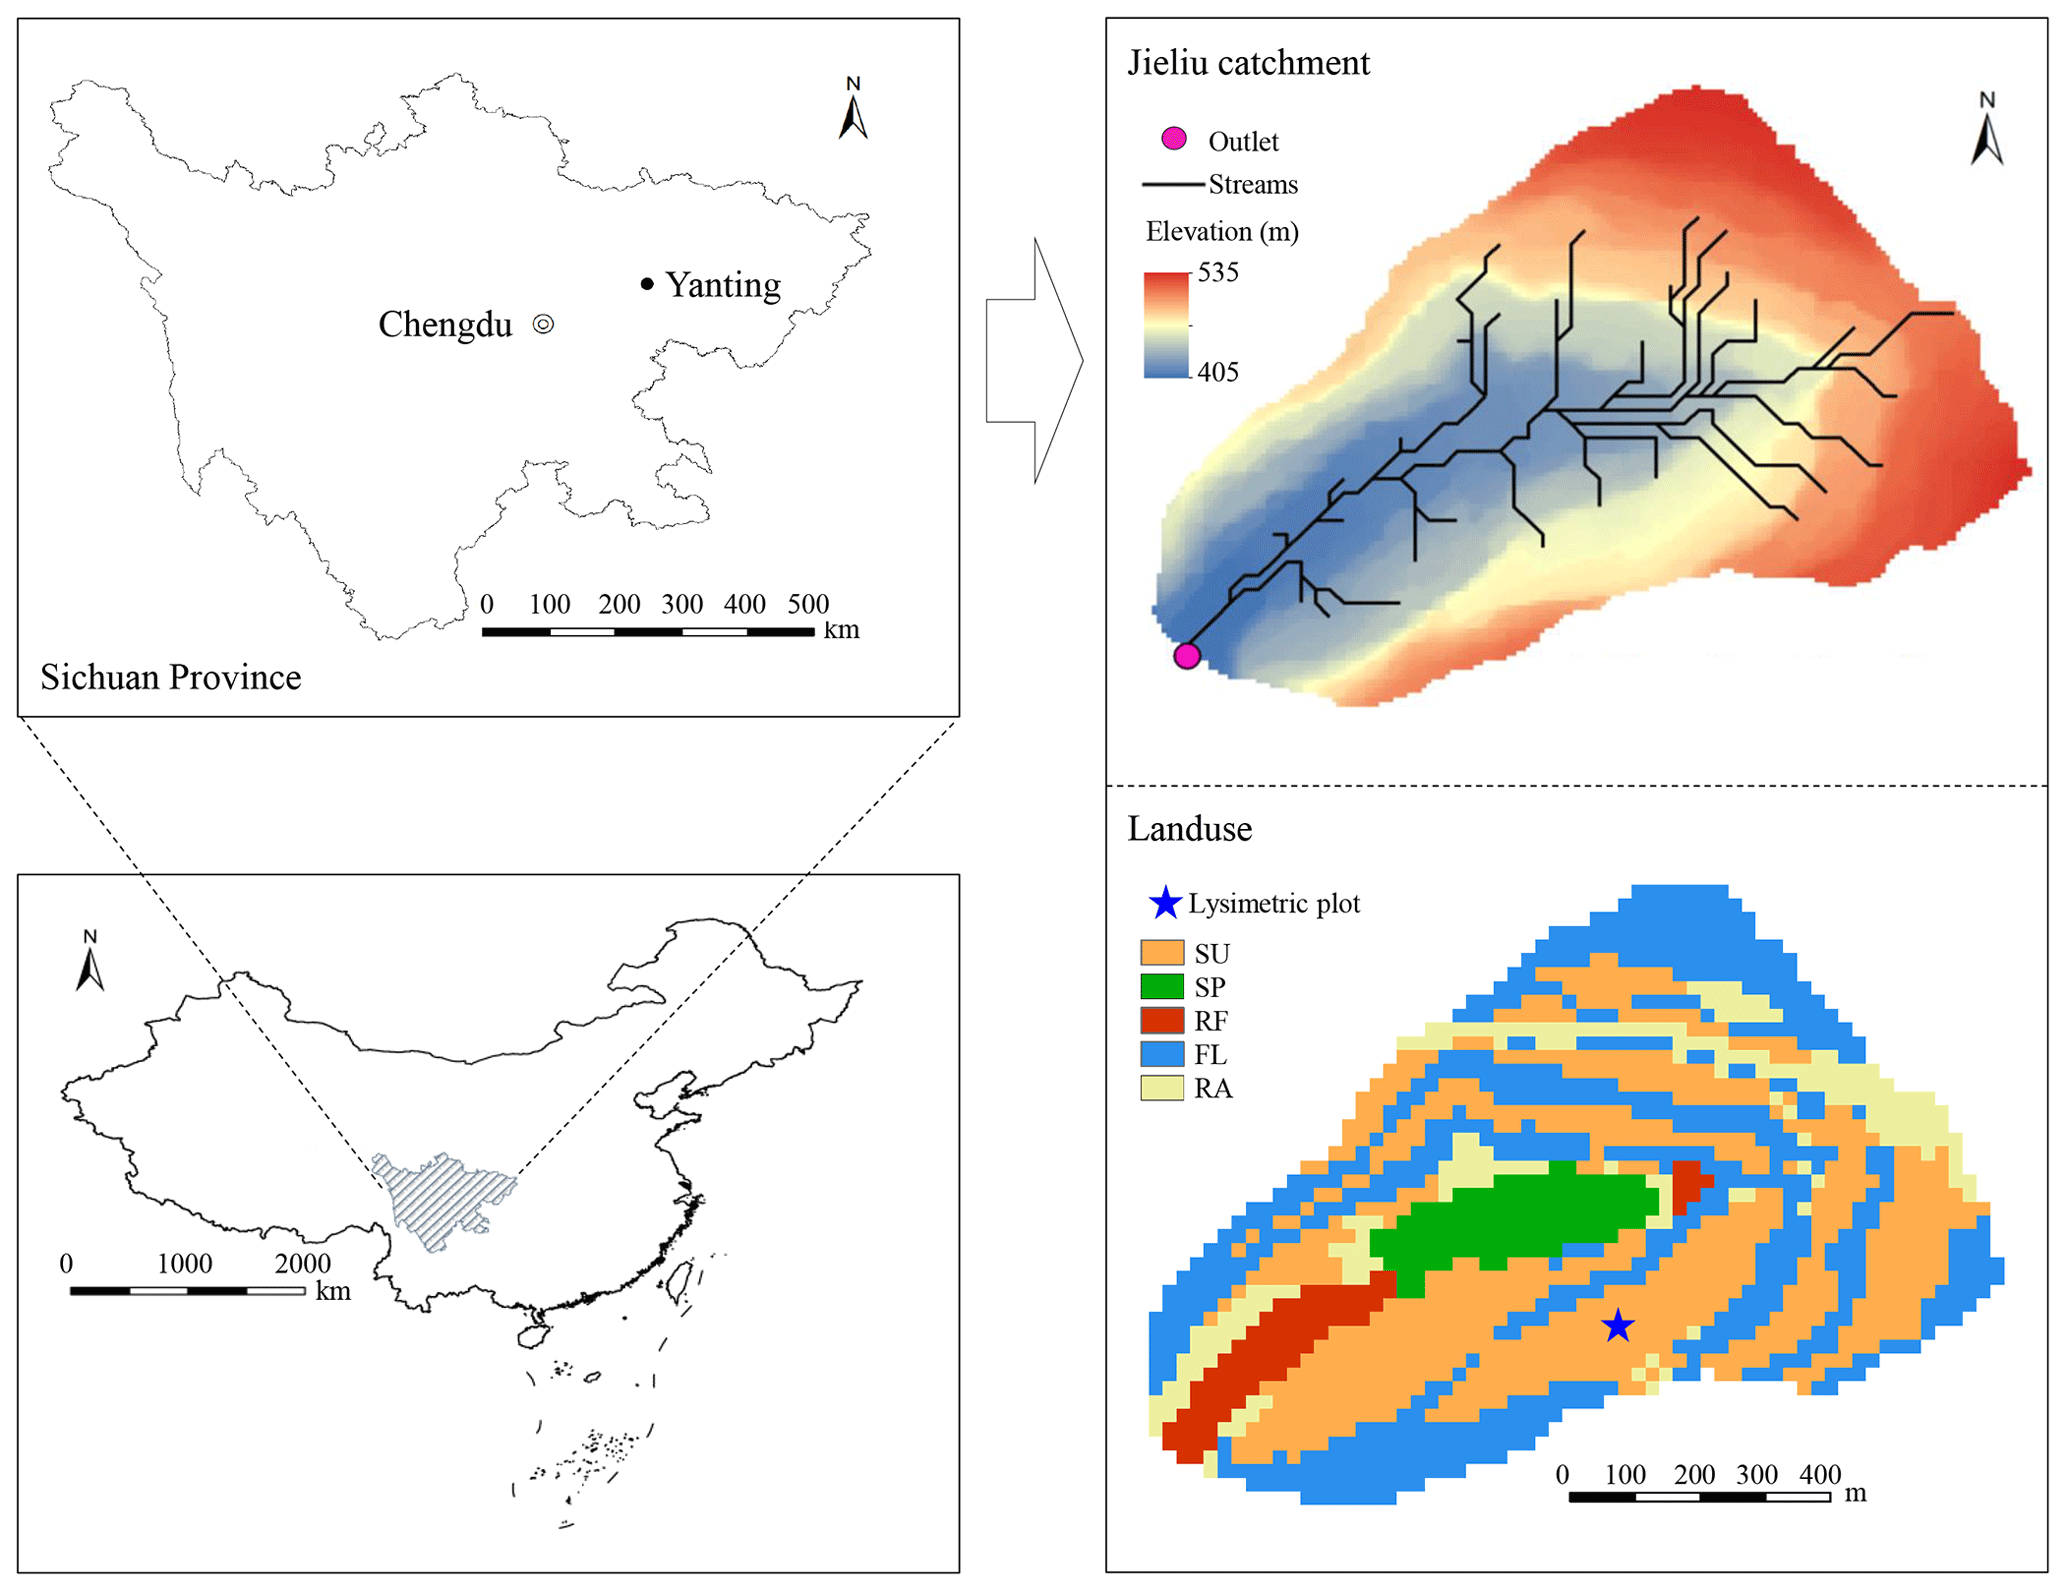
Figure 1The location, digital elevation model and land use types of the Jieliu catchment. The land use types are sloping cultivated upland (SU) with summer maize–winter wheat rotation, seasonally waterlogged paddy (SP) with paddy rice–winter wheat rotation or paddy rice–rape rotation, winter-flooding paddy with the paddy rice flooding–fallow regime (RF), forest land (FL) and village residential areas (RA).
2.2 Overview of the CNMM-DNDC model
The CNMM-DNDC is a process-oriented hydro-biogeochemical model, which was established following basic physics, chemistry and biogeochemistry theories through incorporating the processes of C and N cycling of the DNDC into the hydrological framework of the CNMM (Zhang et al., 2018). The core processes simulated by CNMM-DNDC include thermal conduction, energy balance, hydraulic dynamics (e.g., soil evaporation, transpiration, canopy interception, infiltration, percolation, surface runoff, subsurface flow and water uptake by plants), C and N cycling (e.g., mineralization, immobilization, decomposition, nitrification, denitrification, nitrate leaching, urea hydrolysis, plant uptake and gas emissions), plant growth (e.g., photosynthesis and respiration) and the discharge and water quality of river networks (Fig. S1 in the Supplement).
2.3 Model modifications
The CNMM-DNDC model can simulate the lateral movements of water-soluble nutrients (e.g., ammonium, nitrate, phosphate and dissolved organic matter) by surface and subsurface runoff, whereas it lacks the capabilities of simulating soil erosion and sediment transport caused by surface runoff and the associated transportation of PC, PN and PP. To address this deficiency, this study incorporated the modules of soil erosion and element enrichment into the lateral hydrological framework of the CNMM-DNDC model (Sect. S1). Therefore, the upgraded CNMM-DNDC model was equipped with the ability to estimate the movements of soil particles and particulate nutrients transported with surface runoff in the lateral dimension (Fig. S1). The soil erosion module adopted the simplified ROSE model (Rose et al., 1983; Stewart, 1985), which is a process-oriented soil erosion model. The ROSE model is based on the dynamic equilibrium of three simultaneous processes, including rainfall detachment, runoff detachment, and sediment deposition. In an individual erosion event, the process of runoff detachment dominates, and the latter two processes of rainfall detachment and sediment deposition can generally be neglected (Stewart, 1985). Therefore, in the simplified ROSE module, the sediment yield (Ys, kg dry soil ha−1) resulting from soil erosion was driven by the actual surface runoff (Rs, m) and concomitantly regulated by the coverage fraction of vegetation (Cv, fraction) and the land's slope angle, which was represented by the absolute value of the sine value of the land's slope angle (Sl, dimensionless), as shown in Eq. (1). The complete physical processes for soil erosion of the ROSE module (Sect. S2) were the reason why we chose it, though the two processes which had minor effects on soil erosion in an individual erosion event were neglected in the simplified ROSE module. The upgraded CNMM-DNDC was expected to provide the effects of field management (e.g., tillage) on soil chemical or physical properties to influence soil erosion instead of applying the empirical mathematical formula to predict the effects of field management, as in USLE and its revised and modified versions (Panagos et al., 2015b; Meinen and Robinson, 2021).
Here, Rs is calculated from the existing hydrological module of the CNMM-DNDC model, in which Rs occurs in the following two cases. First, Rs is caused by the mechanism of excess infiltration, in which the water input (i.e., precipitation and irrigation) is greater than the maximum infiltration capacity of the soil. Second, Rs is derived from the mechanism of excess storage, in which precipitation or irrigation still occurs when the soil surface water content exceeds the corresponding saturated water content. The direction of the surface runoff conflux is estimated by the distributed weights of four neighboring grids (i.e., in the upper, lower, left and right directions), which are calculated based on the elevation of these grids. η (dimensionless) is the efficiency of sediment entrained by surface runoff, which depends on soil texture and Cv, as shown in Eq. (2).
In Eq. (2), a1 is the rate of sediment carried by surface runoff on bare land, which differs for various soil textures and generally needs to be calibrated by the observed data of sediment yield for a given study area. Loch and Donnollan (1983) reported that a1 varies from 1.0 % to 8.7 % in Middle Ridge clay loam and Irving clay soils. Among the only eight soil erosion observations conducted in the lysimetric plot from 2015 to 2017, four observations in 2016 were provided for model calibration. Additional soil erosion observation of the lysimetric plots with different soil textures are needed to operate the CNMM-DNDC in order to establish the general relationship between a1 and soil texture (e,g., soil clay, silt and sand contents) in the future. Moreover, the value of Cv for the natural vegetation (e.g., forest and grass) was addressed as half of the ratio of the real leaf area index (LAI) and the maximum LAI (which is one of the model inputs). For the crop system, the LAI was the function of the growing index, which is estimated by the ratio of the accumulated temperature from sowing to the present time to the accumulated thermal degree for maturity in the plant growth module. Thus, the Cv value of the crop was calculated by the growing index. The Cv value of the artificial lands (e.g., the urban or rural residential areas) was calibrated and set to 0.1, which represented the effects of concrete roads and residential buildings on the reduction of the soil area exposed to erosion. The Cv value of the artificial lands may generally be quantified using the coverage of buildings and cement roads with more observations in the future.
It is known that the eroded sediments are usually richer in C, N and P elements than the in situ soils from which the eroded sediments originate (Massey and Jackson, 1952; Schiettecatte et al., 2008; Wan and El-Swaify, 1998). The above phenomenon is usually referred to as sediment enrichment, which can be quantified by an empirically based enrichment ratio (E). E is usually defined as the ratio of the concentration of C, N and P elements in the eroded sediment to that in the source soil (Sharpley, 1980; Teixeira and Misra, 2005). Generally, as more eroded sediment is produced, the richness of the C, N and P elements decreases. The enrichment ratio of the C and N nutrients (ECN) is estimated by Eq. (3), which was adapted from McElroy et al. (1976) and Williams and Hann (1978). The pre-exponential factor (k1) of Eq. (3) was calibrated to 1.2 using the PN data observed at the lysimetric plot in this study. The enrichment ratio of P nutrients (EP) is calculated by Eq. (4) from Sharpley (1980).
The yields of PC (PC, kg C ha−1), PN (PN, kg N ha−1) and PP (PP, kg P ha−1) nutrients caused by soil erosion were calculated based on E, Ys and the content of the corresponding organic C (CC, g C ha−1), N (CN, g N ha−1) and P (CP, g P ha−1) pools in topsoil using Eqs. (5)–(7), respectively. BD (g m−3) and Ds (m) refer to the soil bulk density and the depth of topsoil, respectively. Eight of the soil organic C and N sub-pools participated in the process of soil erosion: pools of very labile, labile and resistant decomposable litters, labile and resistant active microbes and labile, resistant and passive humus. Five of the soil organic P sub-pools were involved in the process of soil erosion: the pools of active and passive organic P, active and dead microorganism P and inert stable P. Meanwhile, the flows of C, N and P among the pools of the labile and resistant organic and inorganic were considered in the CNMM-DNDC. For example, the C and N of the litter and humus pools and the P of the pools of the active or passive organic P and the inert stable P could flow into inorganic pools and microbe pools by decomposition. The PC, PN and PP yields calculated by the element enrichment module were also deducted from the corresponding sub-pools of the topsoil. Subsequently, the eroded soil and PC, PN and PP nutrients are transported with the surface runoff and eventually drain into streams. The upgraded model considered the mass balances of soil water and the elements of C, N and P, without considering soil body balance.
2.4 Preparation for model simulation
The input data for driving the model operation consisted of meteorological data at the 3 h scale (including average air temperature, solar radiation, longwave radiation, wind speed, humidity and total precipitation), spatialized soil properties (including soil texture, soil organic carbon, bulk density and pH), a gridded digital elevation model (DEM, Fig. 1) with a resolution of 5 m × 5 m, the spatial distribution of land use (Fig. 1) and cropping systems and the field management practices. Taking the efficiency of the model calculation and the accuracy of the biogeochemical process description into consideration, the upgraded CNMM-DNDC model conducted a simulation with a grid of 15 m × 15 m from 2004 to 2017, with an initial spin-up period of 10 years. The DEM, soil properties, land use, cropping systems, field management practices and meteorological data from 2004 to 2014 were primarily adapted from Zhang et al. (2018). The remaining meteorological data were adapted from the hourly observations provided at the National Science & Technology Infrastructure (http://rs.cern.ac.cn, last access: 26 July 2023). The information about the vertical layered soil properties (e.g., soil bulk density; pH; clay content; field capacity; wilting point; saturated hydraulic conductivity; organic C; total nitrogen, TN, and total phosphorus, TP, content) of different land uses are listed in Table S1. The input data of soil properties, DEM, land use and cropping systems and field management practices were resampled to the ASCII grids at a resolution of 15 m × 15 m using the ArcGIS 10.0 software package (ESRI, Redlands, CA, USA). The observation data measured at the lysimetric plot and the catchment outlet, which are listed in Table S2, contributed to model calibration and validation. The surface runoff, associated sediment yield and PN and TN yields from 2004 to 2006 with three replicates and surface runoff, associated sediment yield and TP yield from 2017 to 2018 with three replicates measured at the lysimetric plots were adapted from Deng et al. (2011) and Hu (2020), respectively. The monthly stream flow, sediment yield and PN and TN yields from 2007 to 2008 measured at the catchment outlet were directly taken from Deng et al. (2011). TN is the total amount of NH, NO, dissolved organic N and PN. TP is the total amount of dissolved organic and inorganic P and PP. Among them, the observed data from the lysimetric plot in 2004 (with seven observation times) and 2016 (with four observation times and a heavy precipitation event) and the observed data from the catchment outlet in 2007 were used for model calibration, and the remaining observed data were used for model validation. Previously, a comprehensive and systematic verification of the CNMM-DNDC simulation on soil temperature, soil moisture, crop yield, water flows, nitrate loss, fluxes of methane, ammonia, NO and N2O and stream discharges of water and NO was conducted by Zhang et al. (2018), which was statistically in good agreement with the observations.
2.5 Climate and land use scenario settings
Scenario analysis was adopted to assess the impact of climate change and land use change on water-induced erosion and associated nutrient losses. The baseline scenario was set as the traditional land use types and management in 2008 (the year for model validation) with local and historical meteorology. Two groups of climate change and land use change scenarios were designed: single-factor change and multi-factor change scenarios (Table S3). The single-factor change scenarios altered only one factor while keeping the others constant. The single-factor change scenarios of climate change consisted of two parts. One part, for air temperature change, was altered within the range of −4 to +4 ∘C with an interval of 0.2 ∘C. The other part, for precipitation change, was altered over the range from −30 % to +30 % with an interval of 2 %. For the sake of argument, we divided air temperature and precipitation single-factor scenarios into four groups: a lower and higher warming group (i.e., the air temperature increased from 0 to 2 ∘C and from 2 to 4 ∘C), a lower and higher cooling group (i.e., the air temperature decreased from 0 to 2 ∘C and from 2 to 4 ∘C), a lower and higher rain-enhanced group (i.e., the precipitation increased from 0 % to 20 % and from 20 % to 30 %) and a lower and higher rain-reduced group (i.e., the precipitation decreased from 0 % to 20 % and from 20 % to 30 %). A single-factor change scenario of land use was designed as SU changed into FL with a lower soil erosion rate (i.e., UFL scenario). The existing land use conversion to another type, such as the change from cropland to FL or some other land use, is a kind of compromise and required a sensitivity analysis of the model simulation rather than representing the conditions of the real natural system (Dey and Mishra, 2017). The IPCC's Summary for Policymakers (IPCC, 2021) points out that average annual global land precipitation is projected to increase by 10.5 % and 30.2 % at the 1.5 and 4 ∘C warming levels, respectively. According to the correspondence between climate warming and increasing precipitation in the IPCC's Sixth Assessment Report (AR6), the multi-factor change scenarios were designed into two multiple climate change scenarios: the low and high GHG emissions scenarios. The low GHG emissions scenario represents air temperature and precipitation increasing by 1.5 ∘C and 10 %, respectively, while the high scenario represents air temperature and precipitation increasing by 4 ∘C and 30 %, respectively. Furthermore, we also explored the effect of the low and high GHG emissions scenarios in a combination of land use change scenarios (i.e., UFL scenario) on sediment yield and particulate nutrient yields. The tillage scenario analysis was involved in the scenario analysis of alternative management practices, which were conducted as the no tillage operation in 2008. The relative change deviations of the simulated annual accumulated sediment and particulate nutrient yields at the catchment outlet of the designed scenarios from the baseline were provided as the quantitative evaluation index for scenario analysis (Abdalla et al., 2020; Dubache et al., 2019). Moreover, the crop yield changes between the designed scenarios and the baseline were evaluated in the scenario analysis.
2.6 Evaluation of model performance and statistical analysis
The performance of the upgraded CNMM-DNDC model in simulating sediment and particulate nutrient yields was evaluated using the normalized root mean square error (nRMSE), the Nash–Sutcliffe index (NSI) and the slope, determination coefficient (R2) and significance level (p) of the univariate linear regression (ULR) between the simulation and observation. The nRMSE and NSI values are calculated by Eqs. (8) and (9), respectively. Oi and Si are the observed and simulated values, respectively. is the mean value of the observed data, and n is the number of paired samples. If the value of nRMSE is closer to 100, the values simulated by the model are more coincident with the observed values (Cui et al., 2014; Smith et al., 1997). The value of the NSI provides the discrepancy between the simulated values and the mean of the observed values, with a positive value indicating an acceptable simulation (Li et al., 2022a). The closer to 1 the slope and R2 of the ULR are, the better the simulated values match the observed values. The Origin 8.0 (OriginLab Ltd., Guangzhou, China) and ArcGIS 10.0 software packages were used for graph drawing.
In addition, Pearson correlations were carried out to study the relationships between the variables relevant to soil erosion and those related to the biogeochemical process. The Pearson correlation coefficient (r) is used to measure the correlation between two variables, with the value ranging from −1 to 1. The R software was applied for the graph drawing of the correlation matrix.
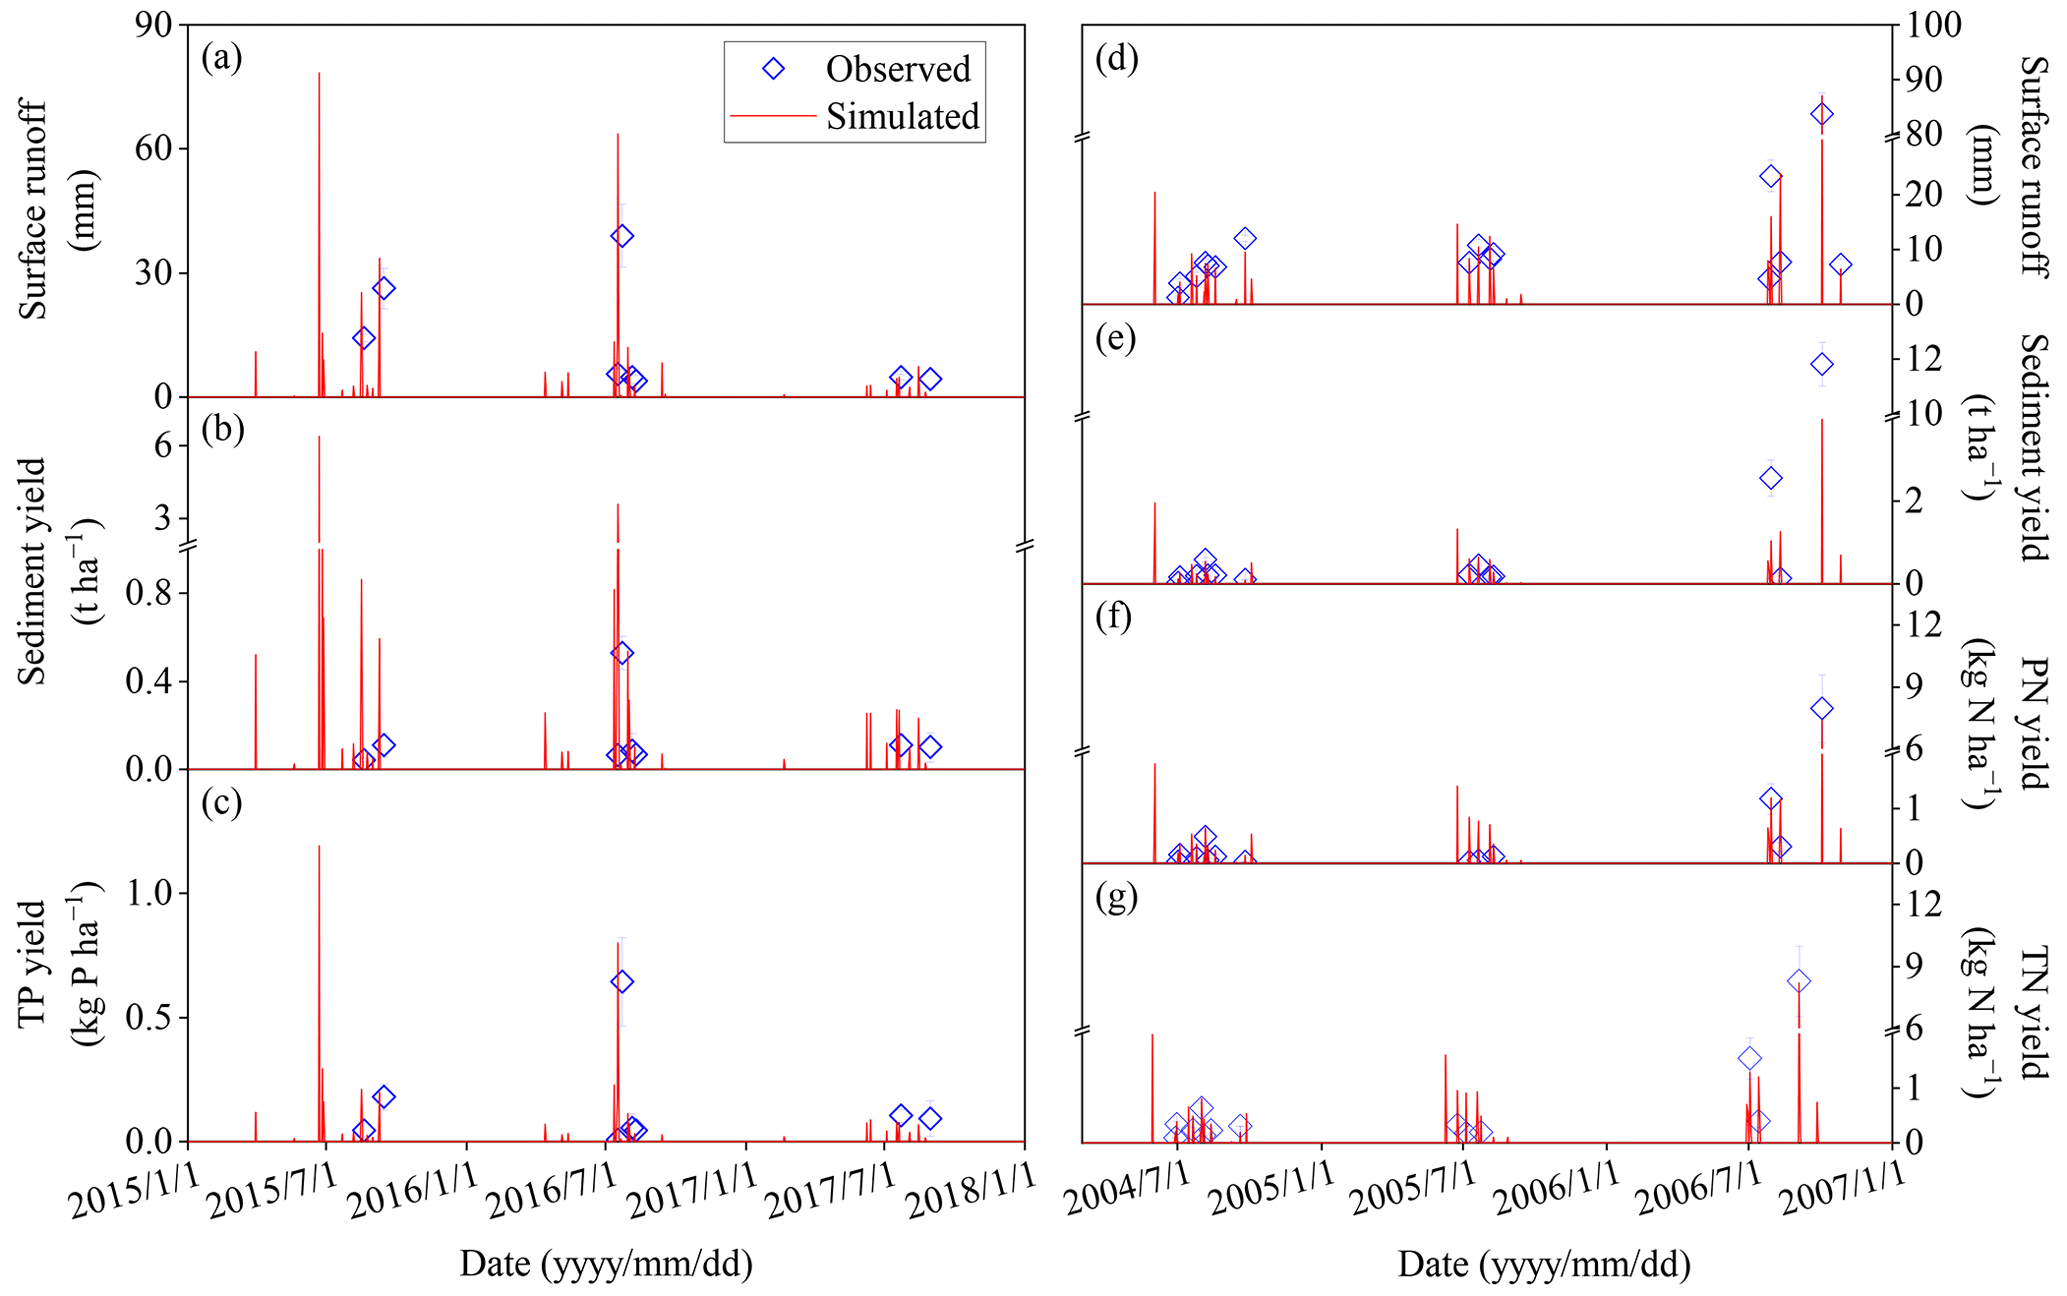
Figure 2Observed and simulated surface runoff (a), sediment yield (b) and total phosphorus (TP) yield (c) from 2015 to 2017 and surface runoff (d), sediment yield (e), particulate nitrogen (PN) yield (f) and total nitrogen (TN) yield (g) from 2004 to 2006 in the lysimetric plot. TP means the total amount of dissolved phosphorus and particulate phosphorus (PP). TN means the total amount of NH, NO, dissolved organic nitrogen and PN. The vertical bars indicate the standard error of three spatial replicates. The observed data, from Deng et al. (2011), Zhang et al. (2018), Li et al. (2022a) and Hu (2020), were provided by Bo Zhu.
3.1 Model performance in simulating soil erosion in the lysimetric plot
Given the limited size of the samples, the performance of the upgraded CNMM-DNDC model was revealed using only the graph of the predictions and observations (Fig. 2a–c), without a quantitative evaluation with the above statistical criteria. The temporal dynamic patterns of the simulated surface runoff, sediment and concomitant PP yields were in accordance with the observed values when either model calibration or validation was performed (Fig. 2a–c). Nevertheless, on 23 July 2016, which witnessed a heavy precipitation event (213 mm precipitation over the 7 d prior to the observation day), the upgraded model overestimated the observed sediment yield by approximately 6 times (3.6 versus 0.6 t ha−1, Fig. 2b). However, the simulated surface runoff and TP yield were only approximately 60 % and 20 % larger than the observed values, respectively. Unfortunately, the simulated peaks of surface runoff and sediment yield at the end of June 2015 lacked the support of the observations. Moreover, we conducted an evaluation of the simulated and observed NH and NO yields accompanied by surface runoff in the lysimetric plot (Fig. S2). The upgraded model generally captured the temporal variation and magnitude of the observed NH and NO yields, although discrepancies existed in the magnitude of the peak yields (i.e., the model underestimated NH yield caused by approximately 100 mm precipitation on 4 September 2006; Fig. S2).
3.2 Model performance in simulating soil erosion at the catchment outlet
The monthly observed and simulated stream flow, sediment yield, PN and TN yields at the outlet of the Jieliu catchment from 2007 to 2008 are illustrated in Fig. 3. The observed stream flow and sediment yield began to increase dramatically with the concentrated precipitation in summer and early autumn but rarely occurred in winter and spring (Fig. 3a–c). The upgraded CNMM-DNDC model successfully predicted the above temporal pattern of the stream flow and sediment yield at the catchment outlet with acceptable NSI values of 0.89 and 0.89 and significant ULRs with R2 values of 0.98 and 0.96 and slope values of 0.98 and 0.90 for model validation, respectively (Table 1). Moreover, model validation of sediment yield resulted in a larger nRMSE (38.23 %) than that of stream flow simulation (34.57 %).
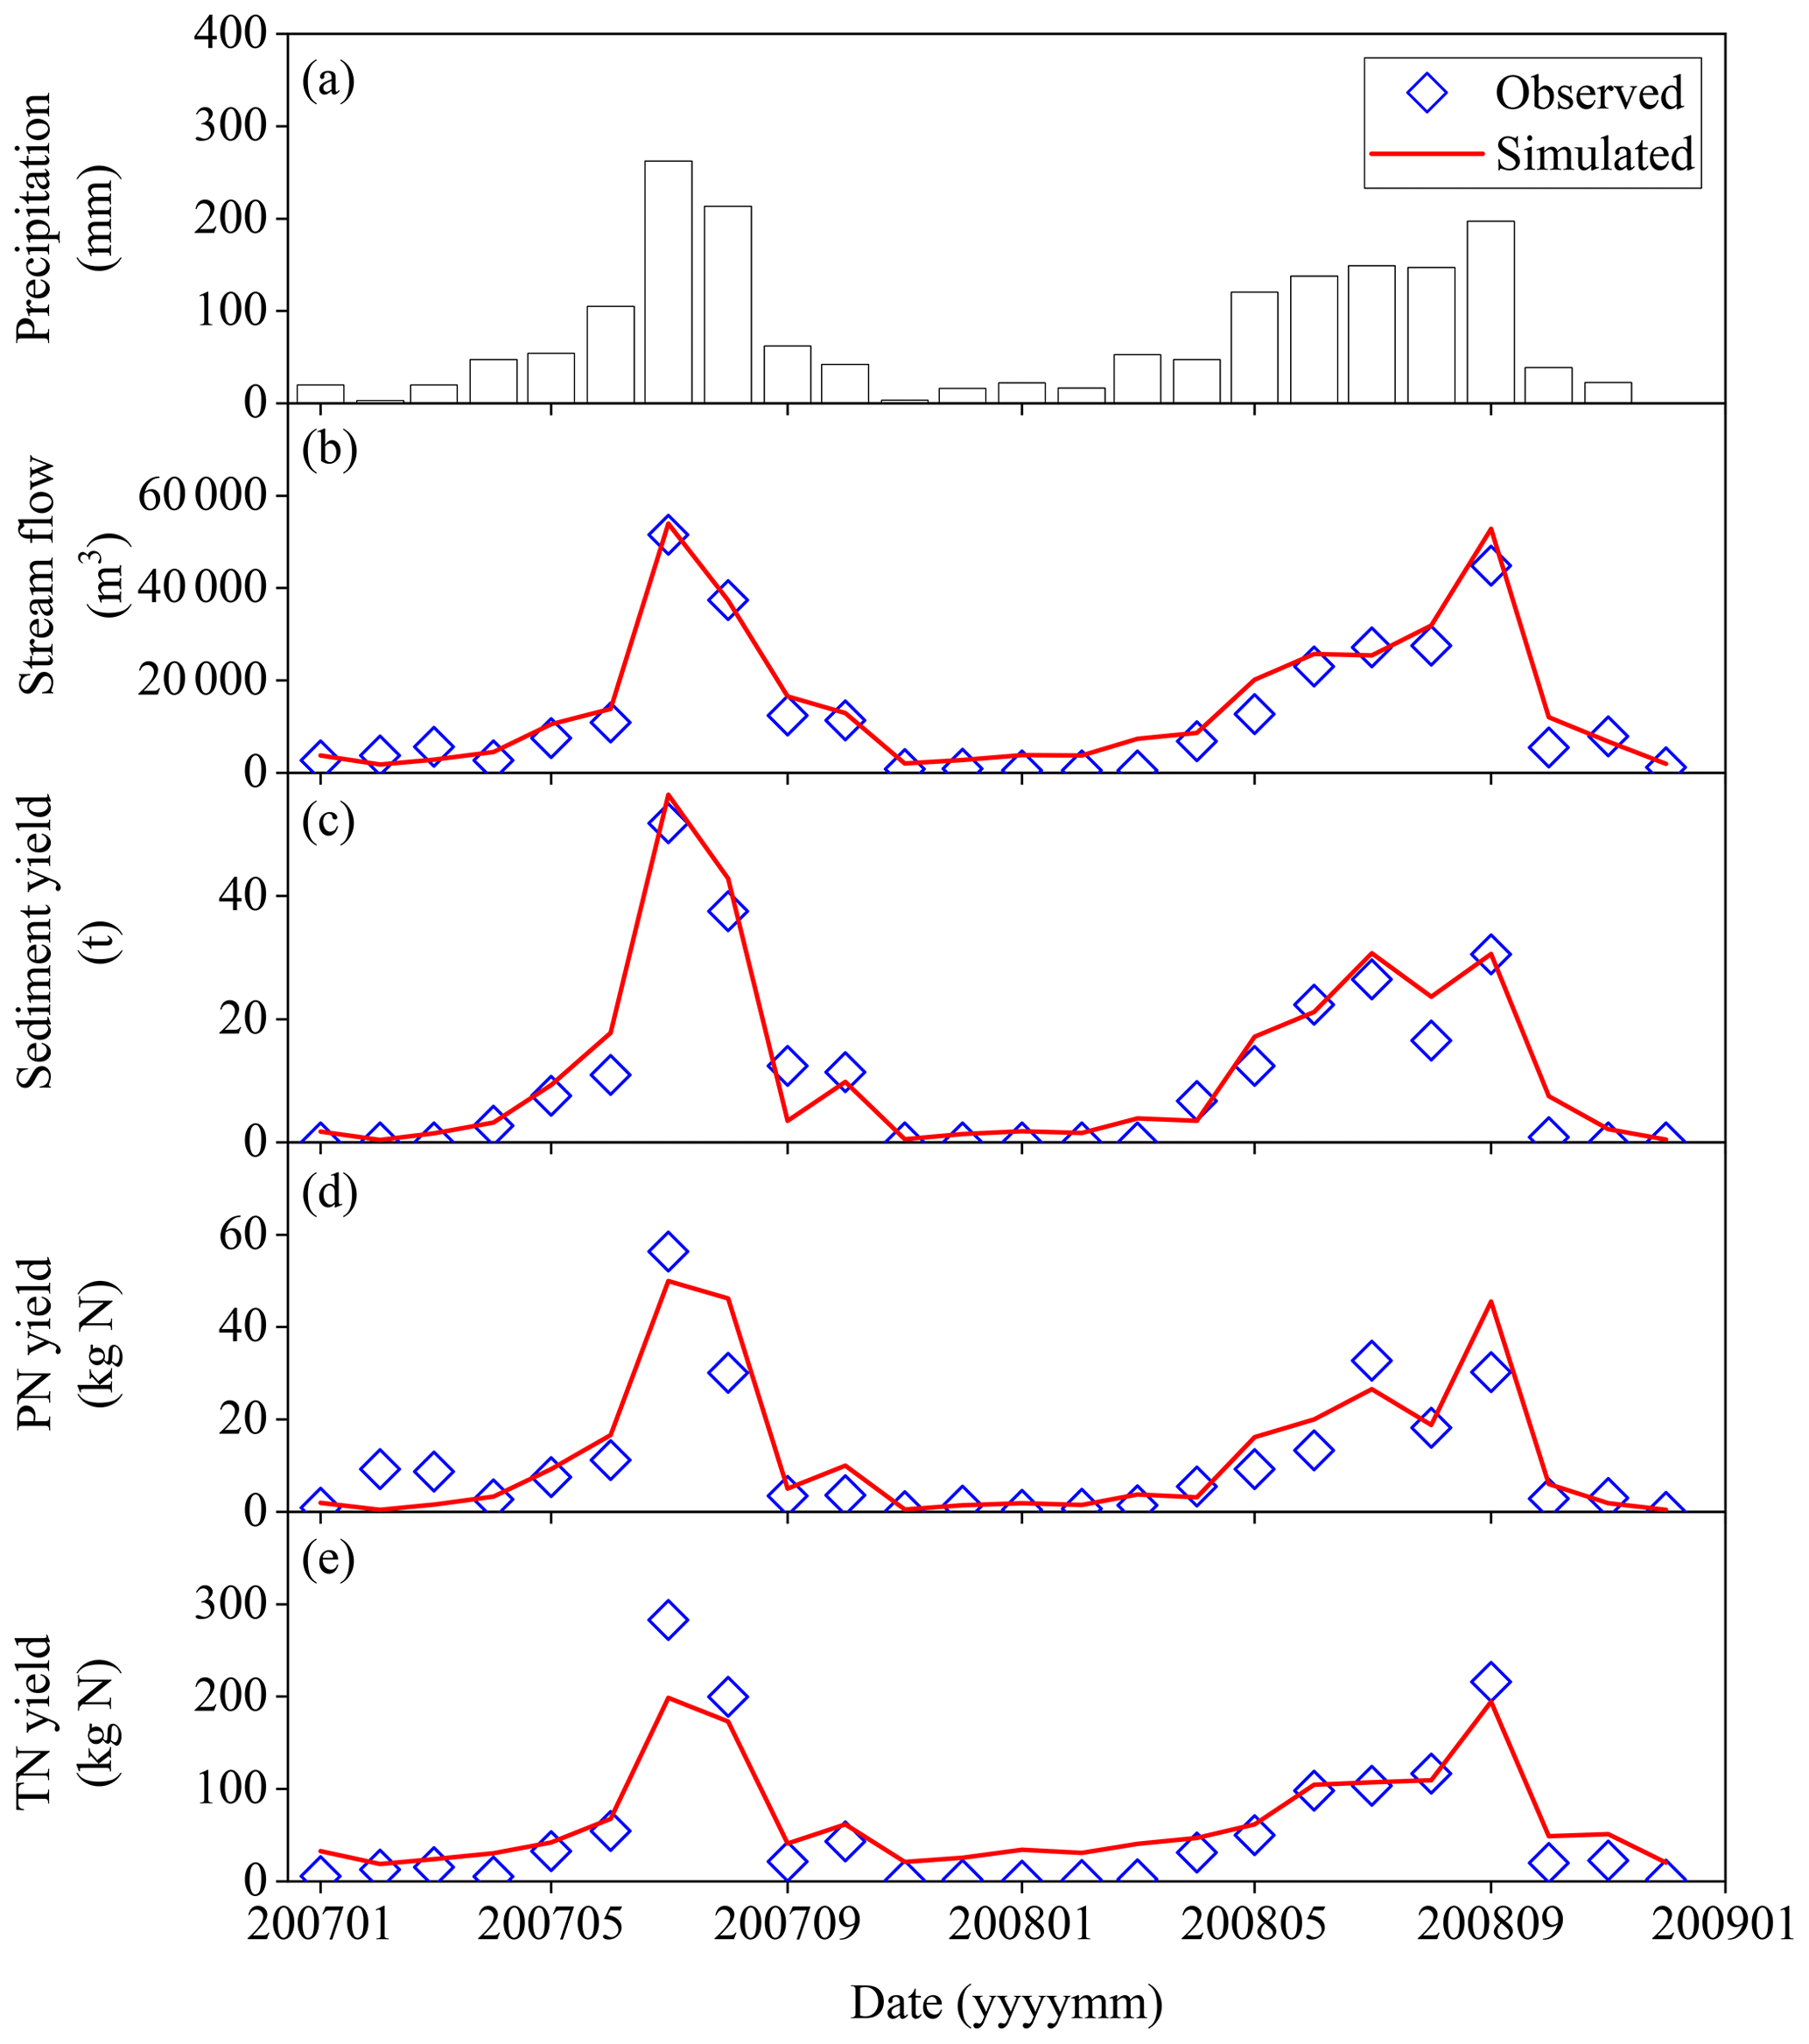
Figure 3Monthly observed precipitation (a), observed and simulated stream flow (b), sediment yield (c), particulate nitrogen (PN) yield (d) and total nitrogen (TN) yield (e) at the outlet of the Jieliu catchment from 2007 to 2008. TN is the total amount of NH, NO, dissolved organic nitrogen and PN. The observed data, from Deng et al. (2011) and Zhang et al. (2018), were provided by Bo Zhu.
Table 1Performance of the upgraded CNMM-DNDC model in simulating the stream flow, sediment yield and particulate nitrogen (PN) and total nitrogen (TN) yields at the Jieliu catchment outlet from 2007 to 2008. TN is the total amount of NH, NO, dissolved organic nitrogen and PN.
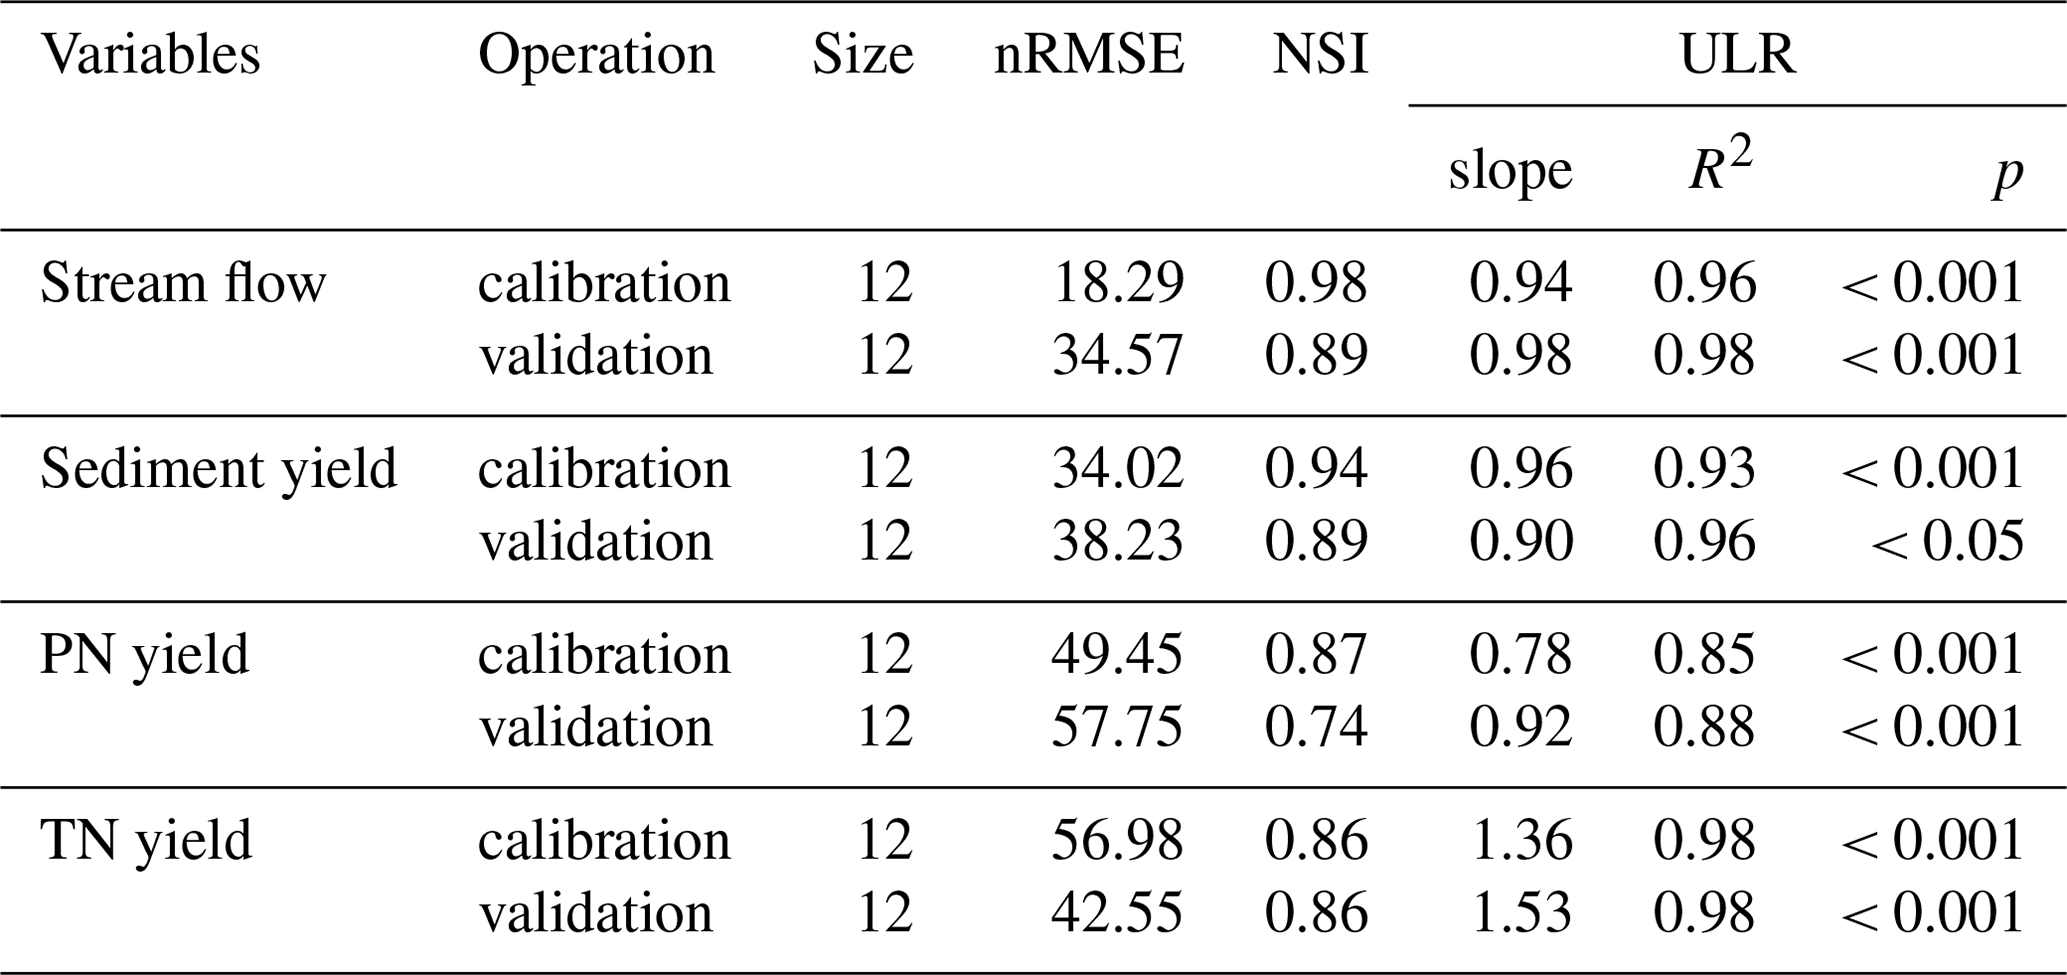
The statistical criteria used to quantify the discrepancy between observations and simulations include the normalized root mean square error (nRMSE), the Nash–Sutcliffe index (NSI) and the slope, determination coefficient (R2) and significance level (p) of the univariate linear regression (ULR). “Size” means sample size. The column “Operation” specifies whether the evaluation is conducted for model calibration or validation.
The observed monthly PN and TN yields revealed a similar temporal pattern to that of sediment yield (Fig. 3d–e), ranging from 0 to 56.3 kg N and 0.9 to 283.1 kg N with a mean value of 10.5 and 55.9 kg N, respectively. The corresponding simulated monthly PN and TN yields resulted in ranges of 0.5 to 50.4 kg N and 18.8 to 196.0 kg N with averages of 12.0 and 65.1 kg N, respectively. The upgraded model provided an overestimation of the monthly PN yield in August 2007 and September 2008 by 11.3 and 14.8 kg N, respectively. The PN yields in February 2007, March 2007, July 2007 and July 2008 and the TN yield in summer were underestimated. However, in terms of the validation, statistical comparisons between the simulated PN and TN yields showed significant ULRs with R2 values of 0.88 and 0.98 and slope values of 0.92 and 1.53, nRMSE values of 57.75 % and 42.55 % and NSI values of 0.74 and 0.86, respectively (n=12; Table 1). Meanwhile, the upgraded CNMM-DNDC model successfully predicted the temporal variation and magnitudes of NO yield at the catchment outlet, although the model slightly underestimated the peak yield in July and August of 2007 and in September of 2008 (Fig. S3). The successful prediction of the PN and NO yields and the underestimation of the TN yield in July of 2007 might illustrate that the model underestimated NH or dissolved organic N yields in July of 2007. As the above results demonstrated, the simulated and observed PN and TN yields at the catchment outlet indicated good agreement despite the slight underestimation of the individual large values when heavy precipitation occurred.
3.3 Components of the simulated TN and PN at the catchment outlet
The monthly components of TN and/or PN simulated from the original and upgraded CNMM-DNDC model during the model validation of 2008 at the catchment outlet are illustrated in Fig. 4. Among the TN components, including PN, NH, dissolved organic N (DON) and NO, the simulation from both the original and upgraded CNMM-DNDC demonstrated that the proportion of NO at the catchment outlet was larger than that of NH during the period from May to September, when the larger precipitation events and amounts appeared. Moreover, the upgraded CNMM-DNDC demonstrated that PN accounted for up to 16.2 %–26.6 % of the TN components during the period with larger precipitation events and amounts. Meanwhile, the labile or resistant humus N accounted for 11.3 %–20.3 % of the PN components, though the passive humus N accounted for the largest of the PN components. In addition, compared with the original model, the upgraded model simulated the observed TN with smaller nRMSE (42.55 % versus 51.67 %), better NSI (0.86 versus 0.80) and slightly improved r2 of the ULRs (0.98 versus 0.97) though no significant difference was found between the original and upgraded model (Fig. 4).
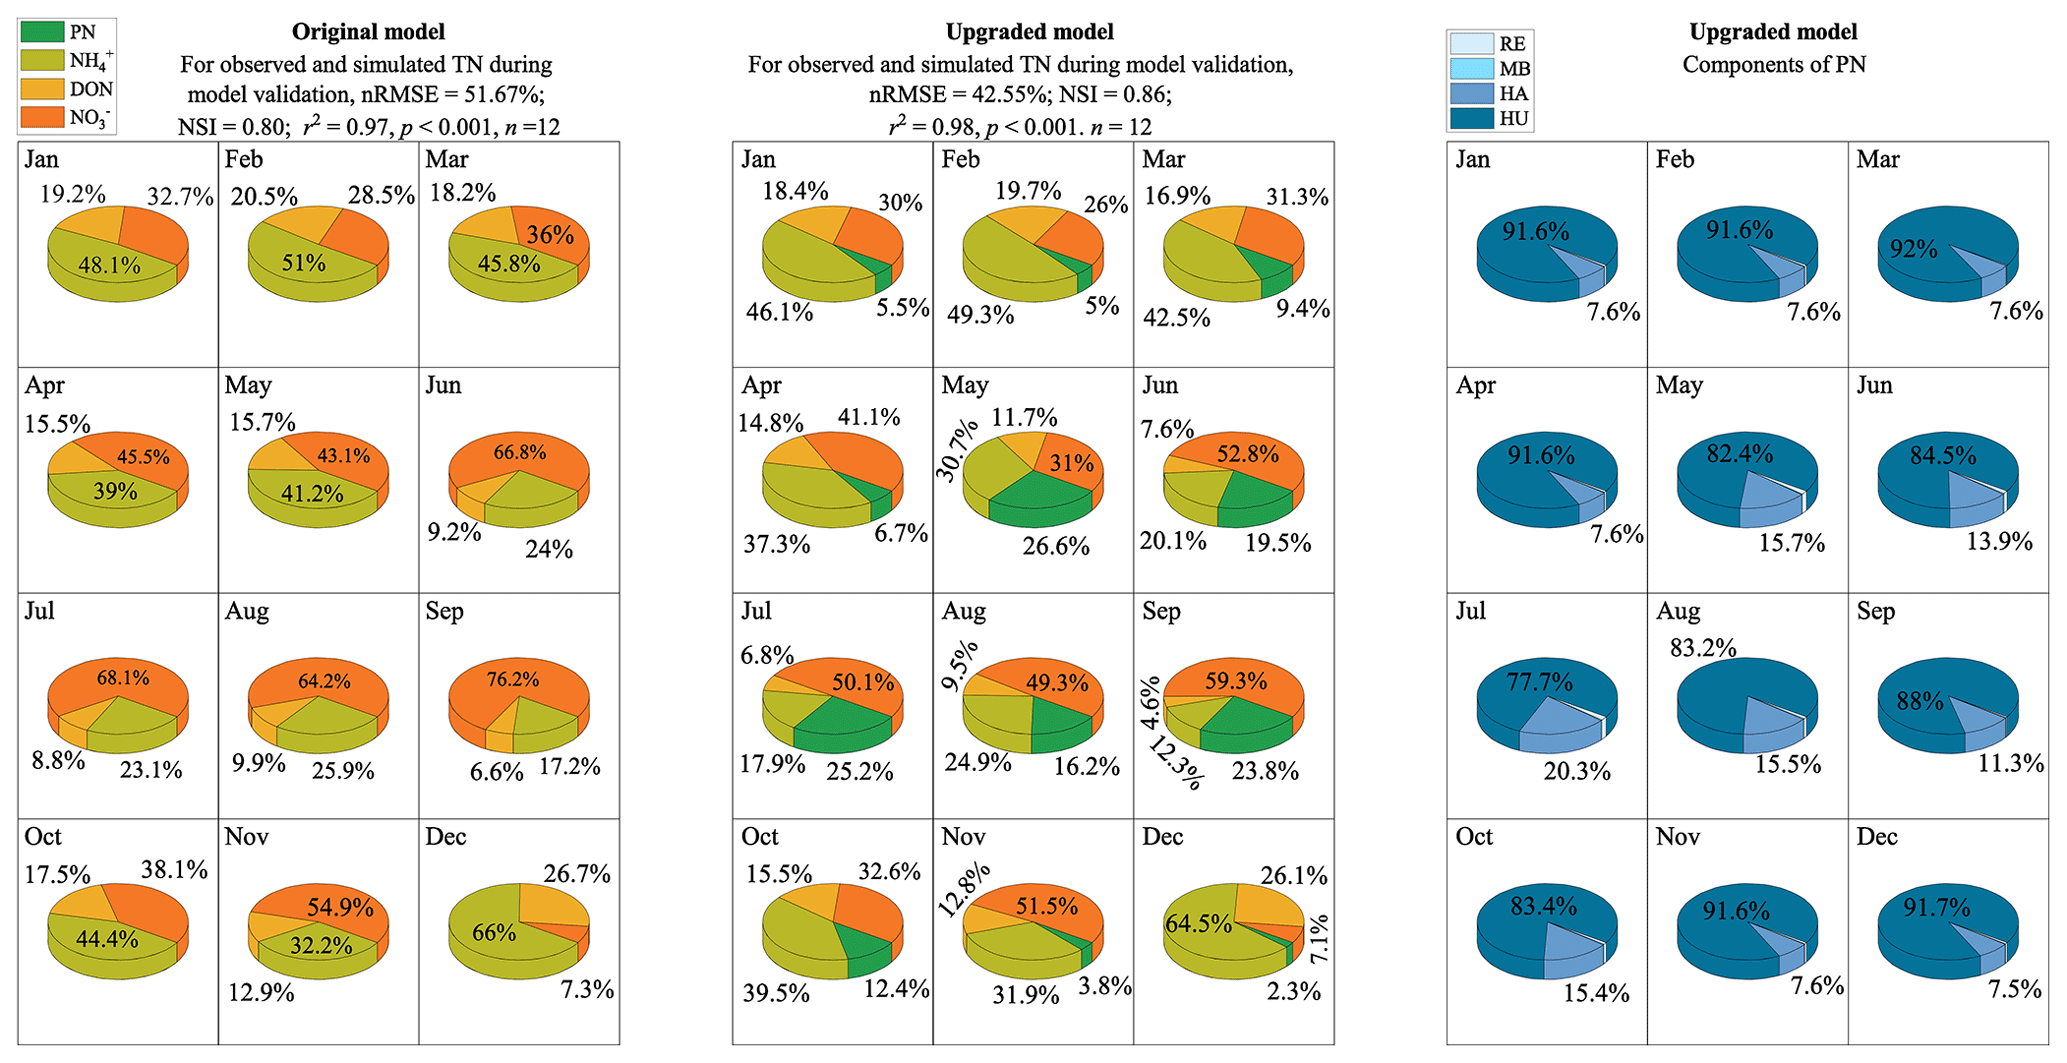
Figure 4Components of the simulated total nitrogen (TN) yield of the original CNMM-DNDC and components of the simulated TN and particulate nitrogen (PN) yields of the upgraded model during the model validation. DON is the abbreviation of the dissolved organic nitrogen. The components of PN are the nitrogen from residue (RE), microbe (MB), labile or resistant humus (HA) and passive humus (HU).
3.4 Spatial distributions of sediment yield and PC, PN and PP yields
Figure 5 illustrates the simulated spatial distributions of the sediment yield and PC, PN and PP yields and the effects of different land uses on those in the validation year, 2008. The annual accumulated sediment yield simulated by the upgraded model amounted to 0–106.6 t ha−1 yr−1 with an average of 5.0 t ha−1 yr−1 in 2008, which was a moderate rainfall year (952 mm) with eight large rainstorm events (exceeding 50 mm rainfall within 24 h). The simulated annual accumulated PC, PN and PP yields were 0–595.7 kg C ha−1 yr−1, 0–56.0 kg N ha−1 yr−1 and 0−7.9 kg P ha−1 yr−1 with averages of 63.6 kg C ha−1 yr−1, 6.1 kg N ha−1 yr−1 and 0.9 kg P ha−1 yr−1, respectively. The SU contributed to the greatest yields of sediment and PC, PN and PP nutrients, with 68 %, 60 %, 58 % and 57 % of the total, respectively. Approximately 21 % of sediment yield came from the RA as the second largest contributor to sediment yield, while the FL were the secondary sources of PC, PN and PP yields, with 30 %, 32 % and 32 % of total yields, respectively. Meanwhile, the highest rates of PC, PN and PP yields per unit area occurred in the SU, with 84.1 kg C ha−1 yr−1, 7.7 kg N ha−1 yr−1 and 1.1 kg P ha−1 yr−1, respectively. However, the RA yielded the highest rates of sediment yield, i.e., 8.6 t ha−1 yr−1. The second largest yield rates per unit area of PC, PN and PP appeared in the RA. These results demonstrated that sediment yield and PC, PN and PP yields caused by surface runoff in the Jieliu catchment were directly relevant to the type of land use, and the SU became the primary source of sediment yield and PC, PN and PP yields. Meanwhile, sediment and PC, PN and PP yields from the RA could not be neglected.
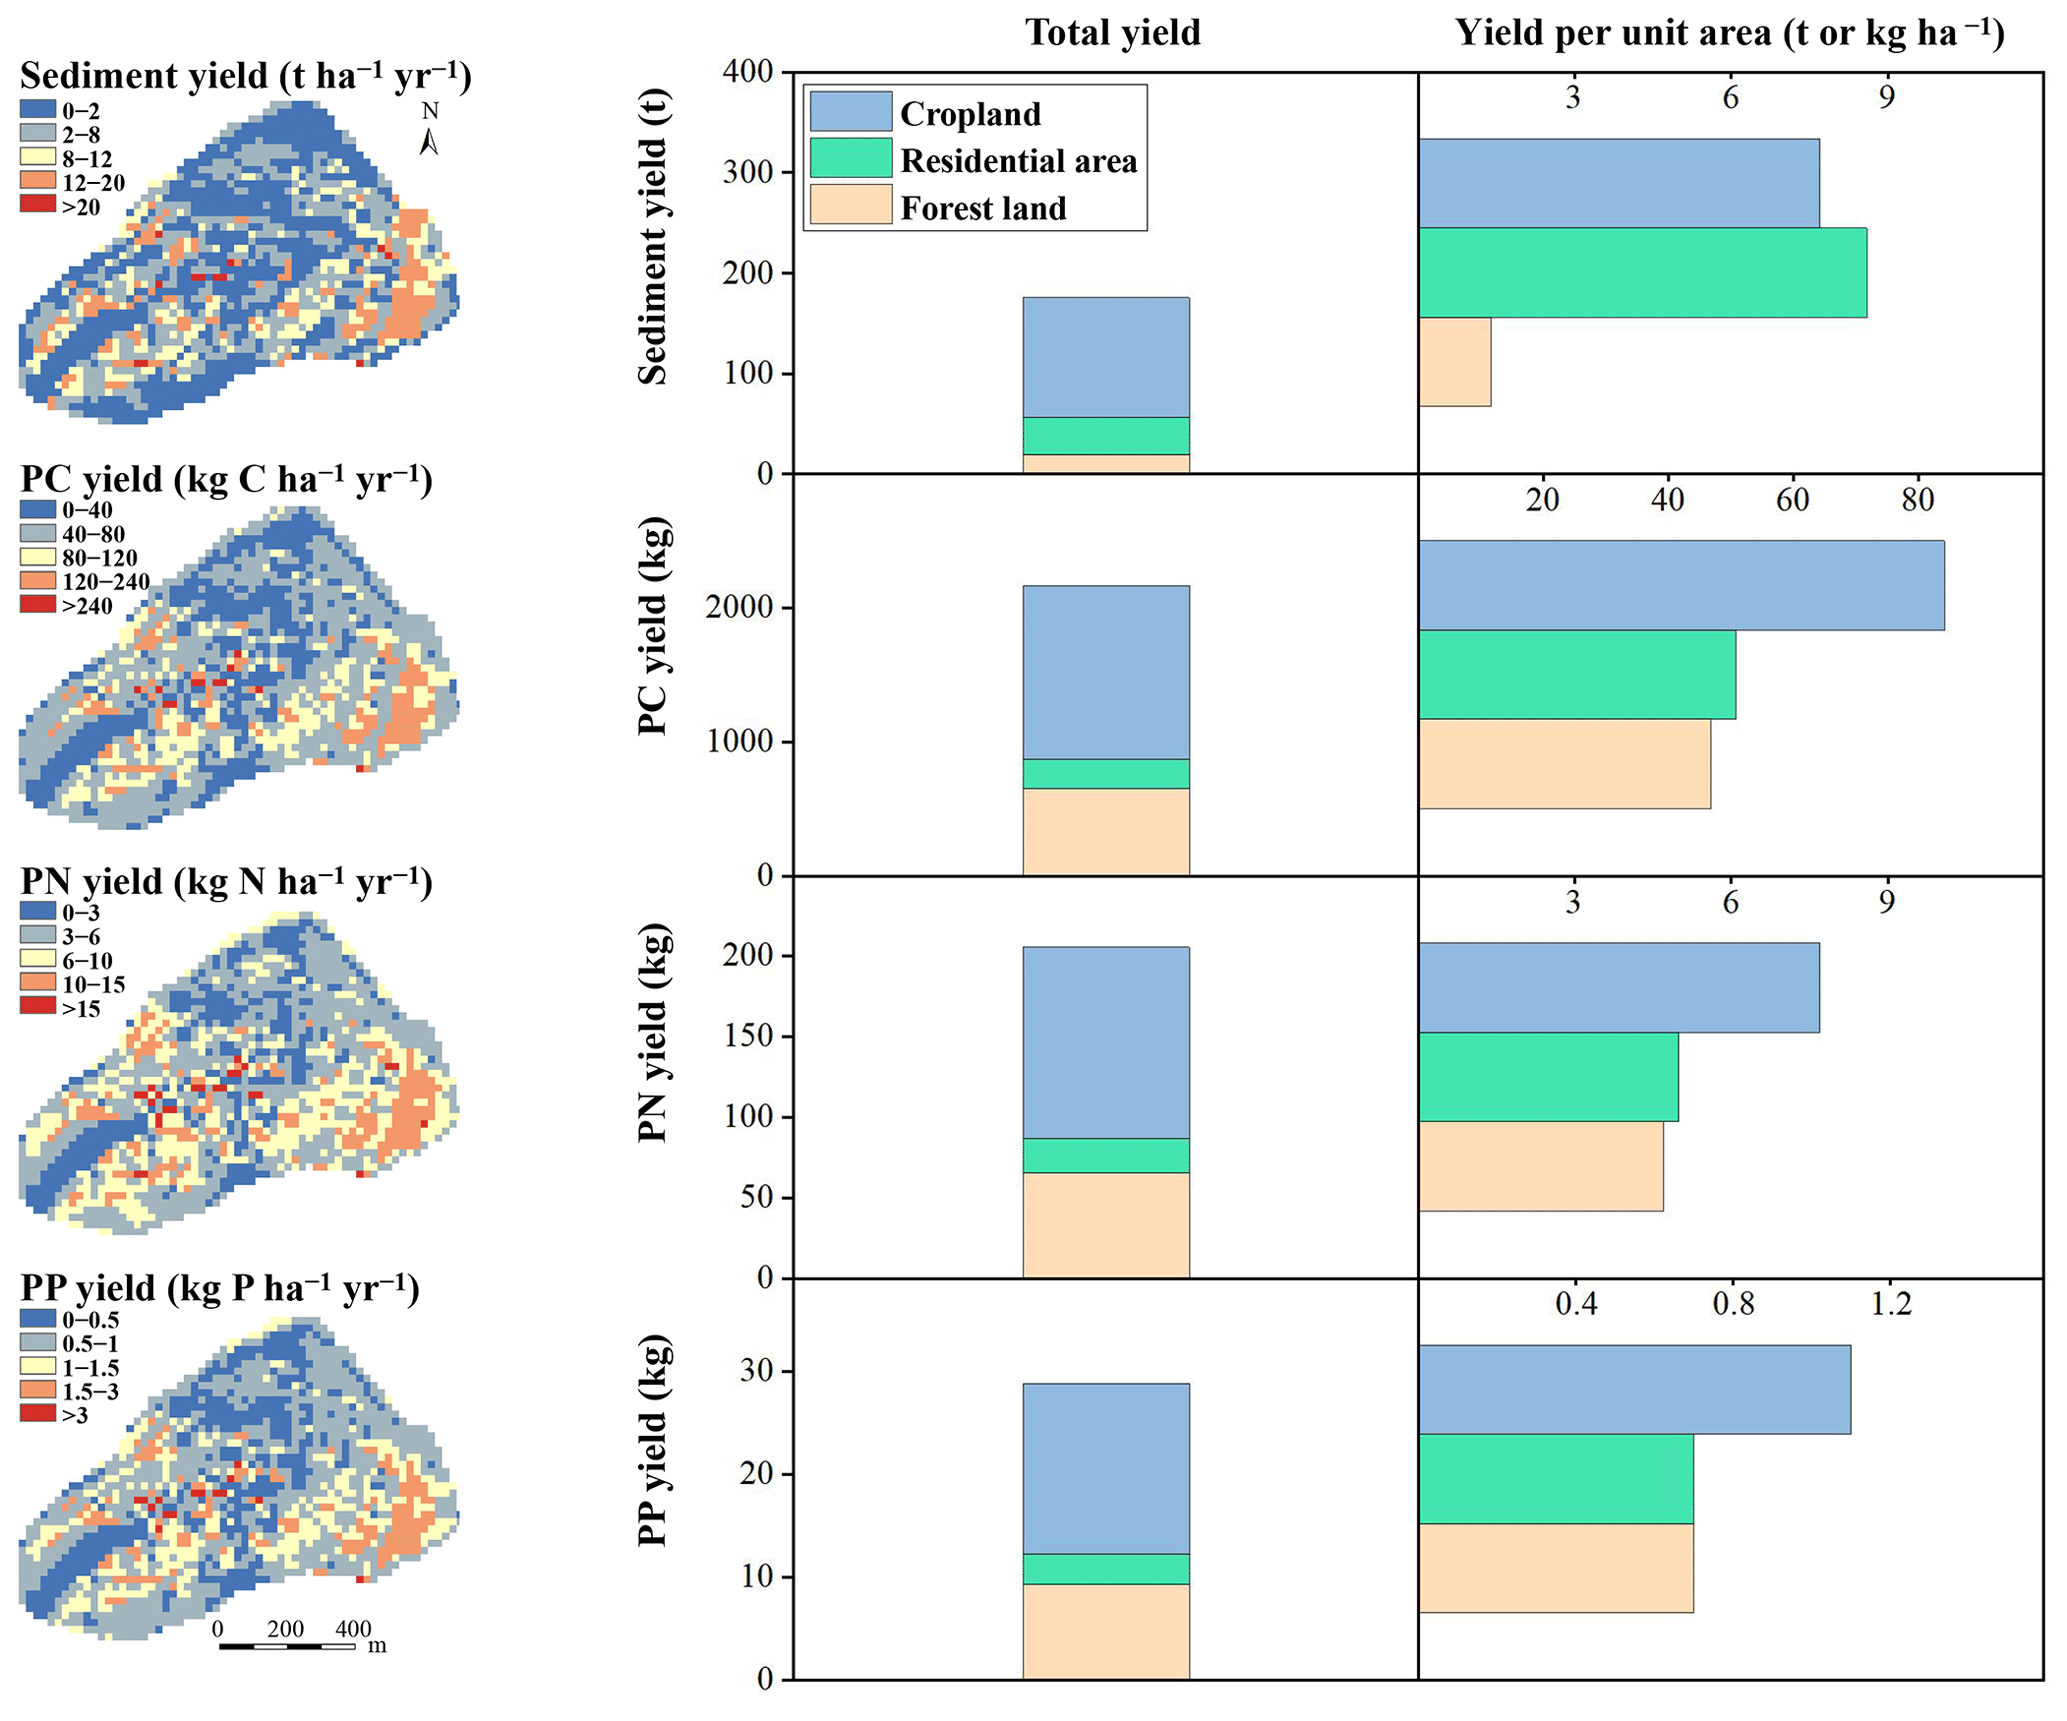
Figure 5Simulated spatial distributions of sediment yield and particulate carbon (PC), particulate nitrogen (PN) and particulate phosphorus (PP) yields and the effects of different land uses (cropland, village residential areas and forest land) in the validation year, 2008.
Moreover, the upgraded CNMM-DNDC model coupled biogeochemical processes with soil erosion and was able to predict the crucial variables relevant to biogeochemical processes, including productivity, GHGs, contaminated gases and NO loss, as well as the variables related to soil erosion, including the yields of sediment and PC, PN and PP (Fig. S4, Sect. S1).
3.5 Sediment yield and PC, PN and PP yields under different scenarios
The simulated results of the single-factor change scenarios of precipitation and temperature were presented in Fig. 6. The sediment yield and PC, PN and PP yields (i.e., the target variables) increased with precipitation or air temperature, which was reflected by the positive values. The more positive the slope value is, the greater the target variables increase and vice versa. The slopes between the air temperature changes of the higher and lower cooling and warming scenarios and the sediment yield changes yielded −1.25, −1.00, −0.38 and −0.40, respectively. Compared to the slopes of the lower warming scenarios and the lower cooling scenarios, the slopes of the higher warming scenarios and the higher cooling scenarios provided 21 % and 5 % higher yields of sediment, respectively. Meanwhile, the changes in PC, PN and PP yields showed similar but stronger responses to the higher cooling scenarios. However, the particulate nutrient yields showed a complicated response to the warming scenarios. The changes in the particulate nutrient yields showed an increasing tendency in response to the increase of air temperature. For the lower warming scenarios, the particulate nutrient yields increased with increasing air temperature. In terms of the higher warming scenarios, the particulate nutrient yields were still increasing, but the increase rate slowed. Compared to the baseline scenario, the scenarios with the air temperature change from 0 to −1 ∘C led to a slight increase in crop yields, but the crop yields decreased as the air temperature continued to decrease. In addition, the crop yields decreased with increasing air temperature. These results proved that the increase in air temperature decreased the sediment yields but increased PC, PN and PP yields, although the promoting effect became weaker for the higher warming scenarios.
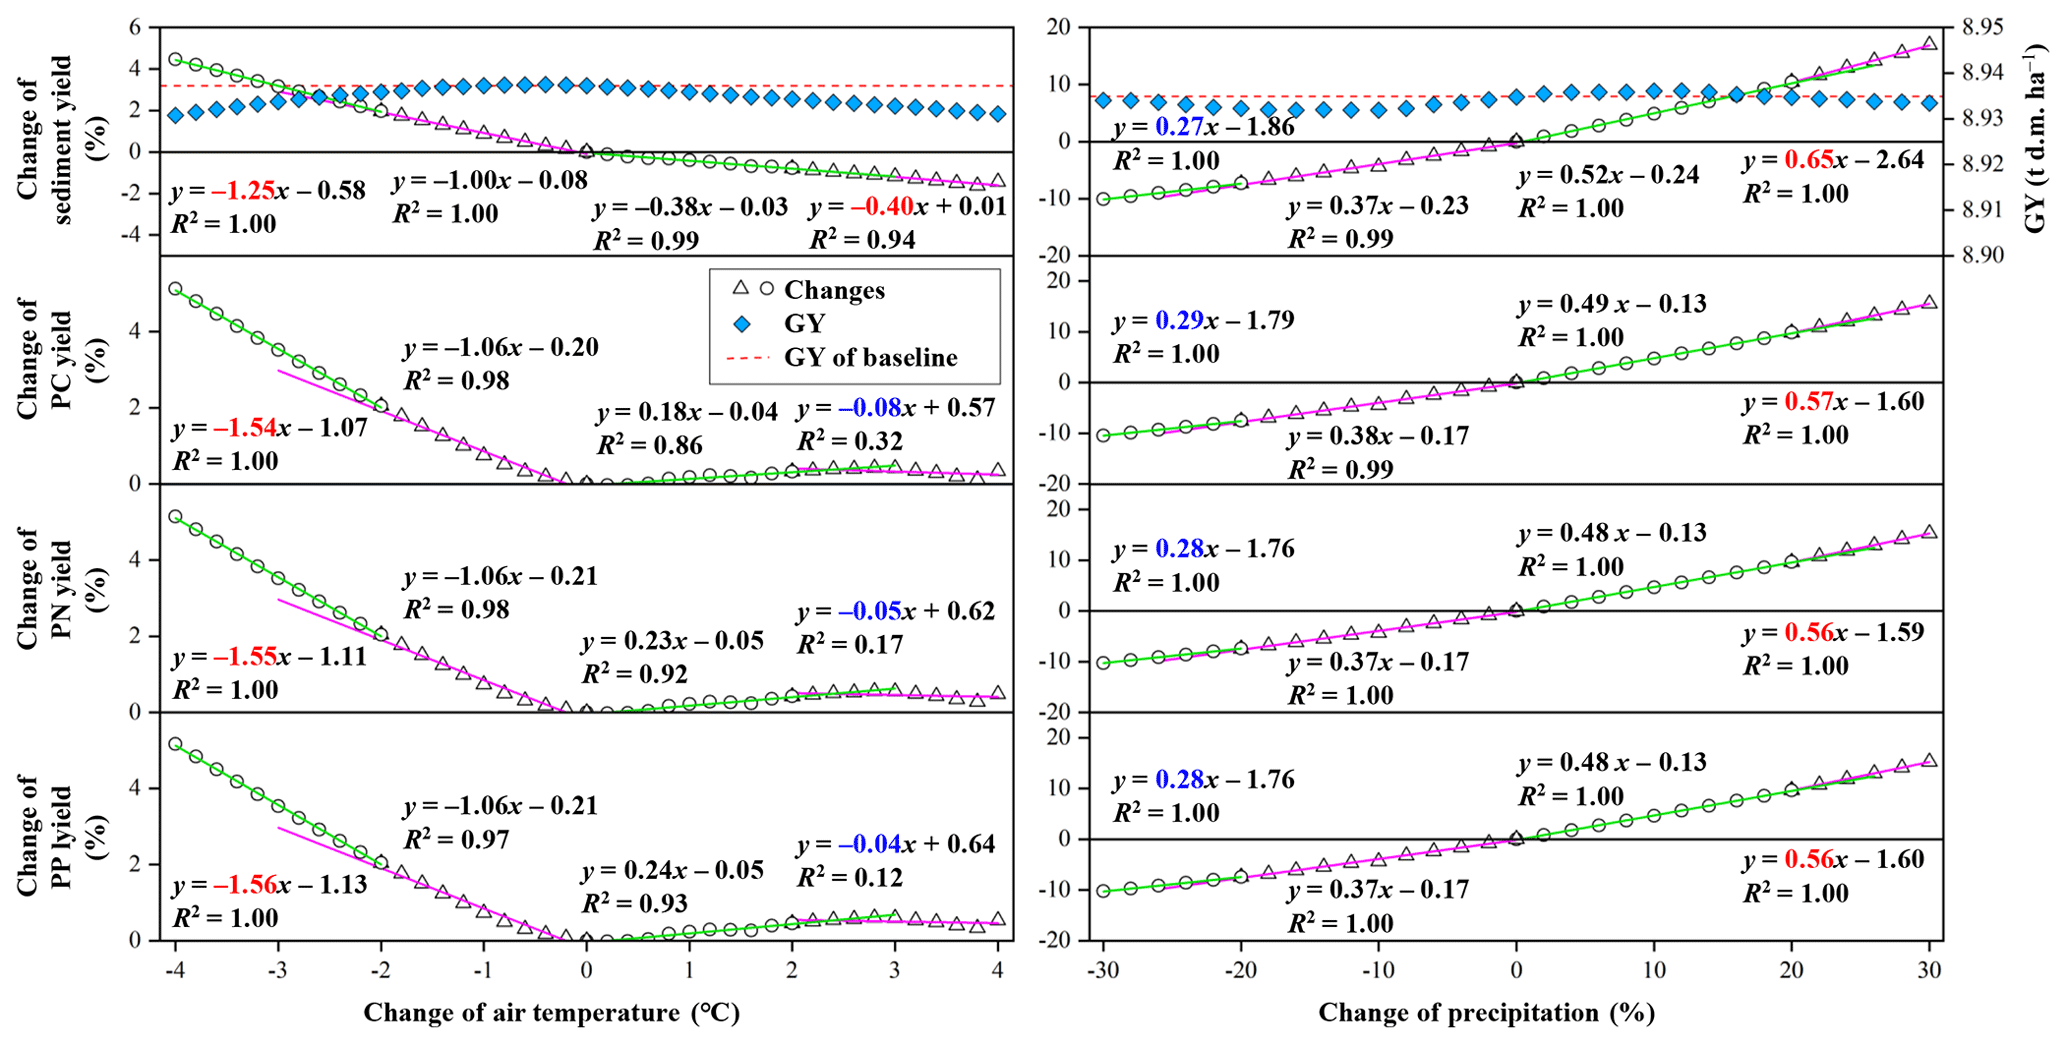
Figure 6Simulated effects of precipitation and air temperature change on sediment yield, crop yield (GY) and particulate carbon (PC), particulate nitrogen (PN) and particulate phosphorus (PP) yields in the validation year, 2008. The air temperature and precipitation single-factor scenarios were divided into four sets. The scenarios with air temperature reductions and increases of 0–2∘ and greater than 2∘ were defined as the lower and higher cooling and warming scenarios, respectively. Similarly, the scenarios with precipitation reductions and increases of 0 %–20 % and greater than 20 % were defined as the lower and higher rain-reduced and rain-enhanced scenarios, respectively. The numbers in blue and red in front of the letter x show that the higher warming or cooling scenarios (or the higher rain-enhanced or rain-reduced scenarios) result in stronger or weaker effects on sediment yield and PC, PN and PP yields than the lower scenarios, respectively. The green and violet lines refer to the linear regressions between the changes of the climate variables (i.e., air temperature and precipitation) and the changes of the variables associated with soil erosion. The lines are color-coded to differentiate the results of the different scenarios.
The slopes between the precipitation changes of the higher and lower rain-reduced and rain-enhanced scenarios and the sediment yield changes resulted in the values of 0.27, 0.37, 0.52 and 0.65, respectively. In comparison with the lower rain-enhanced and rain-reduced scenarios, the slopes of the higher rain-enhanced and rain-reduced scenarios provided 24 % higher and 34 % lower yields of sediment, respectively. Meanwhile, the changes in particulate nutrient yields showed similar but weaker responses to the changes in precipitation. The above results demonstrated that the yield of sediment and particulate nutrients increased with the increasing precipitation. In addition, the contribution from elevated precipitation tended to be stronger for the higher rain-enhanced scenarios. Furthermore, the changes in sediment and PC, PN and PP yields were more sensitive to the precipitation scenarios than to the temperature scenarios. Precipitation, when altered over the range from −30 % to +30 %, posed a minor influence on crop yields (within ±0.03 %). Compared with the baseline, the scenarios with the precipitation increasing within 18 % yielded slightly increased crop yields, while crop yields slightly decreased in the scenarios of reduced precipitation and in those with over 20 % increased precipitation.
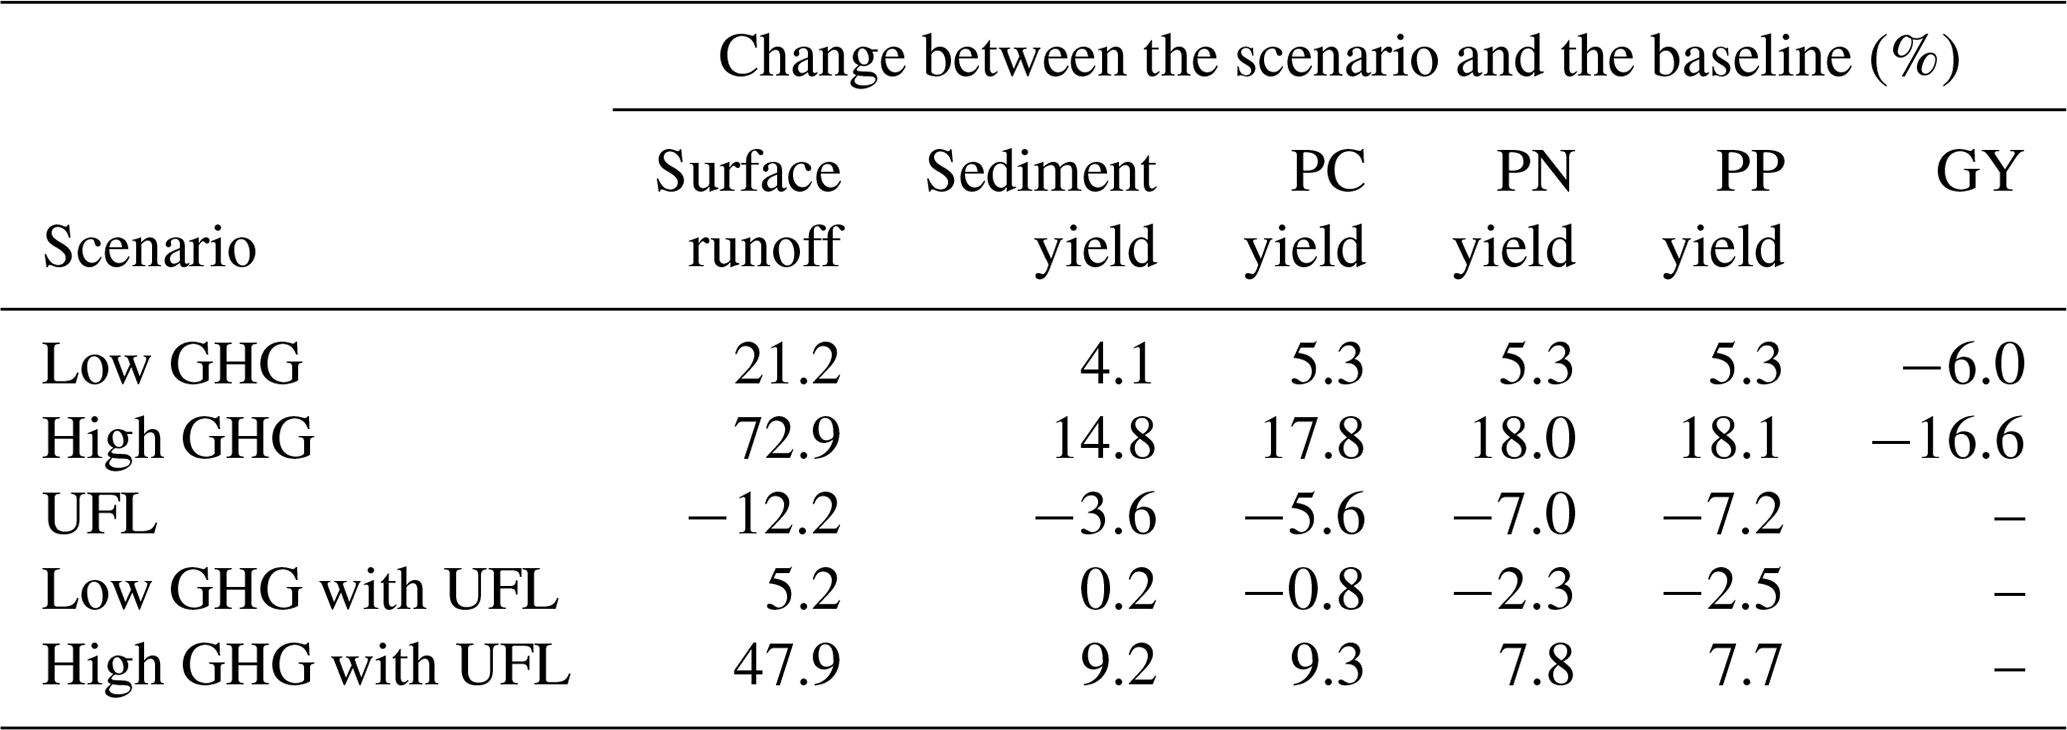
Table 2 illustrates the results of the multi-factor change scenarios and the land use change single-factor scenario (UFL scenario). Compared to the baseline scenario, the UFL scenario reduced stream flow, sediment yield and PC, PN and PP yields by −12.2 %, −3.6 %, −5.6 %, −7.0 % and −7.2 %, respectively. In comparison with the baseline scenario, the low GHG emissions scenario with air temperature increasing by 1.5 ∘C and precipitation increasing by 10 % increased the stream flow, sediment yield and PC, PN and PP yields by 21.2 %, 4.1 %, 5.3 %, 5.3 % and 5.3 %, respectively. The increasing effects of the high GHG emissions scenarios on the sediment and particulate nutrient yields were more than 3 times those of the low GHG emissions scenarios. The crop yield change between the low GHG emissions scenario and the baseline scenario yielded −6.0 %, while the crop yield of the high GHG emissions scenario was 16.6 % lower than the baseline. The low GHG emissions under the UFL scenario increased the stream flow and sediment yield by 5.2 % and 0.2 %, respectively, but decreased PC, PN and PP yields by −0.8 %, −2.3 % and −2.5 %, respectively. Moreover, the high GHG emissions under the UFL scenario increased the stream flow, sediment yield and PC, PN and PP yields by 47.9 %, 9.2 %, 9.3 %, 7.8 % and 7.7 %, respectively. The no-tillage scenario decreased the yields of particulate nutrients by approximately 2.5 %, but showed almost no effect on sediment yield compared with the baseline scenario (Fig. S5).
Table 2Simulated comprehensive effects of precipitation, air temperature and land use change on crop yield (GY), surface runoff, sediment yield, and particulate carbon (PC), particulate nitrogen (PN) and particulate phosphorus (PP) yields in the validation year, 2008. The low greenhouse gas (GHG) emissions scenario is that of air temperature increasing by 1.5 ∘C and precipitation increasing by 10 %. The high GHG emissions scenario is that of an air temperature increase of 4 ∘C and a precipitation increase of 30 %. The UFL scenario is that of sloping cultivated upland change into forest land.
3.6 Relationship among the variables relevant to soil erosion, productivity and C/N losses
Figure 7 illustrates the relationships between the variables relevant to soil erosion and biogeochemistry for different land use types, which were derived from the model simulation. No soil erosion in the winter-flooding paddy with the paddy rice flooding–fallow regime (RF) because of the year-round flooding regime. For the other three land use types, significant positive correlations (r>0.88) between sediment yield and particulate nutrient yields were found, because they were entrained by water and moved with the water flow. With regard to the SU, the particulate nutrient yields were significantly correlated with NO yields through leaching (r>0.6), though the correlation coefficient between sediment yields and NO loss through leaching only yielded 0.26 (insignificant). For the seasonally waterlogged paddy (SP), the variables related to soil erosion (including sediment yields and particulate nutrient yields) were negatively correlated with NH3 emissions (r>0.65), while they were positively correlated with NO loss through runoff (). As for FL, significantly positive correlations between the variables related to soil erosion and NO loss through leaching/runoff were found (r>0.72), which might be because all of these variables were related to precipitation. Productivity had negative impacts on sediment yield and particulate nutrient yields in the RF and FL systems, while it had a slightly negative impact on sediment yield but a slightly positive impact on particulate nutrient yields in the SP system.
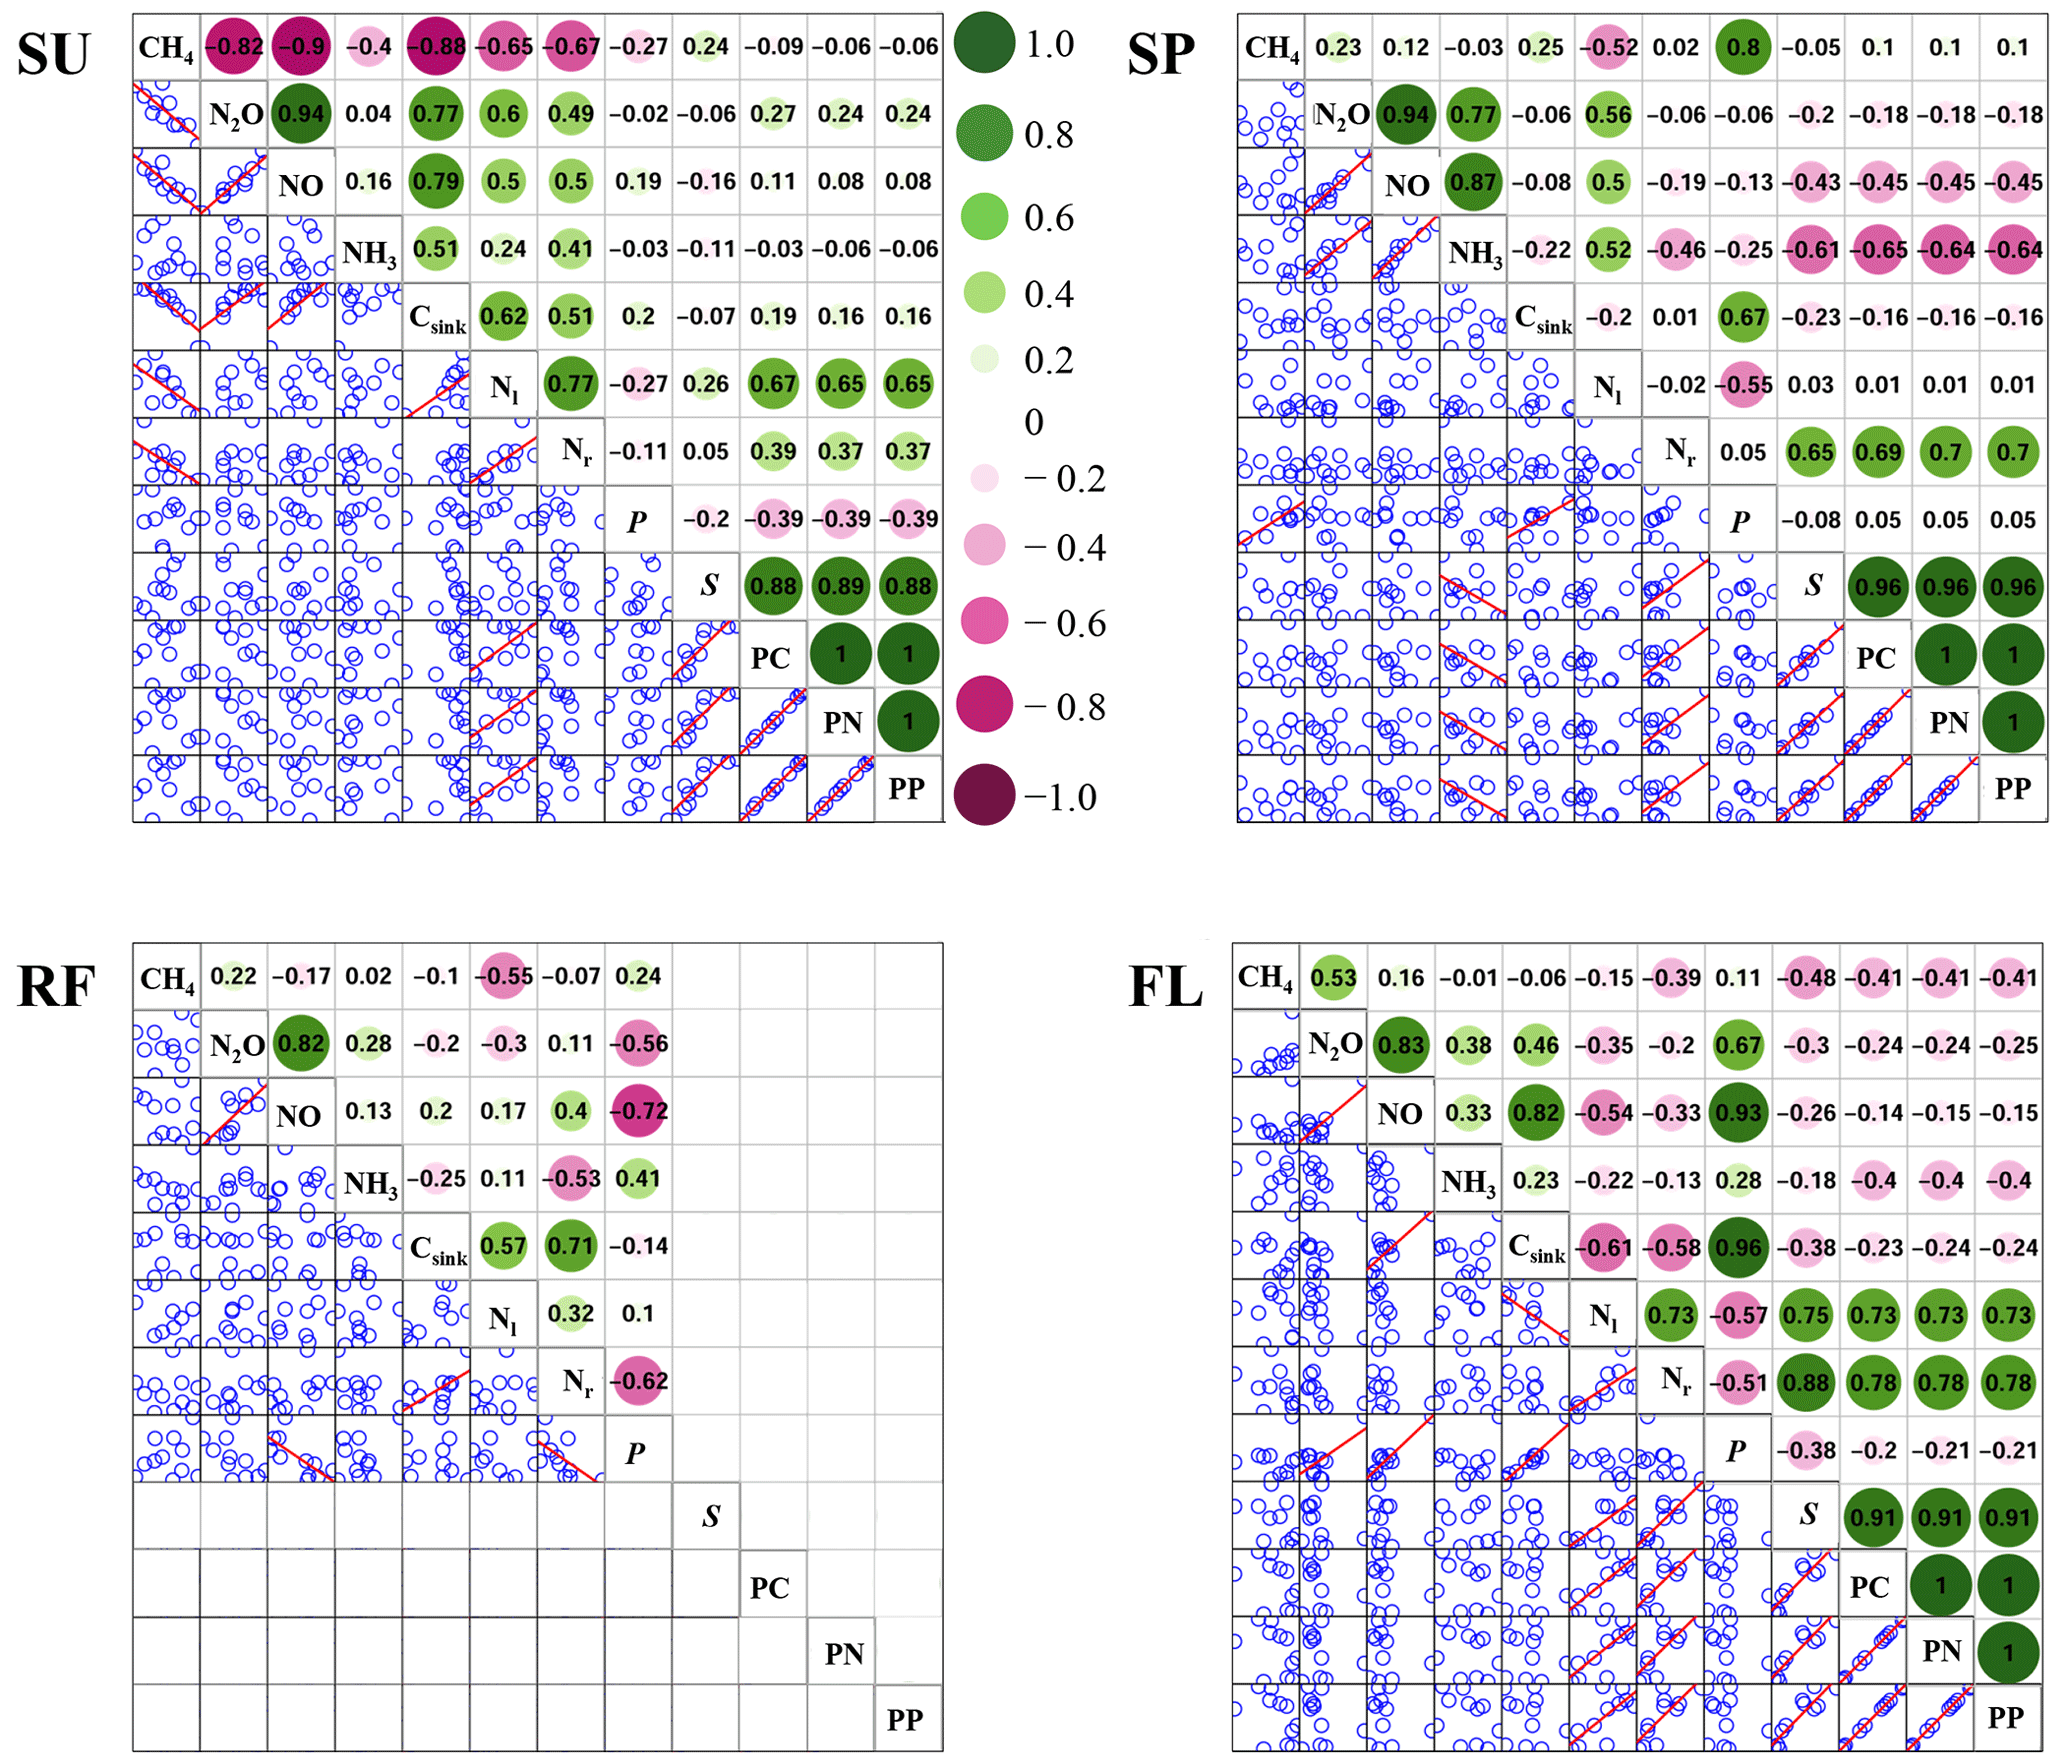
Figure 7Correlation analysis among the simulated sediment (S), particulate carbon (PC), particulate nitrogen (PN) and particulate phosphorus (PP) yields, productivity (P), carbon sink density (Csink), methane (CH4), nitrous oxide (N2O), nitric oxide (NO) and ammonia (NH3) emissions, losses of nitrate through leaching (Nl) and surface runoff (Nr) for different land use types. The land use types are sloping cultivated upland (SU) with summer maize–winter wheat rotation, seasonally waterlogged paddy (SP) with paddy rice–winter wheat rotation or paddy rice–rape rotation, winter-flooding paddy with the rice paddy flooding–fallow regime (RF) and forest land (FL). No yields of S, PC, PN and PP in the RF crop system because of the year-round flooding regime. The figures in the circles stand for the correlation coefficients. The scatterplots of the bottom left are related to the correlation coefficients, and the linear regression curves (i.e., the red line) are provided when the correlations at p<0.05 are considered significant.
4.1 Effect of land use on soil erosion and associated PC, PN and PP losses
Land use change has been considered one of the most important factors affecting the intensity and distribution of surface runoff and soil erosion (Dunjó et al., 2004; Kosmas et al., 1997; Wei et al., 2007; X. Zhang et al., 2021). Our study provided consistent results, which indicate that the intensity of soil erosion and associated PC, PN and PP yields in the Jieliu catchment were closely related to land use, with the following order: SU > RA > FL. The RA, with waterproofed concrete roads and residential buildings, was the secondary source of soil erosion, which might be because it provided the largest surface runoff among the three land use types in the year of 2008 (Fig. S6), though limited soil was exposed for erosion. There were three major reasons why FL contributed the lowest yields of sediment and particulate nutrients among the above three land uses. First, canopy interception reduced the amount of rainfall reaching the ground, which directly decreased the occurrence of runoff and associated erosion (Greene and Hairsine, 2004; Hou et al., 2020; Vasquez-Mendez et al., 2010). Several previous studies also reported that FL with a thick canopy exhibited a lower amount of runoff than did other land uses (Mehri et al., 2018; Mohammad and Adam, 2010; Nunes et al., 2011). Fortunately, the direct protection mechanism of canopy interception was included in the CNMM-DNDC model, calculated using the LAI (Zhang et al., 2018). Second, the litter cover of FL protects the soil surface from the direct splash and detachment of raindrops, which can decrease the formation of mechanical crusts and increase the infiltration capacity, hence diminishing the potential for surface runoff and soil erosion (Casermeiro et al., 2004; Lemenih et al., 2005; Wainwright et al., 2002). However, the CNMM-DNDC did not take litter cover protection of the soil surface into consideration. Further observation data and studies are needed to introduce the mechanism of the effect of litter cover on surface runoff and soil sediment into the CNMM-DNDC model. Last, FL has more soil organic matter and greater hydraulic conductivity than other land uses, which can indirectly enhance soil infiltration and reduce surface runoff (Abrishamkesh et al., 2011; Fu et al., 2000; Lemenih et al., 2004). The excellent soil properties of FL soil (e.g., higher soil organic matter and vertical saturated hydraulic conductivity) have been involved in the CNMM-DNDC model inputs. Moreover, as the forest litterfall returned to the soil and participated in further C and N cycling, the soil organic matter content was enhanced and accumulated in the FL. With regard to the scenario analysis, we found that the scenarios of FL showed greater decreases in sediment yield than surface runoff (Table 2). The results of the lysimetric plot experiments by Chen et al. (2012) also demonstrate that vegetation types and human interference have a relatively small impact on surface runoff but an appreciable effect on sediment yield.
The canopy of the cultivated cropland served as a weaker hindrance to rainfall, which suffered from more surface runoff than that of the forest canopy. However, the different effects on soil erosion and rainfall interception of various crop planting densities (Panagos et al., 2015a), e.g., wide row maize and dense grass-like wheat, and different crop types (Williams, 1990) require additional observation in order to modify and evaluate the CNMM-DNDC in the future. Furthermore, frequent agricultural activities (i.e., tillage) loosen the subsurface soil and nutrients, which raises the risk of soil erosion (Gregorich et al., 1998; Moldenhauer et al., 1967; Muukkonen et al., 2009). The CNMM-DNDC model has taken the vertical mixing effect of tillage on the chemical soil properties into consideration, and this process left the subsurface soil organic nutrients unprotected and prone to erosion. This explained the reduction in PC, PN and PP nutrient yields under the no-tillage scenarios (Fig. S5). However, several studies found that tillage disturbed the soil structure and pore size distribution (Carof et al., 2007; Castellini and Ventrella, 2012; Kay and VandenBygaart, 2002; Nunes et al., 2010), which made the effect of agricultural activities on surface runoff and soil erosion difficult to model (Leitinger et al., 2010). Given that the vertical mixing effect of tillage on soil chemical properties instead of soil physical properties was considered in the CNMM-DNDC, the yields of surface runoff and sediment resulting from the no-tillage scenario did not decrease compared with the baseline scenario with tillage (Fig. S5).
4.2 Effect of climate change on soil erosion and associated PC, PN and PP losses
In the past decades, the frequent occurrence of warming and extreme weather events (e.g., extreme precipitation events) has been irrefutable (IPCC, 2019). From 1998 to 2021, the observed annual average air temperature and annual precipitation in the Jieliu catchment also presented an increasing trend but did not have a significant regression relationship (Fig. S7). In CNMM-DNDC, the biogeochemical processes were strongly influenced by air or soil temperature (Table S4). There were two reasons why the simulated soil erosion responded to air temperature changes. On one hand, vegetation growth was sensitive to air temperature changes, which affected the Cv, the effect factor of soil erosion in Eq. (1). The increasing air temperature provided a positive effect on the vegetation growth (e.g., LAI, Fig. S8), which increased the precipitation interception by the canopy to directly decrease soil erosion. However, the increasing air temperature might have shortened the duration of the vegetation growth period, which would have directly shortened the period that soils were protected by the crop canopy and lengthened the time that bare soils were exposed to surface runoff, increasing the risk of erosion (Fig. S8). This increasing risk of sediment yield when the air temperature increased was not shown in this case, perhaps because the heavy rainfall events occurred around the period of vegetation growth (Fig. S8). In addition, the decreasing air temperature weakened the processes of the respiration and photosynthesis, which led to slower vegetation growth (Fig. S8). On the other hand, compared to the baseline scenarios, the climate warming scenarios, with better vegetation growth, conducted greater evapotranspiration, which led to a reduction in soil moisture content, indirectly reducing the surface runoff and soil erosion. The asymmetric response of sediment and particulate nutrient yields to the cooling and warming scenarios might result from the different effects of the cooling and warming of air temperature on vegetation growth. The growth of vegetation was strongly inhibited by the low temperature in the cooling scenarios through affecting the duration and start time of the phenological stages. Our results of the scenario analysis indicated that the sediment yield slightly decreased with the scenarios treated with climate warming alone, resulting from the higher Cv caused by the enhanced vegetation growth (Ficklin et al., 2009; F. Zhang et al., 2020; Zhou et al., 2003). We found a reduction in the decreasing effect of increasing air temperature on sediment yield (especially for the scenario with an air temperature increase of 4 ∘C; Fig. 6), which might be because the enhanced effect of increasing air temperature on vegetation growth is not unlimited. Once the air temperature exceeds the threshold of the optimum temperature for photosynthesis and vegetation growth, it has a negative or even harmful impact on plant growth (Chapin, 1983; Schlenker and Roberts, 2009). The complex response of PC, PN and PP yields to air temperature increased, probably because they increased with the enrichment ratio and sediment yield, but the enrichment ratio decreased with sediment. Therefore, the slightly increasing sediment with increasing air temperature and the corresponding decreasing enrichment ratio might lead to upward or downward fluctuations in PC, PN and PP yields. However, we found that the rate of soil yield increased with increasing precipitation amount and the corresponding increase in heavy rain events. Jiang et al. (2017) also found that the increase in sediment yield was amplified by the increased precipitation, which was directly accompanied by a dramatic and sustained increase in surface runoff. Therefore, the higher GHG emissions scenarios, in which the soil erosion showed a greater increase response to the rising precipitation and a smaller decrease response to the rising air temperature, might lead to a greater risk of soil erosion than the low GHG emissions scenario. Overall, our results indicated that the hydrology of the Jieliu catchment is very sensitive to potential future climate changes, especially to the higher GHG emissions scenarios.
4.3 Interactive effect of climate and land use change on soil and nutrient losses through water-induced erosion
Changes in either climate or land use imply considerable influences on the water and nutrient cycles in a catchment or region (Labat et al., 2004; Milliman et al., 2008; Piao et al., 2007; Yin et al., 2017). Our simulated results indicated that the reduction extent of the UFL scenario on soil erosion, especially on sediment yield and associated nutrient yields, offset the increasing extent caused by the low GHG emissions scenario. However, the UFL scenario could not totally offset the sediment and PC, PN and PP yields caused by the high GHG emissions scenario. Nevertheless, vegetation restoration might still be able to slow the soaring process of soil erosion caused by climate change in the future. Previous studies primarily focused on the effects of human activity and climate change on the changes in surface runoff or stream flow. Wang et al. (2016) demonstrated that human activity had a slightly larger effect on stream flow changes than the climate (59 % versus 41 %) by analyzing the long-term records of hydrological data in the Luan River basin in north China. The results in the Heihe River basin in northwest China showed that human activities were the dominant contributor to the variation in runoff in the upper and middle reaches when compared to climate change (Qiu et al., 2015). However, other studies have shown that the influence of climate change on soil and water loss was greater than that of human activities. Jiang et al. (2017) pointed out that climate change, in comparison with anthropogenic activities, was the primary factor causing the changes in both stream flow and sediment discharge in the Yellow River basin and Yangtze River basin in China. The Huron River catchment in southeastern Michigan in the USA was more sensitive to climate change than to land use change, as demonstrated by Barlage et al. (2002).
Furthermore, we found that the promoting impacts of both high and low GHG emissions scenarios on surface runoff were greater than those on sediment yield and associated particulate nutrient yields. In contrast, the reduction effect of the UFL scenarios on sediment yield and associated particulate nutrient yields was stronger than that on surface runoff (Table 2). These results demonstrated that human activity, e.g., the conversion from cropland with intensive human disturbance to FL, resulted in a greater mitigation effect on sediment yield and associated particulate nutrient yields than on surface runoff. Therefore, further studies should consider the effects of human activity and climate change on surface runoff and on soil erosion, as well as the associated nutrient yields. In summary, reasonable human interventions such as rational land use change are expected to be feasible practices to decelerate soil erosion and associated particulate nutrient yields without altering and disturbing the hydrological cycle of a catchment in the context of global warming.
The hydro-biogeochemical model (CNMM-DNDC) was improved by introducing the soil erosion physical model and the element (i.e., carbon, nitrogen and phosphorus) enrichment module to estimate soil erosion and the movements of particulate nutrients. The comparability between the simulation and observations, including surface runoff, sediment yield, particulate nitrogen (PN) and particulate phosphorus (PP) yields at the lysimetric plot and the stream flow, sediment and PN yields at the outlet of Jieliu catchment, demonstrated that the upgraded CNMM-DNDC model can reliably simulate soil erosion and the consequential particulate nutrient yields. The spatial distribution characteristics of sediment yield and the consequential particulate carbon (PC), PN and PP yields were directly related to the spatial distribution of land use type, among which the sloping cultivated cropland areas contributed the greatest yields of sediment and particulate nutrients. The analysis of climate single-factor change scenarios shows that the high GHG emissions scenarios had greater potential risk of soil erosion, resulting in larger soil erosion rates than those in the low GHG emissions scenarios. The scenarios with cropland change into forest land decreased stream flow, sediment yield and PC, PN and PP yields compared to the baseline scenario. Anthropogenic activities (e.g., land use change) might be expected to help mitigate the processes of soil and water losses accelerated by climate change in the future.
The CNMM-DNDC model was originally developed by the Institute of Atmospheric Physics using the C language, which can be run on a standard PC. The upgraded model is available on Figshare (https://doi.org/10.6084/m9.figshare.20210546, Li, 2022).
The supplement related to this article is available online at: https://doi.org/10.5194/bg-20-3555-2023-supplement.
SL arranged the data, improved the model, implemented the simulation and prepared the original draft. YL, XZ and WZ developed the conceptualization and methodology of this study. BZ, PH, JF and TW collected and arranged data. SH, RW and KW analyzed the data and verified the results. ZY and CL improved the conceptualization and writing.
The contact author has declared that none of the authors has any competing interests.
Publisher’s note: Copernicus Publications remains neutral with regard to jurisdictional claims in published maps and institutional affiliations.
This work was supported by the National Natural Science Foundation of China (grant nos. 42161144002 and U22A20562), the Chinese Academy of Sciences (grant nos. ZDBS-LY-DQC007 and XDA23070100), the National Key R&D Program of China (grant no. 2022YFE0209200), the special fund of State Environmental Protection Key Laboratory of Formation and Prevention of Urban Air Pollution Complex (grant no. SEPAir-2022080590), and the National Key Scientific and Technological Infrastructure project “Earth System Science Numerical Simulator Facility” (EarthLab).
This paper was edited by Akihiko Ito and reviewed by two anonymous referees.
Abdalla, M., Song, X., Ju, X., Topp, C., and Smith, P.: Calibration and validation of the DNDC model to estimate nitrous oxide emissions and crop productivity for a summer maize-winter wheat double cropping system in Hebei, China, Environ. Pollut., 262, 114199, https://doi.org/10.1016/j.envpol.2020.114199, 2020.
Abrishamkesh, S., Gorji, M., and Asadi, H.: Long-term effects of land use on soil aggregate stability, Int. Agrophys., 25, 103–108, 2011.
Arnold, J., Srinivasan, R., Muttiah, R., and Williams, J.: Large area hydrologic modeling and assessment part I: model development, J. Am. Water Resour. Assoc., 34, 73–89, https://doi.org/10.1111/j.1752-1688.1998.tb05961.x, 1998.
Barlage, M., Richards, P., Sousounis, P., and Brenner, A.: Impacts of climate change and land use change on runoff from a Great Lakes watershed, J. Great Lakes Res., 28, 568–582, https://doi.org/10.1016/S0380-1330(02)70606-0, 2002.
Berhe, A., Barnes, R., Six, J., and Marín-Spiotta, E.: Role of Soil Erosion in Biogeochemical Cycling of Essential Elements: Carbon, Nitrogen, and Phosphorus, Annu. Rev. Earth Planet. Sci., 46, 521–548, https://doi.org/10.1146/annurev-earth-082517-010018, 2018.
Carof, M., De Tourdonnet, S., Coquet, Y., Hallaire, V., and Roger-Estrade, J.: Hydraulic conductivity and porosity under conventional and no-tillage and the effect of three species of cover crop in northern France, Soil Use Manage., 23, 230–237, https://doi.org/10.1111/j.1475-2743.2007.00085.x, 2007.
Casermeiro, M., Molina, J., Caravaca, M., Costa, J., Massanet, M., and Moreno, P.: Influence of scrubs on runoff and sediment loss in soils of Mediterranean climate, Catena, 57, 91–107, https://doi.org/10.1016/s0341-8162(03)00160-7, 2004.
Castellini, M. and Ventrella, D.: Impact of conventional and minimum tillage on soil hydraulic conductivity in typical cropping system in Southern Italy, Soil Tillage Res., 124, 47–56, https://doi.org/10.1016/j.still.2012.04.008, 2012.
Chapin, F.: Direct and indirect effects of temperature on arctic plants, Polar Biol., 2, 47–52, https://doi.org/10.1007/BF00258285, 1983.
Chen, H., Yang, J., Fu, W., He, F., and Wang, K.: Characteristics of slope runoff and sediment yield on karst hill-slope with different land-use types in northwest Guangxi, Trans. Chin. Soc. Agr. Eng., 28, 121–126, https://doi.org/10.3969/j.issn.1002-6819.2012.16.019, 2012.
Cui, F., Zheng, X., Liu, C., Wang, K., Zhou, Z., and Deng, J.: Assessing biogeochemical effects and best management practice for a wheat–maize cropping system using the DNDC model, Biogeosciences, 11, 91–107, https://doi.org/10.5194/bg-11-91-2014, 2014.
Deng, J., Zhou, Z., Zhu, B., Zheng, X., Li, C., Wang, X., and Jian, Z.: Modeling nitrogen loading in a small watershed in southwest China using a DNDC model with hydrological enhancements, Biogeosciences, 8, 2999–3009, https://doi.org/10.5194/bg-8-2999-2011, 2011.
Dey, P. and Mishra, A.: Separating the impacts of climate change and human activities on streamflow: a review of methodologies and critical assumptions, J. Hydrol., 548, 278–290, https://doi.org/10.1016/j.jhydrol.2017.03.014, 2017.
Donovan, M.: Modelling soil loss from surface erosion at high-resolution to better understand sources and drivers across land uses and catchments; a national-scale assessment of Aotearoa, New Zealand, Environ. Modell. Softw., 147, 105228, https://doi.org/10.1016/j.envsoft.2021.105228, 2022.
Dubache, G., Li, S., Zheng, X., Zhang, W., and Deng, J.: Modeling ammonia volatilization following urea application to winter cereal fields in the United Kingdom by a revised biogeochemical model, Sci. Total Environ., 660, 1403–1418, https://doi.org/10.1016/j.scitotenv.2018.12.407, 2019.
Dunjó, G., Pardini, G., and Gispert, M.: The role of land use–land cover on runoff generation and sediment yield at a microplot scale, in a small Mediterranean catchment, J. Arid Environ., 57, 99–116, https://doi.org/10.1016/S0140-1963(03)00097-1, 2004.
Ekholm, P. and Lehtoranta, J.: Does control of soil erosion inhibit aquatic eutrophication, J. Environ. Manage., 93, 140–146, https://doi.org/10.1016/j.jenvman.2011.09.010, 2012.
Ferrant, S., Oehler, F., Durand, P., Ruiz, L., Salmon-Monviola, J., Justes, E., Dugast, P., Probst, A., Probst, J., and Sanchez-Perez, J.: Understanding nitrogen transfer dynamics in a small agricultural catchment: comparison of a distributed (TNT2) and a semi distributed (SWAT) modeling approaches, J. Hydrol., 406, 1–15, https://doi.org/10.1016/j.jhydrol.2011.05.026, 2011.
Ficklin, D., Luo, Y., Luedeling, E., and Zhang, M.: Climate change sensitivity assessment of a highly agricultural watershed using SWAT, J. Hydrol., 374, 16–29, https://doi.org/10.1016/j.jhydrol.2009.05.016, 2009.
Fu, B., Chen, L., Ma, K., Zhou, H., and Wang, J.: The relationships between land use and soil conditions in the hilly area of the loess plateau in northern Shaanxi, China, Catena, 39, 69–78, https://doi.org/10.1016/s0341-8162(99)00084-3, 2000.
Garcia-Ruiz, J., Begueria, S., Nadal-Romero, E., Gonzalez-Hidalgo, J., Lana-Renault, N., and Sanjuan, Y.: A meta-analysis of soil erosion rates across the world, Geomorphology, 239, 160–173, https://doi.org/10.1016/j.geomorph.2015.03.008, 2015.
Greene, R. and Hairsine, P.: Elementary processes of soil-water interaction and thresholds in soil surface dynamics: a review, Earth Surf. Process. Landf., 29, 1077–1091, https://doi.org/10.1002/esp.1103, 2004.
Gregorich, E., Greer, K., Anderson, D., and Liang, B.: Carbon distribution and losses: erosion and deposition effects, Soil Tillage Res., 47, 291–302, https://doi.org/10.1016/S0167-1987(98)00117-2, 1998.
Hou, G., Bi, H., Huo, Y., Wei, X., Zhu, Y., Wang, X., and Liao, W.: Determining the optimal vegetation coverage for controlling soil erosion in Cynodon dactylon grassland in North China, J. Clean. Product., 244, 118771, https://doi.org/10.1016/j.jclepro.2019.118771, 2020.
Hu, P.: Applicability of revised DNDC model to simulate phosphorus migration on the slope farmland of purple soil, Institute of Mountain Hazards and Environment, University of Chinese Academy of Sciences, Chengdu, 35–39, https://doi.org/10.27525/d.cnki.gkchs.2020.000048, 2020.
IPCC: Climate Change and Land: an IPCC Special Report on Climate Change, Desertification, Land Degradation, Sustainable Land Management, Food Security, and Greenhouse Gas Fluxes in Terrestrial Ecosystems, 133–150, https://lcluc.umd.edu/announcements/climate-change-and-land-ipcc-special-report (last access: 31 July 2023), 2019.
IPCC: Sixth Assessment Report: Working Group I: Summary for Policemakers, 6–31, https://www.ipcc.ch/report/ar6/wg1/chapter/summary-for-policymakers/ (last access: 31 July 2023), 2021.
Jetten, V., Govers, G., and Hessel, R.: Erosion models: quality of spatial predictions, Hydrol. Process., 17, 887–900, https://doi.org/10.1002/hyp.1168, 2003.
Jiang, C., Zhang, L., and Tang, Z.: Multi-temporal scale changes of streamflow and sediment discharge in the headwaters of Yellow River and Yangtze River on the Tibetan Plateau, China, Ecol. Eng., 102, 240–254, https://doi.org/10.1016/j.ecoleng.2017.01.029, 2017.
Kay, B. and VandenBygaart, A. : Conservation tillage and depth stratification of porosity and soil organic matter, Soil Tillage Res., 66, 107–118, https://doi.org/10.1016/S0167-1987(02)00019-3, 2002.
Kosmas, C., Danalatos, N., Cammeraat, L., Chabart, M., Diamantopoulos, J., Farand, R., Gutierrez, L., Jacob, A., Marques, H., Martinez-Fernandez, J., Mizara, A., Moustakas, N., Nicolau, J., Oliveros, C., Pinna, G., Puddu, R., Puigdefabregas, J., Roxo, M., Simao, A., Stamou, G., Tomasi, N., Usai, D., and Vacca, A.: The effect of land use on runoff and soil erosion rates under Mediterranean conditions, Catena, 29, 45–59, https://doi.org/10.1016/S0341-8162(96)00062-8, 1997.
Labat, D., Godderis, Y., Probst, J., and Guyot, J.: Evidence for global runoff increase related to climate warming, Adv. Water Resour., 27, 631–642, https://doi.org/10.1016/j.advwatres.2004.02.020 ,2004.
Leitinger, G., Tasser, E., Newesely, C., Obojes, N., and Tappeiner, U.: Seasonal dynamics of surface runoff in mountain grassland ecosystems differing in land use, J. Hydrol., 385, 95–104, https://doi.org/10.1016/j.jhydrol.2010.02.006, 2010.
Lemenih, M., Karltun, E., and Olsson, M.: Assessing soil chemical and physical property responses to deforestation and subsequent cultivation in smallholders farming system in Ethiopia, Agriculture, Ecosyst. Environ., 105, 373–386, https://doi.org/10.1016/j.agee.2004.01.046, 2005.
Lemenih, M., Olsson, M., and Karltun, E.: Comparison of soil attributes under Cupressus lusitanica and Eucalyptus saligna established on abandoned farmlands with continuously cropped farmlands and natural forest in Ethiopia, Forest Ecol. Manage., 195, 57–67, https://doi.org/10.1016/j.foreco.2004.02.055, 2004.
Li, C., Frolking, S., and Frolking, T.: A model of nitrous oxide evolution from soil driven by rainfall events: 1. Model structure and sensitivity, J. Geophys. Res.–Atmos., 97, 9759–9776, https://doi.org/10.1029/92jd00509, 1992.
Li, S.: CNMM-DNDC_for_erosion, Figshare [data set], https://doi.org/10.6084/m9.figshare.20210546, 2022.
Li, S., Li, Y., Zhang, W., Zheng, X., Hu, P., Fan, J., Wang, T., and Zhu, B.: Simulation of water-induced erosion and transport of particulate elements in catchment by extending the CNMM-DNDC model, Chin. J. Eco-Agr., 30, 1511–1521, https://doi.org/10.12357/cjea.20210781, 2022a.
Li, S., Zhang, W., Zheng, X., Li, Y., Han, S., Wang, R., Wang, K., Yao, Z., Liu, C., and Zhang, C.: Update of a biogeochemical model with process-based algorithms to predict ammonia volatilization from fertilized cultivated uplands and rice paddy fields, Biogeosciences, 19, 3001–3019, https://doi.org/10.5194/bg-19-3001-2022, 2022b.
Li, Y., Shen, J., Wang, Y., Gao, M., Liu, F., and Zhou, P.: CNMM: a grid-based spatially-distributed catchment simulation model, China Science Press, Beijing, 36–86, ISBN 9787030497147, 2017.
Liu, Y., Fu, B., Liu, Y., Zhao, W., and Wang, S.: Vulnerability assessment of the global water erosion tendency: vegetation greening can partly offset increasing rainfall stress, Land Deg. Develop., 30, 1061–1069, https://doi.org/10.1002/ldr.3293, 2019.
Loch, R. and Donnollan, T.: Field rainfall simulator studies on two clay soils of the Darling Downs, Queensland. II. Aggregate breakdown, sediment properties and soil erodibility, Aust. J. Soil Res., 21, 47–58, https://doi.org/10.1071/sr9830047, 1983.
Ma, X., Zhao, C., and Zhu, J.: Aggravated risk of soil erosion with global warming: a global meta-analysis, Catena, 200, 105129, https://doi.org/10.1016/j.catena.2020.105129, 2021.
Massey, H. and Jackson, M.: Selective erosion of soil fertility constituents, Soil Sci. Soc. Am. Proc., 16, 353–356, https://doi.org/10.2136/sssaj1952.03615995001600040008x, 1952.
McElroy, A., Chiu, S., Nebgen, J., and Bennett, F.: Loading functions for assessment of water pollution from nonpoint sources, Midwest Research Institute, Kansas City, 104–106, https://www.osti.gov/biblio/7141870 (last access: 31 July 2023), 1976.
Mehri, A., Salmanmahiny, A., Tabrizi, A., Mirkarimi, S., and Sadoddin, A.: Investigation of likely effects of land use planning on reduction of soil erosion rate in river basins: case study of the Gharesoo River Basin, Catena, 167, 116–129, https://doi.org/10.1016/j.catena.2018.04.026, 2018.
Meinen, B. and Robinson, D.: From hillslopes to watersheds: Variability in model outcomes with the USLE, Environ. Modell. Softw., 146, 105229, https://doi.org/10.1016/j.envsoft.2021.105229, 2021.
Milliman, J., Farnsworth, K., Jones, P., Xu, K., and Smith, L.: Climatic and anthropogenic factors affecting river discharge to the global ocean, 1951–2000, Global Planet. Change, 62, 187–194, https://doi.org/10.1016/j.gloplacha.2008.03.001, 2008.
Mohammad, A. and Adam, M.: The impact of vegetative cover type on runoff and soil erosion under different land uses, Catena, 81, 97–103, https://doi.org/10.1016/j.catena.2010.01.008, 2010.
Moldenhauer, W., Wischmei, W., and Parker, D.: Influence of crop management on runoff erosion and soil properties of a Marshall silty clay loam, Soil Sci. Soc. Am. Proc., 31, 541–546, https://doi.org/10.2136/sssaj1967.03615995003100040031x, 1967.
Muukkonen, P., Hartikainen, H., and Alakukku, L.: Effect of soil structure disturbance on erosion and phosphorus losses from Finnish clay soil, Soil Tillage Res., 103, 84–91, https://doi.org/10.1016/j.still.2008.09.007, 2009.
Nunes, A., de Almeida, A., and Coelho, C.: Impacts of land use and cover type on runoff and soil erosion in a marginal area of Portugal, Appl. Geogr., 31, 687–699, https://doi.org/10.1016/j.apgeog.2010.12.006, 2011.
Nunes, A., Coelho, C., de Almeida, A., and Figueiredo, A.: Soil erosion and hydrological response to land abandonment in a central inland area of Portugal, Land Deg. Develop., 21, 260–273, https://doi.org/10.1002/ldr.973, 2010.
Panagos, P., Borrelli, P., Meusburger, K., Alewell, C., Lugato, E., and Montanarella, L.: Estimating the soil erosion cover-management factor at the European scale, Land Use Pol., 48, 38–50, https://doi.org/10.1016/j.landusepol.2015.05.012, 2015a.
Panagos P., Borrelli P., Meusburger K., Zanden E., Poesen J., Alewell C.: Modelling the effect of support practices (P-factor) on the reduction of soil erosion by water at European scale, Environ. Sci. Pol., 51, 23–34, https://doi.org/10.1016/j.envsci.2015.03.012, 2015b.
Panagos, P., Borrelli, P., and Robinson, D.: Tackling soil loss across Europe, Nature, 526, 195, https://doi.org/10.1038/526195d, 2015c.
Piao, S., Friedlingstein, P., Ciais, P., de Noblet-Ducoudré, N., Labat, D., and Zaehle, S.: Changes in climate and land use have a larger direct impact than rising CO2 on global river runoff trends, P. Natl. Acad. Sci. USA, 104, 15242–15247, https://doi.org/10.1073/pnas.0707213104, 2007.
Pohlert, T., Huisman, J., Breuer, L., and Frede, H.: Integration of a detailed biogeochemical model into SWAT for improved nitrogen predictions: model development, sensitivity, and GLUE analysis, Ecol. Modell., 203, 215–228, https://doi.org/10.1016/j.ecolmodel.2006.11.019, 2007.
Qiu, L., Peng, D., Xu, Z., and Liu, W.: Identification of the impacts of climate changes and human activities on runoff in the upper and middle reaches of the Heihe River basin, China, J. Water Clim. Change, 7, 251–262, https://doi.org/10.2166/wcc.2015.115, 2015.
Renard, K., Foster, G., Weesies, G., McCool, D., and Yoder, D.: Predicting soil erosion by water: a guide to conservation planning with the Revised Universal Soil Loss equation (RUSLE), Agricultural Handbook Service, United States Department of Agriculture, Washington, 1–324, https://handle.nal.usda.gov/10113/11126 (last access: 31 July 2023), 1997.
Rose, C., Williams, J., Sander, G., and Barry, D.: A mathematical model of soil erosion and deposition processes: I. theory for a plane land element, Soil Sci. Soc. Am. J., 47, 991–995, https://doi.org/10.2136/sssaj1983.03615995004700050030x, 1983.
Schiettecatte, W., Gabriels, D., Cornelis, W., and Hofman, G.: Enrichment of organic carbon in sediment transport by interrill and rill erosion processes, Soil Sci. Soc. Am. J., 72, 50–55, https://doi.org/10.2136/sssaj2007.0201, 2008.
Schlenker, W. and Roberts, M.: Nonlinear temperature effects indicate severe damages to US crop yields under climate change, P. Natl. Acad. Sci. USA, 106, 15594–15598, https://doi.org/10.1073/pnas.0906865106, 2009.
Sharpley, A.: The enrichment of soil Phosphorus in runoff sediments, J. Environ. Qual., 9, 521–526, https://doi.org/10.2134/jeq1980.00472425000900030039x, 1980.
Smith, P., Smith, J., Powlson, D., McGill, W., Arah, J., Chertov, O., Coleman, K., Franko, U., Frolking, S., Jenkinson, D., Jensen, L., Kelly, R., Klein-Gunnewiek, H., Komarov, A., Li, C., Molina, J., Mueller, T., Parton, W., Thornley, J., and Whitmore, A.: A comparison of the performance of nine soil organic matter models using datasets from seven long-term experiments, Geoderma, 81, 153–225, https://doi.org/10.1016/s0016-7061(97)00087-6, 1997.
Stewart, B.: Advance in soil science, Springer-Verlag, New York Berlin Heidelberg Tokyo, 18–55, https://doi.org/10.1007/978-1-4612-5046-3, 1985.
Sumner, H., Wauchope, R., Truman, C., Dowler, C., and Hook, J.: Rainfall simulator and plot design for mesoplot runoff studies, Trans. ASAE, 39, 125–130, https://doi.org/10.13031/2013.27489, 1996.
Teixeira, P. and Misra, R.: Measurement and prediction of nitrogen loss by simulated erosion events on cultivated forest soils of contrasting structure, Soil Tillage Res., 83, 204–217, https://doi.org/10.1016/j.still.2004.07.014, 2005.
Vasquez-Mendez, R., Ventura-Ramos, E., Oleschko, K., Hernandez-Sandoval, L., Parrot, J., and Nearing, M.: Soil erosion and runoff in different vegetation patches from semiarid Central Mexico, Catena, 80, 162–169, https://doi.org/10.1016/j.catena.2009.11.003, 2010.
Wainwright, J., Parsons, A., Schlesinger, W., and Abrahams, A.: Hydrology–vegetation interactions in areas of discontinuous flow on a semi-arid bajada, Southern New Mexico, J. Arid Environ., 51, 319–338, https://doi.org/10.1006/jare.2002.0970, 2002.
Wan, Y. and El-Swaify, S.: Sediment enrichment mechanisms of organic carbon and phosphorus in a well-aggregated Oxisol, J. Environ. Qual., 27, 132–138, https://doi.org/10.2134/jeq1998.00472425002700010019x, 1998.
Wang, H., Chen, L., and Yu, X.: Distinguishing human and climate influences on streamflow changes in Luan River basin in China, Catena, 136, 182–188, https://doi.org/10.1016/j.catena.2015.02.013, 2016.
Wei, W., Chen, L., Fu, B., Huang, Z., Wu, D., and Gui, L.: The effect of land uses and rainfall regimes on runoff and soil erosion in the semi-arid loess hilly area, China, J. Hydrol., 335, 247–258, https://doi.org/10.1016/j.jhydrol.2006.11.016, 2007.
Williams, J. R.: The erosion-productivity impact calculator (EPIC) model: a case history, Philos. Trans. Roy. Soc., 329, 421–428, https://doi.org/10.1098/rstb.1990.0184, 1990.
Williams, J.: Sediment routing for agricultural watersheds, J. Am. Water Resour. Assoc., 11, 965–974, https://doi.org/10.1111/j.1752-1688.1975.tb01817.x, 1975.
Williams, J. and Hann, R.: Optimal operation of large agricultural watersheds with water quality constraints, Texas Water Resource Institute, Texas A&M University, Texas, 17–25, https://hdl.handle.net/1969.1/6286 (last access: 31 July 2023), 1978.
Wischmeier, W. and Smith, D.: Predicting rainfall erosion losses: a guide to conservation planning, Agricultural Handbook, Science and Education Administration, United States Department of Agriculture, Washington, 1–47, https://handle.nal.usda.gov/10113/CAT79706928, 1978.
Yang, D., Kanae, S., Oki, T., Koike, T., and Musiake, K.: Global potential soil erosion with reference to land use and climate changes, Hydrol. Process., 17, 2913–2928, https://doi.org/10.1002/hyp.1441, 2003.
Yin, J., He, F., Xiong, Y. J., and Qiu, G. Y.: Effects of land use/land cover and climate changes on surface runoff in a semi-humid and semi-arid transition zone in northwest China, Hydrol. Earth Syst. Sci., 21, 183–196, https://doi.org/10.5194/hess-21-183-2017, 2017.
Zeng, S., Zhan, C., Sun, F., Du, H., and Wang, F.: Effects of climate change and human activities on surface runoff in the Luan river basin, Adv. Meteorol., 6, 1–12, https://doi.org/10.1155/2015/740239, 2015.
Zhang, F., Shi, X., Zeng, C., Wang, L., Xiao, X., Wang, G., Chen, Y., Zhang, H., Lu, X., and Immerzeel, W.: Recent stepwise sediment flux increase with climate change in the Tuotuo River in the central Tibetan Plateau, Sci. Bull., 65, 410–418, https://doi.org/10.1016/j.scib.2019.12.017, 2020.
Zhang, W., Li, Y., Zhu, B., Zheng, X., Liu, C., Tang, J., Su, F., Zhang, C., Ju, X., and Deng, J.: A process-oriented hydro-biogeochemical model enabling simulation of gaseous carbon and nitrogen emissions and hydrologic nitrogen losses from a subtropical catchment, Sci. Total Environ., 616, 305–317, https://doi.org/10.1016/j.scitotenv.2017.09.261, 2018.
Zhang, W., Yao, Z., Zheng, X., Liu, C., Wang, R., Wang, K., Li, S., Han, S., Zuo, Q., and Shi, J.: Effects of fertilization and stand age on N2O and NO emissions from tea plantations: a site-scale study in a subtropical region using a modified biogeochemical model, Atmos. Chem. Phys., 20, 6903–6919, https://doi.org/10.5194/acp-20-6903-2020, 2020.
Zhang, W., Li, S., Han, S., Zheng, X., Xie, H., Lu, C., Sui, Y., Wang, R., Liu, C., Yao, Z., and Li, T.: Less intensive nitrate leaching from Phaeozems cultivated with maize generally occurs in northeastern China, Agr. Ecosyst. Environ., 310, 107303, https://doi.org/10.1016/j.agee.2021.107303, 2021.
Zhang, X., Song, J., Wang, Y., Deng, W., and Liu, Y.: Effects of land use on slope runoff and soil loss in the Loess Plateau of China: a meta-analysis, Sci. Total Environ., 755, 142418, https://doi.org/10.1016/j.scitotenv.2020.142418, 2021.
Zhou, L., Kaufmann, R., Tian, Y., Myneni, R., and Tucker, C.: Relation between interannual variations in satellite measures of northern forest greenness and climate between 1982 and 1999, J. Geophys. Res.-Atmos., 108, ACL 3-1–ACL 3-16, https://doi.org/10.1029/2002jd002510, 2003.
Zhu, B., Wang, T., Kuang, F., Luo, Z., Tang, J., and Xu, T.: Measurements of nitrate leaching from a hillslope cropland in the Central Sichuan Basin, China, Soil Sci. Soc. Am. J., 73, 1419–1426, https://doi.org/10.2136/sssaj2008.0259, 2009.