the Creative Commons Attribution 4.0 License.
the Creative Commons Attribution 4.0 License.
 | 25 Aug 2023
Seasonal cycles of biogeochemical fluxes in the Scotia Sea, Southern Ocean: a stable isotope approach
Sian F. Henley
Katharine Hendry
Marianne Wootton
Lisa Friberg
Ursula Dallman
Tong Wang
Christopher Coath
Clara Manno
The biological carbon pump is responsible for much of the decadal variability in the ocean carbon dioxide (CO2) sink, driving the transfer of carbon from the atmosphere to the deep ocean. A mechanistic understanding of the ecological drivers of particulate organic carbon (POC) flux is key both to the assessment of the magnitude of the ocean CO2 sink and for accurate predictions as to how this will change with changing climate. This is particularly important in the Southern Ocean, a key region for the uptake of CO2 and the supply of nutrients to the global thermocline. In this study we examine sediment-trap-derived particle fluxes and stable isotope signatures of carbon (C), nitrogen (N), and biogenic silica (BSi) at a study site in the biologically productive waters of the northern Scotia Sea in the Southern Ocean. Both deep (2000 m) and shallow (400 m) sediment traps exhibited two main peaks in POC, particulate N, and BSi flux: one in austral spring and one in summer, reflecting periods of high surface productivity. Particulate fluxes and isotopic compositions were similar in both deep and shallow sediment traps, highlighting that most remineralisation occurred in the upper 400 m of the water column. Differences in the seasonal cycles of isotopic compositions of C, N, and Si provide insights into the degree of coupling of these key nutrients. We measured increasing isotopic enrichment of POC and BSi in spring, consistent with fractionation during biological uptake. Since we observed isotopically light particulate material in the traps in summer, we suggest physically mediated replenishment of lighter isotopes of key nutrients from depth, enabling the full expression of the isotopic fractionation associated with biological uptake. The change in the nutrient and remineralisation regimes, indicated by the different isotopic compositions of the spring and summer productive periods, suggests a change in the source region of material reaching the traps and associated shifts in phytoplankton community structure. This, combined with the occurrence of advective inputs at certain times of the year, highlights the need to make synchronous measurements of physical processes to improve our ability to track changes in the source regions of sinking particulate material. We also highlight the need to conduct particle-specific (e.g. faecal pellets, phytoplankton detritus, zooplankton moults) isotopic analysis to improve the use of this tool in assessing particle composition of the sinking material and to develop our understanding of the drivers of biogeochemical fluxes.
- Article
(3736 KB) - Full-text XML
-
Supplement
(1025 KB) - BibTeX
- EndNote


The transfer of carbon from the atmosphere to the deep ocean via the biological carbon pump (Volk and Hoffert, 1985) is important for the sequestration of carbon and, combined with ocean circulation, is a main driver of decadal variability in the ocean carbon dioxide (CO2) sink (DeVries, 2022). A mechanistic understanding of the processes controlling the magnitude and efficiency of the biological carbon pump is therefore key to the assessment and prediction of the ocean's role as a CO2 sink and requires a robust characterisation of the composition of the sinking particles transferring particulate organic carbon (POC) to the deep ocean. The composition of particles affects the sinking rate, lability, and thus degree of remineralisation as they sink through the water column (e.g. Ploug et al., 2008; Giering et al., 2020).
Sediment traps enable visual assessment of sinking particles and have been deployed in numerous locations throughout the world's oceans to both quantify biogeochemical fluxes and characterise the nature of sinking material (e.g. Torres Valdés et al., 2014). Sediment traps can be susceptible to collection biases depending on the depth of deployment, trap design, hydrodynamic conditions, and properties of sinking particles (Buesseler et al., 2007). Moored sediment traps can underestimate the actual flux at depths shallower than ∼1500 m by collecting only a portion of the sinking material, though biases vary greatly between sites (Buesseler et al., 2007). Numerous studies have recorded the dominance of particular organisms or types of detrital material in trap material, highlighting the importance of ecosystem community structure for the magnitude and efficiency of the biological carbon pump. For example, faecal pellets, diatoms, diatom resting spores, and Acantharea have been observed as significant contributors to particle fluxes (González et al., 2009; Belcher et al., 2018, 2017; Manno et al., 2015; Gleiber et al., 2012; Rembauville et al., 2015; Roca-Marti et al., 2017). Such visual assessment of trap material is typically very time-consuming. Additionally, fragile material, such as salp faecal pellets (Iversen et al., 2017; Pauli et al., 2021), may break up in the sample manipulation processes, making it hard to account for visually. Biogeochemical methods such as the use of stable isotopes may offer additional insight into the drivers of POC fluxes (e.g. Henley et al., 2012).
Marine phytoplankton take up aqueous CO2 (CO during photosynthesis, converting it to organic carbon. During this process, the lighter isotope (12C) is preferentially assimilated, which enriches the residual aqueous pool in the heavier isotope (13C). The stable isotopic composition of the POC (δ13CPOC) of the marine phytoplankton is therefore lower than that of the carbon source. Over large scales, the δ13C of marine phytoplankton has been found to be inversely correlated with [CO] in surface waters (Rau et al., 1991). However, numerous other factors have been identified as impacting the δ13CPOC of surface waters and marine plankton. Phytoplankton growth rates, cell geometry, and non-diffusive uptake of carbon via carbon concentration mechanisms have all been highlighted as impacting the δ13CPOC of marine plankton and thus surface waters (Popp et al., 1999, 1998; Bidigare et al., 1999; Trull and Armand, 2001; Tuerena et al., 2019). This decoupling of the relationship between δ13CPOC and [CO] presents challenges for palaeoceanographic studies but also the possibility of using the δ13CPOC of marine samples to infer information about community composition.
During photosynthetic uptake, the balance between supply and demand of carbon impacts δ13CPOC, regulated by the transport of inorganic carbon into the internal cell and fixation to organic carbon (Popp et al., 1999; Trull and Armand, 2001). A greater isotopic fractionation occurs in smaller phytoplankton cells, enabled by the higher cell-surface-area-to-volume (SA:V) ratios and increased amount of [CO] diffusing across the cell membrane relative to the total carbon within the cell (Popp et al., 1998; Tuerena et al., 2019; Hansman and Sessions, 2016). Thus, a community dominated by large, fast-growing diatoms is expected to contribute to enriched δ13CPOC values compared to a community dominated by picoplankton. A study by Henley et al. (2012) in the coastal western Antarctic Peninsula attributed a large (∼10 ‰) negative isotopic shift in δ13CPOC to a near-complete biomass dominance of the marine diatom Proboscia inermis, highlighting the possible impact of shifts in species composition on stable isotopes. It may therefore be possible to use stable isotopes to gain information about the community composition of phytoplankton driving, for example, large spring pulses in POC flux. Additionally, siliceous phytoplankton, such as diatoms, require dissolved silica (silicic acid, DSi) to build their cell walls or frustules (amorphous SiO2⋅nH2O, referred to here as biogenic silica, BSi). During the uptake of DSi, diatoms fractionate the stable isotopes of silicon (28Si, 29Si, 30Si), preferentially taking up the lighter isotopes during cell wall (frustule) formation (De La Rocha et al., 1997). This means that BSi fluxes and ratios of light 28Si to heavy 30Si (expressed as δ30Si) in sinking particulate organic matter (POM) can be informative about DSi utilisation by siliceous phytoplankton. The fractionation of Si isotopes during diatom DSi utilisation is approximately −1.1 ‰, although estimates of this value vary in laboratory and field studies between −0.5 ‰ and −2.5 ‰ (Hendry and Brzezinski, 2014). Whilst some studies have shown that isotopic fractionation is independent of temperature, DSi concentration, and diatom species (e.g. De La Rocha et al., 1997), one in vitro laboratory culture experiment revealed a potential species effect, with polar species exhibiting more extreme fractionation (−2.09 ‰ for Chaetoceros sp. and 0.54 ‰ for Fragilariopsis kerguelensis; Sutton et al., 2013). The impact of water column dissolution on frustule δ30Si is poorly constrained, with experimental evidence for either a small fractionation of −0.55 ‰ (Demarest et al., 2009) or a negligible impact (Wetzel et al., 2014; Egan et al., 2012; Grasse et al., 2021).
Additionally, the stable isotopes of marine nitrogen reveal information about the uptake of inorganic nitrogen sources by phytoplankton (Wada and Hattori, 1978) as well as trophic and food web processes (Michener and Lajtha, 2008). Nitrogen has two isotopes, 14N and 15N, and the ratio between these heavy and light isotopes is expressed as δ15N. Different sources of nitrogen can alter the stable isotopic composition of marine phytoplankton because ammonium characteristically has a lower value of δ15N than nitrate supplied from depth. As well as this, isotopic fractionation occurs during transfer through the food web, with a trophic enrichment of typically 2 ‰–4 ‰ between successive trophic levels (Montoya, 2007; Minagawa and Wada, 1984). Excretion and egestion processes can also impact δ15N; isotopic discrimination during the excretion of ammonium by zooplankton and fish results in ammonium that is 15N-depleted relative to the substrate catabolised (Montoya, 2007). Thus, there are several interacting processes impacting the degree of fractionation and subsequent isotopic ratios in particulate nitrogen (PN), and knowledge of δ15N ratios may provide insight into biogeochemical processes and the composition of the sinking flux.
In this study we examine the seasonal cycle of the magnitude and composition of vertical biogeochemical fluxes of particulate material collected by two sediment traps deployed for almost 1 year on a deep ocean mooring located in the northern Scotia Sea in the Atlantic sector of the Southern Ocean. The Scotia Sea, particularly the region downstream of South Georgia, is a hot spot for biological productivity, supported by higher iron availability (Korb et al., 2008; Matano et al., 2020). Diatoms dominate the phytoplankton assemblage, particularly in the summer months, with smaller contributions of dinoflagellates (Korb et al., 2012). The large, consistent phytoplankton blooms occurring in this region support high fluxes of POC to the deep ocean, with two peaks in POC flux occurring during the seasonal cycle: the first peak in austral spring and the second in late summer or early autumn (Manno et al., 2015). Faecal pellets (up to 91 % in late spring and early summer; Manno et al., 2015), krill exuviae (up to 47 % in summer; Manno et al., 2020), and diatoms, particularly resting spores (annual contribution of 42 %; Rembauville et al., 2016) have been shown to make large contributions to the POC fluxes in our study region. Here we use δ13CPOC, δ15NPN, and δ30SiBSi alongside calculated fluxes of POC, PN, and BSi as tools to reveal information about sinking particulate organic matter and the processes influencing its production and subsequent flux to depth. A greater in-depth understanding of the composition and thus the drivers of POC flux in this important region is key to improving estimates of the current and future strength of the biological carbon pump and the ocean's role as a CO2 sink.
2.1 Study area
This study was conducted in the open-ocean environment of the northern Scotia Sea in the Southern Ocean at a long-term observatory station, P3 (Fig. 1), where an oceanographic mooring is located. The mooring is part of the Scotia Sea Open Ocean Observatory (SCOOBIES: https://www.bas.ac.uk/project/scoobies/, last access: 10 August 2022), a programme designed to investigate the biological and biogeochemical influence of the large and persistent phytoplankton bloom to the northwest of South Georgia.
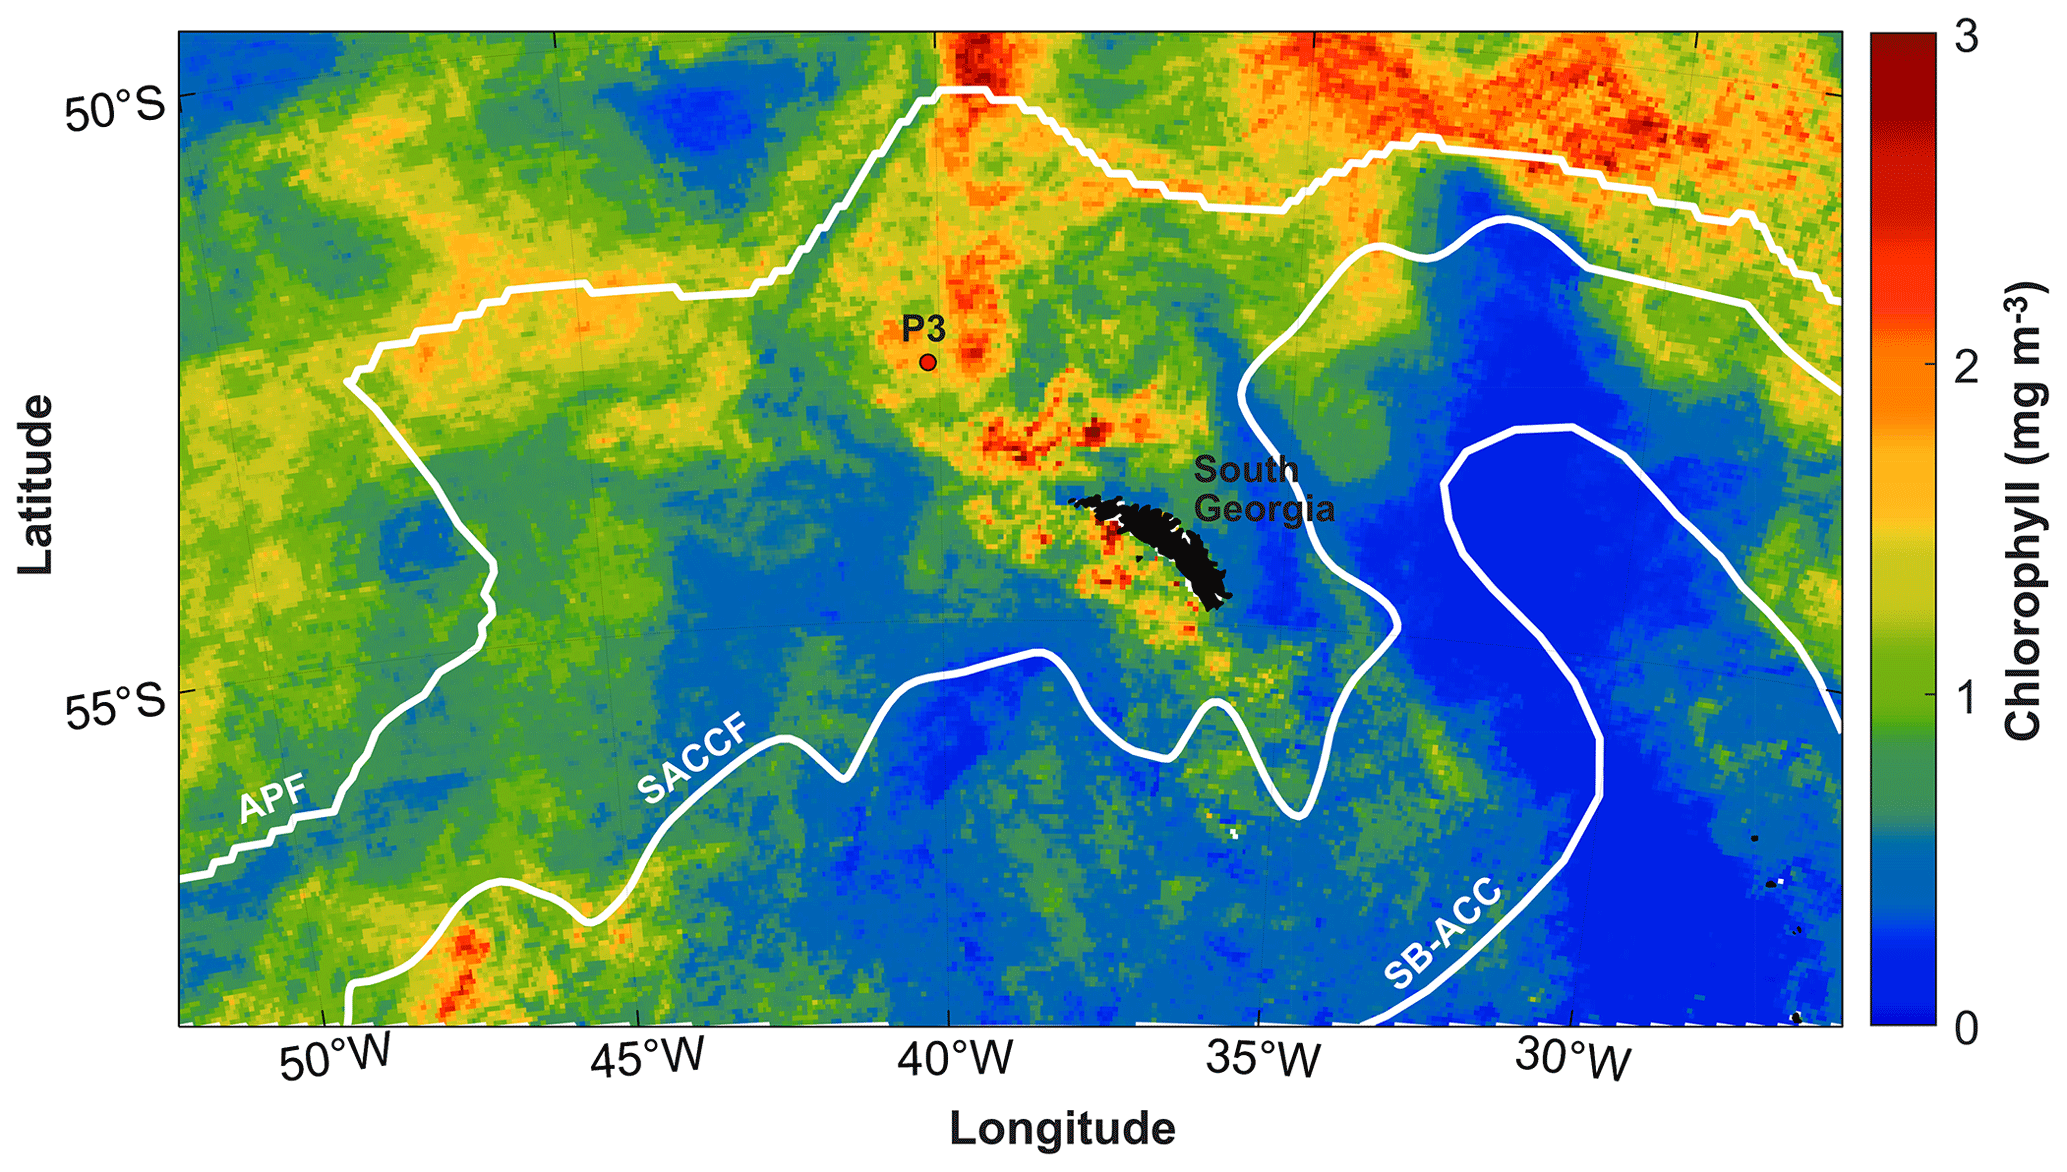
Figure 1Location of P3 mooring site to the northwest of South Georgia. White lines indicate frontal positions of the Antarctic Polar Front (APF) (Moore et al., 1999), Southern Antarctic Circumpolar Current Front (SACCF) (Thorpe et al., 2002), and the southern boundary of the Antarctic Circumpolar Current (SB-ACC) (Orsi et al., 1995). Mean chlorophyll concentration (mg m−3) is shown for December 2018 from 8 d satellite chlorophyll data from the Ocean Colour CCI (version 5.0) (Sathyendranath et al., 2021, 2019).
2.2 Sediment trap deployment
Two sediment traps were deployed on the mooring array to collect sinking particles for the analysis of carbon, nitrogen, and biogenic silica fluxes and the analysis of δ13CPOC, δ15NPN, and δ30SiBSi. The mooring was deployed from 25 January 2018, during research cruise JR17002 aboard the RRS James Clark Ross, to 1 January 2019, recovered during research cruise DY098 aboard the RRS Discovery. The mooring was located at 52.8036∘ S, 40.1593∘ W, to the northwest of the island of South Georgia in the Scotia Sea at a water depth of 3748 m. Sediment traps (McLane PARFLUX, 0.5 m2 surface collecting area; McLane Research Laboratories Inc, Falmouth, MA, USA) were deployed at 400 and 2000 m (referred to hereafter as shallow and deep respectively) and were each equipped with 21 sample bottles. A baffle at the top of the trap prevented large organisms from entering and each sample bottle contained a formosaline solution (filtered seawater containing 2 % formalin, mixed with sodium tetraborate (BORAX; 0.025 % ), and 0.5% sodium chloride) to prevent mixing with the overlying water column and stop biological degradation. Previous studies have reported the effects of formalin on δ13CPOC and δ15NPN to be small (± 1 ‰ and ±1.5 ‰ respectively; Mincks et al., 2008, and references therein). This equates to 13 % and 16 % of the maximum range measured in our study, which is small compared to the isotopic shifts we observed. Yet we stress that all δ13CPOC and δ15NPN values given here are associated with this uncertainty. The sediment trap sample carrousel was programmed to rotate every 7–31 d depending on the season: shorter periods to coincide with austral summer and longer periods during austral winter (Table S1 in the Supplement). Seaguard™ current meters were deployed ∼50 m above the shallow sediment trap and 50 m below the deep sediment trap, set at a measurement interval of 2 h.
2.3 Trap sample processing
Each sample bottle from the sediment trap was processed on return to the laboratory. The supernatant was carefully removed using a syringe, and swimmers (zooplankton that are believed to have entered the trap actively whilst alive) were removed. Swimmers were removed by hand under a dissecting microscope and were not included in flux calculations. The material from each sediment trap sample bottle was split into a number of smaller aliquots for subsequent analysis using a McLane rotary splitter.
2.4 Organic carbon and nitrogen
For each sediment trap bottle from both deep and shallow traps, two or three splits were taken and each was analysed for POC and PN mass and δ13CPOC and δ15NPN. Once split, the material was filtered onto pre-combusted (450 ∘C, 16 h) 25 mm glass fibre filters (GF/F; nominal pore size 0.7 µm) and rinsed with Milli-Q water. Samples were air-dried and fumed for 24 h with 37 % HCl in a desiccator before finally being oven-dried at 50 ∘C for 24 h. Filters and filter blanks were placed in sterile tin capsules, and POC and PN were measured on a CE Instruments NA2500 elemental analyser, calibrated using an acetanilide calibration standard with a known % C and % N of 71.09 % and 10.36 % respectively. Standards were interspersed regularly between samples to measure and correct for drift. Analytical precision was better than 1.0 % for POC and 1.1 % for PN. The POC flux (F, mg C m−2 d−1) for each sample was calculated using the following equation:
Here m is the mass of POC in the sample bottle (mg), d is the number of days that the sample bottle was open (7–31 d), and A is the surface area of the sediment trap opening (0.5 m2). The same calculation was carried out for PN.
δ13CPOC and δ15NPN were analysed on a Thermo Finnigan Delta-V Advantage isotope ratio mass spectrometer that was in line with the elemental analyser. All δ13CPOC and δ15NPN data are presented in the delta per mille (‰) notation relative to the appropriate international standard, according to Eq. (2).
R denotes the 13C 12C ratio for carbon or the 15N 14N ratio for nitrogen. Rsample refers to the relevant ratio in the sample. Rstandard refers to the ratios in the international standards Vienna Pee Dee Belemnite (V-PDB) for δ13C and atmospheric nitrogen (AIR) for δ15N, both of which are calibrated against the PACS-2 marine sediment reference material. Multiple repeats of analytical standards gives a reproducibility of 0.2 ‰ for C and N, which is significantly smaller than the uncertainty associated with organic molecules in the formalin preservative (±1 ‰ and ±1.5 ‰ for C and N respectively; Mincks et al., 2008, and references therein).
2.5 Biogenic silica
Two splits were taken from each sample bottle from both deep and shallow sediment traps for the analysis of biogenic silica and silicon isotopes. Split material was filtered onto 25 mm, 0.4 µm polycarbonate filters and rinsed with Milli-Q water before drying at 50 ∘C for 24 h. Material on the filters was solubilised via an alkaline extraction method (Hatton et al., 2019) carried out at the Bristol Isotope Group (BIG) laboratory. Sample material was digested in Teflon tubes with 0.2M NaOH at 100 ∘C for 40 min. This was followed by neutralisation with 6M HCl. Biogenic silica (SiO2, termed BSi) concentrations were measured chlorometrically by molybdate blue spectrophotometry (heteropoly blue method) (Strickland and Parsons, 1972) using a Hach DR3900 spectrophotometer set at a wavelength of 815 nm. Supernatants were stored for 7–11 months before column chemistry for isotope analysis. Fluxes of biogenic silica were calculated as for POC using Eq. (1).
For Si isotope analysis, supernatants and reference materials were purified by passing through cation exchange columns (Bio-Rad AG50W-X12, 200–400 mesh resin) pre-cleaned with HCl following Georg et al. (2006). Samples were acidified to a pH of 1–2 to ensure that all the silicon remained in solution. Samples were loaded onto columns and eluted with Milli-Q water to produce a 2.5 ppm solution, and concentrations were checked to confirm quantitative yields. Si isotopic composition was analysed within 24 h of column chemistry. Stable Si isotopic compositions are presented in standard delta notation (δ30Si), as for δ13CPOC and δ15NPN according to Eq. (2), where R is 30Si 28Si. These compositions are checked against δ29Si (where R is 29Si 28Si) for mass dependence. The samples were measured at the BIG laboratory on a Finnigan Neptune Plus high-resolution MC-ICP-MS (Thermo Fisher Scientific). The Si solutions were spiked with magnesium spike (Inorganic Ventures MSMG 10 ppm), hydrochloric acid (1M HCl in-house distilled), and sulfuric acid (0.1 M H2SO4, ROMIL-UpA™ Ultra Purity sulfuric acid) and transferred from the autosampler via a PFA Savillex C-Flow nebuliser (35 µL min−1) connected to an Apex IR desolvating nebuliser (Ward et al., 2022) and measured on the low-mass side to resolve any isobaric interferences (e.g. 14N16O+). All standards and samples were blank-corrected offline. The intensity of 28Si in the 0.1 M HCl blank was <1 % of the sample intensity in all sample runs. Furthermore, we also measured Mg isotopes (24Mg, 25Mg, and 26Mg) as an internal isotopic reference to correct for any mass-dependent fractionation (Cardinal et al., 2003). Measurements that resulted in large corrections (>0.3 ‰ on δ30Si) underwent repeat analysis. Instrumental mass bias was further accounted for using a standard-sample bracketing method using a 2 ppm reference standard (NBS or RM8546) solution. Two splits were analysed for each sediment trap bottle as well as standards and sample blanks. Solutions obtained from each split were measured in replicate (n=2–3) alongside the continuous measurement of reference materials diatomite and LMG-08 to ensure reproducibility and to monitor data quality. Measurements of diatomite and LMG-08 yielded δ30Si of +1.23 ‰ (SD ± 0.03, n=18) and −3.40 ‰ (SD ± 0.05, n=5) respectively, which agreed with published values (Reynolds et al., 2007; Hendry and Robinson, 2012; Grasse et al., 2017). Typical reproducibility between the sediment trap sample splits (coming from the same sediment trap bottle) was 0.034 ‰ (1 ± SD). A lithogenic correction (e.g. Closset et al., 2015) was not carried out on these samples given the high percentage of biogenic silica present in the samples (mean percentage BSi as SiO2 of 17 %). BSi extraction methods show lower variability for marine sediments with BSi >15 %–20 % and do not show evidence of significant leaching of lithogenic material through time (Conley, 1998). However, even an extreme scenario of variable lithogenic contamination of 1 %–5 % of isotopically light marine clays (with δ30Si of −2.3 ‰; Opfergelt and Delmelle, 2012) would only result in a potential systematic offset of 0.12 ‰, which, although this is larger than the uncertainty on an individual data point, is 1 order of magnitude smaller than the observed seasonal signal.
2.6 Chlorophyll and phytoplankton community composition
Surface chlorophyll concentrations were obtained from satellite-derived 8 d Ocean Colour CCI (version 5.0) (Sathyendranath et al., 2021, 2019). We present the monthly mean of these 8 d data for December at our study site (Fig. 1) as well as the 8 d chlorophyll concentration data from September 2017 to December 2018 (Fig. 2) averaged over a bounding box around our study site (53–52∘ S, 41–40 ∘ W).
Light microscopy was used to assess phytoplankton and microzooplankton community composition of a small selection of samples from the two main productive periods. A biological method of sample preparation and analysis was chosen, comparable with Rembauville et al. (2015), to determine the quantity of empty and full cells. Following subsampling using the rotary splitter, samples for morphological taxonomic analysis were diluted to a standardised 25 mL. Samples were gently inverted using the Paul Schatz principle (figures of eight) for 1 min to homogenise them, and 2 mL was withdrawn using a modified pipette with widened opening. Several common diatoms in Antarctic waters are long and slim; in particular, Thalassiothrix antarctica has been recorded with an apical axis of up to 5 mm. To ensure such specimens remain intact and are not excluded from the pipetting process, a wide bore opening was used. The 2 mL subsamples were used to fill a 1 mL Sedgwick–Rafter counting chamber. Chambers were viewed using a compound light microscope (Nikon Eclipse 80i) with differential interference contrast at x200 magnification. For the larger, easily identifiable cells, the whole chamber was observed; for smaller cells a proportion of the chamber was examined depending upon cell abundance (at least 500 cells were counted). Only complete cells were enumerated to avoid over counting of fragmented specimens. Cells were determined as “full” or alive at time of collection if they possessed chloroplasts/plastids, pigment, a nucleus, or, in the case of Pronoctiluca, a distinct accumulation body; cells lacking these internal features were deemed as “empty” or dead at time of collection. Specimens were identified according to Hasle and Syvertsen (1997), Medlin and Priddle (1990), Priddle and Fryxell (1985), and Scott and Marchan (2005).
Cell biovolume and surface area estimates were calculated using geometrics and the appropriate shape-related equations for phytoplankton genera proposed by Hillebrand et al. (1999). Metrics used in the calculations were based on the average size of 10 randomly selected specimens belonging to a species or other taxonomic group within the samples.
3.1 Environmental conditions
Mean current velocities were 0.11 (±0.06) and 0.06 (±0.03) m s−1 for shallow and deep current meters respectively (Supplement Fig. S1). Maximum current speeds recorded reached 0.43 and 0.18 m s−1 for shallow and deep meters respectively. The periods with currents substantially elevated above the mean were June for both traps and additionally in late August and September for the shallow trap, both for periods of ∼5–10 d. Both are periods of low fluxes during austral winter and are not the main subject of the study here, though it is likely that particle collection was biased at these times (Buesseler et al., 2007).
Satellite-derived estimates of surface chlorophyll show high concentrations during austral summer (January to March) peaking at 2.3 mg m−3, as well as during spring (November–December), peaking at 2.1 mg m−3 (Figs. 2, S2). Data coverage is limited in the winter due to cloud cover, but concentrations appear to be <0.4 mg m−3. We define here two productive periods (when chlorophyll concentrations were >0.4 mg m−3), which we refer to throughout the paper: productive period 1 – January to the start of April 2018; productive period 2 – September to the end of December 2018. We note that our sediment trap data begin on the 25 January, so we do not capture the start of period 1.
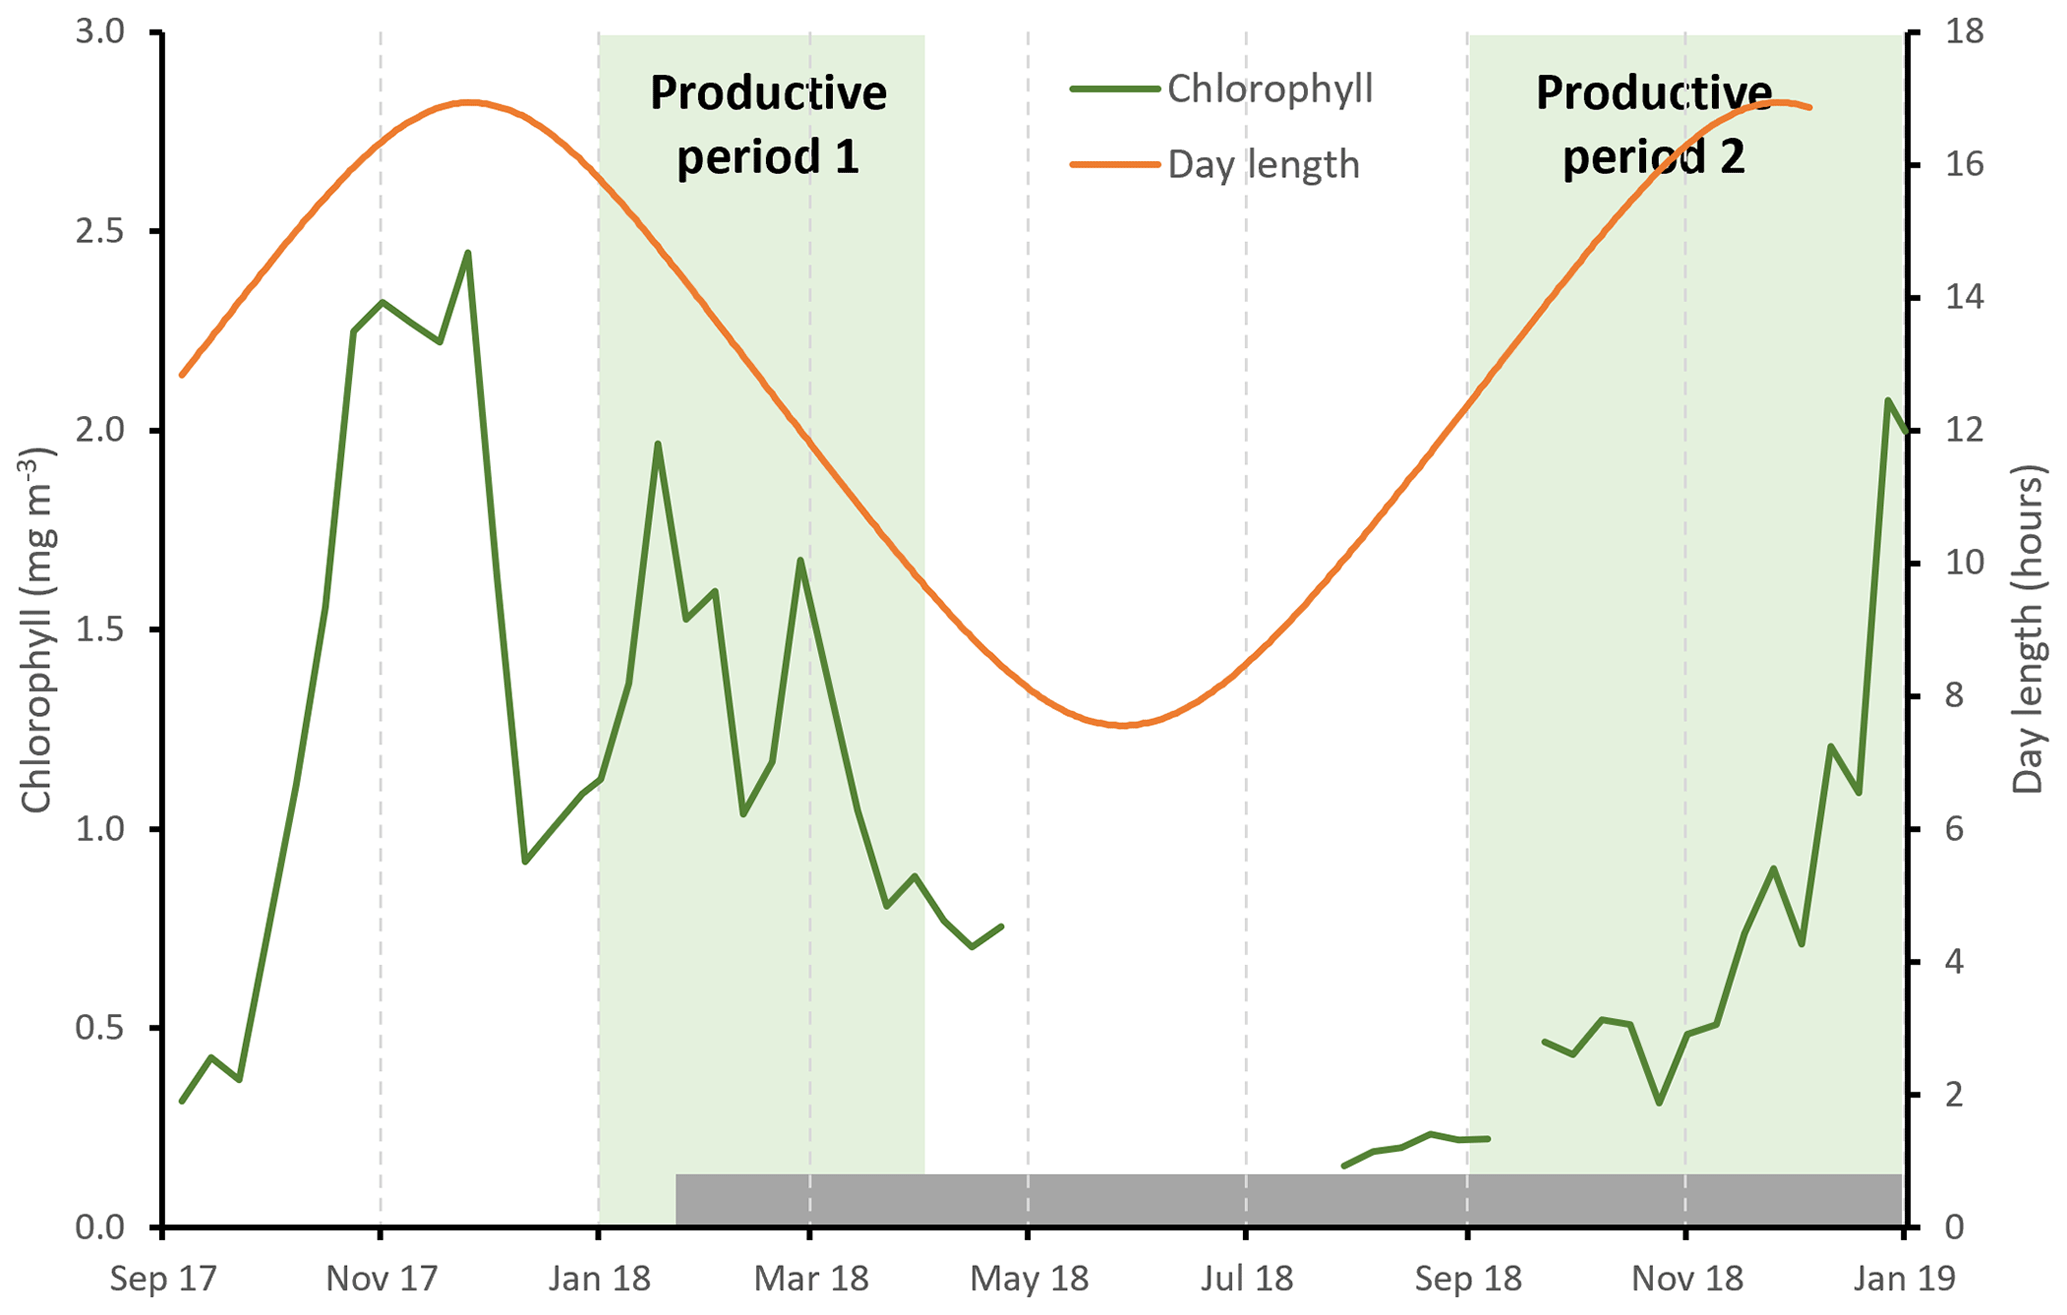
Figure 2Seasonal cycle of satellite-derived surface chlorophyll concentration (green line, 8 d data from the Ocean Colour CCI (version 5.0 (Sathyendranath et al., 2021, 2019)). Day length at 53∘ S is shown by the orange line. The two productive periods are highlighted by the shaded green regions, and the grey shaded bar shows the duration of the sediment trap sampling period.
3.2 POC, PN, and BSi fluxes
There is a clear seasonal cycle in POC, PN, and BSi fluxes, all tracking each other well (Fig. 3). Since two to three splits were analysed from each sediment trap bottle, we refer here to the mean flux for each sediment trap bottle based on the available splits for that bottle. POC fluxes were low during austral autumn and winter, with fluxes <10 and <7 mg C m−2 d−1 for shallow and deep traps respectively during the period March to October 2018 (Fig. 3a). Higher fluxes were measured in summer 2018 (productive period 1), reaching 25.3 mg C m−2 d−1 in late January 2018 in the shallow trap and 13.1 mg C m−2 d−1 in late February in the deep trap. The maximum POC fluxes measured occurred in early December 2018 (productive period 2), reaching 45.7 and 43.4 mg C m−2 d−1 in shallow and deep traps respectively. PN fluxes follow the same trends as POC fluxes, peaking at 4.2 and 2.4 mg N m−2 d−1 during period 1 and 10.8 and 8.2 mg N m−2 d−1 during period 2 in shallow and deep traps respectively (Fig. 3b). The mean POC:PN ratio (mol : mol) throughout the study period was 6.40 (±0.73) and 6.02 (±0.90) in shallow and deep traps respectively, with higher ratios in the productive periods compared to the winter months. Mean POC:PN ratios were 6.83 (±0.48) and 6.63 (±0.71) during period 1 and period 2 in the shallow trap and 6.40 (±0.63) and 5.51 (±0.87) in the deep trap. Over the winter months POC:PN was 5.83 (±0.54) and 6.26 (±0.87) in shallow and deep traps respectively.
BSi fluxes (Fig. 3c) track those of POC well. The lowest fluxes (<20 mg SiO2 m−2 d−1) occurred in the autumn and winter (March–October), with the exception of a small peak of up to 39.7 mg SiO2 m−2 d−1 in May 2018. During summer 2018 (productive period 1), BSi fluxes were high, reaching 129.1 mg SiO2 m−2 d−1 in early February in the shallow trap and 84.3 mg SiO2 m−2 d−1 in late February in the deep trap. By far the highest fluxes were observed in spring 2018 (productive period 2), peaking in early December at 562.4 and 285.4 mg SiO2 m−2 d−1 in shallow and deep traps respectively. The mean BSi : POC ratio (mol : mol) throughout the study period was 29.82 (±17.80) and 25.86 (±11.72) in shallow and deep traps respectively. Higher BSi : POC ratios were observed in the shallow trap in period 1 (38.45 ± 10.96), and both shallow and deep traps in period 2 (36.94 ± 16.32 and 35.70 ± 12.10 respectively). BSi : POC ratios were lower in the deep trap during period 1 (23.64 ± 6.82). The correspondence in timing of the elevated fluxes of POC, PN, and BSi fluxes in the shallow and deep traps in spring (period 2) highlights that sinking rates must be sufficient (>114 m d−1) for particles to travel the 1600 m between the two traps in the 14 d period that those sediment trap cups were open. In period 1, there was a time lag of 14 to 35 d between the timing of the maximum POC, PN, and BSi fluxes in the deep and shallow sediment traps. This suggests sinking rates of 46–114 m d−1. However, we stress that this assumes vertical sinking, which as we discuss in Sect. 4 is not always the case.
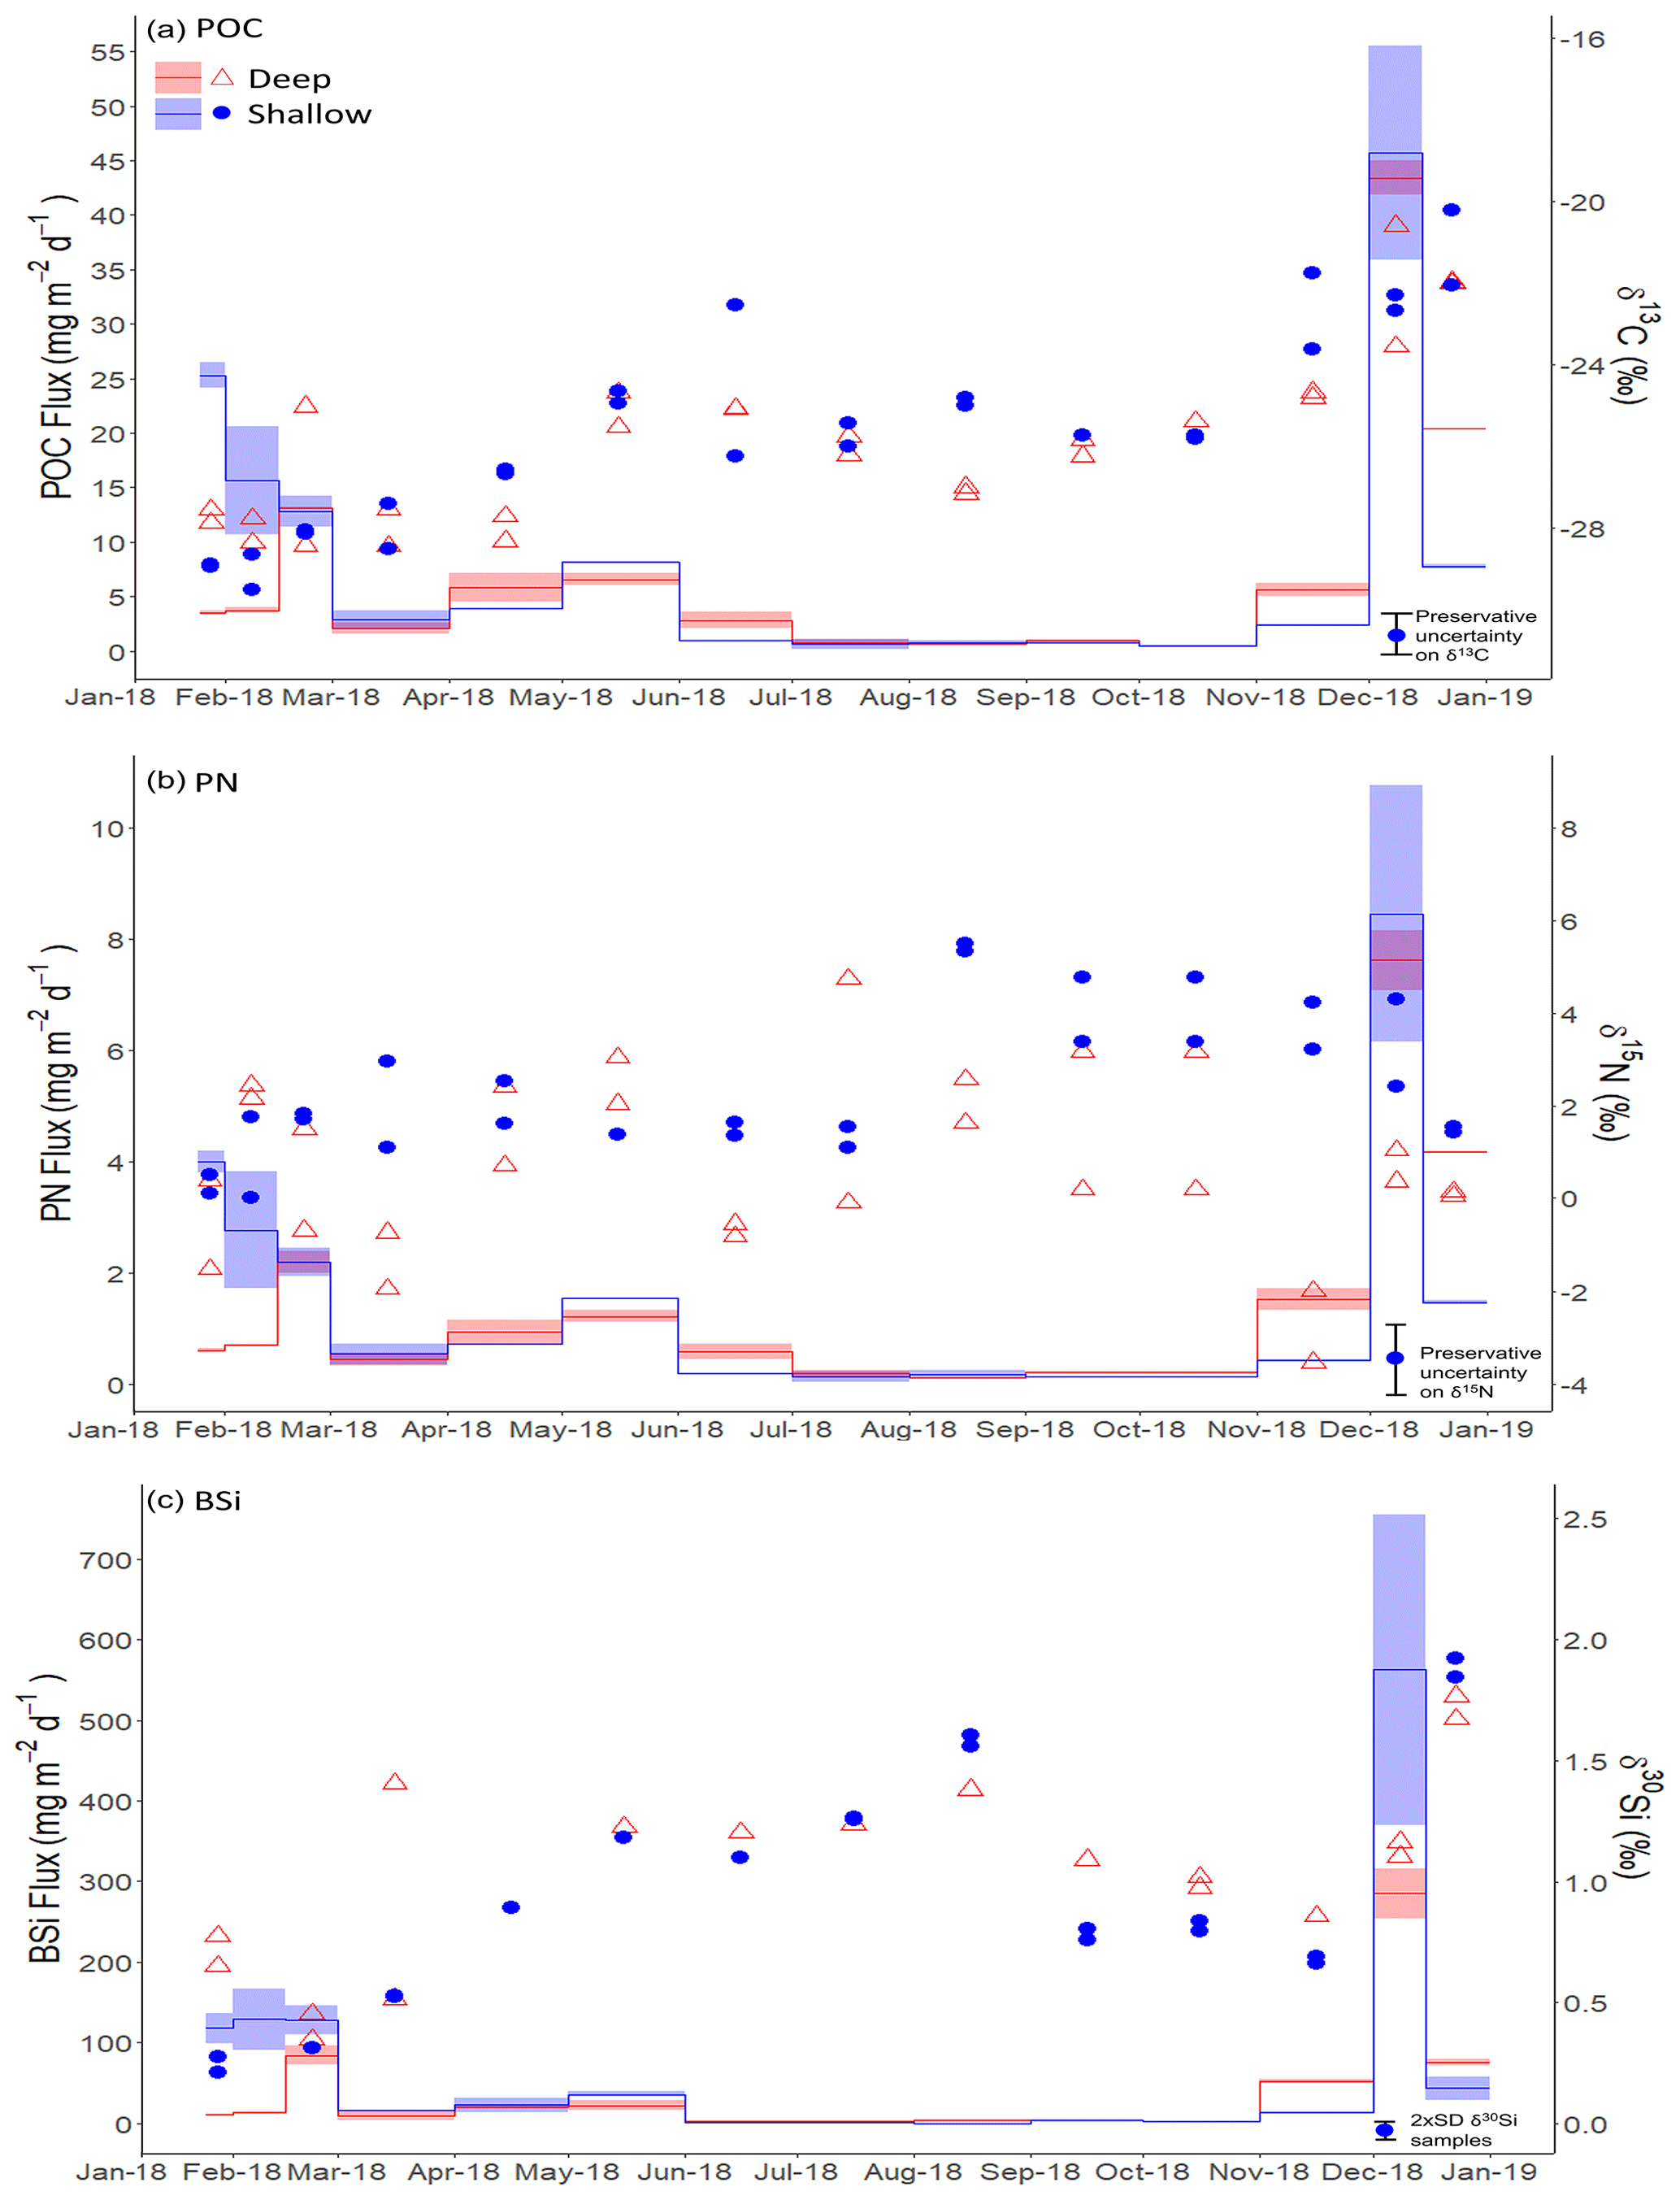
Figure 3(a) Particulate organic carbon (POC), (b) particulate nitrogen (PN), and (c) biogenic silica (SiO2, BSi) fluxes (mg m−2 d−1) at deep (red shading) and shallow (blue shading) sediment traps. Shading indicates the maximum and minimum flux from two splits, with the solid line indicating the mean value. Coloured points show isotope ratios for (a) δ13CPOC, (b) δ15NPN, and (c) δ30SiBSi with red open triangles and blue filled circles indicating deep and shallow sediment traps respectively. The legend shown in the top left hand corner of panel a applies to all panels. The maximum error in sediment trap δ13CPOC (±1 ‰) and δ15NPN (±1.5 ‰) values is shown by scaled error bars in the bottom right corner and is associated with formaldehyde preservation (Mincks et al., 2008) since this vastly exceeds analytical error. For δ30SiBSi, the scaled error bar represents 2 ± SD (0.07 ‰) for the analytical sample replicates. For each sample, isotope ratios are given at the midpoint of the period that the sample cup was open.
3.3 δ13CPOC, δ15NPN, and δ30SiBSi isotopes
δ13CPOC values of deep and shallow sediment trap samples track each other well and show the same order of enrichment and depletion (Fig. 3a). When describing the results for an individual sediment trap bottle, we give the mean of replicate splits from that sediment trap bottle unless otherwise stated. Initially, from January to March 2018, we see isotopically light δ13CPOC values between −27.40 ‰ and −28.56 ‰, before increasing to −24.38 ‰ and −25.07 ‰ in June in shallow and deep traps respectively. Over winter, δ13CPOC became more depleted (shallow −25.76 ‰ in October; deep −27.07 ‰ in August) with a slight divergence (2.17 ‰) in the tracking of deep and shallow δ13CPOC in August 2018. Coinciding with increasing chlorophyll concentrations, δ13CPOC became more enriched during the period September to December 2018 (−25.72 ‰ to −21.13 ‰ and −26.04 ‰ to −21.98 ‰ for shallow and deep traps respectively).
Comparison of flux-weighted δ13CPOC values confirms the carbon isotopic similarity of deep and shallow traps, particularly during period 2 (Table 1). These results also highlight the shift in both δ13CPOC and δ30SiBSi between period 1 and period 2.
Table 1Sediment trap seasonal (January 2018–December 2018), period 1 (January 2018–start of April 2018), period 2 (September 2018–end of December 2018), and winter (April–end of August) flux-weighted mean δ13CPOC (‰), δ15NPN (‰), and δ30SiBSi (‰) for shallow (400 m) and deep (2000 m) traps. Given that the analytical conditions were the same for all samples measured, we use the pooled variance over the applicable time period as a measure of uncertainty in these mean isotopic ratios. Degrees of freedom (dof) are based on cups with replicate isotopic measurements and are given in parentheses.
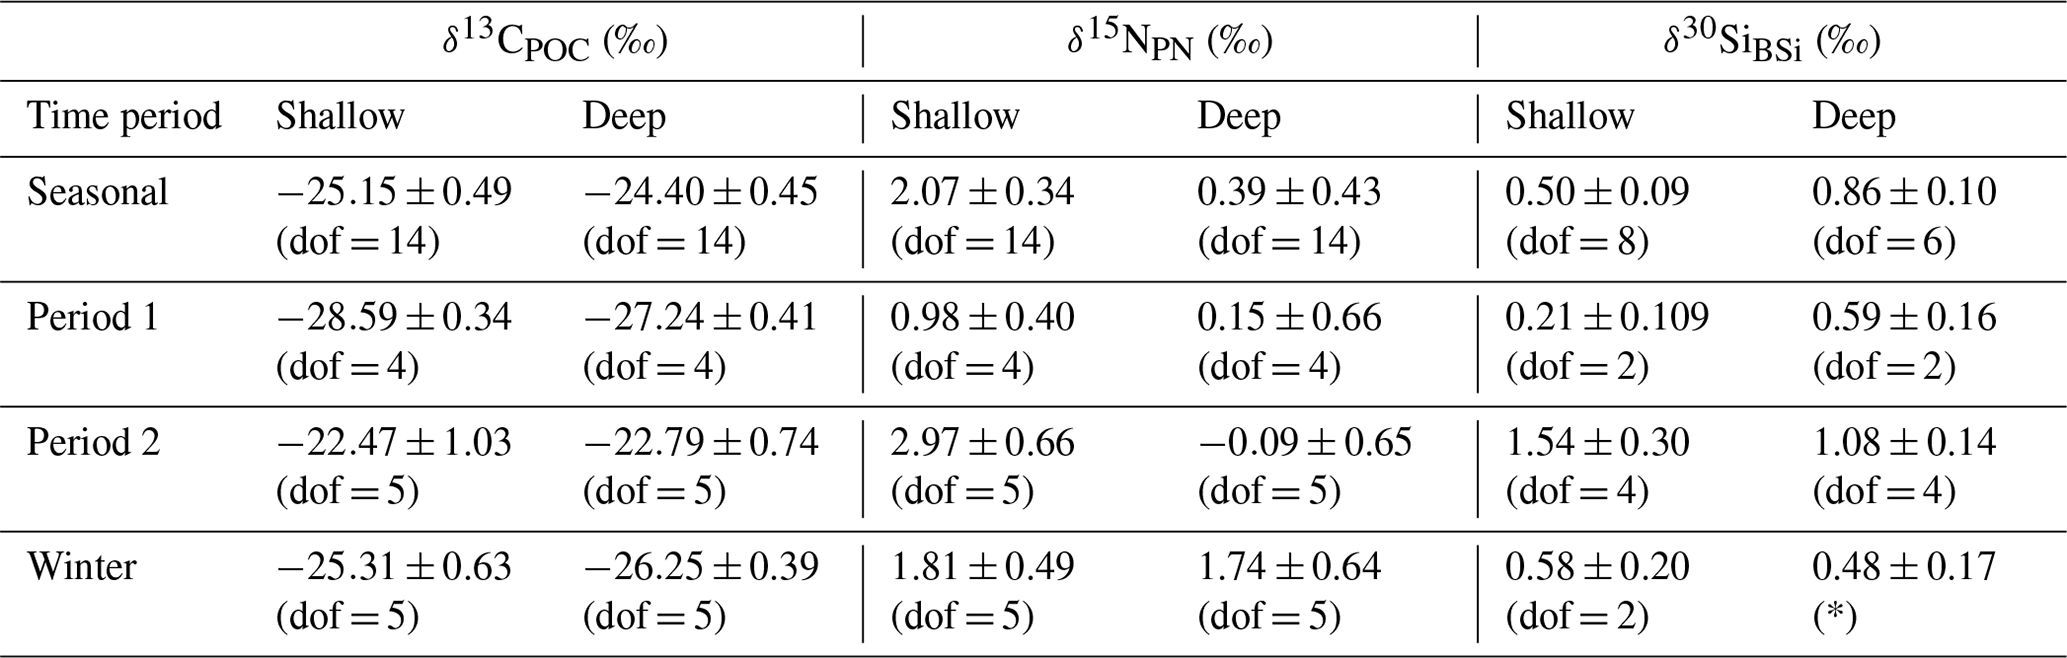
∗ There were no replicates from the deep sediment trap sample bottles for Si isotopes during this period.
δ15NPN values are less consistent between deep and shallow sediment trap samples, and there is more heterogeneity between sample splits. For the shallow trap we see values ranging between +0.13 ‰ and +2.96 ‰ (mean +1.42 ‰; SD 0.79 ‰) from January to June 2018, and, for the deep trap, values ranged between −1.95 ‰ and +3.04 ‰ (mean +0.60 ‰; SD 1.60 ‰) during this period. Values increase between June and August, reaching +5.42 ‰ and +2.10 ‰ in shallow and deep traps respectively. From August to December (shallow) and August to November (deep), we see a trend of decreasing δ15NPN to +1.49 ‰ and −2.77 ‰ in shallow and deep traps respectively, with the decrease being of a similar magnitude (3.93 ‰ and 4.87 ‰ respectively) for both traps. Shallow δ15NPN is consistently higher than deep δ15NPN by 4.52 ‰ on average during this period (August to November). In the deep trap we see a final increase in δ15NPN coinciding with the increase in PN flux from November to December 2018, reaching a mean of +0.71 ‰. The same increase in δ15NPN is not apparent in the shallow trap.
Si isotope compositions in deep and shallow samples were quite similar, exhibiting the same seasonal patterns. Both deep and shallow traps showed an increase in δ30SiBSi from January to July 2018 (+0.71 ‰ to +1.24 ‰ in the deep trap and +0.24 ‰ to +1.26 ‰ in the shallow trap) with the steepest increase occurring from March to May (Fig. 3c). Sample splits generally showed good agreement with one exception during March 2018 when sample splits from the deep sediment trap were +0.52 ‰ and +1.41 ‰, highlighting the heterogeneous nature of the sediment trap material. Isotopic values in the deep trap were then quite steady over winter compared to the rest of the record, with an increase of 0.38 ‰ in the shallow trap between May and August. At the end of August, δ30SiBSi began to decrease steeply, reaching +0.68 ‰ and +0.86 ‰ in shallow and deep traps respectively in November 2018. Following this, δ30SiBSi increased rapidly to +1.72 (deep) and +1.89 ‰ (shallow) coinciding with the large increase in BSi fluxes at this time.
3.4 Phytoplankton community structure
Eight samples (four deep and four shallow, Table 2) were analysed by light microscopy for phytoplankton composition to cover the high-productivity periods 1 and 2. Diatoms, silicoflagellates, and dinoflagellates were observed, with a dominance of diatoms (>85 % by both abundance and biovolume). Microzooplankton were also recorded, in particular Radiolaria and tintinnids, though these were not dominant by biovolume or abundance. Only intact cells were identified and counted. In terms of abundance, during period 1, the diatoms Fragilariopsis spp. dominated both deep (58 %–66 %) and shallow (∼70 %) trap samples (Fig. 4a, c), whereas during period 2 the phytoplankton community structure was more mixed, with contributions from the diatoms Thalassionema nitzschioides, Chaetoceros small (<20 µm) centrics, and Fragilariopsis spp. Large centric diatoms (>20 µm) represented 15 %–20 % of the community by abundance in the deep trap during productive period 1 but <2.5 % in productive period 2. Interestingly we do not see these large centrics in the shallow trap during productive period 1, implying that sinking velocities were <76 m d−1 for these large phytoplankton cells based on the duration that the first sediment trap bottle was open and the depth between the two traps.
In terms of biovolume, Fragilariopsis spp. were still a dominant component of the shallow trap sample in period 1 (∼33 %) but were <9 % of the community in the deep trap during period 1, with the large cells of the diatom Coscinodiscus dominating with 39 %–67 % (Fig. 4b, d). Diatoms, Corethron pennatum (shallow: 10 %–13 %; deep: 15 %), Rhizosolenia (shallow: 9 %–21 %), and large centric diatoms (>20 µm) (shallow: 10 %–17 %; deep: 16 %–20 %) as well as the silicoflagellate Dictyocha (shallow: 9 %–10 %; deep: 8 %) were also relatively high in terms of biovolume during period 1. During period 2, the community was quite mixed in terms of biovolume in the shallow trap (Fig. 4b). The deep trap had similar contributions from Fragilariopsis spp. (22 %–28 %), Dictyocha (14 %–15 %), Coscinodiscus (10 %), and small (<20 µm, 9 %–14 %) and large (>20 µm, 9 %–19 %) centric diatoms during period 2. Since there has been little known work on the δ30Si of Dictyocha or indeed other silicoflagellates, we are not able to constrain the impact of this organism on our measured values. However, since the contribution by abundance was >5 % and diatoms were dominant (>85 %), their isotopic signature would need to be vastly different from that of diatoms to have an appreciable impact on our results.
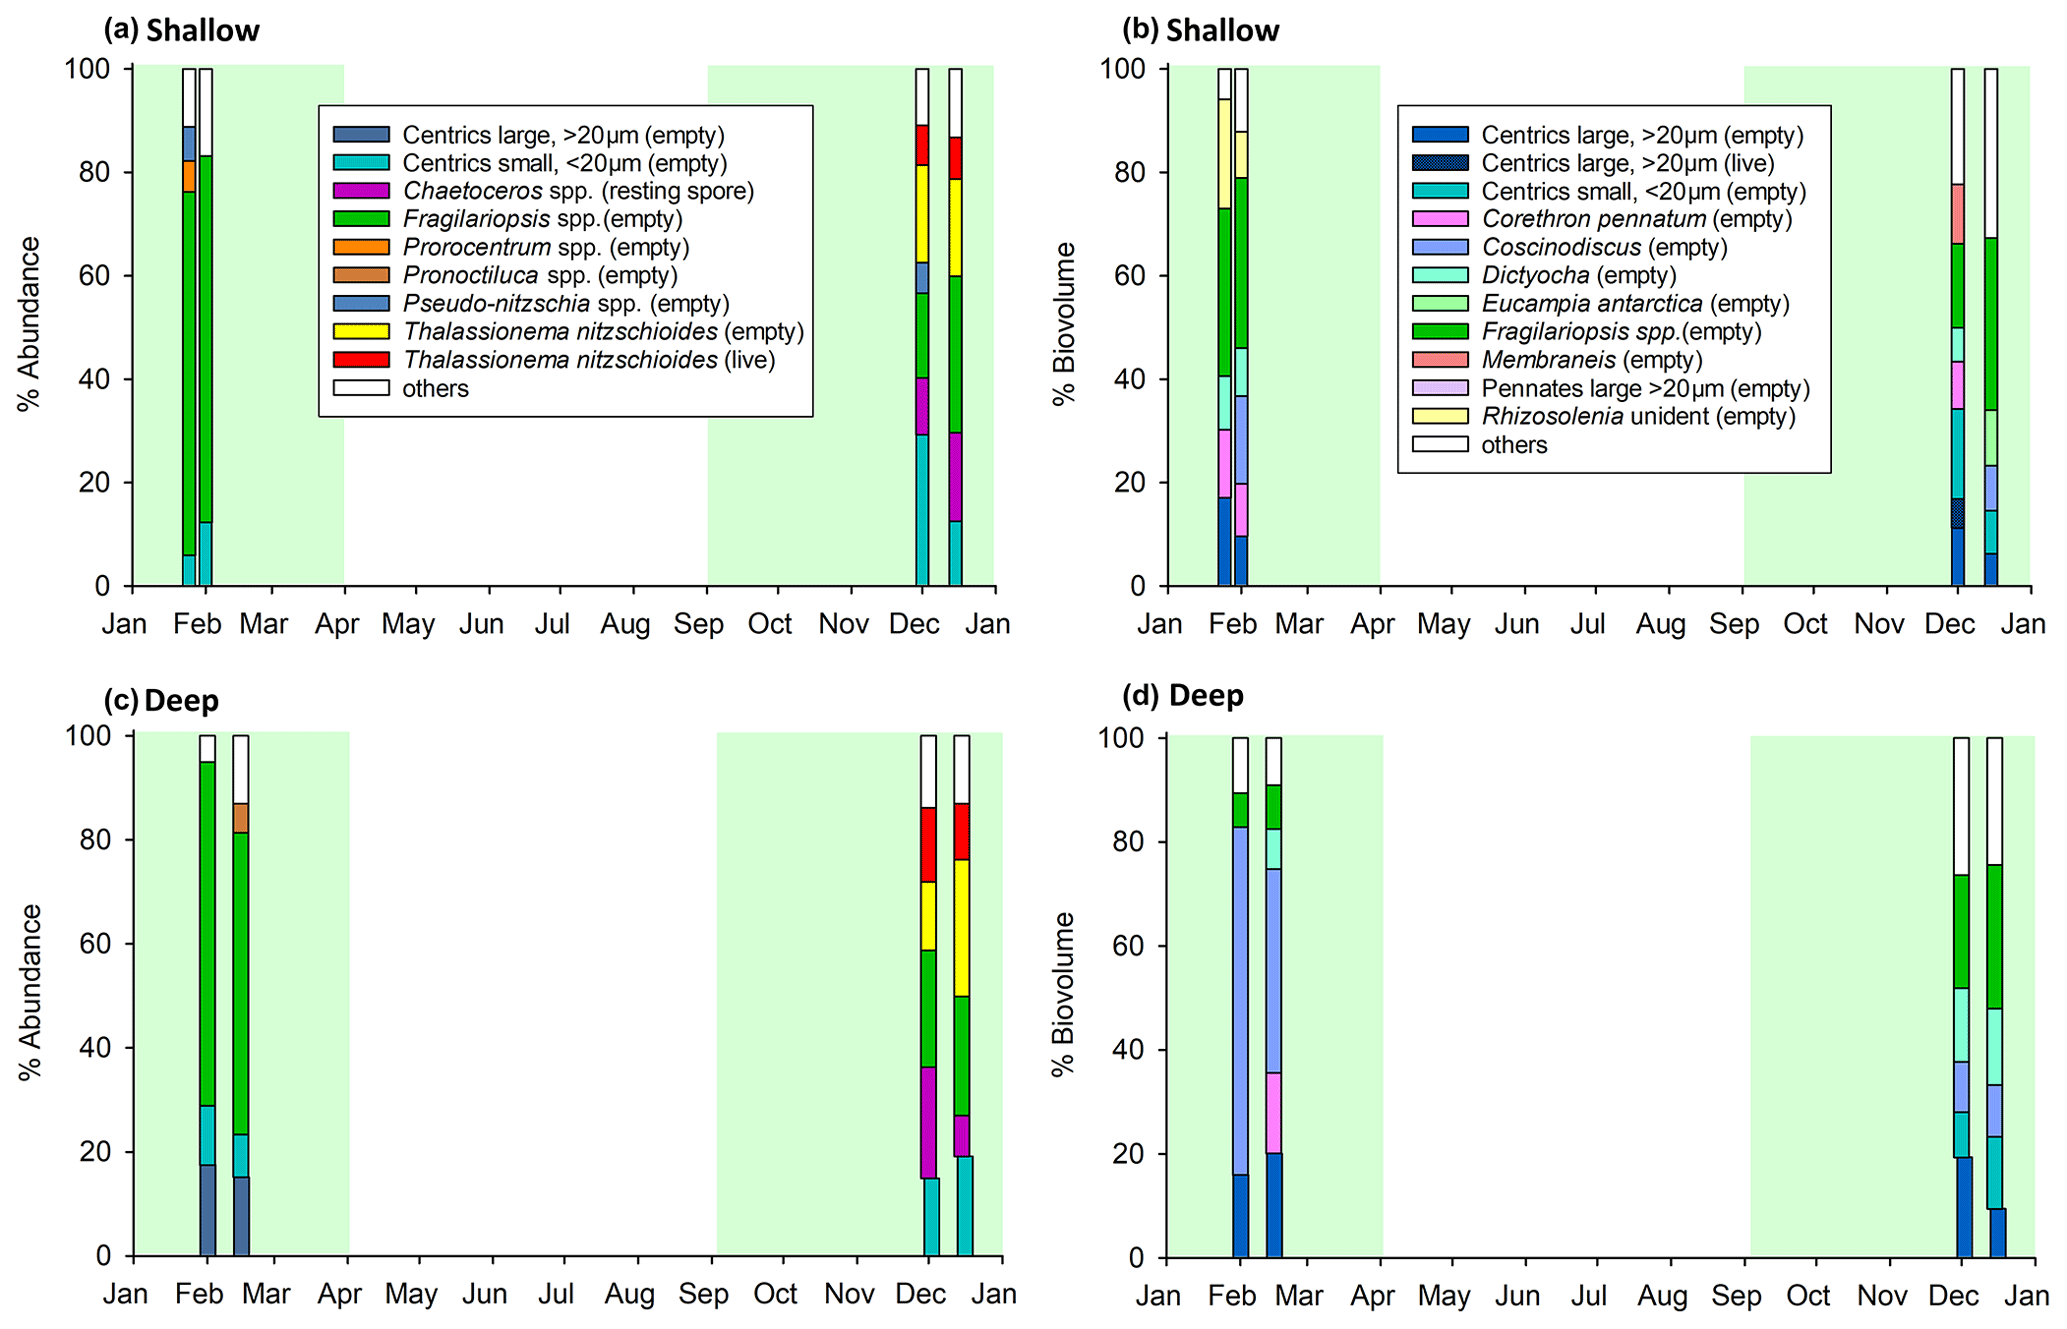
Figure 4Phytoplankton assemblage of (a, b) shallow and (c, d) deep sediment trap samples, according to abundance (a, c) and biovolume (b, d). Plots (a) and (c) show phytoplankton contributing >5 % by abundance, and plots (b) and (d) show phytoplankton contributing >5 % by biovolume. Other refers to all other counted taxa combined. Four samples were identified taxonomically for each trap. Green shading highlights productive periods 1 and 2, as per Fig. 2. Note that only intact cells were counted.
In this study we measure the seasonal cycle of POC, PN, and BSi fluxes as well as the δ13CPOC, δ15NPN, and δ30SiBSi values of sinking particles collected in shallow (400 m) and deep (2000 m) sediment traps in the Scotia Sea, Southern Ocean. Both the magnitude of fluxes and isotopic compositions were generally similar in the shallow and deep sediment traps, suggesting that most remineralisation occurred in the upper 400 m. This highlights that material reaching 400 m likely facilitates the transfer of carbon much deeper in the ocean, sequestering carbon for longer time periods (Kwon et al., 2009).
4.1 Seasonal flux cycles
The seasonal cycles of POC agree well with previously published work at the same location (Manno et al., 2015), with peaks in austral spring and late summer, though the peak POC fluxes recorded here (45.7 and 43.4 mg C m−2 d−1 in shallow and deep traps respectively) are higher than those observed in previous years (22.9 mg C m−2 d−1; Manno et al., 2015). A smaller additional peak in POC flux (<10 mg C m−2 d−1) occurred in April and May, in agreement with some previous years (Manno et al., 2015). PN fluxes followed the same seasonal trend as POC for both deep and shallow traps suggesting a similar source. The similar magnitude of POC:PN ratios in period 1 in the two traps supports consistency in the degree of degradation at these depths. The lower POC:PN ratios measured in the deep trap between August and October compared to the shallow trap are consistent with a divergence in δ15NPN ratios and could indicate that material arriving at the two traps is not necessarily sourced from the same region and time period in surface waters. Given the slower sinking speeds at this low-productivity time of year, it is possible that material reaching the deep trap is sourced from upstream of where material reaching the shallow trap is sourced in the regional circulation system. Different source regions are likely characterised by different phytoplankton assemblages with different nutrient stoichiometry, and the time taken for source material to reach each of the traps may well lead to differences in the degradation state of organic matter, which could also lead to variations in POC:PN.
Our measured fluxes of BSi are higher than previously observed at this site at 2000 m (Rembauville et al., 2016). Maximum fluxes of 46.0 mg SiO2 m−2 d−1 were recorded by Rembauville et al. (2016) in January 2012, which though of similar magnitude to our summer peak of 84.3 mg SiO2 m−2 d−1 is 1 order of magnitude lower than the spring peak of 285.4 mg SiO2 m−2 d−1 in December 2018. However, the Rembauville et al. (2016) record ends in November and therefore would not have captured the main peak in particle flux following the phytoplankton spring bloom in December (apparent in satellite surface chlorophyll; Fig. 2 in Rembauville et al., 2016). Additionally, we do not capture the first 3 weeks of January in our data. Interannual variability in export flux can be high due to the complexity of processes controlling the magnitude of export flux, such as community structure, nutrient limitation, and zooplankton activity. Closset et al. (2015) measured very high fluxes (>700 mg SiO2 m−2 d−1) of BSi south of the Sub-Antarctic Front in the Australian sector of the Southern Ocean at 2000 m, and similarly high fluxes have been observed in other sectors (Fischer et al., 2002; Honjo et al., 2000). A study by Trull et al. (2001) measured fluxes of BSi in the range of 30–160 mg SiO2 m−2 d−1 during the productive season in the same region as Closset et al. (2015), again highlighting the high interannual variability.
We define two main productive periods: productive period 1 from January to the start of April 2018 and productive period 2 from September to the end of December 2018 when chlorophyll concentrations were >0.4 mg m−3. Satellite data suggest the magnitude of chlorophyll concentration was similar during both productive periods but increasing in magnitude throughout period 2 and decreasing in period 1, consistent with the timing of sampling. The particle fluxes associated with productive period 2 were much higher than those during productive period 1, a difference that is particularly pronounced for BSi fluxes. The bloom during period 2 was more geographically widespread (Fig. S2), and thus it is possible that if more of the material reaching the trap was sourced from productive waters, this could have supported the higher fluxes observed at this time. The observed higher BSi fluxes in productive period 2 could also relate to the presence of more heavily silicified diatom species at this time, including the occurrence of resting spores (Chaetoceros spp.; Fig. 4 and Rembauville et al., 2016), increased aggregation (and thus sinking) potential, higher sinking rates, and/or reduced grazing pressure. The fact that we observed resting spores at the end of productive period 2 suggests that nutrients may have started to become limiting for at least some of the phytoplankton community (e.g. silicic acid and/or iron; Rembauville et al., 2016). POC and BSi fluxes track each other closely, and ratios suggest substantial export of biogenic silica (Fig. 5). This, combined with our visual observations of a dominance of phytoplankton material in the trap during the spring peak that was dominated by diatoms (Fig. 4), suggests an important role for diatoms in transferring organic carbon to the deep ocean at this time. This could be achieved if cells are large, through large mineral (silica) ballasted cells sinking at high velocities (Baumann et al., 2022) or through the bioprotection of internal organic matter from grazing and oxidation by the diatom silica frustules (Passow and De La Rocha, 2006; Armstrong et al., 2001; Smetacek et al., 2004).
4.2 Seasonal variations in isotope ratios
Despite the strong relationship between particulate fluxes of POC and BSi, the relationship between the δ13CPOC and δ30SiBSi isotope signatures is less pronounced (linear regression: R2=0.427, p<0.001; Fig. 5). This may relate to greater variation in the fractionation factor for δ13C compared to δ30Si (Brandenburg et al., 2022) as well as differences in remineralisation of organic carbon and silicon in the frustule. Additionally, whereas most of the δ30Si signal is from diatoms, the δ13C signal in the sediment trap material is also impacted by the presence of other organic material, e.g. zooplankton faecal pellets. We do not find significant relationships between δ15NPN and δ13CPOC (p=0.63) or δ30SiBSi (p=0.60). We discuss results for each of the three main periods: productive period 1 (first export event), the winter flux hiatus, and productive period 2 (second export event).
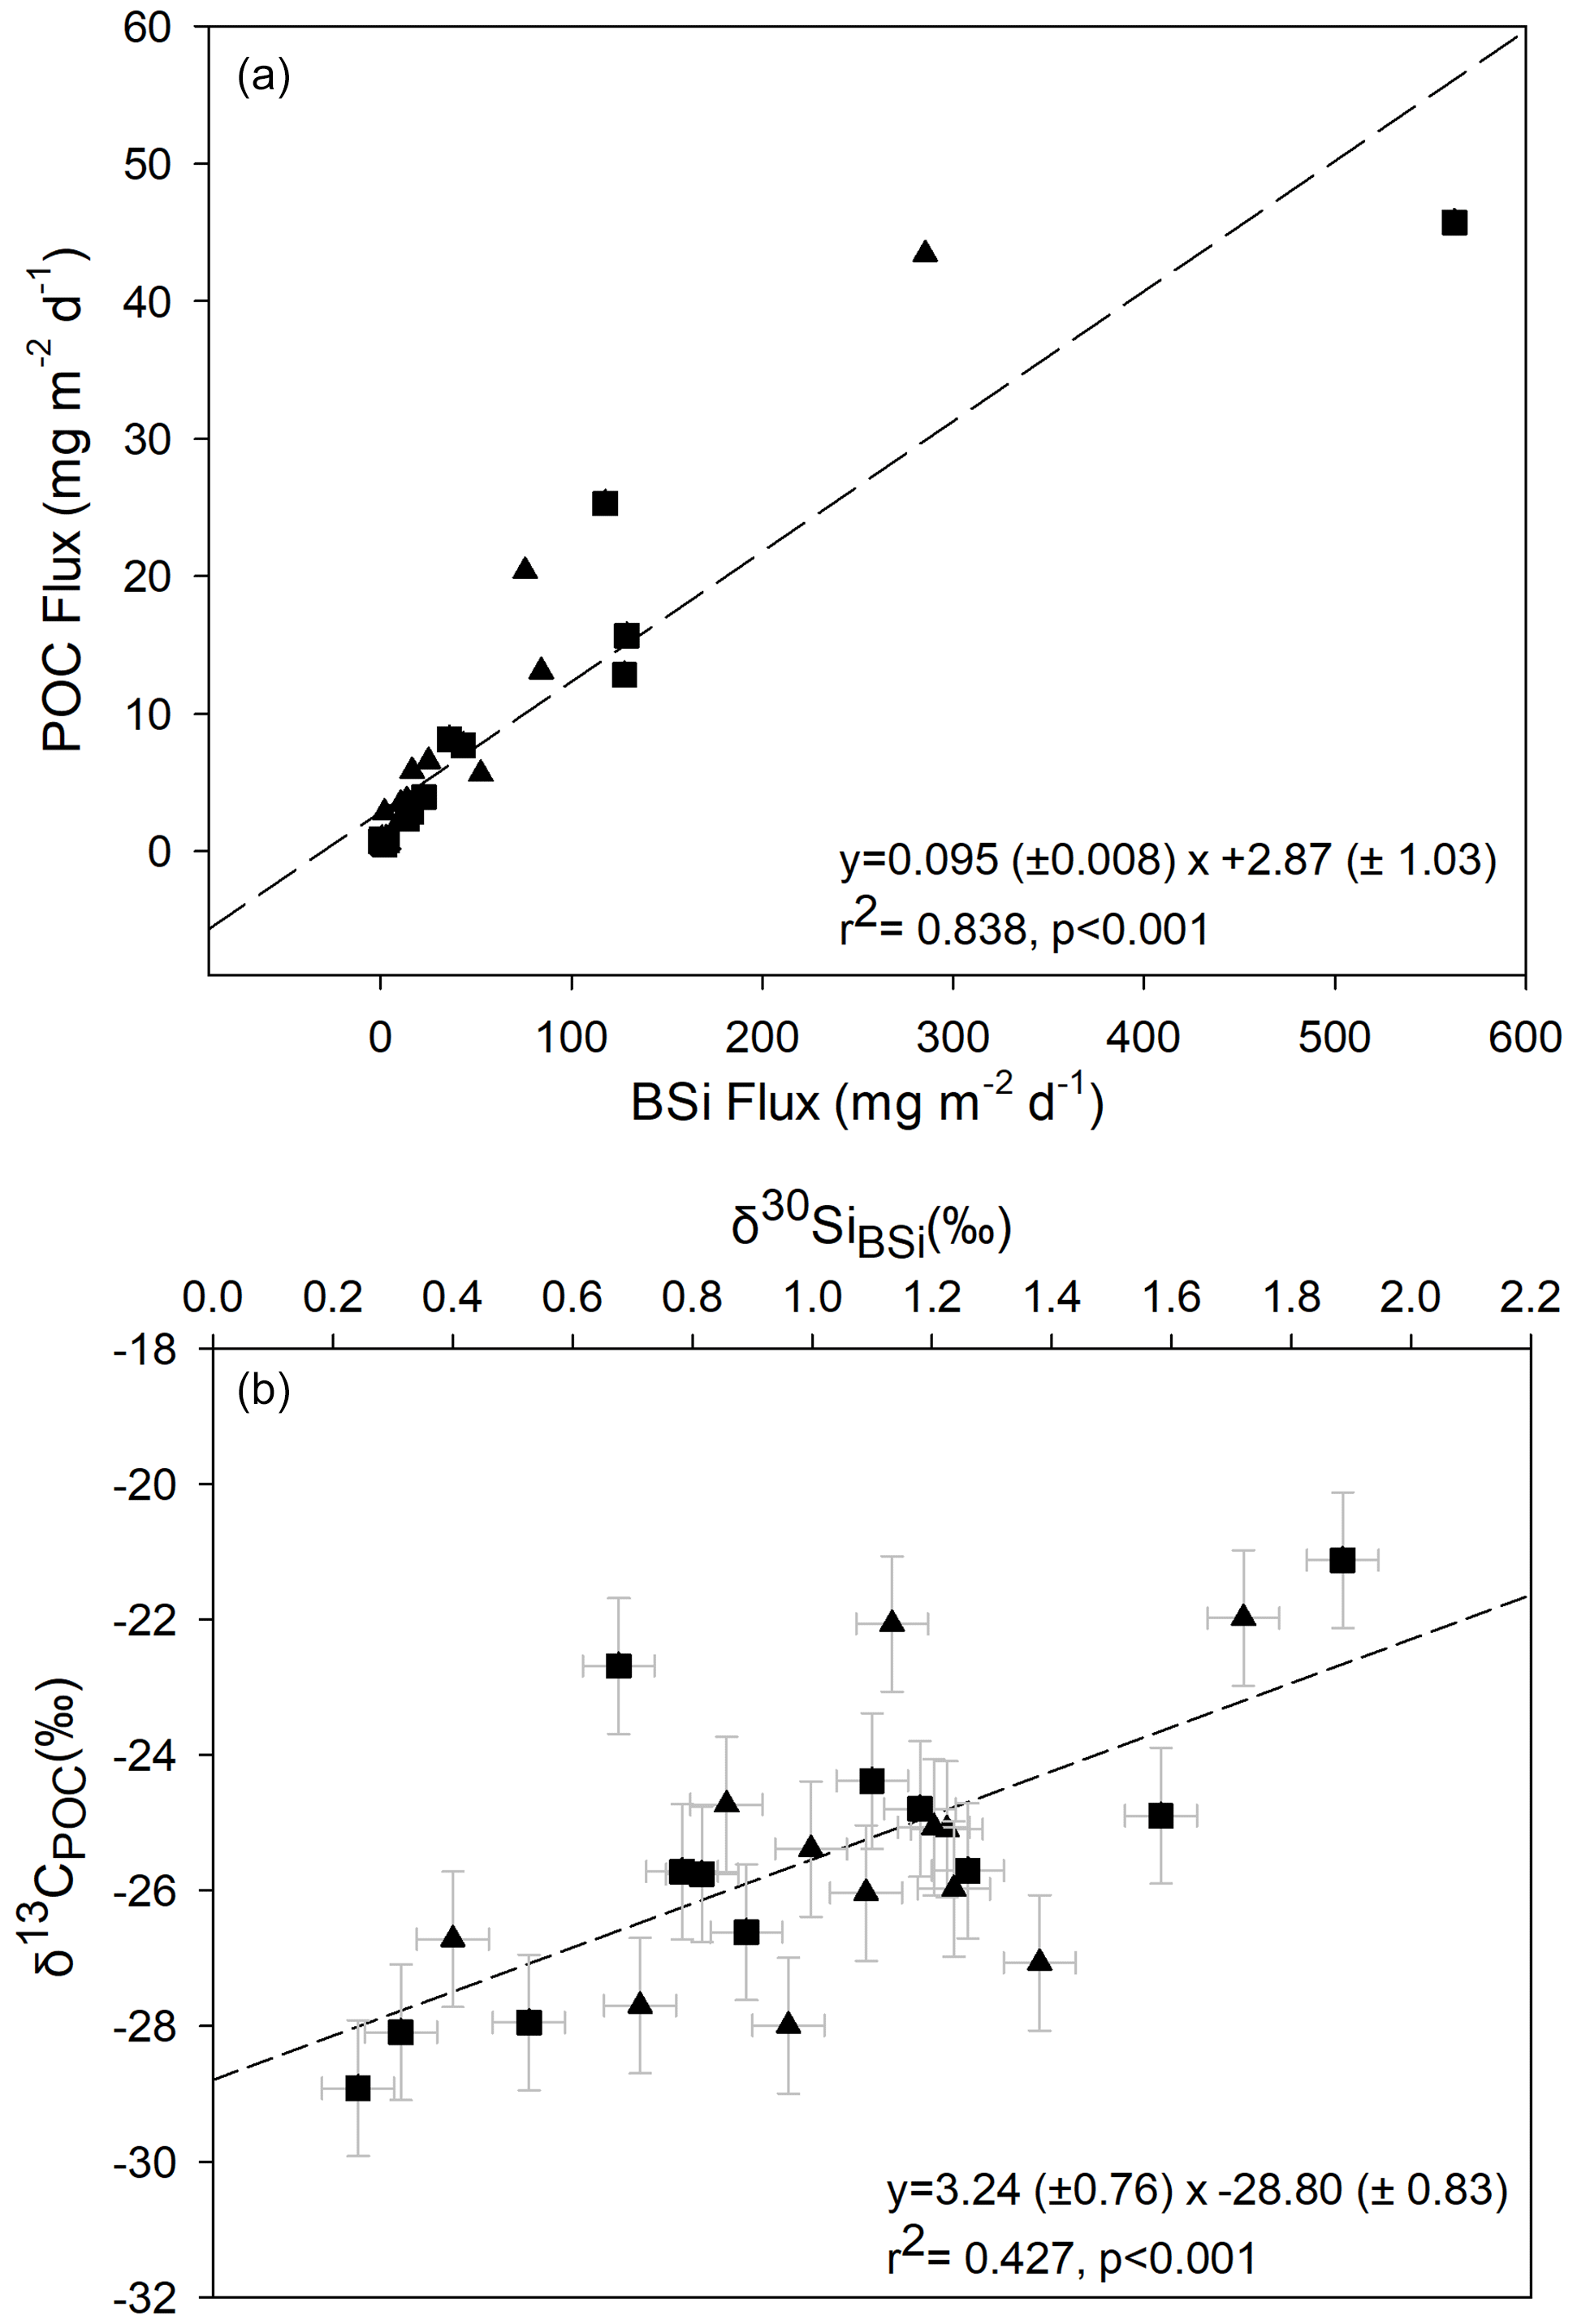
Figure 5Relationship between BSi and POC for data from both deep (triangles) and shallow (squares) sediment traps. (a) Regression between BSi and POC fluxes and (b) between δ13CPOC and δ30SiBSi. Regression lines are shown by dashed lines with coefficients and associated standard errors also shown. Error bars on isotope values represent the maximum error on sediment trap δ13CPOC (±1 ‰) associated with formaldehyde preservation (Mincks et al., 2008), and for δ30SiBSi, the scaled error bar represents 2 × SD (0.07 ‰) for the analytical sample replicates.
4.2.1 Productive period 1
During productive period 1, δ13CPOC is low, averaging −28.59 ‰ and −27.24 ‰ in shallow and deep traps respectively, close to that expected for Southern Ocean phytoplankton a employing typical C3 metabolism (i.e. diffusive CO2 transfer into the internal cell pool and Rubisco carboxylation) (Raven, 1997). This is consistent with the dominance of diatoms (Fragilariopsis spp.) in the trap material, as Bacillariophyceae are known to employ a C3 metabolism (Table IV in Raven, 1997). Preferential uptake of 28Si by diatoms (De La Rocha et al., 1997) during the late spring bloom of productive period 1 also explains the low δ30SiBSi values. BSi : POC ratios were elevated at the start of productive period 1, which may suggest that phytoplankton were heavily silicified. The contribution of non-siliceous phytoplankton was low during the periods analysed for phytoplankton composition (<2 %, with the exception of the shallow trap in the late January sample where the contribution was 6.7 %), though we cannot rule out higher contributions of non-siliceous phytoplankton during other periods which could account for the lower BSi : POC ratios at these times. After initial low values, we see a progressive increase in both δ13CPOC and δ30SiBSi, reflecting the progressive utilisation of both 12C and 28Si as nutrient pools are consumed during the bloom. As such, the diatom cells reaching the sediment trap in late spring and early summer were utilising increasingly isotopically enriched C and Si for growth, leading to progressive isotopic enrichment of the cells sinking into the sediment trap. This observation fits with elevated but decreasing surface chlorophyll concentrations from February to April 2018. Increasing δ13CPOC and δ30SiBSi into the late summer may also partially reflect preferential remineralisation of the more labile 12C and 28Si in particles as they sink through the upper 400 m of the water column. The lack of variation in δ13CPOC and δ30SiBSi between 400 and 2000 m in our study suggests that remineralisation may be limited between these depth or that there is no further fractionation effect. Whilst laboratory-based silica dissolution experiments are equivocal (Demarest et al., 2009; Wetzel et al., 2014), our findings agree with field studies that also indicate a lack of Si isotopic fractionation during diatom silica dissolution (Closset et al., 2015; Egan et al., 2012).
During productive period 1 there was no clear trend in δ15NPN, with values between −1.95 ‰ and +2.96 ‰. We speculate that this mixed signal resulted from a combination of surface phytoplankton using both ammonium and nitrate as the inorganic nitrogen source and variability in the sediment trap material composition. Enrichments of 2 ‰–4 ‰ occur between successive trophic levels, and egestion and excretion can have varying isotopic effects (see Sect. 4.3); thus the presence of faecal pellets, animal moults, and carcasses could alter the isotopic composition of the sediment trap material. Additionally, any supply of ammonium through remineralisation would be utilised quickly because ammonium is kinetically favourable to nitrate (Glibert et al., 2016), resulting in particles with a decreased δ15NPN compared to those produced by nitrate assimilation.
4.2.2 Winter hiatus
Between May and August, both δ13CPOC and δ30SiBSi showed little change, with a slight progressive decrease for δ13CPOC and an increase in δ30SiBSi. It is possible that the slight progressive trend towards a lighter carbon isotopic composition of sinking particles from −24.94 ‰ to −25.98 ‰ is driven by a mixture of older, isotopically heavier particles that have undergone partial remineralisation and the input of material of different isotopic composition from the small secondary peak in POC we observed in late April and early May. An input of smaller, more slowly sinking cells reaching the trap in increasing numbers following the initial late spring peak in production could drive the lower δ13CPOC at this time. Additionally, the pulse of material could be driven by a successive peak in production of a different phytoplankton community with a different isotopic signature. Korb et al. (2012) found an increasing presence of dinoflagellates from spring to summer as well as seasonal changes in the size structure of the phytoplankton community to the northwest of South Georgia, supporting either hypothesis. We do not have the species composition data from this time period to evidence this directly, but we suggest that the reduction in δ13CPOC does not relate to a mixing event and a resupply of 12C, due to the fact that δ30SiBSi continued to increase slowly. Given the generally lighter silicon isotopic composition of seawater below the photic zone, we would expect a mixing event to also result in a decline in seawater δ30Si and consequently δ30SiBSi. This would mean that our hypothesised shift in phytoplankton species composition in the traps (May–August) did not impact Si fractionation to the same extent as carbon isotopes. Whereas size, growth rates, cell geometry, and different carbon acquisition mechanisms have all been highlighted as impacting the δ13CPOC of marine plankton (Popp et al., 1999, 1998; Bidigare et al., 1999; Trull and Armand, 2001; Tuerena et al., 2019), species-dependent Si fractionation by polar and subpolar diatoms has only been observed in the laboratory, not in the field (Annett et al., 2017; Cassarino et al., 2017; Sutton et al., 2013). δ15NPN in the shallow trap showed a slight progressive decrease from April to July, before increasing in August to 5.42 ‰. The progressive decrease is consistent with the propagation of the surface signal of phytoplankton growth and fractionation, with a longer time lag than during spring and summer due to slower sinking rates during the low-productivity period. Decreasing δ15NPN reflects the increasing influence of ammonium uptake, either in the same locale or upstream in the regional circulation system, which leads to lower δ15NPN than nitrate uptake in the slowly sinking flux. The large range in δ15NPN in the deep trap in July makes it difficult to determine with certainty a trend in δ15NPN in the deep trap between July and October. Dissimilar trends in δ15NPN between the two traps over the winter period also support the argument that material reaching these two traps may have a different source region or time period in surface waters (Sect. 4.1).
4.2.3 Productive period 2
At the start of productive period 2 (September) we saw a significant decrease in δ30SiBSi (∼0.5 ‰) in both traps suggesting resupply of 28Si-enriched silicic acid to the euphotic zone via mixing. Interestingly, we did not see the same consistent shift in carbon isotopes; we measured a ∼1 ‰ decrease in the shallow trap δ13CPOC and a ∼1 ‰ increase in the deep trap δ13CPOC. We speculate that this mixing could bring waters of increased silicic acid concentrations to the surface, promoting the full expression of the isotope fractionation effect from phytoplankton uptake and thus lower δ30SiBSi in sinking particles. To match our observations, these mixed waters would need to be similar in dissolved inorganic carbon concentrations and δ13C, which could relate to the depth of mixing and differences in the depth at which POC and BSi are remineralised (Friedrich and Rutgers van der Loeff, 2002; Weir et al., 2020). We note that current velocities recorded at this time were elevated (Fig. S1), particularly in the deep trap, suggesting a shift in the surrounding velocity fields, which may have resulted in biased sample collection at this time through either over- or under-collection (Buesseler et al., 2007). Whereas δ13CPOC progressively increased during productive period 2, from −25.88 ‰ in September to −21.56 ‰ at the end of December (mean of deep and shallow traps), δ30SiBSi continued to decrease until November before showing a sudden increase from +0.74 ‰ to +1.80 ‰ at the end of the sampling period. This may suggest that DSi or co-limiting nutrients were replete, and uptake could occur unhindered until November 2018 when very high rates of production and the associated high fluxes of BSi increased the demand for DSi and led to the enrichment of δ30Si in overlying waters and subsequently sinking siliceous phytoplankton. For carbon, uptake was sufficient from September to progressively deplete source waters in 12C, driving an increase in δ13C in surface waters and newly formed phytoplankton cells. BSi : POC ratios increased from September to December, suggesting that material reaching the traps was increasingly silicified.
Interestingly, unlike C and Si isotopes, we saw a divergence in the nitrogen isotopic composition of deep and shallow traps between August and December. The sharp increase in mean δ15NPN from +1.32 ‰ in July to +5.42 ‰ in August 2018 in the shallow trap that initiated the divergence strongly suggests an advective change in source material. As noted above, this was a period of increased horizontal velocities and may have facilitated material reaching the two traps from different sources of differing initial composition and degradation states. The substantially lower δ15NPN in the deep trap from August to November compared to that of the shallow trap is surprising. It would be expected, that, as particles sink and are progressively decomposed this would remove dissolved nitrogen depleted in 15N, thus increasing δ15NPN in the particles. Indeed many studies have observed this trend of increasing δ15N with depth in suspended particles (Altabet et al., 1991, and references therein). However, like Altabet et al. (1991), we observe lower δ15NPN in sinking particles in the deep sediment trap. This has also been observed previously in Antarctic waters (Wada et al., 1987). Though the reason for this is not well understood (Sigman and Fripiat, 2019), it appears to be a consistent phenomenon. Particles in our deep trap must therefore be gaining light nitrogen or losing heavy nitrogen and could reflect a different source composition. In agreement with Altabet et al. (1991), we suggest that lateral transport of low δ15NPN from a region of increased ammonium-based production could explain this, highlighting a difference in the source of sinking particles to the two traps. Altabet et al. (1991) also suggests that, since protein nitrogen is 3 ‰ higher than bulk nitrogen, the selective decomposition of protein could explain the decrease in δ15N with depth, though why this would not be the case also for suspended PN is unclear. We observe the greatest divergence in shallow and deep N isotope compositions during periods of low PN flux (Fig. 3), consistent with the observations of Altabet et al. (1991), enabling a low flux of laterally supplied material to have an amplified impact on the isotope signal. In support of this, in December when particle fluxes increase sharply with the spring bloom, δ15NPN in the deep trap increases more in line with that of the shallow trap, highlighting a switch from source material being dominated by lateral supply when vertical supply is negligible to the dominance of vertical supply from surface production following the phytoplankton bloom.
4.3 Drivers of shifting isotopic ratios
The mean flux-weighted isotopic composition measured during productive periods 1 (January to the start of April 2018) and 2 (September to the end of December 2018) suggests that the processes driving the flux of material at these times differ (Fig. 3, Table 1). The divergence in the δ15NPN of deep and shallow trap material during period 2 limits our ability to compare the temporal shifts in mean isotopic ratios for nitrogen isotopes, so we focus here on δ13CPOC and δ30SiBSi. Since our record does not extend beyond December 2018 and we do not capture the first 3 weeks of January 2018 when fluxes were likely high, we do not record the initial value at this time; however, we would expect δ13CPOC to be even more negative at this time. We cannot determine if δ13CPOC and δ30SiBSi would return to values akin to that in period 1 in the following late-spring–summer season (January 2019). We saw a shift in δ13CPOC from a mean of −28.31 ‰ in January 2018 at the time of our first measurements to −25.88 ‰ in September at the start of period 2. This coincided with a change in community structure, with abundance dominated by Fragilariopsis spp. in period 1 to a more mixed community in period 2. Of the abundant phytoplankton species (>5 %, Fig. 4a, c), we find statistically significant linear relationships between δ13CPOC and percent abundance for Fragilariopsis spp. (empty: R2=0.926, p<0.001), Thalassionema nitzschioides (live: R2=0.774, p=0.004; empty: R2=0.844, p=0.001), and Chaetoceros spp. (resting spore) (R2=0.732, p=0.007). We stress this is based on only eight samples. Nevertheless, these robust samples show that there was a shift in phytoplankton community structure. Though Fragilariopsis spp. were mainly empty cells, colonisation by bacteria (Grossart et al., 2003; Kiørboe et al., 2003) may facilitate carbon transfer within and on these cells, and certainly the live cells of T. nitzschioides and resting spores of Chaetoceros spp. would act as agents of carbon transfer (Agusti et al., 2015; Salter et al., 2012; Rembauville et al., 2016).
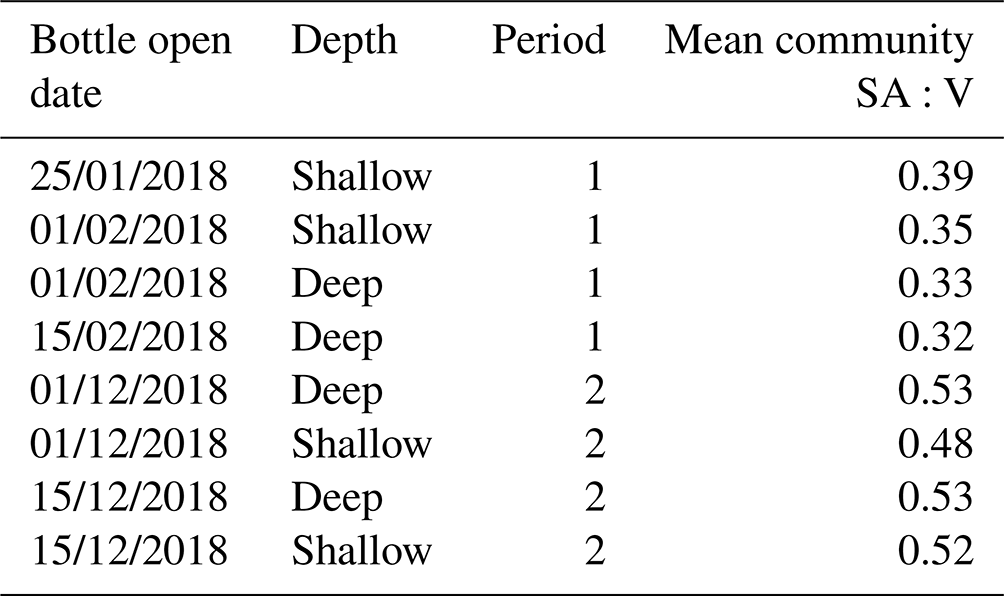
We examine whether this shift in phytoplankton community composition is associated with a change in SA:V (Table 2) since greater fractionation of carbon in smaller phytoplankton cells with higher SA:V is well observed in the literature (e.g. Popp et al., 1998; Tuerena et al., 2019). There was a statistically significant (paired t test, p=0.008) difference in the community SA:V between productive periods, increasing from 0.35 µm2 µm−3 in period 1 to 0.51 µm2 µm−3 in period 2. However, this would result in increased isotopic fractionation during period 2, which is the opposite to what we observed. We note here, that as only intact cells were counted, the measured SA:V ratios may not fully account for the isotopic composition of the trap material due to the presence of fragmented material. It is possible that there was a change in the mechanism of carbon uptake with the more mixed phytoplankton community in period 2 using HCO instead of CO2 or employing carbon concentrating mechanisms (CCMs), both of which would result in higher δ13CPOC than the diffusive uptake of CO2 and Rubisco carboxylation (Raven, 1997; Cassar et al., 2004). Studies show that there is much diversity amongst diatoms in the use of CCMs, and many are able to take up both CO2 and HCO (Trimborn et al., 2009; Roberts et al., 2007; Shen et al., 2017; Young et al., 2016). We suggest that species-driven differences in carbon uptake mechanisms account in part for the differing δ13CPOC that we observed during the two main productive periods.
Table 2Phytoplankton cell community surface area to volume (SA:V) ratios measured in deep and shallow sediment traps for samples enumerated in both productive periods 1 and 2.
We also observed a shift in the mean flux-weighted δ30SiBSi ratios (Table 1) between period 1 and period 2. With the exception of one culture study (Sutton et al., 2013), systematic species-driven shifts in δ30SiBSi fractionation have not been observed (e.g. De La Rocha et al., 1997), suggesting that there may be an additional driver of the changing isotopic ratios. Since, prior to our first measurements there had been a long-lasting phytoplankton bloom (Fig. S2), we would expect production to have utilised much of the light 28Si, resulting in particles with enriched δ30SiBSi reaching the trap in January 2018. However, we observe isotopically light mean values of +0.48 ‰ at the start of sampling at the end of January, suggesting that there must have been a resupply of 28Si. Physical mixing, bringing deep and benthic waters rich in nutrients, including iron, to the surface waters around South Georgia, is known to support the large blooms occurring downstream of South Georgia (Matano et al., 2020; Nielsdóttir et al., 2012) and could supply both 12C-enriched dissolved inorganic carbon and 28Si-enriched silicic acid. Additional nutrients could also be supplied to our study region by glacial discharge associated with isotopically light silicon isotopic signatures (Matano et al., 2020; Hatton et al., 2019) or benthic fluxes from shelf sediments, likely also releasing isotopically light DSi (Ng et al., 2020; Cassarino et al., 2020; Closset et al., 2022). Therefore, we suggest that low values (increased fractionation) of δ13CPOC and δ30SiBSi during period 1 relate to increased nutrient availability enabling the full expression of the isotopic fractionation and thus enabling isotopically light particulate material to reach the sediment trap.
The ocean circulation in our study region is complex and variable on fine spatial and temporal scales, affecting horizontal and vertical velocities (e.g. Boehme et al., 2008). It is clear from the currents measured at the depths of our two traps (Fig. S1), that both the direction and magnitude of the flow can vary within and between seasons and are not necessarily consistent between the two depths. There are thus potentially different source regions for material in the two traps at certain times of the year as suggested for example by δ15NPN ratios in winter. We lack the full depth resolution of vertical and horizontal velocity fields and information on sinking rates to confirm this, but previous studies have highlighted variability in the locations of the Southern Antarctic Circumpolar Current Front and the Polar Front, as well as eddies generated from these fronts, in our study region (Moore et al., 1999; Boehme et al., 2008; Whitehouse et al., 1996). We suggest that variability in ocean current velocities could explain different isotopic ratios in periods 1 and 2, through the supply of material to the traps from different source regions with differing nutrient and remineralisation regimes. Different source waters would impact nutrient availability including iron supply, uptake, and recycling (Hawco et al., 2021; Ellwood et al., 2020), which in turn influences species composition, nutrient utilisation, and uptake rates (e.g. Meyerink et al., 2019). This highlights the importance of making synchronous and full-depth resolution measurements of physical processes, such as current strength and direction, to be able to distinguish between spatial and temporal drivers of shifts in species composition, particle flux, and isotopic composition.
Since trophic transfer is known to impact both carbon and nitrogen isotope compositions of organic matter, the presence of moults and faecal pellets in trap samples is also important to consider. An incubation study focussed on Euphausia superba found that the δ15N of the E. superba faecal pellets was always lower than that of the copepods they ingested, though still higher than that of POM (Schmidt et al., 2003). Additionally, Tamelander et al. (2006) measured faecal pellets produced by copepods with depleted 15N compared to the algal food source. Though a few studies on temperate and subtropical copepods showed that the faecal material had similar or slightly higher δ15N than the food source (Altabet and Small, 1990; Checkley and Entzeroth, 1985), there is no consistent fractionation effect of egestion for either δ15N or δ13C, which may relate to compositional differences (protein, carbohydrate, lipid) and their isotopic values (Tamelander et al., 2006). We are therefore not able to determine the impact of faecal pellets or moults on the isotopic composition of our samples. As phytoplankton material dominated at the times of peak flux, we suggest that the importance of faecal pellets and moults may be greater during periods of lower flux; however, we cannot rule out their contribution during the bloom periods. We suggest that it would be highly informative to conduct particle-specific isotope analysis of common particle types in sediment traps, such as faecal pellets, phytoplankton detritus, and zooplankton moults, to improve our ability to determine the impact of particle flux composition on bulk isotope compositions.
The seasonal cycles in primary productivity and nutrient uptake in surface waters at our study site in the Scotia Sea are reflected in the fluxes and isotopic ratios of sinking particulate material. We find that most remineralisation occurs in the upper 400 m of the water column, and below this the magnitude of the flux of sinking material is relatively consistent, supported by consistency in POC:PON ratios. We find that particulate fluxes of C and BSi are tightly coupled, which highlights the importance of siliceous material in the transfer of POC to depth. We suggest that a change in phytoplankton community structure can at least partly explain the shifts in carbon isotopic composition between the two productive periods measured here. Though complex, seasonal patterns in isotopic composition of particulate material reaching the sediment traps do reflect the degree and type of nutrient utilisation in the source surface waters. Our data also suggest an importance of laterally supplied material to the sediment traps and supports seasonal differences in source regions. Our results highlight the need for more detailed mechanistic understanding of the drivers of POC flux and biogeochemical cycling to improve estimates of the current and future strength of the biological carbon pump and the ocean's role as a CO2 sink.
Data are housed with the British Antarctic Survey Polar Data Centre. Phytoplankton abundances and biovolume as well as mean flux and isotopic ratios are available under https://doi.org/10.5285/6A5A80F9-4C30-4AD6-A5BE-CCBA53F8A464 (Belcher et al., 2023a) and https://doi.org/10.5285/32629396-BAFC-40BD-AB6F-3DEA5F3E51C1 (Belcher et al., 2023b).
The supplement related to this article is available online at: https://doi.org/10.5194/bg-20-3573-2023-supplement.
AB and CM conceived the study and participated in fieldwork to collect samples. AB conducted laboratory analysis with support from TW, LF, and UD for isotope analysis. MW conducted phytoplankton analysis and provided intellectual input on phytoplankton community composition. SFH and KH provided support for isotopic analysis and contributed to the interpretation of the data and implications. CC supported uncertainty analysis. All authors contributed text to the paper.
The contact author has declared that none of the authors has any competing interests.
Publisher’s note: Copernicus Publications remains neutral with regard to jurisdictional claims in published maps and institutional affiliations.
We are very grateful to the scientists and crew aboard research cruises JR17002 and DY098 for their efforts to deploy and recover the P3 mooring. We thank staff at the Bristol Isotope Group for running and maintenance of the mass spectrometer facilities at the University of Bristol, as well as Colin Chilcott for technical support for C and N analysis at the University of Edinburgh. We thank Sally Thorpe and Emma Young for insights into the physical oceanographic conditions of the region. Finally, a special thanks to Flo Atherden for her dedicated work picking out swimmers from the shallow sediment trap.
This research has been supported by the British Antarctic Survey (grant no. NC-ALI funding) and the Natural Environment Research Council (grant nos. NE/K010034/1 and MR/T020962/1). Ursula Dallman was supported by the UK NERC through grant NE/P006108/1. Lisa Friberg was supported by a NERC GW4C DTP 85 studentship and Tong Wang by a CSC-UoB Joint Scholarship.
This paper was edited by Sebastian Naeher and reviewed by Patricia Grasse and one anonymous referee.
Agusti, S., González-Gordillo, J. I., Vaqué, D., Estrada, M., Cerezo, M. I., Salazar, G., Gasol, J. M., and Duarte, C. M.: Ubiquitous healthy diatoms in the deep sea confirm deep carbon injection by the biological pump, Nat. Commun., 6, 1–8, https://doi.org/10.1038/ncomms8608, 2015.
Altabet, M. A. and Small, L. F.: Nitrogen isotopic ratios in fecal pellets produced by marine Zooplankton, Geochim. Cosmochim. Ac., 54, 155–163, https://doi.org/10.1016/0016-7037(90)90203-W, 1990.
Altabet, M. A., Deuser, W. G., Honjo, S., and Stienen, C.: Seasonal and depth-related changes in the source of sinking particles in the North Atlantic, Nature, 354, 136–139, https://doi.org/10.1038/354136a0, 1991.
Annett, A. L., Henley, S. F., Venables, H. J., Meredith, M. P., Clarke, A., and Ganeshram, R. S.: Silica cycling and isotopic composition in northern Marguerite Bay on the rapidly-warming western Antarctic Peninsula, Deep. Res. Pt. II, 139, 132–142, https://doi.org/10.1016/j.dsr2.2016.09.006, 2017.
Armstrong, R. A., Lee, C., Hedges, J. I., Honjo, S., and Wakeham, S. G.: A new, mechanistic model for organic carbon fluxes in the ocean based on the quantitative association of POC with ballast minerals, Deep. Res. Pt. II, 49, 219–236, https://doi.org/10.1016/S0967-0645(01)00101-1, 2001.
Baumann, M., Paul, A. J., Taucher, J., Bach, L. T., Goldenberg, S., Stange, P., Minutolo, F., and Riebesell, U.: Drivers of Particle Sinking Velocities in the Peruvian Upwelling System, EGUsphere [preprint], https://doi.org/10.5194/egusphere-2022-814, 2022.
Belcher, A., Manno, C., Ward, P., Henson, S. A., Sanders, R., and Tarling, G. A.: Copepod faecal pellet transfer through the meso- and bathypelagic layers in the Southern Ocean in spring, Biogeosciences, 14, 1511–1525, https://doi.org/10.5194/bg-14-1511-2017, 2017.
Belcher, A., Manno, C., Thorpe, S., and Tarling, G.: Acantharian cysts: high flux occurrence in the bathypelagic zone of the Scotia Sea, Southern Ocean, Mar. Biol., 165, 117, https://doi.org/10.1007/s00227-018-3376-1, 2018.
Belcher, A., Wootton, M., and Manno, C.: Sediment trap plankton community composition from the Scotia Sea in 2018 (Version 1.0), [data set], NERC EDS UK Polar Data Centre, https://doi.org/10.5285/6A5A80F9-4C30-4AD6-A5BE-CCBA53F8A464, 2023a.
Belcher, A., Henley, S. F., Hendry, K. R., Friberg, L., Dallman, U., Wang, T., and Manno, C.: Sediment trap fluxes and stable isotopes of particulate carbon, nitrogen and biogenic silica from the Scotia Sea in 2018 (Version 1.0), [data set], NERC EDS UK Polar Data Centre, https://doi.org/10.5285/32629396-BAFC-40BD-AB6F-3DEA5F3E51C1, 2023b.
Bidigare, R., Hanson, L., Buesseler, K. O., Wakeham, G., Freeman, H., Pancost, R. D., Millero, J., Steinberg, P., Popp, N., Latasa, M., Landry, R., and Laws, A.: Iron-stimulated changes in 13C fractionation and export by equatorial Pacific phytoplankton: Toward a paleogrowth rate proxy, Paleoceanography, 14, 589–595, https://doi.org/10.1029/1999PA900026, 1999.
Boehme, L., Meredith, M. P., Thorpe, S. E., Biuw, M., and Fedak, M.: Antarctic circumpolar current frontal system in the South Atlantic: Monitoring using merged Argo and animal-borne sensor data, J. Geophys. Res., 113, C09012, https://doi.org/10.1029/2007JC004647, 2008.
Brandenburg, K. M., Rost, B., Van de Waal, D. B., Hoins, M., and Sluijs, A.: Physiological control on carbon isotope fractionation in marine phytoplankton, Biogeosciences, 19, 3305–3315, https://doi.org/10.5194/bg-19-3305-2022, 2022.
Buesseler, K. O., Antia, A. N., Chen, M., Fowler, S. W., Gardner, W. D., Gustafsson, O., Harada, K., Michaels, A. F., Rutgers van der Loeff, M., Sarin, M., Steinberg, D. K., and Trull, T.: An assessment of the use of sediment traps for estimating upper ocean particle fluxes, J. Mar. Res., 65, 345–416, https://doi.org/10.1357/002224007781567621, 2007.
Cardinal, D., Alleman, L. Y., De Jong, J., Ziegler, K., and Andre, L.: Isotopic composition of silicon measured by multicollector plasma source mass spectrometry in dry plasma mode, J. Anal. At. Spectrom., 18, 213–218, https://doi.org/10.1039/b210109b, 2003.
Cassar, N., Laws, E. A., Bidigare, R. R., and Popp, B. N.: Bicarbonate uptake by Southern Ocean phytoplankton, Global Biogeochem. Cy., 18, 1–10, https://doi.org/10.1029/2003GB002116, 2004.
Cassarino, L., Hendry, K. R., Meredith, M. P., Venables, H. J., and De La Rocha, C. L.: Silicon isotope and silicic acid uptake in surface waters of Marguerite Bay, West Antarctic Peninsula, Deep. Res. Pt. II, 139, 143–150, https://doi.org/10.1016/j.dsr2.2016.11.002, 2017.
Cassarino, L., Hendry, K., Henley, S. F., Macdonald, E., Arndt, S., Freitas, F. S., Pike, J., and Firing, Y. L.: Sedimentary Nutrient Supply in Productive Hot Spots off the West Antarctic Peninsula Revealed by Silicon Isotopes, Global Biogeochem. Cy., 34, https://doi.org/10.1029/2019GB006486, 2020.
Checkley, D. M. and Entzeroth, L. C.: Elemental and isotopic fractionation of carbon and nitrogen by marine, planktonic copepods and implications to the marine nitrogen cycle, J. Plankton Res., 7, 553–568, https://doi.org/10.1093/plankt/7.4.553, 1985.
Closset, I., Cardinal, D., Bray, S. G., Thil, F., Djouraev, I., Rigual-Hernández, A. S., and Trull, T. W.: Seasonal variations, origin, and fate of settling diatoms in the Southern Ocean tracked by silicon isotope records in deep sediment traps, Global Biogeochem. Cy., 29, 1495–1510, https://doi.org/10.1002/2015GB005180, 2015.
Closset, I., Brzezinski, M. A., Cardinal, D., Dapoigny, A., Jones, J. L., and Robinson, R.: A silicon isotopic perspective on the contribution of diagenesis to the sedimentary silicon budget in the Southern Ocean, Geochim. Cosmochim. Ac., 327, 298–313, 2022.
Conley, D. J.: An interlaboratory comparison for the measurement of biogenic silica in sediments, Mar. Chem., 63, 39–48, https://doi.org/10.1016/S0304-4203(98)00049-8, 1998.
Demarest, M. S., Brzezinski, M. A., and Beucher, C. P.: Fractionation of silicon isotopes during biogenic silica dissolution, Geochim. Cosmochim. Ac., 73, 5572–5583, https://doi.org/10.1016/j.gca.2009.06.019, 2009.
DeVries, T.: Atmospheric CO2 and Sea Surface Temperature Variability Cannot Explain Recent Decadal Variability of the Ocean CO2 Sink, Geophys. Res. Lett., 49, 1–17, https://doi.org/10.1029/2021GL096018, 2022.
Egan, K. E., Rickaby, R. E. M., Leng, M. J., Hendry, K. R., Hermoso, M., Sloane, H. J., Bostock, H., and Halliday, A. N.: Diatom silicon isotopes as a proxy for silicic acid utilisation: A Southern Ocean core top calibration, Geochim. Cosmochim. Ac., 96, 174–192, https://doi.org/10.1016/j.gca.2012.08.002, 2012.
Ellwood, M. J., Strzepek, R. F., Strutton, P. G., Trull, T. W., Fourquez, M., and Boyd, P. W.: Distinct iron cycling in a Southern Ocean eddy, Nat. Commun., 11, 1–8, https://doi.org/10.1038/s41467-020-14464-0, 2020.
Fischer, G., Gersonde, R., and Wefer, G.: Organic carbon, biogenic silica and diatom fluxes in the marginal winter sea-ice zone and in the Polar Front Region: Interannual variations and differences in composition, Deep. Res. Pt. II, 49, 1721–1745, https://doi.org/10.1016/S0967-0645(02)00009-7, 2002. Friedrich, J. and Rutgers van der Loeff, M. M.: A two-tracer (210Po-234Th) approach to distinguish organic carbon and biogenic silica export flux in the Antarctic Circumpolar Current, Deep. Res. Pt. I., 49, 101–120, https://doi.org/10.1016/S0967-0637(01)00045-0, 2002.
Georg, R. B., Reynolds, B. C., Frank, M., and Halliday, A. N.: New sample preparation techniques for the determination of Si isotopic compositions using MC-ICPMS, Chem. Geol., 235, 95–104, https://doi.org/10.1016/j.chemgeo.2006.06.006, 2006.
Giering, S. L. C., Cavan, E. L., Basedow, S. L., Briggs, N., Burd, A. B., Darroch, L. J., Guidi, L., Irisson, J. O., Iversen, M. H., Kiko, R., Lindsay, D., Marcolin, C. R., McDonnell, A. M. P., Möller, K. O., Passow, U., Thomalla, S., Trull, T. W., and Waite, A. M.: Sinking Organic Particles in the Ocean – Flux Estimates From in situ Optical Devices, Front. Mar. Sci., 6, 834, https://doi.org/10.3389/fmars.2019.00834, 2020.
Gleiber, M. R., Steinberg, D. K., and Ducklow, H. W.: Time series of vertical flux of zooplankton fecal pellets on the continental shelf of the western Antarctic Peninsula, Mar. Ecol. Prog. Ser., 471, 23–36, https://doi.org/10.3354/meps10021, 2012.
Glibert, P. M., Wilkerson, F. P., Dugdale, R. C., Raven, J. A., Dupont, C. L., Leavitt, P. R., Parker, A. E., Burkholder, J. M., and Kana, T. M.: Pluses and minuses of ammonium and nitrate uptake and assimilation by phytoplankton and implications for productivity and community composition, with emphasis on nitrogen-enriched conditions, Limnol. Oceanogr., 61, 165–197, https://doi.org/10.1002/lno.10203, 2016.
González, H. E., Daneri, G., Iriarte, J. L., Yannicelli, B., Menschel, E., Barría, C., Pantoja, S., and Lizárraga, L.: Carbon fluxes within the epipelagic zone of the Humboldt Current System off Chile: The significance of euphausiids and diatoms as key functional groups for the biological pump, Prog. Oceanogr., 83, 217–227, https://doi.org/10.1016/j.pocean.2009.07.036, 2009.
Grasse, P., Brzezinski, M. A., Cardinal, D., De Souza, G. F., Andersson, P., Closset, I., Cao, Z., Dai, M., Ehlert, C., Estrade, N., François, R., Frank, M., Jiang, G., Jones, J. L., Kooijman, E., Liu, Q., Lu, D., Pahnke, K., Ponzevera, E., Schmitt, M., Sun, X., Sutton, J. N., Thil, F., Weis, D., Wetzel, F., Zhang, A., Zhang, J., and Zhang, Z.: GEOTRACES inter-calibration of the stable silicon isotope composition of dissolved silicic acid in seawater, J. Anal. At. Spectrom., 32, 562–578, https://doi.org/10.1039/c6ja00302h, 2017.
Grasse, P., Haynert, K., Doering, K., Geilert, S., Jones, J. L., Brzezinski, M. A., and Frank, M.: Controls on the Silicon Isotope Composition of Diatoms in the Peruvian Upwelling, Front. Mar. Sci., 8, 1–15, https://doi.org/10.3389/fmars.2021.697400, 2021.
Grossart, H. P., Kiørboe, T., Tang, K., and Ploug, H.: Bacterial colonization of particles: Growth and interactions, Appl. Environ. Microbiol., 69, 3500–3509, https://doi.org/10.1128/AEM.69.6.3500-3509.2003, 2003.
Hansman, R. L. and Sessions, A. L.: Measuring the in situ carbon isotopic composition of distinct marine plankton populations sorted by flow cytometry, Limnol. Oceanogr.-Meth., 14, 87–99, https://doi.org/10.1002/lom3.10073, 2016.
Hasle, G. R. and Syvertsen, E. E.: Chapter 2 – Marine Diatoms, in: Identifying Marine Phytoplankton, edited by: Tomas, C. R., Academic Press, San Diego, 5–385, 1997.
Hatton, J. E., Hendry, K. R., Hawkings, J. R., Wadham, J. L., Opfergelt, S., Kohler, T. J., Yde, J. C., Stibal, M., and Žárský, J. D.: Silicon isotopes in Arctic and sub-Arctic glacial meltwaters: The role of subglacial weathering in the silicon cycle, Roy. Soc. A-Math. Phy., 475, 20190098, https://doi.org/10.1098/rspa.2019.0098, 2019.
Hawco, N. J., Barone, B., Church, M. J., Babcock-Adams, L., Repeta, D. J., Wear, E. K., Foreman, R. K., Björkman, K. M., Bent, S., Van Mooy, B. A. S., Sheyn, U., DeLong, E. F., Acker, M., Kelly, R. L., Nelson, A., Ranieri, J., Clemente, T. M., Karl, D. M., and John, S. G.: Iron Depletion in the Deep Chlorophyll Maximum: Mesoscale Eddies as Natural Iron Fertilization Experiments, Global Biogeochem. Cy., 35, 1–18, https://doi.org/10.1029/2021GB007112, 2021.
Hendry, K. R. and Brzezinski, M. A.: Using silicon isotopes to understand the role of the Southern Ocean in modern and ancient biogeochemistry and climate, Quat. Sci. Rev., 89, 13–26, https://doi.org/10.1016/j.quascirev.2014.01.019, 2014.
Hendry, K. R. and Robinson, L. F.: The relationship between silicon isotope fractionation in sponges and silicic acid concentration: Modern and core-top studies of biogenic opal, Geochim. Cosmochim. Ac., 81, 1–12, https://doi.org/10.1016/j.gca.2011.12.010, 2012.
Henley, S. F., Annett, A. L., Ganeshram, R. S., Carson, D. S., Weston, K., Crosta, X., Tait, A., Dougans, J., Fallick, A. E., and Clarke, A.: Factors influencing the stable carbon isotopic composition of suspended and sinking organic matter in the coastal Antarctic sea ice environment, Biogeosciences, 9, 1137–1157, https://doi.org/10.5194/bg-9-1137-2012, 2012.
Hillebrand, H., Dürselen, C. D., Kirschtel, D., Pollingher, U., and Zohary, T.: Biovolume calculation for pelagic and benthic microalgae, J. Phycol., 35, 403–424, https://doi.org/10.1046/j.1529-8817.1999.3520403.x, 1999.
Honjo, S., Francois, R., Manganini, S., Dymond, J., and Collier, R.: Particle fluxes to the interior of the Southern Ocean in the Western Pacific sector along 170∘ W, Deep. Res. Pt. II, 47, 3521–3548, https://doi.org/10.1016/S0967-0645(00)00077-1, 2000.
Iversen, M. H., Pakhomov, E. A., Hunt, B. P. V, Jagt, H. Van Der, Wolf-gladrow, D., and Klaas, C.: Sinkers or floaters? Contribution from salp pellets to the export flux during a large bloom event in the Southern Ocean, Deep Sea Res. Pt. II, 138, 116–125, https://doi.org/10.1016/j.dsr2.2016.12.004, 2017.
Kiørboe, T., Tang, K., Grossart, H. P., and Ploug, H.: Dynamics of microbial communities on marine snow aggregates: Colonization, growth, detachment, and grazing mortality of attached bacteria, Appl. Environ. Microbiol., 69, 3036–3047, https://doi.org/10.1128/AEM.69.6.3036-3047.2003, 2003.
Korb, R. E., Whitehouse, M. J., Atkinson, A., and Thorpe, S.: Magnitude and maintenance of the phytoplankton bloom at South Georgia: a naturally iron-replete environment, Mar. Ecol. Prog. Ser., 368, 75–91, https://doi.org/10.3354/meps07525, 2008.
Korb, R. E., Whitehouse, M. J., Ward, P., Gordon, M., Venables, H. J., and Poulton, A. J.: Regional and seasonal differences in microplankton biomass, productivity, and structure across the Scotia Sea: Implications for the export of biogenic carbon, Deep Sea Res. Pt. II, 59, 67–77, https://doi.org/10.1016/j.dsr2.2011.06.006, 2012.
Kwon, E., Primeau, F., and Sarmiento, J.: The impact of remineralization depth on the air-sea carbon balance, Nat. Geosci., 2, 630–635, 2009.
De La Rocha, C. L., Brzezinski, M. A., and DeNiro, M. J.: Fractionation of silicon isotopes by marine diatoms during biogenic silica formation, Geochim. Cosmochim. Ac., 61, 5051–5056, https://doi.org/10.1016/S0016-7037(97)00300-1, 1997.
Manno, C., Stowasser, G., Enderlein, P., Fielding, S., and Tarling, G. A.: The contribution of zooplankton faecal pellets to deep-carbon transport in the Scotia Sea (Southern Ocean), Biogeosciences, 12, 1955–1965, https://doi.org/10.5194/bg-12-1955-2015, 2015.
Manno, C., Fielding, S., Stowasser, G., Murphy, E. J., and Thorpe, S. E.: Continuous moulting by Antarctic krill drives major, Nat. Commun., 16, 6051, https://doi.org/10.1038/s41467-020-19956-7, 2020.
Matano, R. P., Combes, V., Young, E. F., and Meredith, M. P.: Modeling the Impact of Ocean Circulation on Chlorophyll Blooms Around South Georgia, Southern Ocean, J. Geophys. Res.-Ocean., 125, 1–18, https://doi.org/10.1029/2020JC016391, 2020.
Medlin, L. K. and Priddle, J.: Polar marine diatoms, British Antarctic Survey, Cambridge, UK, 214 pp., 1990.
Meyerink, S. W., Boyd, P. W., Maher, W. A., Milne, A., Strzepek, R., and Ellwood, M. J.: Putting the silicon cycle in a bag: Field and mesocosm observations of silicon isotope fractionation in subtropical waters east of New Zealand, Mar. Chem., 213, 1–12, https://doi.org/10.1016/j.marchem.2019.04.008, 2019.
Michener, R. and Lajtha, K.: Stable Isotopes in Ecology and Environmental Science: Second Edition, 1–566, https://doi.org/10.1002/9780470691854, 2008.
Minagawa, M. and Wada, E.: Stepwise enrichment of 15N along food chains: Further evidence and the relation between ä15N and animal age, Geochim. Cosmochim. Ac., 48, 1135–1140, https://doi.org/10.1016/0016-7037(84)90204-7, 1984.
Mincks, S. L., Smith, C. R., Jeffreys, R. M., and Sumida, P. Y. G.: Trophic structure on the West Antarctic Peninsula shelf: Detritivory and benthic inertia revealed by δ13C and δ15N analysis, Deep. Res. Pt. II, 55, 2502–2514, https://doi.org/10.1016/j.dsr2.2008.06.009, 2008.
Montoya, J. P.: Natural abundance of δ15N in marine planktonic ecosystems, in: Stable Isotopes in Ecology and Environmental Science: Second Edition, edited by: Michener, R. and Lajtha, K., Blackwell Publishing, 1–566, https://doi.org/10.1002/9780470691854, 2007.
Moore, J. K., Abbott, M. R., and Richman, J. G.: Location and dynamics of the Antarctic Polar Front from satellite sea surface temperature data, J. Geophys. Res.-Oceans, 104, 3059–3073, https://doi.org/10.1029/1998JC900032, 1999.
Ng, H. C., Cassarino, L., Pickering, R. A., Woodward, E. M. S., Hammond, S. J., and Hendry, K. R.: Sediment efflux of silicon on the Greenland margin and implications for the marine silicon cycle, Earth Planet. Sci. Lett., 529, 115877, https://doi.org/10.1016/j.epsl.2019.115877, 2020.
Nielsdóttir, M. C., Bibby, T. S., Moore, C. M., Hinz, D. J., Sanders, R., Whitehouse, M., Korb, R., and Achterberg, E. P.: Seasonal and spatial dynamics of iron availability in the Scotia Sea, Mar. Chem., 130, 62–72, https://doi.org/10.1016/j.marchem.2011.12.004, 2012.
Opfergelt, S. and Delmelle, P.: Silicon isotopes and continental weathering processes: Assessing controls on Si transfer to the ocean, Compt. Rend. Geosci., 344, 723–738, https://doi.org/10.1016/j.crte.2012.09.006, 2012.
Orsi, H., Whitworth III, T., and Nowlin Jr, W. D.: On the meridional extent and fronts of the Antarctic Circumpolar Current, Deep Sea Res. Pt. I, 42, 641–673, https://doi.org/10.1016/0967-0637(95)00021-W, 1995.
Passow, U. and De La Rocha, C. L.: Accumulation of mineral ballast on organic aggregates, Global Biogeochem. Cy., 20, 1–7, https://doi.org/10.1029/2005GB002579, 2006.
Pauli, N.-C., Flintrop, C. M., Konrad, C., Pakhomov, E. A., Swoboda, S., Koch, F., Wang, X.-L., Zhang, J.-C., Brierley, A. S., Bernasconi, M., Meyer, B., and Iversen, M. H.: Krill and salp faecal pellets contribute equally to the carbon flux at the Antarctic Peninsula, Nat. Commun., 12, 7168, https://doi.org/10.1038/s41467-021-27436-9, 2021.
Ploug, H., Iversen, M. H., and Fischer, G.: Ballast, sinking velocity, and apparent diffusivity within marine snow and zooplankton fecal pellets: Implications for substrate turnover by attached bacteria, Limnol. Oceanogr., 53, 1878–1886, 2008.
Popp, B. N., Laws, E. A., Bidigare, R. R., Dore, J. E., Hanson, K. L., and Wakeham, S. G.: Effect of phytoplankton cell geometry on carbon isotopic fractionation, Geochim. Cosmochim. Ac., 62, 69–77, https://doi.org/10.1016/S0016-7037(97)00333-5, 1998.
Popp, B. N., Trull, T., Kenig, F., Wakeham, S. G., Rust, T. M., Tilbrook, B., Griffiths, F. B., Wright, S. W., Marchant, H. J., Bidigare, R. R., and Laws, E. A.: Controls on the carbon isotopic composition of Southern Ocean phytoplankton, Global Biogeochem. Cy., 13, 827–843, https://doi.org/10.1029/1999GB900041, 1999.
Priddle, J. and Fryxell, G.: Handbook of the common plankton diatoms of the Southern Ocean: Centrales except the genus Thalassiosira, British Antarctic Survey, Cambridge, UK, 159 pp., 1985.
Rau, G. H., Froelich, P. N., Takahashi, T., and J., D. M. D.: Does sedimentary organic δ13C record variations in quaternary ocean [CO2(aq)], Paleoceanography, 6, 335–347, 1991.
Raven, J. A.: Inorganic Carbon Acquisition by Marine Autotrophs, Adv. Bot. Res., 27, 85–209, https://doi.org/10.1016/S0065-2296(08)60281-5, 1997.
Rembauville, M., Blain, S., Armand, L., Quéguiner, B., and Salter, I.: Export fluxes in a naturally iron-fertilized area of the Southern Ocean – Part 2: Importance of diatom resting spores and faecal pellets for export, Biogeosciences, 12, 3171–3195, https://doi.org/10.5194/bg-12-3171-2015, 2015.
Rembauville, M., Manno, C., Tarling, G. A., Blain, S., and Salter, I.: Strong contribution of diatom resting spores to deep-sea carbon transfer in naturally iron-fertilized waters downstream of South Georgia, Deep. Res. Pt. I, 115, 22–35, https://doi.org/10.1016/j.dsr.2016.05.002, 2016.
Reynolds, B. C., Aggarwal, J., André, L., Baxter, D., Beucher, C., Brzezinski, M. A., Engström, E., Georg, R. B., Land, M., Leng, M. J., Opfergelt, S., Rodushkin, I., Sloane, H. J., Van Den Boorn, S. H. J. M., Vroon, P. Z., and Cardinal, D.: An inter-laboratory comparison of Si isotope reference materials, J. Anal. At. Spec., 22, 561–568, https://doi.org/10.1039/b616755a, 2007.
Roberts, K., Granum, E., Leegood, R. C., and Raven, J. A.: Carbon acquisition by diatoms, Photosynth. Res., 93, 79–88, https://doi.org/10.1007/s11120-007-9172-2, 2007.
Roca-Marti, M., Puigcorbé, V., Iversen, M. H., Rutgers van der Loeff, M., Klaas, C., Cheah, W., Bracher, A., and Masqué, P.: High particulate organic carbon export during the decline of a vast diatom bloom in the Atlantic sector of the Southern Ocean, Deep Sea Res. Pt. II, 138, 102–115, https://doi.org/10.1016/j.dsr2.2015.12.007, 2017.
Salter, I., Kemp, A. E. S. S., Moore, C. M., Lampitt, R. S., Wolff, G. A., and Holtvoeth, J.: Diatom resting spore ecology drives enhanced carbon export from a naturally iron-fertilized bloom in the Southern Ocean, Global Biogeochem. Cy., 26, 1–17, https://doi.org/10.1029/2010GB003977, 2012.
Sathyendranath, S., Brewin, R., Brockmann, C., Brotas, V., Calton, B., Chuprin, A., Cipollini, P., Couto, A., Dingle, J., Doerffer, R., Donlon, C., Dowell, M., Farman, A., Grant, M., Groom, S., Horseman, A., Jackson, T., Krasemann, H., Lavender, S., Martinez-Vicente, V., Mazeran, C., Mélin, F., Moore, T., Müller, D., Regner, P., Roy, S., Steele, C., Steinmetz, F., Swinton, J., Taberner, M., Thompson, A., Valente, A., Zühlke, M., Brando, V., Feng, H., Feldman, G., Franz, B., Frouin, R., Gould, R., Hooker, S., Kahru, M., Kratzer, S., Mitchell, B., Muller-Karger, F., Sosik, H., Voss, K., Werdell, J., and Platt, T.: An Ocean-Colour Time Series for Use in Climate Studies: The Experience of the Ocean-Colour Climate Change Initiative (OC-CCI), [data set], Sensors, 19, 4285, https://doi.org/10.3390/s19194285, 2019.
Sathyendranath, S., Jackson, T., Brockmann, C., Brotas, V., Calton, B., Chuprin, A., Clements, O., Cipollini, P., Danne, O., Dingle, J., Donlon, C., Grant, M., Groom, S., Krasemann, H., Lavender, S., Mazeran, C., Mélin, F., Müller, D., Steinmetz, F., Valente, A., Zühlke, M., Feldman, G., Franz, B., Frouin, R., Werdell, J., and Platt, T.: ESA Ocean Colour Climate Change Initiative (Ocean_Colour_cci): Version 5.0 Data, NERC EDS Cent, Environ. Data Anal., https://doi.org/10.5285/1dbe7a109c0244aaad713e078fd3059a, 2021.
Schmidt, K., Atkinson, A., Stübing, D., McClelland, J. W., Montoya, J. P., and Voss, M.: Trophic relationships among Southern Ocean copepods and krill: Some uses and limitations of a stable isotope approach, Limnol. Oceanogr., 48, 277–289, https://doi.org/10.4319/lo.2003.48.1.0277, 2003.
Scott, F. J. and Marchant, H. J. (Eds.): Antarctic Marine Protists, Australian Biological Resources Study, Canberra, 563 pp., ISBN-10 0642568359, 2005.
Shen, C., Dupont, C. L., and Hopkinson, B. M.: The diversity of CO2-concentrating mechanisms in marine diatoms as inferred from their genetic content, J. Exp. Bot., 68, 3937–3948, https://doi.org/10.1093/jxb/erx163, 2017.
Sigman, D. M. and Fripiat, F.: Nitrogen isotopes in the ocean, Encycl. Ocean Sci., 263–278, https://doi.org/10.1016/B978-0-12-409548-9.11605-7, 2019.
Smetacek, V., Assmy, P., and Henjes, J.: The role of grazing in structuring Southern Ocean pelagic ecosystems and biogeochemical cycles, Antarct. Sci., 16, 541–558, https://doi.org/10.1017/S0954102004002317, 2004.
Strickland, J. and Parsons, T.: A Practical Handbook of Seawater Analysis, Fisheries Research Board of Canada, 405 pp., https://doi.org/10.2307/1979241, 1972.
Sutton, J. N., Varela, D. E., Brzezinski, M. A., and Beucher, C. P.: Species-dependent silicon isotope fractionation by marine diatoms, Geochim. Cosmochim. Ac., 104, 300–309, https://doi.org/10.1016/j.gca.2012.10.057, 2013.
Tamelander, T., Søreide, J. E., Hop, H., and Carroll, M. L.: Fractionation of stable isotopes in the Arctic marine copepod Calanus glacialis: Effects on the isotopic composition of marine particulate organic matter, J. Exp. Mar. Bio. Ecol., 333, 231–240, https://doi.org/10.1016/j.jembe.2006.01.001, 2006.
Thorpe, S. E., Heywood, K. J., Brandon, M. A., and Stevens, D. P.: Variability of the southern Antarctic Circumpolar Current front north of South Georgia, J. Mar. Syst., 37, 87–105, https://doi.org/10.1016/S0924-7963(02)00197-5, 2002.
Torres Valdés, S., Painter, S. C., Martin, A. P., Sanders, R., and Felden, J.: Data compilation of fluxes of sedimenting material from sediment traps in the Atlantic Ocean, Earth Syst. Sci. Data, 6, 123–145, https://doi.org/10.5194/essd-6-123-2014, 2014.
Trimborn, S., Wolf-Gladrow, D., Richter, K. U., and Rost, B.: The effect of pCO2 on carbon acquisition and intracellular assimilation in four marine diatoms, J. Exp. Mar. Bio. Ecol., 376, 26–36, https://doi.org/10.1016/j.jembe.2009.05.017, 2009.
Trull, T. W. and Armand, L.: Insights into Southern Ocean carbon export from the ä13c of particles and dissolved inorganic carbon during the SOIREE iron release experiment, Deep. Res. Pt. II, 48, 2655–2680, https://doi.org/10.1016/S0967-0645(01)00013-3, 2001.
Trull, T. W., Bray, S. G., Manganimi, S. J., Honjo, S., and François, R.: of the Southern Ocean , south of Australia with traps fluxes were high at all the sites mass g organic carbon m−1 at-1000 m, assuming minimal flux outside the Subantarctic Front with one trap at 3080 m, and at −54∘ S in the Polar Frontal Zone (PF Z), J. Geophys. Res., 106, 31489–31509, 2001.
Tuerena, R. E., Ganeshram, R. S., Humphreys, M. P., Browning, T. J., Bouman, H., and Piotrowski, A. P.: Isotopic fractionation of carbon during uptake by phytoplankton across the South Atlantic subtropical convergence, Biogeosciences, 16, 3621–3635, https://doi.org/10.5194/bg-16-3621-2019, 2019.
Volk, T. and Hoffert, M. I.: Ocean Carbon Pumps: Analysis of relative strengths and efficiencies in ocean driven atmospheric CO2 changes, in: The carbon cycle and atmospheric CO2: Natural variations Archean to Present, edited by: Sundquist, E. T. and Broecker, W. S., American Geophysical Union, Washington, DC, 99–110, 1985.
Wada, E. and Hattori, A.: Nitrogen isotope effects in the assimilation of inorganic nitrogenous compounds by marine diatoms, Geomicrobiol. J., 1, 85–101, https://doi.org/10.1080/01490457809377725, 1978.
Wada, E., Terazaki, M., Kabaya, Y., and Nemoto, T.: 15N and 13C abundances in the Antartic Ocean with emphasis on the biogeochemical structure of the food web, Deep Sea Res., 34, 829–841, https://doi.org/10.1016/0198-0149(87)90039-2, 1987.
Ward, J. P. J., Hendry, K. R., Arndt, S., Faust, J. C., Freitas, F. S., Henley, S. F., Krause, J. W., März, C., Ng, H. C., Pickering, R. A., and Tessin, A. C.: Stable silicon isotopes uncover a mineralogical control on the benthic silicon cycle in the Arctic Barents Sea, Geochim. Cosmochim. Ac., 329, 206–230, https://doi.org/10.1016/j.gca.2022.05.005, 2022.
Weir, I., Fawcett, S., Smith, S., Walker, D., Bornman, T., and Fietz, S.: Winter biogenic silica and diatom distributions in the Indian sector of the Southern Ocean, Deep. Res. Pt. I, 166, 103421, https://doi.org/10.1016/j.dsr.2020.103421, 2020.
Wetzel, F., de Souza, G. F., and Reynolds, B. C.: What controls silicon isotope fractionation during dissolution of diatom opal?, Geochim. Cosmochim. Ac., 131, 128–137, https://doi.org/10.1016/j.gca.2014.01.028, 2014.
White, W. M., Albarède, F., and Télouk, P.: High-precision analysis of Pb isotope ratios by multi-collector ICP-MS, Chem. Geol., 167, 257–270, https://doi.org/10.1016/S0009-2541(99)00182-5, 2000.
Whitehouse, M. J., Priddle, J., Trathan, P. N., and Brandon, M. A.: Substantial open-ocean phytoplankton blooms to the north of South Georgia, South Atlantic, during summer 1994, Mar. Ecol. Prog. Ser., 140, 187–197, https://doi.org/10.3354/meps140187, 1996.
Young, J. N., Heureux, A. M. C., Sharwood, R. E., Rickaby, R. E. M., Morel, F. M. M., and Whitney, S. M.: Large variation in the Rubisco kinetics of diatoms reveals diversity among their carbon-concentrating mechanisms, J. Exp. Bot., 67, 3445–3456, https://doi.org/10.1093/jxb/erw163, 2016.