the Creative Commons Attribution 4.0 License.
the Creative Commons Attribution 4.0 License.
 | 24 Jan 2023
Permafrost degradation and nitrogen cycling in Arctic rivers: insights from stable nitrogen isotope studies
Adam Francis
Raja S. Ganeshram
Robyn E. Tuerena
Robert G. M. Spencer
Robert M. Holmes
Jennifer A. Rogers
Claire Mahaffey
Across the Arctic, vast areas of permafrost are being degraded by climate change, which has the potential to release substantial quantities of nutrients, including nitrogen into large Arctic rivers. These rivers heavily influence the biogeochemistry of the Arctic Ocean, so it is important to understand the potential changes to rivers from permafrost degradation. This study utilized dissolved nitrogen species (nitrate and dissolved organic nitrogen (DON)) along with nitrogen isotope values (δ15N-NO and δ15N-DON) of samples collected from permafrost sites in the Kolyma River and the six largest Arctic rivers. Large inputs of DON and nitrate with a unique isotopically heavy δ15N signature were documented in the Kolyma, suggesting the occurrence of denitrification and highly invigorated nitrogen cycling in the Yedoma permafrost thaw zones along the Kolyma. We show evidence for permafrost-derived DON being recycled to nitrate as it passes through the river, transferring the high 15N signature to nitrate. However, the potential to observe these thaw signals at the mouths of rivers depends on the spatial scale of thaw sites, permafrost degradation, and recycling mechanisms. In contrast with the Kolyma, with near 100 % continuous permafrost extent, the Ob River, draining large areas of discontinuous and sporadic permafrost, shows large seasonal changes in both nitrate and DON isotopic signatures. During winter months, water percolating through peat soils records isotopically heavy denitrification signals in contrast with the lighter summer values when surface flow dominates. This early year denitrification signal was present to a degree in the Kolyma, but the ability to relate seasonal nitrogen signals across Arctic Rivers to permafrost degradation could not be shown with this study. Other large rivers in the Arctic show different seasonal nitrogen trends. Based on nitrogen isotope values, the vast majority of nitrogen fluxes in the Arctic rivers is from fresh DON sourced from surface runoff through organic-rich topsoil and not from permafrost degradation. However, with future permafrost thaw, other Arctic rivers may begin to show nitrogen trends similar to the Ob. Our study demonstrates that nitrogen inputs from permafrost thaw can be identified through nitrogen isotopes, but only on small spatial scales. Overall, nitrogen isotopes show potential for revealing integrated catchment wide nitrogen cycling processes.
- Article
(2526 KB) - Full-text XML
- BibTeX
- EndNote


The Arctic Ocean contains ∼1 % of global ocean volume but receives greater than 10 % of the total global riverine discharge (Frey and McClelland, 2009). This disproportionate influence of rivers means that any changes in riverine inputs will likely have significant implications on marine chemical, physical, and biological processes (Holmes et al., 2012). River biogeochemistry and discharge also integrate catchment-wide processes, making them potentially sensitive indicators of change to the terrestrial environment (Holmes et al., 2000). With diminishing sea ice and opening of surface waters to light, Arctic productivity is sensitive to riverine nutrient inputs and particularly nitrogen, which is the limiting nutrient in coastal areas (Thibodeau et al., 2017).
Biologically available nitrogen can exist as dissolved inorganic nitrogen (DIN) in forms of nitrate, nitrite, and ammonium. DIN is calculated as the sum of these three forms (DIN = NO + NO + NH (McCrackin et al., 2014) and can be taken up by primary producers (Tank et al., 2012). Nitrite and ammonium are highly biologically labile and so only persist for a short time before being converted into nitrate or assimilated. Nitrogen can also exist as dissolved organic nitrogen (DON), but these forms generally need to be broken down (remineralized) into DIN before uptake can occur (Tank et al., 2012). DON is calculated as the difference between total dissolved nitrogen (TDN) and DIN: (DON = TDN − DIN) (Frey et al., 2007). Nitrate is expected to be the dominant species so a simplification can be made to DON = TDN − NO. As part of the nitrogen cycle, exchange between these pools occurs in riverine and coastal areas depending on environmental conditions. In oxic conditions, assimilation and nitrification occur, while denitrification can be dominant in anoxic conditions (Voigt et al., 2017).
Extensive areas of permafrost influence most of the riverine inputs to the Arctic Ocean. Permafrost is defined as “any subsurface material that remains below 0 ∘C for at least two consecutive years” (Van Everdingen, 1998). It is defined exclusively on the basis of temperature, not whether ice is present. Permafrost can stabilize ancient soils, preventing breakdown of soil organic matter, and is classified based on its spatial extent and thickness. Continuous permafrost has 90–100 % aerial extent and is 100–800 m thick, while discontinuous has 50–90 % extent and is 25–100 m thick (Anisimov and Reneva, 2006).
Permafrost undergoes degradation through different mechanisms. The most common is active layer deepening, where the top layer of soil that degrades and refreezes each year becomes deeper due to increased summer temperatures and the influx of precipitation (Nelson et al., 1997). This increases the depth of permafrost, allowing the active layer to penetrate previously frozen soil. Permafrost can also degrade through riverbank or coastal erosion, cutting through deep horizons of permafrost, promoting rapid and often catastrophic degradation (Streletskiy et al., 2015). These mechanisms all lead to increases in soil microbial activity that release dissolved nitrogen from previously frozen organic matter (Beermann et al., 2017). The proportion of the released nitrogen species vary depending on the degree and mechanism of degradation.
Climate change is causing annual surface air temperatures within the Arctic to increase at almost twice the rate of the global average (Hassol, 2004). In 2010, air temperatures in the Arctic were 4 ∘C warmer than the reference period of 1968–1996 (NOAA, 2014). A further 4–7 ∘C increase is expected by the end of the century (Hassol, 2004). These dramatic temperature changes will result in the Arctic experiencing unprecedented impacts on its environments. Over the whole pan-Arctic watershed, river discharge is increasing by an estimated 5.6 km3 yr−1 each year, based on observations from 1964–2000 (McClelland et al., 2006). Some recent studies have revealed even greater rates occurring and predicted into the future, but some uncertainty exists due to substantial variation across basins and permafrost regimes (Feng et al., 2021). Discharge has already increased by ∼10 % in Russian rivers compared to this reference period (Peterson et al., 2002). Permafrost is at high risk of degradation with climate change, with estimates that 10 % of permafrost in the Northern Hemisphere has disappeared in the last 100 years (NSIDC, 2018). Predictions of future losses vary, but a recent study predicts 4.8 or 6 million km2 of permafrost (32 % or 40 % of global total) would be lost for a global temperature increase of 1.5 or 2 ∘C, respectively (UNFCCC, 2015; Chadburn et al., 2017).
Riverine biogeochemistry across the Arctic will be significantly affected by these changes due to liberation of nutrients and organic matter from the degrading permafrost and alterations to nutrient cycling within Arctic rivers. Although there has been considerable research into the effects of permafrost degradation on organic matter and carbon fluxes (Frey and Smith, 2005; Schuur et al., 2009; Vonk et al., 2013; Spencer et al., 2015), there are fewer studies on nitrogen loading in Arctic rivers and fewer still on cycling and processing. Some of the proposed dynamics of nitrogen cycling from permafrost degradation have been described in a study of Alaskan permafrost by Harms (2013). The active layer of soil is rich in fresh organic matter with a high C:N ratio. Within this layer, biotic assimilation of nitrate occurs along with denitrification in anaerobic conditions. With limited permafrost degradation, nitrogen export from this layer will largely be in the form of DON, rather than nitrate, but at relatively low concentrations. Much of the Arctic is covered in many metres of peat, so it is argued that this may apply to large areas of Arctic watersheds, especially western Siberia (Frey and McClelland, 2009). As watershed mean annual air temperature (MAAT) increases past the threshold limit for permafrost (−2 ∘C – catchment temperature where permafrost begins to degrade), DON concentrations in streams and rivers rapidly increase, with only smaller changes in nitrate concentrations, resulting in the DON : nitrate ratio increasing. The extent of permafrost degradation is the controlling factor on DON variability, as greater depths of soil are exposed with increasing degradation (MacLean et al., 1999; Frey et al., 2007).
In contrast, where shallow peat exists, warming and underlying permafrost degradation can cause the active layer to deepen into mineral horizons with low C:N ratios. This can lead to flow paths of groundwater being directed through these mineral horizons, leading to an increased adsorption of DON and release of nitrate through subsequent mineralization and nitrification (Harms, 2013). This process can occur to a lesser extent on a seasonal cycle with groundwater influx from mineral horizons in the winter and surface runoff from organic horizons in spring and summer. Extensive future permafrost degradation in catchments with active layer deepening occurring is expected to increase the seasonal groundwater contribution, leading to decreased DON concentrations and increased nitrate concentrations in streams and rivers (Walvoord and Striegl, 2007).
These studies focus on gradual active layer deepening processes. Other, more rapid permafrost degradation processes such as riverine and coastal erosion are more spatially limited but could be responsible for moving nitrogen species rapidly and directly from terrestrial permafrost to riverine or coastal environments (Berhe et al., 2007). This mechanism is understudied, so the resulting nitrogen export is still relatively unknown.
The processing and cycling of nitrogen that occurs in-stream and in near-shore coastal areas after release from permafrost is also largely unknown. DON represents a 5× greater influx to Arctic shelf waters from rivers than nitrate across the whole Arctic, but 70 % of the DON is removed in shelf waters before reaching the open marine environment (Thibodeau et al., 2017). The processes involved in this removal are largely unclear but riverine nitrate can have a strong remineralized signal, with sources from recycling of particulate organic nitrogen (PON) and DON (Thibodeau et al., 2017). The biolability of riverine DON and exchanges with the nitrate pool are key aspects that influence the Arctic nitrogen cycle, and the impact of future permafrost degradation on these aspects has not been studied. It is important, therefore, to understand how permafrost degradation may influence each nitrogen species input across multiple Arctic river catchments and the subsequent potential changes to the riverine and coastal nitrogen cycle as a result. This study focusses solely on the dissolved species of nitrogen, where most cycling occurs.
Dual stable nitrogen and oxygen isotopes of dissolved nitrate (δ15N-NO and δ18O-NO and nitrogen isotopes of TDN and DON (δ15N-TDN and δ15N-DON) were used to determine cycling and source processes. During various stages of the nitrogen cycle, biological processes favour the use of the light nitrogen isotope (14N) over the heavy isotope (15N) due to it being more energetically favourable (Sigman and Casciotti, 2001). This leaves the residual pool with more of the heavier isotopes, thus a more positive (higher) isotopic signature. The relative extent of a certain cycling processes is proportional to the residual isotopic signature. Transformation between nitrogen pools can also induce kinetic isotopic fractionation with fractionation factors unique to each transformation process (Voigt et al., 2017). Oxygen isotopes behave similarly but have different sources to nitrogen during each cycling stage, so the use of the dual isotope technique can distinguish sources of nitrate and determine the relative influence of nitrogen cycling processes such as nitrification, assimilation, or denitrification (Thibodeau et al., 2017). Comparisons of δ15N-NO versus δ18O-NO can show distinct sources of nitrate and mixing between them based on the environmental conditions inducing specific isotopic fractionations to both elements. Particular nitrogen cycling processes can also be shown using this method. For example, during denitrification or biological assimilation (nitrate consumption processes), the residual nitrogen and oxygen pools become equally enriched in the heavy isotopes (Granger et al., 2004), the fractionation of the two isotopes is “coupled”, resulting in a near 1:1 relationship (Botrel et al., 2017). In comparison, nitrification, a nitrate producing process, causes decoupled fractionation between the isotopes due to different nitrogen and oxygen sources (Sigman et al., 2005).
Since DON concentrations are elevated relative to nitrate concentrations in this Arctic riverine environment (Thibodeau et al., 2017), δ15N-DON can be measured, allowing the possible sources of DON to be determined, and when combined with nitrate isotope data, some of the cycling mechanisms can also be identified. This is only the second study utilizing δ15N-DON in the Arctic (Thibodeau et al., 2017) and the first to apply it to Arctic rivers.
This study aimed to contribute to the debate on the role of permafrost degradation on changing riverine loads of nitrogen into the Arctic. Specifically, determining if there is an increase of dissolved nitrogen supply into Arctic rivers and coastal zones as a result of permafrost degradation within catchments, what the proportions of nitrogen species within these inputs are, and whether a unique permafrost degradation signal can be detected in rivers using dissolved nitrogen species. A major focus was on the understudied area of nitrogen cycling within rivers and coastal areas. Nitrogen isotope signals in degradation zones and Arctic rivers with differing permafrost extents were utilized to provide insights into catchment-scale nitrogen cycling and recycling of various forms during riverine transport.

Figure 1(a) Sample names and collection locations from sites around the lower Kolyma River and estuary. Samples collected on a research trip in autumn 2018. Satellite image 1 source: data SIO, NOAA, US Navy, NGA, GEBCO – image Landsat/Copernicus – image IBCAO © Google Earth. Satellite image 2 source: © OpenStreetMap – © FATMAP – other providers. (b) Catchment areas (red lines) and sampling locations (red and yellow circles) of the six largest Arctic rivers (orange lines) used in the ArcticGRO III (Arctic Great Rivers Observatory) project. The extent and type of permafrost present in each catchment is also shown. Base map modified from Brown et al. (1997). (c) Catchment characteristics of each river shown. Data taken from Amon et al. (2012) and Holmes et al. (2012), and average peatland depth calculated from supplementary data in Hugelius et al. (2020).
2.1 Study areas and sample collection
2.1.1 Kolyma
Samples from the lower Kolyma River catchment were used to identify local-scale nitrogen signals from zones affected by varying levels of permafrost degradation (Fig. 1a). Samples were collected in September 2018 from surface water, filtered on-site using a 0.7 µM glass fibre filter and immediately frozen. Late autumn sampling was chosen as active layer depths reach their maximum extent at this time, allowing the greatest permafrost DOM influx to streams (Schuur et al., 2008; Mann et al., 2012).
PD1 is a well-studied permafrost degradation zone known as Duvannyi Yar, where a 10–12 km long outcrop of permafrost is exposed along the bank of the Kolyma River. The permafrost is part of the extensive Pleistocene Yedoma permafrost that covers much of the Kolyma and Lena catchments and contains almost a third of all organic matter stored in Arctic permafrost (Vonk et al., 2013). Limited freeze–thaw action prevents processing and degradation of organic matter, resulting in storage of ancient and well-preserved organic matter. Ancient ice wedges also characterize this permafrost, accounting for about 50 % of the soil volume and storing some of the organic matter within it (Schirrmeister et al., 2011). Yedoma permafrost is mostly continuous throughout the Kolyma catchment, except at a limited number of erosional sites such as Duvannyi Yar. Here, the river erodes it at 100 m yr−1, leading to extensive permafrost degradation throughout the soil horizon (Vasil'chuk et al., 2001). This destabilizes soil profiles, leading to bank collapses and release of ancient organic matter into streams. This erosional style degradation leads to both organic layer and mineral influence in dissolved nitrogen and carbon additions, differing to active layer degradation mechanisms where the peat depth determines which layer is exposed after degradation (Harms, 2013). Radiocarbon dating of DOC from a fluid mud stream draining from the degrading permafrost yielded an age of 20 000 years at this site. This organic matter is highly biolabile after thawing occurs and can be assimilated rapidly by aquatic microorganisms after mineralization (Vonk et al., 2012; Spencer et al., 2015). Samples for this study were collected from a similar fluid mud stream.
In contrast, samples PC1 and PC2 were taken from streams draining sites underlain with continuous modern permafrost with little permafrost-derived DOC, if any. The sites contained functioning ecosystems of larch forests, shrub/moss, and lichen understory with no exposed permafrost (Loranty et al., 2018). This is representative of large areas of the Kolyma catchment as well as portions of other Russian Arctic rivers, so can be used to determine the background non-degradation signal for nitrogen species.
To determine how nitrogen species from permafrost degradation are processed within an Arctic river and a marine environment, samples were taken in the main stem of the Kolyma River, downstream of the degradation site, along with samples in the estuarine zone where the Kolyma River meets the East Siberian Sea (Fig. 1a). The riverine sample labelled R1 is the same site used in the ArcticGRO Kolyma samples described in Sect. 2.1.2.
2.1.2 Pan-Arctic rivers
The Arctic Great Rivers Observatory (ArcticGRO) (https://arcticgreatrivers.org/, last access: 25 July 2022) is an international project collecting and analysing riverine water samples using identical methods. Samples used in this study were collected in 2017, using methods described in Holmes et al. (2021), from the six largest Arctic rivers; four in Russia – Kolyma, Ob, Lena, and Yenisey – and two in North America – Yukon and Mackenzie (Fig. 1b). Together, the proportion of continuous and discontinuous permafrost within these catchments is 48 %, similar to the proportions across the whole pan-Arctic catchments (52 %) (Tank et al., 2012). Thus, these rivers represent overall pan-Arctic conditions. These catchments also cover transitions from continuous permafrost zones of the Arctic to permafrost-free, capturing the variability that occurs across the pan-Arctic (Tank et al., 2012). Studying the major Arctic rivers allowed comparisons of nitrogen loading and cycling between rivers to identify variations of permafrost and catchment influences. The generated datasets from this study were interpreted using discharge, concentration, and other biogeochemical data from 2003 to 2018, available on the ArcticGRO website (https://arcticgreatrivers.org/data/, last access: 25 July 2022). The overview of the production of this dataset and some of the associated uncertainties and variability are shown in Holmes et al. (2012) and Shiklomanov et al. (2006).
2.1.3 Analysis of nitrogen species – concentrations and stable isotopes
TDN and DOC concentrations were measured using a Shimadzu TOC/TN analyser at the University of Edinburgh (Kolyma samples) and Woods Hole Research Centre (ArcticGRO samples). Inorganic nutrient concentrations were measured at the Woods Hole Research Centre using an Astoria analyzer (ArcticGRO samples) and also calculated from mass spectrometer peak areas referenced to two internal standards with known concentrations and isotopic values (Kolyma samples). All stable isotopic analysis was carried out at the School of Geosciences, University of Edinburgh.
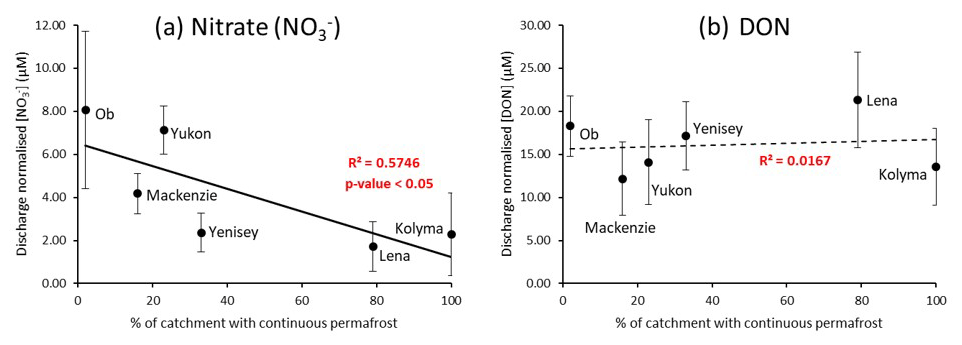
Figure 2Relationships between the extent of continuous permafrost within each river catchment and (a) nitrate and (b) DON discharge normalized concentrations (µM) for the period 2003–2018. Data are from the ArcticGRO online dataset. Error bars from the discharge normalized standard deviations are quite large due to the large year-to-year variability in nitrate DON concentrations, however these do not affect the overall trends observed.
2.1.4 δ15N and δ18O of nitrate (NO
The dual isotope technique to measure nitrogen and oxygen isotopes of nitrate was carried out by the denitrifier method modified from Sigman et al. (2001), Casciotti et al. (2002), and McIlvin and Casciotti (2011). It utilizes denitrifying bacteria, Pseudomonas aureofaciens, which lack nitrous oxide (N2O) reductase activity to convert dissolve nitrate into N2O gas while maintaining an identical nitrogen isotopic signature to the original nitrate. The oxygen isotope signature is subject to change with water molecules, so is corrected for using the method in Weigand et al. (2016). Samples with low nitrate concentrations (<1 µM) could not be analysed for nitrate isotopes. As a result, some samples were excluded from analysis. The analytical precision for δ15N-NO was ±0.4 ‰ and ±0.3 ‰ for the two reference standards IAEA-N3 and USGS-34, respectively, and for δ18O-NO, it was ±1.0 ‰ and ±0.8 ‰, respectively. This was based on >30 measurements of the international standards analysed on several different days.
2.1.5 δ15N of TDN
This method utilizes an extra step prior to the denitrifier method, where the sample TDN is converted into nitrate while maintaining the TDN isotopic signature. This involves oxidation with potassium persulphate followed by digestion of the organic nitrogen to an equivalent amount of nitrate that is then prepared via the denitrifier method. This procedure was adapted from Knapp et al. (2005) and Thibodeau et al., (2013, 2017), using internal standards to ensure that fractionation is minimal and values obtained are representative of the actual δ15N of DON. δ15N-TDN isotopic values represent the values of both DON and DIN (nitrate + nitrite). Therefore, δ15N-DON is calculated using concentration weighted δ15N-NO and δ15N-TDN values, and allowed the processes involved in organic and inorganic nitrogen to be compared. δ15N-DON could only be calculated when δ15N-NO values were available ([NO] >1 µM). Samples with nitrate concentrations less than 1 µM were reported as δ15N of TDN, since δ15N of DON was not calculable and using δ15N of TDN allowed comparisons with other samples.
This calculation assumes that the isotopic signature of nitrate can represent that of DIN and the contribution from ammonium is negligible. This is because ammonium is unstable in peatland environments and is rapidly converted into nitrate, meaning nitrate makes up the majority of the DIN pool and ammonium concentrations are low and often below detection limits, as mentioned in Holmes et al. (2012).
3.1 Permafrost extent and nitrogen species
Mean ArcticGRO nitrate and DON (TDN-DIN) concentrations of all available data points in the ArcticGRO dataset from 2003–2018 were calculated for each of the six rivers. This produced average annual nitrate and DON concentrations (from Holmes et al., 2012). To remove the effect of unequal seasonal sampling and the large variability in hydrology in these river systems, the concentrations were normalized to the discharge of the sample collection month and plotted against percentage continuous permafrost (Fig. 2). This allowed more accurate inter-river comparisons of nitrogen species concentration.
Negative correlations are present between permafrost extent and discharge normalized nitrate concentrations. The concentration trend shown is statistically significant to a 95 % confidence level (p-value = 0.05), according to the Spearman's rank test. However, no statistically significant relationship exists between discharge normalized DON concentrations and permafrost extent for all rivers.
Overall, these negative linear relationships suggest that the less permafrost present in a river catchment, the more nitrate is released from the surrounding soil. Therefore, permafrost degradation may induce greater concentrations of nitrate into Arctic rivers. Similar trends have been observed in other studies (Jones et al., 2005; Harms, 2013). Conversely, no significant relationship can be observed between discharge normalized DON concentrations and permafrost extent in any of the plots (Fig. 2b). Given that DON is the dominant form of nitrogen released from soil, the increase in nitrate concentrations but not DON suggests that cycling of organic nitrogen to inorganic forms in soils and/or upstream rivers may be promoted with decreasing permafrost extents. Figure 2 displays the variability from the extent of continuous permafrost but not from active permafrost degradation. Local-scale measurements of degradation sites from the Kolyma River were used to address if active permafrost degradation releases nitrogen and identify cycling processes involved. Seasonal trends were also used to see when each of the species become dominant and to help determine catchment-scale processes.
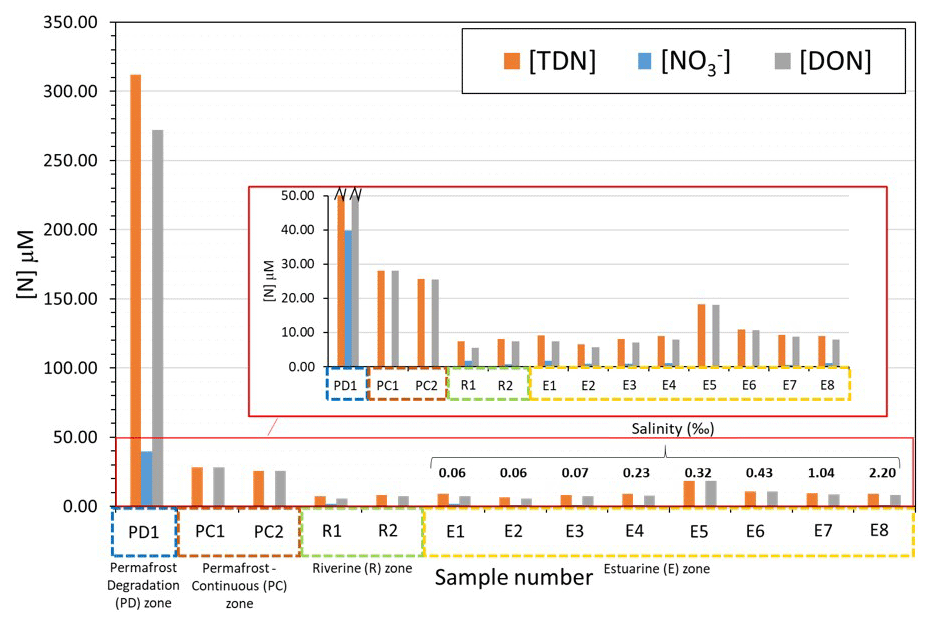
Figure 3Concentrations of total dissolved nitrogen (TDN), nitrate (), and dissolved organic nitrogen (DON) in different zones of the lower Kolyma River, as overviewed in Fig. 1a. Salinity values are displayed for the estuarine samples in order of increasing salinity. The inserted panel shows the small-scale differences on downstream sites.

Figure 4Nitrogen isotopes of TDN, nitrate (), and DON in different zones of the lower Kolyma River, as overviewed in Fig. 1a. Oxygen isotopes (δ18O) of nitrate are also shown on the negative scale below the nitrogen isotope values. Only three sites (PD1, R1, and R2) were able to have nitrogen isotopes of nitrate (and therefore also of DON) analysed, as most nitrate concentrations were <1 µM. However, since nitrate concentrations were very small in comparison to DON (see Fig. 3), especially for the permafrost influenced site, then it can be assumed that the nitrogen isotopic signature of DON is roughly equal to the signature of TDN (δ15N-DON ≈δ15N-TDN). The permafrost-influenced sample was analysed across four repeat runs, allowing a robust standard deviation to be calculated.
3.2 Local scale permafrost degradation signals
3.3 Concentration of nitrogen species
Figure 3 shows the concentrations of different nitrogen species in zones of the Kolyma River and estuary. The concentrations of nitrate and DON represent the dissolved inorganic and the dissolved organic species of TDN, respectively. Site PD1 at Duvannyi Yar, with substantial permafrost degradation, has greatly elevated concentrations of all nitrogen species in comparison to other samples. Most of the nitrogen is present as DON (312 µM for DON and 40 µM for nitrate). In comparison, the permafrost influenced zone (where continuous permafrost is present) has substantially lower concentrations with DON roughly 25–28 µM and nitrate concentrations being almost negligible at 0.2 µM. The amount of DON relative to nitrate in these sites was however much greater than the permafrost degradation site. Permafrost degradation appears to release DON and nitrate in large amounts, whereas the continuous permafrost releases much less DON and very little nitrate.
In the main stem of the river, DON concentrations decreased (to 6–7 µM). Nitrate concentrations were greater than in the permafrost-influenced zone (1–2 µM), but still an order of magnitude lower than the degradation zone. In the estuarine zone, concentrations of both DON and nitrate fluctuated slightly but remained at a similar level to the riverine samples (DON = 5–9 µM, nitrate = 0.2–2 µM), with no clear trend in concentration with increasing salinity. DON increased slightly in site 007, but this was anomalous in comparison with the rest of the site concentrations.
These trends suggest that within continuous permafrost zones of the Kolyma catchment, only DON is released from soil in significant amounts. DON concentrations were 169× greater than nitrate concentrations. This observation that more permafrost leads to less release of nitrate supports observations on the catchment scale, as noted in Sect. 3.1. Our findings show that within the Yedoma permafrost degradation zone, permafrost degradation facilitates the release of large amounts of both nitrate and DON from the soil and into the dissolved phase. DON was still the dominant species, but not as much as with continuous permafrost, with a concentration 7 times greater than nitrate.
However, in the main stem of the river, the signals were quickly lost, with concentrations decreasing by 44-fold and 31-fold for nitrate and DON, respectively. This decrease in both species was partially due to a dilution effect, but could also be due to the diluting source having a lower proportion of nitrate than DON. Such a possibility is consistent with continuous permafrost occupying the vast majority of the catchment, with smaller inputs of DON and with lower DON : nitrate ratios. DON concentrations may be 10 times higher than nitrate concentrations in the main stem due to nitrate being more readily removed than DON. However, there was no clear change in concentrations downriver, suggesting processing of the nitrogen pool may be small, but cycling processes are difficult to determine using only concentration data.
3.4 Nitrogen isotopic signatures
Figure 4 shows the stable isotopic signatures of different nitrogen species in zones along the Kolyma River. At the permafrost degradation site, nitrogen isotopes of all species were enriched in 15N (δ15N-NO ‰, δ15N-DON = 7 ‰), and δ18O-NO values were very negative at −19 ‰. In comparison, the permafrost-influenced sites had lower isotopic values for DON (3 ‰ to 4 ‰).
The signals observed in the permafrost degradation site were rapidly lost in the main stem of the river and into the estuary. In the river, δ15N-NO was ∼5 ‰ and δ15N-DON was 2 ‰ to 5 ‰, while δ18O-NO was around −5 ‰. At the start of the estuary, δ18O-NO increased to −3 ‰. With consideration of the errors associated with the measurement, there were no clear trends observed for δ15N moving downstream (similar to the concentration data) and into the estuary, suggesting minimal alterations to dominant processing cycles of nitrogen in the main river stem.
In summary, a unique signal representing inputs from degrading Yedoma permafrost was detected using concentrations and isotopic signatures of nitrogen species (Figs. 3 and 4). From the site at Duvannyi Yar, extensive permafrost degradation brings water to the Kolyma River with very high DON concentrations (272 µM) and high δ15N-DON (6.7 ‰). In addition, nitrate concentrations were high (40 µM), with very high δ15N-NO (11.5±0.26 ‰) but very low δ18O-NO ( ‰).
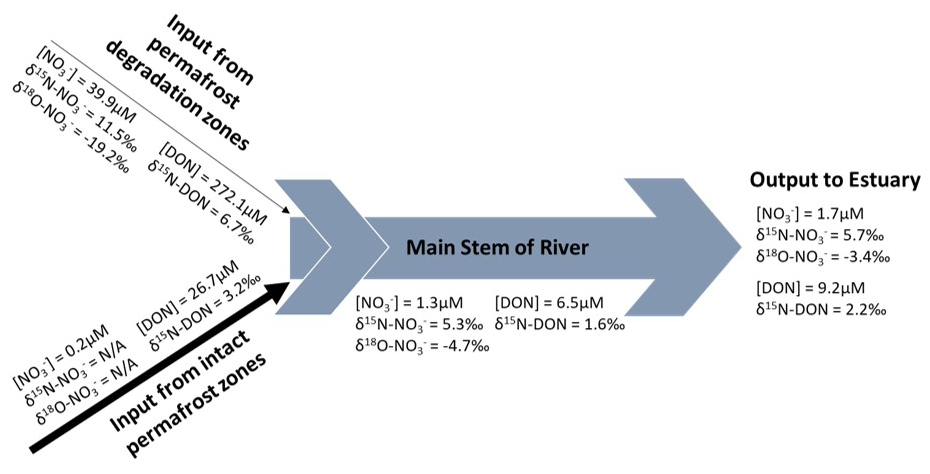
Figure 5Summary of concentration and isotopic signals of nitrate and DON species in the Kolyma system. Data displayed are average values of all samples in each zone of the river.
3.4.1 Explanation of signals observed and likely processing
During degradation, permafrost releases large amounts of organic matter and organic nitrogen (DON) from the soil and ice (272 µM in this study, Fig. 5). This undergoes rapid mineralization, firstly to highly reactive ammonium, then to nitrate via nitrification (Voigt et al., 2017). The lighter isotope of nitrogen is preferred for these reactions through kinetic fractionation (Mariotti et al., 1981), however the first step of this reaction (ammonification, DON converted to ammonium), is associated with a small fractionation factor (Swart et al., 2008), so cannot fully explain the high isotopic signature of the residual DON pool (6.7 ‰). Nitrification produces high concentrations of nitrate (40 µM), however the waterlogged and anaerobic conditions in the soil, combined with the lack of vascular plants for competition (Repo et al., 2009), produces good conditions for denitrifying bacteria to convert the readily available nitrate to atmospheric N2 via denitrification. This reaction produces much stronger kinetic fractionation than nitrification (Swart et al., 2008), so this partial denitrification, where not all nitrate is denitrified, results in the residual nitrate pool becoming isotopically heavy with a high δ15N-NO signal of 11.5 ‰. DON also shows this high denitrification signal, suggesting exchange of denitrified nitrogen between the nitrate and DON pools through the assimilation of partially denitrified heavy nitrate and the production of heavy DON by remineralization. Even though 14N is preferred to form DON, a highly invigorated nitrogen cycle with continuous nitrogen exchange between pools explains the unusually heavy δ15N values in both DON and nitrate pools.
Additionally, the fact that DON is not isotopically heavier than nitrate is also expected, as the primary source of DON is from decaying organic matter preserved in the permafrost, and this process releases organic matter with a low δ15N to start with that forms DON also with a lower δ15N (Sipler and Bronk, 2015). This is supplemented with a smaller contribution from DON formed from the recycled heavy nitrate. Therefore, nitrogen processing in the permafrost degradation zone not only involves active release of DON by heterotrophic remineralization with anaerobic processes such as denitrification, but also exchange between nitrogen pools. Oxygen isotopes of nitrate provide further evidence for this recycling.
During denitrification, fractionation of nitrogen and oxygen is 1:1; therefore, oxygen isotopes should behave similarly to nitrogen isotopes and become isotopically heavy (high signal) in the residual nitrate pool (Sigman et al., 2009). This is not observed however, as δ18O-NO in the permafrost degradation stream had a very negative (low) signal (−19.2 ‰). Therefore, denitrification alone cannot explain the oxygen isotopic signatures. The δ18O-NO signal “resets” to the value of ambient water and dissolved oxygen when it is recycled (Buchwald and Casciotti, 2010) while the fixed nitrogen is internally cycled, retaining its isotopic signatures (Sigman et al., 2009). The observed δ18O-NO signal in the permafrost degradation zone is very close to the value of δ18O-H2O of Kolyma River water for this time of year (−20 ‰) (Yi et al., 2012). However, this stream water was draining straight from the ancient ice wedges and had not been in contact with the main stem “modern” water. The δ18O-H2O of ice wedges was much lower than present day river δ18O-H2O: −33.3 ‰ (Vonk et al., 2013) due to different environmental conditions during the formation period of this permafrost (Hubberten et al., 2004; Vonk et al., 2013). Given that the denitrification signal was largely reduced in δ18O-NO suggests that the partially denitrified nitrate was almost completely recycled through the assimilation–ammonification–nitrification cycle during permafrost degradation. This vigorous nitrogen cycling and exchange between nitrogen pools should occur in the degradation site soil before reaching the river. Collectively, the dual nitrogen and oxygen isotopic signals of nitrate and nitrogen isotopes of DON provide evidence for a range of nitrogen recycling process active in the degradation zone. This produced unusually heavy δ15N values in both DON and nitrate pools and a δ18O-NO signal representing both the recycling and denitrification processes. These isotopic signals show a unique signature where inputs from Yedoma permafrost degradation enter the main stem of the river. Processing in the main stem can then alter these signals, explaining the signal observed at the river mouth.
Organic matter from this permafrost site is very biolabile and ancient permafrost DOC is the most biolabile source of DOC in riverine Arctic systems due to lack of processing and survival of bacteria (Vonk et al., 2013). Up to 50 % of permafrost DOC can be lost in less than 7 d in the Kolyma River (Spencer et al., 2015). This time period is equal to water residence times between headwater streams in degradation zones and the river mouth (3 d) (Vonk et al., 2013). However, DON may behave differently to DOC in terms of cycling. Unlike DOC (where a large proportion of the carbon is oxidized and lost as CO2) (O'Donnell et al., 2016), DON will mostly be converted into nitrate during degradation. This nitrate will likely continue to be recycled along with DON degradation in the river.
Therefore, it is expected that the high δ15N values (for both DON and nitrate) from the degradation site would be retained through recycling, and even if some nitrogen was lost as N2 or N2O or to PON (which sinks out) via assimilation, the residual dissolved pool would remain isotopically heavy. However, since these DON signals were not clearly observed downstream, this suggests that the contributions of these permafrost degradation streams were relatively small compared to other DON sources in the main stem of the river (Drake et al., 2018) probably receiving waters from continuous permafrost, resulting in nitrogen signals from permafrost degradation being quickly lost. Dilution with main stem water containing lower concentrations and lower δ15N values is a major contributor to the changes observed.
The main stem isotopic signatures represent the average catchment characteristics (a combination of all permafrost influenced and degradation sites), and since the δ15N-TDN were much more similar (the same within error) to the permafrost influenced site, it can be assumed that these conditions represent the majority of the Kolyma catchment, as it has near 100 % continuous permafrost coverage. However, within that TDN input, permafrost-influenced sites supply mostly DON but very little nitrate (Figs. 2 and 3). From the permafrost zone to the main stem, DON concentrations decreased and nitrate concentrations increased slightly (even with dilution effects). The isotopic signature of the main stem nitrate was also significantly heavier than that of permafrost and main stem DON. The concentration trends suggest that recycling of DON to nitrate was occurring in the river, and when combined with the isotopic trends, some of the isotopically heavy nitrogen from DON and nitrate originating in the degradation site may have contributed to these recycling processes. This allows the heavy nitrogen signal from the degrading Yedoma permafrost to be transferred and retained in the main stem nitrate. This was assisted by the negligible diluting nitrate inputs from much of the permafrost-covered catchment. Importantly, this also suggests that a significant nitrate pool in the main stem is produced from DON recycling rather than from direct nitrate inputs to the river.
However, δ18O-NO values in the main stem were higher than the degradation site (−3.4 ‰ to −4.7 ‰). These values were much greater than would be expected from nitrogen recycling and nitrate DON exchange occurring in the main stem. Determining the cause for these high signals is difficult due to a multitude of possible factors influencing the isotopic signatures. Co-occurrence of partial nitrate uptake and nitrification in the main stem which decouples the nitrogen and oxygen isotopes (Sigman et al., 2009) may be occurring, but would only account for a δ18O-NO increase of around 5 ‰ (Wankel et al., 2007). External sources such as atmospheric deposition and surface runoff with minimal interaction with catchment soils (e.g. snowmelt or high riverine discharge during sampling due to localized rainfall) may also bring high δ18O-NO and lower δ15N-DON values into the main stem (Heikoop et al., 2015; Thibodeau et al., 2017). However, the amount of atmospheric δ18O-NO signal that reaches the main stem may be low, as studies have shown that nearly all snowpack nitrate is assimilated or remineralized before being released into the river, thus losing nearly all the high δ18O-NO signal (Tye and Heaton, 2007).
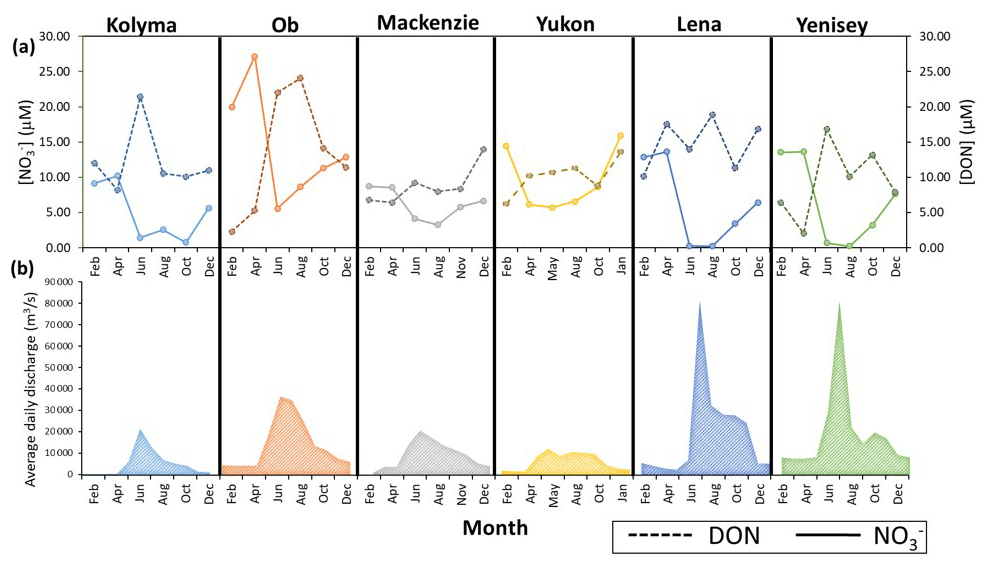
Figure 6Seasonal concentrations (a) for nitrate and DON in the six Arctic GRO rivers between 2003 and 2018. Discharge trends for each river are also shown in (b). Note, sample concentration values were taken six times throughout the year, every second month. The daily discharges for each month were averaged to produce the average daily discharge value for each month, 12 per year. Data are obtained from the ArcticGRO online database.
Overall, determining the cause of the high δ18O-NO values and lower δ15N-DON in the main stem relative to the permafrost zone cannot be constrained with this study, but is likely to be some combination of atmospheric, microbial, and recycling signals with co-occurrence of uptake, nitrification, and possible denitrification. All of these may change seasonally, which is explained in greater depth in Sect. 3.3.
In summary, a unique signature representing inputs from degrading Yedoma permafrost was identified in the lower Kolyma River catchment, indicating anaerobic degradation, denitrification, and vigorous nitrogen cycling within permafrost soils undergoing degradation. Dilution of the DON degradation signal occurs in the main stem, but the DON (from the degradation site as well as the surrounding catchment) also undergoes mineralization to nitrate, transferring the isotopic degradation signature to the nitrate. Therefore, increases in the nitrogen release from Yedoma permafrost soils, irrespective of the species, is most likely to be reflected in riverine nitrate concentrations. However, signals are unlikely to be strongly observed around the mouth of rivers, unless very spatially extensive degradation zones are present in the catchment, providing large enough fluxes of nitrogen species liberated from permafrost. This would allow the degradation signal to persist through the background catchment-wide nitrogen signal from modern surface soils.
The permafrost degradation occurring at this Kolyma site is only one type of degradation mechanism that can occur. It involves erosion of ice-rich permafrost (Yedoma) found mainly in the Lena and Kolyma catchments, but not in other Russian Arctic river catchments such as the Ob and Yenisey (Wild et al., 2019) (some is also present in the Yukon catchment). This type of degradation produces a greater export in the form of POC than DOC (Wild et al., 2019), as seen in the Kolyma and Lena. This preferred release of POC (thus PON) from Yedoma permafrost could partially explain why a stronger degradation signal was not observed downstream in the Kolyma River. Other degradation mechanisms such as top-down active layer deepening occur widely across the Ob and Yenisey catchments and produce significantly more degradation-sourced DOC than POC (Wild et al., 2019), and possibly more DON than PON. With this type of degradation mechanism, the depth of peat would likely play a more important role in interactions with different soil horizons and the associated release of different dissolved species.
Large seasonality of DOC permafrost contribution exists in Arctic rivers (Wild et al., 2019). Permafrost-derived DOC had a greater contribution to total DOC flux in all four rivers in late autumn and winter compared to spring and summer when modern DOC sources dominate export. A similar mechanism may also operate for DON, where the sources in spring and summer are not derived as strongly from permafrost but from surface soils that experience minimal nitrogen processing. Therefore, permafrost signals and associated processes should be considered on spatial (inter-catchment) and temporal scales.
3.5 Seasonal nitrogen species trends in rivers
3.5.1 Time series concentration and discharge trends
Figure 6b shows that all six rivers follow a similar seasonal discharge trend typical of northern high-latitude rivers. Low flow is present in winter months, where groundwater is the primary source of water. During spring, snowmelt causes rapid increases in discharge (the spring freshet) peaking in late May to June. Peaks are greatest in the Lena and Yenisey. After the freshet, discharge decreases throughout summer, occurring more rapidly in the Lena and Yenisey, while in other rivers, peak discharge extends throughout summer, most apparent in the Yukon River.
All rivers in general show increases in DON concentrations (DON) in summer months during peak discharge, and this concentration increase is highest in the Ob, followed by the Yenisey and Kolyma, and lowest in the Lena, Mackenzie, and Yukon where only small seasonal changes occur in DON. Nitrate concentrations (NO) in most rivers show opposite seasonal trends to DON (Fig. 6a), with the Ob showing the greatest seasonal change of all rivers in both nitrate and DON. The Lena and Yenisey show nitrate concentrations decreasing to almost zero in the summer months during peak discharge.
In general, Fig. 6 confirms that DON is the dominant form of nitrogen released from these soils and transported in these rivers, due to its high concentration during the high discharge periods of the spring freshet. This DON source is likely derived from surface runoff through organic rich topsoil (Harms, 2013). Following the local-scale Kolyma section, seasonal stable isotopes trends are used next to detect (1) permafrost degradation signals and (2) any in-stream processing of nitrogen.
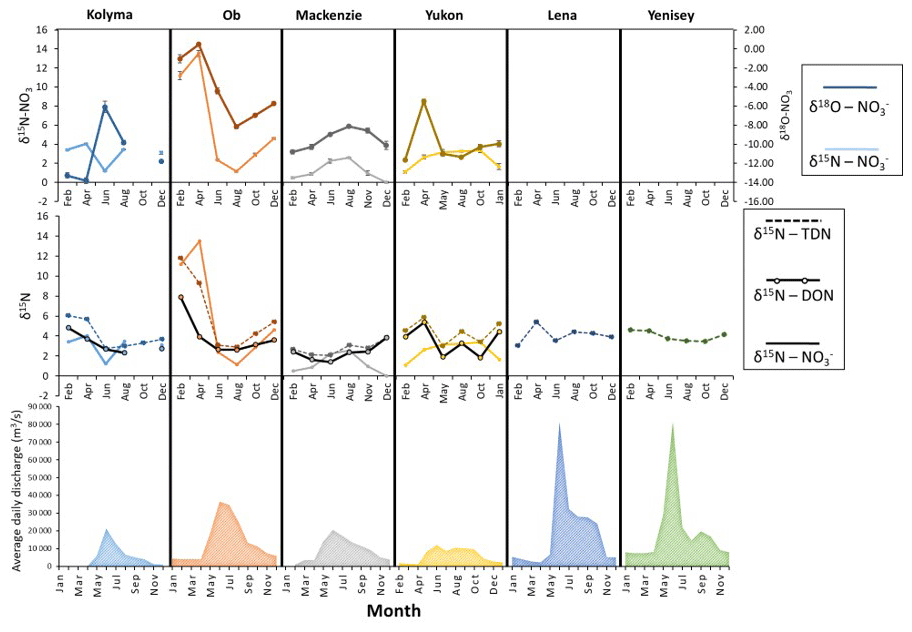
Figure 7Seasonal nitrogen (and oxygen) isotopic trends for all six Arctic GRO rivers. Nitrate isotopes as part of the dual isotope technique (δ15N and δ18O) are shown on (a). Nitrogen isotopes of TDN, nitrate, and DON, note the one scale for all three, are shown in (b). Seasonal discharges are also shown in (c). Only δ15N values of TDN were plotted for the Lena and Yenisey, since nitrate concentrations were very low for dual isotopic analysis of nitrate, hence δ15N- and δ18O- values were not obtained. However, since nitrate concentrations were very small in comparison to DON (see Fig. 6), then it can be assumed that the nitrogen isotopic signature of DON is approximately equal to the signature of TDN (δ15N-DON ≈δ15N-TDN).
3.5.2 Time series nitrogen isotopic trends
Figure 7 presents a time series isotopic analysis of the Arctic rivers. The sampling sites were located at the mouths of the rivers (Fig. 1), therefore they integrate signals of various source of nitrogen and nitrogen cycling processes in the catchment. From Figs. 6 and 7, strong seasonal variations affect nearly all the trends of nitrogen species in each river, but the trends suggest that discharge was not the greatest influencer on the isotopic signatures. Summer values of δ15N of nitrate, DON, and TDN are around 2 ‰ to 4 ‰, similar to the Kolyma River main stem in summer, indicating a mixed nitrogen source dominated by surface nitrogen sources diluting signals from continuous permafrost and permafrost degradation signals (Fig. 7). These results are consistent with previous studies of DOC in Arctic rivers (Wild et al., 2019). Permafrost-derived DOC has a greater contribution to total DOC flux in all four rivers in late autumn and winter compared to spring and summer when modern DOC sources dominate export. A similar mechanism may also operate for DON where the sources in spring and summer are not derived as strongly from permafrost but from surface soils that experience minimum nitrogen processing (Harms, 2013).
δ15N-NO and δ15N-DON values of the Kolyma and Ob in late winter and early spring are high before becoming lower in spring/summer and returning to high values at the end of the year (Fig. 7) (this is also seen in the Yukon to a lesser extent). It is notable that the Kolyma and Ob have the highest and lowest continuous permafrost extent respectively among the large Arctic rivers. We evaluate the seasonal trend further in the Ob River (with comparison to the Kolyma), which has the largest seasonal isotopic shift out of all the rivers (Fig. 7).
3.5.3 Relating seasonal trends to nitrate sources, permafrost degradation, and nitrogen cycling mechanisms
The Ob has the greatest seasonal isotopic shifts with very heavy winter δ15N-NO values of 12 ‰ to 14 ‰ occurring over winter and early spring but decreasing to 2 ‰ in summer, and a change from 8 ‰ to 2.5 ‰ for δ15N-DON. The δ18O-NO trend for the Ob River follows a similar pattern to the δ15N-NO (i.e. they are coupled). However, for the Kolyma, the two isotopes are decoupled and show strong opposing trends, though this trend could be influenced by the anomalously high δ18O-NO value in June, and may not represent true conditions.
The peak δ15N-NO values in the Ob River are similar to the signal for denitrification in high-latitude permafrost regions (Harms, 2013), and the isotopic and nitrate concentration peak in winter could be further evidence of extensive denitrification sources. Despite low concentrations of DON during the winter months, its isotopic signature was similar to the Kolyma degradation site, however the higher values of δ15N-NO suggests that different processes are occurring in each river and that the signal cannot be compared to the possible permafrost degradation signal observed in the Kolyma (Sect. 3.2.3). The stronger denitrification signal may be more visible in the main stem of the Ob unlike in the Kolyma, due to a much lower extent of continuous permafrost within the catchment (permafrost present as discontinuous or sporadic under the large peatland of Western Siberian Lowlands, Wild et al., 2019). The lack of permafrost in the Ob catchment may also allow some groundwater encroachment of the mineral horizon in some places within the catchment. Here, DON can be adsorbed and mineralized to nitrate (Harms, 2013). Denitrification of this remineralized nitrate due to the waterlogging of the soil in these large wetlands would also lead to the high isotopic signatures observed. It is important to note that these denitrification processes occur without permafrost degradation influence in the Ob, whereas the denitrification signal observed in the Kolyma Yedoma degradation site was likely due to the permafrost degradation. Denitrification signals are much more influential in the Ob than the Kolyma, where the permafrost extent is very low. The high nitrate concentrations show that a substantial amount of denitrified nitrate is added to the rivers, and the Ob River is displaying a source-dominated signal, with instream processes possibly less influential.
The coupling of δ15N-NO and δ15N-DON throughout the year suggests the same source for both nitrogen species. However, some DON may also be oxidized into nitrate in the main stem and allow the heavy δ15N signal to be transferred from the DON to the nitrate. This would also reduce the DON concentrations as observed.
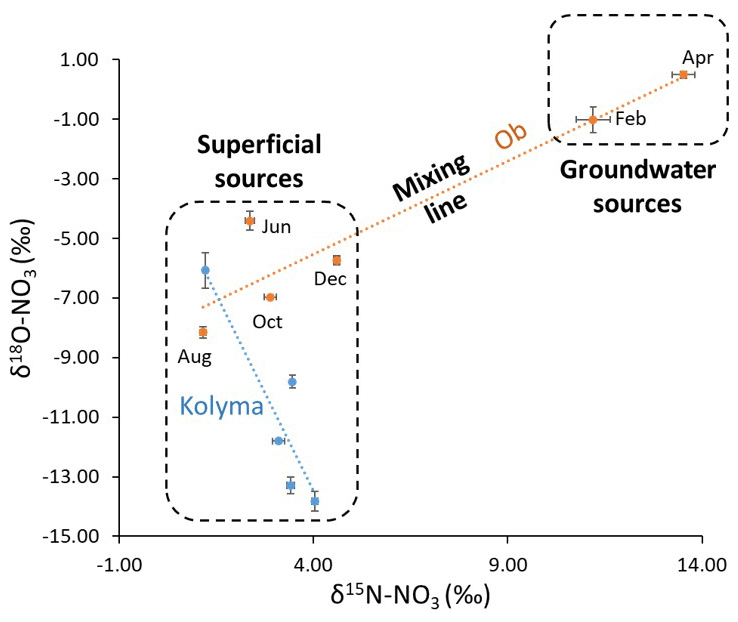
Figure 8Likely different sources of nitrate throughout the year in the Ob and Kolyma catchments inferred by relationships between δ15N- and δ18O-. A mixing line can be plotted as a regression line between the two sources. The location on the plot that each sample occurs can indicate the dominant nitrate sources at that time, and from that, the processes occurring can be inferred.
The observed variability of nitrate isotopes in the Ob River can be approximated to changes between two dominant sources, as outlined in Fig. 8. The heavier winter δ15N-NO values in the Ob represent groundwater-dominated sources, and the high δ18O-NO values are largely coupled to the δ15N-NO (Fig. 7). This is further evidence for denitrification in the consistently wet conditions of the Ob catchment, preventing significant recycling of the denitrified nitrate and resetting of the δ18O-NO to δ18O-H2O. (Frey and McClelland, 2009). Additionally, the lack of permafrost allows more percolation of groundwater in winter and a greater input of a denitrified signal through deeper lateral subsurface flow. The lower δ15N-NO summer values were consistent with minimally processed atmospheric nitrogen sources, with little denitrified nitrate present, delivered through surface runoff during the spring freshet to the river. However, the lower δ18O-NO values in the summer do not correspond to an influence of an isotopically high atmospheric or snowmelt nitrate source. This could be due to the main stem summer signal being a mix of different sources and recycling occurring (as described previously for the local scale Kolyma catchment). The δ18O-NO values are lower and closer to the δ18O-H2O values of the Ob (14.85 ‰) (Yi et al., 2012), than seen in the Kolyma, suggesting some degree of nitrate recycling that can cause δ18O-NO values to be reset to water values. These values are likely mixed with surface runoff signals from snowmelt (bringing higher δ18O-NO signals) and near surface runoff through topsoil, masking the smaller input of denitrification signals from groundwater.
A regression line between the two likely different sources in the Ob (Fig. 8) shows the dominant source changing throughout the year and main-stem water showing mixing between them. Overall, it is likely that the groundwater-derived signal is present throughout the year as part of a mixed signal but the seasonal variation of dominant sources influences its visibility in the main stem. Surface spring/summer flows dominate and mask the groundwater signal during summer, whereas in winter the subsurface flow is dominant and allows the groundwater and associated denitrified signal to be more clearly observed
The Kolyma seasonal trend is similar to the Ob, except the magnitude of isotopic and concentration change was less (Fig. 7). δ18O-NO was decoupled from the δ15N-NO in the Kolyma, unlike the coupling in the Ob. The continuous permafrost coverage preventing catchment-wide denitrification in the Kolyma along with the observed conversion of DON to nitrate and subsequent recycling could explain the decoupling throughout the year. This decoupling also suggests that nitrate uptake is low, and the small contribution of nitrate due to the high continuous permafrost extent is likely to drive nitrate limitation in this river, despite DON remineralization (Fig. 2). This similar but suppressed trend suggests that the denitrification signal is less influential and was diluted, similar to local-scale observations (Sect. 3.2). The greater coverage of permafrost in the Kolyma catchment compared to the Ob may reduce the seasonal change in nitrogen species signals, especially nitrate (as observed in Fig. 2) by restricting flow paths to minimal contact with mineral horizons and reducing groundwater flow. This can also explain the observed mixing line and the surface source dominance throughout the year shown in Fig. 8.
The local-scale permafrost degradation signals observed from the Yedoma permafrost degradation in the Kolyma may be visible in the seasonal trends due to similar main stem DON and nitrate signals in the early season, possibly assisted by the lack of other nitrate inputs and DON recycling to nitrate. However, it is not possible to observe any permafrost degradation signals in the Ob catchment or to compare trends with previous local-scale findings due to the dominance of the groundwater-derived denitrification signal and different catchment conditions.
3.5.4 Explanations for times series trends in other Arctic rivers
The Mackenzie and Yukon show δ15N-NO trends peaking in the summer months (Fig. 7). This was an opposite trend to the nitrate concentration, and more closely follows the discharge trends. The Yukon had the most prolonged δ15N-NO peak out of all the rivers. Little change in δ15N-DON occurred for the Mackenzie, while for the Yukon it showed variability all year with no clear trends; δ18O-NO was strongly coupled to δ15N-NO for the Mackenzie, but was uncoupled for the Yukon.
In the Mackenzie River, the source signal in the summer months is dominated by runoff, carrying a large DON signal. However, since DON isotopes and concentrations are decoupled from nitrate isotopes and concentrations, the factors influencing both nitrogen species are different. Nitrate is influenced mainly by instream processes (Harms, 2013), due to assimilation or uptake of nitrate by phytoplankton in summer. The smaller isotopic shift between seasons could also signify assimilation rather than denitrification (Struck, 2012). This process would be assisted by the large area of lakes in the Mackenzie catchment where water residence times are increased, allowing extensive primary productivity (Janjua and Tallman, 2015).
The Yukon followed similar trends to the Mackenzie (for δ15N, [NO], [DON]) suggesting uptake in the summer months was also a dominant nitrogen cycling process. Similarly, there is extensive lake cover in the Yukon catchment (Brabets et al., 2000). However, δ18O-NO and δ15N-NO were uncoupled and variable, potentially reflecting different sources of water throughout the year and the extended discharge period providing water involved in nitrate processing with different δ18O-H2O values. These δ18O-H2O trends can be observed in the ArcticGRO database (Holmes et al., 2021)
It was difficult to determine any dominant processes within the Lena and Yenisey due to the lack of nitrate isotopic data and the little seasonal change in δ15N-TDN (DON). However, a unique aspect of these rivers is the very high freshet discharge and the associated high DON concentrations but very low nitrate concentrations. The fact that these large changes in runoff can occur without a change in isotopic DON could suggest that recent topsoil-derived organic matter was the dominant source of nitrogen throughout the year, similar to observations for carbon (Wild et al., 2019).
3.5.5 Implications of findings and possible future changes
Permafrost degradation will have different impacts on riverine nitrogen geochemistry in different catchments across the Arctic. With future permafrost degradation, through both active layer deepening and erosional degradation, the seasonal trends may change from the Kolyma style more towards the Ob style, since the Ob represents a catchment with very little permafrost present. Greater shifts in concentrations and δ15N isotopic signals between seasons would be expected with high δ15N signals in the winter and early spring through denitrification of waterlogged soil but a rapid shift in δ15N with runoff conditions. However, this would depend on other catchment conditions as well as the style and rate of degradation.
As degradation released DON was observed to be converted to nitrate in the main stem of the Kolyma and likely in other rivers, this would increase the amount of bioavailable nitrogen (nitrate is more bioavailable for assimilation than DON) and possibly fuel increased productivity. As observed in the study, this conversion would have the greatest impact in catchments with few other nitrate inputs, e.g. from high continuous permafrost coverage, such as the Kolyma. However, if active layer deepening induces the widespread reduction of continuous permafrost extent in favour of discontinuous coverage, this may allow nitrogen input processes similar to those described for the Ob to dominate over this main stem mineralization of nitrate for the long term.
This study demonstrates that nitrate concentrations may increase the most relative to other nitrogen species and would carry with it a high isotopic signature from denitrification processes. This increase of nitrate is supported by other studies such as Walvoord and Striegl (2007), but not by Frey et al. (2007) who predict an increase in DON, not nitrate. There is ongoing debate over the dominant species likely to be observed.
Irrespective of N species released and the degradation mechanism, nitrogen fluxes are likely to increase with permafrost degradation, causing significant impact to the coastal zones. Any increases in nitrogen loading to coastal Arctic areas will have large impacts on productivity, since these zones are heavily nitrogen-limited (Thibodeau et al., 2017). Currently, productivity peaks over a short period in summer when light is not limiting. However, permafrost degradation and greater nitrogen fluxes may increase the magnitude of these productivity peaks inducing possible algal blooms. Yet, light limitation will still control productivity later in the year. Overall, the cycling of these nitrogen species in coastal zones is essential to understand further to make robust predictions of future change.
Overall, catchment permafrost coverage seems to control main stem nitrate concentrations but not DON, with large extents of continuous permafrost leading to low concentrations of nitrate in Arctic rivers. In local Kolyma degradation sites, Yedoma permafrost degradation was characterized by high DON and nitrate concentrations, high δ15N-DON and δ15N-NO, and very low δ18O-NO. These signatures indicate rapid recycling and exchange between nitrogen pools resulting in the entire system becoming isotopically heavy for nitrogen. Upon release to the main river stem, this signature is greatly diluted, but evidence for recycling of degradation-derived DON to nitrate, transferring the heavy isotopic signature to nitrate, was observed. This DON recycling could be the main source of nitrate in catchments with extensive permafrost coverage and few nitrate inputs. However, these input signals from Yedoma degradation are unlikely to be observed strongly at the river mouth unless degradation zones are more spatially extensive.
δ15N of nitrate, TDN, and DON during summer and spring freshets generally exhibit values around 2 ‰ to 4 ‰, DON dominates the nitrogen export within these rivers in the form of fresh DON-derived from surface runoff through modern, organic rich topsoil. However, Arctic rivers all have different nitrogen dynamics based on their catchment characteristics. The Ob catchment, with its lowest extent of permafrost coverage and extensive peatland area demonstrates a strong denitrification signal, however this cannot be linked to the degradation induced denitrification signal observed in the Kolyma. The Ob isotopic signal is strongly seasonal and influenced by the changing soil flow paths that arise throughout the year. The Kolyma had a similar seasonal trend but with reduced magnitude, and showed evidence of differing processes occurring compared to the Ob, but were similar to local-scale observations. A diluted denitrification signal, DON recycling to nitrate, and low nitrate uptake were all possibly assisted by the lack of other nitrate inputs and high permafrost coverage. In other Arctic river catchments, different factors can mask any fresh permafrost degradation signals. Lacustrine nitrogen assimilation and uptake are dominant in the Mackenzie and seasonal changes in water sources are important for the Yukon catchment, while large freshet discharges in the Lena and Yenisey likely inundate the catchments with runoff-derived nitrogen.
It is possible that with future decreases in catchment permafrost coverage, seasonal nitrogen dynamics in Arctic rivers could begin to resemble that of the Ob catchment. In general, increased fluxes of nitrogen are expected as a result of degradation, which would have impacts on coastal environments and ecosystems as well as in rivers with nitrogen limitation. However, the extent of this is unclear at present. Further studies are required to explore more local-scale and coastal nitrogen cycling and the impacts of permafrost degradation on riverine and coastal environments.
This study shows how nitrogen isotopes can be used to integrate catchment-wide processes in Arctic rivers as well as showcasing small-scale nitrogen dynamics within permafrost degradation zones. Utilizing this technique across further sites in the Arctic will help to further our understanding of current processes and future changes in Arctic nitrogen cycling.
Datasets are available through the BODC data repository via the following link: https://doi.org/10.5285/e777252b-b44a-7978-e053-6c86abc0d89f (Francis et al., 2022).
AF carried out laboratory work and wrote the paper. RSG designed of the study and helped with the interpretation of the data. RET assisted with laboratory work. Both RSG and RET contributed to the writing of the paper. JR and RGMS collected samples from the Kolyma and provided further information on the sites in the lower Kolyma catchment. RMH manages the online Arctic GRO dataset used for this project and made available the ArcticGRO samples. CM led and coordinated the CAO, ARISE project. All authors provided comments on the paper.
The contact author has declared that neither of the authors has any competing interests.
Publisher's note: Copernicus Publications remains neutral with regard to jurisdictional claims in published maps and institutional affiliations.
We thank the ArcticGRO consortia for providing pan-Arctic river samples and datasets. We also extend thanks to the ARISE consortia and the NERC's Changing Arctic Ocean (CAO) programme, particularly Louisa Norman and Antonia Doncila for logistic support. Thanks are also due to Colin Chilcott for isotopic analysis at the University of Edinburgh.
This work resulted from the ARISE project (NE/P006310/1 awarded to RSG), part of the Changing Arctic Ocean programme, jointly funded by the UKRI Natural Environment Research Council (NERC) and the German Federal Ministry of Education and Research (BMBF).
This paper was edited by Perran Cook and reviewed by two anonymous referees.
Amon, R. M. W., Rinehart, A. J., Duan, S., Louchouarn, P., Prokushkin, A., Guggenberger, G., Bauch, D., Stedmon, C., Raymond, P. A., Holmes, R. M., McClelland, J. W., Peterson, B. J., Walker, S. A., and Zhulidov, A. V.: Dissolved organic matter sources in large Arctic rivers, Geochim. Cosmochim. Ac., 94, 217–237, https://doi.org/10.1016/J.GCA.2012.07.015, 2012.
Anisimov, O. and Reneva, S.: Permafrost and changing climate: the Russian perspective, Ambio, 35, 169–175, https://doi.org/10.1579/0044-7447(2006)35[169:pacctr]2.0.co;2, .
Beermann, F., Langer, M., Wetterich, S., Strauss, J., Boike, J., Fiencke, C., Schirrmeister, L., Pfeiffer, E.-M., and Kutzback, L.: Permafrost thaw and liberation of inorganic nitrogen in Eastern Siberia, Permafrost Perigl., 28, 605–618, https://doi.org/10.1002/ppp.1958, 2017.
Berhe, A. A., Harte, J., Harden, J. W., and Torn, M. S.: The Significance of the Erosion-induced Terrestrial Carbon Sink, BioScience, Narnia, 57, 337–346, https://doi.org/10.1641/B570408, 2007.
Botrel, M., Bristow, L. A., Altabet, M. A., Gregory-Eaves, I., and Maranger, R.: Assimilation and nitrification in pelagic waters: insights using dual nitrate stable isotopes (δ15N, δ18O) in a shallow lake, Biogeochemistry, Springer International Publishing, 135, 221–237, https://doi.org/10.1007/s10533-017-0369-y, 2017.
Brabets, T., Wang, B., and Meade, R.: Environmental and Hydrologic Overview of the Yukon River Basin, Alaska and Canada Water-Resources Investigations Report 99-4204, Anchorage, https://pubs.usgs.gov/wri/wri994204/pdf/wri994204.pdf (last access: 4 June 2019), 2000.
Brown, J., Ferrians Jr., O. J., Heginbottom, J. A., and Melnikov, E. S.: Circum-Arctic map of permafrost and ground-ice conditions, Circum-Pacific Map, https://doi.org/10.3133/cp45, 1997.
Buchwald, C. and Casciotti, K. L.: Oxygen isotopic fractionation and exchange during bacterial nitrite oxidation, Limnol. Oceanogr., 55, 1064–1074, https://doi.org/10.4319/lo.2010.55.3.1064, 2010.
Casciotti, K. L., Sigman, D. M., Galanter Hastings, M., Böhlke, J. K., and Kilkert, A.: Measurement of the Oxygen Isotopic Composition of Nitrate in Seawater and Freshwater Using the Denitrifier Method, American Chemical Society, https://doi.org/10.1021/AC020113W, 2002.
Chadburn, S. E., Burke, E. J., Cox, P. M., Friedlingstein, P., Hugelius, G., and Westermann, S.: An observation-based constraint on permafrost loss as a function of global warming, Nat. Clim. Change, 7, 340–344, https://doi.org/10.1038/nclimate3262, 2017.
Drake, T. W., Guillemette, F., Hemingway, J. D., Chanton, J. P., Podgorski, D. C., Zimov, N. S., and Spencer, R. G. M.: The Ephemeral Signature of Permafrost Carbon in an Arctic Fluvial Network, J. Geophys. Res.-Biogeo., 123, 1475–1485, https://doi.org/10.1029/2017JG004311, 2018.
Feng, D., Gleason, C. J., Lin, P., Yang, X., Pan, M., and Ishitsuka, Y.: Recent changes to Arctic river discharge, Nat. Commun., 12, 6917, https://doi.org/10.1038/s41467-021-27228-1, 2021.
Francis, A., Ganeshram, R., Tuerena, R., Spencer, R. G. M., Holmes, R. M., Rogers, J. A., and Mahaffey, C.: Nitrogen isotope measurements from Arctic rivers and permafrost degradation sites, February 2017–September 2018, NERC EDS British Oceanographic Data Centre NOC, [data set], https://doi.org/10.5285/e777252b-b44a-7978-e053-6c86abc0d89f, 2022.
Frey, K. E., McClelland, J. W., Holmes, R. M., and Smith, L. G.: Impacts of climate warming and permafrost thaw on the riverine transport of nitrogen and phosphorus to the Kara Sea, J. Geophys. Res.-Biogeo., 112, 4–58, https://doi.org/10.1029/2006JG0003692, 2007.
Frey, K. E. and McClelland, J. W.: Impacts of permafrost degradation on arctic river biogeochemistry, Hydrol. Proc., 23, 169–182, https://doi.org/10.1002/hyp.7196, 2009.
Frey, K. E. and Smith, L. C.: Amplified carbon release from vast West Siberian peatlands by 2100, Geophys. Res. Lett., 32, L09401, https://doi.org/10.1029/2004GL022025, 2005.
Granger, J., Sigman, D. M., Needoba, J. A., and Harrison, P. J.: Coupled nitrogen and oxygen isotope fractionation of nitrate during assimilation by cultures of marine phytoplankton, Limnol. Oceanogr., 49, 1763–1773, https://doi.org/10.4319/LO.2004.49.5.1763, 2004.
Harms, T. K.: Permafrost thaw and a changing nitrogen cycle, https://www.lter.uaf.edu/sympo/2013/FRI-1045_Harms.pdf (last access: 27 August 2019), 2013.
Hassol, S.: Impacts of a warming Arctic: Arctic Climate Impact Assessment, Cambridge University Press, https://www.amap.no/documents/doc/impacts-of-a-warming-arctic-2004/786 (last access: 22 November 2019), 2004.
Heikoop, J. M., Throckmorton, H. M., Newman, B. D., Perkins, G. B., Iversen, C. M., Roy Chowdhury, T., Romanovsky, V., Graham, D. E., Norby, R. J., Wilson, C. J., and Wullschleger, S. D.: Isotopic identification of soil and permafrost nitrate sources in an Arctic tundra ecosystem, J. Geophys. Res.-Biogeo., 120, 1000–1017, https://doi.org/10.1002/2014JG002883, 2015.
Holmes, R. M., Peterson, B. J., Gordeev, V. v., Zhulidov, A. v., Meybeck, M., Lammers, R. B., and Vörösmarty, C. J.: Flux of nutrients from Russian rivers to the Arctic Ocean: Can we establish a baseline against which to judge future changes?, Water Resour. Res., 36, 2309–2320, https://doi.org/10.1029/2000WR900099, 2000.
Holmes, R. M., McClelland, J. W., Peterson, B. J., Tank, S. E., Bulygina, E., Eglinton, T. I., Gordeev, V. v., Gurtovaya, T. Y., Raymond, P. A., Repeta, D. J., Staples, R., Striegl, R. G., Zhulidov, A. V., and Zimov, S. A.: Seasonal and Annual Fluxes of Nutrients and Organic Matter from Large Rivers to the Arctic Ocean and Surrounding Seas, Estuar. Coasts, 35, 369–382, https://doi.org/10.1007/S12237-011-9386-6, 2012.
Holmes, R. M., McClelland, J. W., Tank, S. E., Spencer, R. G. M., and Shiklomanov, A. I.: Arctic Great Rivers Observatory, Water Quality Dataset, [data set], https://www.arcticgreatrivers.org/data (last access: 25 July 2019), 2021.
Hubberten, H. W., Andreev, A., Astakhov, V. I., Demidov, I., Dowdeswell, J. A., Henriksen, M., Hjort, C., Houmark-Nielsen, M., Jakobsson, M., Kuzmina, S., Larsen, E., Lunkka, J. P., Lyså, A., Mangerud, J., Möller, P., Saarnisto, M., Schirrmeister, L., Sher, A. V., Siegert, C., and Svendsen, J. I.: The periglacial climate and environment in northern Eurasia during the Last Glaciation, Quat. Sci. Rev., 23, 1333–1357, https://doi.org/10.1016/J.QUASCIREV.2003.12.012, 2004.
Hugelius, G., Loisel, J., Chadburn, S., Jackson, R. B., Jones, M., MacDonald, G., Marushchak, M., Olefeldt, D., Packalen, M., Siewert, M. B., Treat, C., Turetsky, M., Voigt, C., and Yu, Z.: Large stocks of peatland carbon and nitrogen are vulnerable to permafrost thaw, P. Natl. Acad. Sci. USA, 117, 20438–20446, https://doi.org/10.1073/PNAS.1916387117, 2020.
Janjua, M. Y. and Tallman, R. F.: A mass-balanced Ecopath model of Great Slave Lake to support an ecosystem approach to fisheries management: Preliminary results, Canadian Technical Report of Fisheries and Aquatic Sciences, Winnipeg, https://pdfs.semanticscholar.org/f34d/8748a5885b2a1b4a50edfbe01f97f4c5dbfe.pdf (last access: 27 August 2019), 2015.
Jones, J. B., Petrone, K. C., Finlay, J. C., Hinzman, L. D., and Bolton, W. R.: Nitrogen loss from watersheds of interior Alaska underlain with discontinuous permafrost, Geophys. Res. Lett., 32, 1–4, https://doi.org/10.1029/2004GL021734, 2005.
Knapp, A. N., Sigman, D. M., and Lipschultz, F.: N isotopic composition of dissolved organic nitrogen and nitrate at the Bermuda Atlantic Time-series Study site, Global Biogeochem. Cy., 19, 1–15, https://doi.org/10.1029/2004GB002320, 2005.
Loranty, M. M., Berner, L. T., Taber, E. D., Kropp, H., Natali, S. M., Alexander, H. D., Davydov, S. P., and Zimov, N. S.: Understory vegetation mediates permafrost active layer dynamics and carbon dioxide fluxes in open-canopy larch forests of northeastern Siberia, PLOS ONE, 13, e0194014, https://doi.org/10.1371/JOURNAL.PONE.0194014, 2018.
McLean, R., Oswood, M. W., Irons III, J. G., and McDowell, W. H.: The effect of permafrost on stream biogeochemistry: A case study of two streams in the Alaskan (U.S.A.) taiga, Biogeochemistry, 47, 237–265, https://doi.org/10.1023/A:1006142604714, 1999.
Mann, P. J., Davydova, A., Zimov, N., Spencer, R. G. M., Davydov, S., Bulygina, E., Zimov, S., and Holmes, R. M.: Controls on the composition and lability of dissolved organic matter in Siberia's Kolyma River basin, J. Geophys. Res.-Biogeo., 117, 1028, https://doi.org/10.1029/2011JG001798, 2012.
Mariotti, A., Germon, J. C., Hubert, P., Kaiser, P., Letolle, R., Tardieux, A., and Tardieux, P.: Experimental determination of nitrogen kinetic isotope fractionation: Some principles; illustration for the denitrification and nitrification processes, Plant Soil, 62, 413–430, https://doi.org/10.1007/BF02374138, 1981.
McClelland, J. W., Déry, S. J., Peterson, B. J., Holmes, R. M., and Wood, E. F.: A pan-arctic evaluation of changes in river discharge during the latter half of the 20th century, Geophys. Res. Lett., 33, 1–4, https://doi.org/10.1029/2006GL025753, 2006.
McCrackin, M. L., Harrison, J. A., and Compton, J. E.: Factors influencing export of dissolved inorganic nitrogen by major rivers: A new, seasonal, spatially explicit, global model, Global Biogeochem. Cy., 28, 269–285, https://doi.org/10.1002/2013GB004723, 2014.
McIlvin, M. R. and Casciotti, K. L.: Technical Updates to the Bacterial Method for Nitrate Isotopic Analyses, Anal. Chem., 83, 1850–1856, https://doi.org/10.1021/ac1028984, 2011.
Nelson, F. E., Shiklomanov, N. I., Mueller, G. R., Hinkel, K. M., Walker, D. A., and Bockheim, J. G.: Estimating active-layer thickness over a large region: Kuparuk river basin, Alaska, U.S.A, Arctic Alpine Res., 29, 367–378, https://doi.org/10.2307/1551985, 1997.
NOAA: Next Steps in Arctic Governance, Council of Councils, https://councilofcouncils.cfr.org/global-memos/next-steps-arctic-governance (last access: 5 September 2019), 2014.
NSIDC: Climate and Frozen Ground – National Snow and Ice Data Center, https://nsidc.org/cryosphere/frozenground/climate.html, (last access: 5 September 2019), 2018.
O'Donnell, J. A., Aiken, G. R., Swanson, D. K., Panda, S., Butler, K. D., and Baltensperger, A. P.: Dissolved organic matter composition of Arctic rivers: Linking permafrost and parent material to riverine carbon, Global Biogeochem. Cy., 30, 1811–1826, https://doi.org/10.1002/2016GB005482, 2016.
Peterson, B. J., Holmes, R. M., McClelland, J. W., Vörösmarty, C. J., Lammers, R. B., Shiklomanov, A. I., Shiklomanov, I. A., and Rahmstorf, S.: Increasing river discharge to the Arctic Ocean, Science, 298, 2171–2173, https://doi.org/10.1126/SCIENCE.1077445, 2002.
Repo, M. E., Susiluoto, S., Lind, S. E., Jokinen, S., Elsakov, V., Biasi, C., Virtanen, T., and Martikainen, P. J.: LargeN2O emissions from cryoturbated peat soil in tundra, Nat. Geosci., 2, 189–192, https://doi.org/10.1038/ngeo434, 2009.
Schirrmeister, L., Kunitsky, V., Grosse, G., Wetterich, S., Meyer, H., Schwamborn, G., Babiy, O., Derevyagin, A., and Siegert, C.: Sedimentary characteristics and origin of the Late Pleistocene Ice Complex on north-east Siberian Arctic coastal lowlands and islands – A review, Quat. Int., 241, 3–25, https://doi.org/10.1016/J.QUAINT.2010.04.004, 2011.
Schuur, E. A. G., Bockheim, J., Canadell, J. G., Euskirchen, E., Field, C. B., Goryachkin, S. V., Hagemann, S., Kuhry, P., Lafleur, P. M., Lee, H., Mazhitova, G., Nelson, F. E., Rinke, A., Romanovsky, V. E., Shiklomanov, N., Tarnocai, C., Venevsky, S., Vogel, J. G., and Zimov, S. A.: Vulnerability of Permafrost Carbon to Climate Change: Implications for the Global Carbon Cycle, BioScience, 58, 701–714, https://doi.org/10.1641/B580807, 2008.
Schuur, E. A. G., Vogel, J. G., Crummer, K. G., Lee, H., Sickman, J. O., and Osterkamp, T. E.: The effect of permafrost thaw on old carbon release and net carbon exchange from tundra, Nature, 459, 556–559, https://doi.org/10.1038/nature08031, 2009.
Shiklomanov, A. I., Yakovleva, T. I., Lammers, R. B., Karasev, I. Ph., Vörösmarty, C. J., and Linder, E.: Cold region river discharge uncertainty-estimates from large Russian rivers, J. Hydrol., 326, 231–256, https://doi.org/10.1016/j.jhydrol.2005.10.037, 2006.
Sigman, D. M., Casciotti, K. L., Andreani, M., Barford, C., Galanter, M., and Böhlke, J. K.: A bacterial method for the nitrogen isotopic analysis of nitrate in seawater and freshwater, Anal. Chem., 73, 4145–4153, https://doi.org/10.1021/AC010088E, 2001.
Sigman, D. M., Granger, J., DiFiore, P. J., Lehmann, M. M., Ho, R., Cane, G., and van Geen, A.: Coupled nitrogen and oxygen isotope measurements of nitrate along the eastern North Pacific margin, Global Biogeochem. Cy., 19, 1–14, https://doi.org/10.1029/2005GB002458, 2005.
Sigman, D. M., DiFiore, P. J., Hain, M. P., Deutsch, C., Wang, Y., Karl, D. M., Knapp, A. N., Lehmann, M. F., and Pantoja, S.: The dual isotopes of deep nitrate as a constraint on the cycle and budget of oceanic fixed nitrogen, Deep Sea Res. Pt. I, 56, 1419–1439, https://doi.org/10.1016/J.DSR.2009.04.007, 2009.
Sigman, D. M. and Casciotti, K. L.: Nitrogen Isotopes In The Ocean, Enc. Ocean Sci., 2001, 1884–1894, https://doi.org/10.1006/rwos.2001.0172, 2001.
Sipler, R. E. and Bronk, D. A.: Dynamics of Dissolved Organic Nitrogen, Biogeochemistry of Marine Dissolved Organic Matter, Academic Press, 127–232, https://doi.org/10.1016/B978-0-12-405940-5.00004-2, 2015.
Spencer, R. G. M., Mann, P. J., Dittmar, T., Eglinton, T. I., McIntyre, C., Holmes, R. M., Zimov, N., and Stubbins, A.: Detecting the signature of permafrost thaw in Arctic rivers, Geophys. Res. Lett., 42, 2830–2835, https://doi.org/10.1002/2015GL063498, 2015.
Streletskiy, D., Anisimov, O., and Vasiliev, A.: Permafrost Degradation, Snow and Ice-Related Hazards, Risks Disast., 10, 303–344, 2015.
Struck, U.: On The Use of Stable Nitrogen Isotopes in Present and Past Anoxic Environments, edited by: Altenbach, A., Bernhard, J., and Seckbach, J., Anoxia, Cellular Origin, Life in Extreme Habitats and Astrobiology, 21, Springer, 497–513, Dordrecht, 2012 https://doi.org/10.1007/978-94-007-1896-8_26, 2012.
Swart, P., Evans, S. and Capo, T.: The Origin of Nitrogen Isotope Values in Algae, Miami, https://floridadep.gov/rcp/coral/documents/lbsp-project-32a-origin-nitrogen-isotope-values-algae (last access: 18 September 2019), 2008.
Tank, S. E., Manizza, M., Holmes, R. M., McClelland, J. W., and Peterson, B. J.: The Processing and Impact of Dissolved Riverine Nitrogen in the Arctic Ocean, Estuar. Coasts, 35, 401–415, https://doi.org/10.1007/S12237-011-9417-3, 2012.
Thibodeau, B., Miyajima, T., Tayasu, I., Wyatt, A. S. J., Watanabe, A.: Morimoto, N., Yoshimizu, C., and Nagata, T., Heterogeneous dissolved organic nitrogen supply over a coral reef: First evidence from nitrogen stable isotope ratios, Coral Reefs, 32, 1103–1110, https://doi.org/10.1007/S00338-013-1070-9, 2013.
Thibodeau, B., Bauch, D., and Voss, M.: Nitrogen dynamic in Eurasian coastal Arctic ecosystem: Insight from nitrogen isotope, Global Biogeochem. Cy., 31, 836–849, https://doi.org/10.1002/2016GB005593, 2017.
Tye, A. M. and Heaton, T. H. E.: Chemical and isotopic characteristics of weathering and nitrogen release in non-glacial drainage waters on Arctic tundra, Geochim. Cosmochim. Ac., 71, 4188–4205, https://doi.org/10.1016/j.gca.2007.06.040, 2007.
UNFCCC: Adoption of the Paris Agreement, https://unfccc.int/resource/docs/2015/cop21/eng/l09r01.pdf (last access: 2 September 2019), 2015.
Vasil'chuk, Y. K., Vasil'chuk, A. C., Rank, D., Kutschera, W., and Kim, J. C.: Radiocarbon Dating of δ18O-δD Plots in Late Pleistocene Ice-Wedges of the Duvanny Yar (Lower Kolyma River, Northern Yakutia), Radiocarbon, 43, 541–553, https://doi.org/10.1017/S0033822200041199, 2001.
Van Everdingen, R. O.: Multi-language glossary of permafrost and related ground-ice terms: in Chinese, English, French, German, Icelandic, Italian, Norwegian, Polish, Romanian, Russian, Spanish, and Swedish, Calgary: Arctic Institute of North America, 1, p. 78, https://globalcryospherewatch.org/reference/glossary_docs/Glossary_of_Permafrost_and_Ground-Ice_IPA_2005.pdf (last access: 28 October 2022), 1998.
Voigt, C., Marushchak, M. E., Lamprecht, R. E., Jackowicz-Korczyński, M., Lindgren, A., Mastepanov, M., Granlund, L., Christensen, T. R., Tahvanainen, T., Martikainen, P. J., and Biasi, C.: Increased nitrous oxide emissions from Arctic peatlands after permafrost thaw, P. Natl. Acad. Sci. USA, 114, 6238–6243, https://doi.org/10.1073/PNAS.1702902114, 2017.
Vonk, J. E., Sanchez-Garca, L., van Dongen, B. E., Alling, V., Kosmach, D., Charkin, A., Semiletov, I. P., Dudarev, O. v., Shakhova, N., Roos, P., Eglinton, T. I., Andersson, A., and Gustafsson, A.: Activation of old carbon by erosion of coastal and subsea permafrost in Arctic Siberia, Nature 489, 137–140, https://doi.org/10.1038/nature11392, 2012.
Vonk, J. E., Mann, P. J., Dowdy, K. L., Davydova, A., Davydov, S. P., Zimov, N., Spencer, R. G. M., Bulygina, E. B., Eglinton, T. I., and Holmes, R. M.: Dissolved organic carbon loss from Yedoma permafrost amplified by ice wedge thaw, Environ. Res. Lett., 8, 035023, https://doi.org/10.1088/1748-9326/8/3/035023, 2013.
Vonk, J. E., Mann, P. J., Davydov, S., Davydova, A., Spencer, R. G. M., Schade, J., Sobczak, W. V., Zimov, N., Zimov, S., Bulygina, E., Eglinton, T. I., and Holmes, R. M.: High biolability of ancient permafrost carbon upon thaw, Geophys. Res. Lett., 40, 2689–2693, https://doi.org/10.1002/GRL.50348, 2013.
Walvoord, M. A. and Striegl, R. G.: Increased groundwater to stream discharge from permafrost thawing in the Yukon River basin: Potential impacts on lateral export of carbon and nitrogen, Geophys. Res. Lett., 34, L12402, https://doi.org/10.1029/2007GL030216, 2007.
Wankel, S. D., Kendall, C., Pennington, J. T., Chavez, F. P., Paytan, A., Wankel, C.:, Kendall, C., Pennington, J. T., Chavez, F. P., and Paytan, A.: Nitrification in the euphotic zone as evidenced by nitrate dual isotopic composition: Observations from Monterey Bay, California, Global Biogeochem. Cy., 21, GB2009, https://doi.org/10.1029/2006GB002723, 2007.
Weigand, M. A., Foriel, J., Barnett, B., Oleynik, S., and Sigman, D. M.: Updates to instrumentation and protocols for isotopic analysis of nitrate by the denitrifier method, Rapid Commun. Mass Spec., 30, 1365–1383, https://doi.org/10.1002/RCM.7570, 2016.
Wild, B., Andersson, A., Bröder, L., Vonk, J., Hugelius, G., McClelland, J. W., Song, W., Raymond, P. A., and Gustafsson, Ö.: Rivers across the Siberian Arctic unearth the patterns of carbon release from thawing permafrost, P. Natl. Acad. Sci. USA, 116, 10280–10285, https://doi.org/10.1073/PNAS.1811797116, 2019.
Yi, Y., Gibson, J. J., Cooper, L. W., Hélie, J. F., Birks, S. J., McClelland, J. W., Holmes, R. M., and Peterson, B. J.: Isotopic signals (18O, 2H, 3H) of six major rivers draining the pan-Arctic watershed, Global Biogeochem. Cy., 26, GB1027, https://doi.org/10.1029/2011GB004159, 2012.