the Creative Commons Attribution 4.0 License.
the Creative Commons Attribution 4.0 License.
 | 15 Sep 2023
Technical note: Skirt chamber – an open dynamic method for the rapid and minimally intrusive measurement of greenhouse gas emissions from peatlands
Brenda Riquelme
Andrés Gómez
Roy Mackenzie
Francisco Javier Aguirre
Jorge Hoyos-Santillan
Ricardo Rozzi
Armando Sepulveda-Jauregui
We present a reliable and robust open dynamic chamber for measuring greenhouse gas exchange in peatlands with minimal disturbance of the ground. This chamber, called the “skirt chamber”, is based on a transparent plastic film placed above an open frame made of sparse interwoven wires and expanded around the base of the chamber below a steel chain that ensures contact to the ground, avoiding damage, trenching, and cutting vegetation. Gas exchange is determined using a portable gas analyzer from a mass balance in which the imperfect sealing of the chamber to the ground is quantified through the injection of a methane pulse. The method was tested on a pristine peatland dominated by Sphagnum magellanicum located on Navarino Island in the subantarctic Magellanic ecoregion in Chile. Our results indicate that the skirt chamber allowed the determination of methane fluxes and ecosystem respiration in about 20 min, with a limit of detection of 0.185 mg CH4 m−2 h−1 and 173 mg CO2 m−2 h−1, respectively. We conclude that the skirt chamber is a minimally intrusive, fast, portable, and inexpensive method that allows the quantification of greenhouse gas emissions with high spatial resolution in remote locations and without delay.
- Article
(2059 KB) - Full-text XML
- Companion paper
-
Supplement
(784 KB) - BibTeX
- EndNote


Peatlands are a major component of the global carbon cycle and are the largest carbon reservoir in the biosphere (Yu et al., 2011). These ecosystems hold ≈ 644 Gt of carbon (GtC) over 3.99×10⁸ ha (Leifeld and Menichetti, 2018). For that reason, peatlands have gained relevance as a potential nature-based solution (NbS) to help address global warming (Griscom et al., 2017; UNEP, 2019). At present, peatlands act globally as carbon sinks, sequestering 0.1 GtC yr−1 (Frolking et al., 2011). However, peatlands are also among the largest greenhouse gas emitters to the atmosphere (IPCC, 2021), including carbon dioxide (CO2), as a product of ecosystem respiration and methane (CH4), produced through anaerobic processes. Consequently, peatlands can behave as carbon sinks or net sources through time at different timescales (e.g., diurnal, seasonal, decadal, millennial) and spatial scales (i.e., site, watershed, region) (Ding et al., 2004; Günther et al., 2014; Cobb et al., 2017; Swails et al., 2021). The shift from sink to net source, or vice versa, depends on different factors (e.g., climatic conditions, hydrology, anthropogenic impacts) (Leifeld and Menichetti, 2018; Günther et al., 2020; Page et al., 2022). Thus, under the current context of global climate change and accelerated land use change, it is important to accurately assess whether peatlands behave as carbon sinks or net sources, and for that reason it is necessary to improve the temporal and spatial resolution when measuring greenhouse gas emissions in these ecosystems (Lawson et al., 2014).
In peatlands, greenhouse gas exchanges with the atmosphere are currently determined using aboveground and ground-based methods. Aboveground methods are mostly based on the eddy covariance (EC) techniques (Aubinet et al., 2012). Ground-based methods consist of chambers placed on the surface of the terrain, which allow the quantification of greenhouse gas fluxes at specific locations of the ecosystem. Ground-based methods involve either a discrete sampling and measurement of the chamber's headspace or continuous monitoring of the chamber's headspace with a gas analyzer. The use of automatic chambers that open and close at predetermined intervals has allowed the temporal resolution to be increased (Pavelka et al., 2018). However, chamber methods also present several drawbacks; for example, the increase or decrease in the gas concentration within the chamber headspace has a direct impact on the concentration gradient between the ground and the chamber headspace, ultimately altering the flux (Kutzbach et al., 2007; Juszczak, 2013; Pirk et al., 2016; Limpert et al., 2020). Another potential drawback is that the chambers sometimes do not include a fan to homogenize the air, causing local gradients, which modify the measured fluxes, underestimating them by at least one-third (Christiansen et al., 2011; Juszczak, 2013; Pavelka et al., 2018). More importantly, chambers are required to be sealed well to avoid gas exchange between the atmosphere and the chamber headspace. To avoid leakiness, chambers are usually installed on a collar driven several centimeters into the ground, sometimes combined with a water-filled groove.
The use of collars presents additional drawbacks, especially in peatlands characterized by uneven terrain and a dense vegetation rug. First, the collar installation implies some disturbance of the ecosystem, such as cutting the vegetation around the collar to allow its penetration into the ground. This procedure creates a trenching effect that must be considered in measurement protocols (Järveoja et al., 2020). Thus, after collar installation, it is a common practice to wait between 24 and 48 h before starting flux measurements. A collateral impact of the collar strategy is that, due to the delay in measurement, it significantly limits the number of locations where flux can be measured in each experimental time frame, thus limiting both the temporal and spatial resolution of the studies, particularly in remote areas. Second, chamber installation would generally be preferred in relatively flat and even terrain over sloped or uneven ground, thus involving a bias selection of the locations where fluxes are measured. Third, automatic chambers are relatively expensive; thus most of the studies involving them use a few simultaneous chambers operated over days to weeks. This strategy offers an excellent temporal resolution but a relatively poor spatial resolution that could potentially lead to pseudoreplication, i.e., replicates not statistically independent.
To elude the former drawbacks, half a century ago, Edwards and Sollins (1973) suggested a new concept for a chamber through which a known carrier gas flows continuously. The gas concentration is measured at the outlet of the chamber, and the flux is determined after resolving a mass balance equation that involves all inputs and outputs of the chamber. According to Livingston and Hutchinson's classification (Livingston and Hutchinson, 1995), that concept corresponds to a steady-state through-flow chamber, called an “open dynamic chamber” (ODC), in contrast to standard static and dynamic chambers, which are non-steady-state chambers. The advantages of ODCs include a limited gas concentration buildup in the chamber and the continuous measurement of flux over the deployment time. More importantly, ODC measurements are not affected by leaks, as far as the carrier gas composition and flow are precisely known (see Sect. 2.1 for details). Thus, ODCs have the potential to elude the strict requirement of hermetic sealing and, therefore, to avoid disturbances and measurement delay caused by collar installation. Furthermore, the carrier gas of standard ODCs could be substituted by the natural air exchange caused by imperfect sealing of the chamber exposed to wind, as far as the flow rate of the air exchange is known. The substitution of a carrier gas for the quantification of the gas exchange with the environment would allow the use of heavy gas cylinders to be avoided, advantageous for the rapid deployment of a simple, low-cost chamber able to quantify greenhouse gas emission or capture by simply positioning the chamber on the surface of the peatland without penetration into the ground. This chamber could then be placed on any surface independently of the vegetation cover, slope, or terrain unevenness.
The objective of this study was to present the test concept of a modified ODC, hereinafter called the “skirt chamber”, referring to the plastic skirt that is used to make contact with the ground. We tested the skirt-chamber design in the laboratory and in a peatland dominated by Sphagnum magellanicum on Navarino Island (55∘ S), in the sub-Antarctic Magellanic ecoregion of Chile, characterized by an oceanic climate (Rozzi et al., 2012). Our research focused on evaluating the capacity of the skirt chamber to measure CH4 and CO2 net emissions and capture, as well as the respiration rates of the ecosystem with different vegetation covers and terrain. In addition, one of our main goals was to develop a reliable and robust tool that was easy to operate and transport to remote areas, where data on the gas exchange between peatlands and the atmosphere are limited.
2.1 Skirt chamber
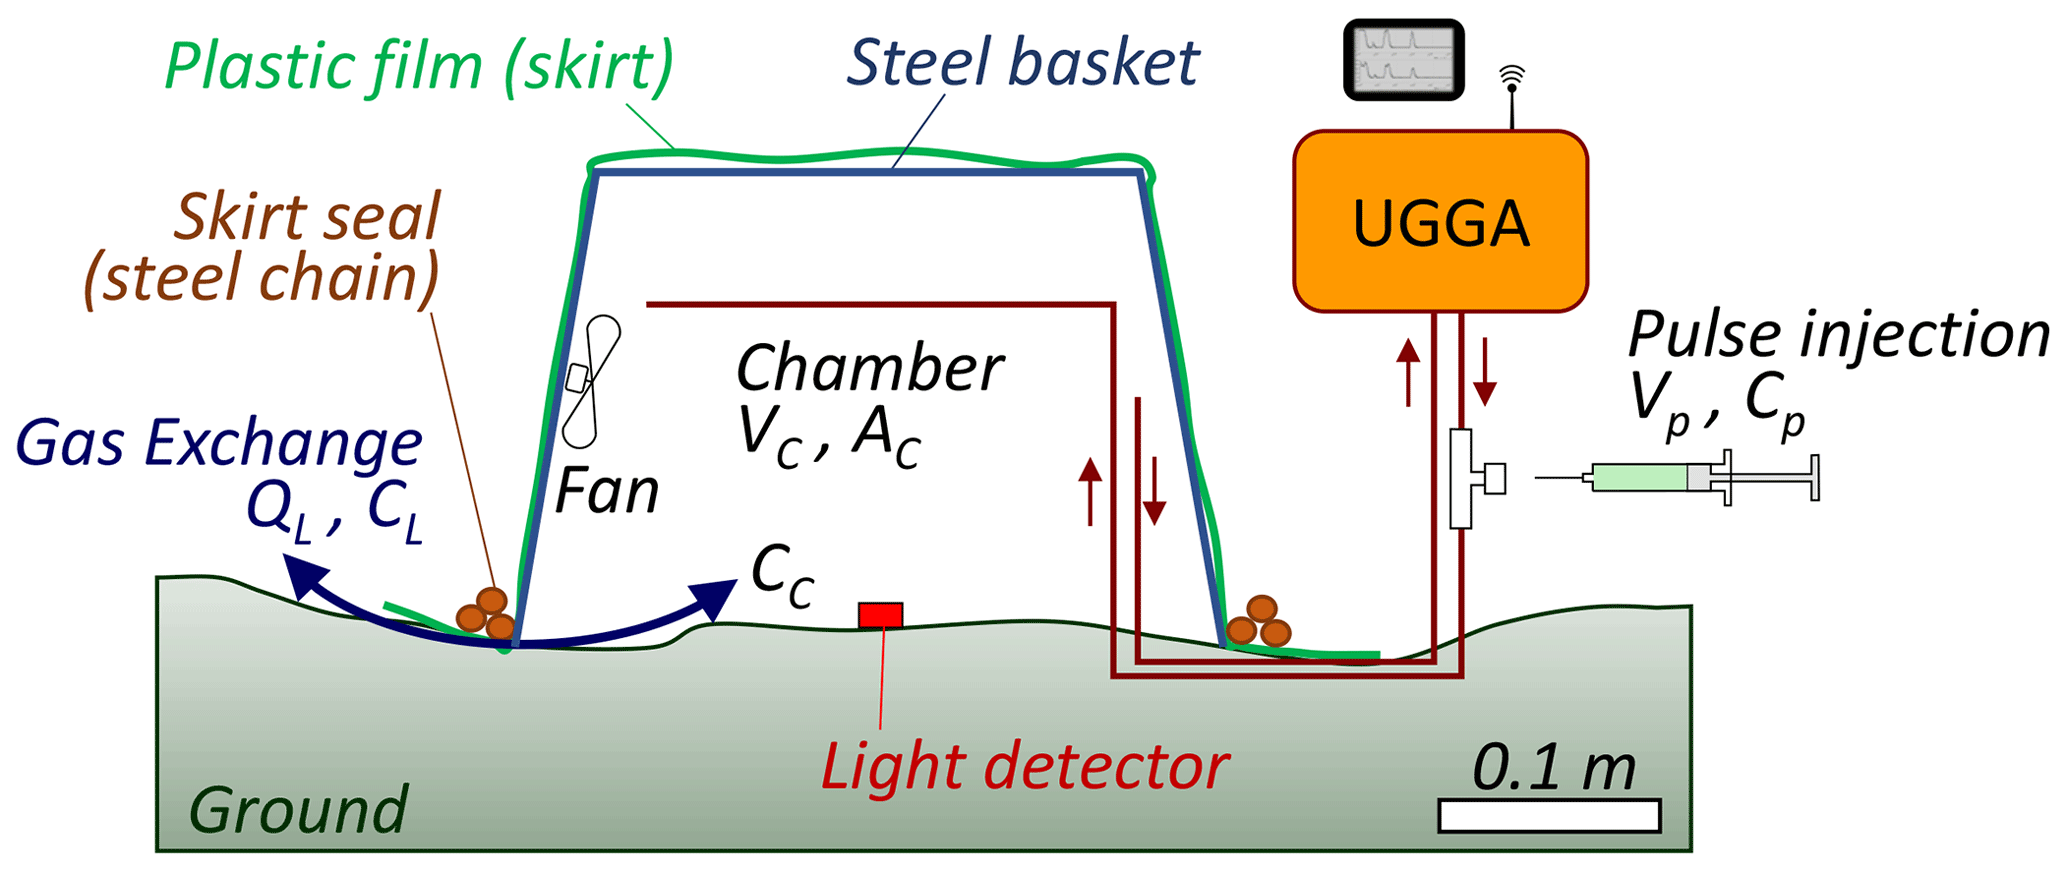
The skirt chamber (Fig. 1; details provided in Sect. 2.3) consists of an open frame made of sparse interwoven steel wires, whose purpose is to support a transparent plastic film and define the chamber's volume while allowing light penetration. On top of the frame (installed on the ground, facing down), the plastic film is expanded over the frame and fixed at its base. When installing the chamber on the ground, the plastic film is expanded on the ground around the chamber, and a steel chain is placed above it, wrapping around the base of the chamber three times, to ensure that the plastic film is in contact with the ground. Thus, this design creates a fixed-volume chamber, opened at the bottom and in contact with the ground. Inside the chamber, a fan is placed to homogenize the air content. Inlet and outlet ports are fixed on opposite sides of the frame and connected, in a recirculation mode, to an ultraportable laser greenhouse analyzer (i.e., UGGA, Model 915-0011-1000, Los Gatos Inc., San Jose, CA, USA).
The gas mass balance of the skirt chamber can be described by Eqs. (1)–(3):
where CC is the gas concentration inside the chamber (mg m−3); F is the flux between the chamber and the ground (mg m−2 h−1); AC is the area of the chamber in contact with the ground (m2); VC is the chamber volume (m3); QL is the flow rate of the gas exchange between the chamber and the exterior, caused by the imperfect seal between the chamber and the ground (m3 h−1); and CL is the gas concentration outside the chamber at ground level.
The term QL/VC is the dilution rate caused by the gas exchange between the chamber and the environment (Eqs. 2 and 3), which is the inverse of the mean gas residence time in the chamber (θC), in such a manner that Eq. (3) becomes
At equilibrium, i.e., concentration not changing over time, equals zero, and the concentration of the gas in the chamber can be considered to be the constant CB (baseline concentration). Under these conditions, Eq. (4) becomes
Thus, as VC and AC are known, F can be determined during chamber deployment from the measurement of CL, CB, and θC.
θC can be determined in the field through the injection of a gas pulse within the chamber. Under these conditions, the steady state is lost, and by substitution of F (Eq. 5) in Eq. (4), we obtain Eq. (6):
Since CB is a constant, under fixed experimental conditions, Eq. (6) can be rewritten as follows:
After integration over time t, we obtain
where CC,t and CC,0 are the gas concentration within the chamber at time t and shortly after the injection of a gas pulse, respectively. Equation (8) describes how, after a gas pulse has been injected, CC returns asymptotically to the equilibrium concentration CB. Thus, the injection of a gas pulse allows θC to be determined, which can then be used to estimate F by using Eq. (5).
In these mass balance equations, it is important to stress that, during field operation with varying wind speed and irradiance, it is not a strict requirement for CB, CC, and θC to remain absolutely stable or fixed. Instead, they can fluctuate around a mean or average value as long as no significant trend or change over time is observed. Thus, it is crucial that each measurement step is sustained for several minutes to allow for the determination of mean values, as is done in the present work. More details and the step-by-step field methodology are described in Sect. 2.3.
2.2 Study site and campaign
The selected study site (54.9396∘ S, 67.6419∘ W) is a 46 000 m2 peatland, locally called “Omora peatland” in reference to the Omora Ethnobotanical Park (Rozzi et al., 2006) where it is located, 2 km west of Puerto Williams, on the northern coast of Navarino Island. This peatland has also been previously called “Caleta Robalo” in a detailed study of the late-Quaternary vegetation and climate (Heusser et al., 1989). In that study, the age of the peatland was established to be a maximum of 13 ka. This ombrotrophic elevated peatland is dominated by Sphagnum magellanicum, with a hummocky topography covered by irregular patches of Empetrum rubrum, Gaultheria spp., Marsippospermum grandiflorum, Tetroncium magellanicum, Polytrichum spp., and shrubby Antarctic beech (Nothofagus antarctica). Also, several lichen species common to the Magellanic moorland complex cover the peatland extensively, such as Pseudocyphellaria spp., Cladonia spp., and Ochrolechia spp. In some locations, apparent black peat was observed without a living Sphagnum cover. The depth of the peat layer was measured from 3–10 m, and the section where measurements were made was characterized by a depth of 8 ± 1 m. The peatland was not flooded, but the water table was close to the surface, i.e., 0.1–0.6 m. The water table depth was manually measured using a groundwater monitoring well, which consisted of plastic 2 in. perforated tubing installed 2 d before our measurements in close vicinity to our measurement site. The height of each measurement point, relative to the water table, was determined using a water level hose. The campaign took place from 3–24 March 2022, which corresponds to the end of the summer season and to a month with relatively warm temperatures and high precipitation levels (Fig. S2). To minimize the impact of operators on the superficial peatland structure, operators used snowshoes, and each measurement spot was marked prior to measurements with a plastic ring of the same size as the chamber to avoid stepping over the location.
2.3 Chamber design and flux measurements
The chamber was a pyramidal trunk basket with a base (opening) of 0.32 × 0.29 m and a height of 0.22 m (Model 47970, Spectrum, Mexico). Above the chamber, we positioned a low-density polyethylene film (1.4 × 1.4 m, 0.025 mm thick, Frost King, Mexico). The plastic film was adjusted and fixed to the chamber's bottom (Fig. S1). The chamber was equipped with a battery-operated fan (portable fan, Cazokasi, Mexico), which was fixed to a lateral face of the chamber (opposite side from the sun) and operated at an airflow speed of about 1.2 m s−1. Inside the chamber, a light/temperature data logger was installed at ground level (MX2202, Hobo, MA, USA), and a second one was installed on the top of the chamber. Data loggers recorded visible light intensity in lux. Inside the chamber, two pieces of 6 mm external diameter (4 mm internal diameter) flexible polyurethane tubing (PUN-6X1-DUO-BS, Festo, Mexico) were fixed to opposite faces of the basket, at about two-thirds of the chamber's height, passed from below the edge of the chamber and connected to the UGGA. The UGGA measured CH4 and CO2 concentration at 1 Hz frequency. When fluxes were measured, the chamber was placed face down; the plastic skirt was expanded around the chamber; and a steel chain (0.27 kg m−1) was placed above the plastic film, wrapped around the base of the chamber three times to ensure that the plastic film was in contact with the ground. At the end of each experiment, a dark screen was placed above the chamber to measure CO2 flux in the absence of light (respiration from soil and plants).
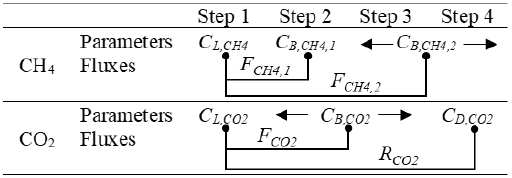
Each flux measurement involved a four-step protocol (Table 1).
-
Step 1. The ground air concentration (CL) of CH4 () and CO2 () was measured for 5 min, just above the vegetation cover (where the chamber was placed).
-
Step 2. The chamber was positioned on the ground and, once steady state was reached, CB of CH4 () and CO2 () was measured over a 5 min period. It should be noted that, after pulse injection (third step), a second was determined. Thus determined during this step was renamed .
-
Step 3. A pulse of 1 mL of standard CH4 (99.99 %, Linde, Chile) was injected once with a plastic syringe through a septum connected to the waste line of the UGGA (returning to the chamber). It is worth noting that, to avoid the use of a heavy gas cylinder, the CH4 used for pulses was contained in small 0.12 L serological bottles, which were used several times before being replaced. The decreasing section of CH4 concentration was used to calibrate Eq. (8) and to determine θC and , the latter in this case being . This step was maintained for 5 to 7 min until a stable was observed. It should also be noted that, as we show in the “Results and discussion” section, the pulse injection (i.e., step 3) had no effect on the CO2 concentration within the chamber. Thus, could be determined over the entire period of steps 2 and 3.
-
Step 4. A dark screen was placed on the chamber for 5 min to measure CO2 flux in the absence of light (respiration). This new CO2 steady-state concentration was called , where D stands for dark conditions. As we show in the “Results and discussion” section, the dark screen had no apparent effect on the CH4 concentration within the chamber. Therefore, could be determined throughout steps 3 and 4 (Table 1).
The four-step experimental strategy allowed the determination of three key CH4 concentrations (, and ) that were used to determine two equivalent CH4 fluxes (FCH4,1 and ; Eq. 5, Table 1). Similarly, three key CO2 concentrations (, and ) were determined, providing one CO2 flux and one respiration rate ( and , respectively) using Eq. (5) in both cases.
At the end of each measurement, before removing the chamber, plastic rulers were placed around the base of the chamber to mark the covered area. A photograph was taken and used to identify the extent of the area covered by the major plant species where fluxes were measured. These scaled photographs were analyzed using the Fiji software (Schindelin et al., 2012). The cover percentage of each individual species or group of species was determined using the freehand selection tool.
Table 1Experimental strategy, parameters, and fluxes determined (see text for details).
2.4 Calibration and laboratory experiments
The chamber volume was experimentally checked in the laboratory (no wind) and on a flat surface, which minimizes leakage. Pulses of known volumes of CH4 were injected, and the concentration in the chamber was measured. The concentration curve was modeled well using the Levenspiel equation (Levenspiel, 1999) for two continuous stirred-tank reactors in series (Eq. 9).
where Ct is the concentration at time t, and Cp is the initial pulse concentration within the chamber, which is equal to the mass of CH4 injected during the pulse (Mp) divided by VC. In Eq. (9), Cp and θ were the adjustment parameters calibrated numerically (Sect. 2.5).
In each experiment, in both the laboratory and field, the area covered by the skirt chamber was determined from a scaled photograph of the chamber taken from above, assuming that the perimeter of the chain used to keep the skirt in contact with the ground defines the area. The scaled photographs were treated using ImageJ (v. 1.8.0_172).
The skirt-chamber method was validated in the field, i.e., on uneven terrain and exposed to wind. With that purpose, triplicate/quadruplicate pulses of six known CH4 masses (Mp) were injected into the chamber. The mass of CH4 detected to exceed the baseline was determined through integration (Eq. 10) and compared to the mass injected. An equivalency between the mass of CH4 injected and the mass detected would indicate that the mass balance of the chamber is correct and that any amount of gas reaching the chamber is correctly appraised.
2.5 Data treatment and statistical analysis
Equations (8), (9), and (10) were calibrated to experimental data using a generalized reduced gradient (GRG) nonlinear tool and minimizing the root mean square error (RMSE) between experimental data and models. To estimate uncertainties in flux determinations (based on Eq. 5), we considered the uncertainties linked to the measurements of the gas concentration at ground level (σCL) and of the baseline concentration (σCB) using a propagation-of-error approach (Eq. 11), where σF is the standard deviation of the flux determination.
In order to estimate the temporal and spatial variability in flux measurements on different days and locations, we used the mean coefficient of variation (CV), which is defined as the ratio of the standard deviation to the mean. When comparing fluxes measured with different methods and their corresponding CV, data were Log10-transformed to fulfill the normality condition assessed by the Shapiro–Wilk test. Then, we identified significant differences among variables using an independent-sample t test with p<0.05. Model calibrations and statistical analyses were performed with Origin(Pro) (Version 2016, OriginLab Corporation, Northhampton, MA, USA). Regarding the limit of detection (LOD) of the skirt-chamber method, we used the typical arbitrary limit of a minimal signal of at least 3 times the standard deviation, thus corresponding to a CV below 33 %. Measurements obtained with a higher CV were considered uncertain.
3.1 Performance of the skirt chamber
An example of chamber deployment in the field and the corresponding data obtained at a location where high emission was observed are shown in Fig. 2. During step 1, before chamber deployment, the CH4 and CO2 concentrations at ground level, i.e., and , respectively, were registered. Immediately after chamber deployment (step 2), an increase in CH4 concentration was standardly observed at a new level , which is an indicator of CH4 emissions. In contrast, the CO2 concentration decreased to a level , often below , which is an indication of CO2 capture. In step 3, as expected, the injection of a CH4 pulse caused a sudden increase in CH4 concentration, followed by an asymptotic and slow return to the baseline level . Then, the use of a dark screen (step 4) caused an increase in the CO2 concentration at , above , which is a manifestation of respiration without photosynthetic uptake. Notably, it was observed that the CH4 pulse injection during step 3 had no effect on the CO2 concentration, and conversely, the dark screen installed during step 4 had no effect on CH4 concentration, in such a manner that to improve the quality of our data, was determined using data from steps 3 and 4, while was determined with data from steps 2 and 3 (Table 1).
3.2 Calibration and method validation
In general, after pulse injections, Eq. (8) fit the experimental data and over 130 measurements well; the mean coefficient of determination (R2) value between the model and the experimental data was 0.987 ± 0.055 (mean ± σ), suggesting that the skirt chamber acted as a continuously stirred-tank reactor. Overall, θC was estimated to be 30.74 ± 22.70 s during the entire field campaign. Keeping in mind that , the equivalent gas flow rate exchange between the chamber and the environment (leak flow rate) was 0.67 ± 0.49 L s−1. The variations in θC observed over the entire field campaign were likely influenced by weather conditions, particularly wind variations, as well as the variable ground surface with different plant covers and, consequently, different permeabilities (see Table S2). By comparison, during laboratory testing, over a flat surface and under no-wind conditions, θC was estimated to be 327.13 ± 11.24 s (n=5), which corresponded to an exchange flow rate of 0.063 ± 0.002 L s−1, i.e., 10 times lower than in the field. These results suggest that the design of the skirt chamber, simply placed on top of the vegetation rug and under non-flooded conditions, promoted a large air exchange with the environment, probably due to wind flushing the interwoven stems, leaves, and roots, at the surface of the peatland and beneath the plastic skirt. This was the subject of a report from Lai et al. (2012), who stressed the importance of wind effects, and might be a potential advantage of the skirt chamber compared to standard chambers using collars, where wind effects are impeded.
During field deployment, a set of validation experiments were performed through the injection of triplicate/quadruplicate CH4 samples at six distinct concentrations. In each case, and θC were estimated through Eq. (8), and then the mass of CH4 detected in the skirt chamber (Mp) was estimated using Eq. (10). The results obtained are presented in Fig. 3, showing that R2 was 0.997, and the slope of the mass of CH4 detected vs. the mass injected was 0.977. The equivalency between the mass of CH4 injected and detected indicates first that the mass of CH4 injected was recovered without being lost due to diffusion into the ground. Indeed, it is essential to note that the transitory and artificial increase in CC after pulse injection has the potential to modify the concentration gradient between the chamber and the soil, as previously suggested (Kutzbach et al., 2007; Juszczak, 2013), and to promote CH4 diffusion from the chamber to the soil, leading to potential biases in θC determination. The consistency between the mass of CH4 injected and detected also suggests that the mass balance of the skirt chamber (Eq. 3) correctly describes the behavior of the skirt chamber and that any amount of gas reaching the chamber is correctly accounted for, validating the method.
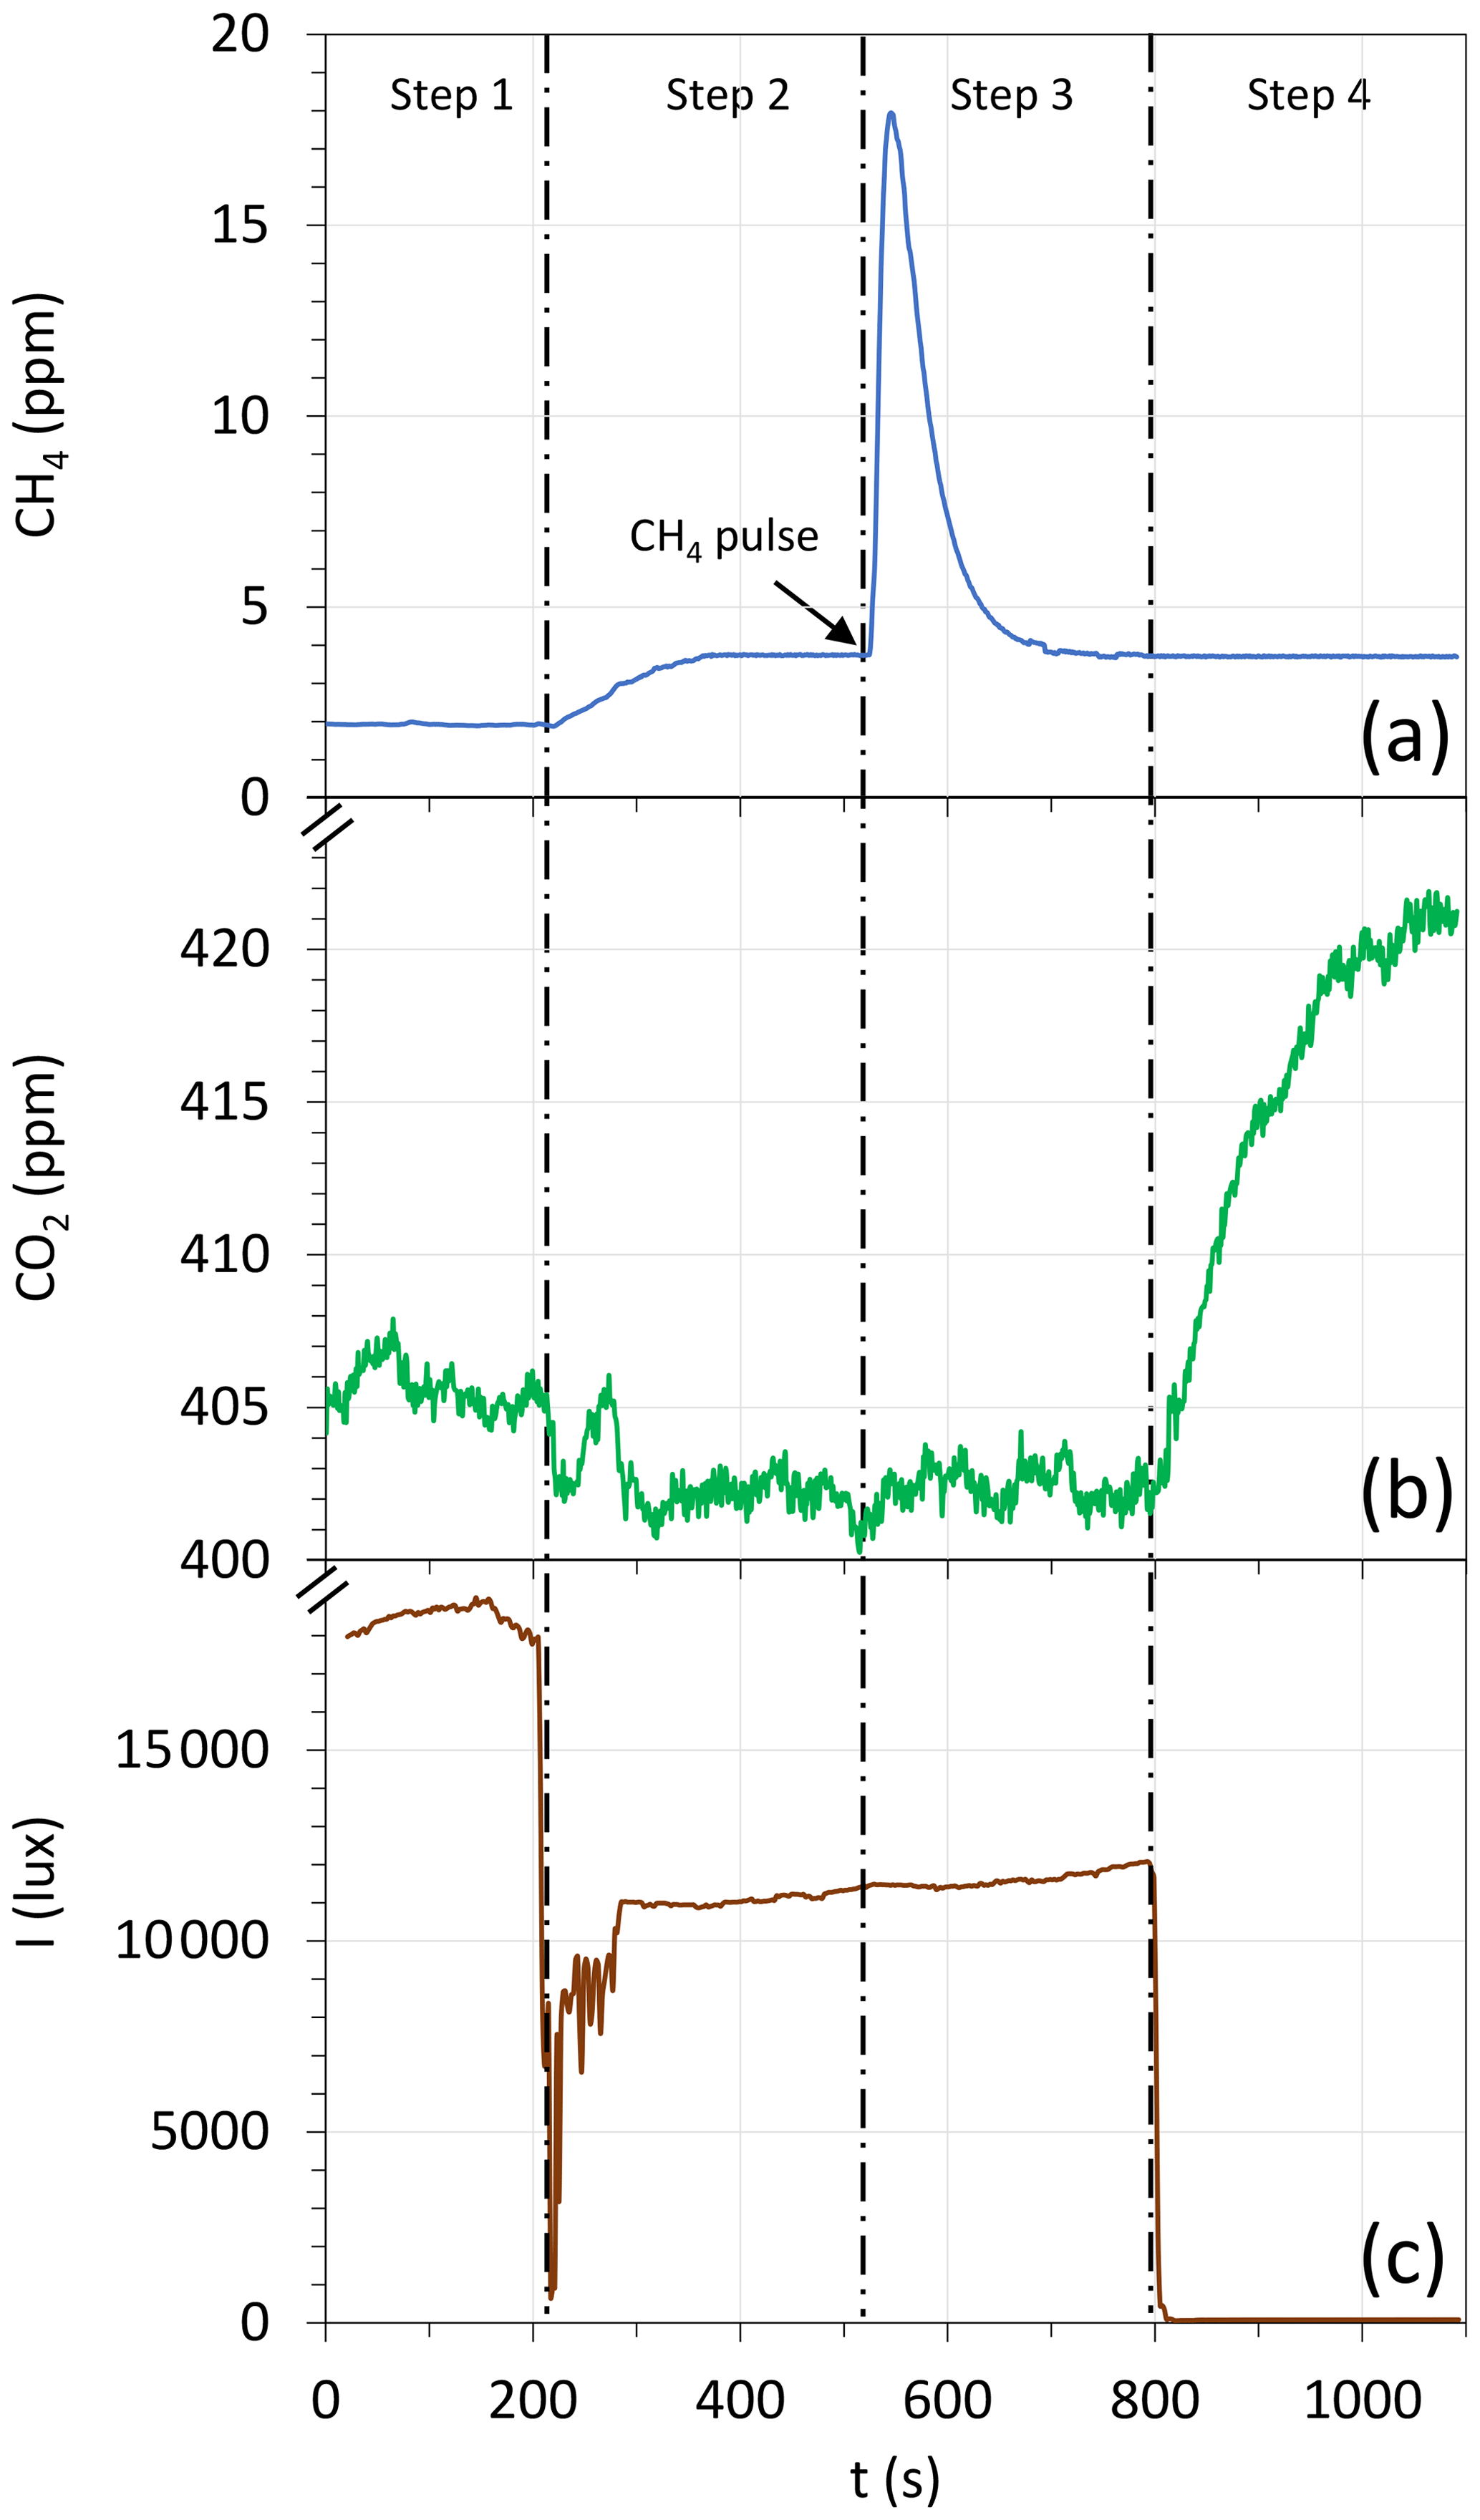
Figure 2Example of data obtained during a chamber deployment. (a) CH4 concentration, (b) CO2 concentration, and (c) visible light irradiance. See text for a complete description of the four steps.
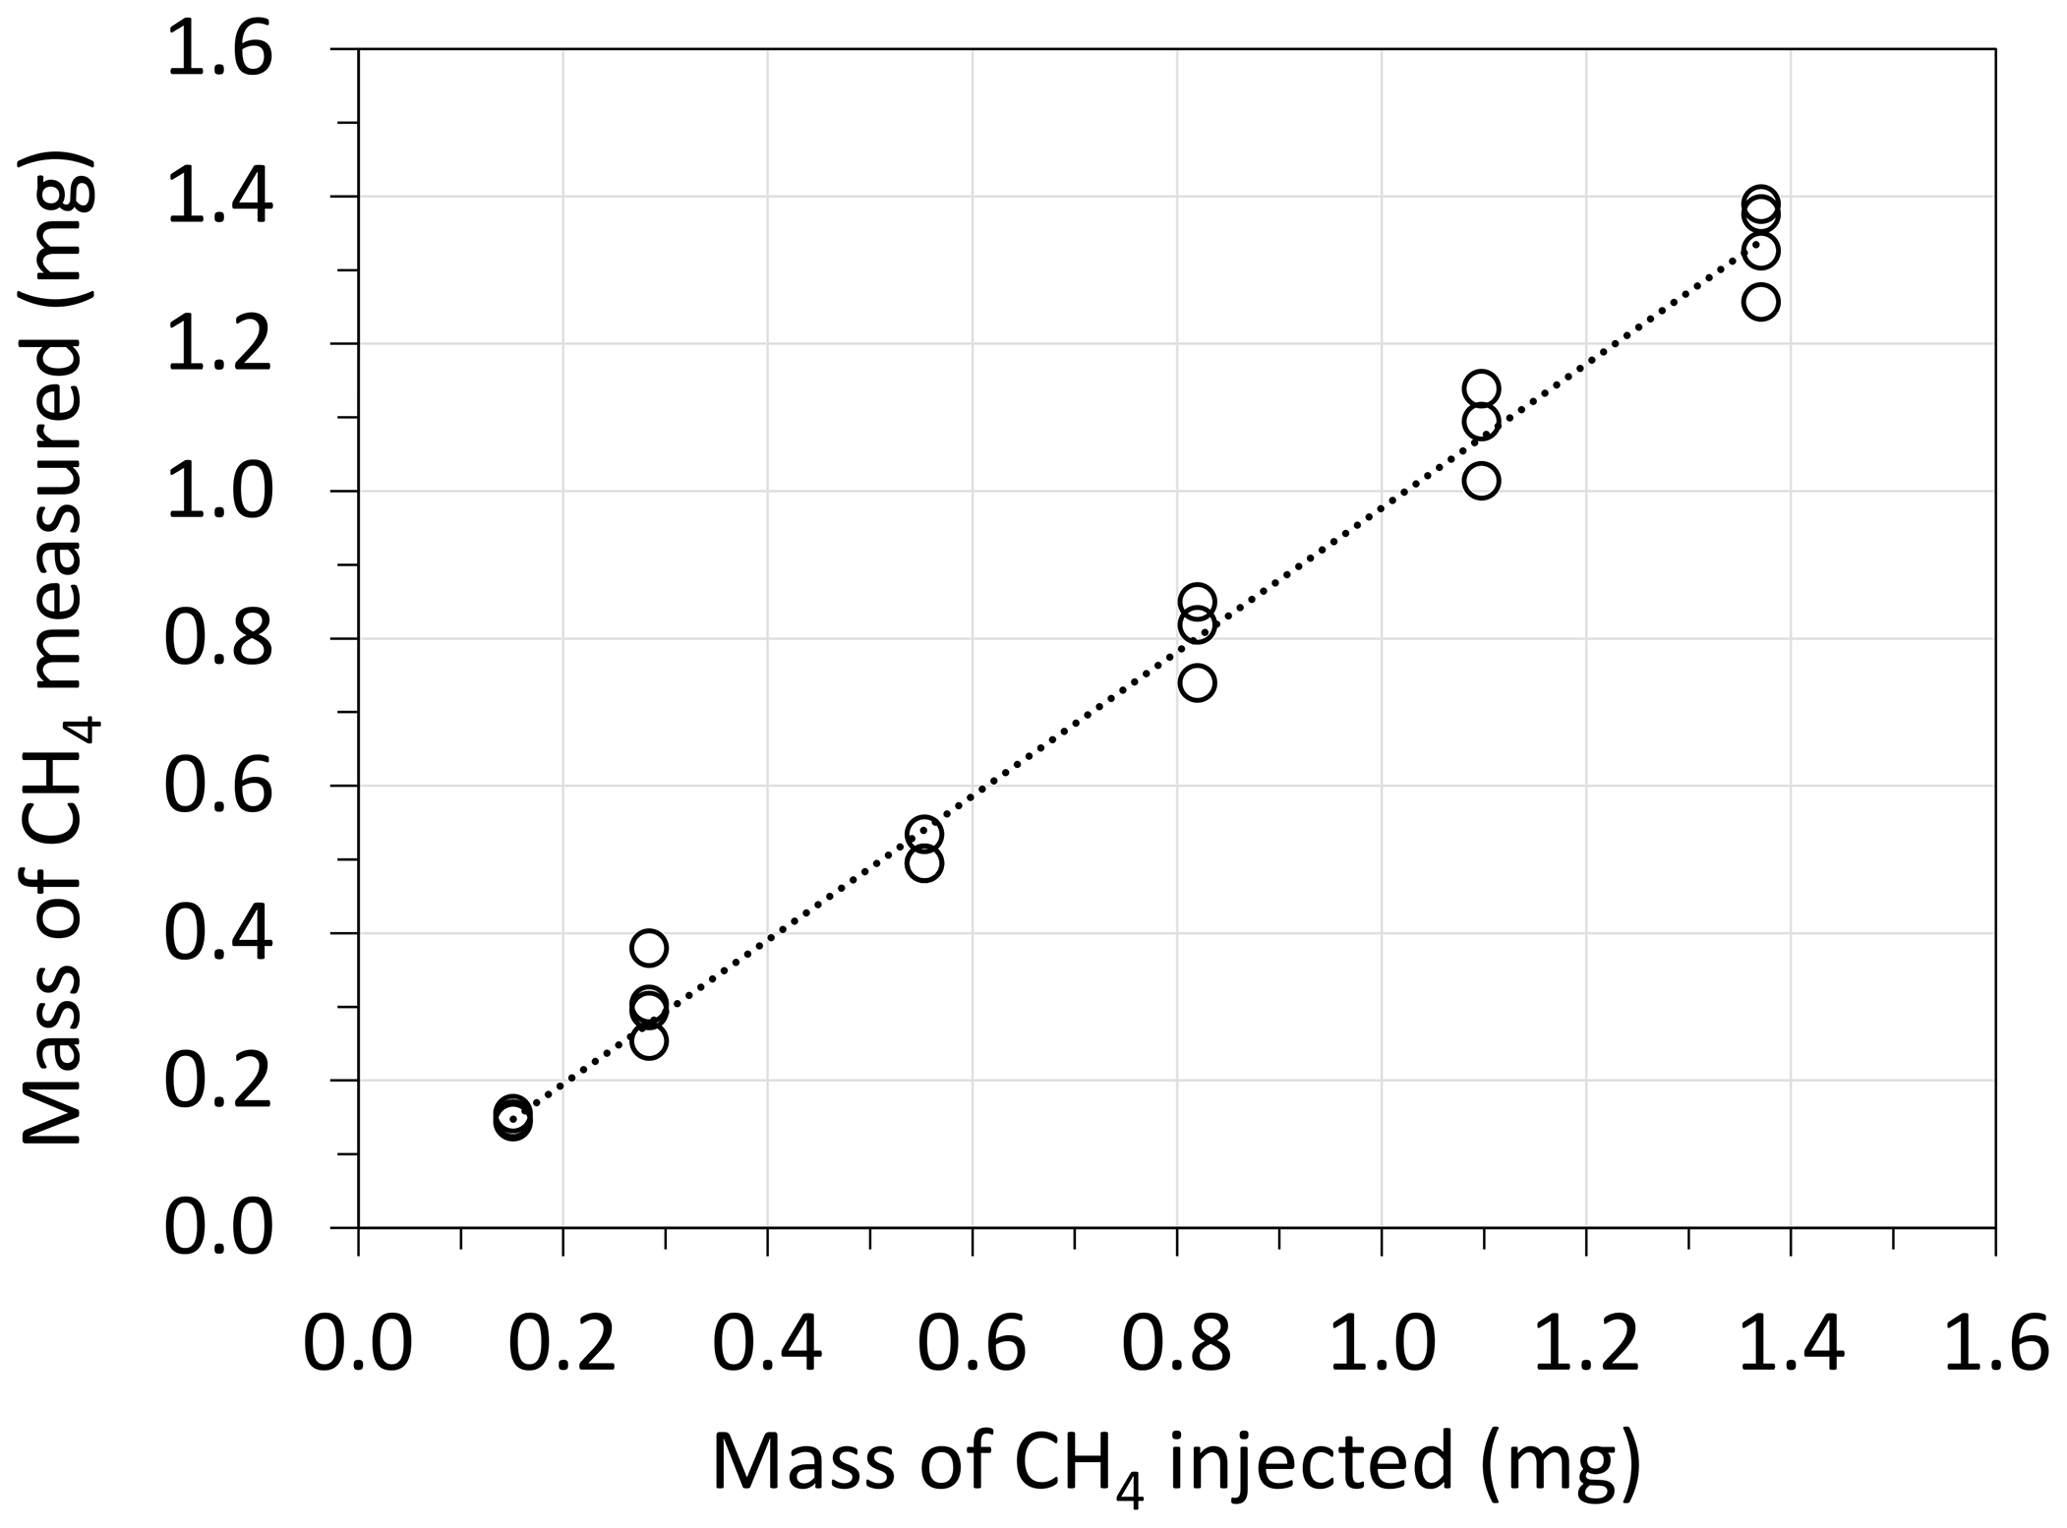
Figure 3Validation of the skirt chamber through the injection of CH4 pulses at different concentrations and determination of the mass of CH4 detected in the chamber. Replicate measurements indicate a mean CV of 7.1 ± 5.0 %.
3.3 CH4 emission
As previously mentioned, Eq. (5), used to determine CH4 flux, can be applied to and to determine or alternatively and to determine . We observed that was subject to large variations, with a mean CV of 171 ± 370 %, over 130 measurements. Contrastingly, was characterized by a mean CV of 30 ± 38 %. We hypothesize that the large difference in CV between and was due to two factors. First, was determined during step 2, shortly after positioning the chamber, while was determined during step 3, at least 5 min after the chamber was installed. Second, was determined from a shorter period of time (3 to 4 min), while was determined from a longer period, i.e., periods 3 and 4, lasting 8 to 9 min. From these results, only is considered hereafter.
To evaluate the repeatability of our measurements, five measurements of were done over a short period of time (< 1.5 h) at two locations where relatively high and low emissions were observed. At the relatively high-emission hotspots, was 17.10 ± 1.77 mg m−2 h−1 (CV 10.3 %), while at the relatively low-emission spot, was 1.20 ± 0.89 mg m−2 h−1 (CV 74.6 %). Repeatability within a longer time frame was also evaluated with measurements at 16 locations divided into 4 transects of 3 m, thus separated by about 1 m. These measurements were repeated on three occasions, i.e., 2 and 12 d after the first measurement (Table 2). During these measurements, we observed that the temporal variation (same locations on different days) was characterized by a mean CV of 59 ± 21 %, while the mean CV of spatial variation (different locations on the same day) was 220 ± 34 %. In particular, it was observed that the CH4 hotspots, i.e., the 3 locations among the 16 measured where the higher fluxes were observed, did not change over time. These results suggest that the spatial variation was higher than temporal variation and that the skirt chamber successfully detected hotspots on repeated occasions.
Table 2 (mg m−2 h−1) measured at 16 locations divided into 4 transects on 3 occasions, i.e., at t=0, 2, and 12 d.
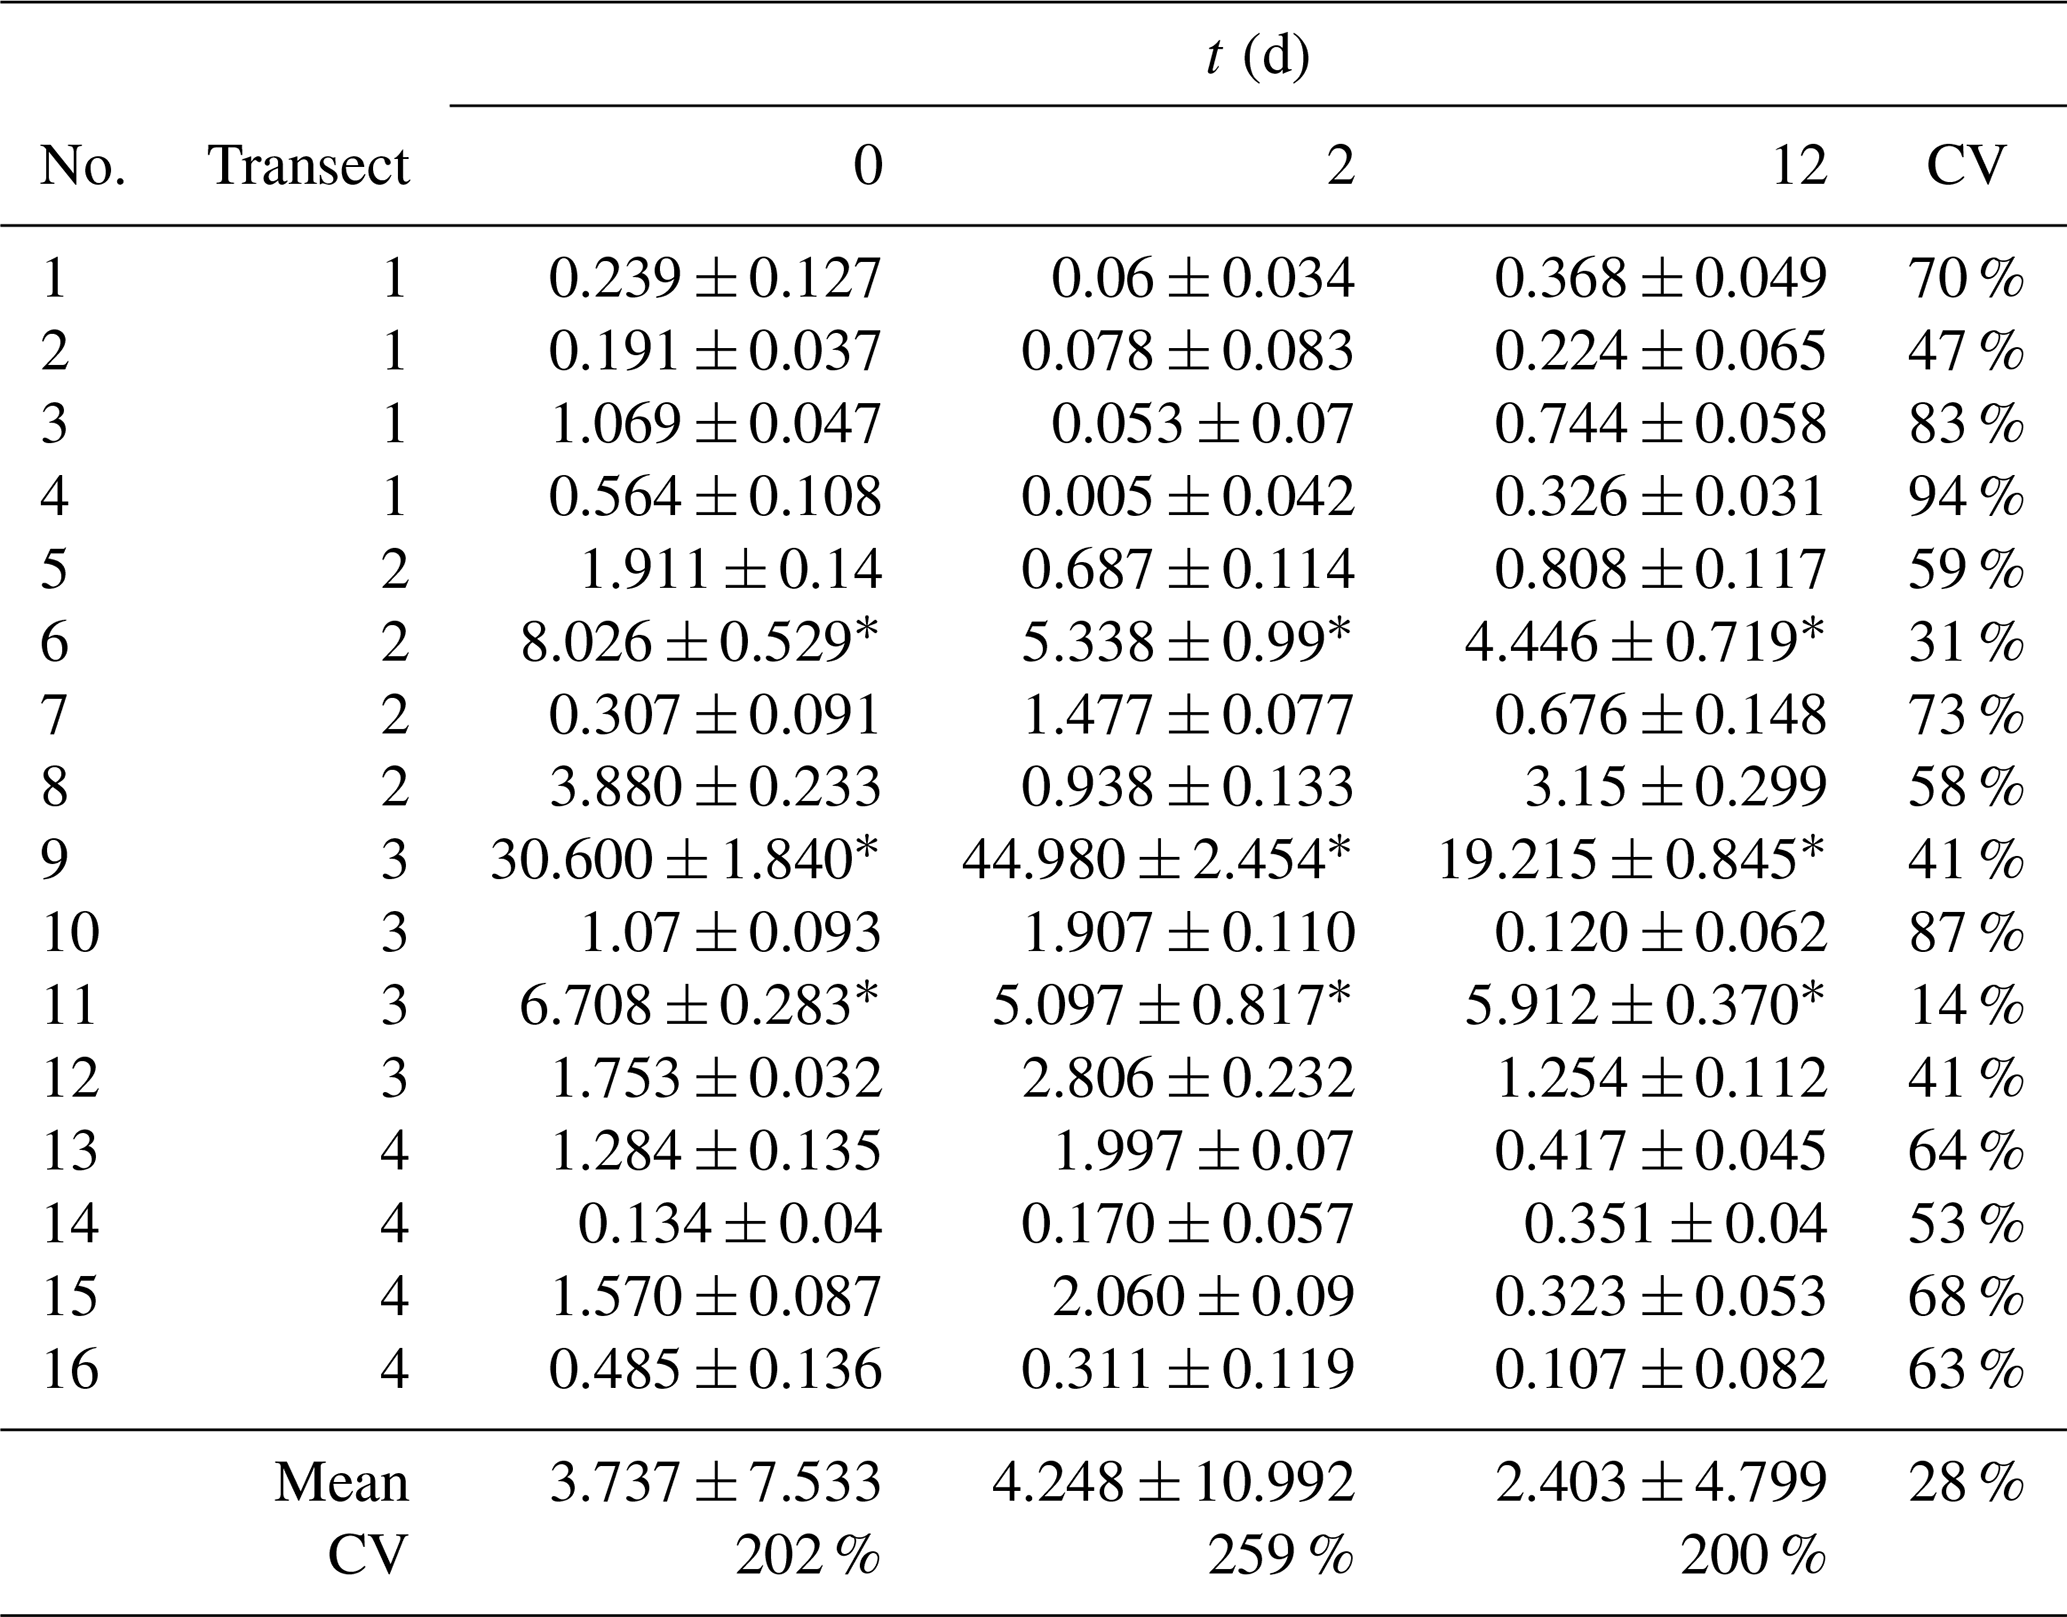
* Hotspots.
The error in determination was evaluated through CV (Eq. 11, Fig. 4a). As flux is determined from the difference between CL and CB, the smaller that difference is, the smaller the flux and the larger the impact of measurement noise will be. Overall, CV ranged from 1 % to 207 %, with a mean of 30 ± 38 % and obviously larger CVs for lower fluxes. It is worth noting that large errors in low-flux measurements would have relatively little impact on the mean emission that would be attributed to a peatland, particularly if it includes hotspots. For instance, in the set of 16 measurements (Table 2), the three locations with the larger emissions represented 76 %–82 % of the total emission. Thus, the remaining 18 %–24 % of the emissions were distributed among 13 relatively low-emission spots, for which a measurement error has a low specific weight. To illustrate the latter, based on our complete dataset (130 measurements), we determined how the variation in each measurement propagates to the mean emission of the complete dataset (; Fig. 4b). Clearly, although hotspots are characterized by a lower CV, they have a much larger impact on the mean emission compared to low-emission spots. Hotspots must therefore be the object of closer attention when determining the mean emission of a peatland. As is discussed in Sect. 3.6, this is a potential strength of the skirt chamber because it allows the number of locations that can be characterized in a given time frame to be multiplied, offering a higher probability of detecting hotspots.
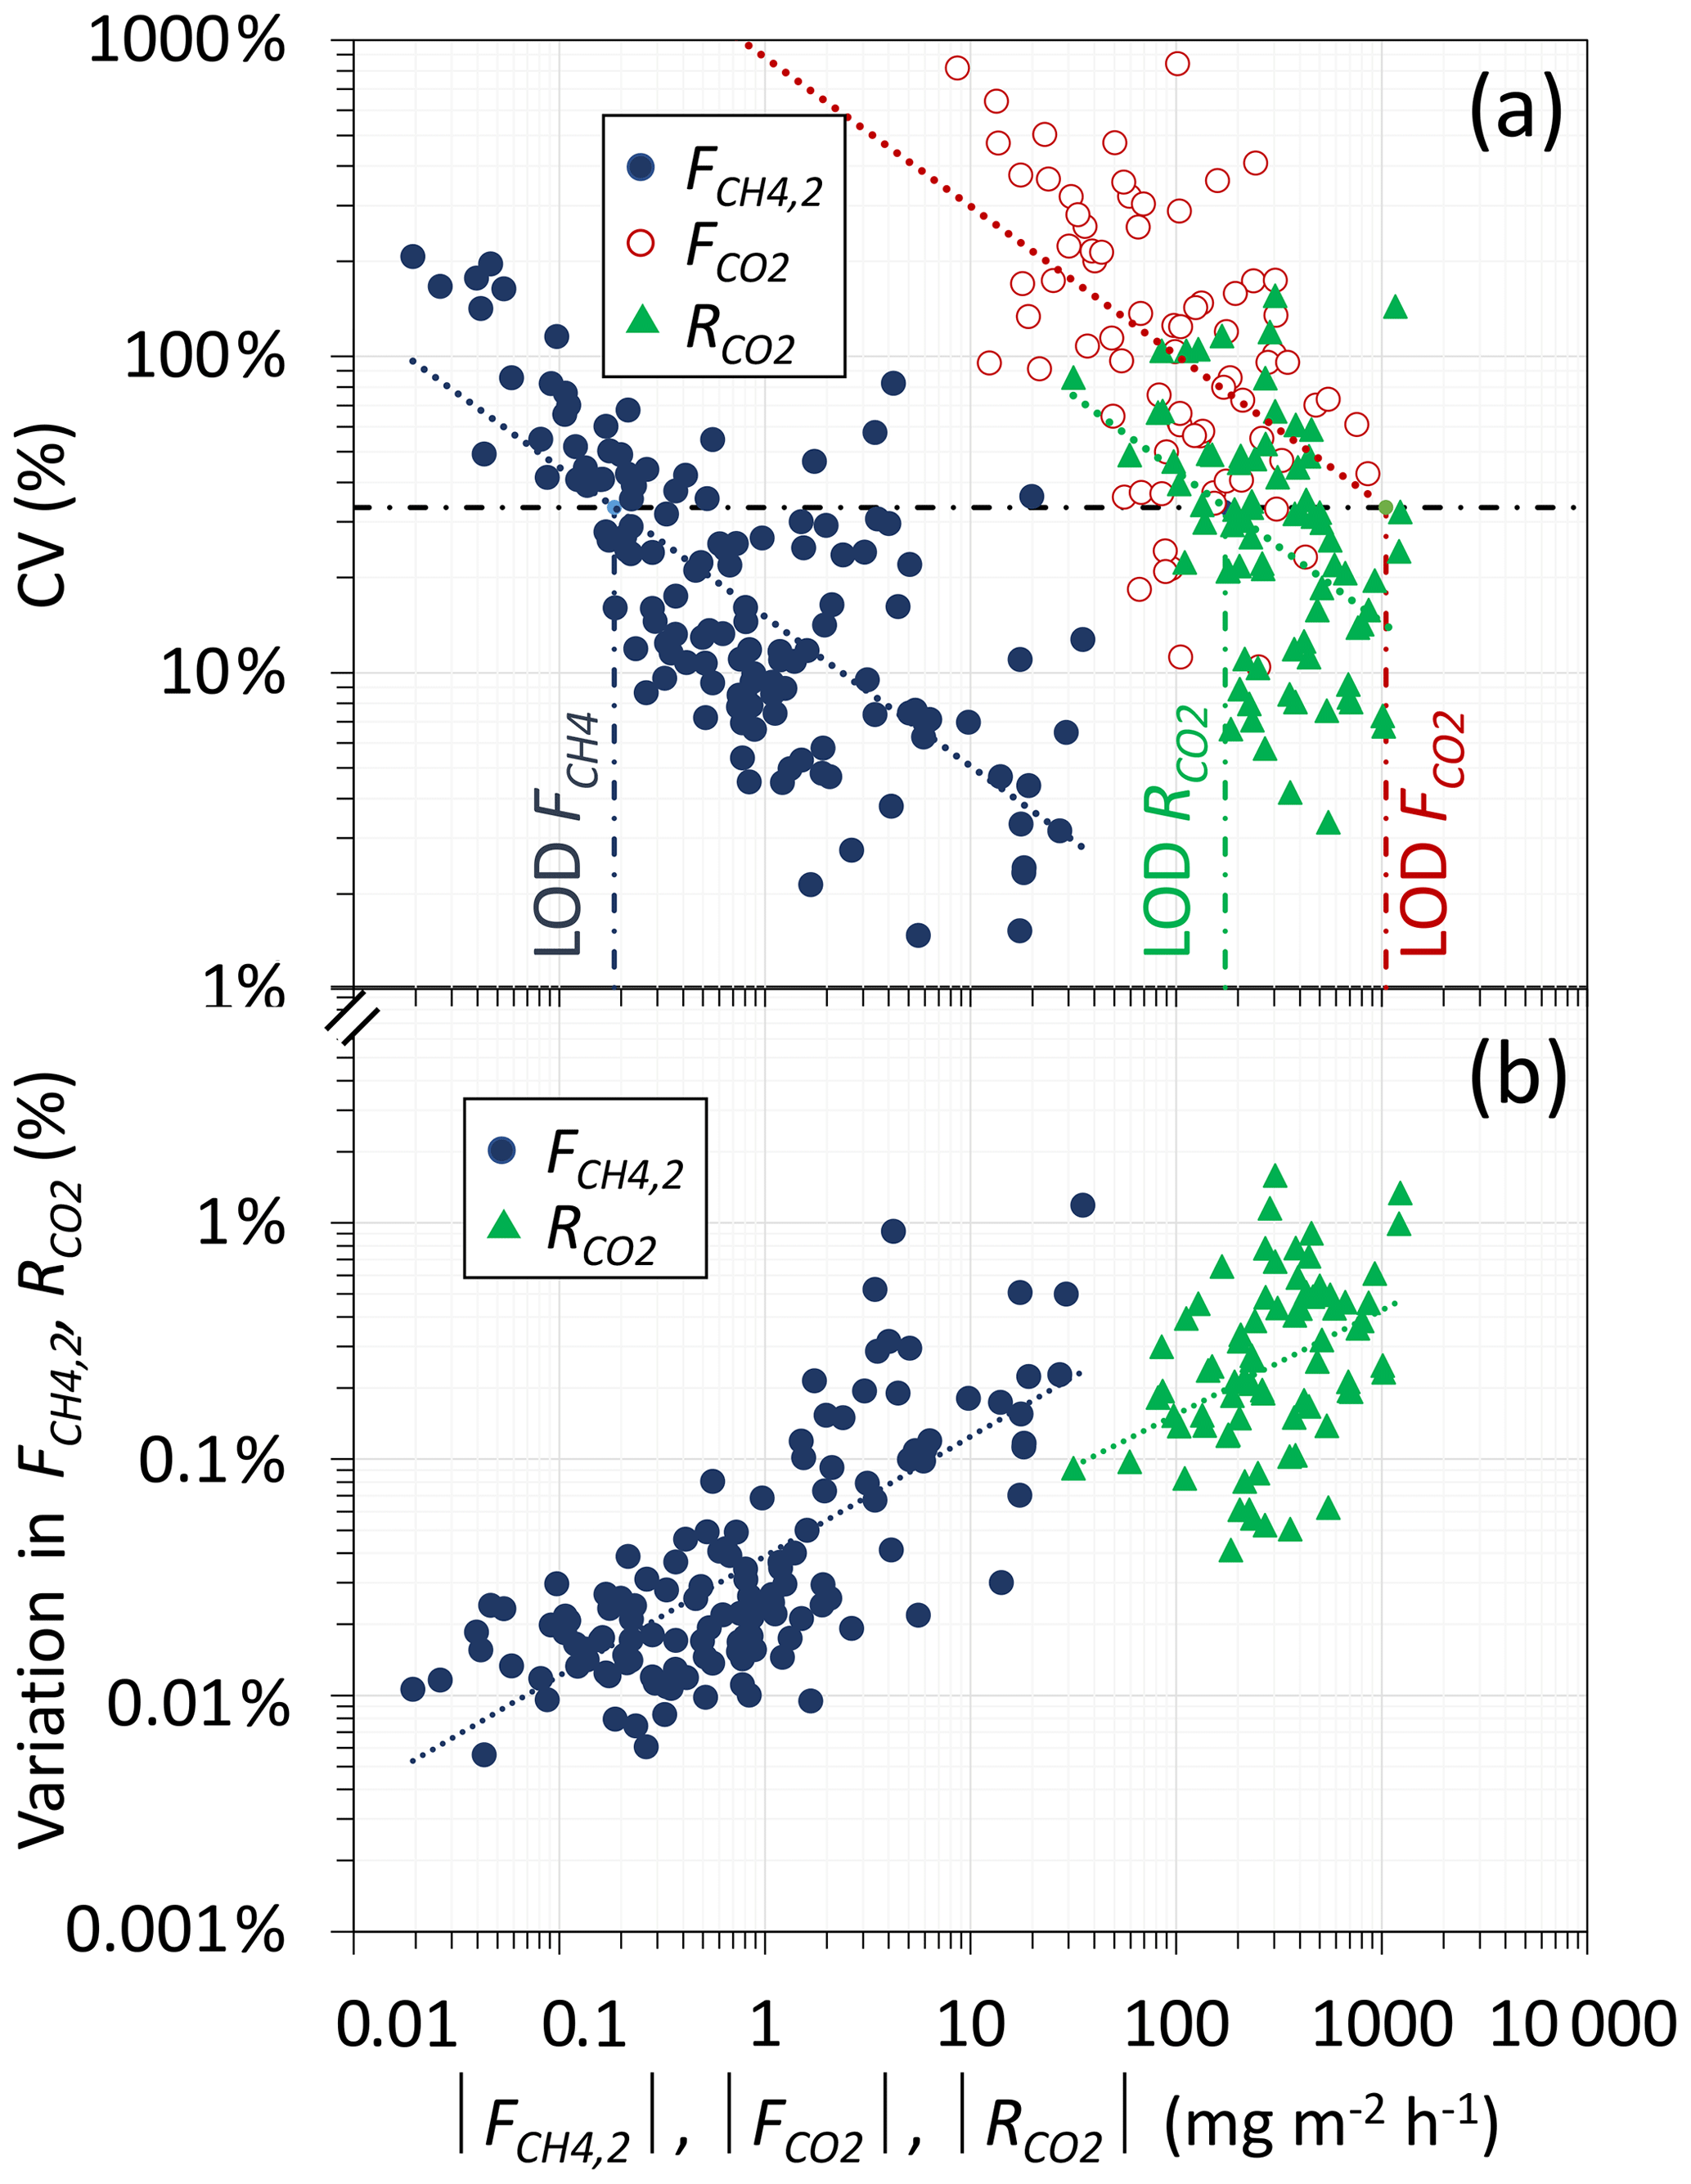
Figure 4Impact of the absolute magnitude of flux and respiration on the coefficient of variation (CV) and limit of detection of the method (LOD; a). Impact of each measurement of the mean emission of the complete dataset (b).
Regarding the LOD of the CH4 flux determination, we used the typical arbitrary limit of a CV below 33 %. This was the case of 71 % of our complete set of measurements. When applying the CV limit to the power trend line that best fits our experimental data (CV = ; Fig. 4a), we estimated that the LOD of was 0.185 mg m−2 h−1, and 81 % of our complete dataset (n=130) was above that LOD. If considering all measurements inferior to LOD to be uncertain and equal to zero, the mean emission of the whole dataset was reduced by only 0.7 %. Thus, as previously established, measurements with low significance had a negligible impact on the mean emission.
Overall, the CH4 flux ranged between −4.23 and 35.26 mg m−2 h−1, with a mean magnitude of 2.68 ± 6.05 mg m−2 h−1. This range is consistent with values reported in previous measurements conducted in peatlands from southern Patagonia, which ranged between −0.03 and 17.30 mg m−2 h−1 (Münchberger et al., 2019; Barret et al., 2022). Approximately 80 % of CH4 fluxes were below those reported by Münchberger et al. (2019), Lehmann et al. (2016), and Fritz et al. (2011) using the static-chamber method. Our CH4 fluxes are also of the same order of magnitude as fluxes reported from bogs and fens in northern regions (0.03 to 23.43 mg m−2 h−1) (Abdalla et al., 2016). However, the highest fluxes we measured are comparable in magnitude to the largest reported in tropical peatlands (Ribeiro et al., 2021), for example, in Panama (31 and 48 mg m−2 h−1) (Wright et al., 2013; Hoyos-Santillan et al., 2019) and in Venezuela (40.03 mg m−2 h−1) (Bracho et al., 1990). Negative values were observed in 11 % of measurements, most of them being close to the detection limit of the method. When excluding negative values, the range of CH4 emissions covered 3 orders of magnitude, sometimes at very close locations.
3.4 CO2 emissions
Overall, CO2 readings were subject to a higher noise level compared to CH4 readings, and therefore presented higher variability. Overall, was negative in 54 % of the cases and ranged between −857 and 549 mg m−2 h−1, with a mean of −21.56 ± 208.49 mg m−2 h−1. This large variability was reflected in the CV of the absolute , noted (Fig. 4a), which was significantly higher than the corresponding CV of (p<0.05). In this case, the LOD of was estimated to be 1047 mg m−2 h−1, and none of our measurements were above that limit. Moreover, only 10 % of our measurements presented a CV inferior to 33.3 %. These results provide strong evidence that the skirt chamber, in its present configuration, inaccurately estimated the CO2 exchange between the peatland and the atmosphere, primarily due to the highly fluctuating CO2 concentrations combined with relatively low CO2 emission/capture rates. Indeed, in contrast to , exhibited high dependence on solar irradiance, which changed rapidly during the field campaign. Therefore, our first suggestion would be to deploy the chamber under more stable irradiance conditions if possible. Furthermore, the skirt chamber tested utilized a transparent plastic film over a basket made of sparsely interwoven steel wires, resulting in limited light penetration to the ground, estimated to be 54 ± 8 %. Hence, our second suggestion would be to optimize incoming irradiance to better mimic the actual conditions existing in the field. This could be achieved through a more transparent chamber design, ensuring that the photosynthetic activity within the chamber closely approximates the conditions that the plants would experience under natural conditions, without a chamber.
3.5 Ecosystem respiration
As illustrated in Fig. 2, when covering the skirt chamber with a dark screen, i.e., when photosynthetic activity was inhibited, an increase in the CO2 concentration within the skirt chamber was standardly observed, reaching a new steady state at , corresponding to the ecosystem respiration. This behavior was observed in all cases and suggests that the respiration rate can be measured during field deployment of the skirt chamber. The dark screen limited light penetration by 98.4 ± 1.8 % in such a manner that photosynthesis could be considered insignificant. The change in the CO2 concentration, from to , was relatively fast and followed an asymptotic trend similar to Eq. (8), where is the CO2 chamber concentration at time t, and θD is the response time.
Equation (12) describes the experimental data well, with a mean R2 of 0.879 ± 0.156. Overall, θD was 53.7 ± 31.3 s, which indicates a fast metabolic change after the switch from light to dark conditions, in accordance with the literature (Masarovičova, 1979). Overall, was positive, i.e., CO2 emission, in all but two cases, with a range (excluding negative values) of 31–1231 mg m−2 h−1 and a mean of 359 ± 292 mg m−2 h−1. This range is consistent with those previous reports conducted in peatlands from southern Patagonia, which ranged between 8 and 667 mg m−2 h−1 using the traditional static-chamber method (Pancotto et al., 2021; Barret et al., 2022). Regarding repeatability, was also evaluated with measurements at 16 locations divided into 4 transects of 3 m on 3 occasions, i.e., 2 and 12 d after the first measurement (Table S1). During these measurements, we observed that the temporal variation (same location on different days) was characterized by a mean CV of 33 ± 17 %, while the mean CV of spatial variation (different locations on the same day) was 58 ± 5 %. These values suggest two important patterns. First, is relatively well distributed compared to . Second, the temporal variation in is lower than its spatial variation; this pattern resembles the findings for .
The CV of the absolute , noted (Fig. 4a), was within the same range as the CV of . In this case the LOD of was estimated to be 173 mg m−2 h−1, and 76 % of our measurements were above that limit. As previously done with , we also determined how the variation in each measurement propagates to the mean respiration of the complete dataset (Fig. 4b). Although with a larger impact than in the case of , similar results were obtained. These results suggest that the skirt chamber allowed the accurate determination of the ecosystem respiration. In this case too, no correlation was found between (Table S1) and the coverage of plants (Table S2).
3.6 Strengths, weaknesses, and perspectives of the skirt chamber
The skirt-chamber concept, tested for the first time in this work, allowed for the determination of CH4 emissions and respiration rates in a peatland. For both parameters, the majority of the measurements were above the detection limit of the method and were characterized by a CV within acceptable limits (i.e., < 33 %). By repeating measurements over a 12 d period, similar results were obtained, indicating that these parameters were more homogeneously distributed over time than over space. From the experience acquired during field deployment, the best strategy would be to measure CH4 emissions and ecosystem respiration according to a three-step protocol: (i) measurement of ground-air concentration for 5 min, followed by (ii) the installation of the chamber and the immediate pulse injection, waiting 5–7 min before (iii) covering the chamber with a dark screen for an additional 5 min. Thus, in 15–17 min, CH4 emission and ecosystem respiration of a specific location can be determined, which suggests that about 20–30 locations could be measured in a reasonable workday (even in remote areas). The main strength of the method is that these parameters can be determined in a minimally intrusive manner and without delay. Moreover, the relatively small size of the skirt chamber also allows CH4 emission and respiration to be determined with a good spatial resolution for almost any terrain and vegetation cover. However, several points still require close attention, which we discuss as follows.
First, the mass balance of the skirt chamber (Sect. 2.1) is sensitive to varying wind speed and solar irradiance, affecting θC, CB, and CC. In this regard, it should be noted that it is not a strict requirement for CB, CC, and θC to remain absolutely stable or fixed, as long as these parameters fluctuate around a mean value with no significant trend or change over time, and that each measurement step is sustained for several minutes. During our experiments, we conducted quadruplicate measurements of known CH4 samples at six distinct concentrations (Fig. 3), and the results indicated a mean CV of 7.1 ± 5.0 %. This suggests that external conditions not related to ecosystem emission variability had a relatively limited impact on measurements. The validity of this finding was further confirmed through quintuplicate ecosystem flux measurements (), which showed a CV of 10.3 % at a relatively high-emission hotspot and a CV of 74.6 % at a relatively low-emission spot. This indicates that the variation in parameter estimation was primarily due to fluctuations in ecosystem emissions rather than changing environmental conditions. However, we acknowledge that varying environmental conditions might still have some impact, and we hypothesize that using a wind shield in close vicinity to the chamber might reduce the influence of wind gusts and to improve the accuracy of the method, which should be tested.
Second, during chamber deployment, we typically observed moderate temperature increases over the chamber deployment time, ranging from 0 to 4.25 ∘C with a mean of 0.83 ± 1.30 ∘C above the ambient air temperature, as exemplified in Fig. S3. The slope of the temperature increase ranged from 0 to 0.63 ∘C min−1, with a mean of 0.09 ± 0.15 ∘C min−1. This temperature increase was positively correlated with sun irradiance, with a Pearson correlation factor of r(130) = 0.712 (p<0.05). The correlation between the temperature change rate (dT dt−1) and sun irradiance (I) was described by the equation d dt = −0.178 + I. In some cases, a decrease in temperature was observed, associated with a sudden decrease in sun irradiance, and this cooling effect was systematically observed after the dark screen was placed on the chamber for respiration measurement (step 4). We attribute the relatively moderate temperature increases to two main factors. First, as a characteristic of the skirt chamber, there is a constant gas exchange with the exterior, thus reducing heat accumulation within the chamber that would be observed in a closed chamber. Second, the light intensity was moderated due to the relatively low latitude of Navarino Island (54.9396∘ S) and the lack of transparency of the chamber (as discussed in Sect. 3.4).
Third, in this study, we exclusively tested the chamber under non-flooded conditions. However, it is expected that the chamber would function effectively when used in flooded areas, where a water layer would provide a seal between the chamber and the ground. In such cases, the chamber would likely operate similarly to a standard closed chamber without any leakage, which could be confirmed through pulse injection. However, the latter should be experimentally tested.
Fourth, another feature of the skirt chamber is that it does not allow for the segregation of diffusive and ebullitive fluxes, well documented in the literature (Baird et al., 2009). During our measurements, we did not observe sudden peak increases in CH4 or CO2 concentrations, which would be expected if bubbles were reaching the surface. Rather than dismissing ebullition, we hypothesize that this absence of peak concentrations was due to the measurements being conducted under non-flooded conditions. In such conditions, any bubbles reaching the acrotelm of the peatland would probably diffuse at a moderate rate through the organic material layer instead of being suddenly released to the gas phase. In this study, emissions were measured based on mean CH4 or CO2 concentrations during steady states, which encompassed some variations potentially associated with ebullition or other temporal effects. Therefore, the results obtained with the skirt chamber reflect total emissions, and an alternative strategy should be employed to separate ebullitive fluxes.
Fifth, in the literature, it is well documented that measuring dark respiration immediately after a period of illumination might lead to an overestimation of plant respiration due to the process of light-enhanced dark respiration (LEDR) in living plant tissues (Atkin et al., 2000; Barbour et al., 2007; Werner et al., 2011). In our study, we adhered to a standard protocol for measuring dark respiration in peatland ecosystems, aligning our analysis with the methodology commonly employed in similar studies (Shaver et al., 2007; Järveoja et al., 2018, 2020; Capooci and Vargas, 2022; Rankin et al., 2022; Virkkala et al., 2022; Ilyasov et al., 2023). By limiting the dark periods to just 5 min, we aimed to reduce the potential influence of LEDR, a phenomenon that typically peaks between 10 and 20 min (Barbour et al., 2007; Atkin et al., 2000) and is strongly influenced by light levels, without displaying a clear pattern (Barbour et al., 2007). Nevertheless, we recognize that the possibility of LEDR affecting our respiration estimates exists in our experimental approach, and as such, the results presented in this study should be considered with appropriate caveats. Despite these considerations, we believe that our discrete gas flux measurements effectively capture the spatial variability in peatland emissions across the microtopography, an issue of significant importance in these ecosystems, as discussed by Capooci and Vargas (2022).
Compared to standard chambers, i.e., non-steady-state chambers (closed systems) that are inserted/embedded into the ground with a collar, the skirt chamber offers several key advantages. These include minimal soil disturbance, a smaller chamber size, and the absence of a collar, which allow rapid measurements in multiple locations, thus enabling improved spatial resolution, as well as improved portability, making it advantageous for fieldwork in remote locations. Furthermore, the design of the skirt chamber may help regulate the temperature increase within the chamber thanks to constant gas exchange with the exterior, which reduces heat accumulation. Contrastingly, standard chambers, and in particular automatic chambers, offer an incomparable temporal resolution, with minimal field workload. Thus, we conclude that the skirt-chamber concept is a new alternative tool with specific advantages that could be advantageously combined with the existing methods to improve our understanding of greenhouse gas emissions and of the factors controlling them in peatlands.
All data are contained within the figures and the Supplement. The raw datasets used will be made available upon request by contacting the corresponding author via email.
The supplement related to this article is available online at: https://doi.org/10.5194/bg-20-3737-2023-supplement.
FT: coordination, conceptualization, fieldwork and lab work, investigation, formal analysis, methodology, data management, writing (original draft), funding management. BR: fieldwork and lab work, logistic support, draft revision. AG: fieldwork and lab work, investigation, methodology, draft revision. RM and FJA: fieldwork and lab work, logistic support, draft revision. JHS: investigation, methodology, data management, formal analysis, writing (original draft), logistic support. RR: draft revision, funding management, logistic support. ASJ: conceptualization, fieldwork and lab work, investigation, formal analysis, methodology, data management, writing (original draft).
The contact author has declared that none of the authors has any competing interests.
Publisher’s note: Copernicus Publications remains neutral with regard to jurisdictional claims in published maps and institutional affiliations.
We thank Rachele Ossola for her support in preparing the graphical abstract.
This research has been supported by the Agencia Nacional de Investigación y Desarrollo (ANID; grant no. CHIC-FB210018, Fondecyt Postdoc 3220809, and Millennium Science Initiative Program ICN2021_002).
This paper was edited by Nicolas Brüggemann and reviewed by two anonymous referees.
Abdalla, M., Hastings, A., Truu, J., Espenberg, M., Mander, Ü., and Smith, P.: Emissions of methane from northern peatlands: a review of management impacts and implications for future management options, Ecol. Evol., 6, 7080–7102, https://doi.org/10.1002/ECE3.2469, 2016.
IPCC: AR6 Climate Change 2021: The Physical Science Basis – IPCC: https://www.ipcc.ch/report/sixth-assessment-report-working-group-i/, last access: 7 October 2022.
Aubinet, M., Vesala, T., and Papale, D.: Eddy Covariance: A Practical Guide to Measurement and Data Analysis, Springer Atmospheric Sciences, 1, 438 pp., https://doi.org/10.1007/978-94-007-2351-1, 2012.
Atkin, O. K., Evans, J. R., Ball, M. C., Lambers, H., and Pons, T. L.: Leaf Respiration of Snow Gum in the Light and Dark. Interactions between Temperature and Irradiance, Plant Physiol., 122, 915–924, https://doi.org/10.1104/PP.122.3.915, 2000.
Baird, A. J., Belyea, L. R., and Morris, P. J.: Upscaling of Peatland-Atmosphere Fluxes of Methane: Small-Scale Heterogeneity in Process Rates and the Pitfalls of “Bucket-and-Slab” Models, Carbon Cycling in Northern Peatlands, American Geophysical Union, 37–53, https://doi.org/10.1029/2008GM000826, 2013.
Barbour, M. M., Mcdowell, N. G., Tcherkez, G., Bickford, C. P., and Hanson, D. T.: A new measurement technique reveals rapid post-illumination changes in the carbon isotope composition of leaf-respired CO2, Plant Cell Environ., 30, 469–482, https://doi.org/10.1111/J.1365-3040.2007.01634.X, 2007.
Barret, M., Gandois, L., Thalasso, F., Martinez-Cruz, K., Sepulveda-Jauregui, A., Lavergne, C., Teisserenc, R., Aguilar-Muñoz, P., Gerardo-Nieto, O., Etchebehere, C., Dellagnezze, B., Bovio-Winkler, P., Fochesatto, G., Tananaev, N., Svenning, M. M., Seppey, C., Tveit, A., Chamy, R., Astorga-España, M. S., Mansilla, A. O., van de Putte, A., Sweetlove, M., and Murray, A. E.: A combined microbial and biogeochemical dataset from high-latitude ecosystems with respect to methane cycle, Sci. Data, 9, 674, https://doi.org/10.1038/s41597-022-01759-8, 2022.
Bracho, R. and Jose, J. J. S.: Energy Fluxes in a Morichal (Swamp Palm Community) at the Orinoco Llanos, Venezuela – Microclimate, Water-Vapor and CO2 Exchange, Photosynthetica, 24, 468–494, 1990.
Capooci, M. and Vargas, R.: Trace gas fluxes from tidal salt marsh soils: implications for carbon-sulfur biogeochemistry, Biogeosciences, 19, 4655–4670, https://doi.org/10.5194/bg-19-4655-2022, 2022.
Christiansen, J. R., Korhonen, J. F. J., Juszczak, R., Giebels, M., and Pihlatie, M.: Assessing the effects of chamber placement, manual sampling and headspace mixing on CH4 fluxes in a laboratory experiment, Plant Soil, 343, 171–185, https://doi.org/10.1007/S11104-010-0701-Y, 2011.
Cobb, A. R., Hoyt, A. M., Gandois, L., Eri, J., Dommain, R., Salim, K. A., Kai, F. M., Su'ut, N. S. H., and Harvey, C. F.: How temporal patterns in rainfall determine the geomorphology and carbon fluxes of tropical peatlands, P. Natl. Acad. Sci. USA, 114, E5187–E5196, https://doi.org/10.1073/pnas.1701090114, 2017.
Ding, W., Cai, Z., and Tsuruta, H.: Diel variation in methane emissions from the stands of Carex lasiocarpa and Deyeuxia angustifolia in a cool temperate freshwater marsh, Atmos. Environ., 38, 181–188, https://doi.org/10.1016/J.ATMOSENV.2003.09.066, 2004.
Edwards, N. T. and Sollins, P.: Continuous Measurement of Carbon Dioxide Evolution From Partitioned Forest Floor Components, Ecology, 54, 406–412, https://doi.org/10.2307/1934349, 1973.
Fritz, C., Pancotto, V. A., Elzenga, J. T. M., Visser, E. J. W., Grootjans, A. P., Pol, A., Iturraspe, R., Roelofs, J. G. M., and Smolders, A. J. P.: Zero methane emission bogs: extreme rhizosphere oxygenation by cushion plants in Patagonia, New Phytol., 190, 398–408, https://doi.org/10.1111/J.1469-8137.2010.03604.X, 2011.
Frolking, S., Talbot, J., Jones, M. C., Treat, C. C., Kauffman, J. B., Tuittila, E. S., and Roulet, N.: Peatlands in the Earth's 21st century climate system, Environ. Rev., 19, 371–396, https://doi.org/10.1139/A11-014, 2011.
Griscom, B. W., Adams, J., Ellis, P. W., Houghton, R. A., Lomax, G., Miteva, D. A., Schlesinger, W. H., Shoch, D., Siikamäki, J. v., Smith, P., Woodbury, P., Zganjar, C., Blackman, A., Campari, J., Conant, R. T., Delgado, C., Elias, P., Gopalakrishna, T., Hamsik, M. R., Herrero, M., Kiesecker, J., Landis, E., Laestadius, L., Leavitt, S. M., Minnemeyer, S., Polasky, S., Potapov, P., Putz, F. E., Sanderman, J., Silvius, M., Wollenberg, E., and Fargione, J.: Natural climate solutions, P. Natl. Acad. Sci. USA, 114, 11645–11650, https://doi.org/10.1073/pnas.1710465114, 2017.
Günther, A. B., Huth, V., Jurasinski, G., and Glatzel, S.: Scale-Dependent Temporal Variation in Determining the Methane Balance of a Temperate Fen, Greenh. Gas Meas. Manag., 4, 41–48, https://doi.org/10.1080/20430779.2013.850395, 2014
Günther, A., Barthelmes, A., Huth, V., Joosten, H., Jurasinski, G., Koebsch, F., and Couwenberg, J.: Prompt rewetting of drained peatlands reduces climate warming despite methane emissions, Nat. Commun., 11, 1–5, https://doi.org/10.1038/s41467-020-15499-z, 2020.
Heusser, C. J.: Late Quaternary Vegetation and Climate of Southern Tierra del Fuego. Late Quaternary vegetation and climate of southern Tierra del Fuego, Quaternary Res., 31, 396–406, https://doi.org/10.1016/0033-5894(89)90047-1, 1989.
Hoyos-Santillan, J., Lomax, B. H., Large, D., Turner, B. L., Lopez, O. R., Boom, A., Sepulveda-Jauregui, A., and Sjögersten, S.: Evaluation of vegetation communities, water table, and peat composition as drivers of greenhouse gas emissions in lowland tropical peatlands, Sci. Total Environ., 688, 1193–1204, https://doi.org/10.1016/J.SCITOTENV.2019.06.366, 2019.
Ilyasov, D. V., Meshcheryakova, A. V., Glagolev, M. V., Kupriianova, I. V., Kaverin, A. A., Sabrekov, A. F., Kulyabin, M. F., and Lapshina, E. D.: Field-Layer Vegetation and Water Table Level as a Proxy of CO2 Exchange in the West Siberian Boreal Bog, Land, 12, 566, https://doi.org/10.3390/LAND12030566, 2023.
Järveoja, J., Nilsson, M. B., Gažovič, M., Crill, P. M., and Peichl, M.: Partitioning of the net CO2 exchange using an automated chamber system reveals plant phenology as key control of production and respiration fluxes in a boreal peatland, Glob. Change Biol., 24, 3436–3451, https://doi.org/10.1111/GCB.14292, 2018.
Järveoja, J., Nilsson, M. B., Crill, P. M., and Peichl, M.: Bimodal diel pattern in peatland ecosystem respiration rebuts uniform temperature response, Nat. Commun., 11, 1–9, https://doi.org/10.1038/s41467-020-18027-1, 2020.
Juszczak, R.: Biases in Methane Chamber Measurements in Peatlands, Int. Agrophys., 27, 159–168, https://doi.org/10.2478/V10247-012-0081-Z, 2013.
Kutzbach, L., Schneider, J., Sachs, T., Giebels, M., Nykänen, H., Shurpali, N. J., Martikainen, P. J., Alm, J., and Wilmking, M.: CO2 flux determination by closed-chamber methods can be seriously biased by inappropriate application of linear regression, Biogeosciences, 4, 1005–1025, https://doi.org/10.5194/bg-4-1005-2007, 2007.
Lai, D. Y. F., Roulet, N. T., Humphreys, E. R., Moore, T. R., and Dalva, M.: The effect of atmospheric turbulence and chamber deployment period on autochamber CO2 and CH4 flux measurements in an ombrotrophic peatland, Biogeosciences, 9, 3305–3322, https://doi.org/10.5194/bg-9-3305-2012, 2012.
Lawson, I. T., Kelly, T. J., Aplin, P., Boom, A., Dargie, G., Draper, F. C. H., Hassan, P. N. Z. B. P., Hoyos-Santillan, J., Kaduk, J., Large, D., Murphy, W., Page, S. E., Roucoux, K. H., Sjögersten, S., Tansey, K., Waldram, M., Wedeux, B. M. M., and Wheeler, J.: Improving estimates of tropical peatland area, carbon storage, and greenhouse gas fluxes, Wetlands Ecol. Manag., 23, 327–346, https://doi.org/10.1007/S11273-014-9402-2, 2014.
Lehmann, J. R. K., Münchberger, W., Knoth, C., Blodau, C., Nieberding, F., Prinz, T., Pancotto, V. A., and Kleinebecker, T.: High-Resolution Classification of South Patagonian Peat Bog Microforms Reveals Potential Gaps in Up-Scaled CH4 Fluxes by use of Unmanned Aerial System (UAS) and CIR Imagery, Remote Sens., 8, 173, https://doi.org/10.3390/RS8030173, 2016.
Leifeld, J. and Menichetti, L.: The underappreciated potential of peatlands in global climate change mitigation strategies, Nat. Commun., 9, 1–7, https://doi.org/10.1038/s41467-018-03406-6, 2018.
Levenspiel, O.: Chemical Reaction Engineering, 3rd Edn., edited by: Anderson, W., Hepburn, K., and Santor, K., Times Roman by Bi-Comp Inc, John Wiley & Sons, 4140–4143, ISBN: 0-471-25424-X, 1999.
Limpert, K. E., Carnell, P. E., Trevathan-Tackett, S. M., and Macreadie, P. I.: Reducing Emissions From Degraded Floodplain Wetlands, Front. Environ. Sci., 8, 8, https://doi.org/10.3389/fenvs.2020.00008, 2020.
Livingston, G. and Hutchinson, J.: Enclosure-Based Measurement of Trace Gas Exchange: Applications and Sources of Error, in: Biogenic trace gases: measuring emissions from soil and water, edited by: Matson, P. and Harris, R., R.C., Oxford, UK, Blackwell Science Ltd., 14–51, ISBN: 0-632-03641-9, 1995.
Masarovičova, E.: Relationships between the CO2 compensation concentration, the slope of CO2 curves of net photosynthetic rate and the energy of irradiance, Biol. Plantarum, 21, 434–439, https://doi.org/10.1007/BF02889485, 2008.
Münchberger, W., Knorr, K. H., Blodau, C., Pancotto, V. A., and Kleinebecker, T.: Zero to moderate methane emissions in a densely rooted, pristine Patagonian bog – Biogeochemical controls as revealed from isotopic evidence, Biogeosciences, 16, 541–559, https://doi.org/10.5194/bg-16-541-2019, 2019.
Page, S., Mishra, S., Agus, F., Anshari, G., Dargie, G., Evers, S., Jauhiainen, J., Jaya, A., Jovani-Sancho, A. J., Laurén, A., Sjögersten, S., Suspense, I. A., Wijedasa, L. S., and Evans, C. D.: Anthropogenic impacts on lowland tropical peatland biogeochemistry, Nat. Rev. Earth Environ., 3, 426–443, https://doi.org/10.1038/s43017-022-00289-6, 2022.
Pancotto, V., Holl, D., Escobar, J., Castagnani, M. F., and Kutzbach, L.: Cushion bog plant community responses to passive warming in southern Patagonia, Biogeosciences, 18, 4817–4839, https://doi.org/10.5194/bg-18-4817-2021, 2021.
Pavelka, M., Acosta, M., Kiese, R., Altimir, N., Brümmer, C., Crill, P., Darenova, E., Fu., Gielen, B., Graf, A., Klemedtsson, L., Lohila, A., Longdoz, B., Lindroth, A., Nilsson, M., Maranón Jiménez, S., Merbold, L., Montagnani, L., Peichl, M., Pumpanen, J., Serrano Ortiz, P., Silvennoinen, H., Skiba, U., Vestin, P., Weslien, P., Janous, D., and Kutsch, W.: Standardisation of chamber technique for CO2, N2O and CH4 fluxes measurements from terrestrial ecosystems, Int. Agrophys., 32, 569–587, https://doi.org/10.1515/intag-2017-0045, 2018.
Pirk, N., Mastepanov, M., Parmentier, F.-J. W., Lund, M., Crill, P., and Christensen, T. R.: Calculations of automatic chamber flux measurements of methane and carbon dioxide using short time series of concentrations, Biogeosciences, 13, 903–912, https://doi.org/10.5194/bg-13-903-2016, 2016.
Ribeiro, K., Pacheco, F. S., Ferreira, J. W., de Sousa-Neto, E. R., Hastie, A., Krieger Filho, G. C., Alvalá, P. C., Forti, M. C., and Ometto, J. P.: Tropical peatlands and their contribution to the global carbon cycle and climate change, Glob. Change Biol., 27, 489–505, https://doi.org/10.1111/GCB.15408, 2021.
Rankin, T. E., Roulet, N. T., and Moore, T. R.: Controls on autotrophic and heterotrophic respiration in an ombrotrophic bog, Biogeosciences, 19, 3285–3303, https://doi.org/10.5194/bg-19-3285-2022, 2022.
Rozzi, R., Armesto, J. J., Gutiérrez, J., Massardo, F., Likens, G., Anderson, C. B., Poole, A., Moses, K., Hargrove, G., Mansilla, A., Kennedy, J.H., Willson, M., Jax, K., Jones, C., Callicott, J. B., and Kalin, M. T.: Integrating ecology and environmental ethics: Earth stewardship in the southern end of the Americas, BioScience, 62, 226–236 https://doi.org/10.1525/bio.2012.62.3.4, 2012.
Rozzi, R., Massardo, F., Anderson, C. B., Kurt Heidinger, J. A., and Silander, J.: Ten Principles for biocultural conservation at the southern tip of the Americas: The approach of the Omora Ethnobotanical Park, Ecol. Soc., 11, 43, https://www.jstor.org/stable/26267796 (last access: 27 November 2022), 2006.
Schindelin, J., Arganda-Carreras, I., Frise, E., Kaynig, V., Longair, M., Pietzsch, T., Preibisch, S., Rueden, C., Saalfeld, S., Schmid, B., Tinevez, J. Y., White, D. J., Hartenstein, V., Eliceiri, K., Tomancak, P., and Cardona, A.: Fiji: an open-source platform for biological-image analysis, Nat. Method., 9, 676–682, https://doi.org/10.1038/nmeth.2019, 2012.
Shaver, G. R., Street, L. E., Rastetter, E. B., Van Wijk, M. T., and Williams, M.: Functional convergence in regulation of net CO2 flux in heterogeneous tundra landscapes in Alaska and Sweden, J. Ecol., 95, 802–817, https://doi.org/10.1111/J.1365-2745.2007.01259.X, 2007.
Swails, E., Hergoualc'h, K., Verchot, L., Novita, N., and Lawrence, D.: Spatio-Temporal Variability of Peat CH4 and N2O Fluxes and Their Contribution to Peat GHG Budgets in Indonesian Forests and Oil Palm Plantations, Front. Environ. Sci., 9, 617828, https://doi.org/10.3389/fenvs.2021.617828, 2021.
UNEP (United Nations Environment Programme): Resolution 4/16. Conservation and Sustainable Management of Peatlands – Resolution Adopted by the United Nations Environment Assembly on 15 March 2019, https://wedocs.unep.org/20.500.11822/30675 (last access: 7 December 2022), 2019.
Virkkala, A. M., Natali, S. M., Rogers, B. M., Watts, J. D., Savage, K., Connon, S. J., Mauritz, M., Schuur, E. A. G., Peter, D., Minions, C., Nojeim, J., Commane, R., Emmerton, C. A., Goeckede, M., Helbig, M., Holl, D., Iwata, H., Kobayashi, H., Kolari, P., López-Blanco, E., Marushchak, M. E., Mastepanov, M., Merbold, L., Parmentier, F. J. W., Peichl, M., Sachs, T., Sonnentag, O., Ueyama, M., Voigt, C., Aurela, M., Boike, J., Celis, G., Chae, N., Christensen, T. R., Bret-Harte, M. S., Dengel, S., Dolman, H., Edgar, C. W., Elberling, B., Euskirchen, E., Grelle, A., Hatakka, J., Humphreys, E., Järveoja, J., Kotani, A., Kutzbach, L., Laurila, T., Lohila, A., Mammarella, I., Matsuura, Y., Meyer, G., Nilsson, M. B., Oberbauer, S. F., Park, S. J., Petrov, R., Prokushkin, A. S., Schulze, C., St. Louis, V. L., Tuittila, E. S., Tuovinen, J. P., Quinton, W., Varlagin, A., Zona, D., and Zyryanov, V. I.: The ABCflux database: Arctic-boreal CO2 flux observations and ancillary information aggregated to monthly time steps across terrestrial ecosystems, Earth Syst. Sci. Data, 14, 179–208, https://doi.org/10.5194/ESSD-14-179-2022, 2022.
Werner, R. A., Buchmann, N., Siegwolf, R. T. W., Kornexl, B. E., and Gessler, A.: Metabolic fluxes, carbon isotope fractionation and respiration – lessons to be learned from plant biochemistry, New Phytol., 191, 10–15, https://doi.org/10.1111/J.1469-8137.2011.03741.X, 2011.
Wright, E. L., Black, C. R., Turner, B. L., and Sjögersten, S.: Environmental controls of temporal and spatial variability in CO2 and CH4 fluxes in a neotropical peatland, Glob. Change Biol., 19, 3775–3789, https://doi.org/10.1111/GCB.12330, 2013.
Yu, Z., Beilman, D. W., Frolking, S., MacDonald, G. M., Roulet, N. T., Camill, P., and Charman, D. J.: Peatlands and Their Role in the Global Carbon Cycle, Eos, 92, 97–98, https://doi.org/10.1029/2011EO120001, 2011.