the Creative Commons Attribution 4.0 License.
the Creative Commons Attribution 4.0 License.
 | 21 Sep 2023
A new method for estimating carbon dioxide emissions from drained peatland forest soils for the greenhouse gas inventory of Finland
Antti Wall
Jukka-Pekka Myllykangas
Paavo Ojanen
Juha Heikkinen
Helena M. Henttonen
Raija Laiho
Kari Minkkinen
Tarja Tuomainen
Juha Mikola
In peatlands drained for forestry, the soil carbon (C) or carbon dioxide (CO2) balance is affected by both (i) higher heterotrophic CO2-C release from faster decomposing soil organic matter (SOM) and (ii) higher plant litter C input from more vigorously growing forests. This balance and other greenhouse gas (GHG) sinks and sources in managed lands are annually reported by national GHG inventories to the United Nations Climate Change Convention. In this paper, we present a revised, fully dynamic method for reporting the CO2 balance of drained peatland forest soils in Finland. Our method can follow temporal changes in tree biomass growth, tree harvesting and climatic parameters, and it is built on empirical regression models of SOM decomposition and litter input in drained peatland forests. All major components of aboveground and belowground litter input from ground vegetation as well as live trees and trees that died naturally are included, supplemented by newly acquired turnover rates of woody plant fine roots. Annual litter input from harvesting residues is calculated using national statistics of logging and energy use of trees. Leaching, which also exports dissolved C from drained peatlands, is not included. The results are reported as time series from 1990–2021 following the practice in the GHG inventory. Our revised method produces an increasing trend of annual emissions from 0.2 to 2.1 t CO2 ha−1 yr−1 for the period 1990–2021 in Finland (equal to a trend from 1.4 to 7.9 Mt CO2 yr−1 for the entire 4.3 Mha of drained peatland forests), with a statistically significant difference between the years 1990 and 2021. Across the period 1990–2021, annual emissions are on average 1.5 t CO2 ha−1 yr−1 (3.4 Mt CO2 yr−1 for 2.2 Mha area) in warmer southern Finland and −0.14 t CO2 ha−1 yr−1 (−0.3 Mt CO2 yr−1 for 2.1 Mha area) in cooler northern Finland. When combined with data on the CO2 sink created by the growing tree stock, in 2021 the drained peatland forest ecosystems were a source of 1.0 t CO2 ha−1 yr−1 (2.3 Mt CO2 yr−1) in southern Finland and a sink of 1.2 t CO2 ha−1 yr−1 (2.5 Mt CO2 yr−1) in northern Finland. We compare these results to those produced by the semi-dynamic method used earlier in the Finnish GHG inventory and discuss the strengths and vulnerabilities of the new revised method in comparison to more static emission factors.
- Article
(4538 KB) - Full-text XML
-
Supplement
(533 KB) - BibTeX
- EndNote


Drainage of peatlands improves forest growth but also turns unmanaged land to managed land and creates anthropogenic greenhouse gas (GHG) emissions: drainage increases aerobic decomposition of soil organic matter (SOM) and leads to substantial carbon dioxide (CO2) emissions, globally accounting for 6 % of total CO2 emissions (Joosten, 2010). Parties and signatories of the Paris Agreement and the United Nations Framework Convention on Climate Change (UNFCCC) are committed to reporting managed land GHG annual emissions and removals by sources and sinks, respectively, from 1990 onwards. Emissions from drained peatlands are reported under the land use, land-use change and forestry (LULUCF) sector of GHG inventories.
In Finland peatlands drained for forestry comprise an important category of managed lands. Almost one-third, or 8.8 Mha (million hectares), of land area in Finland is covered by peatlands. This area also includes ca. 1 Mha thin-peated sites (< 30 cm peat layer). Of the total peatland area, 4.7 Mha is drained for forestry (Korhonen et al., 2021), 0.34 Mha for agriculture and 0.11 Mha for peat extraction (Statistics Finland, 2022). Peatland forests were mainly drained after World War II, with a peak in activity in the 1960s and 1970s (Päivänen and Hånell, 2012). This paper addresses soil CO2 emissions from those 4.3 Mha of drained peatland forests in Finland that fulfill the FAO definition of forest land. Soil CO2 emissions from undrained peatland forests are excluded since the water table level, and thereby the functioning of soil, has not been modified by human activity. Emissions of CO2 from drained peatland forest soils were first globally estimated by IPCC (2006). In Finland, the emissions, or soil C balance, have been quantified by Minkkinen et al. (2002) and Ojanen et al. (2014).
Countries may use static IPCC default emission factors for reporting soil CO2 emissions from their drained peatland forest soils. Country-specific data and improvement of GHG inventory methods beyond the IPCC default emission factors are relevant, especially for countries that have large areas of drained peatlands. Some countries have indeed opted to use country-specific emission factors; these can be based on the subsidence, i.e., fall of the surface of the organic soil, as in the Netherlands (Ruyssenaars et al., 2021), CO2 flux measurements as in Ireland (Duffy et al., 2021) or soil C balance modeling as in the UK (Brown et al., 2021). The weakness of static emission factors is that they cannot follow temporal changes, if such changes occur, in variables that drive the soil CO2 balance. For instance, net CO2 emissions from peatland forest soils may gradually evolve after drainage due to a successional transition of vegetation and changes in peat decomposition and hydrology (Sarkkola et al., 2010; Straková et al., 2012). In addition, increasing global temperatures likely increase SOM decomposition rates and thus soil CO2 emissions.
Here we present a new dynamic method for estimating the soil CO2 balance of drained peatland forests in Finland on the timescales needed in the GHG inventory. We use both measured and modeled values of peat and litter decomposition as well as plant litter input. While water table depth (WTD) is the main factor that controls C loss from peat by heterotrophic respiration in drained wetlands (Silvola et al., 1996; Ojanen et al., 2010; Jauhiainen et al., 2019), direct data on WTD are not available nationwide for GHG inventory purposes in Finland. We therefore link decomposition of peat and litter to tree basal area per hectare (BA) using empirical regression models available for different drained peatland forest site types (Ojanen et al., 2014). BA provides a proxy for the rate of evapotranspiration, which largely controls WTD in forestry-drained peatlands (Hökkä et al., 2021; Leppä et al., 2020). In addition, BA can be used to predict litter input from trees and ground vegetation (Ojanen et al., 2014). The time series of soil CO2 balance is then calculated using a time series of BA provided by the Finnish National Forest Inventory, NFI (Tomppo et al., 2011; Korhonen et al., 2021), combined with a time series of air temperature. Since drained peatland forests are not evenly distributed across Finland, the temperature-dependent peat and litter decomposition is modeled using spatially matched environmental variables. With this method, soil CO2 balance can be estimated as a difference of C added to soil via litter input and CO2 lost through SOM decomposition (Ojanen et al., 2012).
The CO2 balance calculation method that was applied earlier in the Finnish GHG inventory for drained peatland forest soils also had dynamic components, but only in terms of belowground litter input. We call it the “semi-dynamic” or “previous” method in this paper. The estimate of SOM decomposition was static and spatially poorly representative as it relied on data collected from a limited number of field sites (Minkkinen et al., 2007). Aboveground litter input was not included in the previous calculations. Producing a revised, fully dynamic method became possible when new data and empirical models appeared that were able to link together the drivers and components of soil CO2 balance (Ojanen et al., 2010, 2012, 2013, 2014). To illustrate the consequences of adopting the new method for the GHG inventory of Finland, we also present, for comparison, the CO2 balance of drained peatland forest soils as estimated by the earlier semi-dynamic method (Statistics Finland, 2022).
2.1 The concept of soil CO2 balance
The estimation of soil CO2 balance (CO2 Net) is based on the annual difference between the release of CO2 from decomposing soil organic matter (SOM), or heterotrophic soil respiration RHet, and the C entering the soil through plant litter input, and it can be expressed as
where IAGL and IBGL are the annual C mass input (t or Mt of C, as appropriate in the context) of aboveground and belowground litter, respectively, from living trees and ground vegetation; IAGR and IBGR are the annual C input of aboveground and belowground residues, respectively, from forest harvests and naturally dying trees; and is the ratio of CO2 and C molar masses, converting the organic C in dead organic matter to the respective mass unit of CO2. Positive results in Eq. (1) appear when decomposition RHet is larger than the input of litter and residues and denote net CO2 emission from the soil to the atmosphere. Negative values denote a net increase in soil C stock. The time dimension of CO2 balance is 1 year, and decomposition therefore includes wintertime decay as well.
RHet can further be defined as the sum of peat decomposition and decomposition of aboveground and belowground plant litter as well as residues from harvests and trees that died naturally:
where DP is the annual CO2 release (t or Mt of CO2, as appropriate in the context) from decomposing peat, DAGL and DBGL are the annual CO2 release from decomposing aboveground and belowground litter, respectively, of living trees and ground vegetation, and DAGR and DBGR are the annual CO2 release from decomposing aboveground and belowground harvest and natural mortality residues, respectively (Fig. 1). Autotrophic (root) respiration is not a part of the soil C stock change and is therefore not included in RHet. To focus on CO2 release from SOM, not confounded by autotrophic root respiration, the field plots were trenched (Ojanen et al., 2013).
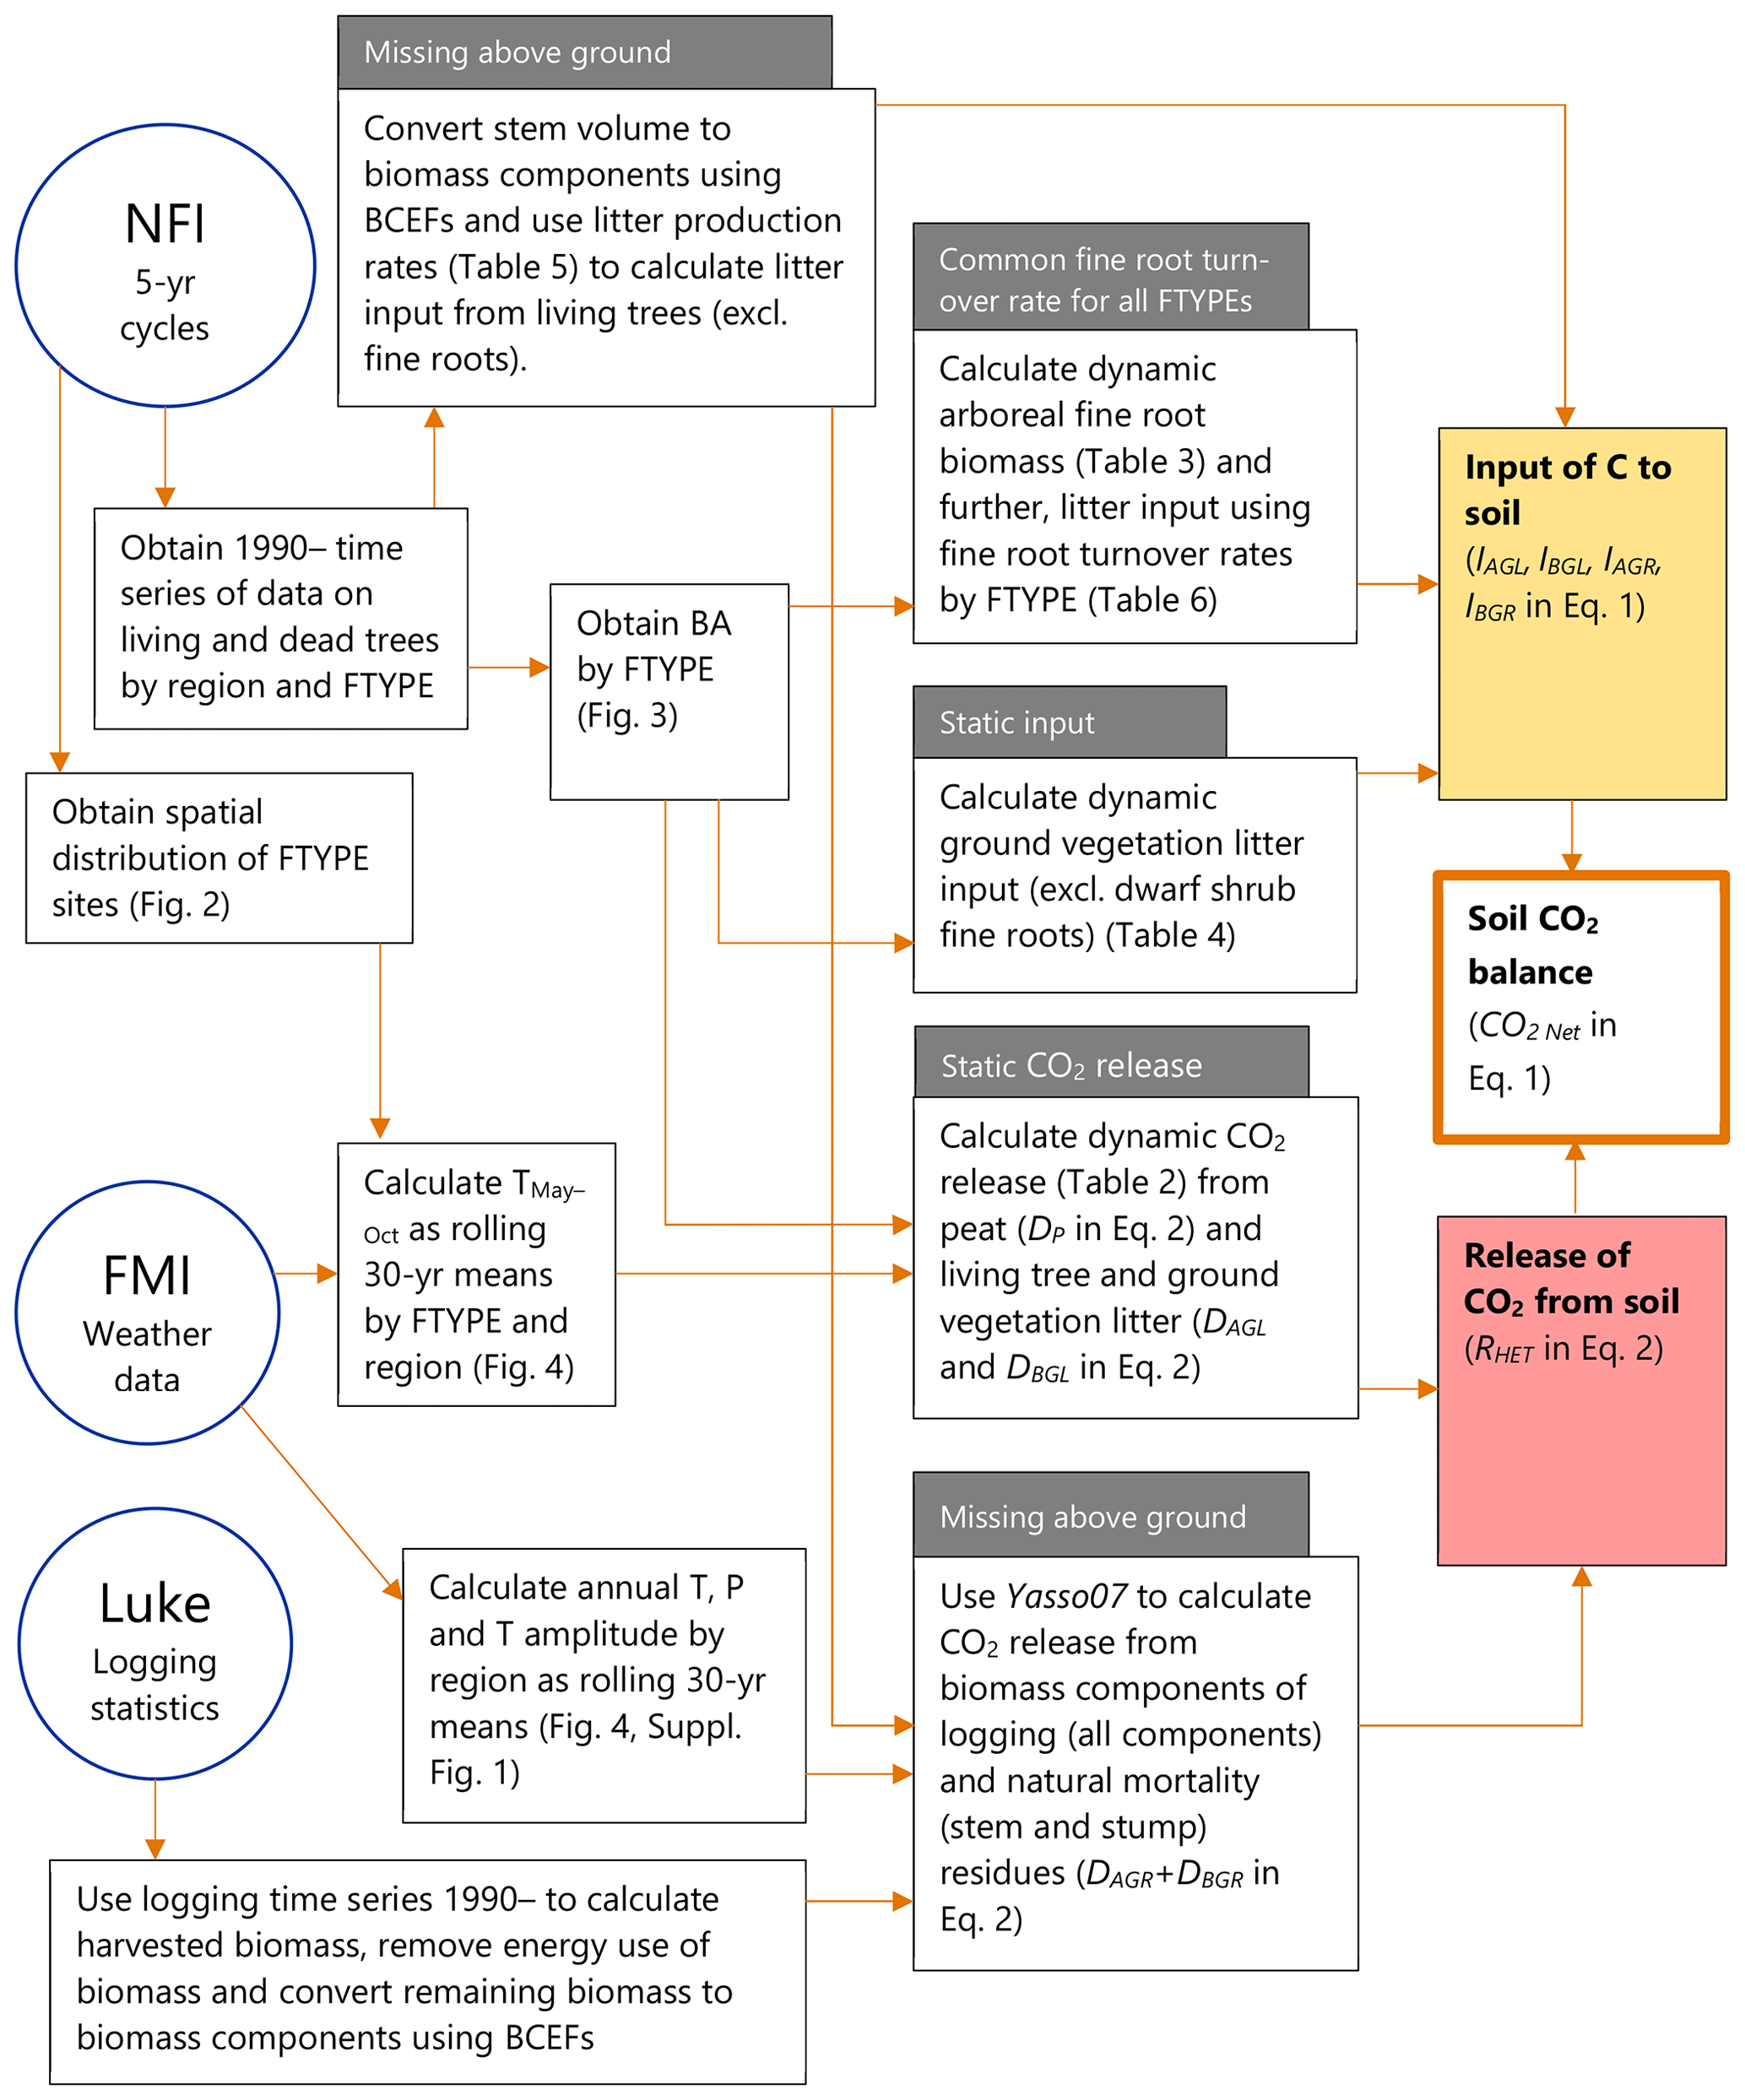
Figure 1Sources of data and workflow for the new method to produce the time series of annual soil CO2 balance for drained organic forest land in the GHG inventory of Finland. NFI means the National Forest Inventory, FMI is the Finnish Meteorological Institute and “Luke” is the Natural Resources Institute Finland. Characteristics of the method previously applied in the GHG inventory, in comparison to the new method, are indicated in grey boxes. References to key figures, tables and equations are shown in the respective boxes. T: temperature, P: precipitation, BCEF: biomass conversion and expansion factor, FTYPE: drained peatland forest site type.
2.2 Drained peatland forest site types
One key element in our method is that litter input and decomposition are individually estimated for each drained peatland forest site type, hereafter denoted as FTYPE. In Finland, FTYPE classification was developed for guiding drainage and forest management on peatlands. It follows the general Finnish forest site type theory (Cajander, 1913) and uses species of trees and ground vegetation as indicators of moisture and fertility regimes. This typification of drained peatlands (Laine, 1989; Laine et al., 2012) is a practical tool for forestry and forest inventory in Finland. Forest growth and the rate of SOM decomposition are related to FTYPE: more fertile FTYPEs support greater tree biomass and growth, and consequently they also have higher decomposition rates (Silvola et al., 1996; Minkkinen et al., 2007; Ojanen et al., 2010).
The current typology of FTYPEs follows the principles presented in Laine et al. (2012) and includes a total of five FTYPEs: herb-rich FTYPE, Vaccinium myrtillus FTYPE, Vaccinium vitis-idaea FTYPE, dwarf shrub FTYPE and Cladonia FTYPE, listed in order of decreasing soil fertility (Table 1). Differences in fertility between FTYPEs are evident in tree and ground vegetation species composition (Table 1). We did not separate the two subtypes of the V. myrtillus and V. vitis-idaea FTYPEs (I and II with different original mire types; Laine et al., 2012) because field determination of FTYPE subtypes can be ambiguous, especially V. vitis-idaea. Drained peatland forest sites have been classified into FTYPEs in field surveys in all NFIs, but the classification shown in Table 1 has only been employed since NFI10 (carried out in 2004–2008). The FTYPEs used in NFI8 (1986–1994) and NFI9 (1996–2003) were converted to correspond to the classification in Table 1 using field-collected data on soil type, drainage status, site fertility and vegetation.
Table 1Characteristics of drained peatland forest site types (FTYPEs) and the GHG inventory estimates of their area and proportion of all drained peatland forest area remaining forest, based on NFI12 data and following the FAO forest classification, in southern and northern Finland (n: number of sample plot centers in each FTYPE). See Fig. 1 for the southern and northern regions of Finland and the distribution of FTYPEs across the regions.
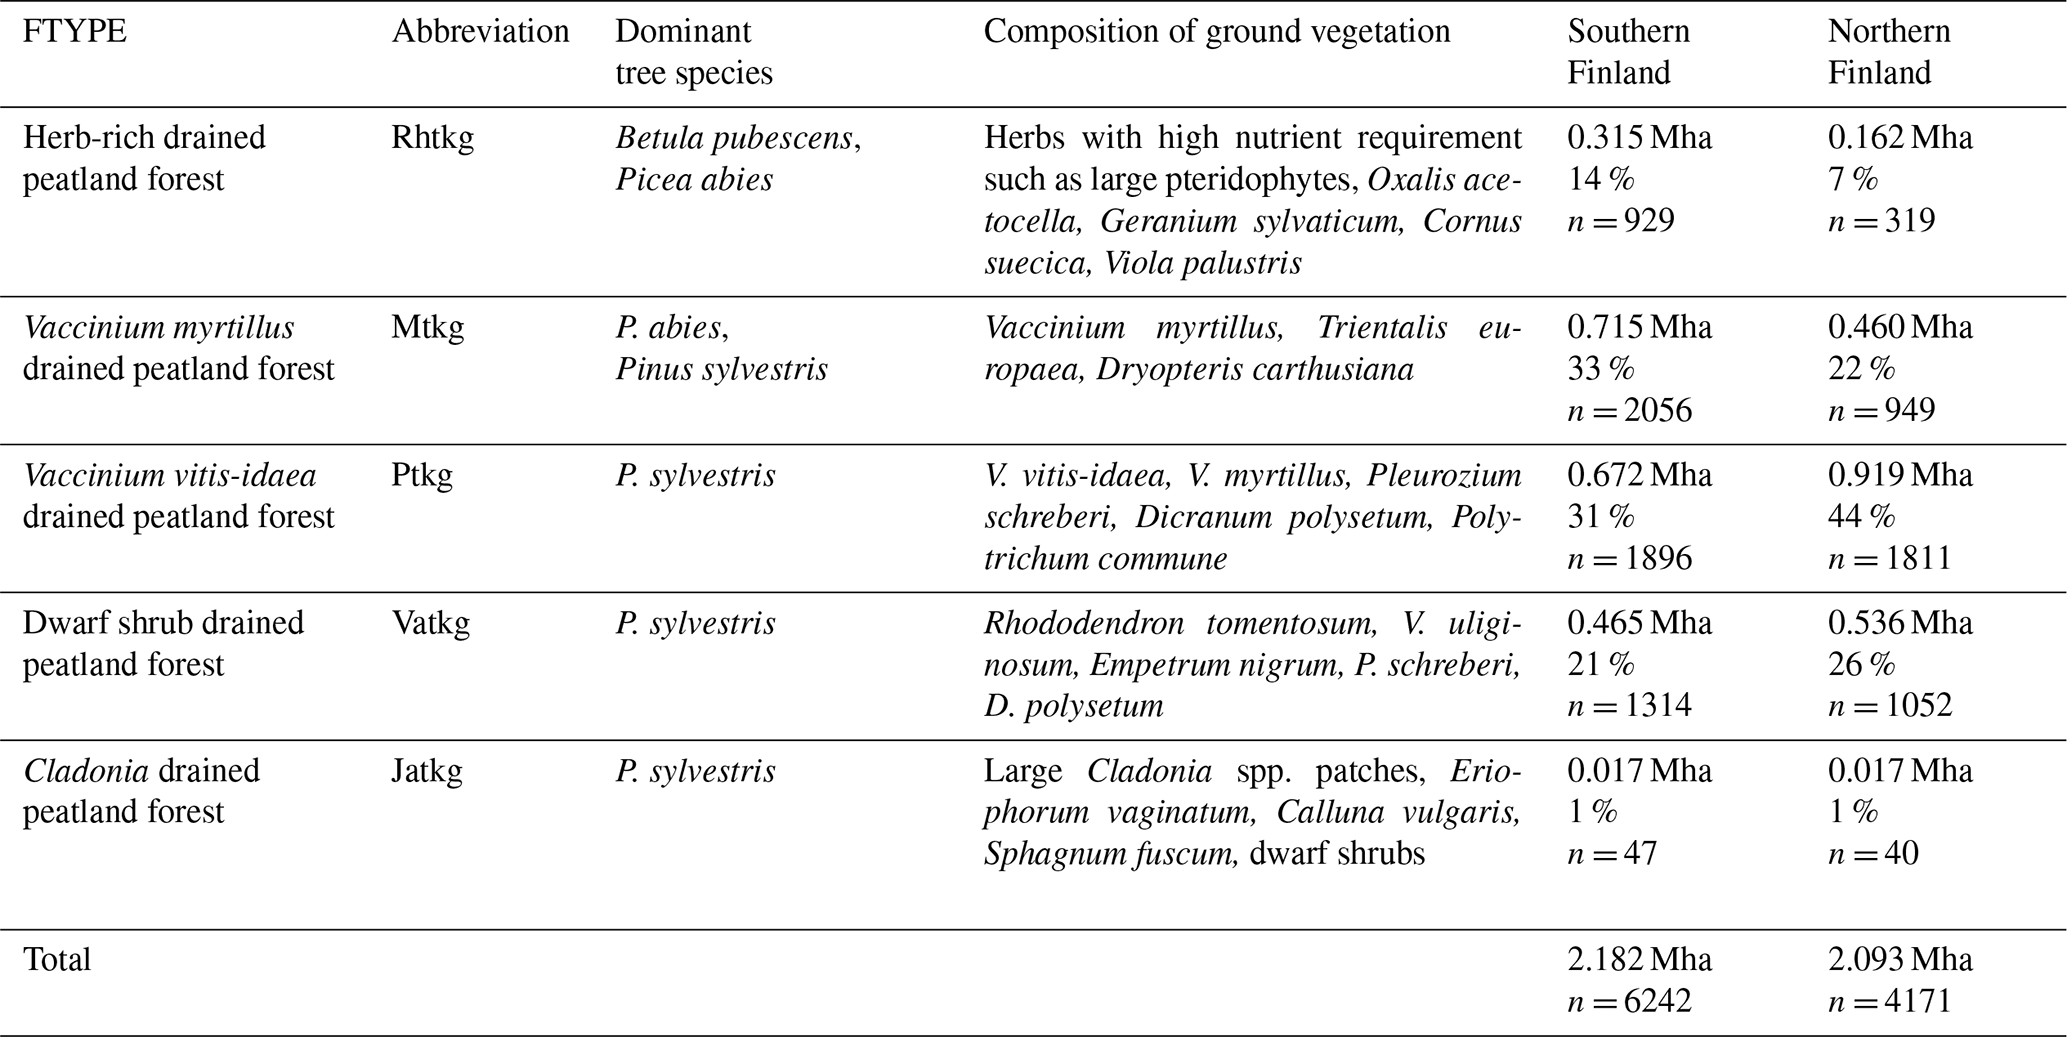
The areas and proportions of FTYPEs of all drained peatland “forests remaining forests” (i.e., forests that have not undergone another change in land use in the past 20 years) in southern and northern Finland, derived from NFI12 (2014–2018), are shown in Table 1, and the distribution of FTYPEs across Finland is illustrated in Fig. 2 (the definition of southern and northern Finland used in this paper follows the definition used in NFI). FTYPE areas have changed over the years due to changes in land use, such as new peatland drainage or reclamation of agricultural land. To provide a time series of FTYPE areas for the GHG inventory period starting from 1990 (Fig. 3), area data were collected from six NFIs, i.e., NFI8 (1986–1994), NFI9 (1996–2003), NFI10 (2004–2008), NFI11 (2009–2013), NFI12 (2014–2018) and NFI13 (2019–2023). As for all other time series that utilize NFI data, the years between NFI mid-years are interpolated. However, the years 1990–1992 in northern Finland are extrapolated because the NFI8 mid-year was after 1990, and from 2017 onwards the values are determined with the help of the not yet complete data from NFI13. The development of the Finnish NFI until NFI9 is described by Tomppo et al. (2011) and the sampling design of NFI12 by Korhonen et al. (2021).
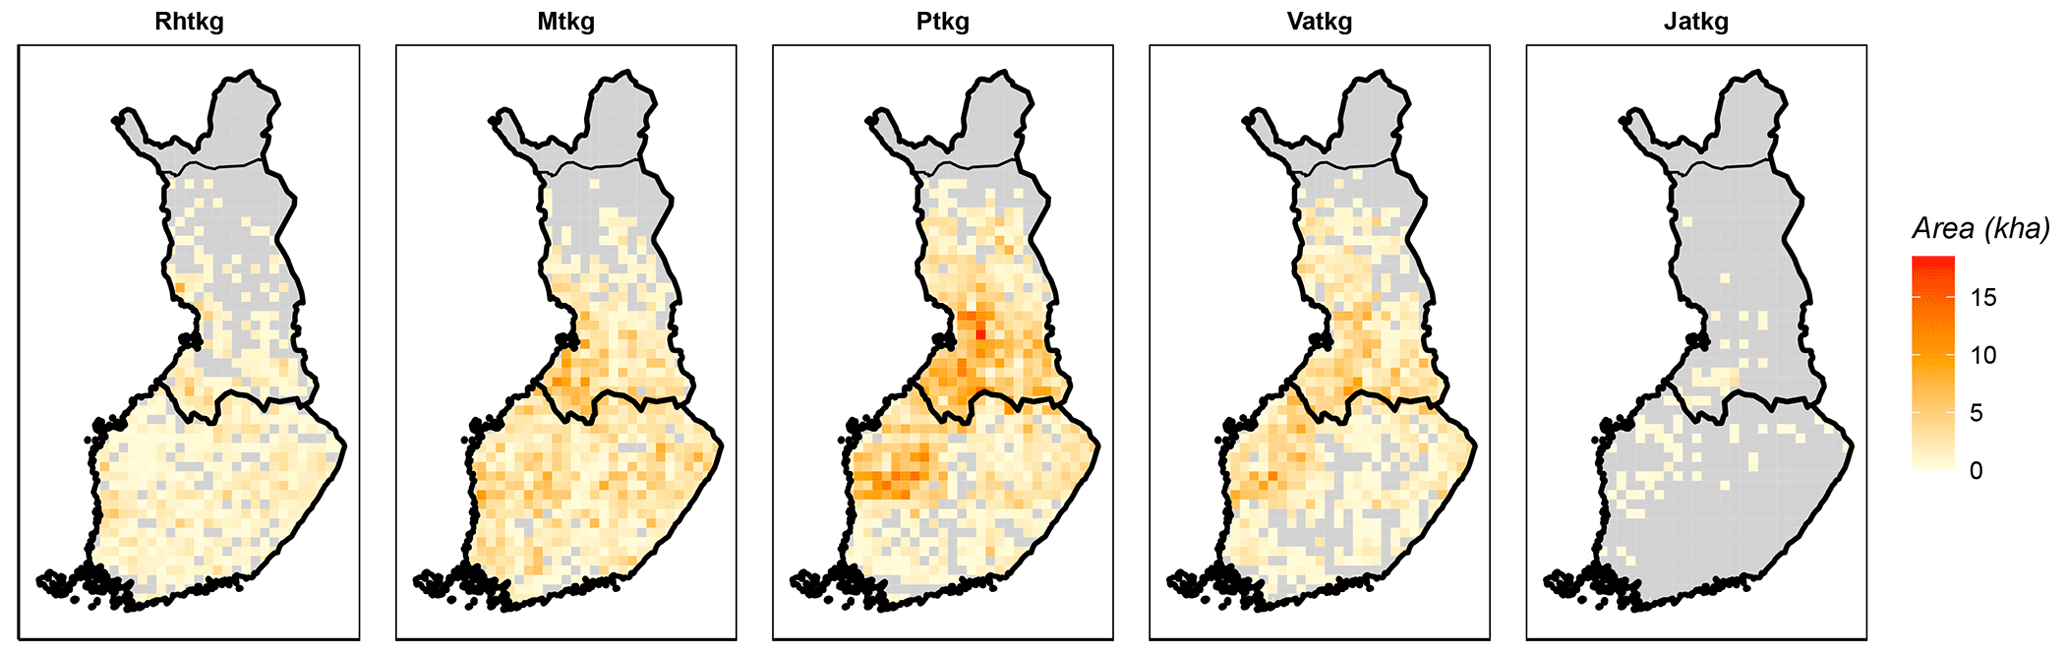
Figure 2Distribution of drained peatland forest site types (FTYPEs) in southern and northern Finland, as observed in NFI12. The color represents the area (kha) of FTYPE in a 20 km × 20 km grid cell, and the division of southern and northern Finland (thick black line) follows the division used in the NFI. The northernmost parts of the country (separated with a thin black line) are not included in NFI. Rhtkg: herb-rich FTYPE, Mtkg: Vaccinium myrtillus FTYPE, Ptkg: Vaccinium vitis-idaea FTYPE, Vatkg: dwarf shrub FTYPE, Jatkg: Cladonia FTYPE, listed in order of decreasing soil fertility.
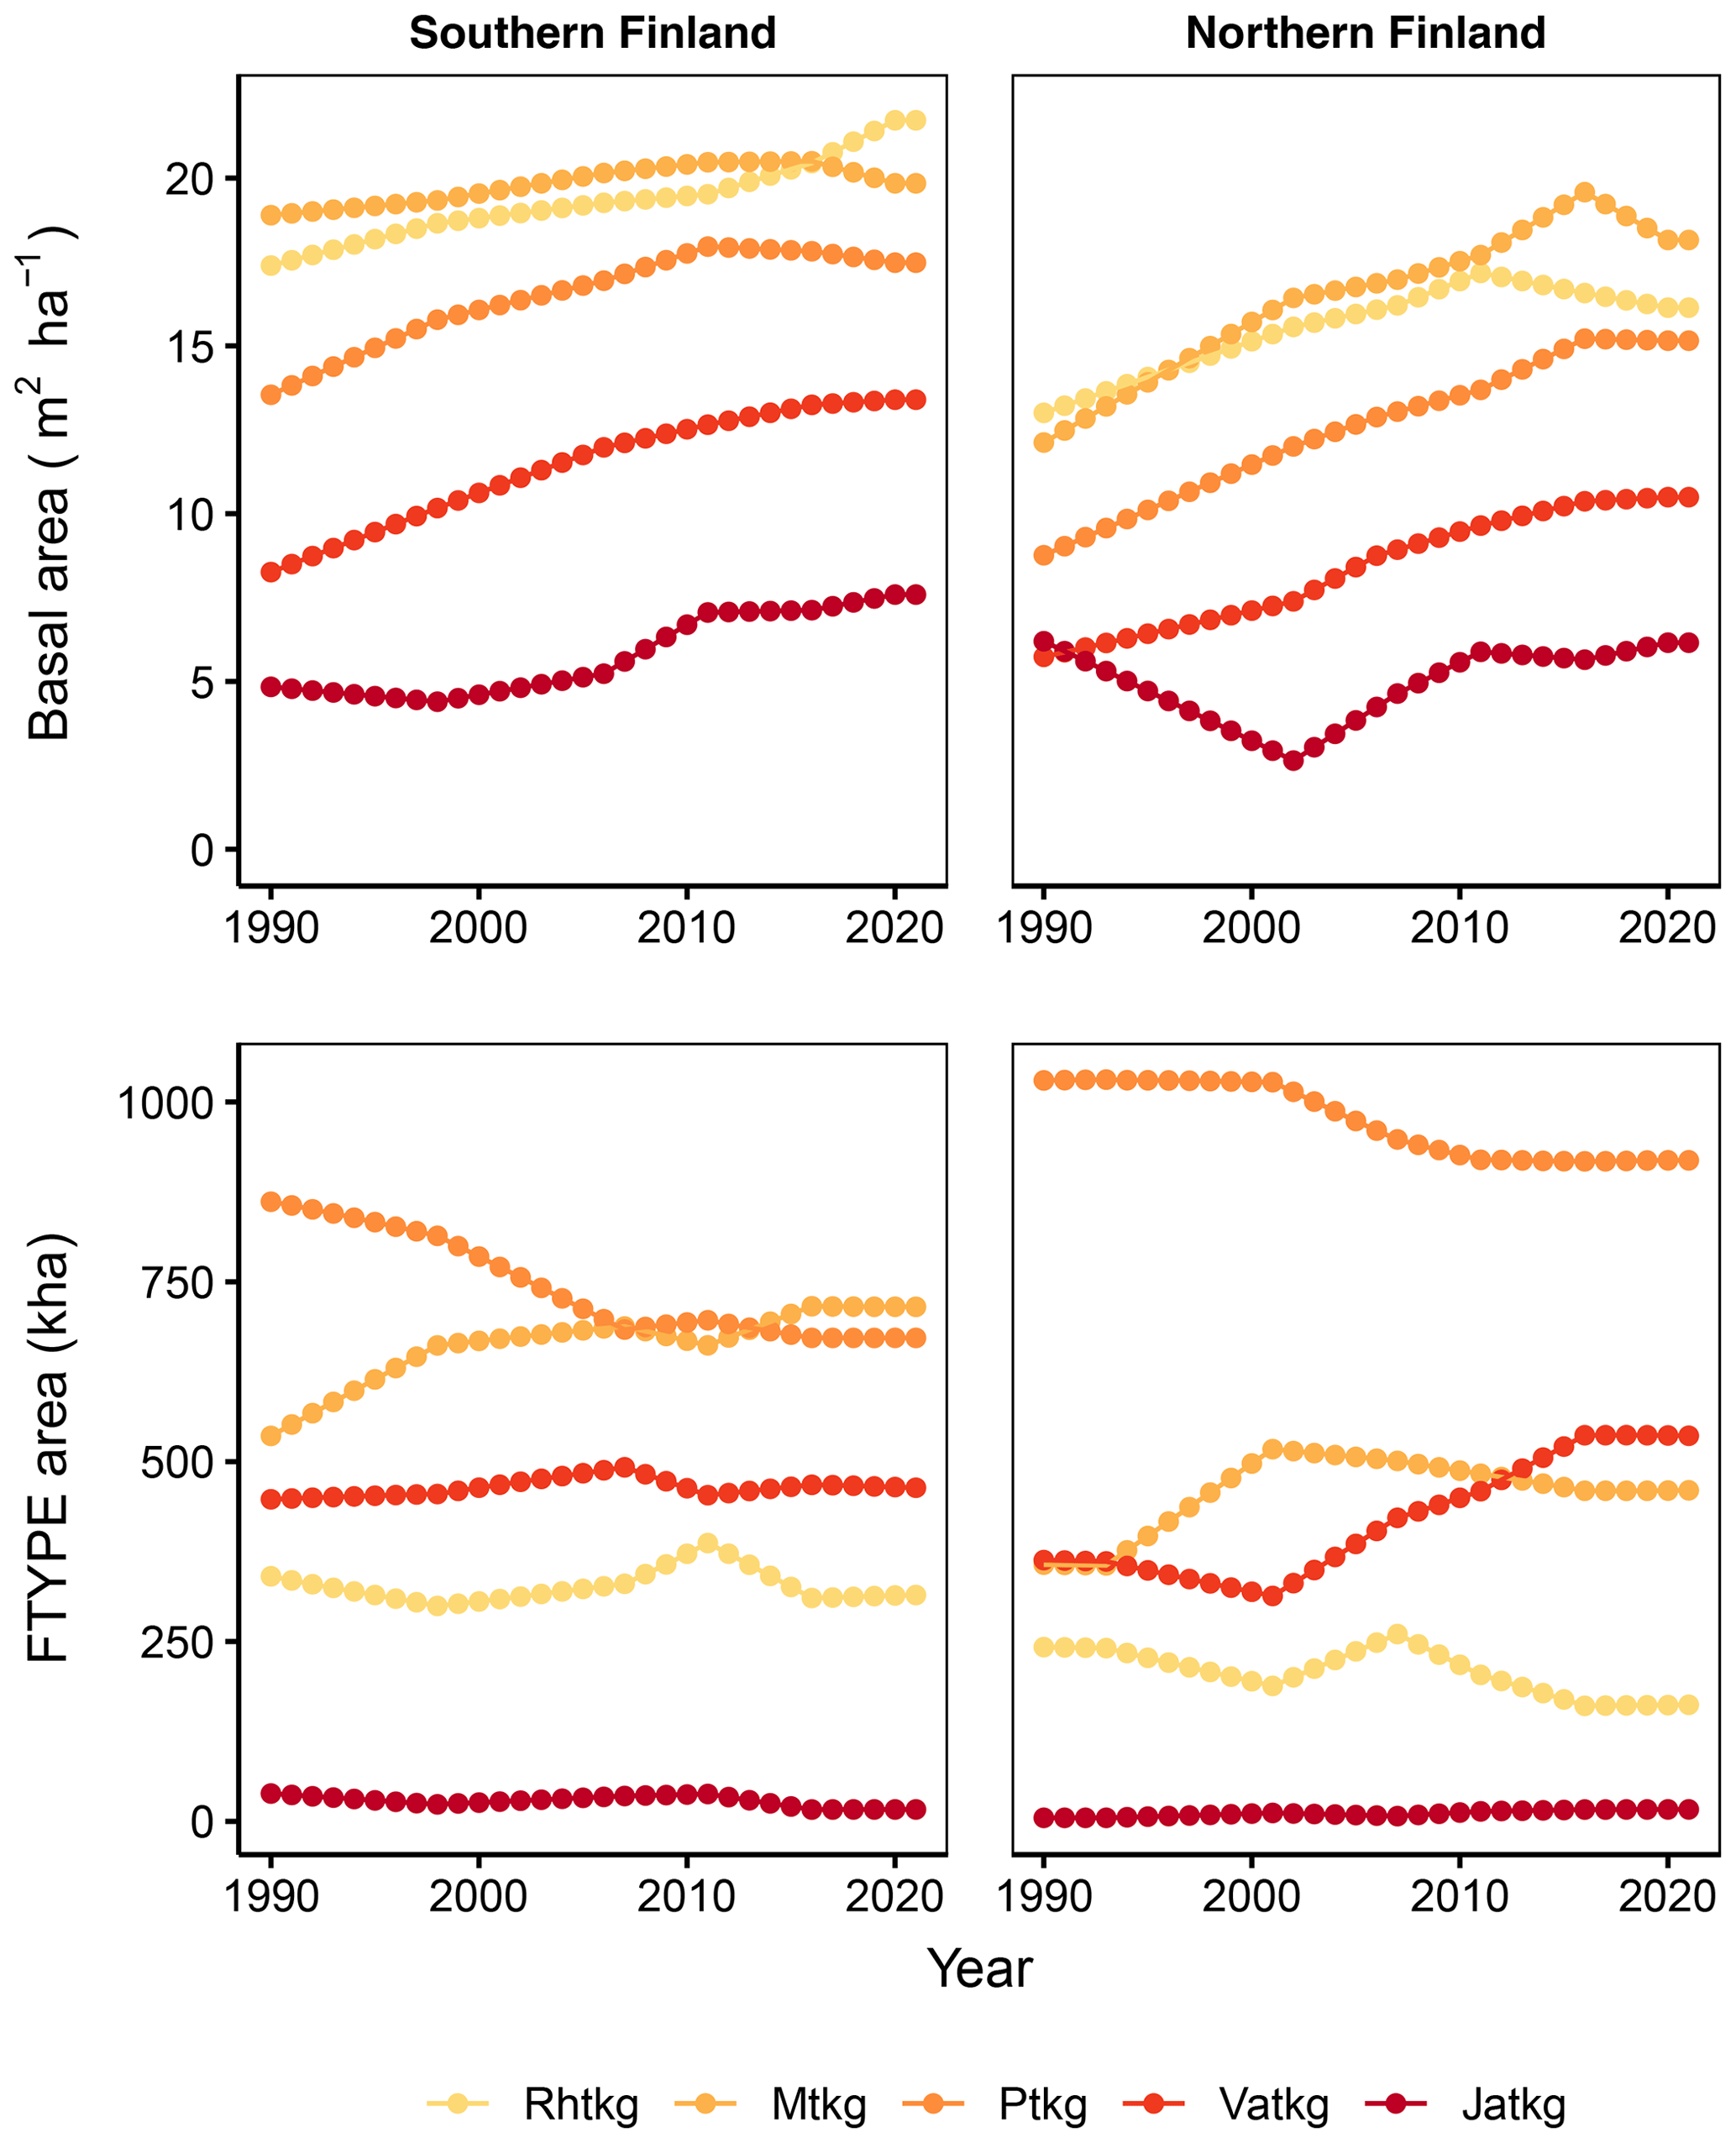
Figure 3Time series of basal area per hectare for each FTYPE and FTYPE areas in southern and northern Finland as estimated from NFI data. Rhtkg: herb-rich FTYPE, Mtkg: Vaccinium myrtillus FTYPE, Ptkg: Vaccinium vitis-idaea FTYPE, Vatkg: dwarf shrub FTYPE, Jatkg: Cladonia FTYPE, listed in order of decreasing soil fertility.
The drained peatland forest sites included in our data are those classified as forests in the Finnish FAO Global Forest Resources Assessment (FRA) (FAO, 2020): i.e., the area is ≥ 0.5 ha, trees are able to reach a height of 5 m and the canopy cover is > 10 %. Currently, NFI field surveys include FRA land classification, and the earlier datasets from the 1990s have been reclassified by NFI.
2.3 Climatic variables
The spatial distributions of FTYPEs (Fig. 2), and thereby their climatic attributes, differ due to geographic factors that originally resulted in the formation of different mires in Finland (Ruuhijärvi, 1960; Havas, 1961; Eurola, 1962). Therefore, the mean May–October air temperatures by FTYPE (approximating the growing season mean air temperature), which are needed to predict SOM decomposition in different FTYPEs (see Table 2), are calculated using real FTYPE distributions in southern and northern Finland (Fig. 2). Briefly, the May–October mean air temperature is first produced for each drained peatland forest location by combining the location data from sample plots in NFI12 with a 10 km × 10 km weather grid data provided by the Finnish Meteorological Institute (Venäläinen et al., 2005). Using the obtained data, FTYPE mean values are calculated for southern and northern Finland. For simplicity, NFI12 locations are used to calculate the FTYPE mean temperatures for all years in the 1990–2021 time series (i.e., we assume that FTYPE spatial distributions have not significantly changed in time). Lastly, the time series for both regions of the country are smoothed using 30-year rolling means (Fig. 4). Smoothed long-term means follow long-term trends, such as gradual warming, but do not bring annual fluctuation in the results and thus help in revealing the anthropogenic impact of changes in drainage area, forest development and harvests on managed land emissions.
Table 2Empirical regression models of CO2 release from peat and litter decomposition for FTYPEs as used in the new method. The regression models are from Ojanen et al. (2014), except that the constants for the V. myrtillus and V. vitis-idaea FTYPEs are weighted means of constants of the two subtypes; BA: tree stand basal area (m2 ha−1), T: mean May–October air temperature (∘C).
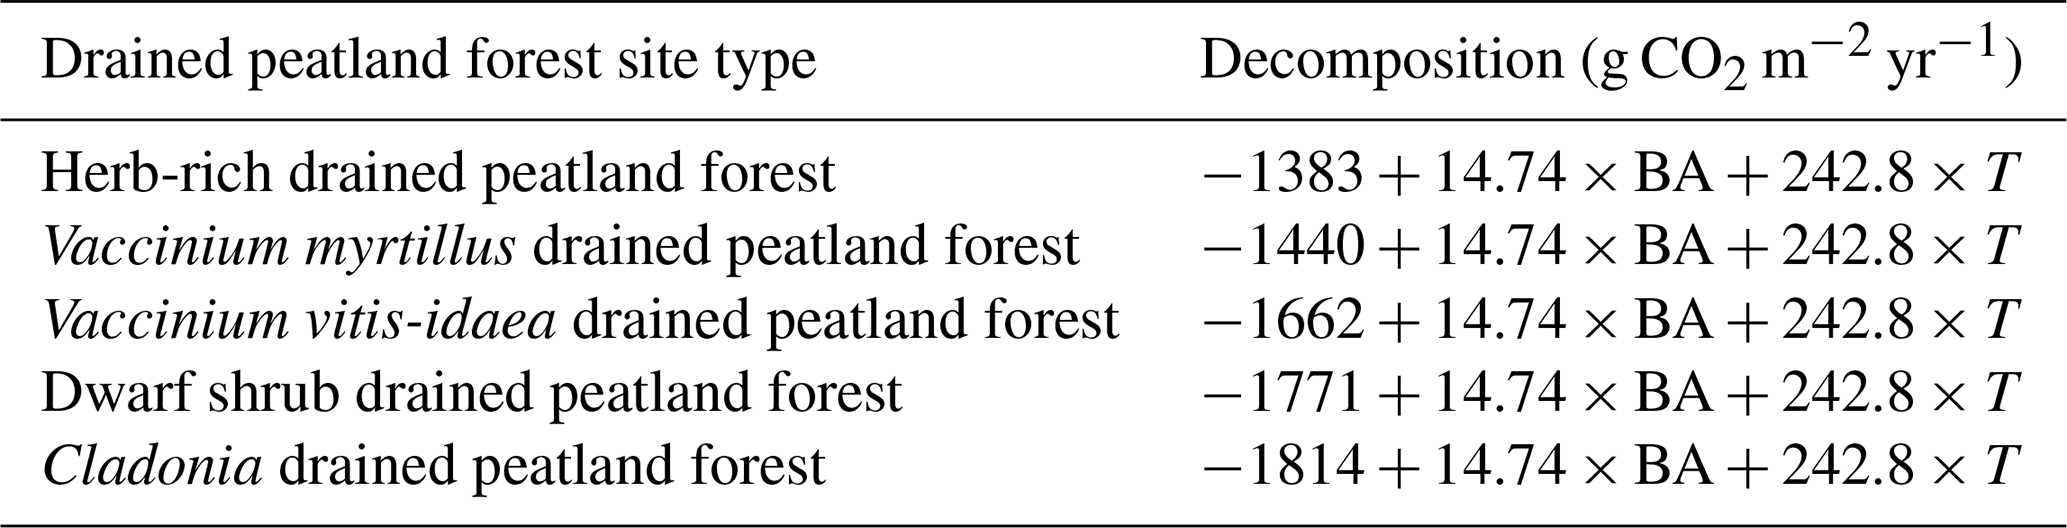
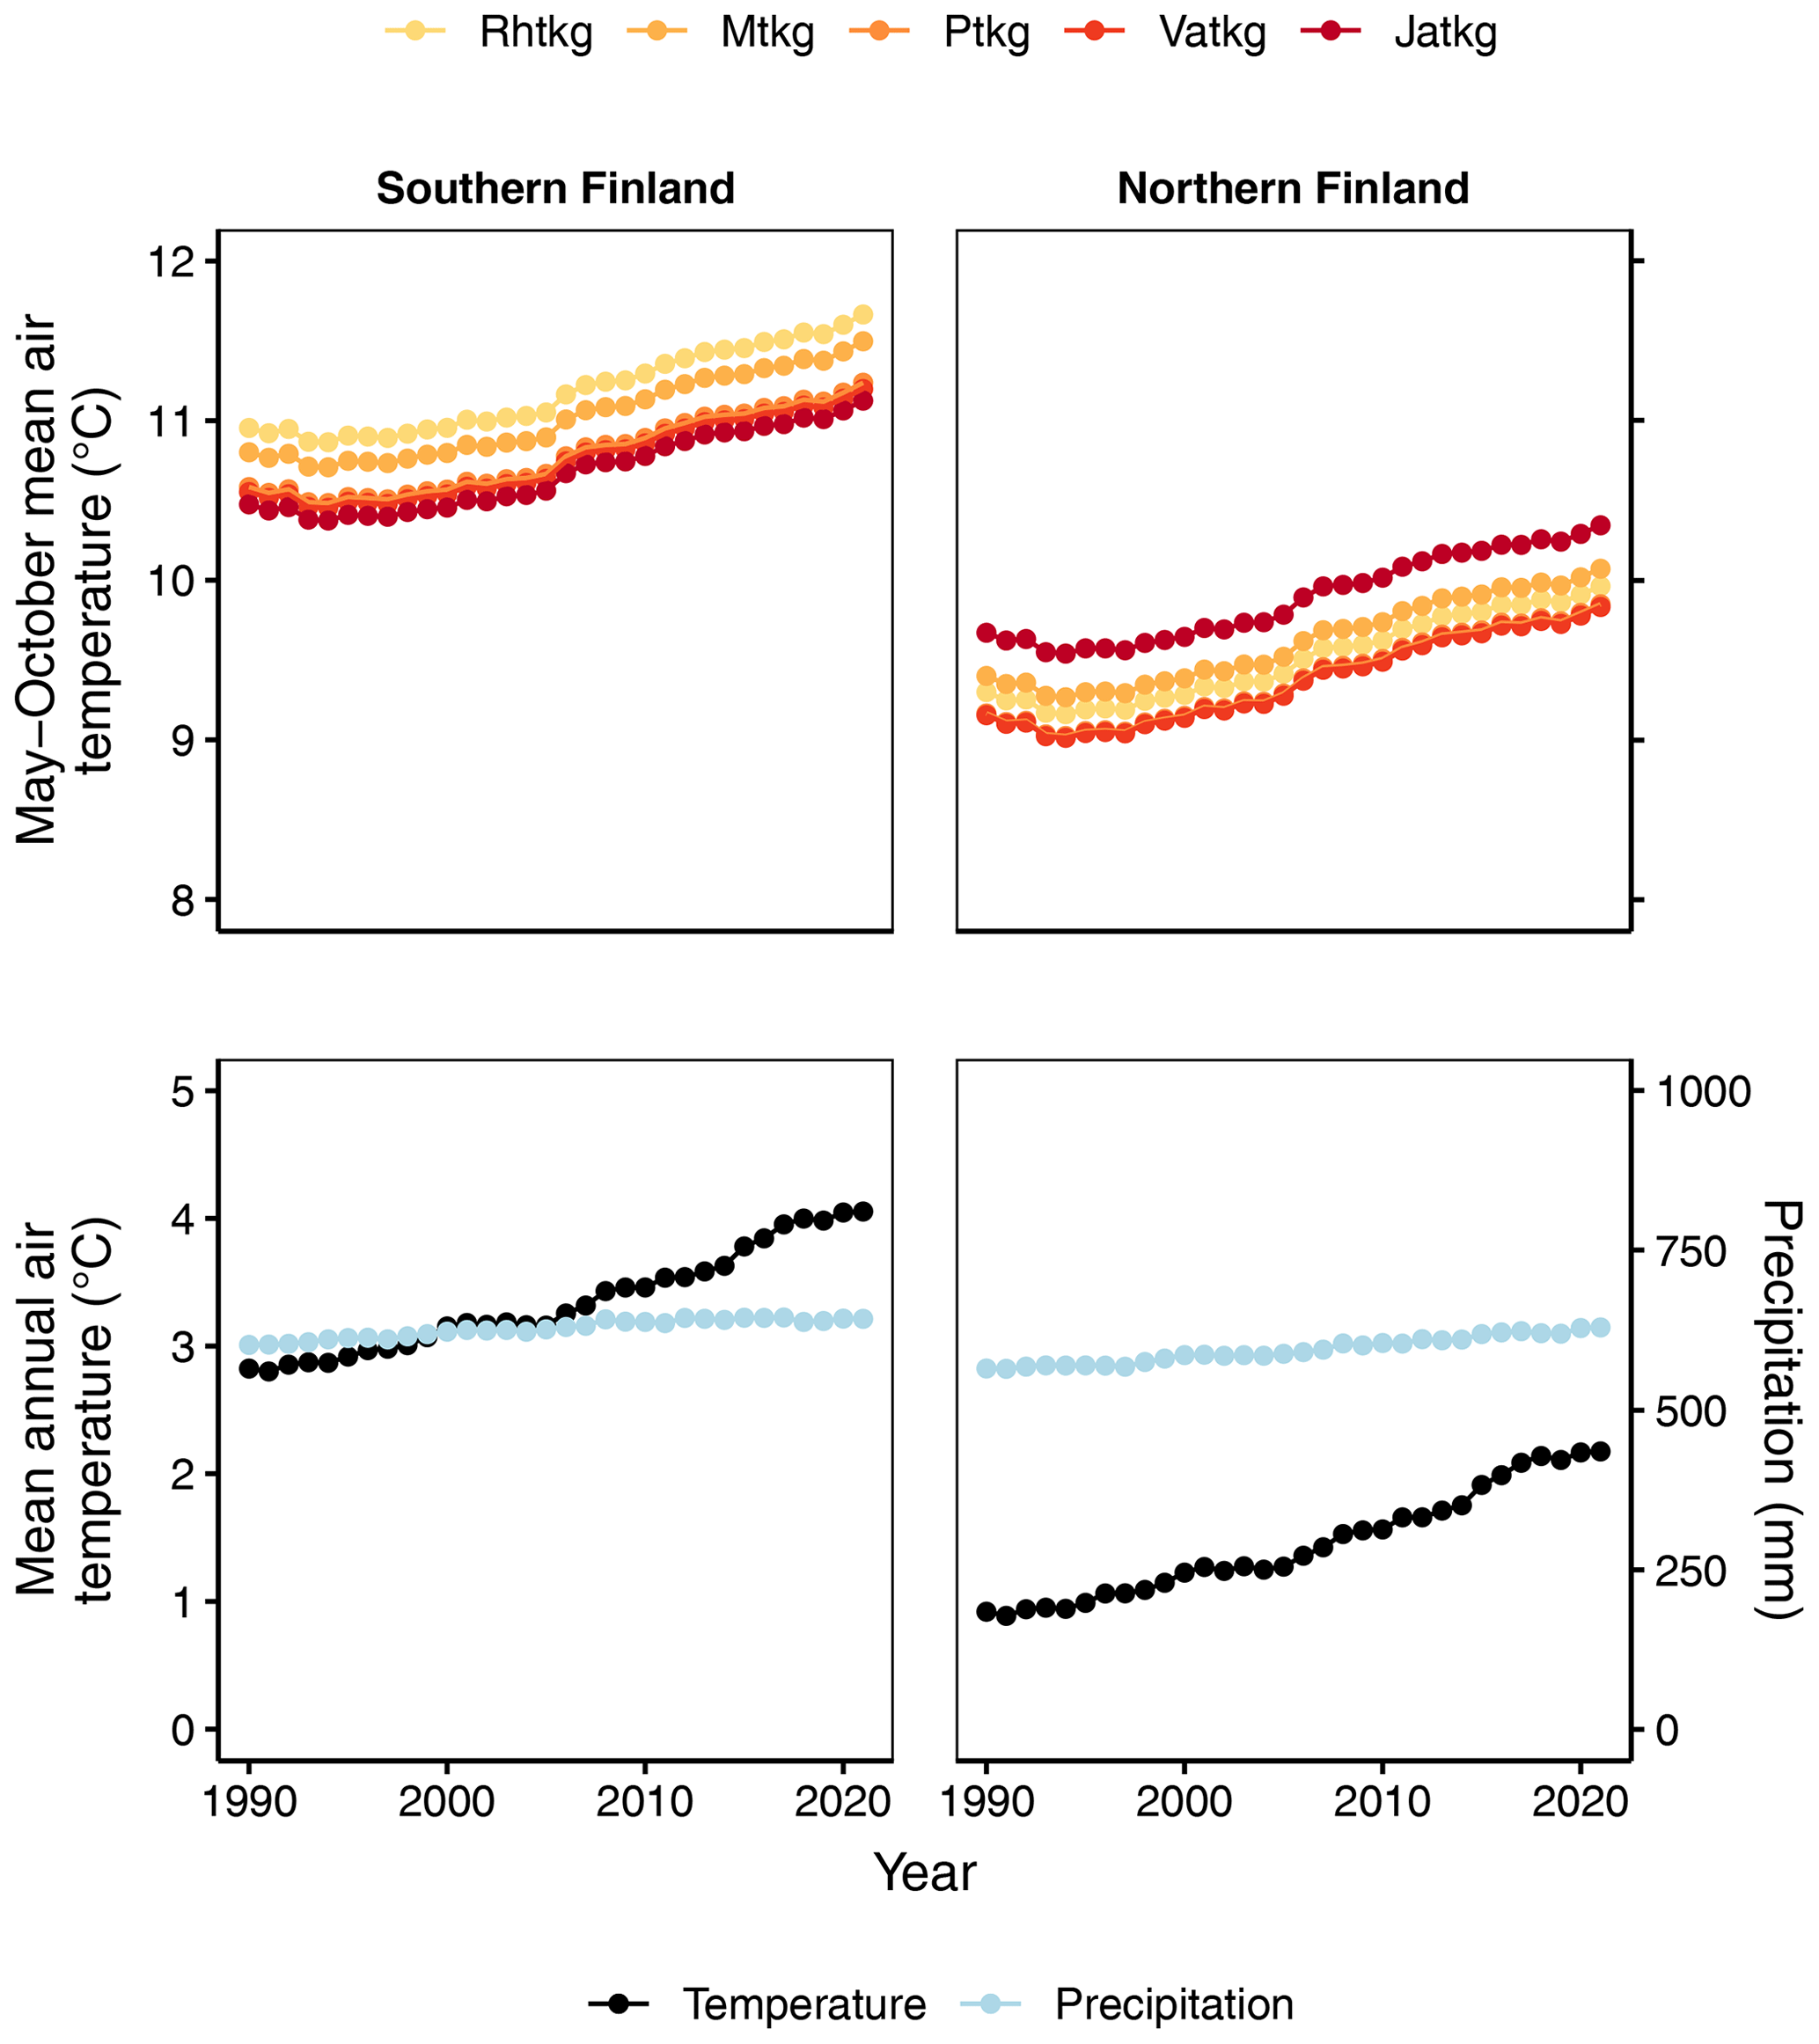
Figure 4May–October mean air temperature for each FTYPE in southern and northern Finland and mean annual air temperature and precipitation of all drained peatland forests in southern and northern Finland for 1990–2021. In all cases, the means are 30-year rolling means. Rhtkg: herb-rich FTYPE, Mtkg: Vaccinium myrtillus FTYPE, Ptkg: Vaccinium vitis-idaea FTYPE, Vatkg: dwarf shrub FTYPE, Jatkg: Cladonia FTYPE, listed in order of decreasing soil fertility.
Decomposition, i.e., CO2 production of litter from forest harvests and trees that died naturally, is calculated using the Yasso07 model (Tuomi et al., 2009, 2011), which uses mean annual temperature, temperature amplitude (the difference between the mean temperature of the warmest and coldest month divided by 2) and annual precipitation as environmental drivers. Spatially weighed and smoothed 1990–2021 time series for these variables are produced as for May–October mean air temperature above, but since the harvest residue data are currently allocated between southern and northern Finland, not to each FTYPE, the means are calculated for southern and northern Finland, not for each FTYPE (Fig. 4, Supplement Fig. S1).
2.4 Basal area
FTYPE mean basal area per hectare, BA (Fig. 3), is used to predict peat and litter CO2 release (see Table 2) as well as ground vegetation and arboreal fine root litter input (Tables 3, 4). The FTYPE mean BA is estimated using data on tree stem diameter (measured at breast height, DBH) of tree species groups (pine, spruce and deciduous species), collected in the sample plots of the NFI8–NFI13 inventories. As in the case of FTYPE areas, FTYPE mean BAs are interpolated for years between the NFI mid-years, extrapolated for 1990–1992 in northern Finland and derived from the not yet complete NFI13 for the years 2017–2021 to produce the time series needed in GHG inventory (Fig. 3). BAs have generally increased with time in drained peatlands, demonstrating the benefits of drainage for tree growth (Fig. 3).
Table 3Regression models from Ojanen et al. (2014) for estimating mean arboreal fine root (≤ 2 mm diameter) biomass (g m−2) for FTYPEs in southern and northern Finland. BA: mean basal area (m2 ha−1); decid: deciduous trees; covershrub: mean dwarf shrub cover (% of area), taken from Table 3.
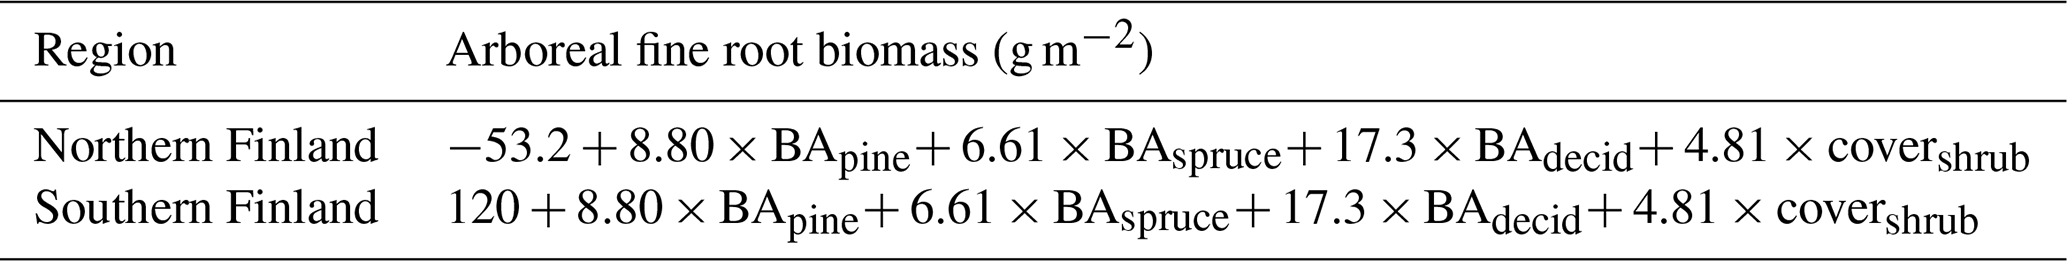
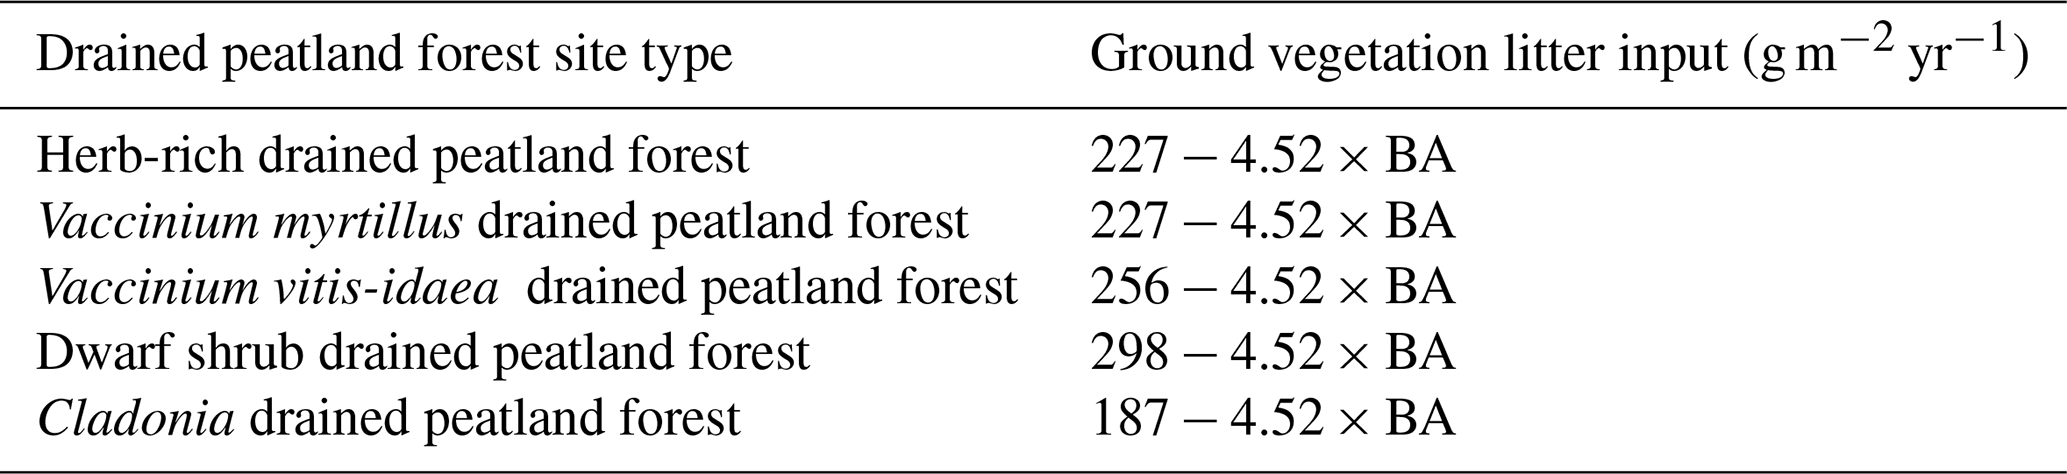
Table 4Regression models of litter input from ground vegetation (combined dry mass of aboveground and belowground litter excluding dwarf shrub fine root litter) in different FTYPEs. Models are from Ojanen et al. (2014), except for the constants of V. myrtillus and V. vitis-idaea FTYPEs, which are area weighted means of constants of their subtypes; BA: basal area (m2 ha−1).
2.5 Calculating litter input
Plant litter input consists of (1) litter from living trees (excluding fine root litter), (2) arboreal fine root litter (roots of trees and dwarf shrubs with ≤ 2 mm diameter), (3) ground vegetation litter (excluding dwarf shrub fine root litter), and (4) litter originating from forest harvests and natural tree mortality. In all calculations, all litter is assumed to contain 50 % C of dry mass.
To estimate litter input from living trees, the mean biomass (Mg ha−1) of each tree component (stem wood, stem bark, live branches, dead branches, foliage, base and stump, and coarse roots of > 10 mm diameter) for each FTYPE is first obtained from NFI. These biomasses are calculated by multiplying mean stem volume in each FTYPE with biomass conversion and expansion factors (BCEFs) based on biomass models of Repola (2008, 2009). BCEFs are component biomass to stem volume ratios, estimated using a subsample of trees measured in detail in each NFI for all different combinations of tree species group, FTYPE, and south and north region. Inputs of litter from living trees, consisting of senesced foliage, branches, stem and stump bark, and coarse roots (> 10 mm diameter), are then estimated by multiplying the biomass estimates and litter production rates (Table 5) of tree components. Litter production rate tells the proportion of the component mass that turns into litter in a year.
Table 5Litter production rates of tree biomass components (i.e., the proportion of the component mass that turns into litter in a year) as derived from studies by Lehtonen et al. (2004), Muukkonen and Lehtonen (2004), Starr et al. (2005), Liski et al. (2006), and Ojanen et al. (2014).
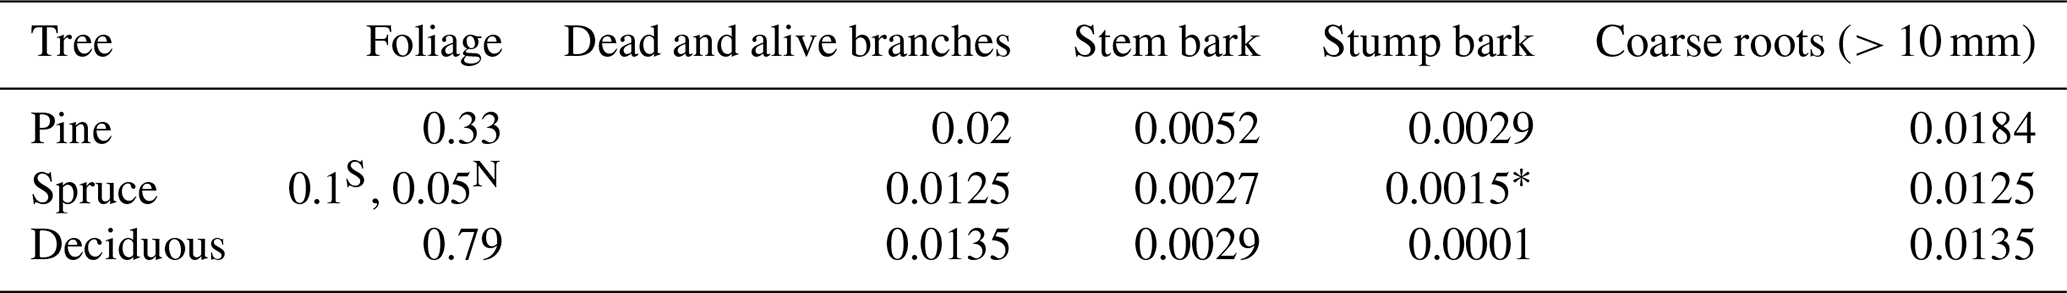
S Southern Finland, N northern Finland, * calculated as a mean of pine and deciduous tree estimates as no estimate for spruce was available from the literature.
To calculate arboreal fine root litter input, fine root biomass is first estimated for each FTYPE by using FTYPE mean BAs of tree groups and FTYPE mean dwarf shrub cover (Table 6) as predictors in empirical regression models (Table 3), obtained from Ojanen et al. (2014). Trees and dwarf shrubs are combined due to difficulties in distinguishing their fine roots in field samples. The dwarf shrub cover for the Vaccinium myrtillus and Vaccinium vitis-idaea FTYPEs is calculated as a weighted mean of values in I and II subtypes with the relative areas of subtypes (61.3 % and 38.7 % for the V. myrtillus FTYPE and 60.1 % and 39.9 % for the V. vitis-idaea FTYPE, respectively) as a weight factor. The fine root biomasses include an estimate for 0–20 cm rooting depth (Ojanen et al., 2013) plus 4.3 % in deeper depths (Laiho and Finér, 1996). Arboreal fine root litter input is then estimated by multiplying fine root standing biomass by the tree fine root turnover rate measured for each FTYPE (Table 6).
Table 6Dwarf shrub cover, obtained from Ojanen et al. (2014), and turnover rate of tree fine roots (≤ 0.5 mm diameter) in FTYPEs. The SDs are calculated from average median turnover rates.
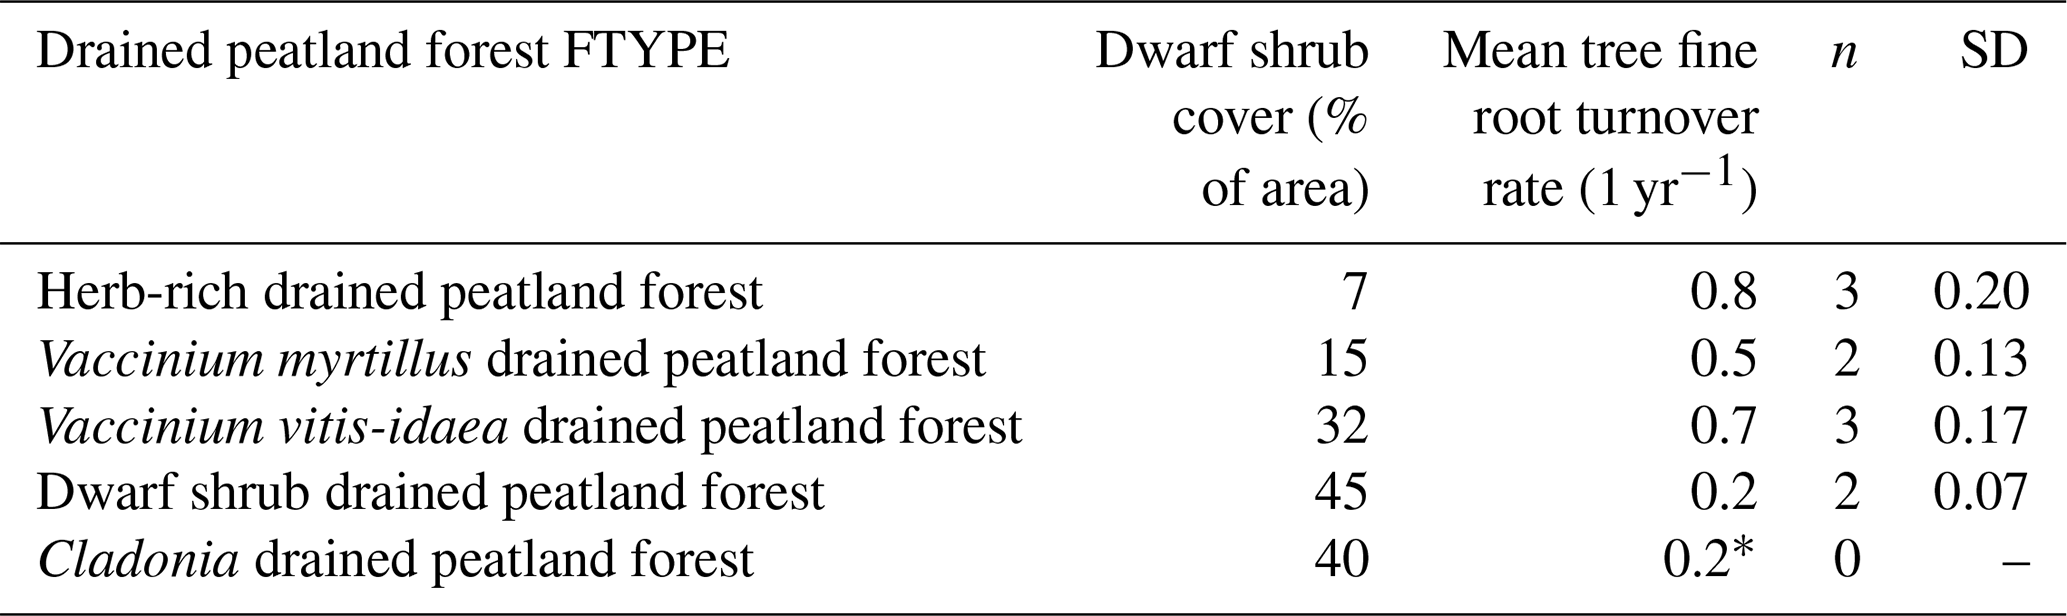
* Value replicated from dwarf shrub FTYPE as no respective site was measured.
Turnover rates of tree fine roots in Table 6 were estimated using minirhizotrons installed in each FTYPE (except for the Cladonia FTYPE, for which the estimate of the dwarf shrub FTYPE is used). Following the minirhizotron method (Lukac, 2012), transparent acrylic tubes (9–12 tubes per site) were installed into the soil on six sites to photograph fine roots (Kari Minkkinen et al., unpublished data). After a 1-year stabilization period, all tubes were photographed 19 times during 4 consecutive years. It has been stated that minirhizotrons may underestimate root longevity in short (< 3 years) studies since stabilization after installation disturbance may take several years (Strand et al., 2008). Our justification for a 1-year stabilization is that installation to peat soil causes little disturbance (no need to dig the soil) in comparison to installation to mineral soils, as in Strand et al. (2008). Images of 1.3 cm × 2 cm (height × width) were taken with a minirhizotron camera (BTC-2; Bartz Technology, Santa Barbara, USA) and analyzed using the WinRHIZO Tron 2015b program (Régent, Canada). The diameters, lengths and depths of roots were recorded. Root longevities (one per turnover) were determined as years with the method by Kaplan and Maier (1958) using median longevity, i.e., the lifetime when 50 % of the observed roots had died. If 50 % mortality was not reached during the monitoring period, a parametric regression model with Weibull error distribution was applied to predict it using survreg (Kalbfleisch and Prentice, 2002) in the R package Survival 3.4-0. The turnover rates are based on tree fine roots with ≤ 0.5 mm diameter, and they are applied for all arboreal fine roots of ≤ 2 mm diameter.
The mean combined aboveground and belowground litter input from ground vegetation (excluding dwarf shrub fine root litter input) is calculated for each FTYPE using FTYPE mean BA as a predictor in empirical regression models (Table 4), obtained from Ojanen et al. (2014). Notably, although dwarf shrub areal cover is assumed to remain static regardless of BA in different FTYPEs (Table 3), the regression models that predict ground vegetation litter input (Tables 4, 5) have BAs of trees as predictors and thus follow changes in BA in FTYPEs.
In forest harvests, most of the collected roundwood is utilized for wood products, but some is, together with harvest residues, used as energy wood. Therefore, to calculate litter input from harvest residues, a chain of calculations is needed. (1) Of all harvested roundwood volume in Finland (Luke statistics, 2022), the proportion that is collected from drained peatland forests is first derived using the respective share of harvest area data provided by the NFI. (2) This proportion of roundwood volume is then converted to total tree biomass, and (3) using data provided by LUKE Statistics (2022) of energy wood consumption, the part of biomass that is used for energy production is deducted from the total harvested biomass. (4) The remaining biomass is finally converted to different tree biomass components using specific BCEFs. Of these components, the foliage, branches, waste wood, stumps and coarse roots are assumed to remain in the harvest sites and thus to compose the harvest residue litter input.
The yearly production of litter from trees that died naturally is derived from NFI. For these trees, litter input consists of all biomass components, including the stem wood, calculated using appropriate BCEFs. Data on litter input from harvested trees and trees that died naturally are currently available for southern and northern Finland, but not for each FTYPE separately.
Finally, litter input lacks one biomass component, i.e., tree roots in the diameter range of 2–10 mm. The reason is that neither biomass nor turnover rate estimates are available for these roots. Omission of the 2–10 mm root litter input does not affect our estimate of heterotrophic decomposition of that litter fraction as it is based on inclusive empirical emission data; see below.
2.6 Calculating soil CO2 release, RHet
Annual CO2 release from decomposing peat, DP, and decomposing aboveground and belowground litter of living trees and ground vegetation, DAGL and DBGL, is calculated using empirical regression models given in Ojanen et al. (2014). These models, presented in Table 2, include an FTYPE-specific constant, FTYPE May–October mean air temperature (Fig. 3) and FTYPE mean BA (Fig. 3) as dynamic predictors. The data behind the regression models include field measurements on 68 drained peatland forest sites (Ojanen et al., 2010, 2013), which cover the distribution of FTYPEs in Finland (see Fig. 1 in Ojanen et al., 2010). The measurements were originally performed on field plots with aboveground litter removed, but the CO2 release from decomposing aboveground litter was later calculated using the Yasso07 decomposition model and added to the recorded values of CO2 release (Ojanen et al., 2013). To focus on CO2 release from SOM, not confounded by autotrophic root respiration, the field plots were trenched (Ojanen et al., 2013). The predicted CO2 release is a yearly estimate, although the temperature predictor is the mean May–October air temperature (Ojanen et al., 2014).
The soil CO2 release estimates produced by the regression models in Table 2 do not include CO2 release from harvest residues (the empirical data for the models were collected at sites without recent harvests) or from stump and stem wood of trees that died naturally (because these parts of litter did not fit inside the CO2 flow measurement chambers). The CO2 release from these litter components is therefore estimated using the Yasso07 decomposition model, combined with time series of southern and northern Finland mean annual air temperature, temperature amplitude and mean annual precipitation (Fig. 4, Supplement Fig. S2). Since the Yasso07 model produces the remaining OM pool after decomposition, the CO2 release from decomposing aboveground and belowground harvest residues as well as stump and stem wood of trees that recently died naturally, DAGR and DBGR, is calculated by subtracting the remaining OM pool from the inputs of these residues, IAGR and IBGR.
The Yasso07 model was first initialized for 50 years using constant residue input from harvests and trees that died naturally (mean of 1970–1976 input for southern Finland and mean of 1975–1977 input for northern Finland). The initialized model was then run from 1971 onwards using real annual residue input. During the 50-year initialization, the OM pool originating from harvest residues and trees that died naturally monotonically approached a plateau (Supplement Fig. S2). The rationale for using unusually short spin-up is that there is no long history for drained peatland forests in Finland (drainage activity rose after the 1940s and was most intensive in the 1970s) and the soil OM pool originating from anthropogenic activity has not been developing for long. Running a longer spin-up would create an unnaturally high harvest and natural tree mortality-based soil OM pool, leading to erroneously high CO2 release from these slowly decomposing C stocks during the GHG inventory reporting period. However, to be aware of the effects of the short spin-up, we also initialized the Yasso07 model for 1000 years. Increasing the length of initialization from 50 to 1000 years increased CO2 release over the years 1990–2021 annually by 2.4 %–0.6 % (mean 1.4 %) and 4.1 %–1.5 % (mean 2.8 %) in southern and northern Finland, respectively.
2.7 Uncertainty analysis
Uncertainty was assessed for each annual estimate of soil CO2 balance, as well as for the estimate of change in balance between the years 1990 and 2021. We use the IPCC (2006) guidelines, wherein uncertainty is defined as 1.96 × SEM (standard error of the mean) and given as a percentage of the sink–source estimate. When the uncertainty of the estimate is less than 100 %, zero is not included within the 95 % confidence limits of the estimate. The accounted sources of uncertainty included NFI sampling errors in area and BA estimates, estimation error in the parameters of the models, litter production rates and dwarf shrub coverage, and uncertainty about litter production originating from living trees, harvests and natural mortality. The details of variance propagation are given in Appendix A. These and all other computations were carried out in the R environment (R Core Team, 2020).
2.8 Earlier version of the calculation method
The earlier version of the calculation method of drained organic forest soil CO2 emissions applied in the GHG inventory of Finland (Statistics Finland, 2022) differs in many ways from the new revised method we present here. In the earlier version, the estimates of heterotrophic soil respiration in FTYPEs are based on results from two peatlands, located at 61∘ N, 25∘ E (covering FTYPEs from the herb-rich to dwarf shrub FTYPE) and 62∘ N, 31∘ E (representing the Cladonia FTYPE) (Nykänen et al., 1998; Minkkinen et al., 2007). The estimates include DP and DBGL only, are static in time, and do not make a difference between southern and northern Finland. Belowground litter input from living trees, ground vegetation, harvest residues and natural mortality is included, whereas aboveground litter input (and most of its decomposition) from living plants and harvests is excluded. Also, in contrast to the new revised method, the belowground litter input from ground vegetation is constant at 1.1 t CO2-C (or 4.0 t CO2) ha−1 yr−1 (Laiho et al., 2003), the arboreal fine root turnover rate is 0.85 for all FTYPEs (Liski et al., 2006) and tree leaf biomass is used as a proxy to estimate arboreal fine root biomass (Helmisaari et al., 2007).
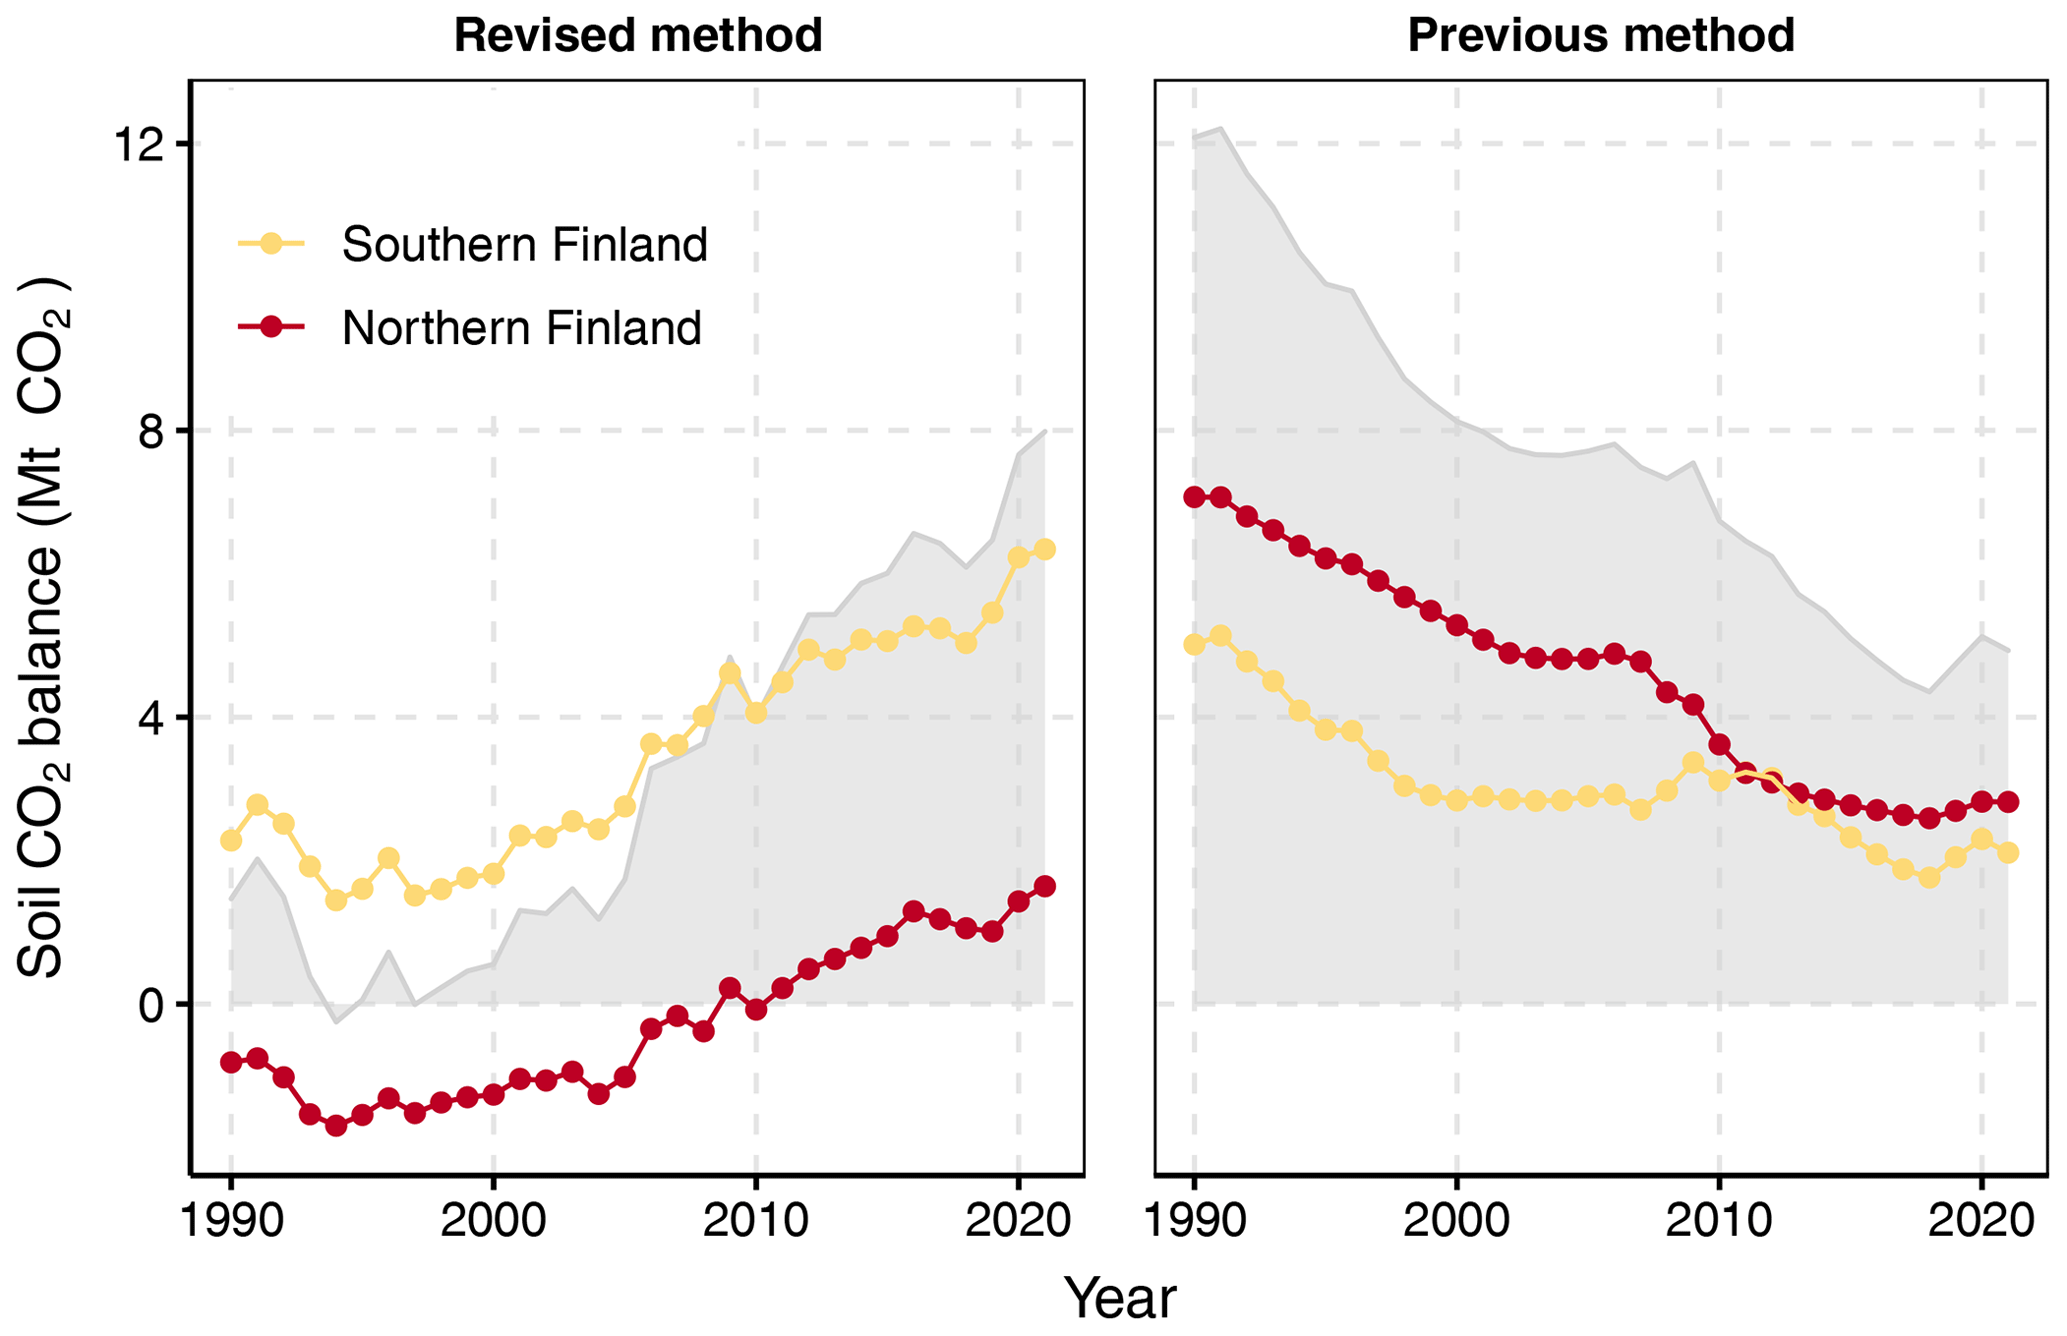
Figure 5Drained organic forest soil CO2 balance for the whole country (grey area) as well as southern Finland (yellow line) and northern Finland (red line) as produced by the new fully dynamic and the previous semi-dynamic method. See Fig. 1 for the two regions of the country.
3.1 Soil CO2 balance
The method developed in this study produces a generally increasing trend of annual emissions from 0.2 to 2.1 t CO2 ha−1 yr−1 for the period 1990–2021, equal to a trend from 1.4 to 7.9 Mt CO2 yr−1 for the entire 4.3 Mha area of drained peatland forests in Finland (Fig. 5). The difference between the years 1990 and 2021 is statistically significant (uncertainty 46 %; Table A10 in Appendix A). Across the period 1990–2021, emissions are on average 1.5 t CO2 ha−1 yr−1, or 3.4 Mt CO2 yr−1, for the whole area of 2.2 Mha in southern Finland and −0.14 t CO2 ha−1 yr−1, or −0.3 Mt CO2 yr−1, for the whole area of 2.1 Mha in northern Finland (Fig. 5). Considering the uncertainty, drained organic forest soils in southern Finland and in the whole country are a source of CO2 in 2021, while the 2021 net emission in northern Finland does not significantly differ from zero (Table A9 in Appendix A).
In contrast to the results produced by the new method, the earlier method produces a decreasing trend of total emissions from 12.1 to 3.2 Mt CO2 for the period 1990–2021 for the whole country, and the emissions are on average lower in southern than northern Finland (Fig. 5).
3.2 Total litter input and decomposition
The new method produces an increasing trend of litter input and decomposition for both southern and northern Finland (Fig. 6). In 2021, total litter input and decomposition are, per unit area, 28 % and 34 % higher in southern than northern Finland, respectively (Fig. 6). In both regions, the increasing trend in total litter input is mainly due to increasing input of aboveground tree litter and belowground arboreal litter (Fig. 6). These litter fractions also include residues from forest harvests and trees that died naturally.
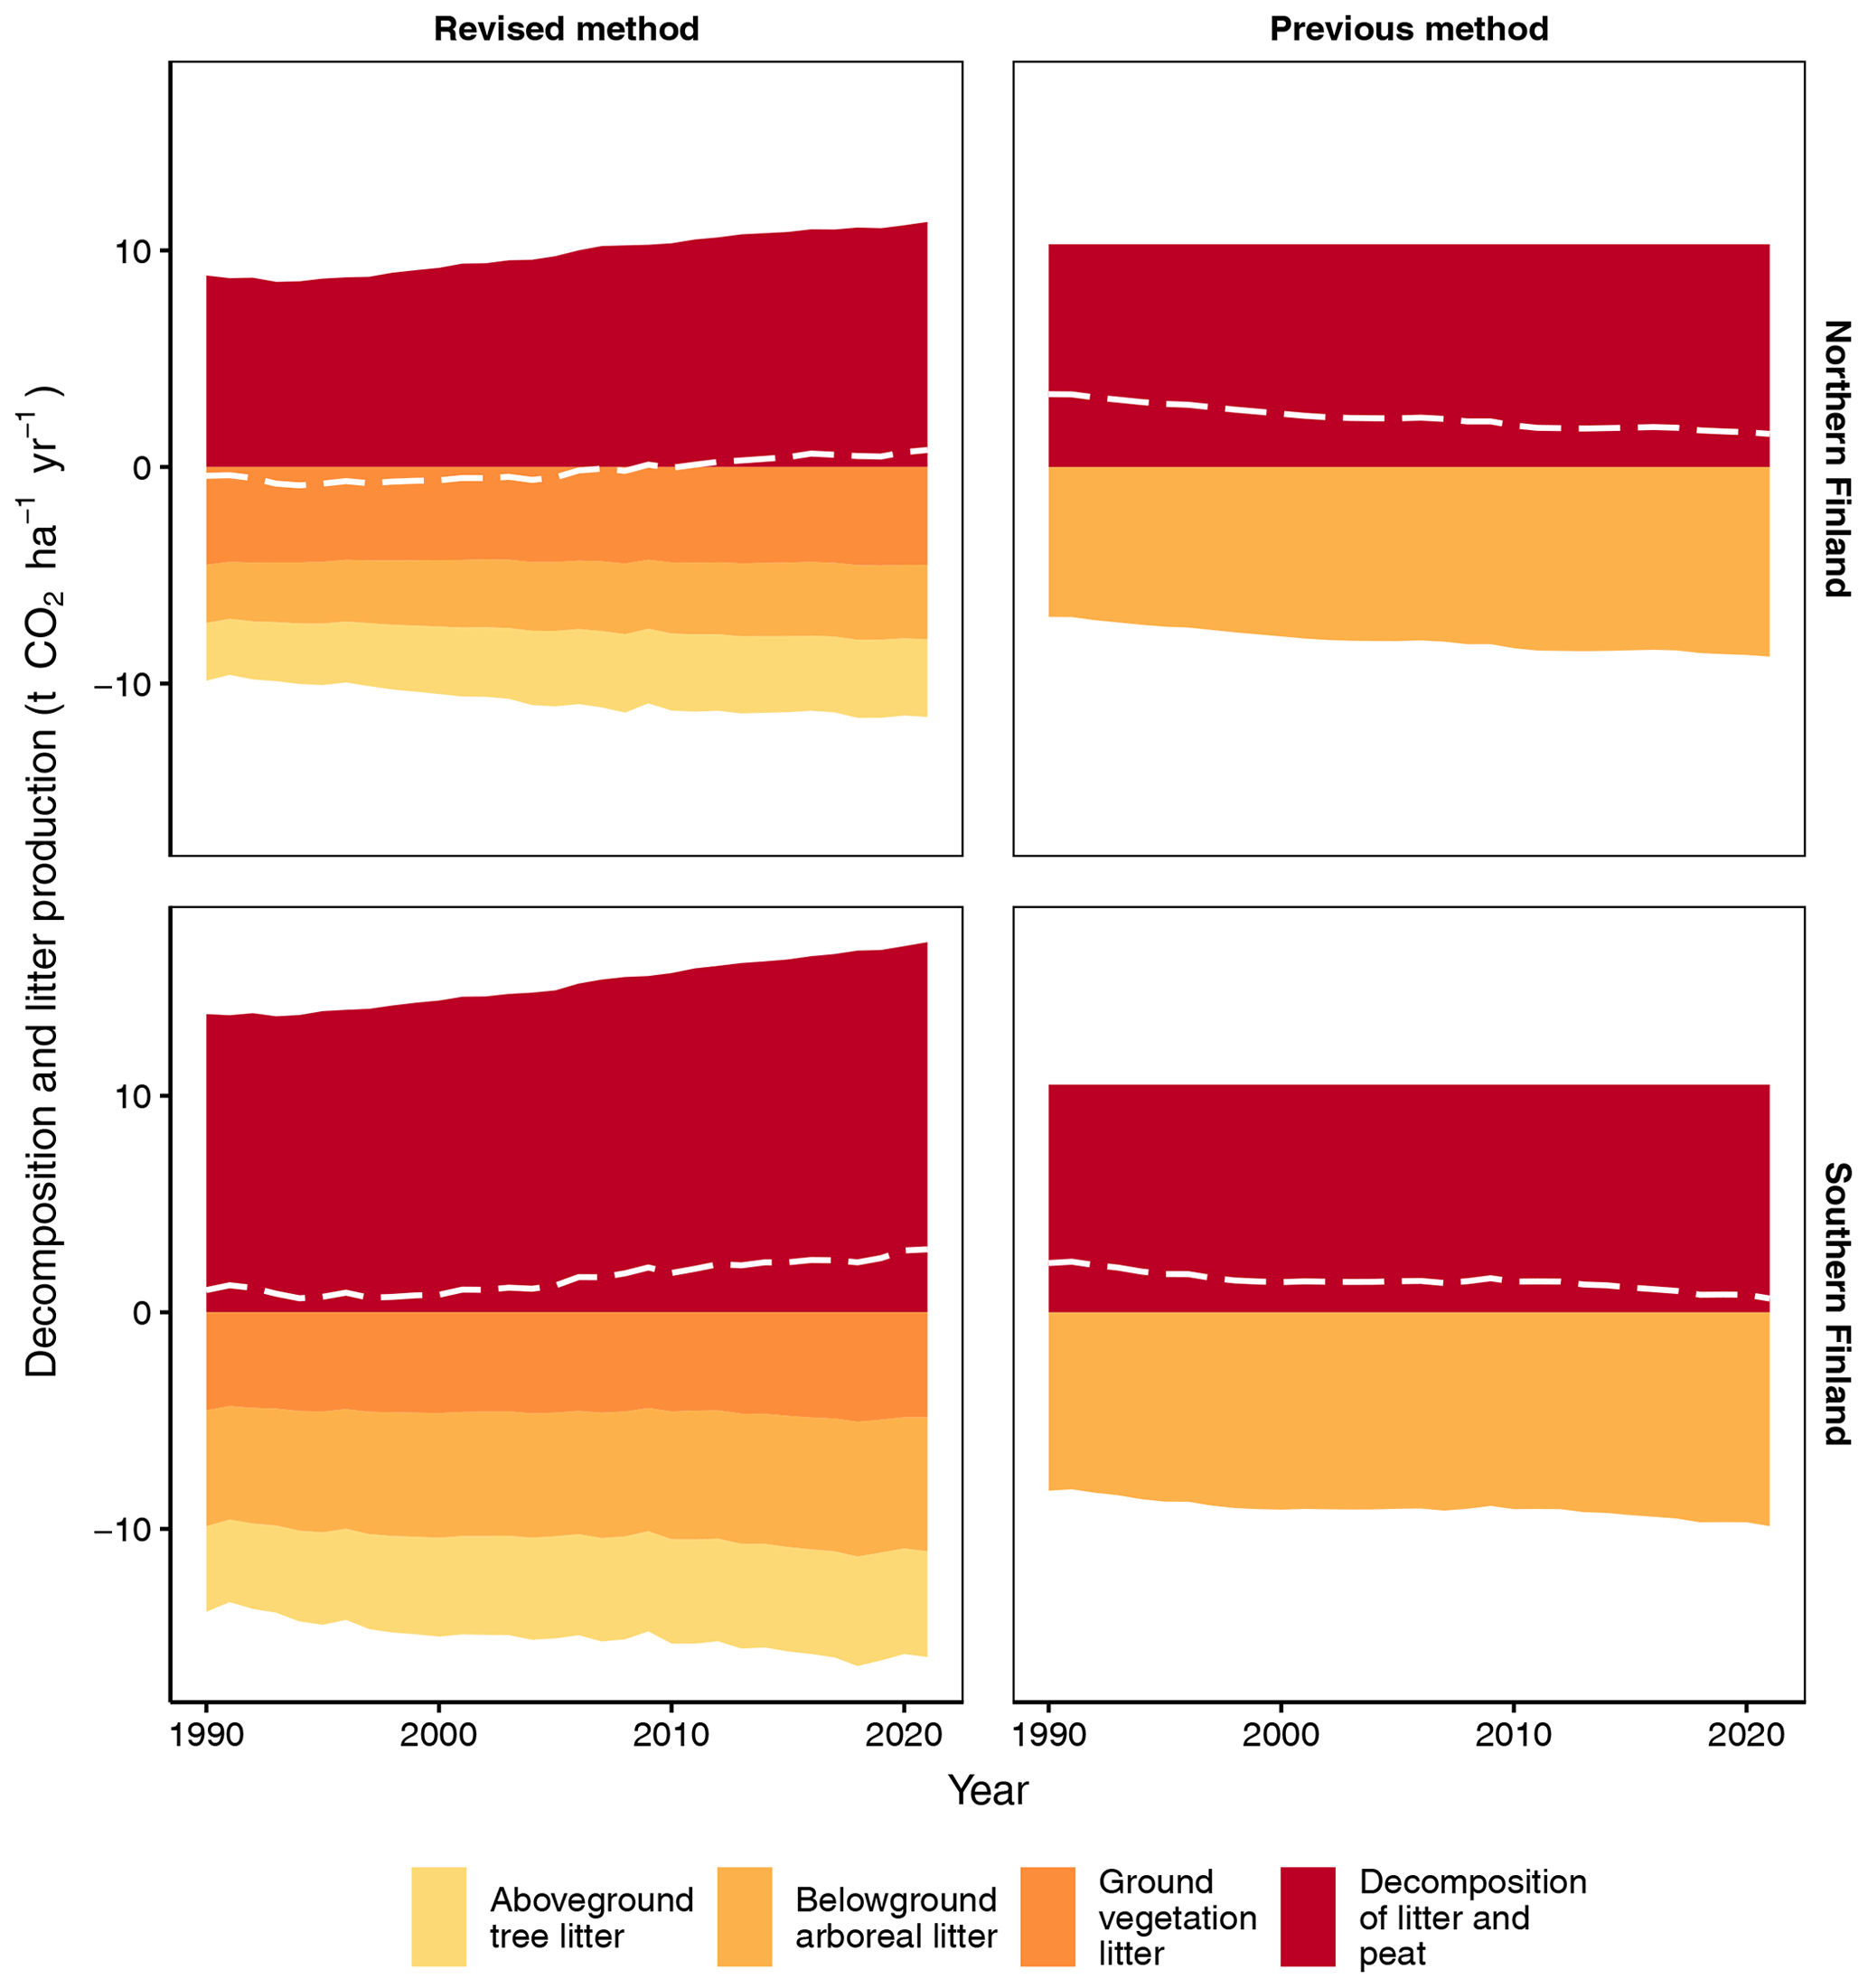
Figure 6Input of litter fractions, CO2 release from decomposing litter and peat, and the CO2 balance (dashed white line) for southern and northern Finland using the new fully dynamic and the previous semi-dynamic method. In the new method, ground vegetation litter consists of both aboveground and belowground litter except for dwarf shrub fine root litter, which is included in belowground arboreal litter.
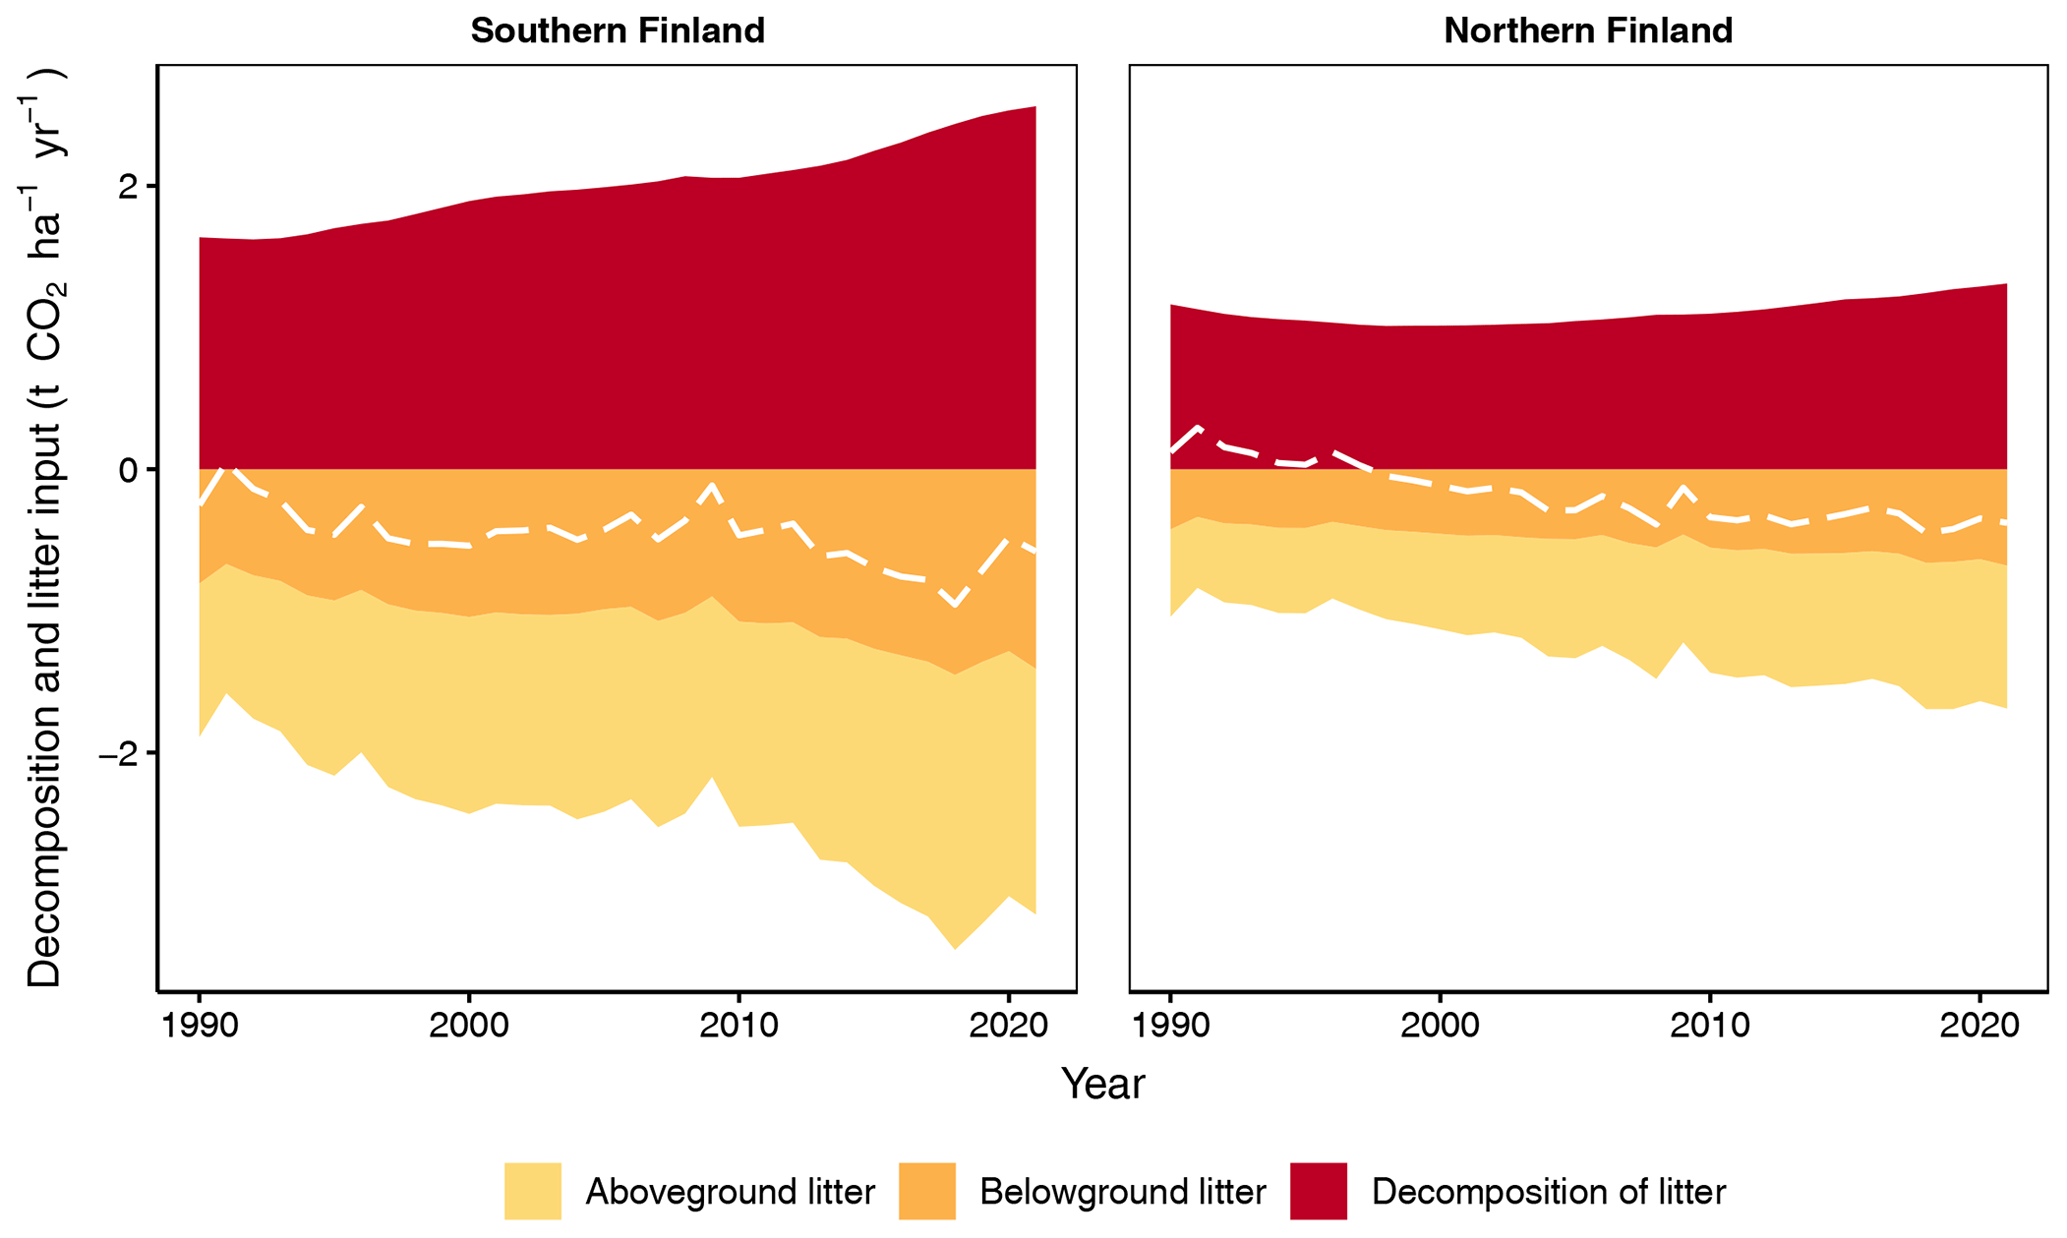
Figure 7Input and decomposition of litter from tree harvests and trees that died naturally, as well as their CO2 balance (dashed line) for southern and northern Finland as produced by the new method. Only stem and stump wood is included for trees that died naturally.
When compared to the earlier method, the new method produces 37 % and 61 % smaller belowground arboreal litter input, per unit area, for southern and northern Finland, respectively (Fig. 6). However, total litter input is on average 62 % and 32 % higher, respectively, because aboveground tree litter and ground vegetation litter are included in the new method (Fig. 6). In 2021, the new method produces 63 % and 10 % higher CO2 release from decomposition, per unit area, than the previous method for southern and northern Finland, respectively (Fig. 6).
3.3 Input and decomposition of litter from harvested trees and trees that died naturally
With the new method the input of litter from harvested trees and trees that died naturally, as well as the CO2 release from their decomposition, is significantly higher, per unit area, in southern than northern Finland but increases with time in both regions (Fig. 7). The CO2 balance of these residues is negative (thus acting as a sink) and has a decreasing overall trend in both regions (Fig. 7). In 2021, the residues form 20 % and 15 % of all litter input, and their decomposition forms 15 % and 12 % of total decomposition in southern and northern Finland, respectively (compare Figs. 6 and 7).
3.4 Comparison of FTYPEs
When litter input and decomposition (excluding litter from harvested trees and trees that died naturally) are estimated with the new method for each FTYPE individually, both litter input and decomposition have a general decreasing trend along the FTYPE fertility gradient from the most fertile herb-rich FTYPE (Rhtkg) to the least fertile Cladonia FTYPE (Jatkg) (Fig. 8). The only exception to this pattern is litter input in the Vaccinium vitis-idaea FTYPE (Ptkg), which in 2021 exceeds litter input in the more fertile Vaccinium myrtillus FTYPE (Mtkg) by 26 % and 20 % in southern and northern Finland, respectively (Fig. 8).
No clear trend of CO2 balance emerges along the FTYPE fertility gradient (Fig. 8). Instead, net emissions are higher at both ends of the gradient than in the Vaccinium vitis-idaea (Ptkg) and the dwarf shrub (Vatkg) FTYPEs (Fig. 8). In these two FTYPEs, ground vegetation litter input and arboreal fine root litter input are relatively high in comparison to other FTYPEs (Fig. 8). In general, the share of ground vegetation litter in total litter input is higher in northern than southern Finland and increases towards the nutrient-poor end of the FTYPE fertility gradient (Fig. 8).
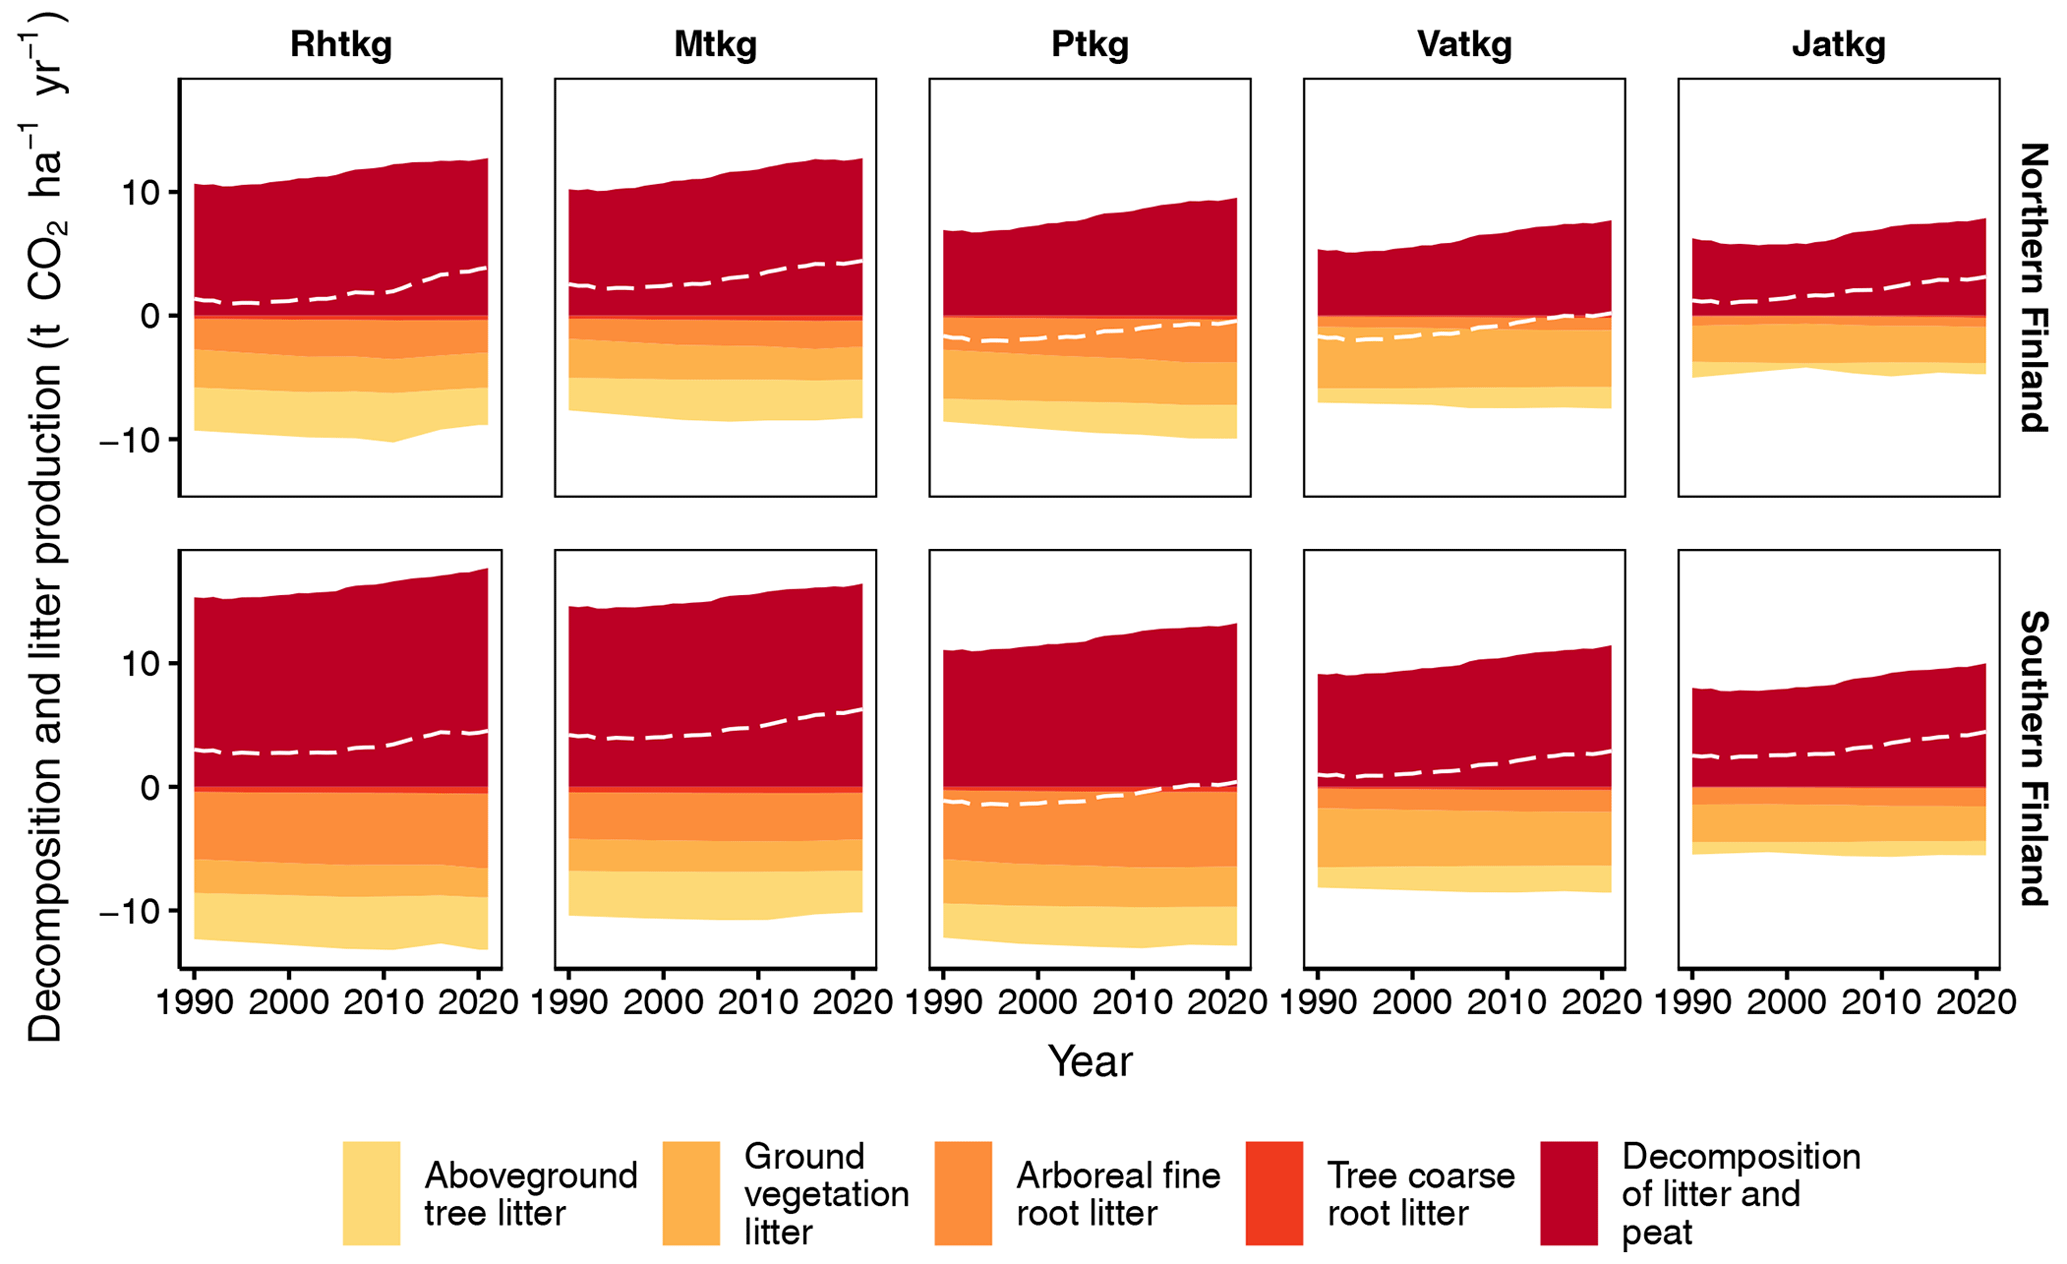
Figure 8Litter input and decomposition (both exclude input and decomposition of litter from harvested trees and trees that died naturally), as well as the soil CO2 balance (dashed line) in FTYPEs in southern and northern Finland as produced by the new method. Ground vegetation litter includes aboveground and belowground litter except for dwarf shrub fine root litter, which is included in arboreal fine root litter. Rhtkg: herb-rich FTYPE, Mtkg: Vaccinium myrtillus FTYPE, Ptkg: Vaccinium vitis-idaea FTYPE, Vatkg: dwarf shrub FTYPE, Jatkg: Cladonia FTYPE, listed in order of decreasing soil fertility.
3.5 Sensitivity of soil CO2 balance to the main dynamic drivers
As temperature, T (and other climatic variables in Yasso07 modeling), and BA are the main dynamic drivers of soil CO2 balance in our method, we examined their relative importance by producing three sets of scenarios, where either (1) climate, (2) BA (and the associated harvest rate), (3) both or (4) neither (the default method) were fixed to their 1990 values (Fig. 9): the first set is for the CO2 balance of tree and ground vegetation litter input and SOM decomposition (top row of graphs, excluding harvest residues and litter from trees that died naturally); the second set is for the CO2 balance of input and decomposition of litter from harvested trees and trees that died naturally (middle row), and the third set is for the total soil CO2 balance (bottom row).
The CO2 balance of tree and ground vegetation litter input and SOM decomposition (Fig. 9 top row) appears to be sensitive to the increasing T as the scenario with constant BA (i.e., only T increases) closely follows the default scenario. The effects of changes in BA are more subtle: increasing BAs until ca. 2010 (Fig. 3) decrease emissions slightly as the scenario with constant climate (only BA changes) produces less CO2 than the scenario wherein both BA and climate remain constant. From ca. 2010 onwards BAs in FTYPEs level off or start decreasing (Fig. 3) and the BA effect turns neutral (northern Finland) or slightly positive (southern Finland) (Fig. 9 top row).
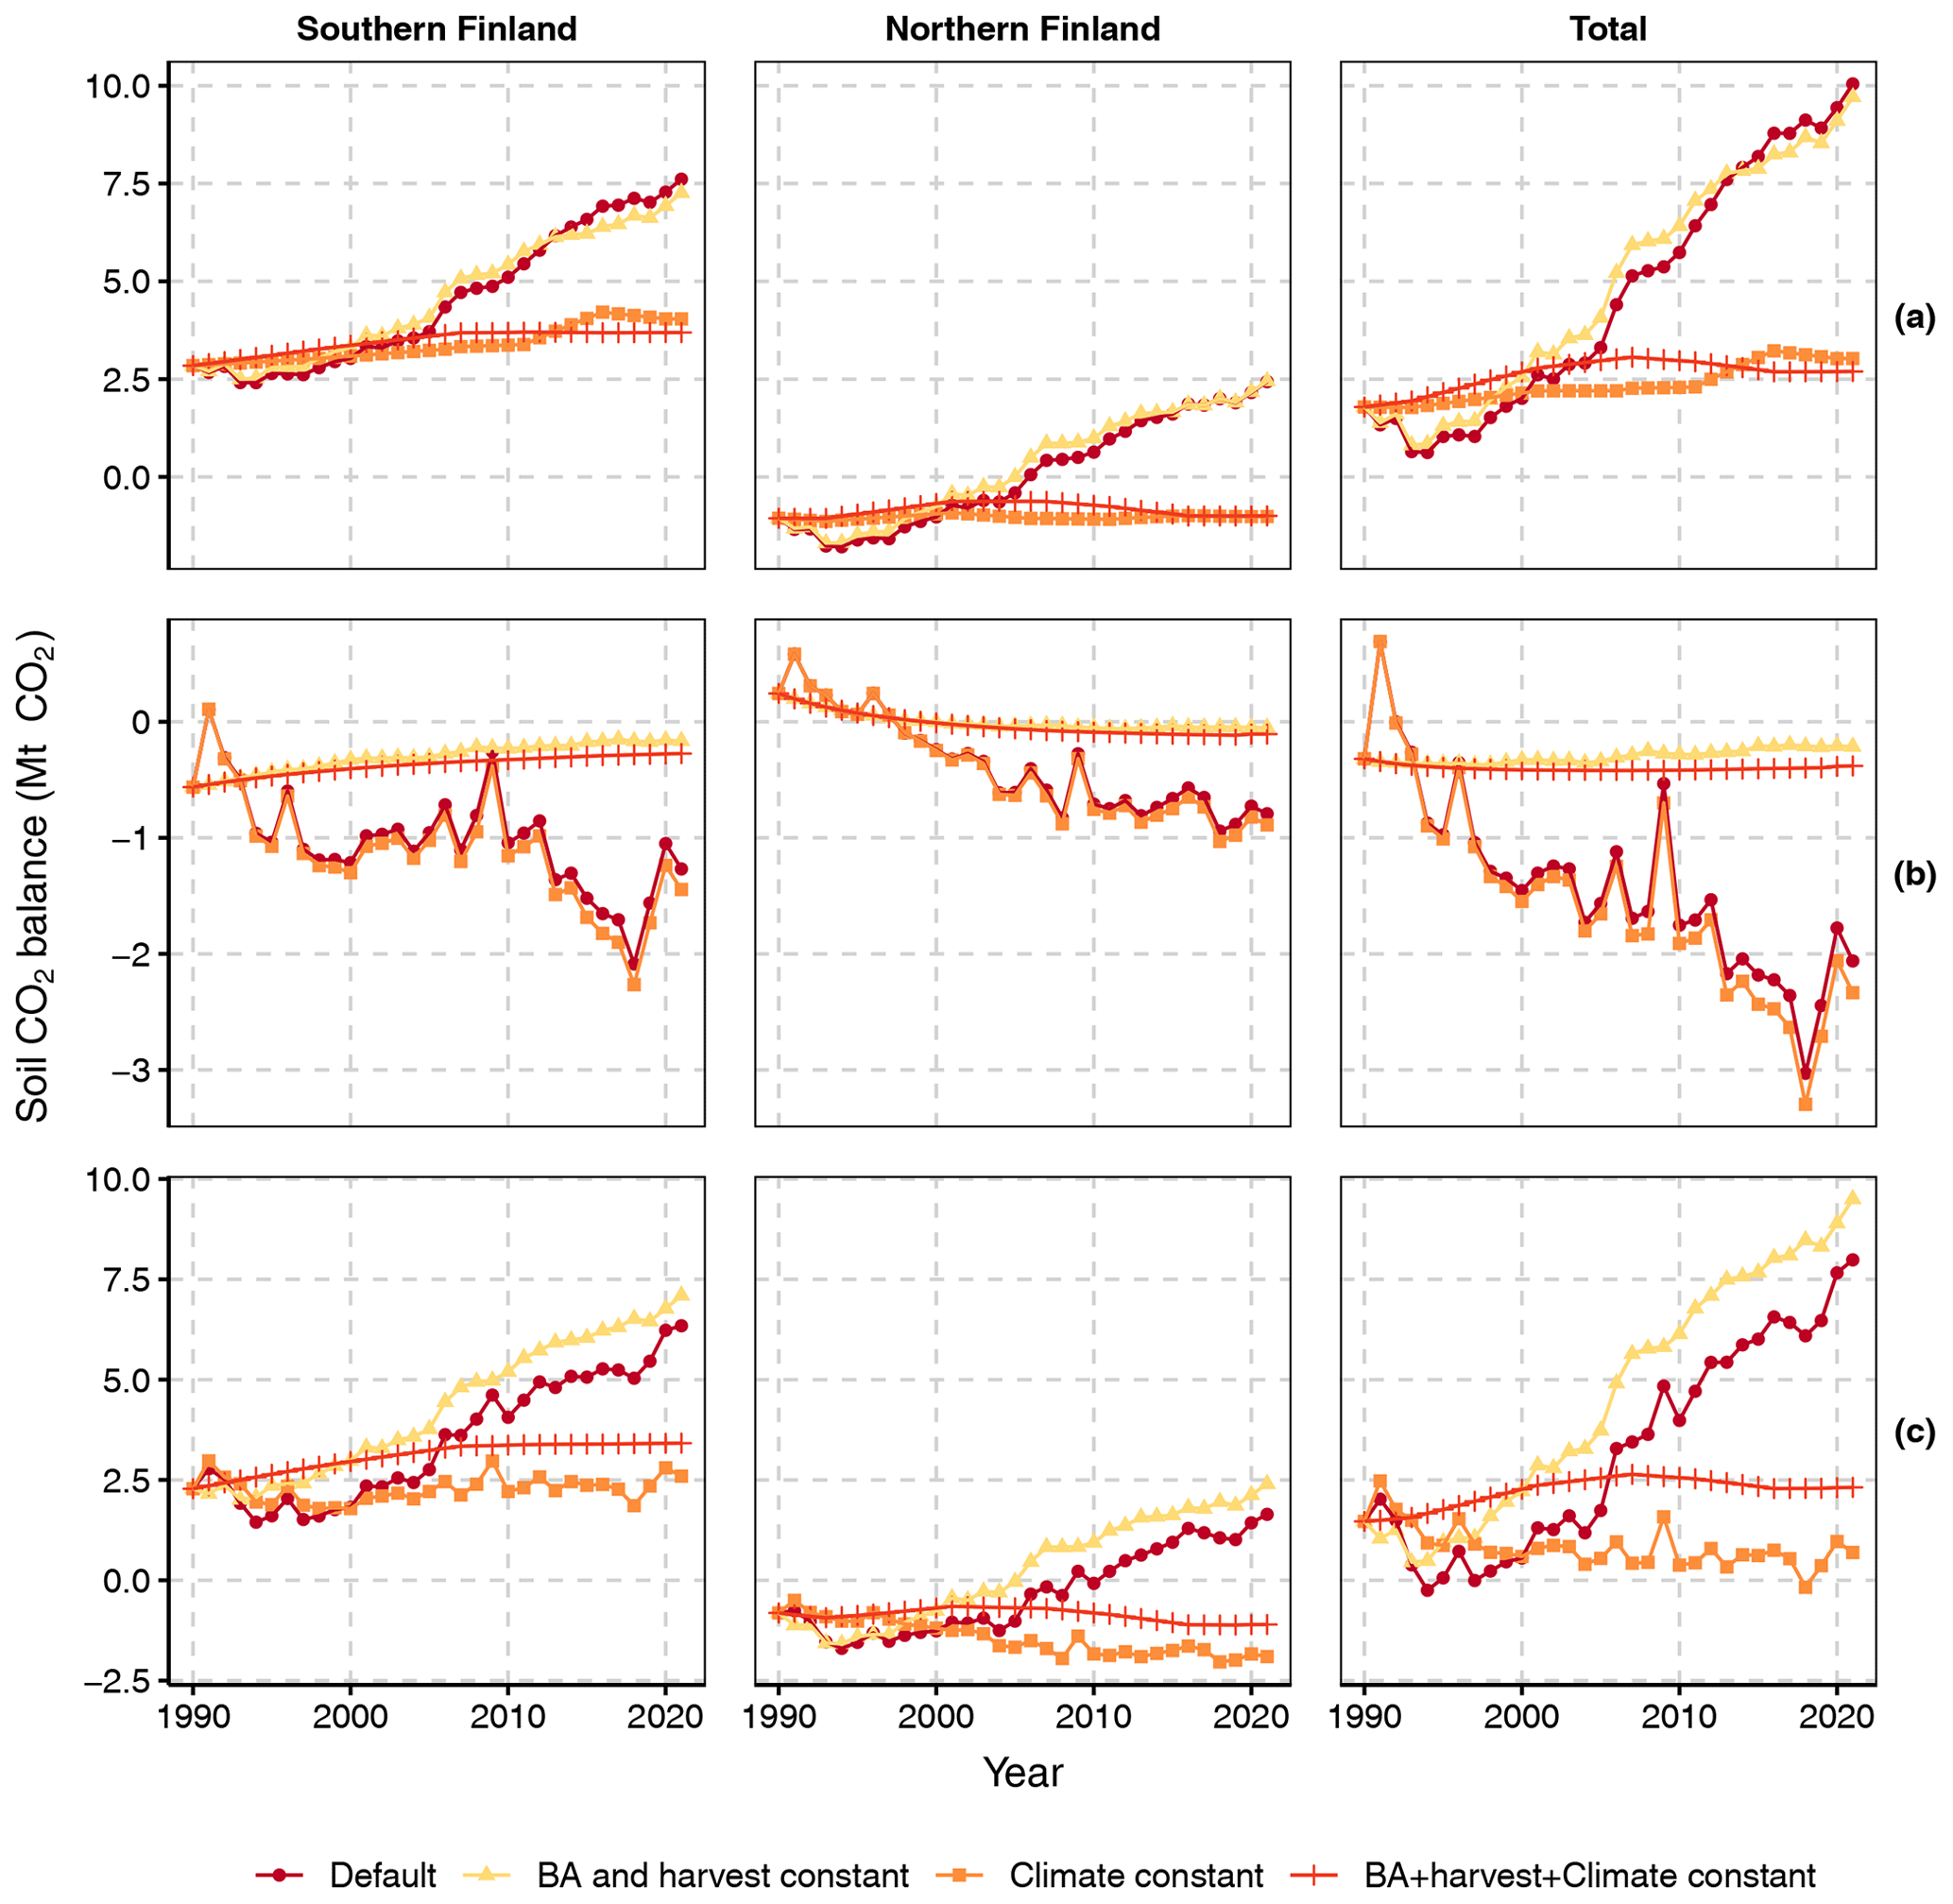
Figure 9Soil CO2 balances calculated with four different scenarios for southern and northern Finland and the whole country: “Default” allows all drivers to change according to data, “BA and harvest constant” fixes the values of BA and harvest rate to that in 1990, “Climate constant” fixes the growing season mean temperature used by equations of SOM decomposition and the climatic variables used by Yasso07 to values recorded in 1990, and “BA + harvest + climate constant” fixes all these variables to their 1990 levels. The top row of panels (a) shows the CO2 balance of live tree and ground vegetation litter input as well as SOM decomposition (thus excluding harvest residues and litter from trees that died naturally); the middle row (b) shows the CO2 balance of input and decomposition of litter from harvested trees and trees that died naturally, and the bottom row (c) shows the total soil CO2 balance.
The CO2 balance of harvest residues and litter from trees that died naturally (Fig. 9 middle row) is driven by changes in BA and harvest rate as the scenario with constant climate (only BA and harvest rate change) closely follows the default scenario. Changes in climate increase emissions slightly as the scenario with constant BA and harvest rate (only climate changes) produces more CO2 than the scenario wherein BA, harvest rate and climate all remain constant.
The scenarios for the total soil CO2 balance (Fig. 9 bottom row) combine the main characteristics of the scenarios for the two parts of the total balance: i.e., the shape and the positive slope of CO2 emissions in the default scenario are driven by climate warming, and the main result of increasing BA and harvest rate from 1990 onwards is a lower level of net soil CO2 emissions.
3.6 Ecosystem CO2 balance
The ecosystem CO2 balance in drained peatland forests is governed by the combination of soil CO2 balance and the CO2 sink created by living trees. When the soil CO2 balance results of the new method are combined with tree CO2 sink for southern Finland, the ecosystem CO2 balance is negative; i.e., the forests are a CO2 sink until the beginning of the 2010s when the balance turns positive (Fig. 10). This change in pattern is a product of both lower tree CO2 sink in the 2010s and increasing soil CO2 emissions (Fig. 10). In northern Finland, drained peatland forests are still a CO2 sink, but the gradually decreasing tree CO2 sink together with increasing soil CO2 emissions also creates a decreasing trend for the ecosystem sink in the 2010s (Fig. 10).
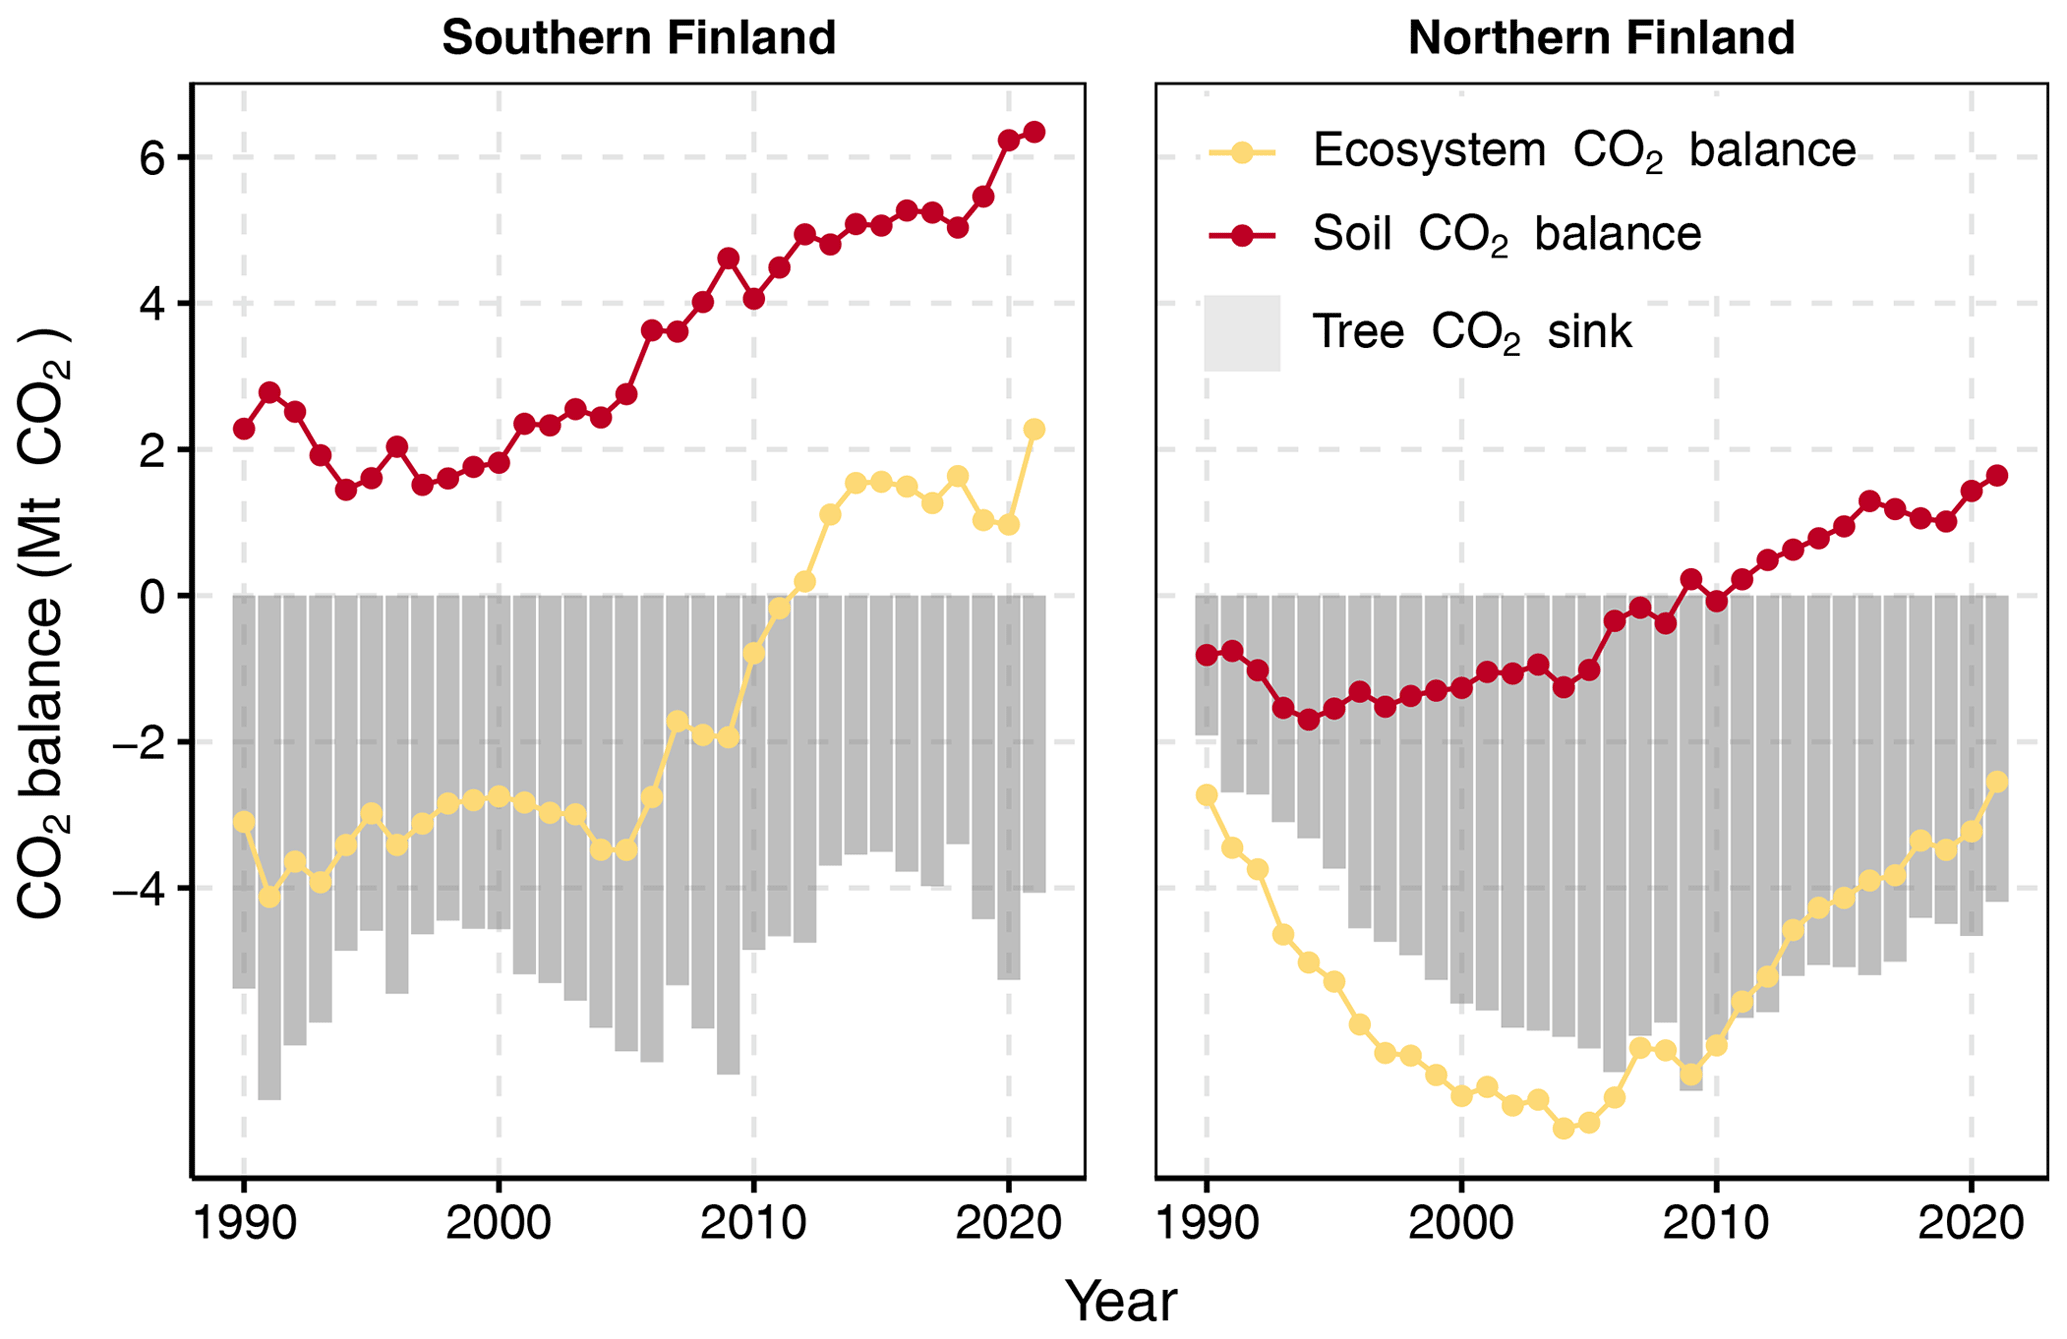
Figure 10Changes in tree CO2 sink (grey bars), soil CO2 balance (red line) and whole-ecosystem CO2 balance (yellow line) (Mt CO2 yr−1) in drained peatland forests in southern and northern Finland across the GHG inventory reporting period (see Fig. 2 for the two regions). Note that no GHGs other than CO2 are included in the calculated balances.
4.1 The CO2 balance of drained organic soils by the new method
The CO2 balance of drained organic soils in Finland, as estimated by the new method we describe in this paper, has two main features (Fig. 5): first, drained peatland soils are currently a source of CO2 in Finland, and second, the emissions are increasing with time due to the high sensitivity of SOM decomposition to increasing temperature. The mean increase of ca. 0.7 ∘C in mean May–October temperatures across the time series in FTYPEs in both southern and northern Finland (Fig. 4) increases CO2 emissions from soil by 8.1 Mt CO2 in the whole country (the constant BA and harvest scenario in Fig. 9 bottom row). An increase in BA and harvest rate over the decades counteracts this pattern (the constant climate scenario in Fig. 9 bottom row), however, and the increase in net soil CO2 emissions across the time series remains smaller (the default scenario in Fig. 9 bottom row).
Both litter input and decomposition have increasing trends in time (Fig. 6). The increasing trend in litter input is mainly driven by the general increase in BA across the FTYPEs (Fig. 4), which leads to greater litter input from living trees (evident in both aboveground tree litter input and belowground arboreal litter input in Fig. 6). Part of the increasing trend is also explained by the increasing input of litter from harvested trees and trees that died naturally (Fig. 7). Litter input from ground vegetation, instead, remains rather stable across the time series (Fig. 6). The increasing CO2 release from decomposition is driven by both increasing BA and increasing May–October temperature (Fig. 3) as both are positively associated with decomposition in the empirical data (Table 2; Ojanen et al., 2014). Part of the increasing trend is also explained by the increasing CO2 release from the decomposing litter of harvested trees and trees that died naturally (Fig. 7). The likely reasons why BA is positively linked to decomposition in the regression models by Ojanen et al. (2014) (Table 2) is that increasing litter input sustains larger decomposer biomass, and thus higher CO2 production, and that higher BA – through higher evapotranspiration – maintains a lower soil water table level and a deeper oxic layer for SOM decomposition (Sarkkola et al., 2010). When the impacts on litter input and decomposition are combined, increasing BA first slightly decreases net soil CO2 emissions (scenario of constant climate in Fig. 8 top row), but this effect disappears in the mid-2010s, when the positive trend in BA levels off or turns negative in most FTYPEs (Fig. 3).
Release of CO2 from decomposition per area of drained peatland forest soil is significantly higher in southern than northern Finland (Fig. 6). This is due to higher temperature, but also due the generally higher BA and litter production (Figs. 3, 4, 6) in southern Finland. Input of litter from forest harvests has an increasing trend, and on the timescale of the inventory time series, harvest residues create a CO2 sink and decrease net soil CO2 emissions (Fig. 7). However, this does not imply that net ecosystem CO2 emissions would decrease with harvests because the tree CO2 sink simultaneously decreases (see trends in the 2010s in Fig. 10).
Of the FTYPEs, the dwarf shrub (Vatkg) and V. vitis-idaea (Ptkg) FTYPEs are clustered to the major water divides called Suomenselkä and Maanselkä of the southern and northern regions of the country, while other FTYPEs are more evenly distributed across the country (Fig. 2). These two common FTYPEs have relatively low nutrient status (Table 1) and both have, even without the harvest residue impact, in most of the GHG inventory time series a negative or near-zero soil CO2 balance in the north, and the V. vitis-idaea FTYPE also in the south (Fig. 8). This is roughly in line with earlier findings (Minkkinen et al., 1999; Ojanen et al., 2014). However, the ubiquitous upwards temporal trend of soil CO2 balance in all FTYPEs (Fig. 8) suggests that these FTYPEs are also entering the phase of net soil CO2 emissions.
Uncertainty due to model parameters and input data were propagated into the soil CO2 balance estimates. The parameter estimates of the peat and litter decomposition model were clearly the greatest source of uncertainty, followed by those in the fine root litter input model (including the turnover rates) and litter input from living trees. Meanwhile, uncertainty in NFI estimates of site type areas and BA had a negligible impact on annual balance estimates and a somewhat greater, but still minor, impact on the estimates of changes in emissions. This indicates that the proposed method might also be applicable in somewhat smaller regions (with less precise NFI estimates) without a drastic increase in uncertainty. Errors in annual soil CO2 balance estimates are strongly correlated over the whole time series because the same model parameters with the same estimation errors are applied throughout the series. Since all applied models were linear in both their parameters and inputs, it was possible to handle these correlations by combining quantities including the same parameter (Appendix A). Uncertainty propagation by means of variances relies on an assumption of symmetric error distributions. This assumption is realistic since uncertainty due to all individual components in the balance estimates was 30 % or less; i.e., the coefficient of variation was at most 0.15 (Table A9; see Frey et al., 2006, Sect. 3.2.2.4). Structural uncertainty about the models could not be accounted for since large-scale validation data do not exist.
4.2 Ecosystem CO2 balance in drained peatland forests
Peatlands in Finland were mostly drained to enhance tree growth, thus enabling forestry on peatlands. The increasing BAs in drained peatlands from 1990 onwards (Fig. 4) show that this target has largely been achieved. Therefore, when considering the net climate effects of peatland drainage, the development of the tree CO2 sink needs to be taken into consideration (Fig. 9). In the 2010s, the trend of gradually increasing BA in drained peatland forests leveled off (Fig. 3). This is due to increasing harvests in these forests (manifested by the increasing harvest residue input in Fig. 7), which in turn is associated with the sharp turn in tree CO2 sink and net ecosystem balance after 2010, ultimately leading to a shift from a net ecosystem sink to a source of CO2 in southern drained peatland forests (Fig. 9). After 2010, drained peatland forests were a sink of CO2 only in northern Finland, but when the northern tree stands mature for harvesting and industry demand for wood remains high, the net ecosystem CO2 sink will likely be lost in northern Finland as well. Calculated for the whole country, forests growing on drained peatlands were a net sink of 0.2 Mt CO2 in 2021.
4.3 Comparing the soil CO2 balance predictions by the new and earlier method
The differences in the estimates of soil CO2 balance between the new fully dynamic and the earlier semi-dynamic method are remarkable (Fig. 4). The main difference is the opposite trends in time series: at the beginning of the GHG inventory reporting period the new method produces 10.7 Mt lower soil CO2 balance than the earlier method, but then it reaches 3.4 Mt higher balance in recent years. The mean level of emissions differs a lot in the north and less in the south (Fig. 5).
The contrasting trends of time series produced by the two methods call for explanations. In the earlier method, CO2 release from decomposition is constant, whereas in the new method CO2 release from decomposition increases in time as it is driven by increasing temperatures and BA (Fig. 6). Both methods predict increasing litter input in time due to increasing BA (Fig. 6). In the earlier method, however, increasing litter input combined with constant decomposition unavoidably leads to decreasing net emissions as the release of CO2 in decomposition does not follow the increase in litter input. In the new method, both constituents of the CO2 balance are dynamic, and the method can produce either an increasing or decreasing trend of net emissions depending on the relative magnitude of slopes in trends for litter input and decomposition. The new method predicts that decomposition increases more in time than litter input does, thus leading to an increasing trend in net soil CO2 emissions.
Besides the difference in the estimation of decomposition, estimation of litter input has major differences between the methods. First, while the aboveground litter (including litter from living trees and ground vegetation, as well as from harvested trees and trees that died naturally) is explicitly included in both litter input and decomposition calculations in the new method, the earlier method assumes that aboveground litter input and decomposition are in equilibrium, and consequently, aboveground litter is not included in the calculation. However, findings from drained organic forest soils suggest that while increasing litter input is generally associated with increasing decomposition, litter input and decomposition are seldom in equilibrium. For instance, in Finland, litter production exceeds decomposition in the nutrient-poor FTYPEs and vice versa in the nutrient-rich FTYPEs (Fig. 1 in Ojanen et al., 2013). Other studies also stress the importance of litter input in the C balance of drained peatland forests, and despite plant-community-level litter decomposition rates being somewhat higher in drained than undrained peatland forests, increased tree litter input can still lead to a significant accumulation of new SOM, especially in conifer-dominated stands (Vávřová et al., 2009; Straková et al., 2012). A model-based assessment of forests growing on mineral soils in Finland further suggests that the proportion of C in litter input that remains in the soil C pool is ca. 4 % (Liski et al., 2006), and although these models are developed for mineral soil forests, the main principles of SOM decomposition also likely apply in drained organic soil forests. Finally, as the maturing drained peatland forests are increasingly harvested, litter production from living trees will inevitably decrease and that from harvest residues increase, making it necessary to explicitly include the input and decomposition of aboveground litter in the calculation method.
Another major change in the estimation of litter input in the new method is the FTYPE-specific turnover rates of arboreal fine roots, which constitute the major source of belowground litter. In light of recent findings, the assumption of a single turnover rate of 0.85, used for all FTYPEs in the earlier inventory method (Statistics Finland, 2022), seems incorrect. The new minirhizotron results included in the new method suggest that the tree fine root turnover rate varies markedly by FTYPE and that the turnover rate is on average lower in the nutrient-poor than in the nutrient-rich FTYPEs (Table 3). The lower turnover rate largely explains the remarkably lower arboreal fine root litter production in the new method (Fig. 6).
4.4 Evaluating the predicted soil CO2 balance
To evaluate the soil CO2 balance predicted by our method, it can be compared to (1) IPCC Tier 1 emission factors, (2) emission factors applied in other European countries, and (3) empirical results on soil CO2 and C balance. As there are no alternative 30-year dynamic emission time series available, the validity of time series dynamics cannot be adequately evaluated here – this would require another comprehensive study. Instead, we will focus on the question of whether the predicted soil CO2 balance is at a feasible level in comparison to emission factors utilized in other GHG inventories and in comparison to results presented in earlier studies.
The default IPCC emission factors for boreal drained organic soils range from 0.25 (95 % confidence interval −0.23–0.73) t CO2-C ha−1 yr−1 in drained nutrient-poor forest land to 0.93 (0.54–1.3) t CO2-C ha−1 yr−1 in nutrient-rich forest land (IPCC, 2014, their Table 2.1 in Chap. 2). Applying the IPCC default emission factors for the areas of nutrient-poor and nutrient-rich FTYPEs found in southern and northern Finland (Table 1) gives emission factors of 0.56 and 0.49 t CO2-C ha−1 yr−1 for these regions, respectively, and an overall factor of 0.53 t CO2-C ha−1 yr−1 for the whole country. The emission rate of 0.50 t CO2-C ha−1 yr−1 predicted by our method for Finland for the year 2021 is slightly lower, but as the emissions with the new method have a rising trend (Fig. 5), they will likely soon exceed the default emissions.
To compare our results to emission factors used for drained organic forest soils by other European countries, we collected information from the national CRF (Common Reporting Format by the United Nations Framework Convention on Climate Change, UNFCCC) tables published in 2021. Russia, Norway, Ireland and Poland use emission factors of 0.52–0.72 t CO2-C ha−1 yr−1 that are at the lower end of the 95 % CI of IPCC default method emissions for boreal nutrient-rich forest land. In temperate areas the IPCC default emission is 2.6 (2.0–3.3) t CO2-C ha−1 yr−1, and temperate countries Germany, Denmark, Switzerland and the UK apply emission factors of 2–2.6 t CO2-C ha−1 yr−1. As expected, the emissions predicted by our method for Finland in the northern boreal forest zone are lower than the emission factors used in countries that are partly or completely located in the temperate zone.
In a compilation of all available empirical soil CO2 balance data in Finland, Ojanen and Minkkinen (2019) estimated emission factors for nutrient-rich (0.66 t CO2-C ha−1 yr−1) and nutrient-poor (−0.19 t CO2-C ha−1 yr−1) forestry-drained peat soils. Weighting these by the FTYPE areas of our study (Table 1) gives a mean emission factor of 0.37 t CO2-C ha−1 yr−1. A previous country-level upscaling study by Ojanen et al. (2014) utilizing the heterotrophic soil respiration–litter production method like the one used in our study (Eq. 1) gives a maximum value (95 % CI) of 0.55 t CO2-C ha−1 yr−1 for the mean emission factor. Other soil CO2 balance (Bjarnadottir et al., 2021; Korkiakoski et al., 2023; Minkkinen et al., 2018; Uri et al., 2017; Meyer et al., 2013) and C balance (Minkkinen et al., 1999; Minkkinen and Laine, 1999; Simola et al., 2012; Lupikis and Lazdins, 2017) studies from boreal and hemiboreal northern Europe further reinforce the view that forestry-drained peat soils have relatively low CO2 emissions; and while drainage has often led to soil C loss, nutrient-poor soils in particular may exhibit soil C sink even after drainage.
Based on the above paragraphs, we can state that the soil CO2 balance predicted by our new method is in line with previous knowledge and within the range of previous results. Even the relatively large change from close-to-zero emissions in the 1990s to close to 10 Mt CO2 yr−1 in 2021 is within the limits of previous knowledge. According to our uncertainty assessment (Appendix A), which covers sampling error and parameter uncertainty of the original models (Ojanen et al., 2014) and the present GHG inventory time series application, this change in emissions is statistically significant. As it is virtually impossible to produce empirical country-level 30-year soil CO2 emission time series for comparison, a comparison with mechanistic modeling results would be a viable option for future research. Mechanistic models that could couple hydrology and the C cycle and are capable of large-scale modeling of forestry-drained peat soils are currently not available, but recent developments in hydrological modeling (e.g., Hökkä et al., 2021; Laurén et al., 2021) appear promising for the development of such models.
4.5 Critical assumptions in the new method
It is well established that water table depth (WTD) is the master variable controlling decomposition in drained wetlands (e.g., Silvola et al., 1996; Ojanen et al., 2014; Jauhiainen et al., 2019), and one can argue that WTD should be included in methods that aim at predicting CO2 release from drained peatland soils. In fact, Ojanen et al. (2010), using the data behind our new method, found that regression models between soil respiration and climate variables had a higher coefficient of determination, R2, when WTD was included (see Ojanen et al., 2010, Table 4). However, because direct data on WTD, in particular for the time series starting in 1990, are not available nationwide for GHG inventory purposes in Finland, WTD cannot currently be used as a predictor of decomposition. In undrained peatlands, soil CO2 balance fluctuates following annual variation in water saturation and temperature (e.g., Alm et al., 1997, 1999), tree growth is suppressed by anoxia, and BA remains low. Draining initiates tree growth and reduces critical high water level periods, and finally, the increasing tree growth and BA lead to lowering water table level (Sarkkola et al., 2010). The impact of WTD on decomposition is therefore implicitly included in our method through the impact of BA, which provides a proxy for the rate of evapotranspiration that largely controls WTD in forestry-drained peatlands (Hökkä et al., 2021; Leppä et al., 2020).
The in situ minirhizotron data behind the arboreal fine root turnover rates that we apply are rare, and the results we use are the first to compare arboreal fine root growth and mortality in different boreal FTYPEs. The measurements carried out with minirhizotrons focused on tree fine roots with diameter ≤ 0.5 mm, but we extrapolated the results for all arboreal roots ≤ 2 mm in diameter. Because thicker fine roots have lower turnover rates, our method may overestimate litter input of roots with a diameter of 0.5–2 mm. In terms of soil CO2 balance, this would lead to underestimation of net CO2 emissions. On the other hand, as the fine root turnover rates of dwarf shrubs are higher than those of trees, at least when compared to Scots pine (Kari Minkkinen et al., unpublished data), our method may in this respect underestimate the arboreal root litter input and overestimate the net CO2 emissions.
What may impair the use of BA when estimating SOM decomposition is that relatively few data are available on CO2 release from peatland forest soils after clear-cutting and regeneration or after other forest management options such as cuttings applied in continuous-cover silviculture. Mäkiranta et al. (2010) showed that CO2 release from soil decreased after forest clear-cutting because of a rising water table and, on the other hand, because of the dryness of the peat soil surface. Instead, CO2 release from decomposing harvest residues was high, and because of the removed tree stand and suffering ground vegetation, the site acted as a high source of CO2 emissions during the whole study of 4 years. Similarly, eddy covariance observations in a drained peatland forest showed markedly elevated CO2 emissions at least 2 years after clear-cutting (Korkeakoski et al., 2019), thus suggesting significant transitory effects of clear-cutting on soil CO2 balance in peatland forests. However, similarly to Mäkiranta et al. (2010) study, a marked share of increased emissions likely also resulted from decomposition of fresh harvest residues in the Korkeakoski et al. (2019) study. While this harvest residue effect is included in our method in both litter input and decomposition (Fig. 7), the temporary effects of tree cut on ground vegetation are not explicitly implemented.
One fundamental assumption in our new method is that the statistical relationships between BA, ground vegetation litter input and SOM decomposition described by Ojanen et al. (2014) for different FTYPEs can also adequately predict these associations in forests under their future successional change. If future forest stands have features that were not present in the studied field sites, this assumption is not valid. This also has relevance in terms of the uncertainty analysis. A strong structural assumption in our new method is that model parameters, including the litter production and turnover rates, do not change in time. If trend-like changes do exist, the reported uncertainties of change estimates are too small (see Lehtonen and Heikkinen, 2016, for an illustration). Better understanding of temporal dynamics would be needed to make the assumptions and uncertainty assessments more comprehensive.
Our method also assumes that the spatial covariation in temperature and decomposition, found by Ojanen et al. (2014) among their field sites, is a causal relationship that can be used to describe the effects of increasing temperature on SOM decomposition under climate warming. In our time series, the May–October mean temperature rises by 0.67 ∘C and the mean annual temperature by 1.2 ∘C during the GHG reporting period (Fig. 3). This upward trend in temperature increases decomposition in our method (Table 2) and will reduce the C sink of forest ecosystems in drained peatlands if it is not simultaneously accompanied by increasing nutrient mineralization, plant growth and litter input. It is well established that heterotrophic soil respiration is sensitive to temperature (Silvola et al., 1996; Kätterer et al., 1998; Meyer et al., 2018), and while the response to temperature may be somewhat attenuated with time due to a gradual decrease in easily degradable C and thermal adaptation of decomposer communities and their respiration (Davidson and Janssens, 2006; Bradford et al., 2008; Bradford, 2013), it is likely that the trend of increasing SOM decomposition produced by our method represents a real outcome of climate warming. Globally the same impact of increasing temperature on soil CO2 emissions in drained peatlands is demonstrated by the steeply increasing emission factors from high latitudes to the tropics (IPCC, 2014, their Table 2.1 in Chap. 2).
4.6 Further development needs
The impact of WTD on SOM decomposition is implicitly included in our method through BA and T, which are both proxies for the rate of evapotranspiration. However, the relationship between BA and WTD is not linear but attenuating at high BAs (Sarkkola et al., 2010). Furthermore, while ditch spacing and ditch depth have a minor role in comparison to BA, they also affect WTD (Sarkkola et al., 2010; Hökkä et al., 2021), and including models that could link ditch parameters to soil CO2 release would likely improve our method. Models to overcome the shortcomings of large-scale WTD estimation in forest drainage are being tested (e.g., Haahti et al., 2015), but finally resolving these issues may require transforming the method into a process-based model, which would then also open avenues for addressing a wider range of environmental effects on decomposition.
Also, while our new method covers a wide range of litter input, litter input from tree roots thinner than coarse roots but thicker than fine roots, i.e., in the diameter range of 2–10 mm, is lacking. This is because there are no data on the standing biomass or litter production rate for this fraction of tree roots. In a Swedish study, Petersson and Ståhl (2006) showed that the belowground tree biomass was on average 11 % higher when roots down to 2 mm diameter were included in comparison to using Marklund's (1987, 1988) biomass equations, which produce the biomass of stump and thicker coarse roots only. Using this estimate, we could assume that we miss ca. 10 % of the tree belowground biomass (i.e., of the combined stump and coarse root biomass) and correct the tree belowground biomass estimate accordingly. However, the turnover rate of this biomass fraction is unknown.
We use 30-year rolling means of climatic variables in our models, computed to the last year of the sequence. This procedure is aimed at smoothing the effects of annual weather variation on the results and thus better reveal the mean level of soil CO2 balance. However, when the smoothed variable has a monotonous trend in time, which is the case, for instance, for May–October or annual mean temperature that increases in time (Fig. 4), the 30-year rolling mean temperatures show past developments behind the present temperature. In our case, this means that the May–October mean air temperature, which largely determines the peat and litter decomposition (Fig. 9 top row), is constantly too low, which in turn leads to CO2 emission estimates that are too low. The origin of applying a rolling mean is in the similar solution used in mineral soils. For a more agile smoothed value, another type of filter would be needed.
Finally, although not adopted in our method, peatlands also release organic C as dissolved and particulate organic carbon, DOC and POC into surrounding waters in their natural stage, and drainage increases the release (Nieminen et al., 2021). The IPCC 2013 Wetlands Supplement (IPCC, 2014) provides default rates of waterborne C release in the form of increased DOC leaching over the natural baseline (IPCC, 2014, their Chap. 2, Eq. 2.5). A simple application of the IPCC Tier 1 value of 0.12 (0.07–0.19) t C ha−1 (IPCC, 2014, their Chap. 2, Table 2.2), multiplied by the total drained forest land area of 4.3 Mha on organic soil in Finland, gives a rough estimate of peat C loss as DOC of 0.52 Mt C. Using the IPCC default assumption that 90 % of DOC is finally released as CO2 to the atmosphere gives an estimate of 1.70 Mt CO2 above the soil CO2 emissions predicted by our new method. This corresponds to a shift of about 21 % of the net soil CO2 balance in 2021 (Fig. 5), the amount worthy of considering as part of the GHG inventory of drained peatlands. Although the fate of DOC in water courses is not entirely clear (a significant part of DOC likely ends up fueling CO2 emissions, but the share of humus that re-sediments to rivers, lakes and seas is difficult to quantify), from the point of view of peatland forest soils, the runaway organic C reduces the peat C pool and displays one more aspect of the anthropogenic impacts of drainage worth acknowledging.
Clear merits of our method are that it includes comprehensive empirical data and models for SOM decomposition and litter production, and it links these to successional changes in tree stand characteristics, monitored by NFI, and to a regionally precise temperature regime. The method also includes realistic propagation of uncertainties in all model inputs and parameters into the annual estimates of CO2 balance and their differences, which is a requirement for GHG inventories. Such a dynamic model that can consider the effects of climate change as well as forest management and development provides a greatly improved tool for forest policy guidance to mitigate climate change.
Uncertainty assessments were developed for all annual estimates of soil CO2 balance in southern Finland, northern Finland and the whole country, as well as for the estimates of change in balance between the years 1990 and 2021. The accounted sources of uncertainty included NFI sampling errors in estimates of the areas of drained peatland forest types along with basal area and biomass of trees, as well as uncertainty about the parameters of the models, litter production and turnover rates, and mean dwarf shrub coverage.
A1 Notation
Soil CO2 balance (Mt yr−1, net emission positive) in year t over forests representing site type p in region r (southern Finland or northern Finland) was estimated as Yrpt=Arptyrpt, where Arpt is the interpolated NFI estimate of the area (Mha) of site type p in region r and
is the estimated net CO2 exchange per area unit (Mg ha−1 yr−1). The components of yrpt are the following:
the prediction of peat and litter decomposition (g CO2 m−2 yr−1), obtained using Eq. (13) of Ojanen et al. (2014, their Table A.5);
the biomass of litter from ground vegetation (g m−2 yr−1), as predicted using Eq. (12) of Ojanen et al. (2014, their Table A.4);
the biomass of litter from fine roots (g m−2 yr−1), as predicted using Eq. (8) of Ojanen et al. (2014, their Table A.2), corrected according to Laiho and Finér (1996) and combined with the site-type-specific turnover rates; Lrpt, the biomass of litter from living trees (excluding fine roots, Mg ha−1 yr−1); and Hrt, the biomass of residual organic matter from tree harvesting and natural mortality after decomposition (Mg ha−1 yr−1).
In the equations above, is the basal area of trees (m2 ha−1) based on NFI, s refers to tree species group, Trpt is the time-smoothed mean May–October air temperature (∘C) over sites of type p in region r and the remaining static components of the predictors are based on earlier studies. Model parameters
are based on Ojanen et al. (2014, their Table A.5),
on Ojanen et al. (2014, their Table A.4) and
on Ojanen et al. (2014, their Table A.2). Mean dwarf shrub coverages μp are from Table A.3 of Ojanen et al. (2014), correction α4=1.043 is based on Laiho and Finér (1996) and turnover rates ϕp are reported in this article (Table 3). q=5 is the number of peatland forest site types, and the applied values of the site-type-specific parameters are listed in Tables 3–6. For , the values β1,p, β2,p and μp are area-weighted averages of the values in Ojanen et al. (2014, their Tables A.5, A.4 and A.3) over the two subtypes I and II (wMtkgI=0.615, wPtkgI=0.6).
The region-specific annual estimates were , country-wide annual estimates were , and corresponding change estimates were and Y2021−Y1990.
A2 Uncertainty components
Uncertainty in estimates Arpt and Brpst due to NFI sampling was based on NFI12 (Tables A1 and A2) relying on the assumptions that (i) the relative standard errors (RSEs) and are unchanged across time, i.e., the same and equal to the corresponding RSEs in Tables A1 and A2 for all t, and (ii) the estimates Arp,1990 and Arp,2016 are uncorrelated, as are Brps,1990 and Brps,2021. Assumption (i) is justified by the relatively constant sampling effort of NFI across time and assumption (ii) by the fact that the estimates for the 2 years are completely based on different NFI campaigns.
Uncertainty due to estimation of parameters in Eqs. (8), (12) and (13) of Ojanen et al. (2014) was based on covariance matrices ΣR, ΣG and ΣF of parameter vectors θR, θG and θF (Tables A3–A5) derived from Tables A.5, A.4 and A.2 of Ojanen et al. (2014).
In particular, , and so on.
Variances of site-type-specific estimates of dwarf shrub coverage, Var(μp), were similarly derived from those presented in Table A.3 of Ojanen et al. (2014), and variances of fine root turnover rates, Var(ϕp), were based on expert judgment (Table A6), as was that of the deep root correction α4, Var(α4)=0.0122.
Relative standard errors of litter production estimates from living trees on drained peatland sites were estimated by region from NFI8 and NFI11 as explained in Lehtonen and Heikkinen (2016). For annual results, RSEs from NFI11 were applied to the litter series Lrpt across all site types and times (Table A7). When aggregating to the whole country and assessing the uncertainty in change between the years 1990 and 2021, correlations between regions and time points (Table A8) due to applying the same biomass models and litter production rates were also taken into account.
Relative standard error of litter originating from harvests and natural mortality was estimated similarly from NFI11 and was applied to the residual series Hrt.
Apart from correlations discussed above, all sources of uncertainty were assumed mutually uncorrelated.
A3 Impacts of uncertainty components on soil CO2 balance estimates
Assuming negligible correlation between area estimates Arpt, variances of region-specific annual balance estimates due to NFI sampling variance in area estimates Arpt were obtained as
variances of country-wide balanced estimates as
and variances of the change in balance between the years 1990 and 2021 as
and
To evaluate the impact of NFI sampling variance in basal area estimates Brpst, balance estimates were rewritten as
where intercepts
do not depend on basal area estimates and
Then, for the annual region-specific balance estimates,
and the variances for the whole country and for the change are obtained similarly (see area estimates above).
Considering uncertainty in the parameters of the peat and litter decomposition model, the balance estimates can also be expressed as
where C3,r does not depend on these parameters:
and
Thus, the impact of uncertainty in the parameters of the peat and litter decomposition model is
where . The corresponding variances for the whole country were obtained using coefficients
and
and for the region-specific change estimates with coefficients
Variances VarG(Y) and VarF(Y) due to parameter uncertainty in ground vegetation and fine root litter production model were derived from covariance matrices ΣG and ΣF and variances Var(α4), Var(ϕp) and Var(μp) in a similar manner.
Variances in region-specific annual balance estimates due to uncertainty in litter input from living trees were estimated as
where variances Var(Lrpt) were based on RSEs in Table A7. When propagating these to the whole country, covariances , based on the NFI11 correlation 0.539 (Table A8), were accounted for, as were covariances between time points when considering the change estimates. For instance,
where and Σ is the covariance matrix of derived using the correlation matrix of Table A8 and variances based on NFI11 for Yr,2021 and NFI8 for Yr,1990.
Finally, variances due to uncertainty in litter input from harvests and natural mortality,
were based on RSEs in Table A7 and on the assumption that the input estimates are uncorrelated across regions and time points. To combine all sources of uncertainty, source-specific variances were simply added up:
Following IPCC guidelines (Frey et al. 2006), percentage uncertainties were defined as
A4 Results
Uncertainties of the year 2021 (positive) balance estimates for southern Finland and the whole country are less than 100 % (Table A9), which indicates that the soils of drained organic peatlands are statistically significant sources of CO2 according to our model predictions. However, the 2021 balance in northern Finland does not differ significantly from zero. The increase in emissions between the years 1990 and 2021 is significant in both regions and in the whole country (Table A10).
The greatest impact was due to uncertainty in the parameter estimates of the peat and litter decomposition model (41 %–67 % of variance in 2021 balance estimates, 73 %–78 % in change estimates; Tables A9 and A10). The impact of uncertainty in fine root model parameters was relatively modest (9 %–10 %) in change estimation, but somewhat greater (19 %–39 %) in annual estimates. From other sources of uncertainty, only litter input from living trees exceeded 10 % impact in any of the estimates. In particular, uncertainty in NFI estimates of site type areas and basal areas of trees had a negligible impact on annual balance estimates and contributed less than 5 % of the variance of change estimates.
The errors in annual balance estimates are positively correlated because the same model parameters with same estimation errors were applied throughout the series. For example,
Due to these correlations, change estimates can differ significantly from zero even if confidence intervals of annual estimates have a large overlap (Fig. A1).
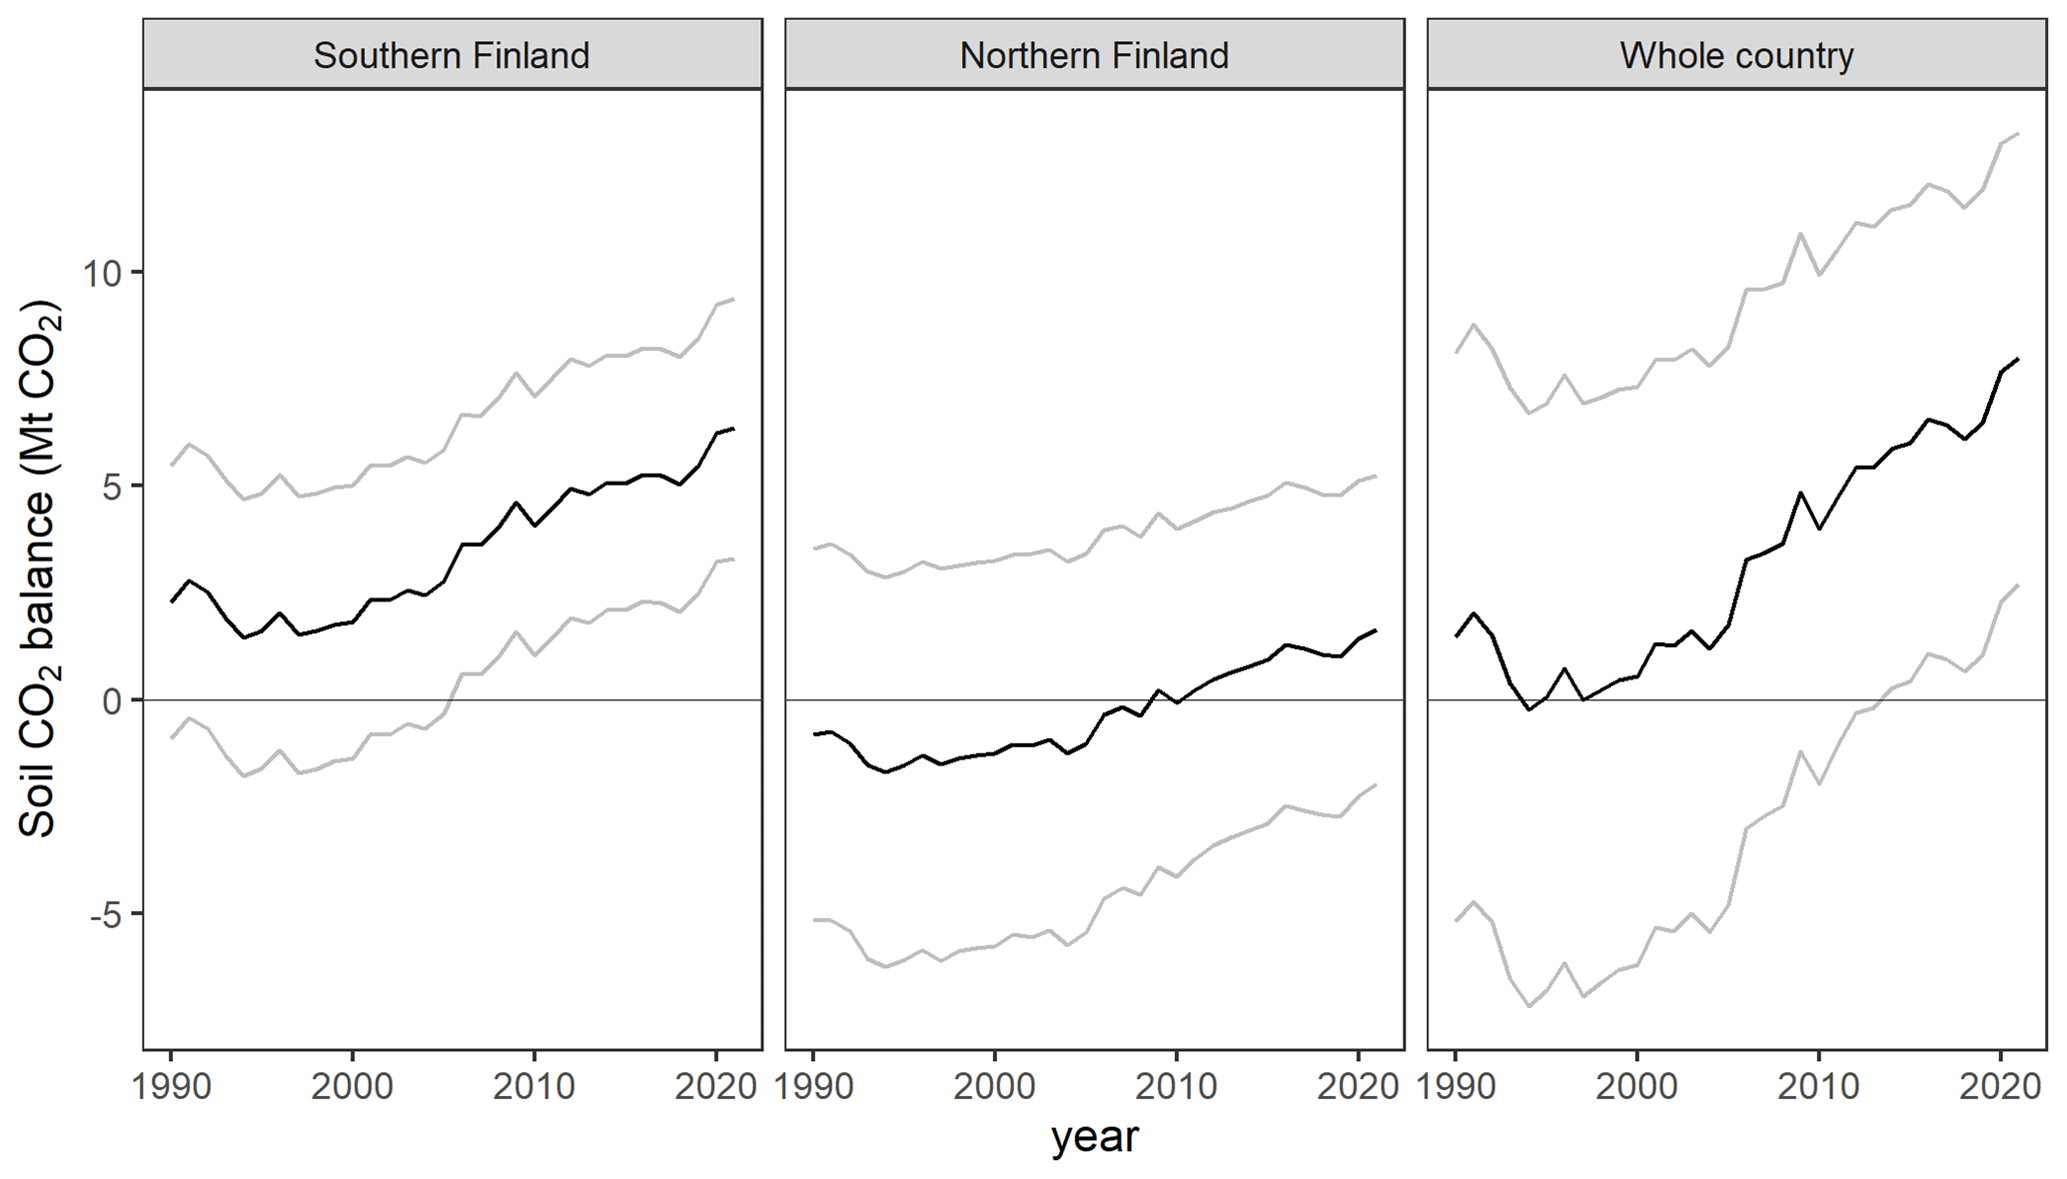
Figure A1Drained organic forest soil CO2 balance for southern Finland, northern Finland and the whole country (black lines; equal to those in Fig. 4), as well as pointwise 95 % confidence intervals obtained by adding ± U to the balance estimate (grey lines).
Table A1NFI12 estimates of the areas of drained peatland forest site types (FTYPEs with their Finnish abbreviations) in southern and northern Finland together with their standard errors (SEs) and relative standard errors (RSEs) due to sampling, assessed as explained in Korhonen et al. (2021, Supplement S1).
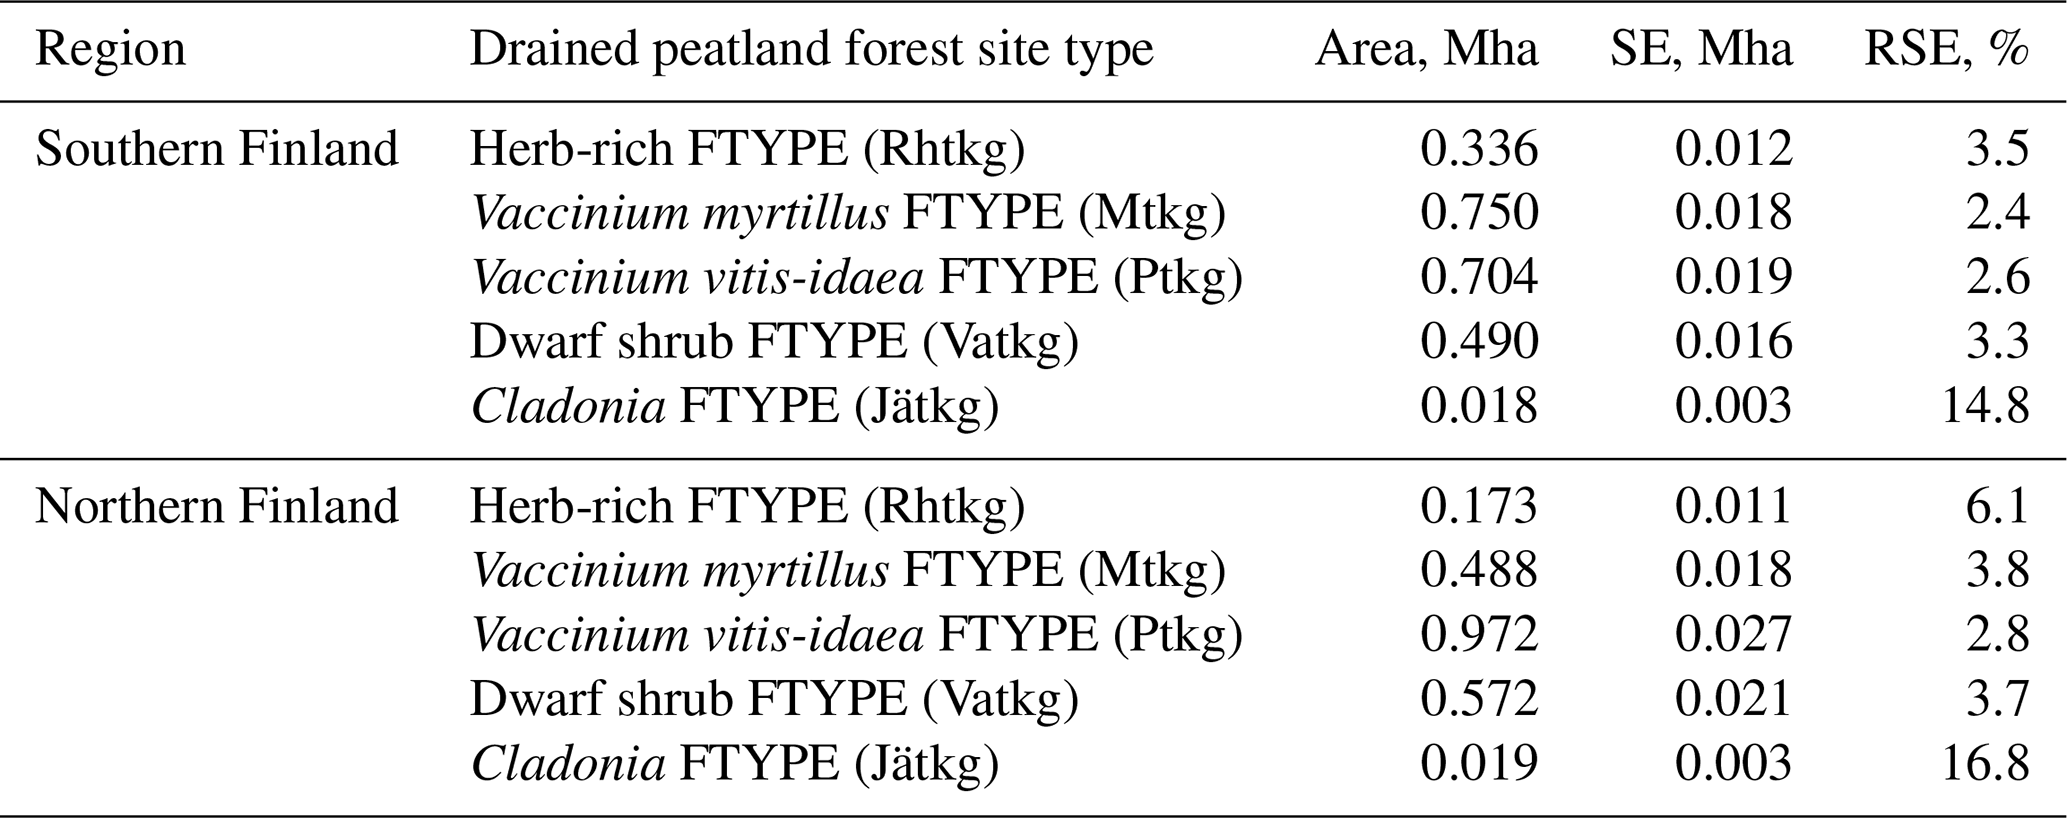
Table A2NFI12 estimates of basal area of trees and their standard errors (SEs) and relative standard errors (RSEs) due to sampling, assessed as explained in Korhonen et al. (2021, Supplement S1).
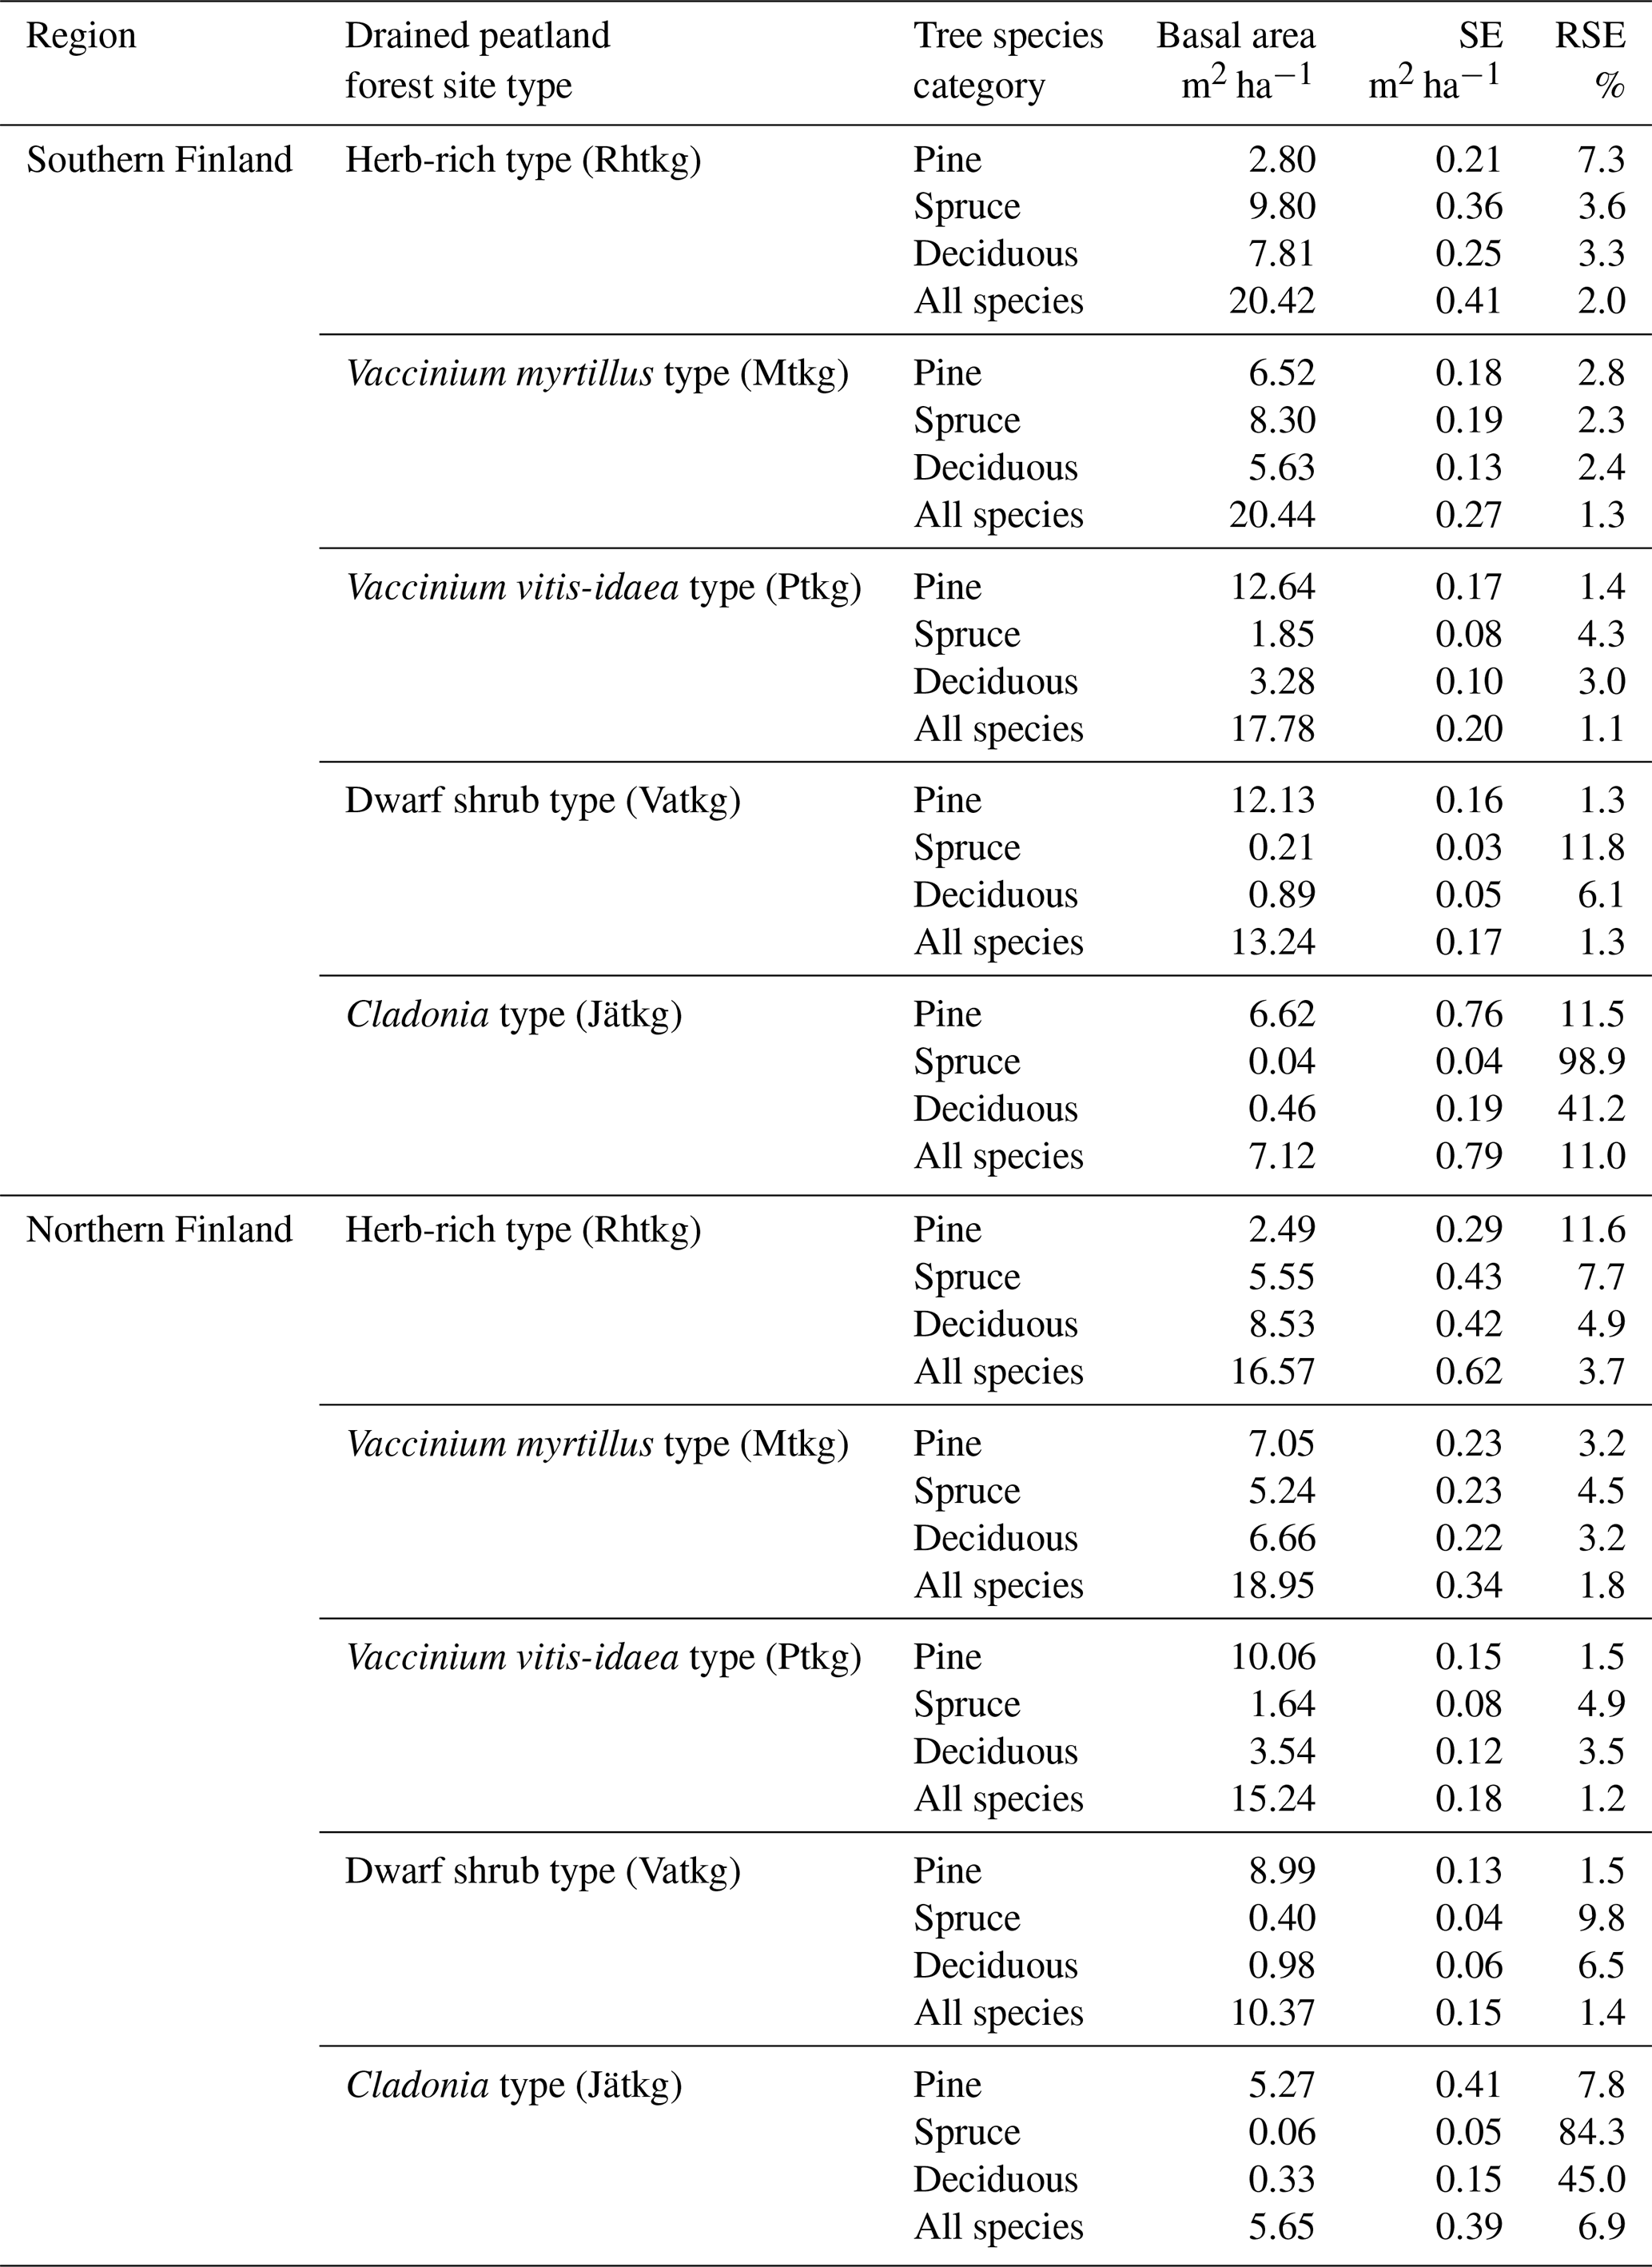
Table A3Covariance matrix ΣR of the parameters of the peat and litter decomposition model derived from Ojanen et al. (2014, their Table A.5) after combining the Mtkg and Ptkg subtypes.
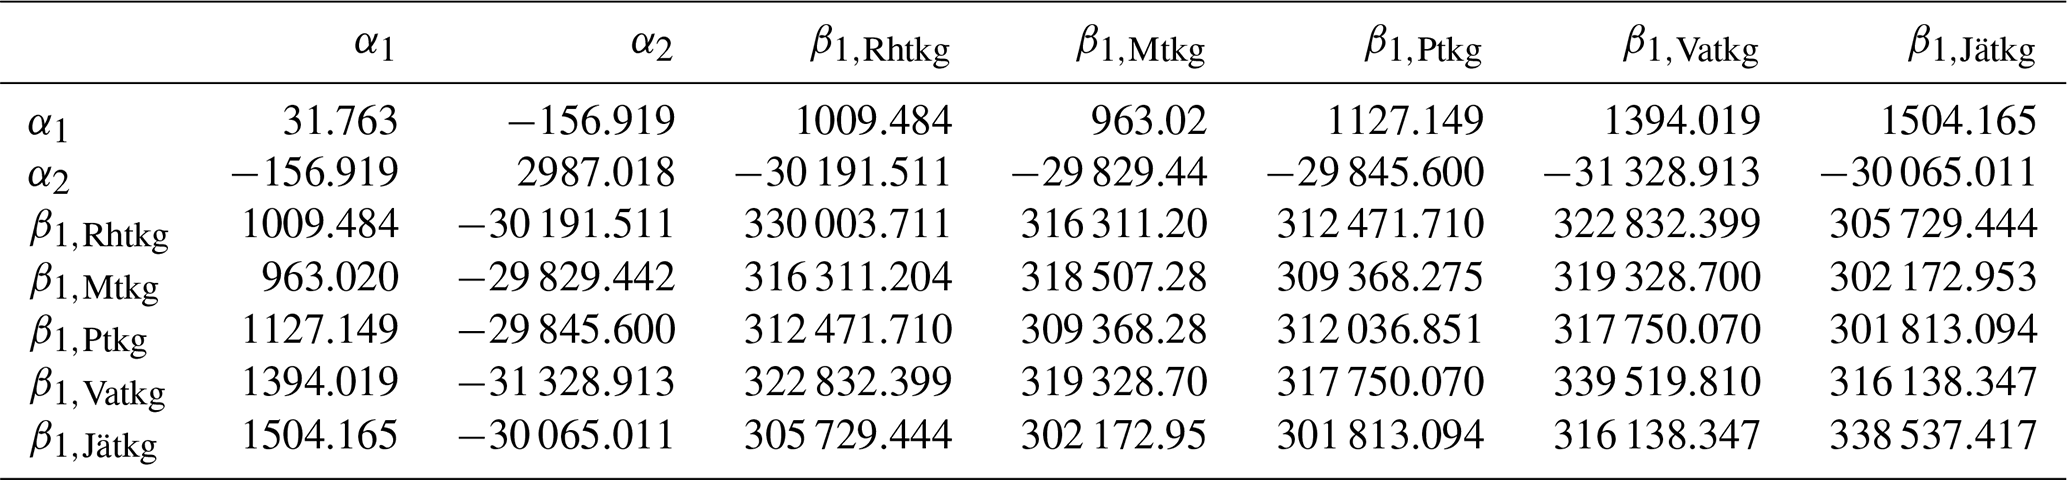
Table A4Covariance matrix ΣG of the parameters of the ground vegetation litter model derived from Ojanen et al. (2014, their Table A.4) after combining the Mtkg and Ptkg subtypes.
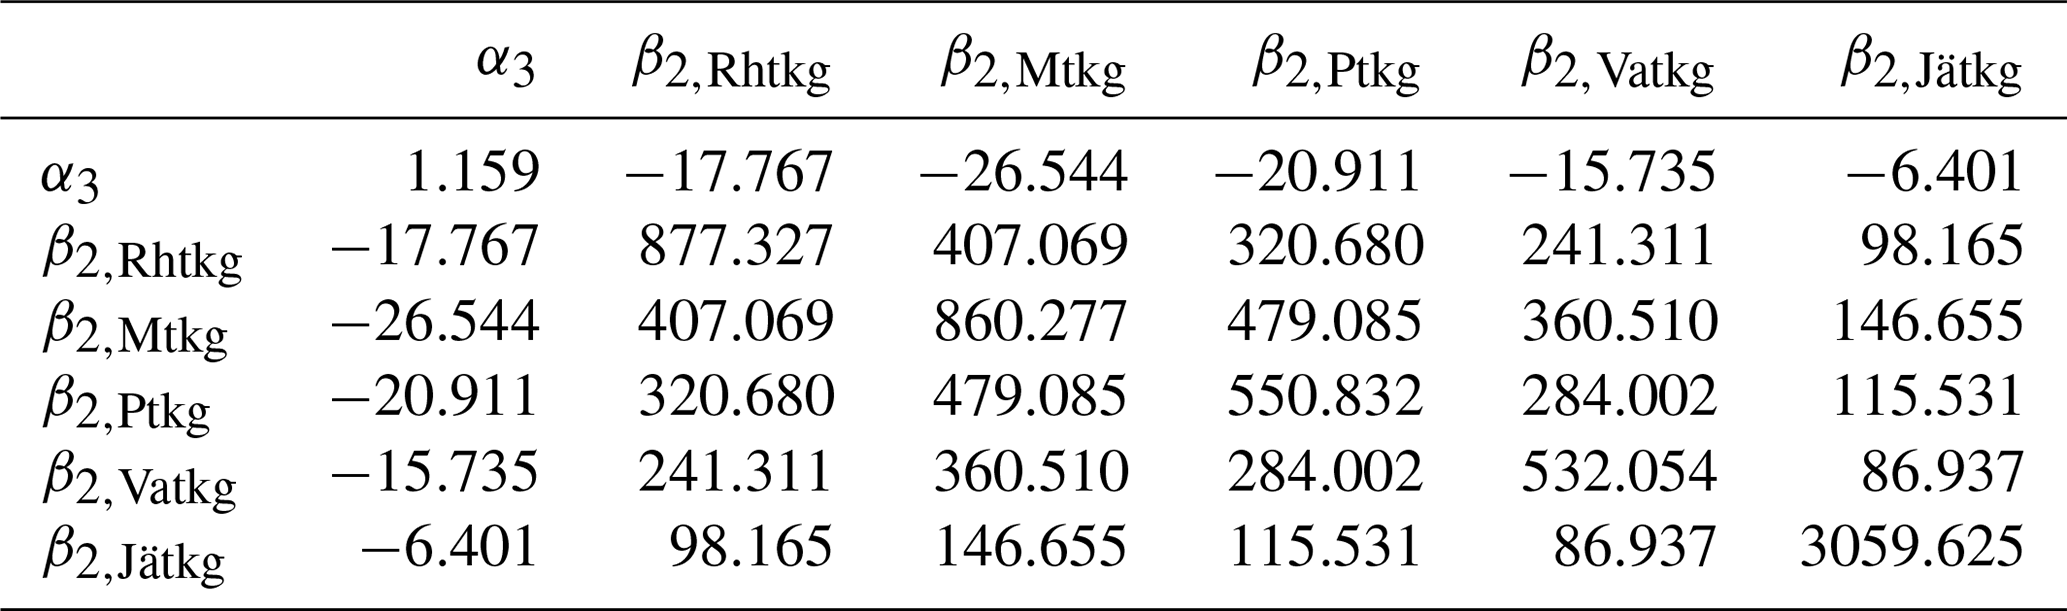
Table A5Covariance matrix ΣF of the parameters of the fine root biomass model of Ojanen et al. (2014, their Table A.2).
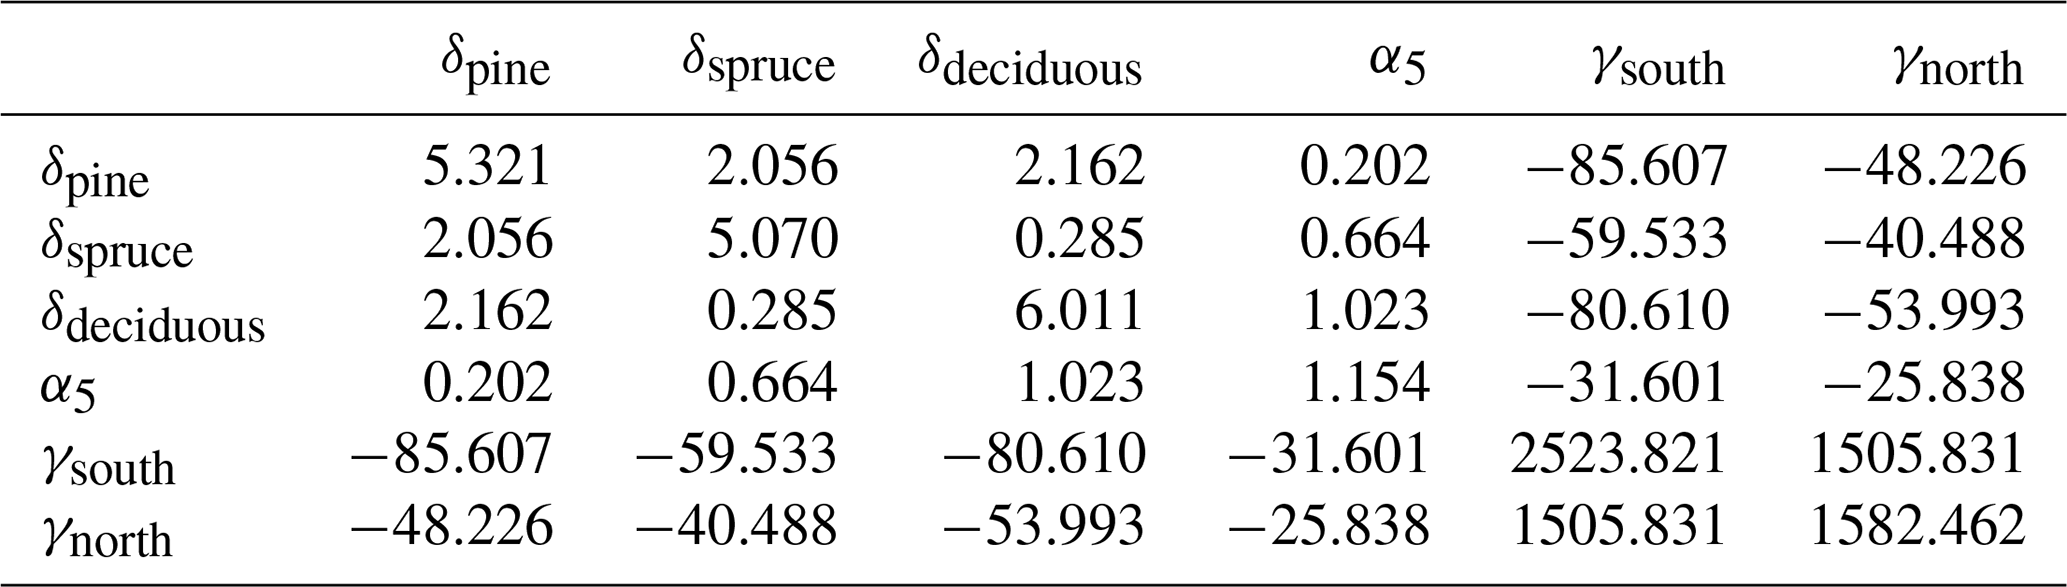
Table A6The applied variances of site-type-specific fine root turnover rates, Var(ϕp) (expert judgment), and dwarf shrub coverages, Var(μp) (Ojanen et al. 2014, their Table A.3, after combining the Mtkg and Ptkg subtypes); the corresponding values ϕp and μp are given in Table 3.
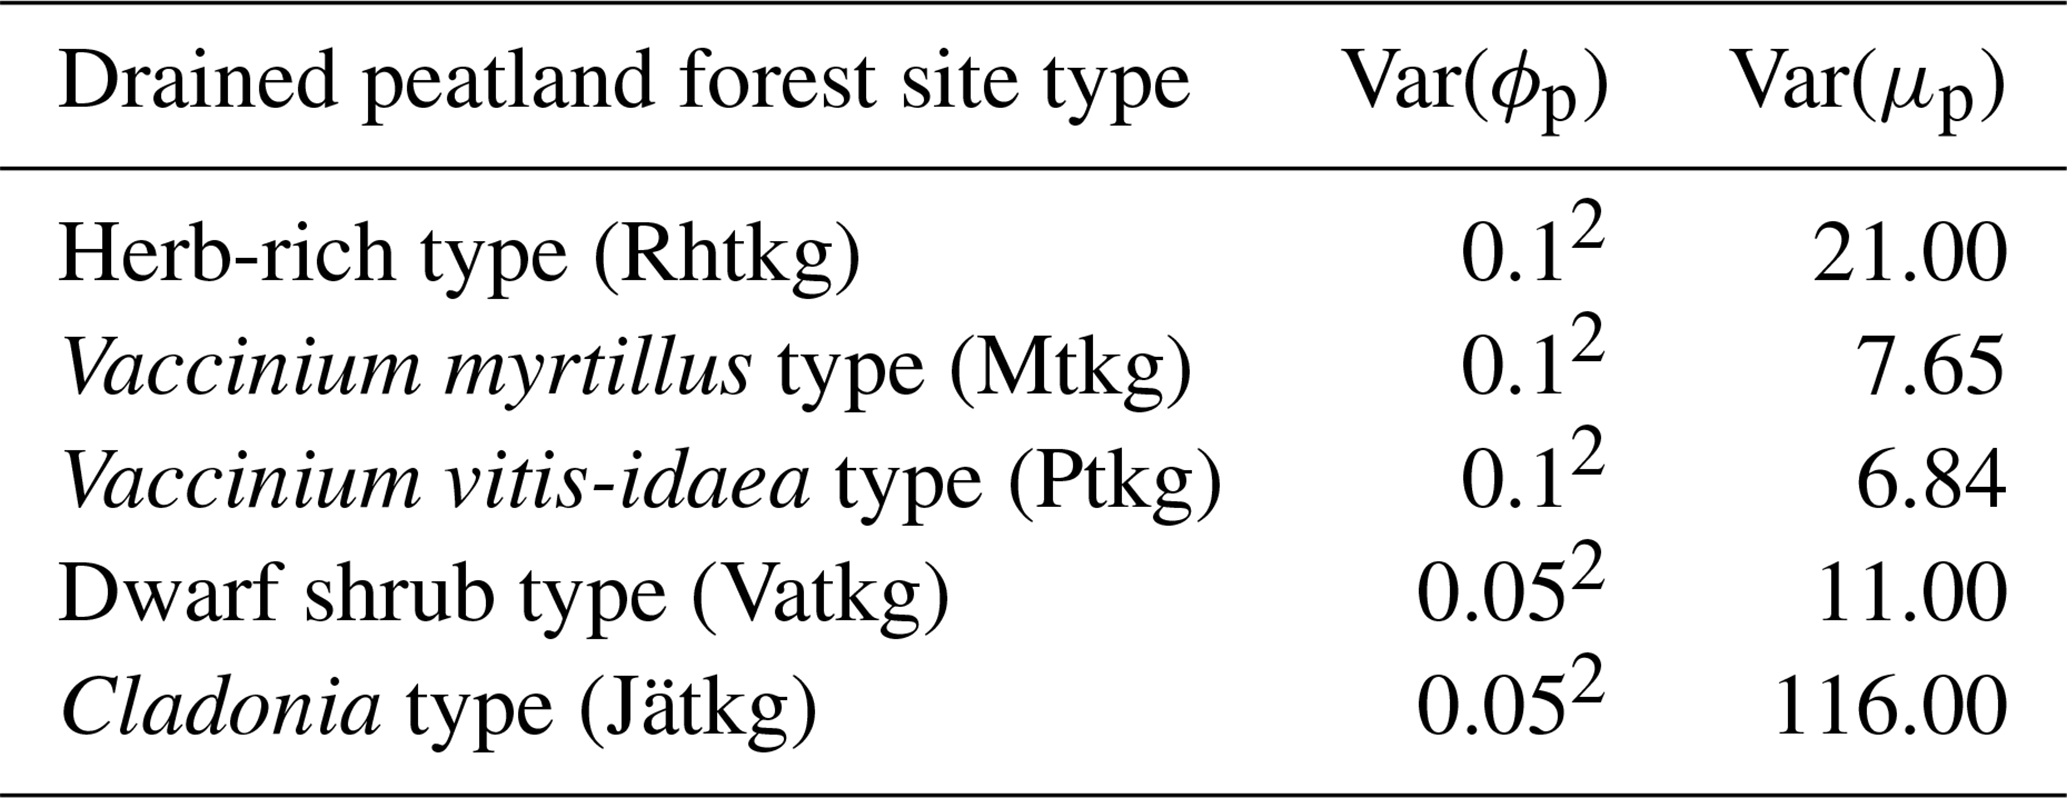
Table A7Relative standard errors (%) of litter production from living trees and from harvests and natural mortality on drained peatlands estimated from NFI11.
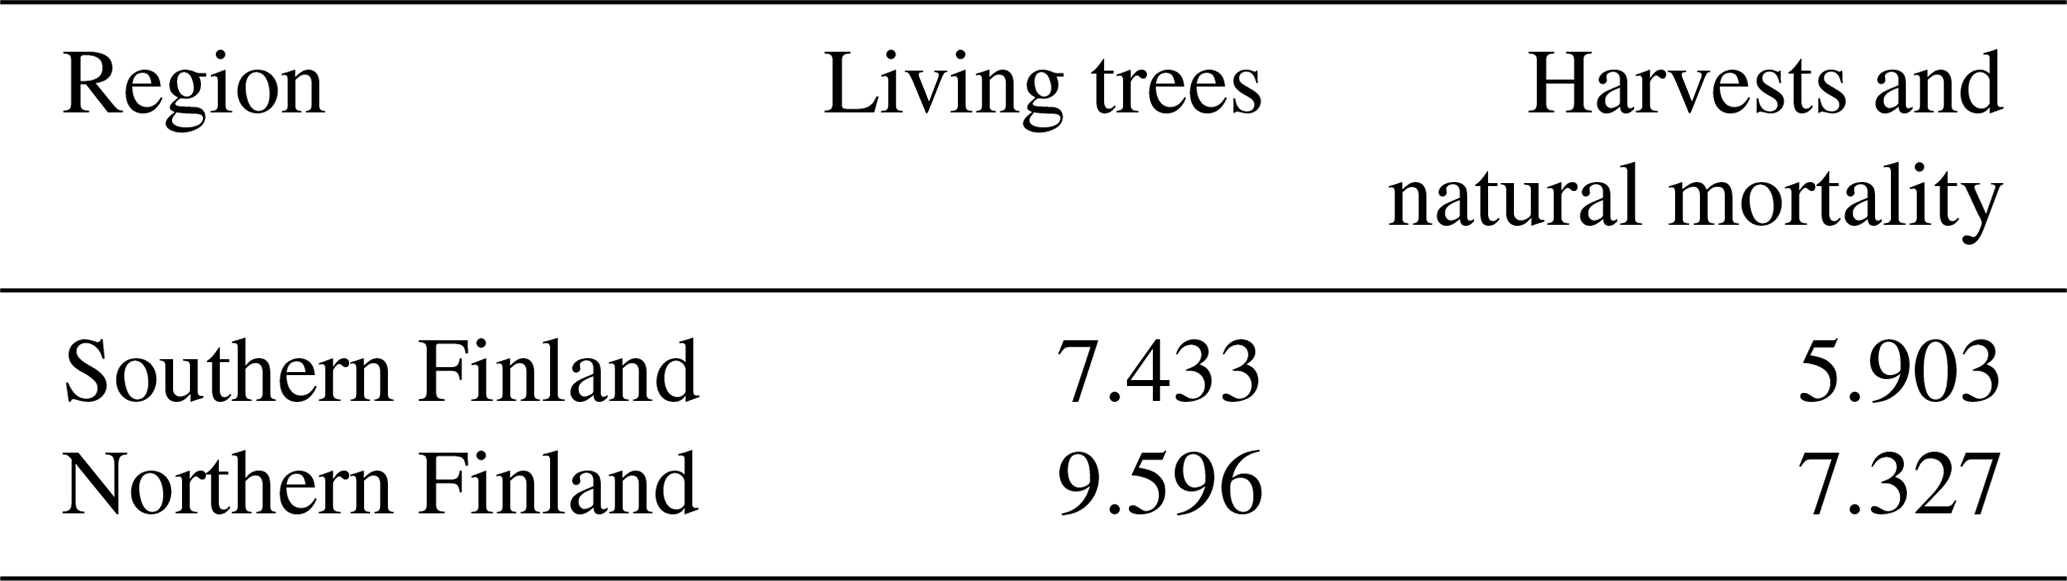
Table A8Correlations of NFI estimates of litter production from living trees.
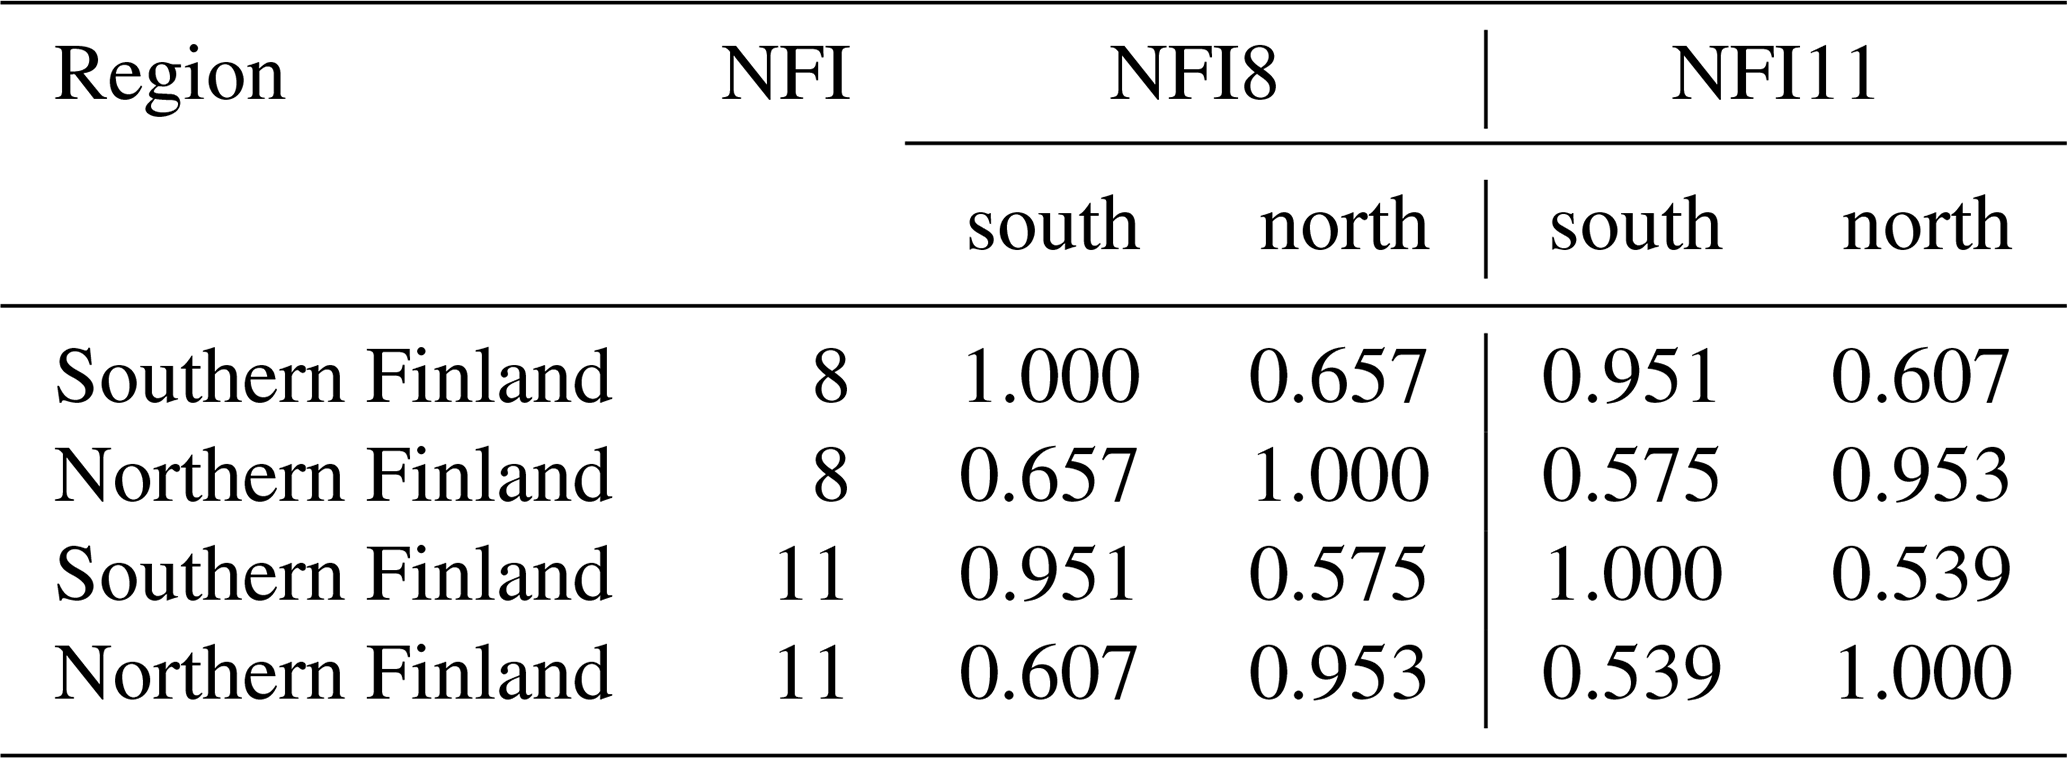
Table A9Estimates of CO2 release from peat and litter decomposition, net C inputs to soil converted to the units of CO2, and soil CO2 balance (“Net”) for the year 2021 together with the variance (“Var”) and uncertainty (“U”) of the estimates.
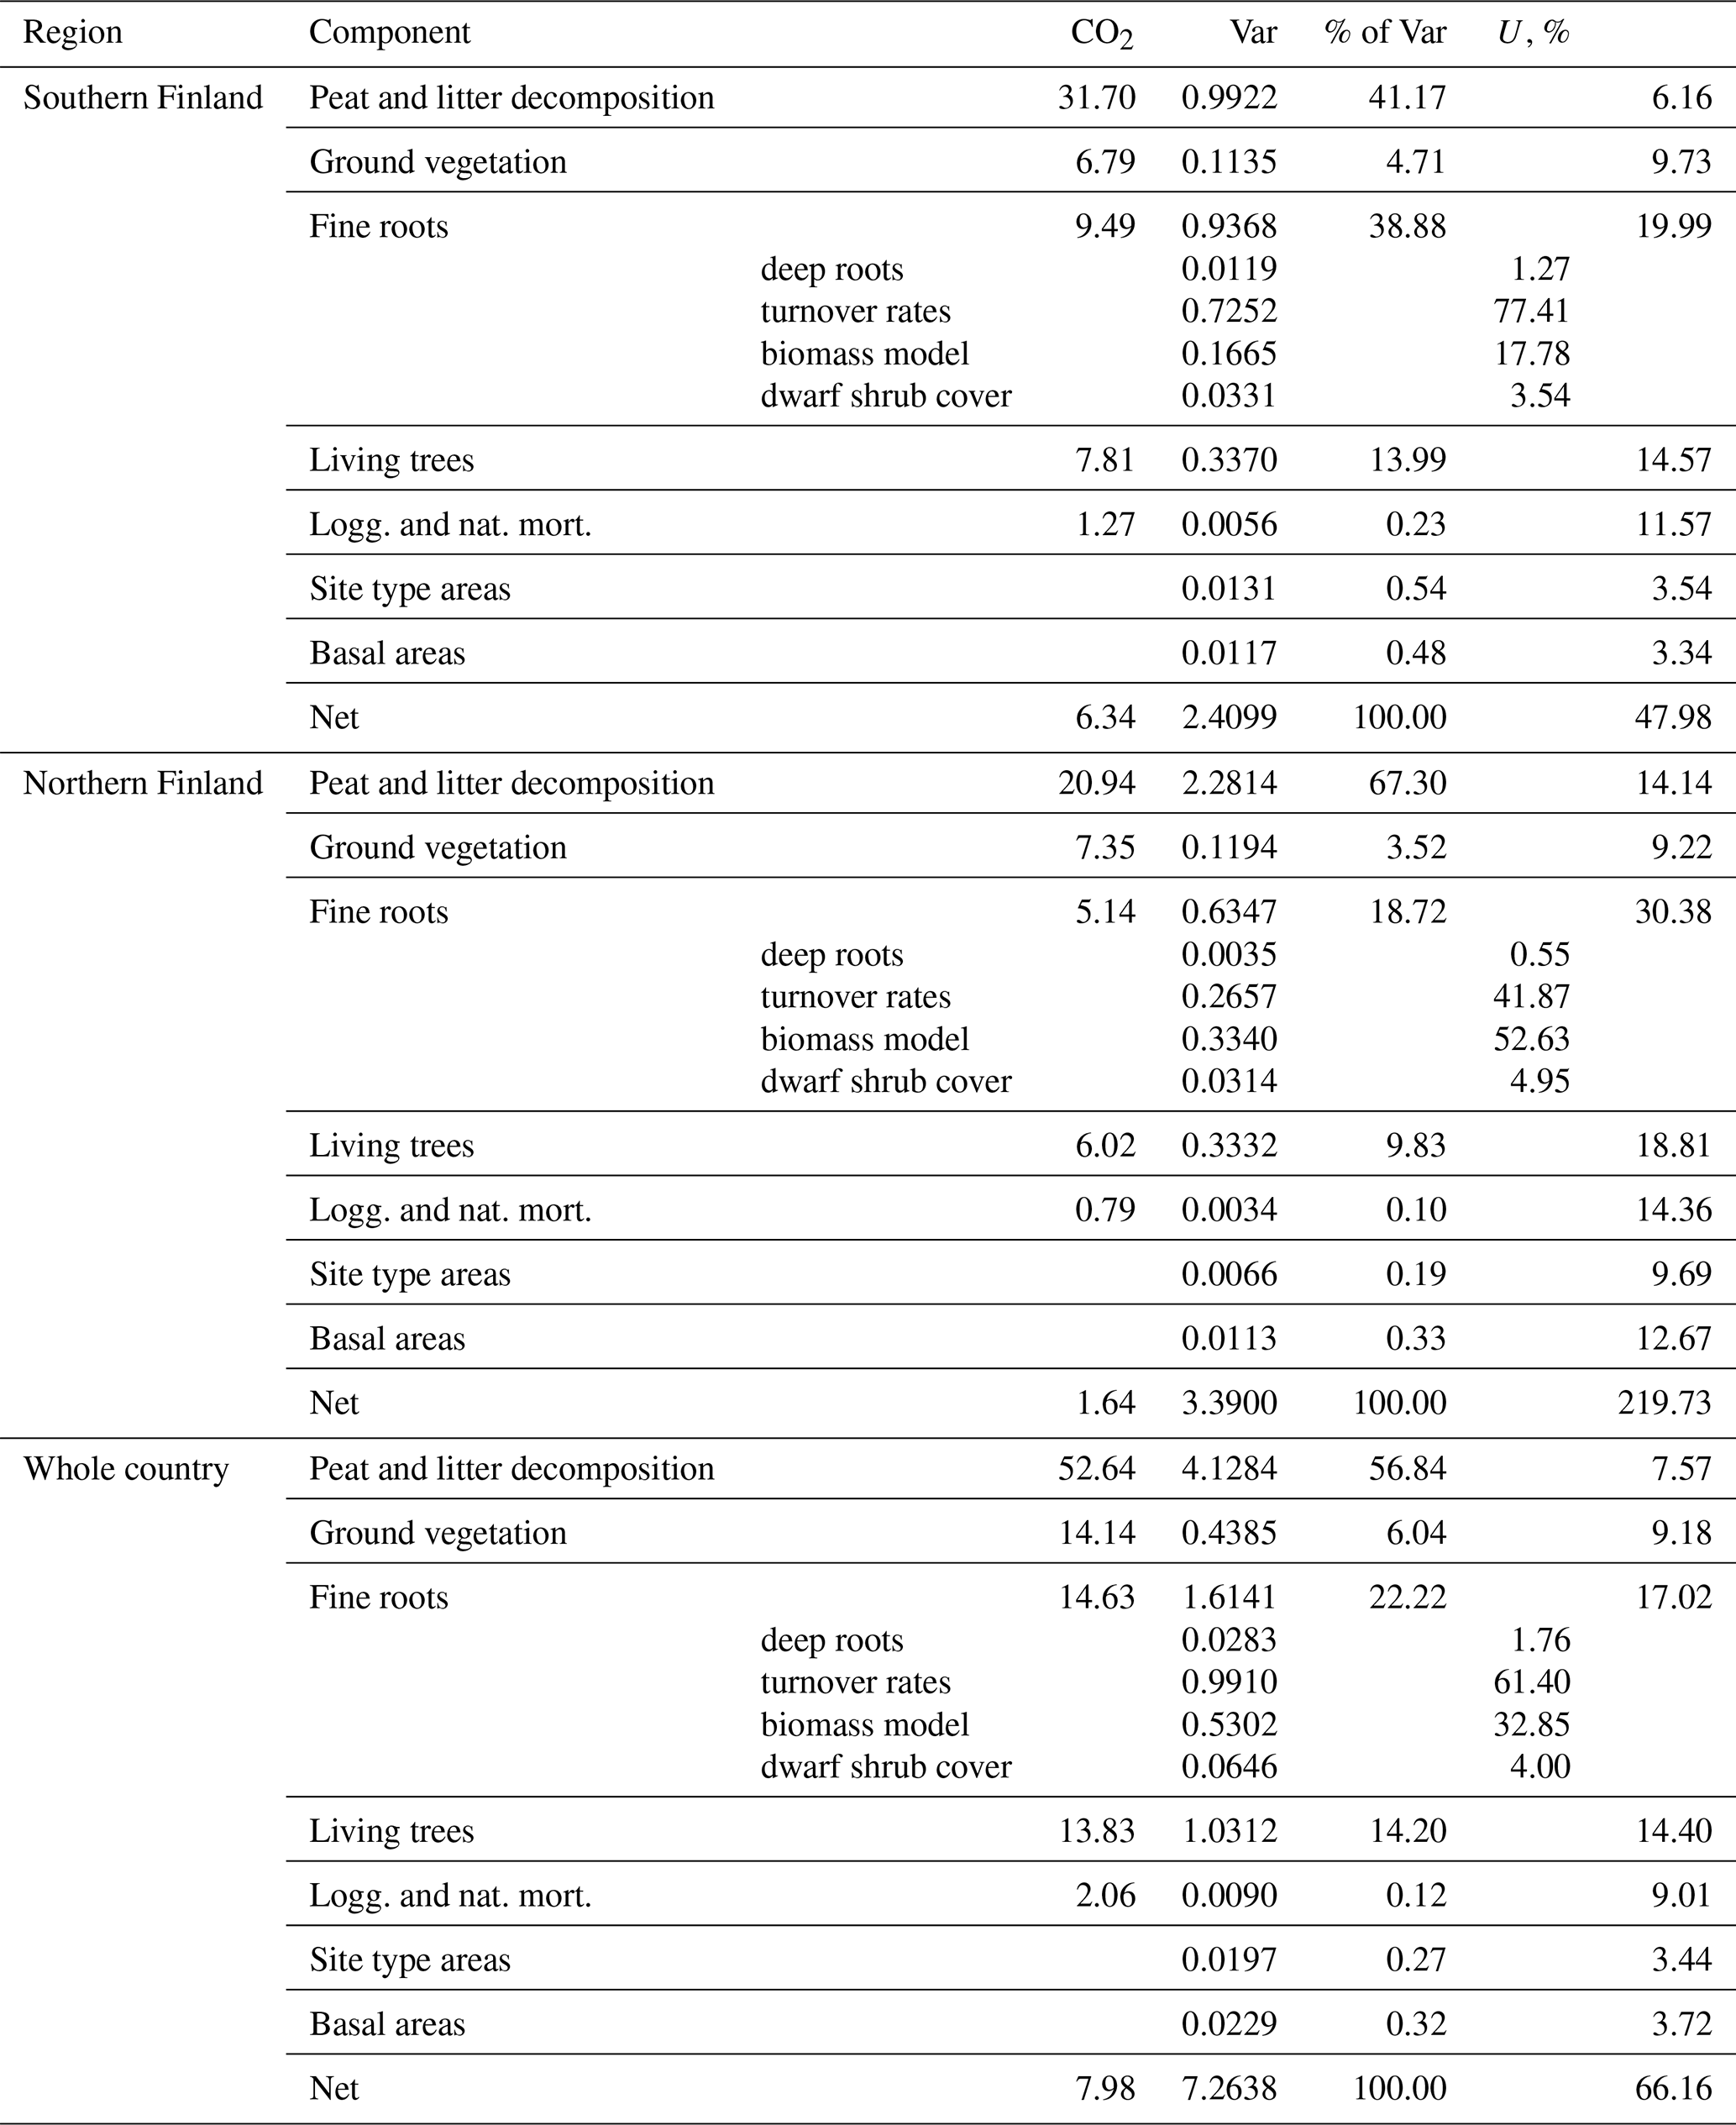
Table A10Estimates of change from 1990 to 2021 in CO2 release from peat and litter decomposition, net C inputs to soil converted to the units of CO2, and soil CO2 balance (“Net”) for the year 2021 together with the variance (“Var”) and uncertainty (“U”) of the change estimates.
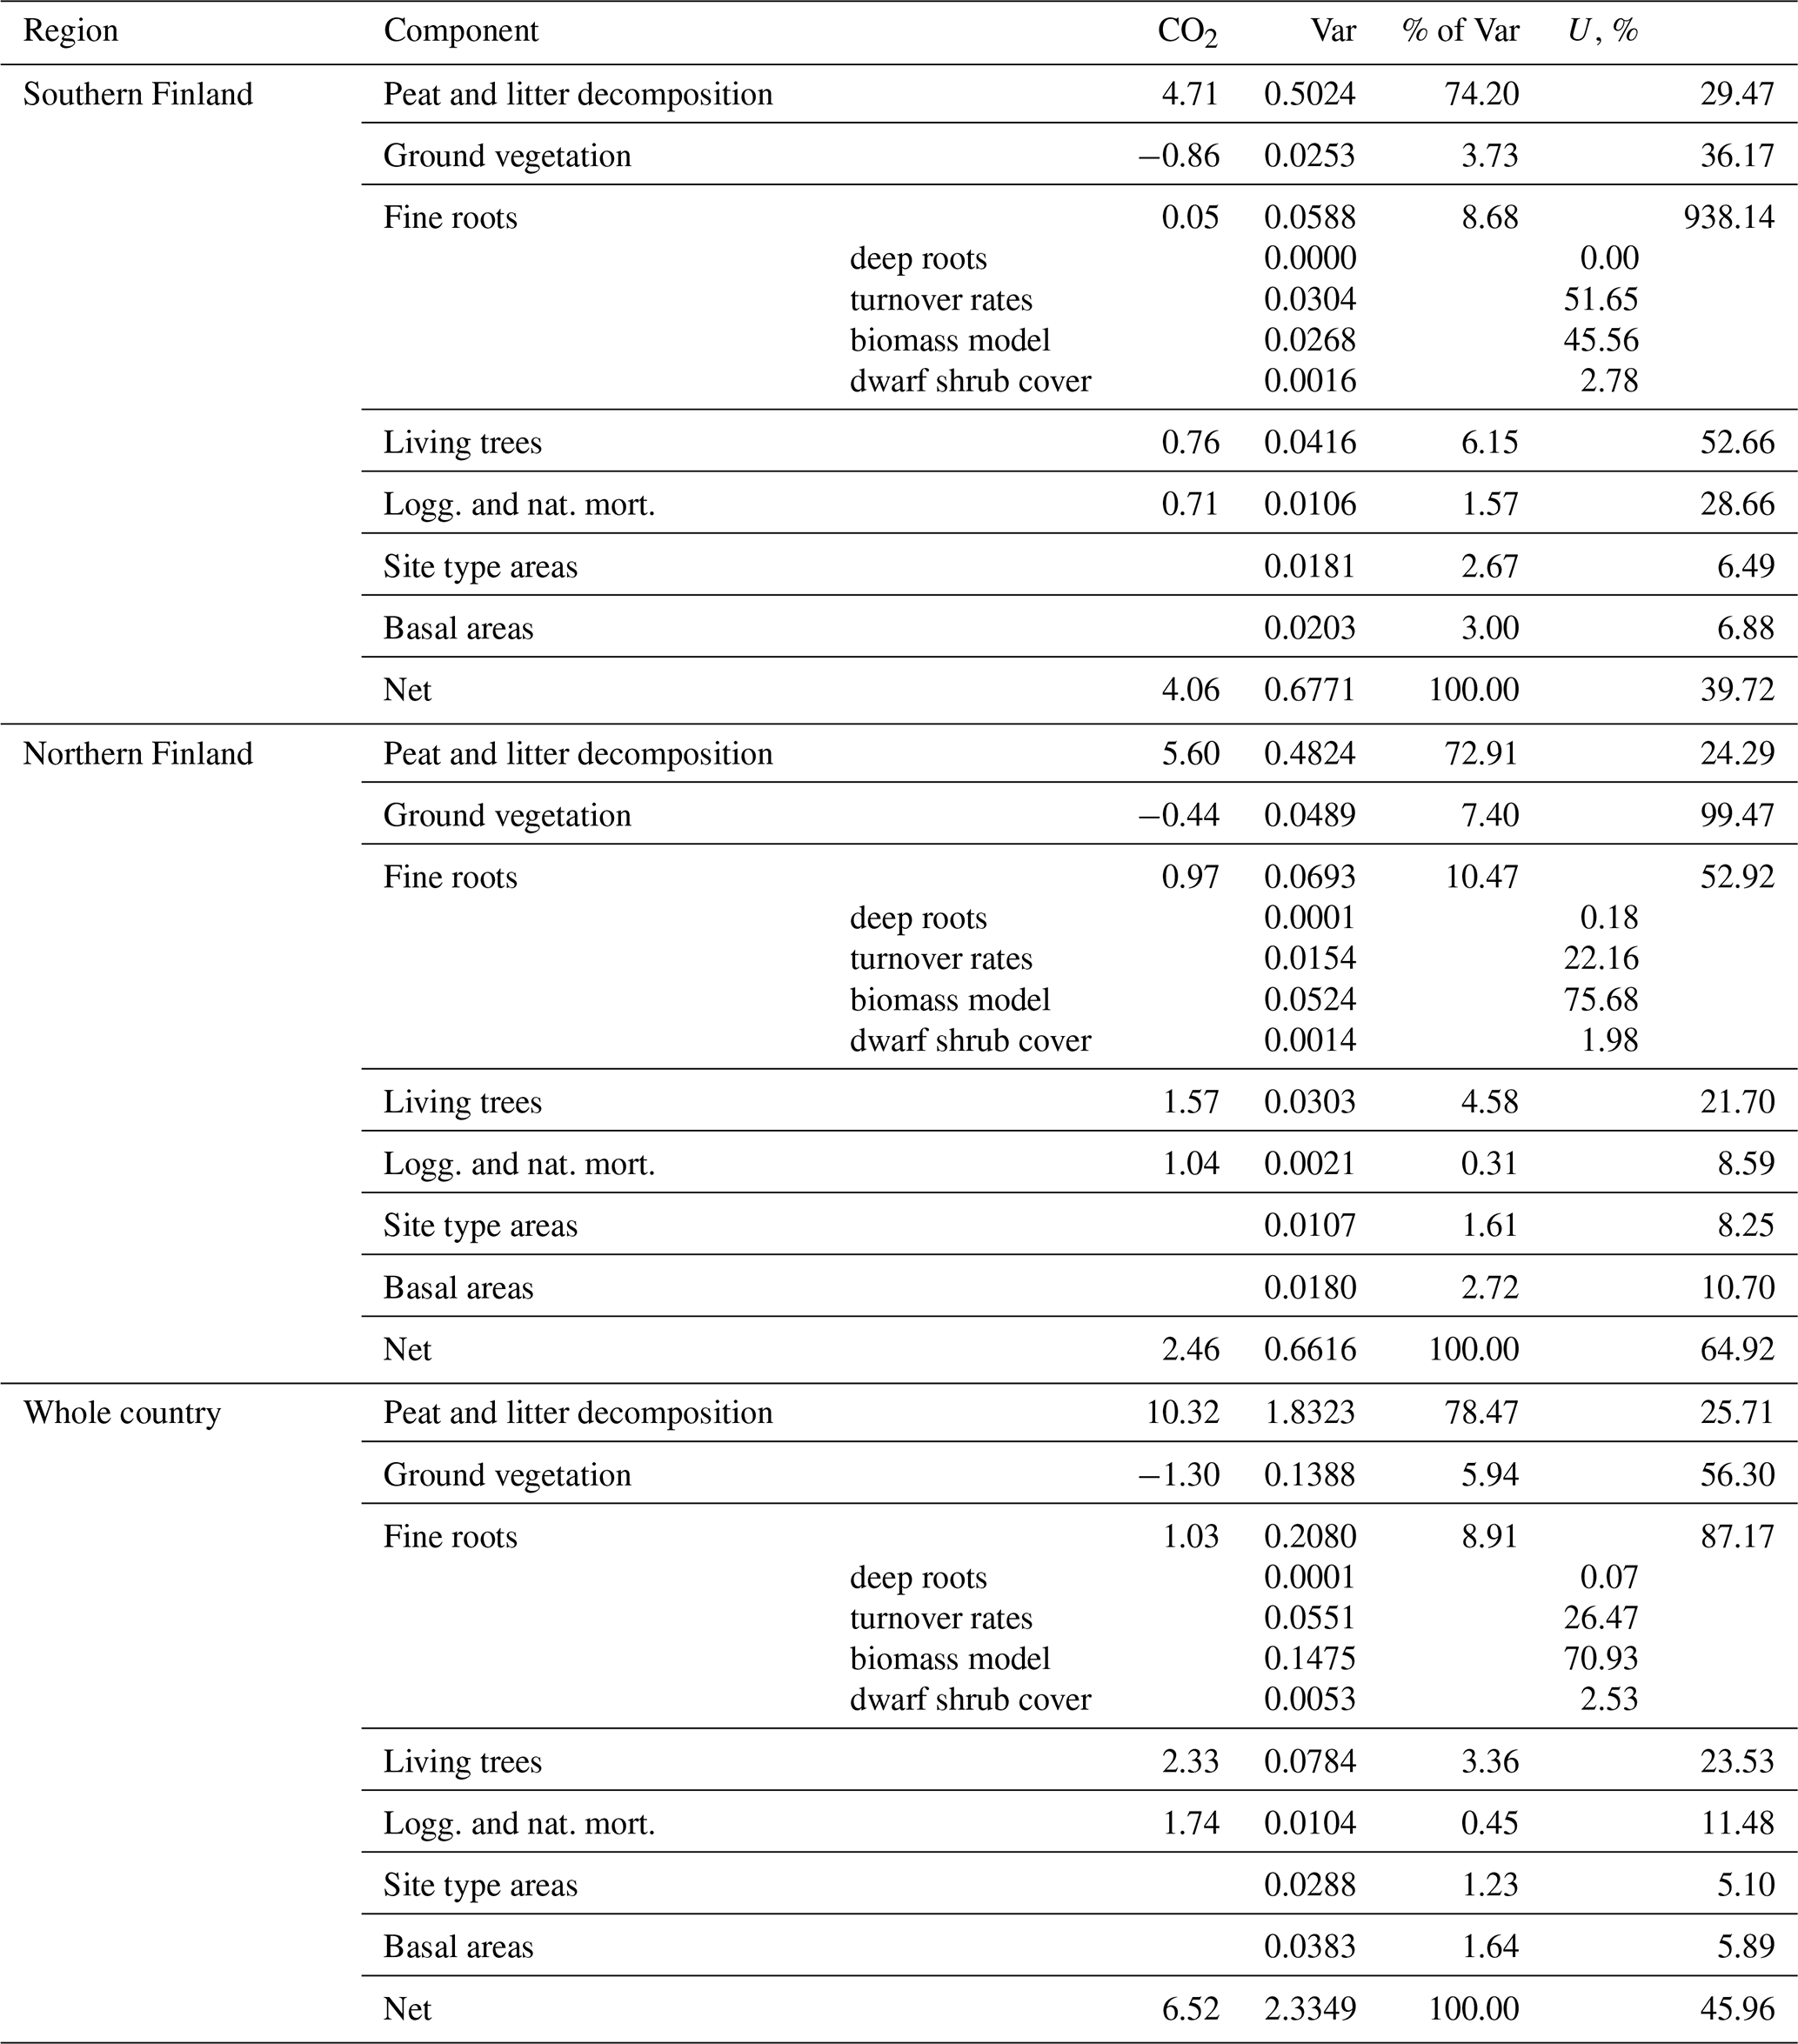
The R scripts that implement the new method are available on Zenodo at https://doi.org/10.5281/zenodo.8354397 (Alm et al., 2023).
The input data with descriptions are available on Zenodo at https://doi.org/10.5281/zenodo.8354397 (Alm et al., 2023).
The supplement related to this article is available online at: https://doi.org/10.5194/bg-20-3827-2023-supplement.
All co-authors (JA, AW, JPM, PO, JH, HMH, RL, KM, TT and JM) have jointly developed the conceptualization of the method for the GHG inventory. PO curated the empirical data, published elsewhere, and contributed to application of the models and discussions of further development needs. AW, TT, HMH and JPM were responsible of model input data curation and ensuring compatibility with the Finnish GHG inventory. JH developed the formal statistical methodology, analyzed the uncertainties and authored Appendix A. JPM developed the method software and with AW was responsible for the computations. JPM also created the visualization of results in figures. Investigation and writing of the original draft were led by JA and JM, produced together with AW, JM, PO, KM and TT. Contributions to text were obtained from KM, RL, JPM and HMH. All co-authors participated in addressing the referee comments and making respective modifications to the paper.
The contact author has declared that none of the authors has any competing interests.
Publisher's note: Copernicus Publications remains neutral with regard to jurisdictional claims in published maps and institutional affiliations.
The paper benefited from expert comments on its earlier version by Chris Evans of the UK Centre for Ecology and Hydrology, Andis Lazdiòš of LSFRI Silava (Latvia), and Jyrki Jauhiainen, Aleksi Lehtonen, Raisa Mäkipää, Timo Penttilä and Sanna Saarnio of the Natural Resources Institute Finland. Riitta Pipatti and Sini Niinistö of the Inventory Unit, Statistics Finland, are acknowledged for encouraging the method development process.
This paper was edited by David McLagan and reviewed by three anonymous referees.
Alm, J., Talanov, A., Saarnio, S., Silvola, J., Ikkonen, E., Aaltonen, H., Nykänen, H., and Martikainen, P.J.: Reconstruction of the carbon balance for microsites in a boreal oligotrophic pine fen, Finland, Oecologia, 110, 423–431, 1997.
Alm, J., Schulman, L., Walden, J., Nykänen, H., Martikainen, P. J., and Silvola, J.: Carbon balance of a boreal bog during a year with an exceptionally dry summer, Ecology, 80, 161–174, 1999.
Alm, J., Wall, A., Myllykangas, J.-P., Ojanen, P., Heikkinen, J., Henttonen, H. M., Laiho, R., Minkkinen, K., Tuomainen, T., and Mikola, J.: Data and R-scripts for estimating carbon dioxide emissions from drained peatland forest soils for the greenhouse gas inventory of Finland (1.0), Zenodo [code, data set], https://doi.org/10.5281/zenodo.8354397, 2023.
Bjarnadottir, B., Sungur, G. A., Sigurdsson, B. D., Kjartansson, B. T., Oskarsson, H., Oddsdottir, E. S., Gunnarsdottir, G. E., and Black, A.: Carbon and water balance of an afforested shallow peatland in Iceland, Forest Ecol. Manag., 482, 118861, https://doi.org/10.1016/j.foreco.2020.118861, 2021.
Bradford, M. A.: Thermal adaptation of decomposer communities in warming soils, Front. Microbiol., 4, 333, https://doi.org/10.3389/fmicb.2013.00333, 2013.
Bradford, M. A., Davies, C. A., Frey, S. D., Maddox, T. R., Melillo, J. M., Mohan, J. E., Reynolds, J. F., Treseder, K. K., and Wallenstein, M. D.: Thermal adaptation of soil microbial respiration to elevated temperature, Ecol. Lett., 11, 1316–1327, 2008.
Brown, P., Cardenas, L., Choudrie, S., Del Vento, S., Richmond, B., Karagianni, E., MacCarthy, J., Mullen, P., Passant, N., B., Smith, H., Thistlethwaite, G., Thomson, A., Turtle, L., and Wakeling, D.: UK Greenhouse Gas Inventory, 1990 to 2019: Annual Report for submission under the Framework Convention on Climate Change, Ricardo Energ. Environ., UK NIR 2021, 655 pp., ISBN 978-0-9933975-7-8, 2021.
Cajander, A. K.: Studien über die Moore Finnlands, Acta Forestalia Fennica, 2, 7530, https://doi.org/10.14214/aff.7530, 1913.
Davidson, E. A. and Janssens, I. A.: Temperature sensitivity of soil carbon decomposition and feedbacks to climate change, Nature, 440, 165–173, https://doi.org/10.1038/nature04514, 2006.
Duffy, P., Black, K., Fahey, D., Hyde, B., Kehoe, A., Murphy, J., Quirke, B., Ryan, A. M., and Ponzi, J.: Ireland National Inventory Report, Greenhouse gas emissions 1990–2019 reported to the United Nations Framework Convention on Climate Change, Environmental Protection Aency, 476 pp., ISBN 978-1-84095-975-8, 2021.
Eurola, S.: Über die regionale Einteilung der südfinnischen Moore, Ann. Botan. Soc.-Vanamo, 33, 1–243, 1962.
FAO: Global Forest Resources Assessment 2020, Terms and Definitions, FRA 2020, Forest Resources Assessment Working Paper 188, Food and Agriculture Organization of the United Nations, Rome, https://www.fao.org/3/I8661EN/i8661en.pdf (last access: 23 August 2023), 2020.
Frey, C., Penman, J., Hanle, L., Monni, S., and Ogle, S.: Uncertainties, Chap. 3, in: 2006 IPCC Guidelines for National Greenhouse Gas Inventories, edited by: Eggleston, H. S., Buendia, L., Miwa, K., Ngara, T., and Tanabe K., prepared by the National Greenhouse Gas Inventories Programme, The Intergovernmental Panel on Climate Change, IGES, Japan, ISBN 4-88788-032-4, https://www.ipcc-nggip.iges.or.jp/public/2006gl/pdf/1_Volume1/V1_3_Ch3_Uncertainties.pdf (last access: 23 August 2013), 2006.
Haahti, K., Warsta, L., Kokkonen, T., Younis, B. A., and Koivusalo, H.: Distributed hydrological modeling with channel network flow of a forestry drained peatland site, Water Resour. Res., 52, 246–263, https://doi.org/10.1002/2015WR018038, 2016.
Havas, P.: Vagetation und Ökologie der ostfinnishen Hangmoore, Ann. Bot. Soc.-Vanamo, 31, 1–188, 1961.
Helmisaari, H.-S., Derome, J., Nöjd, P., and Kukkola, M.: Fine root biomass in relation to site and stand characteristics in Norway spruce and Scots pine stands, Tree Physiol., 27, 1493–1504, 2007.
Hökkä, H., Laurén, A., Stenberg, L., Launiainen, S., Leppä, K., and Nieminen, M.: Defining guidelines for ditch depth in drained Scots pine dominated peatland forests, Silva Fenn., 55, 10494, https://doi.org/10.14214/sf.10494, 2021.
IPCC: 2006 IPCC Guidelines for National Greenhouse Gas Inventories, prepared by the National Greenhouse Gas Inventories Programme, edited by: Eggleston, H. S., Buendia, L., Miwa, K., Ngara, T., and Tanabe K., IGES, Japan, Intergovernmenbtal Panel on Climate Change, ISBN 4-88788-032-4, 2006.
IPCC: 2013 Supplement to the 2006 IPCC Guidelines for National Greenhouse Gas Inventories, Wetlands International, edited by: Hiraishi, T., Krug, T., Tanabe, K., Srivastava, N., Baasansuren, J., Fukuda, M., and Troxler, T. G., IPCC, Switzerland, ISBN 978-92-9169-139-5, 2014.
Jauhiainen, J., Alm, J., Bjarnadottir, B., Callesen, I., Christiansen, J. R., Clarke, N., Dalsgaard, L., He, H., Jordan, S., Kazanavičiūtė, V., Klemedtsson, L., Lauren, A., Lazdins, A., Lehtonen, A., Lohila, A., Lupikis, A., Mander, Ü., Minkkinen, K., Kasimir, Å., Olsson, M., Ojanen, P., Óskarsson, H., Sigurdsson, B. D., Søgaard, G., Soosaar, K., Vesterdal, L., and Laiho, R.: Reviews and syntheses: Greenhouse gas exchange data from drained organic forest soils – a review of current approaches and recommendations for future research, Biogeosciences, 16, 4687–4703, https://doi.org/10.5194/bg-16-4687-2019, 2019.
Joosten, H: The Global Peatland CO2 Picture. Peatland status and emissions in all countries of the World, Ede, Wetlands International, 10 pp., 2010.
Kalbfleisch, J. D. and Prentice, R. L.: The statistical analysis of failure time data, Wiley, ISBN 9780471363576, 2002.
Kaplan, E.L., and Meier, P.: Nonparametric estimation from incomplete observations, J. Am. Stat. Assoc., 53, 457–481, 1958.
Korhonen, K. T., Ahola, A., Heikkinen, J., Henttonen, H. M., Hotanen, J.-P., Ihalainen, A., Melin, M., Pitkänen, J., Räty, M., Sirviö, M., and Strandström, M: Forests of Finland 2014–2018 and their development 1921–2018, Silva Fenn., 55, 10662, https://doi.org/10.14214/sf.10662, 2021.
Korkiakoski, M., Ojanen, P., Tuovinen J.-P., Minkkinen, K., Nevalainen, O., Aurela, M., Laurila, T., and Lohila, A.: Partial cutting of boreal nutrient-rich peatland forest causes radically less short-term CO2 emissions than clear-cutting, Agr. Forest Meteorol., 334, 109361, https://doi.org/10.1016/j.agrformet.2023.109361, 2023.
Kätterer, T., Reichstein, M., Andrén, O., and Lomander, A.: Temperature dependence of organic matter decomposition: a critical review using literature data analyzed with different models, Biol. Fertil. Soils, 27, 258–262, 1998.
Laiho, R., Vasander, H., Penttilä, T., and Laine, J.: Dynamics of plant-mediated organic matter and nutrient cycling following water-level drawdown in boreal peatlands, Global Biogeochem. Cy., 17, 1053, https://doi.org/10.1029/2002GB002015, 2003.
Laine, J.: Metsäojitettujen soiden luokittelu (Classification of peatlands drained for forestry), Suo, 40, 37–51, 1989.
Laine, J. K., Vasander, H., Hotanen, J-P., Saarinen, M., and Penttilä, T.: Suotyypit ja turvekankaat – opas kasvupaikkojen tunnistamiseen (in Finnish), Metsäkustannus, Hämeenlinna, 160 pp., ISBN 978-952-5694-89-5, 2012.
Laurén, A., Palviainen, M., Launiainen, S., Leppä, K., Stenberg, L., Urzainki, I., Nieminen, M., Laiho, R., and Hökkä, H.: Drainage and stand growth response in peatland forests – description, testing, and application of mechanistic peatland simulator SUSI, Forests, 12, 293, https://doi.org/10.3390/f12030293, 2021.
Lehtonen, A., Sievänen, R., Mäkelä, A., Mäkipää, R., Korhonen, K. T., and Hokkanen, T.: Potential litterfall of Scots pine branches in southern Finland, Ecol. Modell., 180, 305–315, 2004.
Lehtonen, A. and Heikkinen, J.: Uncertainty of upland soil carbon sink estimate for Finland, Can. J. Forest Res., 46, 310–322, 2016.
Leppä, K., Korkiakoski, M., Nieminen, M., Laiho, R., Hotanen, J.-P., Kieloaho, A.-J., Korpela, L., Laurila, T., Lohila, A., Minkkinen, K., Mäkipää, R., Ojanen, P., Pearson, M., Penttilä, T., Tuovinen, J.-P., and Launiainen, S.: Vegetation controls of water and energy balance of a drained peatland forest: responses to alternative harvesting practices, Agr. Forest Meteorol., 295, 108198, https://doi.org/10.1016/j.agrformet.2020.108198, 2020.
Liski, J., Lehtonen, A., Palosuo, T., Peltoniemi, M., Eggers, T., Muukkonen, P., and Mäkipää, R.: Carbon accumulation in Finland's forests 1922–2004 – an estimate obtained by combination of forest inventory data with modelling of biomass, litter and soil, Ann. Forest Sci., 63, 687–697, https://doi.org/10.1051/forest:2006049, 2006.
Lukac, M.: Fine root turnover, in: Measuring Roots – An Updated Approach, edited by: Mancuso, S., Springer, 363–373, ISBN 9783642220661, 2012.
LUKE Statistics: https://www.luke.fi/en/statistics/total-roundwood-removals-and-drain (last access: 23 August 2023), 2022.
Lupikis, A. and Lazdins, A.: Soil carbon stock changes in transitional mire drained for forestry in Latvia: A case study, Research for Rural Development, 1, 55–61, https://doi.org/10.22616/rrd.23.2017.008, 2017.
Mäkiranta, P., Riutta, T., Penttilä, T., and Minkkinen, K.: Dynamics of net ecosystem CO2 exchange and heterotrophic soil respiration following clearfelling in a drained peatland forest, Agr. Forest Meteorol., 150, 1585–159, 2010.
Marklund, L. G.: Biomass functions for Norway spruce (Picea abies (L.) Karst.) in Sweden, Dissertation, Swedish Agricultural University, Umeå, Report 123, ISBN 9789157632074, 1987.
Marklund, L. G.: Biomass Functions for Pine, Spruce and Birch in Sweden, Swedish Agricultural University, Dept. of Forest Surv., Report, 45–73, 1988.
Meyer, A., Tarvainen, L., Nousratpour, A., Björk, R. G., Ernfors, M., Grelle, A., Kasimir Klemedtsson, Å., Lindroth, A., Räntfors, M., Rütting, T., Wallin, G., Weslien, P., and Klemedtsson, L.: A fertile peatland forest does not constitute a major greenhouse gas sink, Biogeosciences, 10, 7739–7758, https://doi.org/10.5194/bg-10-7739-2013, 2013.
Meyer, N., Welp, G., and Amelung, W.: The temperature sensitivity (Q10) of soil respiration: controlling factors and spatial prediction at regional scale based on environmental soil classes, Global Biogeochem. Cy., 32, 306–323, 2018.
Minkkinen, K., Vasander, H., Jauhiainen, S., Karsisto, M., and Laine, J.: Post-drainage changes in vegetation composition and carbon balance in Lakkasuo mire, Central Finland, Plant Soil, 207, 107–120, 1999.
Minkkinen, K., Korhonen, R., Savolainen, I., and Laine, J.: Carbon balance and radiative forcing of Finnish peatlands 1900–2100 – the impact of forestry drainage, Glob. Change Biol., 8, 785–799, 2002.
Minkkinen, K., Laine, J., Shurpali, N., Mäkiranta, P., Alm, J., and Penttilä, T.: Heterotrophic soil respiration in forestry drained peatlands, Boreal Environ. Res., 12, 115–126, 2007.
Minkkinen, K., Ojanen, P., Penttilä, T., Aurela, M., Laurila, T., Tuovinen, J.-P., and Lohila, A.: Persistent carbon sink at a boreal drained bog forest, Biogeosciences, 15, 3603–3624, https://doi.org/10.5194/bg-15-3603-2018, 2018.
Muukkonen, P. and Lehtonen, A.: Needle and branch biomass turnover rates of Norway spruce (Picea abies), Can. J. Forest Res., 34, 2517–2527, 2004.
Nieminen, M., Sarkkola, S., Sallantaus, T., Hasselquist, E. M., and Laudon, H.: Peatland drainage – a missing link behind increasing TOC concentrations in waters from high latitude forest catchments?, Sci. Total Environ., 774, 145150, https://doi.org/10.1016/j.scitotenv.2021.145150, 2021.
Nykänen, H., Alm, J., Silvola, J., Tolonen, K., and Martikainen, P. J.: Methane fluxes on boreal peatlands of different fertility and the effect of long-term experimental lowering of the water table on flux rates, Global Biogeochem. Cy., 12, 53–69, 1998.
Ojanen, P. and Minkkinen, K. The dependence of net soil CO2 emissions on water table depth in boreal peatlands drained for forestry, Mires and Peat, International Mire Conservation Group and International Peatland Society, 24, Article 27, 1–8, https://doi.org/10.19189/MaP.2019.OMB.StA.1751, 2019.
Ojanen, P., Minkkinen, K., Alm, J., and Penttilä, P.: Soil–atmosphere CO2, CH4 and N2O fluxes in boreal forestry-drained peatlands, Forest Ecol. Manag., 260, 411–421, 2010.
Ojanen, P., Minkkinen, K., Lohila, A., Badorek, T., and Penttilä, T.: Chamber measured soil respiration: a useful tool for estimating the carbon balance of peatland forest soils?, Forest Ecol. Manag., 277, 132–140, https://doi.org/10.1016/j.foreco.2012.04.027, 2012.
Ojanen, P., Minkkinen, K., and Penttilä, P.: The current greenhouse gas impact of forestry-drained boreal peatlands, Forest Ecol. Manag., 289, 201–208, 2013.
Ojanen, P., Lehtonen, A., Heikkinen, J., Penttilä, T., and Minkkinen, K.: Soil CO2 balance and its uncertainty in forestry drained peatlands in Finland, Forest Ecol. Manag., 325, 60–73, 2014.
Petersson, H. and Ståhl, G.: Functions for below-ground biomass of Pinus sylvestris, Picea abies, Betula pendula and Betula pubescens in Sweden, Scand. J. Forest Res., 21, 84–93, https://doi.org/10.1080/14004080500486864, 2006.
Päivänen, J. and Hånell, B.: Peatland ecology and forestry – a sound approach, Helsingin yliopiston metsätieteiden laitoksen julkaisuja, Vol. 3, University of Helsinki, Department of Forest Sciences, 267 pp., ISBN 978-952-10-4531-8, 2012.
R Core Team: R: A language and environment for statistical computing, R Foundation for Statistical Computing, Vienna, Austria, URL https://www.R-project.org (last access: 25 August 2023), 2020.
Repola, J.: Biomass equations for birch in Finland, Silva Fenn., 42, 605–624, https://doi.org/10.14214/sf.236, 2008.
Repola, J.: Biomass equations for Scots pine and Norway spruce in Finland, Silva Fenn., 43, 625–647, https://doi.org/10.14214/sf.184, 2009.
Ruuhijärvi, R.: Über die regionale Einteilung der nordfinnischen Moore, Ann. Botanici Soc.-Vanamo, 31, 1–360, 1960.
Ruyssenaars, P. G., Coenen, P. W. H. G., Zijlema, P. J., Arets, E. J. M. M., Baas, K., Dröge, R., Geilenkirchen, G., 't Hoen, M., Honig, E., van Huet, B., van Huis, E. P., Koch, W. W. R., te Molder, R., Montfoort, J. A., van der Zee, T., and van Zanten, M. C.: Greenhouse gas emissions in the Netherlands 1990–2019, National Inventory Report 2021. National Institute for Public Health and the Environment (RIVM), https://doi.org/10.21945/RIVM-2021-0007, 2021.
Sarkkola, S., Hokka, H., Koivusalo, H., Nieminen, M., Ahti, E., Paivanen, J., and Laine, J.: Role of tree stand evapotranspiration in maintaining satisfactory drainage conditions in drained peatlands, Can. J. Forest Res. 40, 1485–1496, 2010.
Strand, A. E., Pritchard, S. G., McCormack, M. L., Davis, M. A., and Oren, R.: Irreconcilable differences: fine-root life spans and soil carbon persistence, Science, 319, 456–458, https://doi.org/10.1126/science.1151382, 2008.
Silvola, J., Alm, J., Ahlholm, U., Nykänen, H., and Martikainen, P. J.: CO2 fluxes from peat in boreal mires under varying temperature and moisture conditions, J. Ecol., 84, 219–228, 1996.
Simola, H., Pitkänen, A., and Turunen, J.: Carbon loss in drained forestry peatlands in Finland, estimated by re-sampling peatlands surveyed in the 1980s, Eur. J. Soil Sci., 63, 798–807, https://doi.org/10.1111/j.1365-2389.2012.01499.x, 2012.
Starr, M., Saarsalmi, A., Hokkanen, T., Merilä, P., and Helmisaari, H.-S.: Models of litterfall production for Scots pine (Pinus sylvestris L.) in Finland using stand, site and climate factors, Forest Ecol. Manag., 205, 215–225, 2005.
Statistics Finland: Greenhouse gas emissions in Finland 1990 to 2020, National Inventory Report under the UNFCCC and the Kyoto Protocol, Submission to the European Union, https://unfccc.int/documents/461893 (last access: 25 August 2023), 2022.
Straková, P., Penttilä, T., Laine, J., and Laiho, R.: Disentangling direct and indirect effects of water table drawdown on above- and belowground plant litter decomposition: Consequences for accumulation of organic matter in boreal peatlands, Glob. Change Biol., 18, 322–335, https://doi.org/10.1111/j.1365-2486.2011.02503.x, 2012.
Tomppo, E., Heikkinen, J., Henttonen, H. M., Ihalainen, A., Katila, M., Mäkelä, H., Tuomainen, T., and Vaininkainen, N.: Designing and Conducting a Forest Inventory – case: 9th National Forest Inventory of Finland, Springer, Manag. For. Ecosyst., 21, ISBN 9400716516, 2011.
Tuomi, M., Thum, T., Järvinen, H., Fronzek, S., Berg, B., Harmon, M., Trofymow, J. A., Sevanto, S., and Liski, J.: Leaf litter decomposition – Estimates of global variability based on Yasso07 model, Ecol. Modell., 220, 3362–3371, 2009.
Tuomi, M., Laiho, R., Repo, A., and Liski, J.: Wood decomposition model for boreal forests, Ecol. Modell., 222, 709–718, 2011.
Uri, V., Kukumägi, M., Aosaar, J., Varik, M., Becker, H., Morozov, G., and Karoles, K.: Ecosystems carbon budgets of differently aged downy birch stands growing on well-drained peatlands, Forest Ecol. Manag., 399, 82–93, https://doi.org/10.1016/j.foreco.2017.05.023, 2017.
Vávřová, P., Laiho, R., and Penttilä, T.: Decomposition of Scots pine fine woody debris in boreal conditions: Implications for estimating carbon pools and fluxes, Forest Ecol. Manag., 257, 401–412, https://doi.org/10.1016/j.foreco.2008.09.017, 2009.
Venäläinen, A., Tuomenvirta, H., Pirinen, P., and Drebs, A.: A basic Finnish climate data set 1961–2000 – description and illustrations, Finn. Met. Inst., Reports 2005, 1–27, ISBN 951-697-615-8, 2005.