the Creative Commons Attribution 4.0 License.
the Creative Commons Attribution 4.0 License.
 | 27 Jan 2023
Significant nutrient consumption in the dark subsurface layer during a diatom bloom: a case study on Funka Bay, Hokkaido, Japan
Sachi Umezawa
Manami Tozawa
Yuichi Nosaka
Daiki Nomura
Hiroji Onishi
Hiroto Abe
Tetsuya Takatsu
We conducted repetitive observations in Funka Bay, Hokkaido, Japan, on 15 February, 4 and 15 March, and 14 April 2019. The diatom spring bloom peaked on 4 March and started declining on 15 March. Funka Bay winter water remained below 30 m depth, which was below the surface mixed-layer and dark-layer depth (0.1 % of the surface photosynthetically active radiation, PAR, depth) on 4 and 15 March. In the subsurface layer at depths of 30–50 m, concentrations of NO, PO, and Si(OH)4 decreased by half between these dates, even in the dark. Incubation experiments using the diatom Thalassiosira nordenskioeldii showed that this diatom could consume added nutrients in the dark at substantial rates after pre-culturing to deplete nutrients. Incubation experiments using natural seawater collected in the growing phase of the bloom on 8 March 2022 also showed that nutrient-depleted phytoplankton could consume added nutrients in the dark. We excluded three physical process – water mixing, diffusive transport, and subduction – as possible main reasons for the decrease in nutrients in the subsurface layer. We conclude that the nutrient reduction in the subsurface layer (30–50 m) between 4 and 15 March 2019 could be explained by nutrient consumption by diatoms in the dark in that layer.
- Article
(7625 KB) - Full-text XML
-
Supplement
(848 KB) - BibTeX
- EndNote


The supply of nutrients to the euphotic zone has a potent influence on regulating marine primary production. Numerous studies have examined nutrient utilization by marine biota in relation to the nutrient cycles among the euphotic zone and conterminous zones (e.g., below the euphotic zone, atmosphere, and rivers). In the subarctic northern Pacific Ocean, the higher Si : N ratio in the surface of the western gyre (Oyashio region) leads to a diatom-dominant population, and the lower ratio in the eastern gyre leads to a reduced diatom population; both subarctic gyres are known to be high-nitrate–low-chlorophyll (HNLC) regions, where the depletion of dissolved iron (D-Fe) limits primary production (Harrison et al., 2004). D-Fe and nitrate (NO), supplied from below the surface to the surface euphotic zone through winter vertical water mixing, sustain the spring phytoplankton bloom in the Oyashio region (Nishioka et al., 2011). Most previous studies on marine primary production have been concerned with the nutrient consumption by phytoplankton in the euphotic zone because most phytoplankton species, except for dinoflagellates (e.g., Cullen and Horrigan, 1981), are commonly assumed to be incapable of moving actively between the surface mixed layer and below the surface (subsurface layer). However, a few studies have focused on the vertical migration of a diatom, Rhizosolenia, to uptake nutrients in the subsurface layer and grow in the euphotic zone in the oligotrophic subtropical Pacific (Villareal et al., 1996; Richardson et al., 1998; Villareal et al., 1999, 2014). As for the subarctic area, a modeling study that simulated chlorophyll-a (Chl-a) profiles, considering phytoplankton's migration behavior, demonstrated that vertically migrating phytoplankton can pump up a considerable amount of nutrients to the surface layer from the dark subsurface layer and, thus, contribute 7 % of net primary production at the subarctic gyre of the western Pacific Oyashio region (Witz and Lan Smith, 2020). These previous studies have not yet shown observational evidence of nutrient reduction associated with consumption by phytoplankton in the dark subsurface layer; however, nutrient reduction in the dark subsurface layer has been found in the Funka Bay, Hokkaido, Japan (Kudo and Matsunaga, 1999), which faces to the Oyashio–Kuroshio transitional area in the western North Pacific.
Oyashio water reaches the area off the coast of Hokkaido, Japan, where the subtropical water derived from Kuroshio or the Tsugaru warm current water is also found (Rosa et al., 2007). A small portion of Oyashio water enters Funka Bay in early spring. The bay water exchanges twice a year: with cold Oyashio water in early spring and with Tsugaru warm water in early fall (Ohtani, 1971). The Oyashio water, a cold and low-salinity water, flows into the bay along the northern coast of the bay, forming an anticlockwise flow from late March to the middle of April (Nakada et al., 2013). From repetitive observations in the bay, it is possible to collect seawater samples originating from the same water mass at different times (when the water remains in the bay during the observation period) and then examine the temporal changes in the biogeochemical parameters within the same water mass. For example, temporal changes in nutrients (Kudo and Matsunaga, 1999; Kudo et al., 2000), D-Fe (Hioki et al., 2015), volatile organic iodine (Shimizu et al., 2017), and isoprene (Ooki et al., 2019, 2022) have been examined in relation to primary production in the bay.
In Funka Bay, the diatom bloom begins in late winter (February) before Oyashio water flows into the bay (Kudo and Matsunaga, 1999). A massive spring bloom dominated by diatom species then occurs in March every year (Odate, 1987; Maita and Odate, 1988) when Oyashio water flows into the bay. The bloom lasts until late March or early April when Oyashio water occupies the surface of the bay (Kudo and Matsunaga, 1999). The spring diatom bloom ends due to nitrate depletion, but silicate is further consumed after the nitrate is depleted (Kudo et al., 2000). After the bloom, phosphorus depletion in the bay occasionally limits primary production (Yoshimura and Kudo, 2011). D-Fe is not depleted (>3 nmol L−1) in the surface waters of the bay in April (post-bloom) (Hioki et al., 2015); therefore, D-Fe would not limit primary production. One-third of annual primary production occurs during the spring bloom (Kudo and Matsunaga, 1999; Kudo et al., 2015); thus, the depletion of macronutrients (e.g., N, P, and Si) is the dominant limiting factor for production in the bay. After the bloom, there is extensive settling and sedimentation of particulate organic matter on the seafloor (Miyake et al., 1998), and nutrient regeneration rapidly occurs in the bottom water just after sedimentation (Kudo et al., 2007).
Although most previous studies in Funka Bay have focused on nutrient consumption in the euphotic zone and nutrient regeneration in the bottom water, Kudo and Matsunaga (1999) pointed out that NO concentrations in the dark subsurface layer decreased during the spring blooms in 1991 based on their observations from 1988 to 1992, and they mentioned that the decrease was due to the dilution of water by vertical mixing. In figures showing a time–depth section of the NO concentration in Kudo and Matsunaga (1999), it seems that decreases in NO below the surface occurred during the bloom in all years. This raises the questions as to why the nutrient reduction in the dark subsurface layer occurs so frequently and if it can be attributed to vertical mixing every year, as the surface layer in the bay usually rapidly becomes stratified in spring.
In this paper, we examine the temporal variation in nutrient concentrations in Funka Bay from the early phase of the diatom bloom (February) to the post-bloom period (April) via repetitive observations in 2019. Moreover, we focus on the processes affecting nutrient reduction in the dark subsurface layer during the bloom to show evidence of nutrient consumption by diatoms in the dark.
2.1 Shipboard observations
Shipboard observations were conducted in Funka Bay, Hokkaido, Japan, on 15 February, 4 and 15 March, and 14 April 2019. We used the training ship (T/S) Ushio-maru, operated by the Faculty of Fisheries Sciences, Hokkaido University. Water samples were collected at station 30 (St. 30; 42∘16.2′ N, 140∘36.0′ E; bottom depth of 96 m) located in the center of Funka Bay (Fig. 1b). Seawater samples were collected in 2.5 L Niskin bottles attached to a rosette multi-sampler along with a conductivity–temperature–depth (CTD) probe (SBE 19plus, Sea-Bird Electronics, Inc.). Surface water was collected with a plastic bucket, and bottom water was collected approximately 1 m above the seafloor using a Van Dorn sampling bottle. The sampling depths were 0, 5, 10, 20, 30, 40, 50, 60, 65, 70, 75, 80, 85, and 95 m (and 1 m above the seafloor).
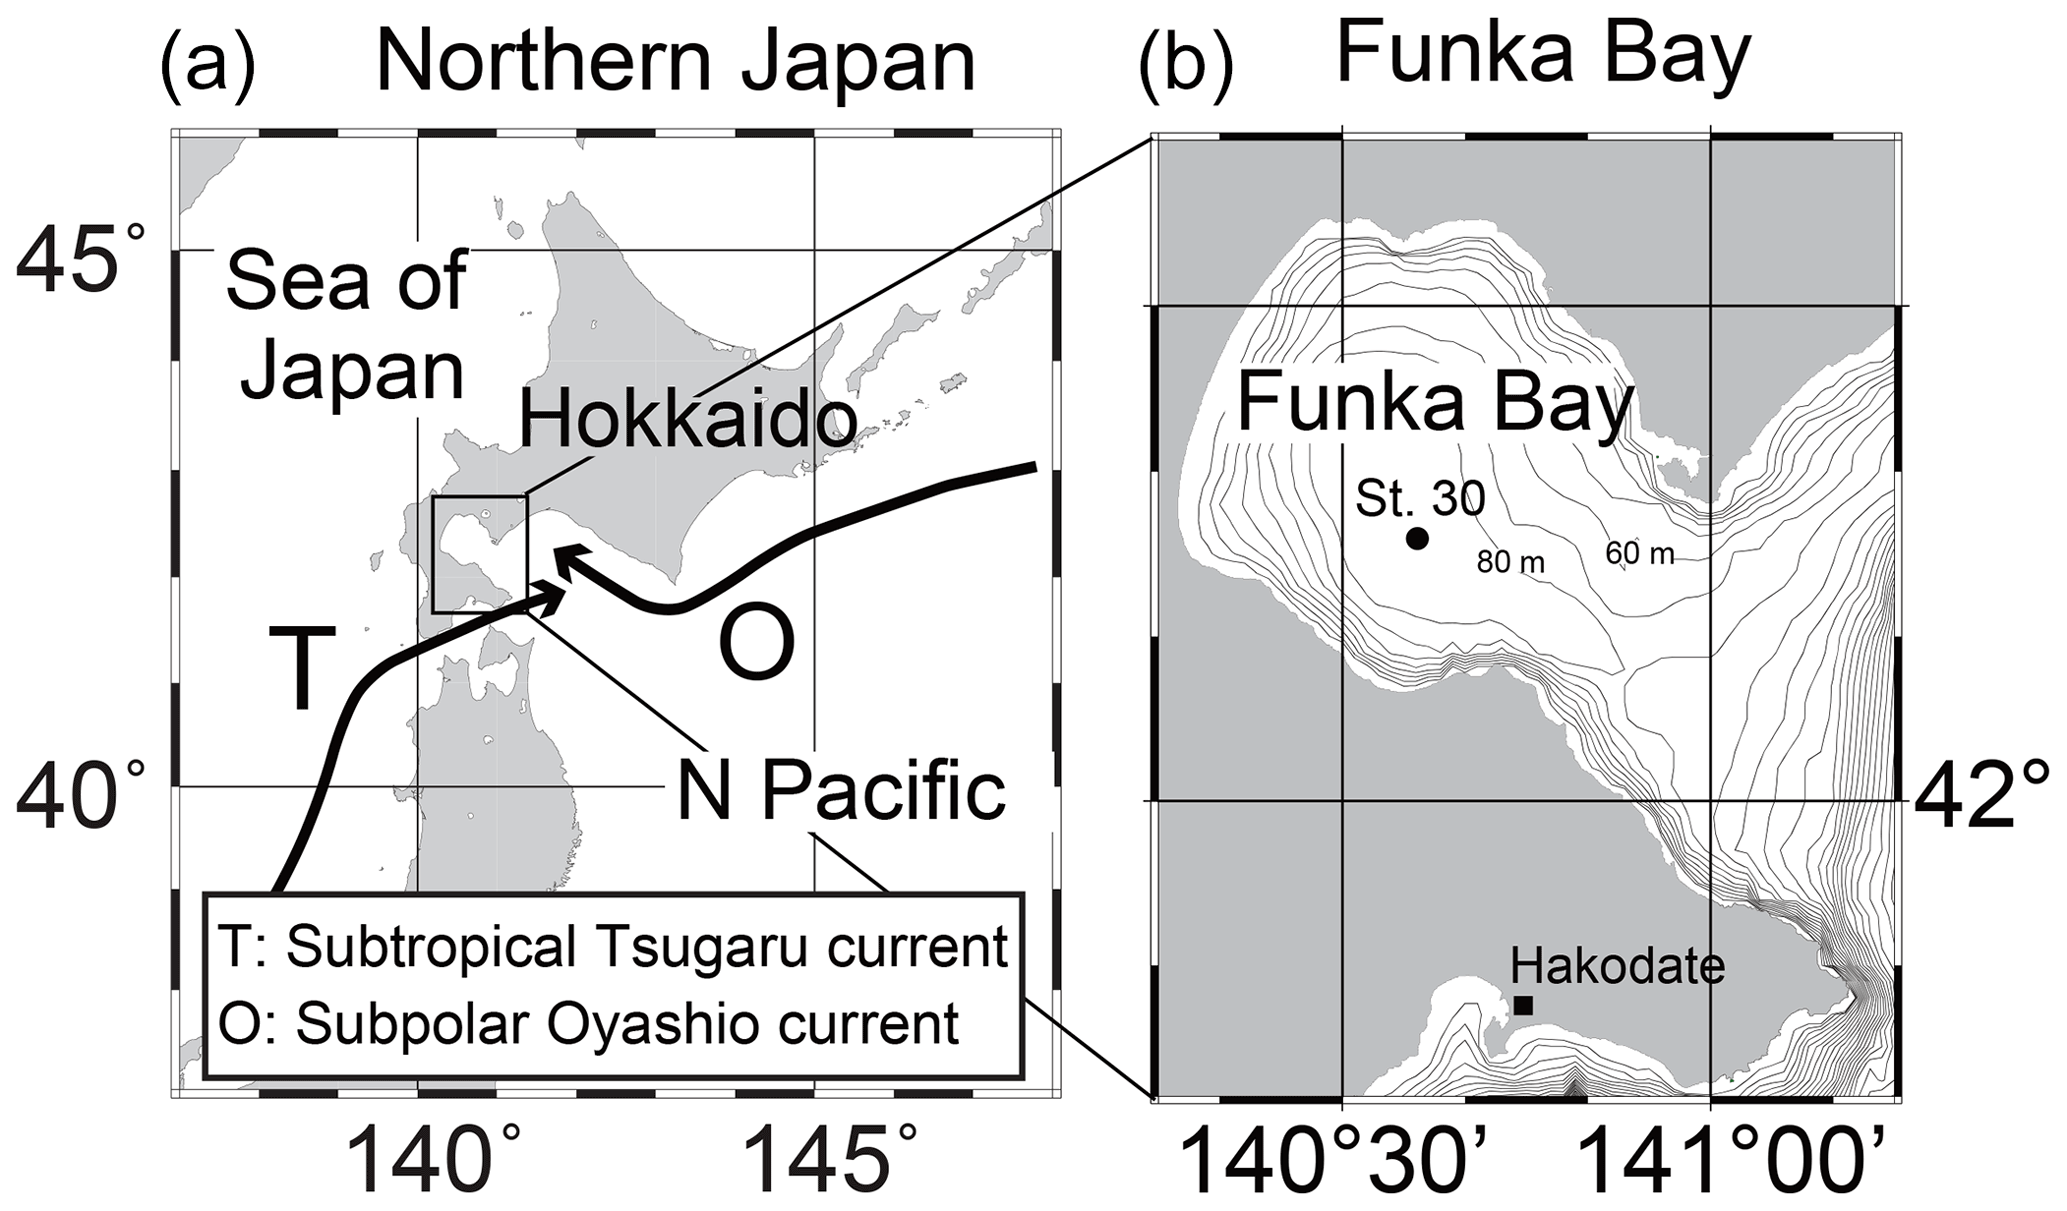
Figure 1Sampling sites in Funka Bay, Hokkaido, Japan.
2.2 Analytical procedures
Chl-a concentrations in discrete seawater samples (100 mL) were measured using the fluorometric Welschmeyer method (Welschmeyer, 1994) and a fluorometer (Turner Designs, model 10-AU-005). Concentrations of nutrients (NO, NO, NH, Si(OH)4, and PO) in discrete seawater samples were measured by colorimetric methods using a QuAAtro system (SEAL Analytical). The analytical precision was 0.12 % for NO, 0.21 % for NO, 0.19 % for PO, 0.11 % for Si(OH)4, and 0.34 % for NH, as determined by repetitive measurement (n=7) of reference seawater for nutrient standards (KANSO, standard Lot BZ, Osaka, Japan). Dissolved oxygen was determined by Winkler titration using a 798 MPT Titrino analyzer (Metrohm, Herisau, Switzerland). Apparent oxygen utilization (AOU) was calculated by subtracting the measured oxygen concentration from the dissolved oxygen concentration at saturation under in situ temperature and salinity conditions (Hansen, 1999).
2.3 Incubation experiments to test for nutrient consumption by diatoms in the dark
We conducted dark-incubation experiments four times using the diatom Thalassiosira nordenskioeldii, which is predominant in the early phase of the spring bloom in Funka Bay (Ban et al., 2000), and twice using natural seawater collected during the diatom bloom in 2022.
2.3.1 Thalassiosira nordenskioeldii incubation experiment
Thalassiosira nordenskioeldii was isolated from natural seawater collected in the western subarctic Pacific Ocean in May 2019. In the first and second Thalassiosira experiments, an axenic culture of the diatom was grown in modified medium (NO, 700 µmol L−1; PO, 26 µmol L−1; and Si(OH)4, 75 µmol L−1) at 6 ∘C (pre-culture). We used a 250 mL cell-cultivation flask with a vent cap (VTC-F75V, VIOLAMO). Incubation procedures were carried out under axenic conditions; however, we did not check for contamination after the incubation. When the Chl-a concentration in the pre-culture medium reached 1426 µg L−1 on Day 17 of pre-culturing for the first experiment, the concentrations of NO, PO, and Si(OH)4 in the medium had dropped below 0.05, 0.05, and 1 µmol L−1, respectively. We regarded the diatoms in the medium on Day 17 as being nutrient depleted. We added nutrients (stock medium) to the nutrient-depleted diatom culture, after which the concentrations were as follows: NO, 29.2 µmol L−1; PO, 1.13 µmol L−1; and Si(OH)4, 4.24 µmol L−1. The incubation bottle (n=1) was put in a dark incubator at 6 ∘C for 6 d. On days 0, 2, 3, 4, and 6 of dark incubation, 10 mL and 100 µL of incubation medium were filtered to measure nutrient and Chl-a concentrations, respectively, using the same methods as for the measurements in seawater samples. The setup conditions of the experiments are summarized in Table 1.
Table 1The setup conditions of dark-incubation experiments. Dark incubations using Thalassiosira nordenskioeldii were carried out four times. The diatom cultures were grown under lit conditions (pre-culture) before they were put in the dark with nutrient addition. Natural seawater incubations were carried out using seawater collected at station 30 in Funka Bay on 8 March 2022.
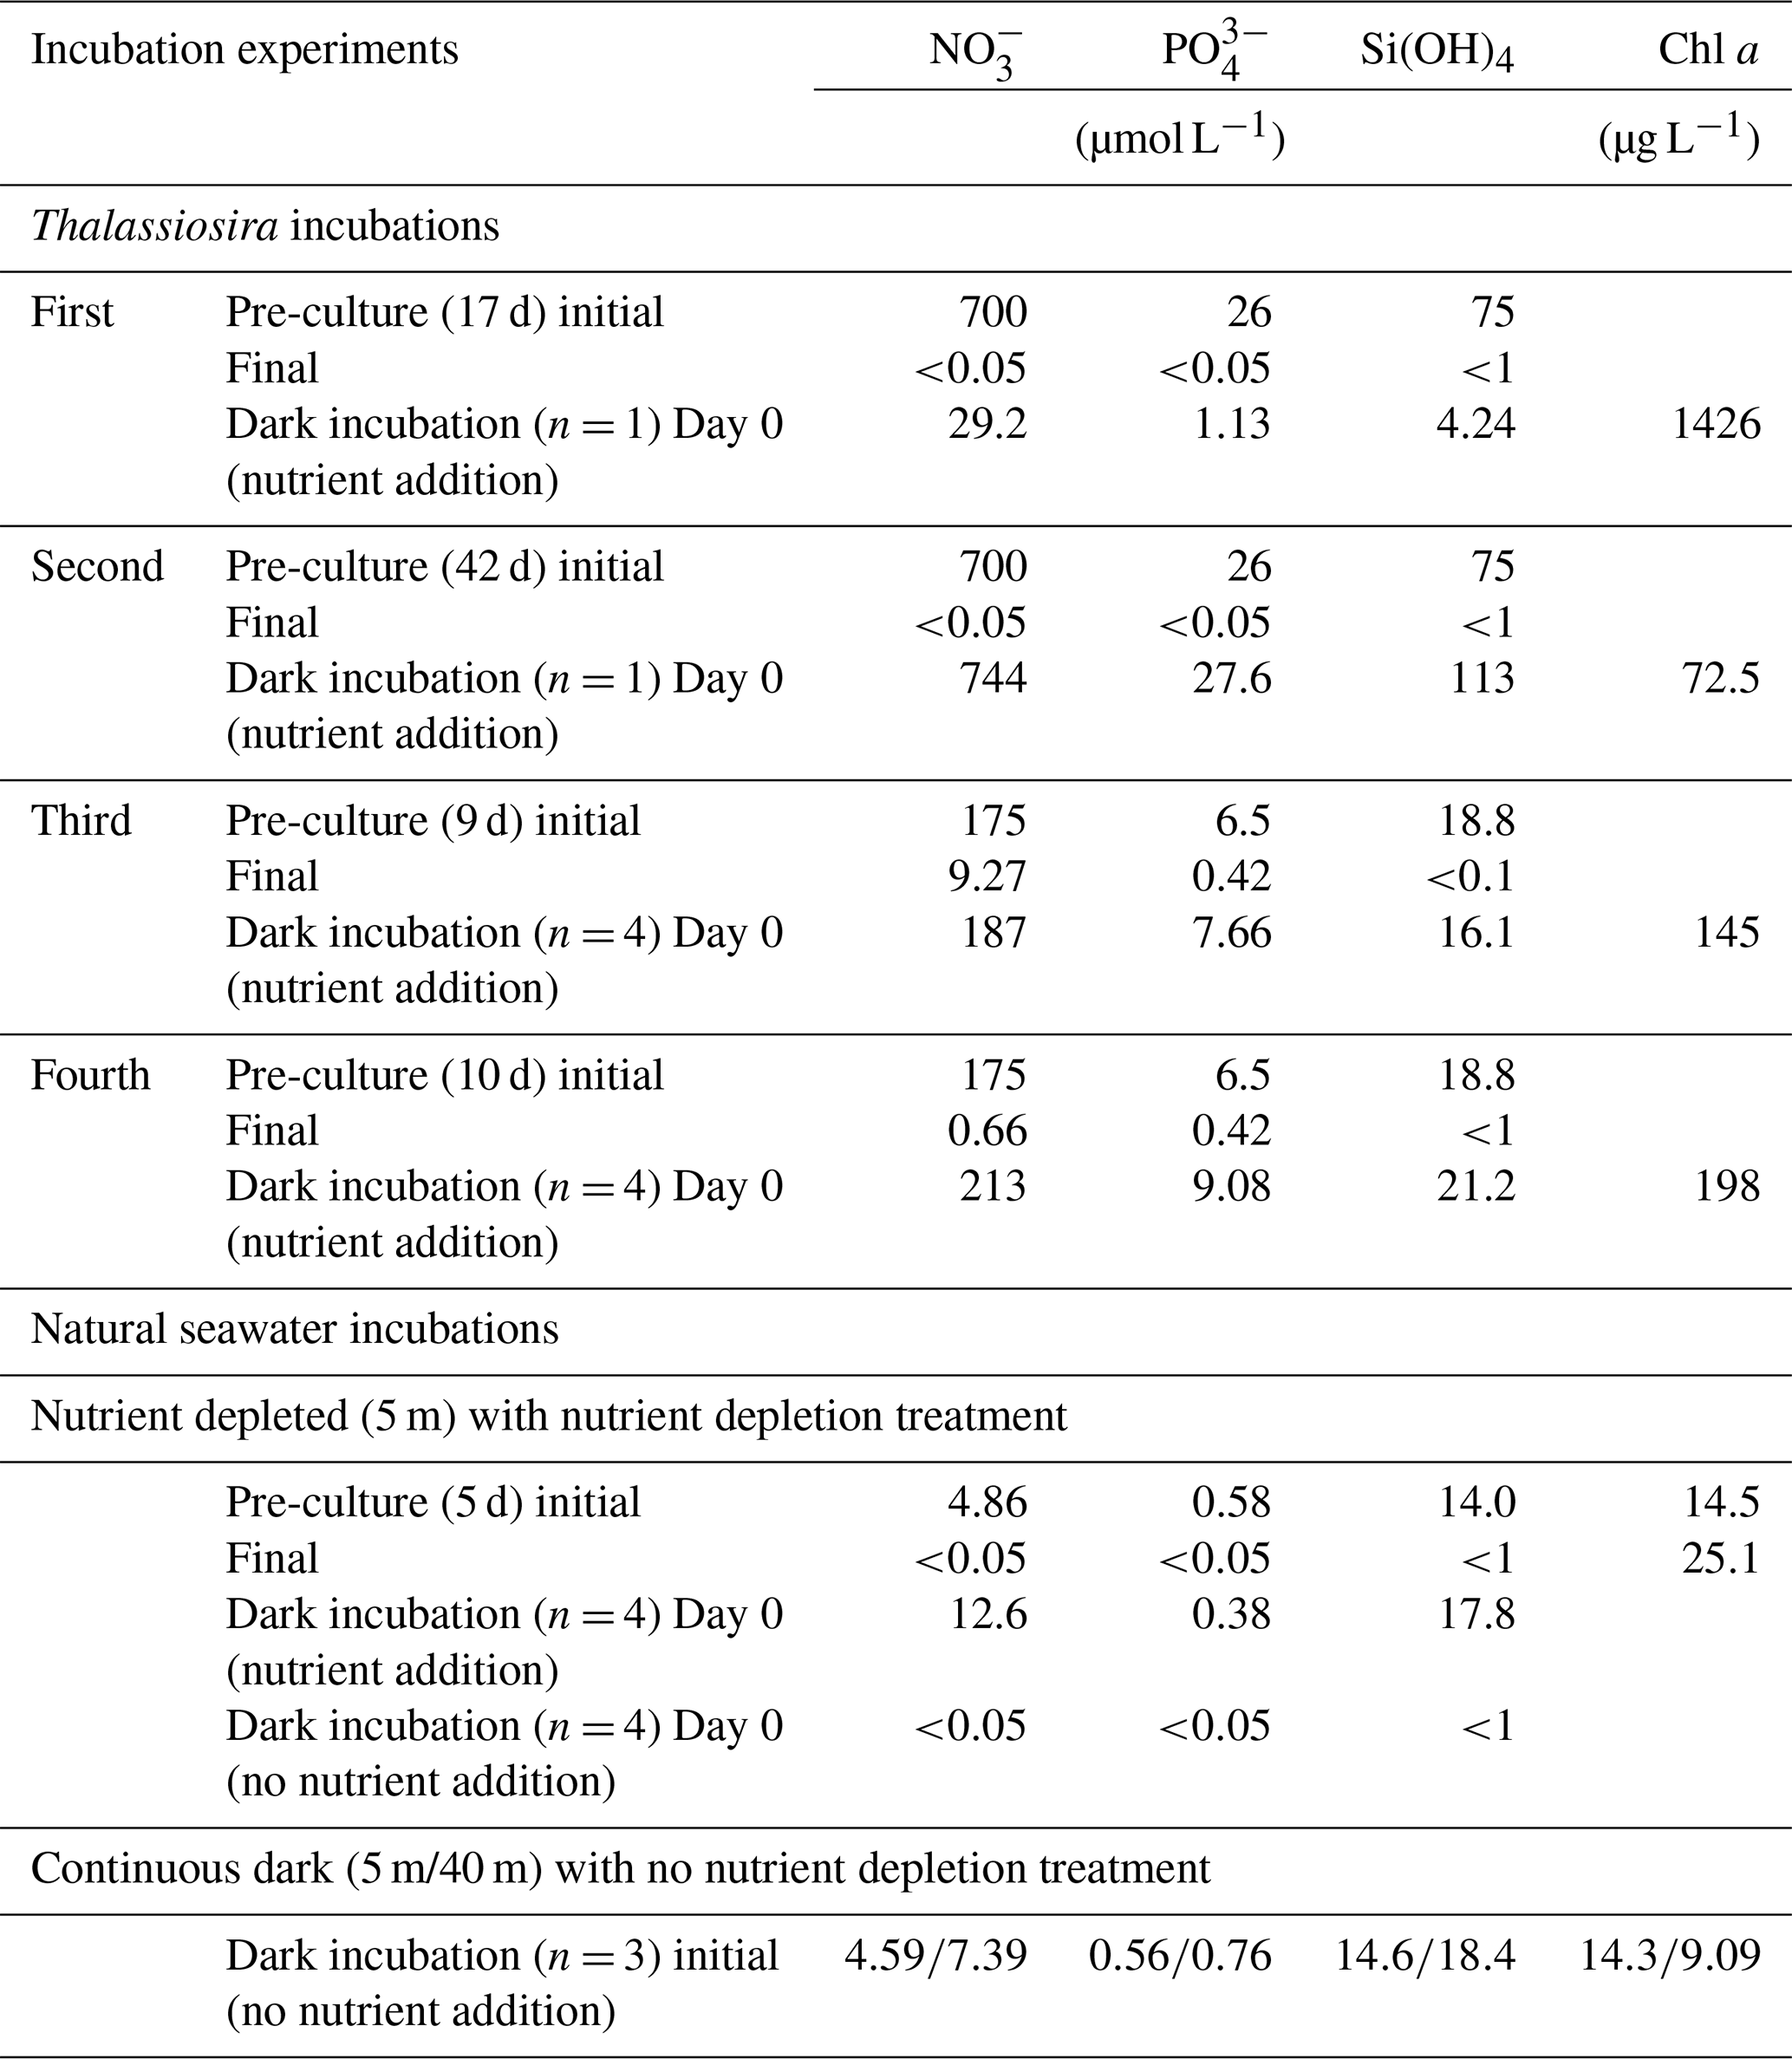
In the second Thalassiosira experiment, another Thalassiosira nordenskioeldii diatom culture that had grown for 42 d was utilized. The Chl-a concentration in the pre-cultured medium for the second experiment was only 72.5 µg L−1, which was 1/20 of that in the first dark incubation, implying that it was in a declining phase. We set the initial concentrations of nutrients (NO, 744 µmol L−1; PO, 27.6 µmol L−1; and Si(OH)4, 113 µmol L−1) at 25 times those of the first experiment and put it in the dark incubator. On days 0, 1, 2, and 10, total volumes of 10 and 1 mL of incubation medium (n=1) were filtered to measure nutrient and Chl-a concentrations, respectively.
In the third and fourth Thalassiosira experiments, 40 mL of diatom culture was divided into two pre-culturing incubation bottles with 170 mL of modified medium (NO, 175 µmol L−1; PO, 6.5 µmol L−1; Si(OH)4, 18.8 µmol L−1). For the third Thalassiosira experiment, the pre-culturing was done for 10 d; the concentration of Chl a in the pre-cultured medium became 145 µg L−1, and the concentrations of NO, PO, and Si(OH)4 dropped as follows: NO, 9.27 µmol L−1; PO, 0.42 µmol L−1; and Si(OH)4, <1 µmol L−1. Relatively high concentrations of NO and PO remained in the medium. For the fourth Thalassiosira experiment, the pre-culturing was done for 11 d; the concentration of Chl a in the pre-cultured medium became 198 µg L−1, and the concentrations of NO, PO, and Si(OH)4 dropped as follows: NO, 0.66 µmol L−1; PO, 0.42 µmol L−1; and Si(OH)4, <1 µmol L−1. Nutrients were rapidly being consumed at the end of the pre-culturing on Day 10 of the third experiment. We added nutrients (stock medium) to the pre-cultured mediums, after which the concentrations (Day 0 of dark incubations) were as follows for the third experiment: NO, 187 µmol L−1; PO, 7.66 µmol L−1; and Si(OH)4, 16.1 µmol L−1. The corresponding concentrations for the fourth experiment were as follows: NO, 213 µmol L−1; PO, 9.08 µmol L−1; and Si(OH)4, 21.2 µmol L−1. The 30 mL of each pre-cultured medium was used for Chl-a and nutrient measurements. The remaining 160 mL of each pre-cultured medium was divided into four cell-cultivation flasks, and they were put in the dark at 6 ∘C. On days 1, 2, and 3, total volumes of 8 and 1 mL of incubation medium (n=4) were filtered to measure nutrient and Chl-a concentrations, respectively.
2.3.2 Natural seawater incubation experiment
For the natural seawater incubation experiment, we collected seawater at 5 and 40 m depths at station 30 in Funka Bay on 8 March 2022. Fourteen 200 mL seawater samples were collected in cell-cultivation flasks (11 flasks for 5 m depth water and 3 flasks for 40 m depth water), and they were stored in a refrigerator for a day until the culture experiment treatment. The concentrations of Chl a at the 5 and 40 m depths were 14.3 and 9.09 µg L−1, respectively. Three flasks of water from both depths were put into a dark incubator at 5 ∘C for 12 d without nutrient addition (continuous dark (5 m/40 m) in Table 1) as a control. Another eight flasks of 5 m depth water were pre-cultured under lit conditions (100 µmol photon s−1, light : dark = 12 h : 12 h) for 5 d at 5 ∘C to deplete nutrients (nutrient depleted (5 m) in Table 1); the concentration of Chl a in the pre-cultured medium became 25.1 µg L−1, and the concentrations of NO, PO, and Si(OH)4 dropped as follows: NO, <0.05 µmol L−1; PO, <0.05 µmol L−1; Si(OH)4, <1 µmol L−1. Nutrients were then added to the four flasks containing the nutrient-depleted pre-cultured 5 m water, after which the concentrations (Day 0) were as follows: NO, 12.6 µmol L−1; PO, 0.38 µmol L−1; and Si(OH)4, 17.8 µmol L−1. No nutrients were added to the other four (of the eight) flasks containing nutrient-depleted pre-cultured seawater. These eight pre-cultured incubation bottles (four bottles with nutrient addition and four without) were put into a dark incubator at 5 ∘C for 7 d. On days 0 and 7 of the dark incubations, total volumes of 8 and 10 mL of incubation medium were filtered to measure nutrient and Chl-a concentrations, respectively.
2.4 Water-mass types and mixed-layer, euphotic-zone, and dark-layer depths
There are two main water masses in Funka Bay throughout the year: Tsugaru water, which originates from the subtropical North Pacific, and Oyashio water, which originates from the subarctic North Pacific. The subtropical Tsugaru water has a higher salinity (33.6–34.2) and is modified into winter water (W) by winter cooling. The subarctic Oyashio water has a lower salinity (32.6–33.0) and is modified into low-density summer water (S) by solar radiative heating and freshwater input. These four water masses were first described by Ohtani and Kido (1980). Ooki et al. (2019) added the transitional waters to the water-mass classification: the transition from winter water to Oyashio water (WO), from Oyashio water to summer water (OS), from summer water to Tsugaru water (ST), and from Tsugaru water to winter water (TW). The temperature–salinity ranges of these water masses are illustrated in the Supplement (Fig. S1).
The surface mixed layer was defined as the layer in which density differences (Δσ) were within 0.125 kg m−3 relative to the density at 5 m depth. The threshold Δσ=0.125 kg m−3 is often used for the monthly mean of the mixed layer in oceanic climate studies (Spall, 1991), whereas the threshold Δσ=0.01 kg m−3 is used for snapshot observations (Thomson and Fine, 2003). We used the maximum threshold Δσ=0.125 kg m−3 to ensure that the subsurface layer water did not mix with the surface layer during intervals (11 d to a month) between our observations. The euphotic-zone depth was defined as the depth at which photosynthetically active radiation (PAR) was 1 % of the surface PAR, i.e., where photosynthesis equals respiration (Marra, 2014). We defined the dark-layer depth as the depth at which PAR was 0.1 % of the surface PAR, i.e., where amount of photosynthesis is approximately 1/10 of that at the 1 % PAR level, considering the light intensity only as a limiting factor of photosynthesis.
2.5 Spatial distributions of temperature, salinity, and density at the sea surface
Spatial distributions of temperature, salinity, and density at the sea surface (1 m) were obtained from an ocean reanalysis product provided by Meteorological Research Institute in Japan. This product is produced using an operational system for monitoring and forecasting the status of coastal and open-ocean waters around Japan (the JPN system; Hirose et al., 2020). The JPN system includes a double-nested ocean model, the core of which is a Japanese coastal model with a horizontal resolution of 2 km. Three sub-models are interconnected using a nesting technique: a global model (horizontal resolution ∼ 100 km), a North Pacific model (horizontal resolution ∼ 10 km), and Japanese coastal model (horizontal resolution ∼ 2 km). A four-dimensional variational method is applied to the North Pacific model as the assimilation scheme. The processes of tides and river runoff are taken into consideration in this JPN system. The reader is referred to Hirose et al. (2020) for more detail.
3.1 Hydrographic features
Vertical distributions of temperature, salinity, density, and the ratio of PAR relative to the surface PAR from 15 February to 15 March are shown in Fig. 2a–d. An overview of the temporal variation in the water-mass structure is shown in Fig. 3. Temperature, salinity, and density were all vertically uniform on 15 February (Fig. 2a, b, c), during which time the water mass was categorized as winter water (Fig. 3). On 15 February, the temperature was the highest (4 ∘C) during the observation period. We classified this period as high-temperature winter water. On 4 March, the temperature dropped below 3.7 ∘C throughout the water column. We found significant decreases in salinity and density at the surface (0–20 m depth). The influence of Oyashio water (WO or O) was evident at the surface (0–7 m) on 4 March, it then extended to the deeper layer (0–24 m) by 15 March and to 0–52 m on 14 April. In the deep layer (below 70 m depth), the temperature increased to 3.9 ∘C on 15 March. We classified this as high-temperature winter water, and this water probably remained in the back of the bay and moved to the deep layer of the observation station on 15 March. Moreover, we considered that the middle layer (subsurface layer, 30–50 m) was relatively stable between 4 and 15 March compared with the surface and deep layers where the waters were obviously exchanged.
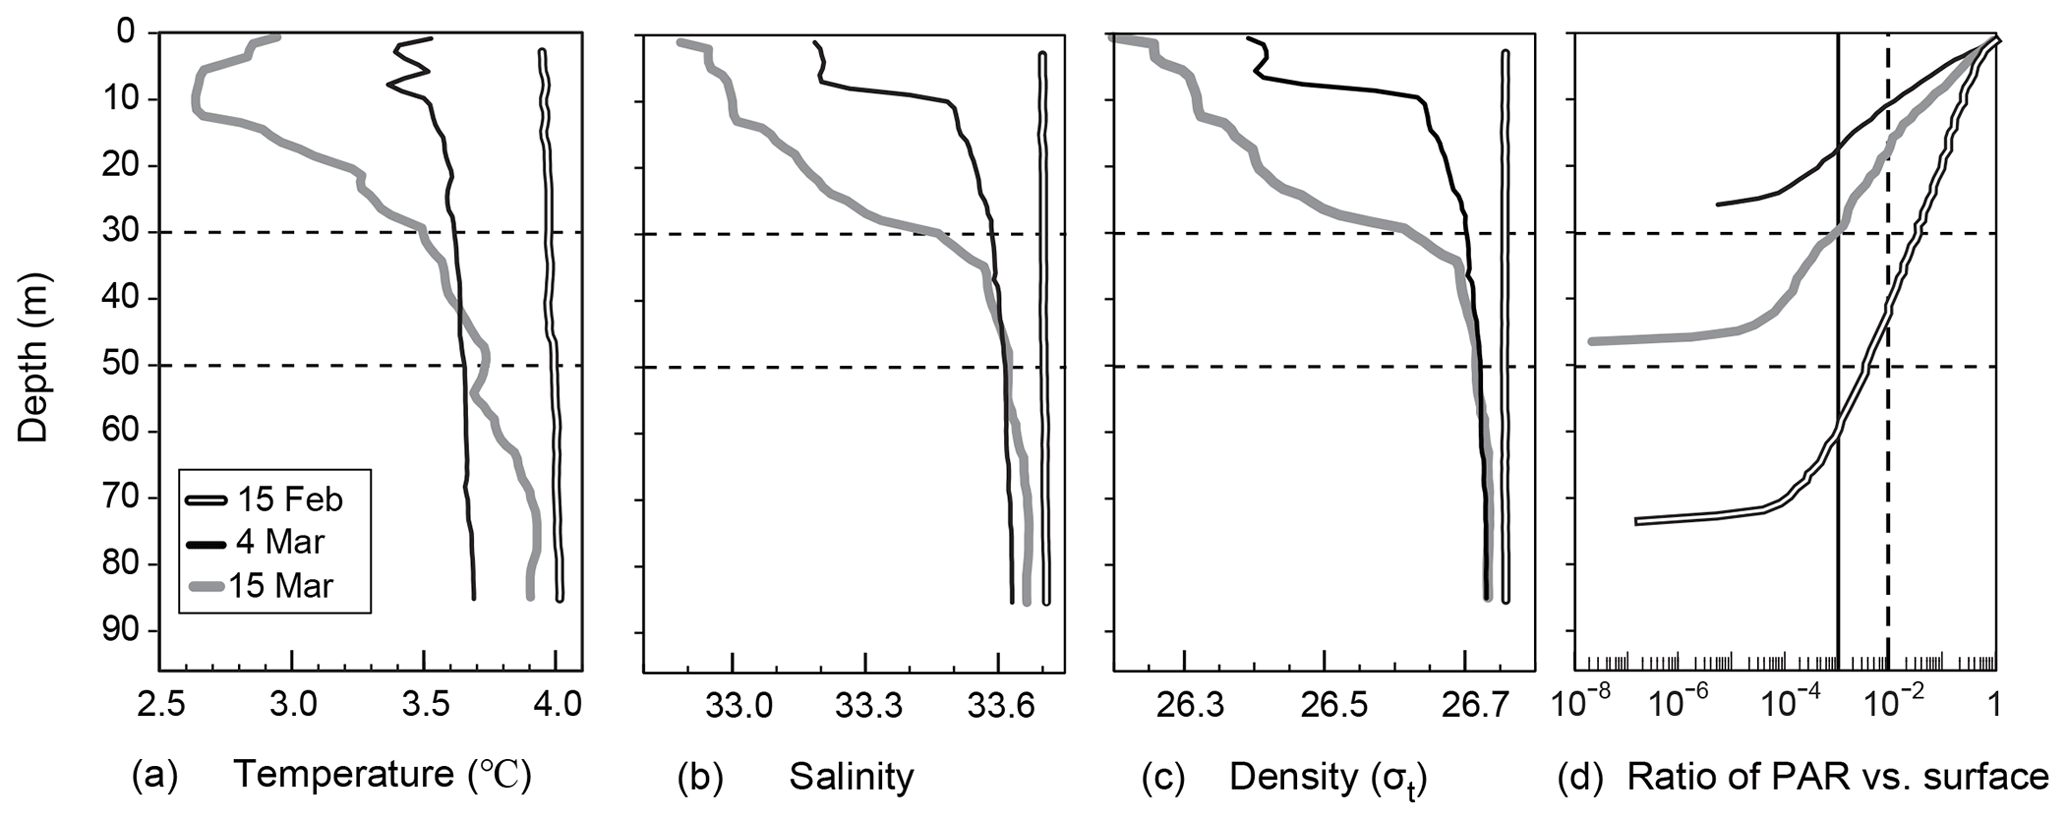
Figure 2Vertical profiles of (a) temperature, (a) salinity, (c) density, and (d) the ratio of PAR to surface PAR at station 30 in Funka Bay, Japan, on 15 February, 4 March, and 15 March. Broken and solid vertical lines in Fig. 2d indicate the PAR ratio at the euphotic-zone depth (1 % PAR vs. surface) and the dark-layer depth (0.1 % PAR vs. surface), respectively.
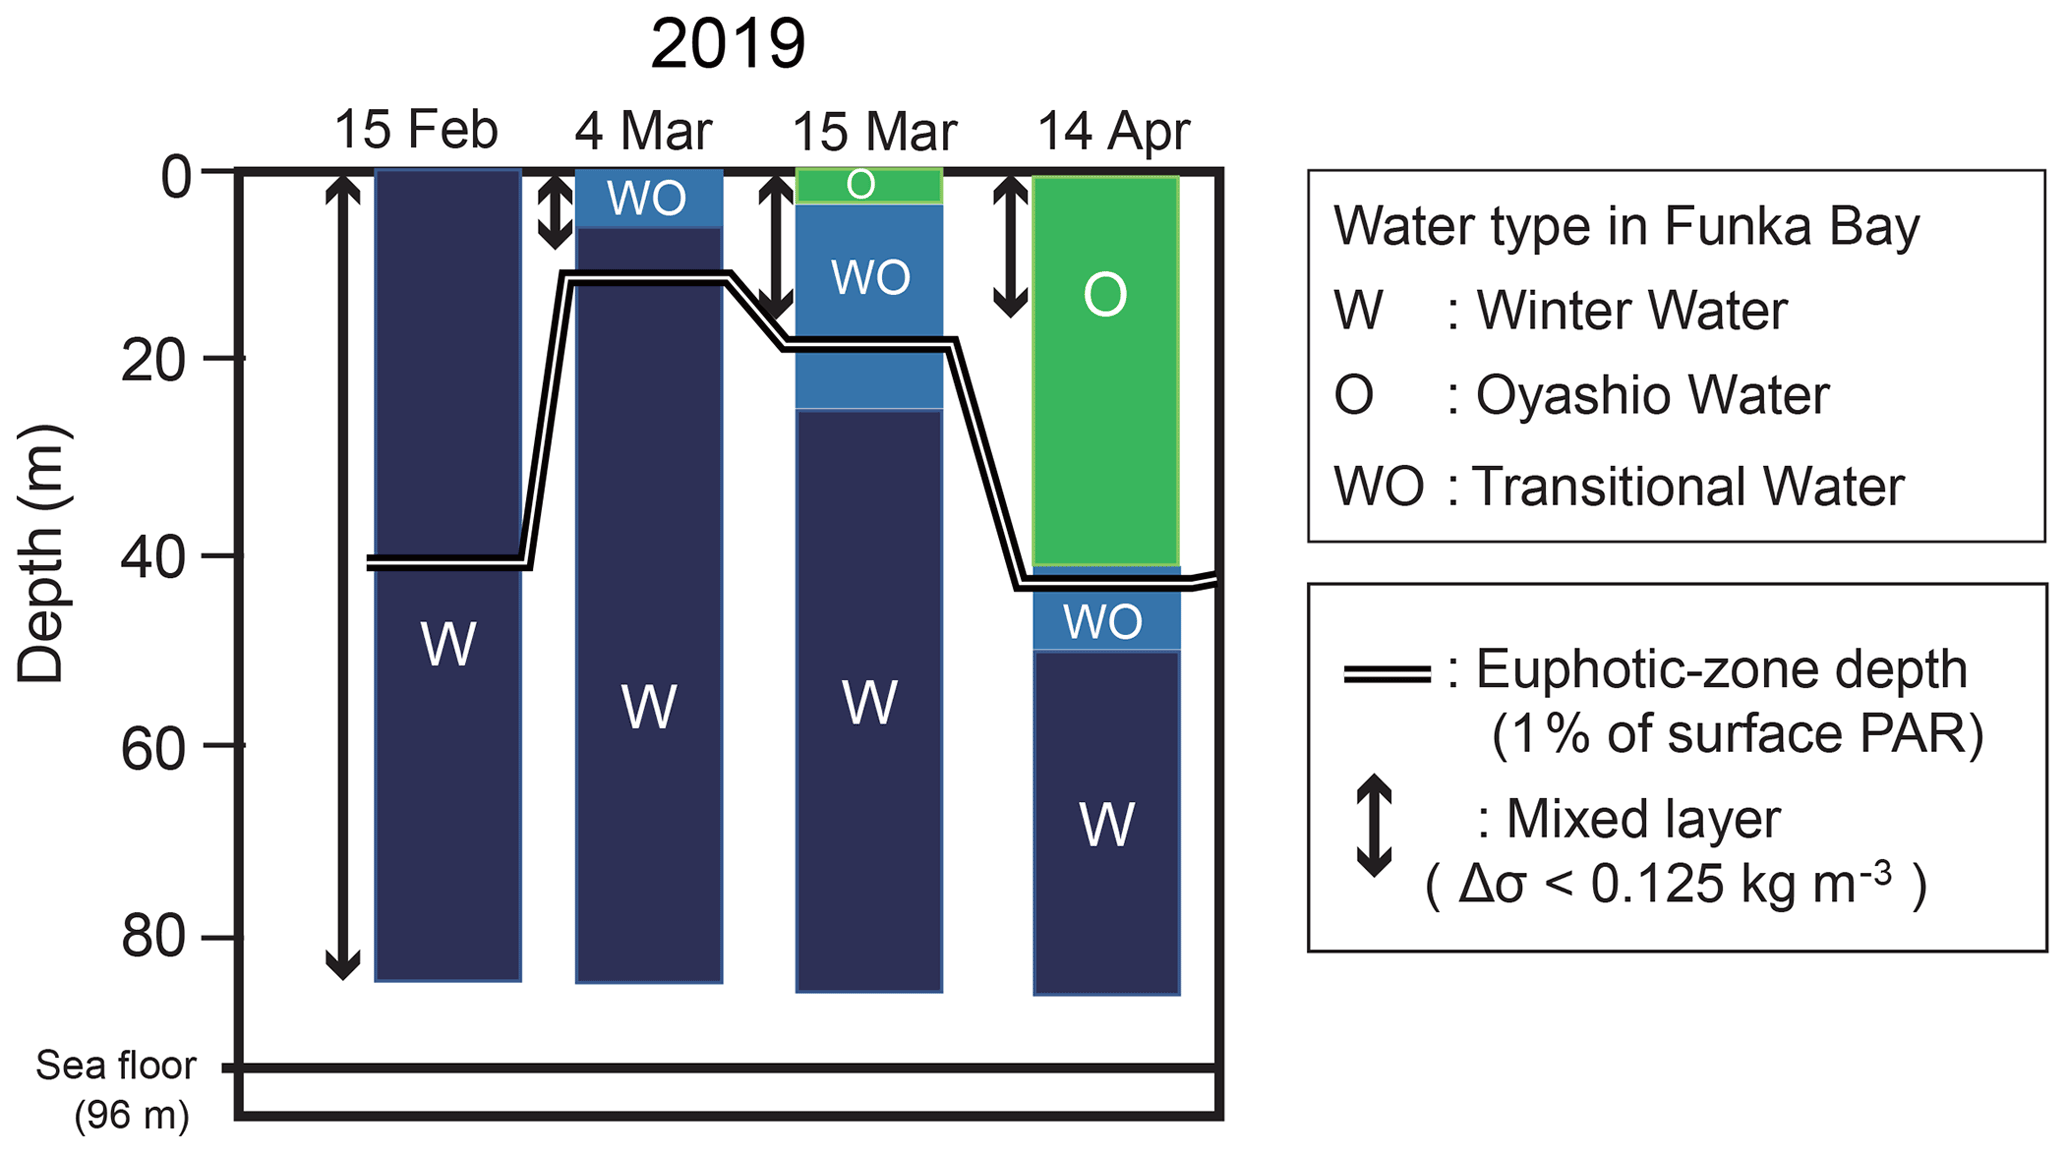
Figure 3Temporal change in the water-mass structure at station 30 in Funka Bay, Japan. The two main water masses are winter water (W) and Oyashio water (O). Transitional water (WO) is water changing from winter water to Oyashio water by mixing. The euphotic-zone depth and the surface mixed-layer depth (MLD) are also shown. The euphotic-zone depth was defined as the depth at which photosynthetically active radiation (PAR) was 1 % of the surface PAR. The MLD was defined as the layer in which density differences (Δσ) were within 0.125 kg m−3 relative to the density at 5 m depth.
As for the light environment, the euphotic-zone depth (or compensation depth), which was defined as the depth at which PAR was 1 % of the surface PAR, was 40 m on 15 February, 11 m on 4 March, and 17 m on 15 March. The dark-layer depth, which was defined as the depth at which PAR was 0.1 % of surface PAR, was 60 m on 15 February, 17 m on 4 March, and 30 m on 15 March (Fig. 2d). The daily average of surface PAR during the period between 4 and 15 March including day and night was 19.3 mol photon m−2 d−1 (224 µmol photon m−2 s−1), which was estimated from the global solar radiation at the Muroran meteorological observatory (Fig. S2). The daily average PAR at the dark-layer depth was estimated to be 0.0193 mol photon m−2 d−1, which was only 1.8 % of global average of compensation irradiance (1.1 mol photon m−2 d−1) for metabolic balance: photosynthesis equals respiration (Regaudie-De-Gioux and Duarte, 2010) Below the dark-layer depths, we assumed that photosynthesis made no difference to the biochemical parameters described in latter sections.
3.2 Biogeochemical parameters
We prepared time–depth sections of biogeochemical parameters, showing the surface mixed-layer, euphotic-zone, and dark-layer depths (Fig. 4a–f). Vertical profiles of the parameters are also shown in Fig. 5a–f.
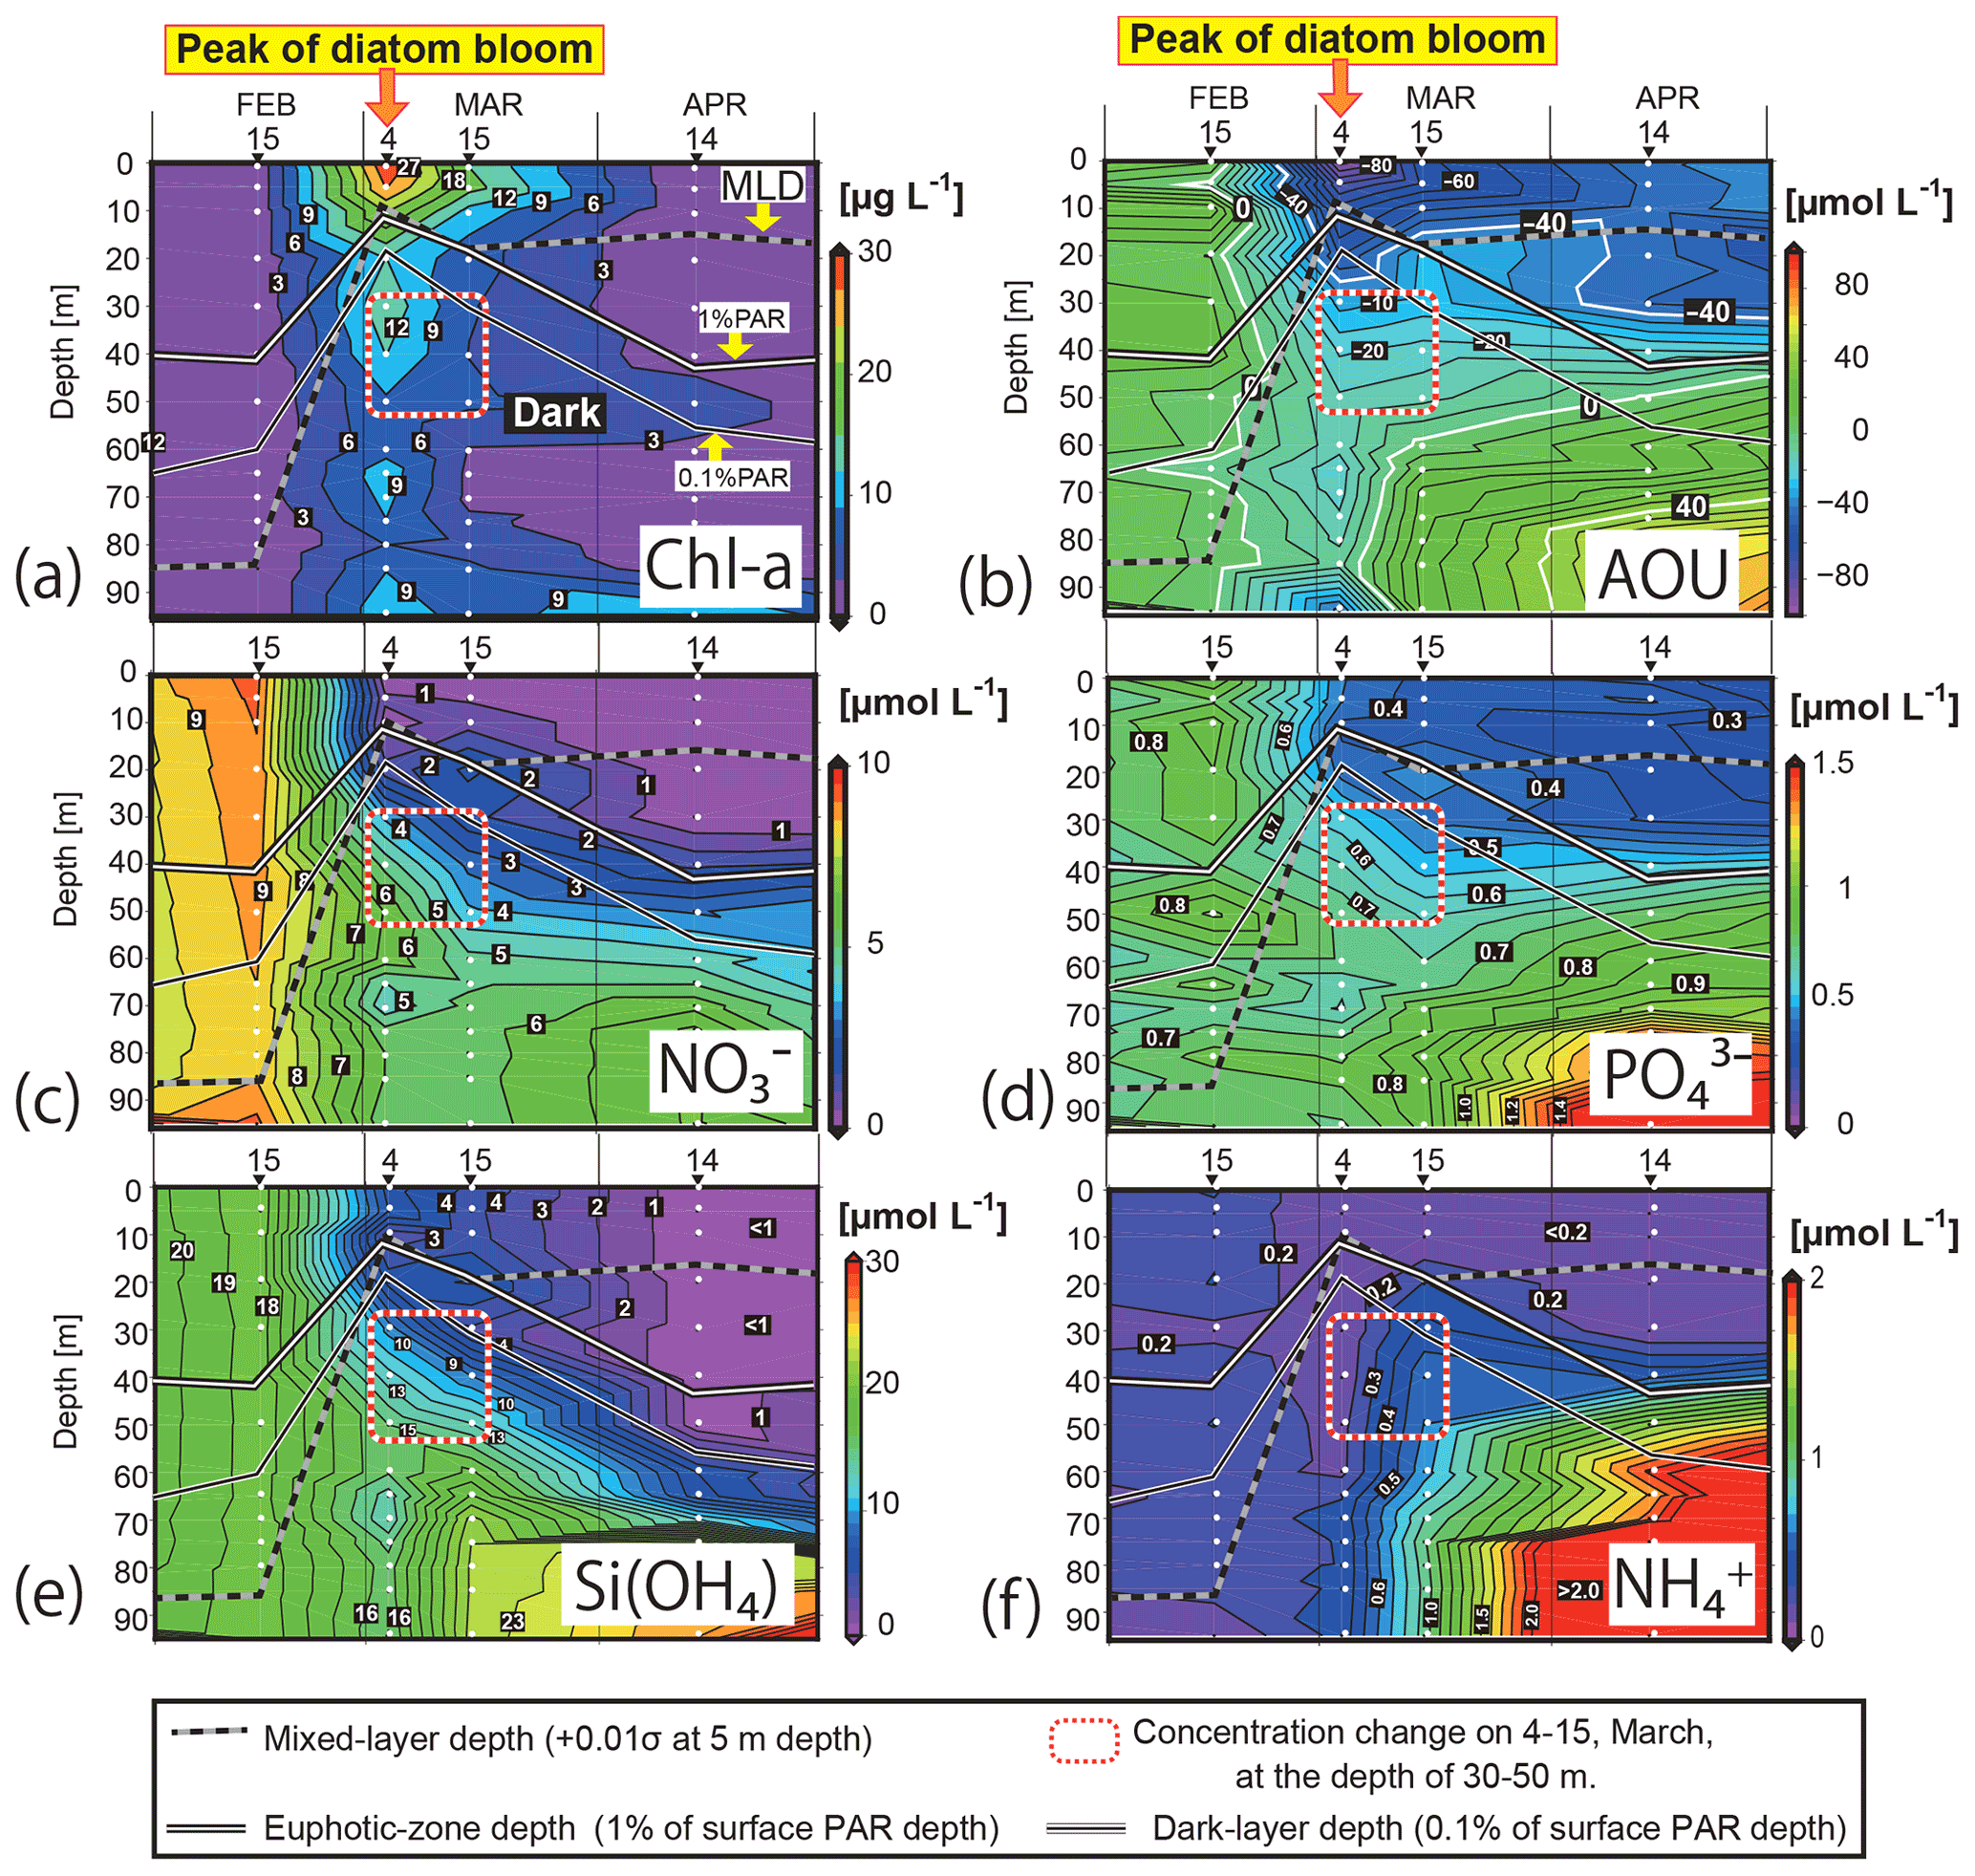
Figure 4Time–depth sections of (a) the Chl-a concentration, (b) apparent oxygen utilization (AOU), and concentrations of (c) NO, (d) PO, (e) Si(OH)4, and (f) NH in the water column in Funka Bay, Japan. Water was collected on 15 February, 4 and 15 March, and 14 April 2019. White circles indicate sampling depths. Solid white lines indicate the euphotic-zone depth (1 % PAR). Solid black lines indicate the dark-layer depth (0.1 % PAR). Black-and-white dotted lines indicate the surface mixed-layer depth. Squares outlined with red-and-white dotted lines indicate the subsurface layer (30–50 m) on 4 and 15 March, where nutrient reductions were observed. PAR denotes photosynthetically active radiation.
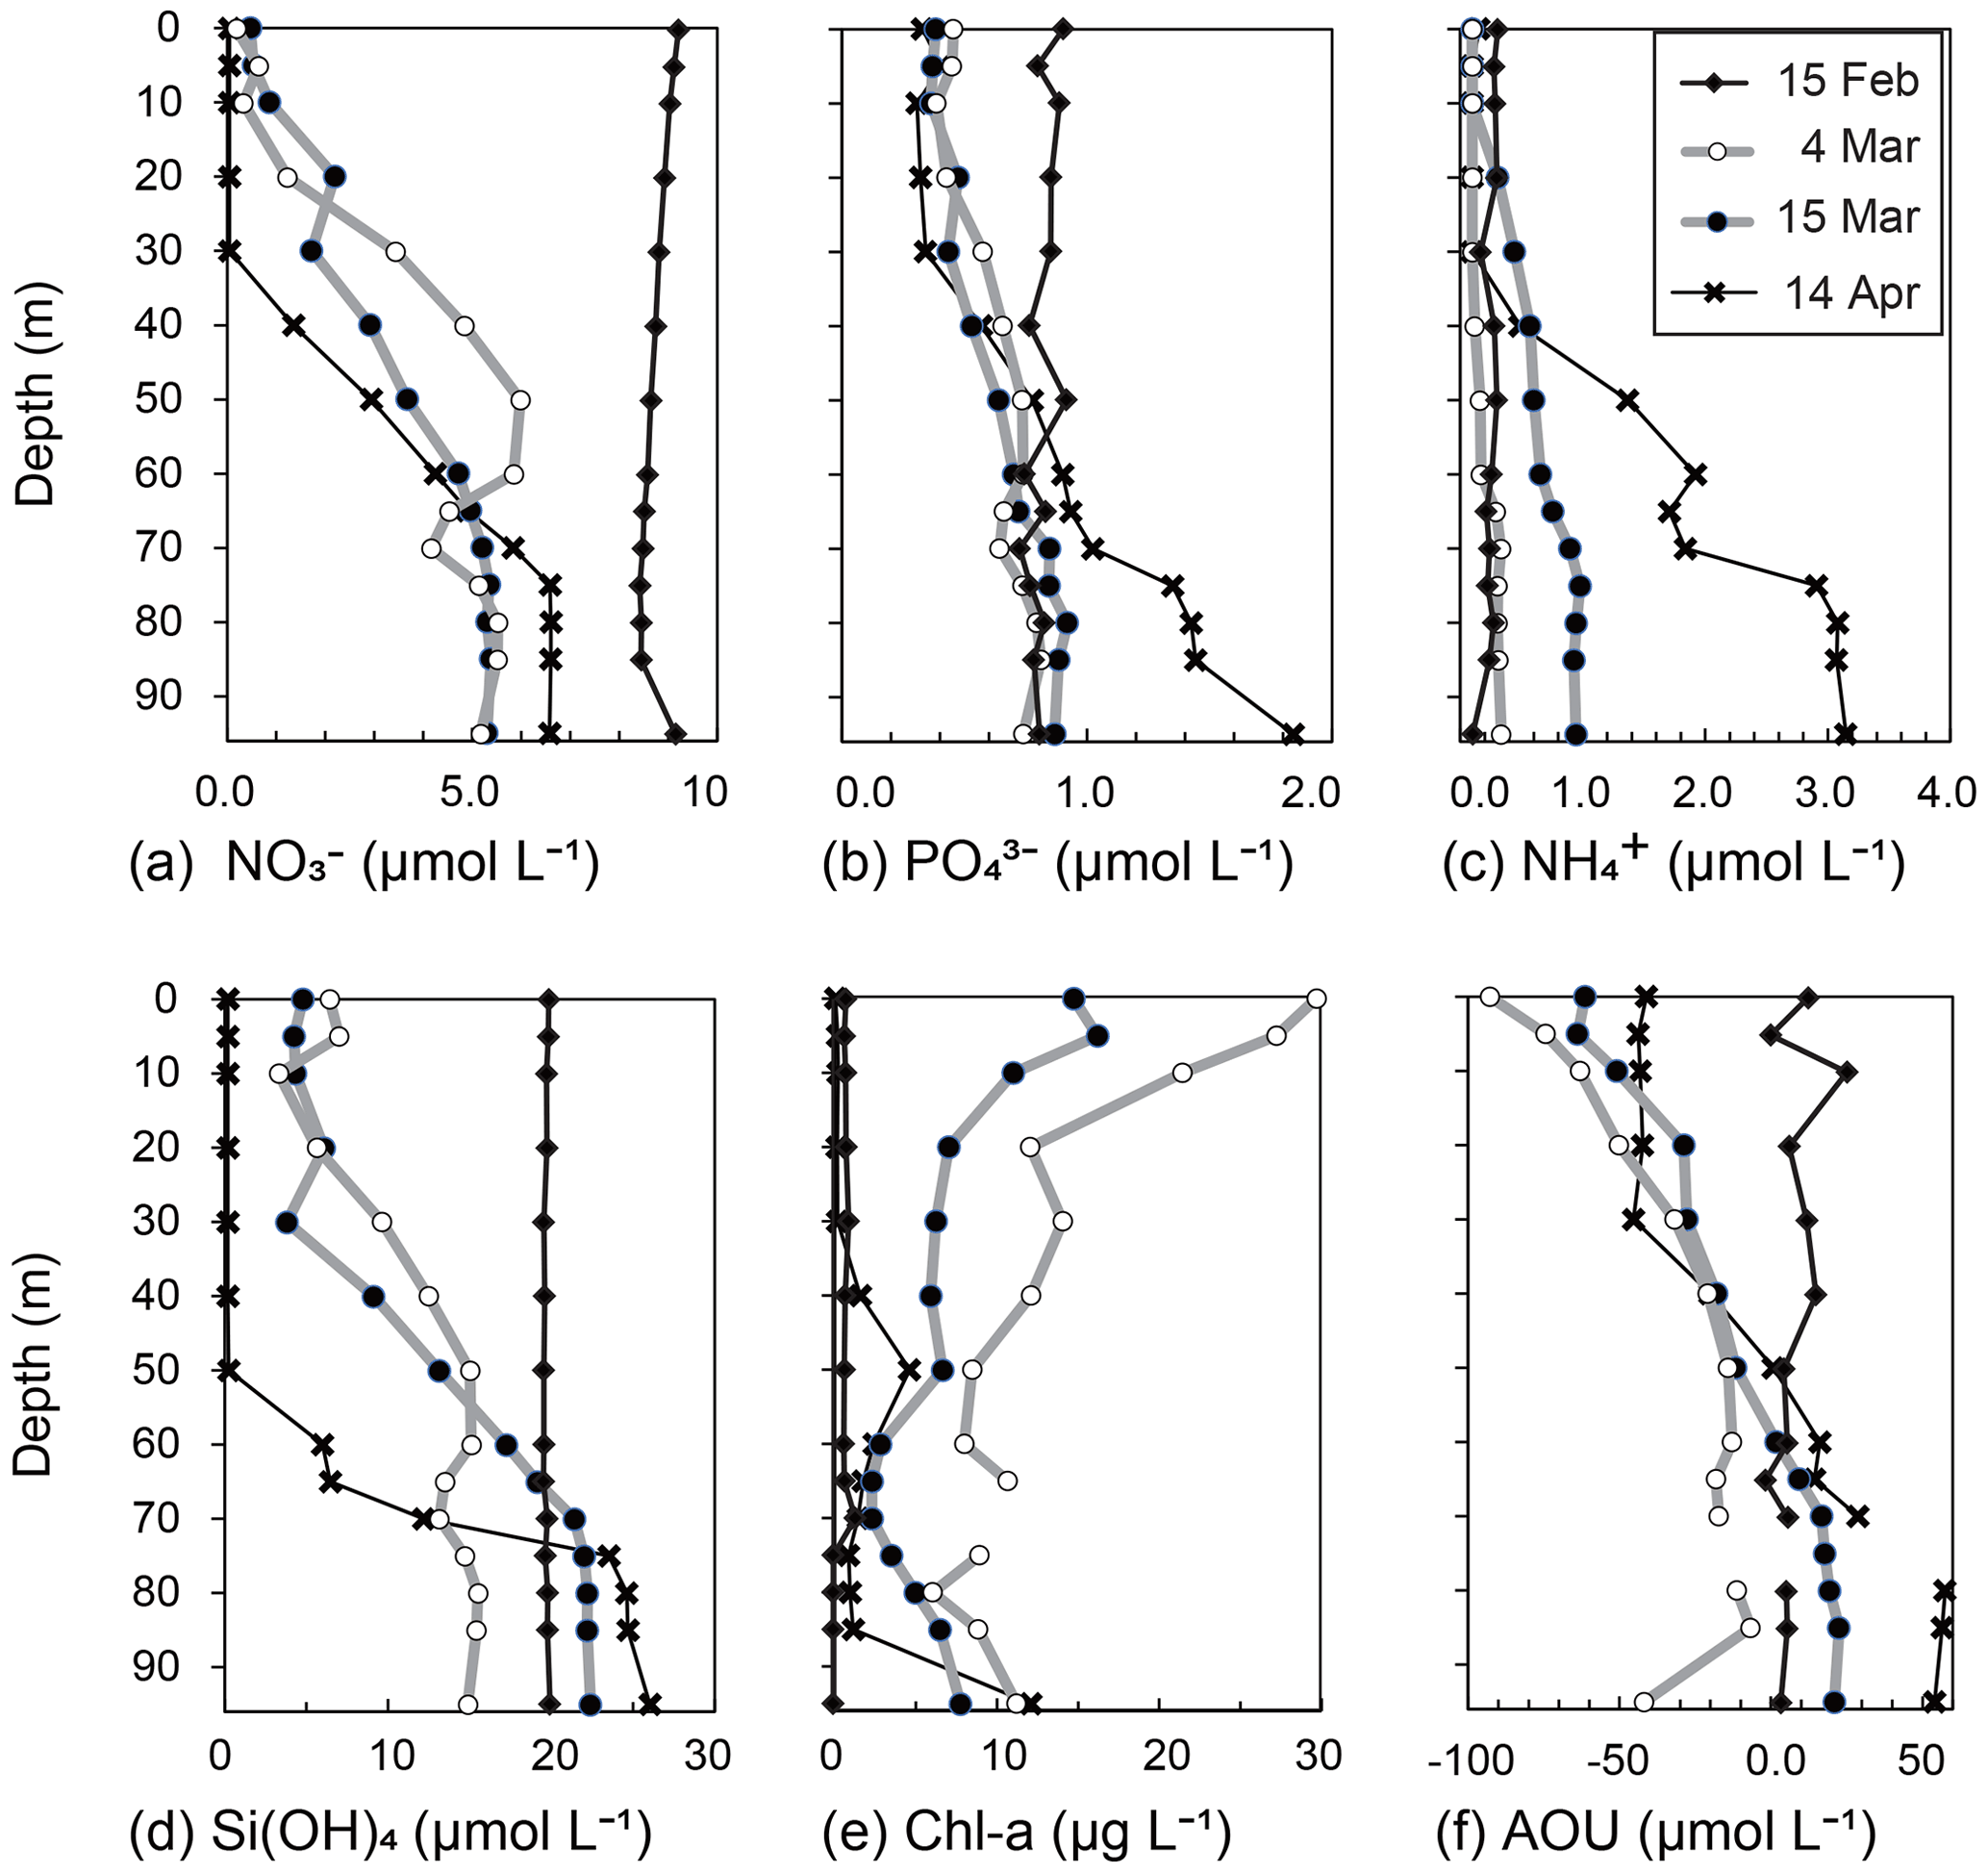
Figure 5Vertical profiles of (a) NO, (b) PO, (c) NH, (d) Si(OH)4, (e) Chl a, and (f) apparent oxygen utilization (AOU) at station 30 in Funka Bay, Hokkaido, Japan, on 15 February, 4 and 15 March, and 14 April 2019.
3.2.1 Chl a
The surface mixed layer reached at least 85 m depth on 15 February, but the Chl-a profile was not vertically uniform (see the Supplement data file). Chl-a concentrations between 0 and 70 m were relatively high, ranging from 0.65 to 1.4 µg L−1 (average of 0.81 µg L−1), compared with concentrations in the deeper layer (75–95 m), where they were below the detection limit (<0.05 µg L−1). We suggest that, on this date, diatom growth had just started as an early phase of the spring bloom.
By 4 March, the Chl-a concentrations had substantially increased at all depths (Figs. 4a, 5e). Notably high concentrations (27–30 µg L−1) were found in the surface mixed layer (0–5 m). The depth range of the mixed layer (0–9 m) was almost the same as that of the euphotic zone (0–13 m). In Funka Bay, a Chl-a maximum of 10–20 µg L−1 has been found at the peak of the diatom bloom in March of every year (Odate et al., 1993; Kudo and Matsunaga, 1999; Kudo et al., 2007). We believe that we observed the peak of the diatom spring bloom on 4 March. Even below the dark-layer depth (17 m), there were high Chl-a concentrations (6.0–14.1 µg L−1). The high Chl-a levels in the dark layer suggested that large amounts of diatom aggregates, which had been produced in the surface layer, were sinking from the surface to the deeper layer.
Chl-a concentrations had decreased at all depths by 15 March; however, high levels were still found within the surface mixed layer (11.0–16.2 µg L−1 at 0–10 m) and in the deeper dark layer (2.3–7.8 µg L−1 at 30–95 m). We considered the spring diatom bloom to be in a declining phase on 15 March.
On 14 April, the Chl-a concentrations were very low in the euphotic zone (0.05–1.6 µg L−1 at 0–40 m) and in the deeper layer (0.85–4.6 µg L−1 at 50–85 m) except for the bottom water just above the seafloor (12.2 µg L−1 at 95 m). We believe that the spring diatom bloom had terminated by 14 April. A local Chl-a maximum concentration of 4.6 µg L−1 was found at 50 m depth, which was between the euphotic-zone depth (42 m) and the dark-layer depth (55 m).
3.2.2 Nitrate
On 15 February, nitrate (NO) concentrations (8.4–9.2 µmol L−1) were vertically uniform (Figs. 4c, 5a).
By 4 March, the NO concentrations had substantially decreased to 0.15–0.60 µmol L−1 in the depth range between 0 and 10 m within the euphotic zone. The decrease at the surface was due to consumption by diatoms, which had rapidly grown during the spring bloom. Below the surface (20–95 m), the NO concentrations had also decreased to 1.9–6.0 µmol L−1, which was approximately half of the concentration in February. Because the dark-layer depth was 60 m on 15 February and 18 m on 4 March, the depth range of 60–95 m was dark on both dates. Thus, there could have been no photosynthesis-related NO consumption in the dark layer (60–95 m). However, NO concentrations in the dark layer had decreased to 4.1–5.8 µmol L−1, which was 60 % of the concentration in February. Explanations for the decrease in NO concentrations in the dark layer are discussed in Sect. 4.1.
On 15 March, the NO levels at 0–10 m depth (0.39–0.79 µmol L−1) within the surface mixed layer (0–18 m) had not changed since 4 March. The euphotic-zone depth (1 % PAR) and dark-layer depth (0.1 % PAR) had deepened to 22 and 30 m, respectively. The NO concentrations in the dark subsurface layer (30–50 m) had decreased substantially to 1.6–3.6 µmol L−1, approximately half those on 4 March within the same depth range. The range of the reduction rate of NO per unit Chl a in the subsurface layer between 4 March and 15 March was 0.016–0.029 µmol (µg Chl a)−1 d−1. The reduction rate per unit Chl a will be compared with the dark-incubation results in Sect. 3.3. We hypothesized that the diatoms that had settled from the surface to the subsurface layer consumed NO in the dark. This possibility will be discussed in Sect. 4.2. The NO concentrations in the deeper layer (60–95 m) had not changed since 4 March.
By 14 April, the euphotic-zone depth had deepened to 47 m. The NO concentrations had decreased to below the detection limit (<0.05 µmol L−1) in the upper euphotic zone (0–30 m) and had decreased to 1.4 µmol L−1 in the lower euphotic zone (40 m). In the deep water (80–95 m), the NO concentrations slightly increased from 5.26 µmol L−1 on 15 March to 6.60 µmol L−1 on 14 April.
3.2.3 Phosphate and silicate
Overall, temporal variations in PO and Si(OH)4 concentrations were very similar to those of NO (Figs. 4d, e; 5b, d). We found decreases in these nutrients in the dark subsurface layer at 60–95 m on 4 March and at 30–50 m on 15 March. On 4 March, the concentrations of PO and Si(OH)4 in the dark subsurface layer (30–50 m) were 0.66 and 12.4 µmol L−1, respectively, decreasing to 0.53 and 8.7 µmol L−1, respectively, on 15 March. We concluded that the reasons for these decreases were the same as for NO, as discussed in Sect. 4.1 and 4.2. The ranges of the reduction rate per unit Chl a in the subsurface layer between 4 and 15 March were 0.001–0.002 µmol (µg Chl a)−1 d−1 for PO and 0.029–0.053 µmol (µg Chl a)−1 d−1 for Si(OH)4. The reduction rate per unit Chl a will be compared with the dark-incubation results in Sect. 3.3. In contrast to the subsurface layer, the average concentrations of PO and Si(OH)4 in the deep layer (80–95 m depth) increased with time: 0.78 µmol L−1 and 15.3 µmol L−1 on 4 March, 0.89 µmol L−1 and 22.3 µmol L−1 on 15 March, and 1.57 µmol L−1 and 25.1 µmol L−1 on 14 April, respectively. A clear increase in the AOU in deep water (80–95 m depth) was found from 15 March (average of 20.9 µmol L−1) to 14 April (average of 56.0 µmol L−1) (see Figs. 4b and 5f). Because the increase in PO coincided with the rise in the AOU, it likely resulted from remineralization following the decomposition of organic matter suspended in the bottom water or settled on the seafloor. The increase in Si(OH)4 in the bottom water likely resulted from the dissolution of biogenic silica that settled on the seafloor.
3.2.4 Ammonium
Temporal variations in NH concentrations were similar to those of the other nutrients, except for substantial increases in NH in the subsurface and bottom layers on 15 March (Figs. 4f, 5c). We considered these increases to be due to the remineralization of organic matter suspended in the water column or settled on the seafloor. Because the NH concentrations were at their lowest during winter with a total column average of 0.25 µmol L−1 on 15 February, the signal from remineralization could be clearly detected on 15 March with an average of 0.54 µmol L−1 in the subsurface water (30–50 m). The deepwater NH concentrations obviously increased with time from 4 March: 0.31 µmol L−1 on 4 March, 0.95 µmol L−1 on 15 March, and 3.05 µmol L−1 on 14 April.
3.3 Limiting factor of primary production during the bloom
On 15 February, before the occurrence of a massive diatom bloom, the average concentrations of NO, PO, and Si(OH)4 at the surface (0–10 m) were 9.1, 0.86, and 19.8 µmol L−1, respectively. On 4 March, at the peak of the bloom, the average concentrations of NO, PO, and Si(OH)4 at the surface (0–10 m) were 0.34, 0.43, and 5.6 µmol L−1, respectively. Uptake ratios of N : P and Si : N at the surface between 15 February and 4 March were 20.5 (= (9.1–0.34) (0.86–0.43)) and 1.62 (= (19.9–5.6) (9.1–0.34)), respectively. Similar uptake ratios during the diatom bloom in Funka Bay have been reported to be 15.6–23.6 for N : P and 1.9–2.7 for Si : N (Kudo and Matsunaga, 1999). From the N : P uptake ratio, NO in the surface water could have been depleted from 4 March onward. On 15 March, during the declining phase of the bloom, the average concentrations of NO, PO, and Si(OH)4 at the surface (0–10 m) were 0.54, 0.37, and 4.5 µmol L−1, respectively. As a sufficient amount of Si(OH)4 remained in the surface water on 15 March, we considered that the N depletion in the surface water limited primary production after the peak of the bloom.
3.4 Dark-incubation experiments
We show temporal changes in nutrients and Chl a in the dark-incubation experiments using the diatom Thalassiosira nordenskioeldii (Fig. 6 for the first and second experiments and Fig. 7 for the third and fourth experiments) and natural seawater (Fig. 8).
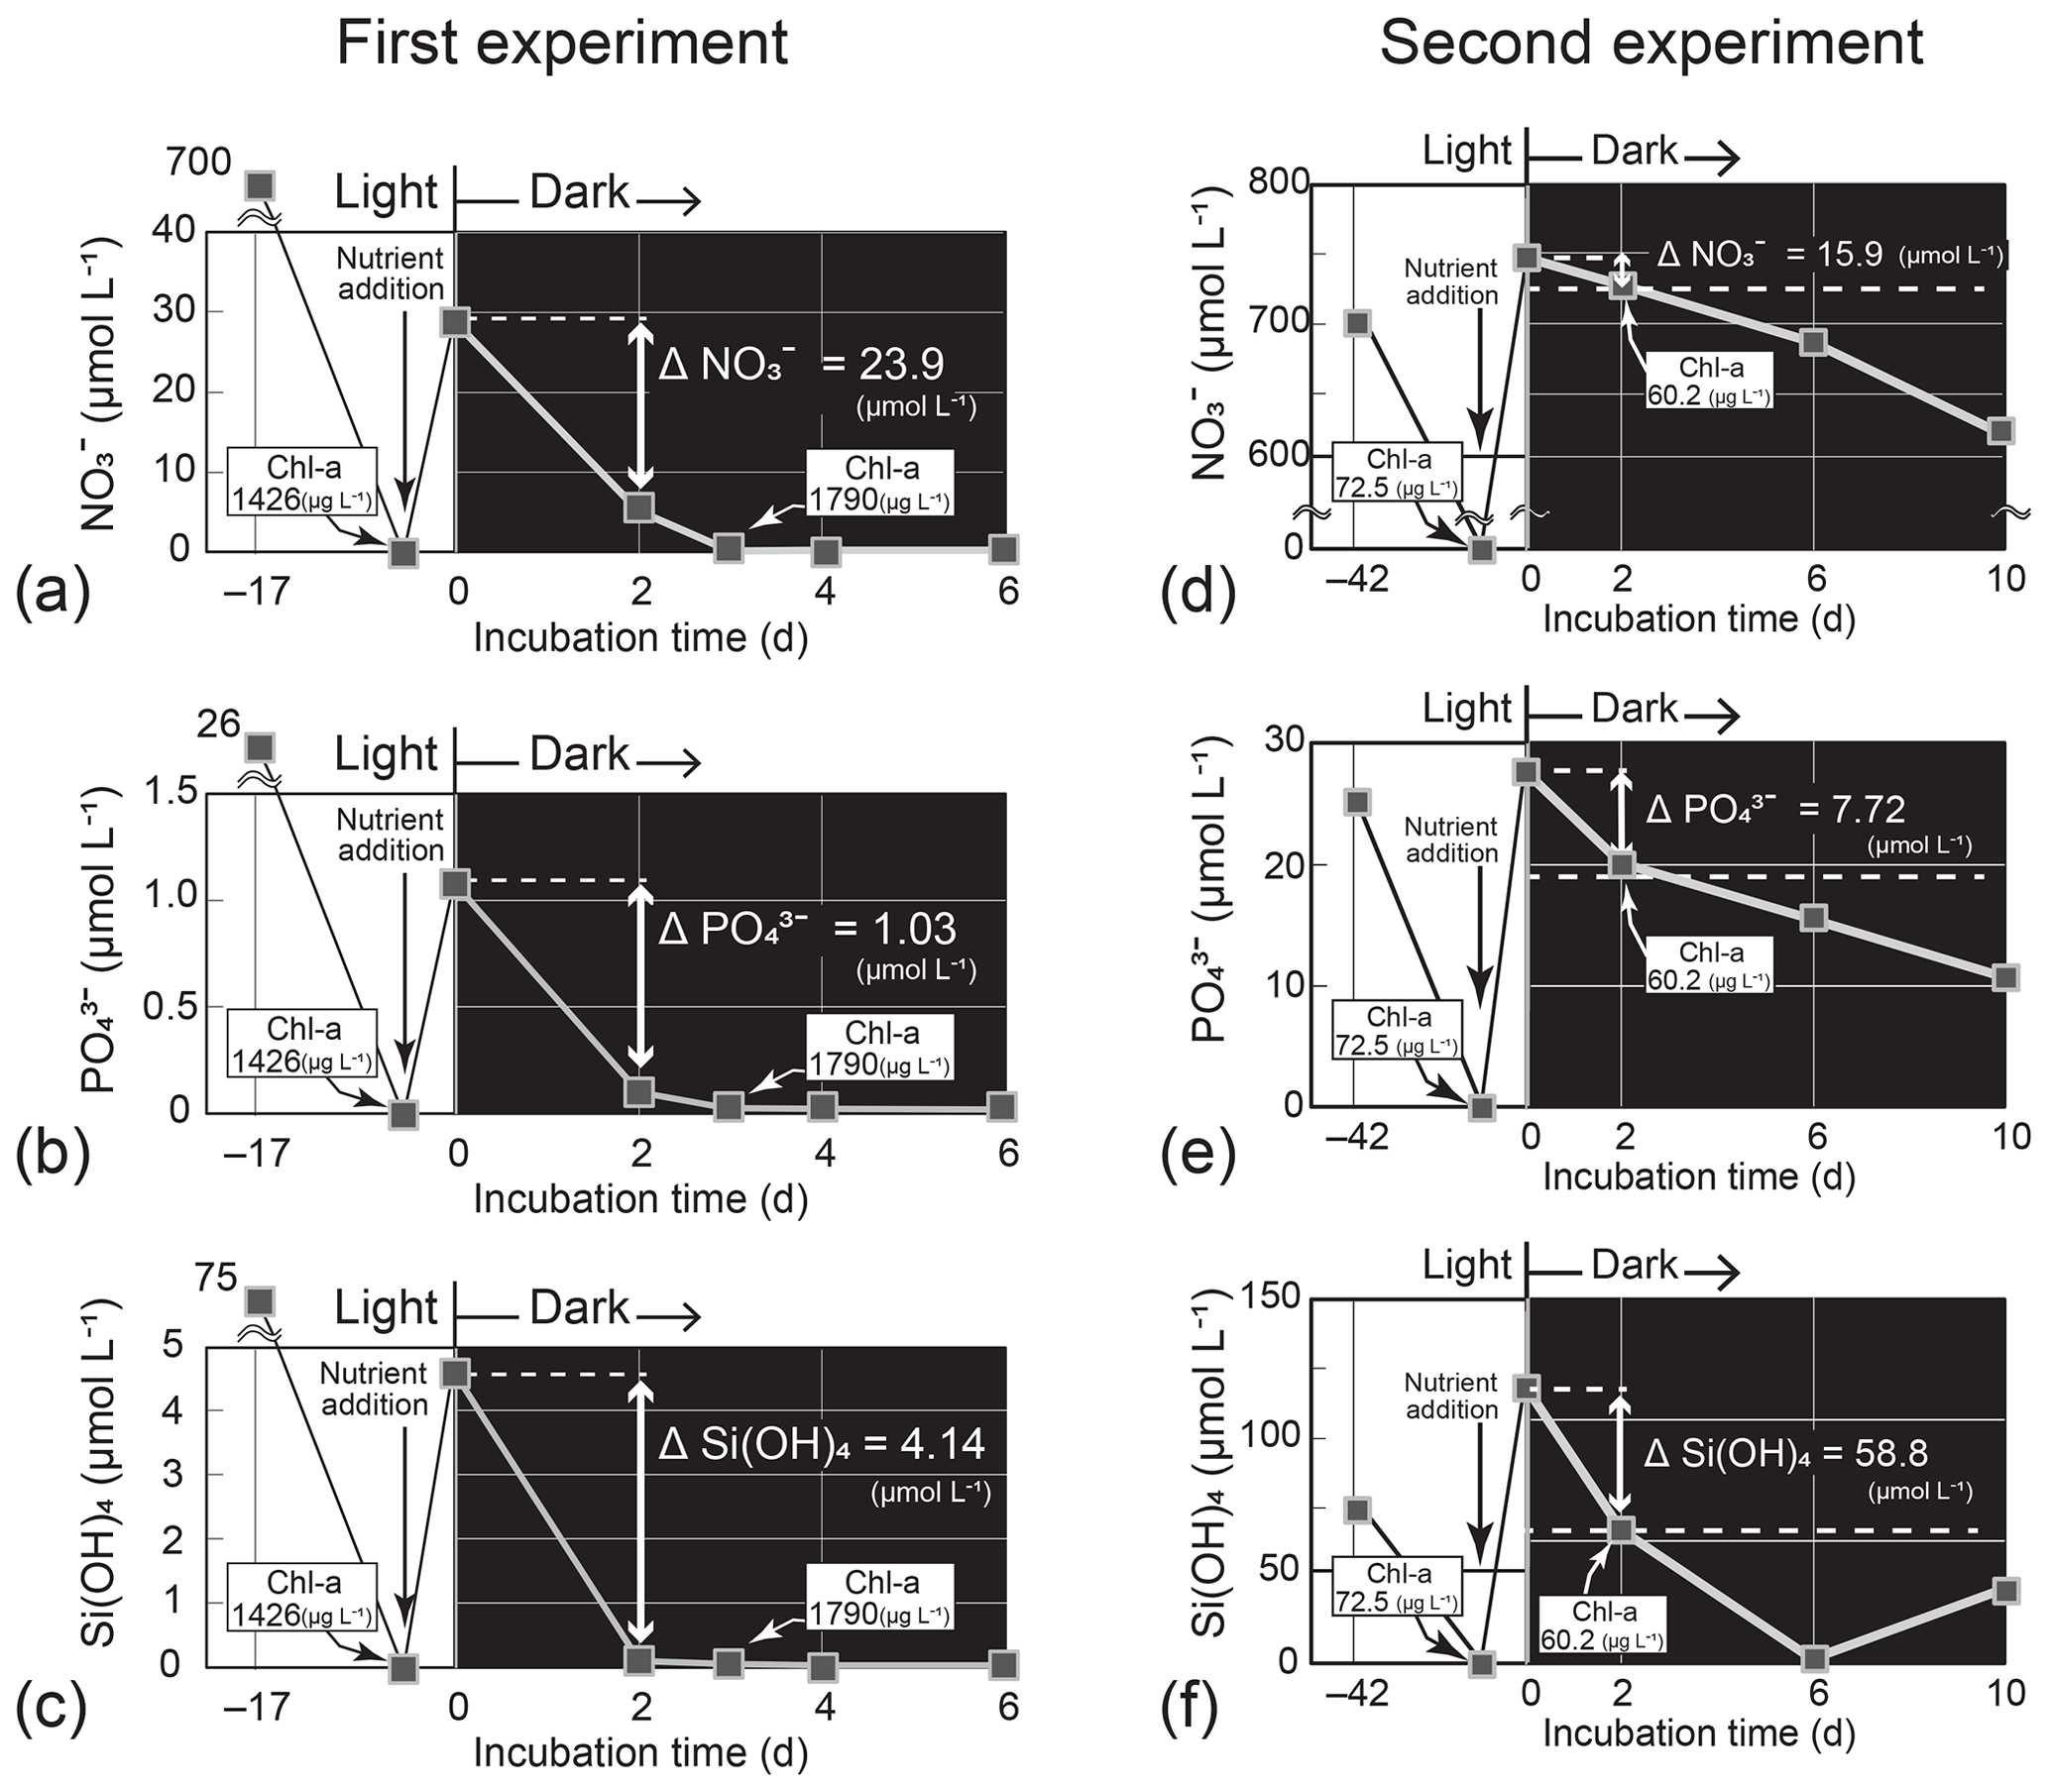
Figure 6Temporal change in the nutrient concentrations in the dark-incubation experiment using the diatom Thalassiosira nordenskioeldii for (a) NO, (b) PO, and (c) Si(OH)4 in the first experiment and for (d) NO, (e) PO, and (f) Si(OH)4 in the second experiment. The diatom was pre-cultured for 17 or 42 d under lit conditions before nutrients were added. Each incubation bottle (n=1) with nutrient addition was put in the dark on Day 0.
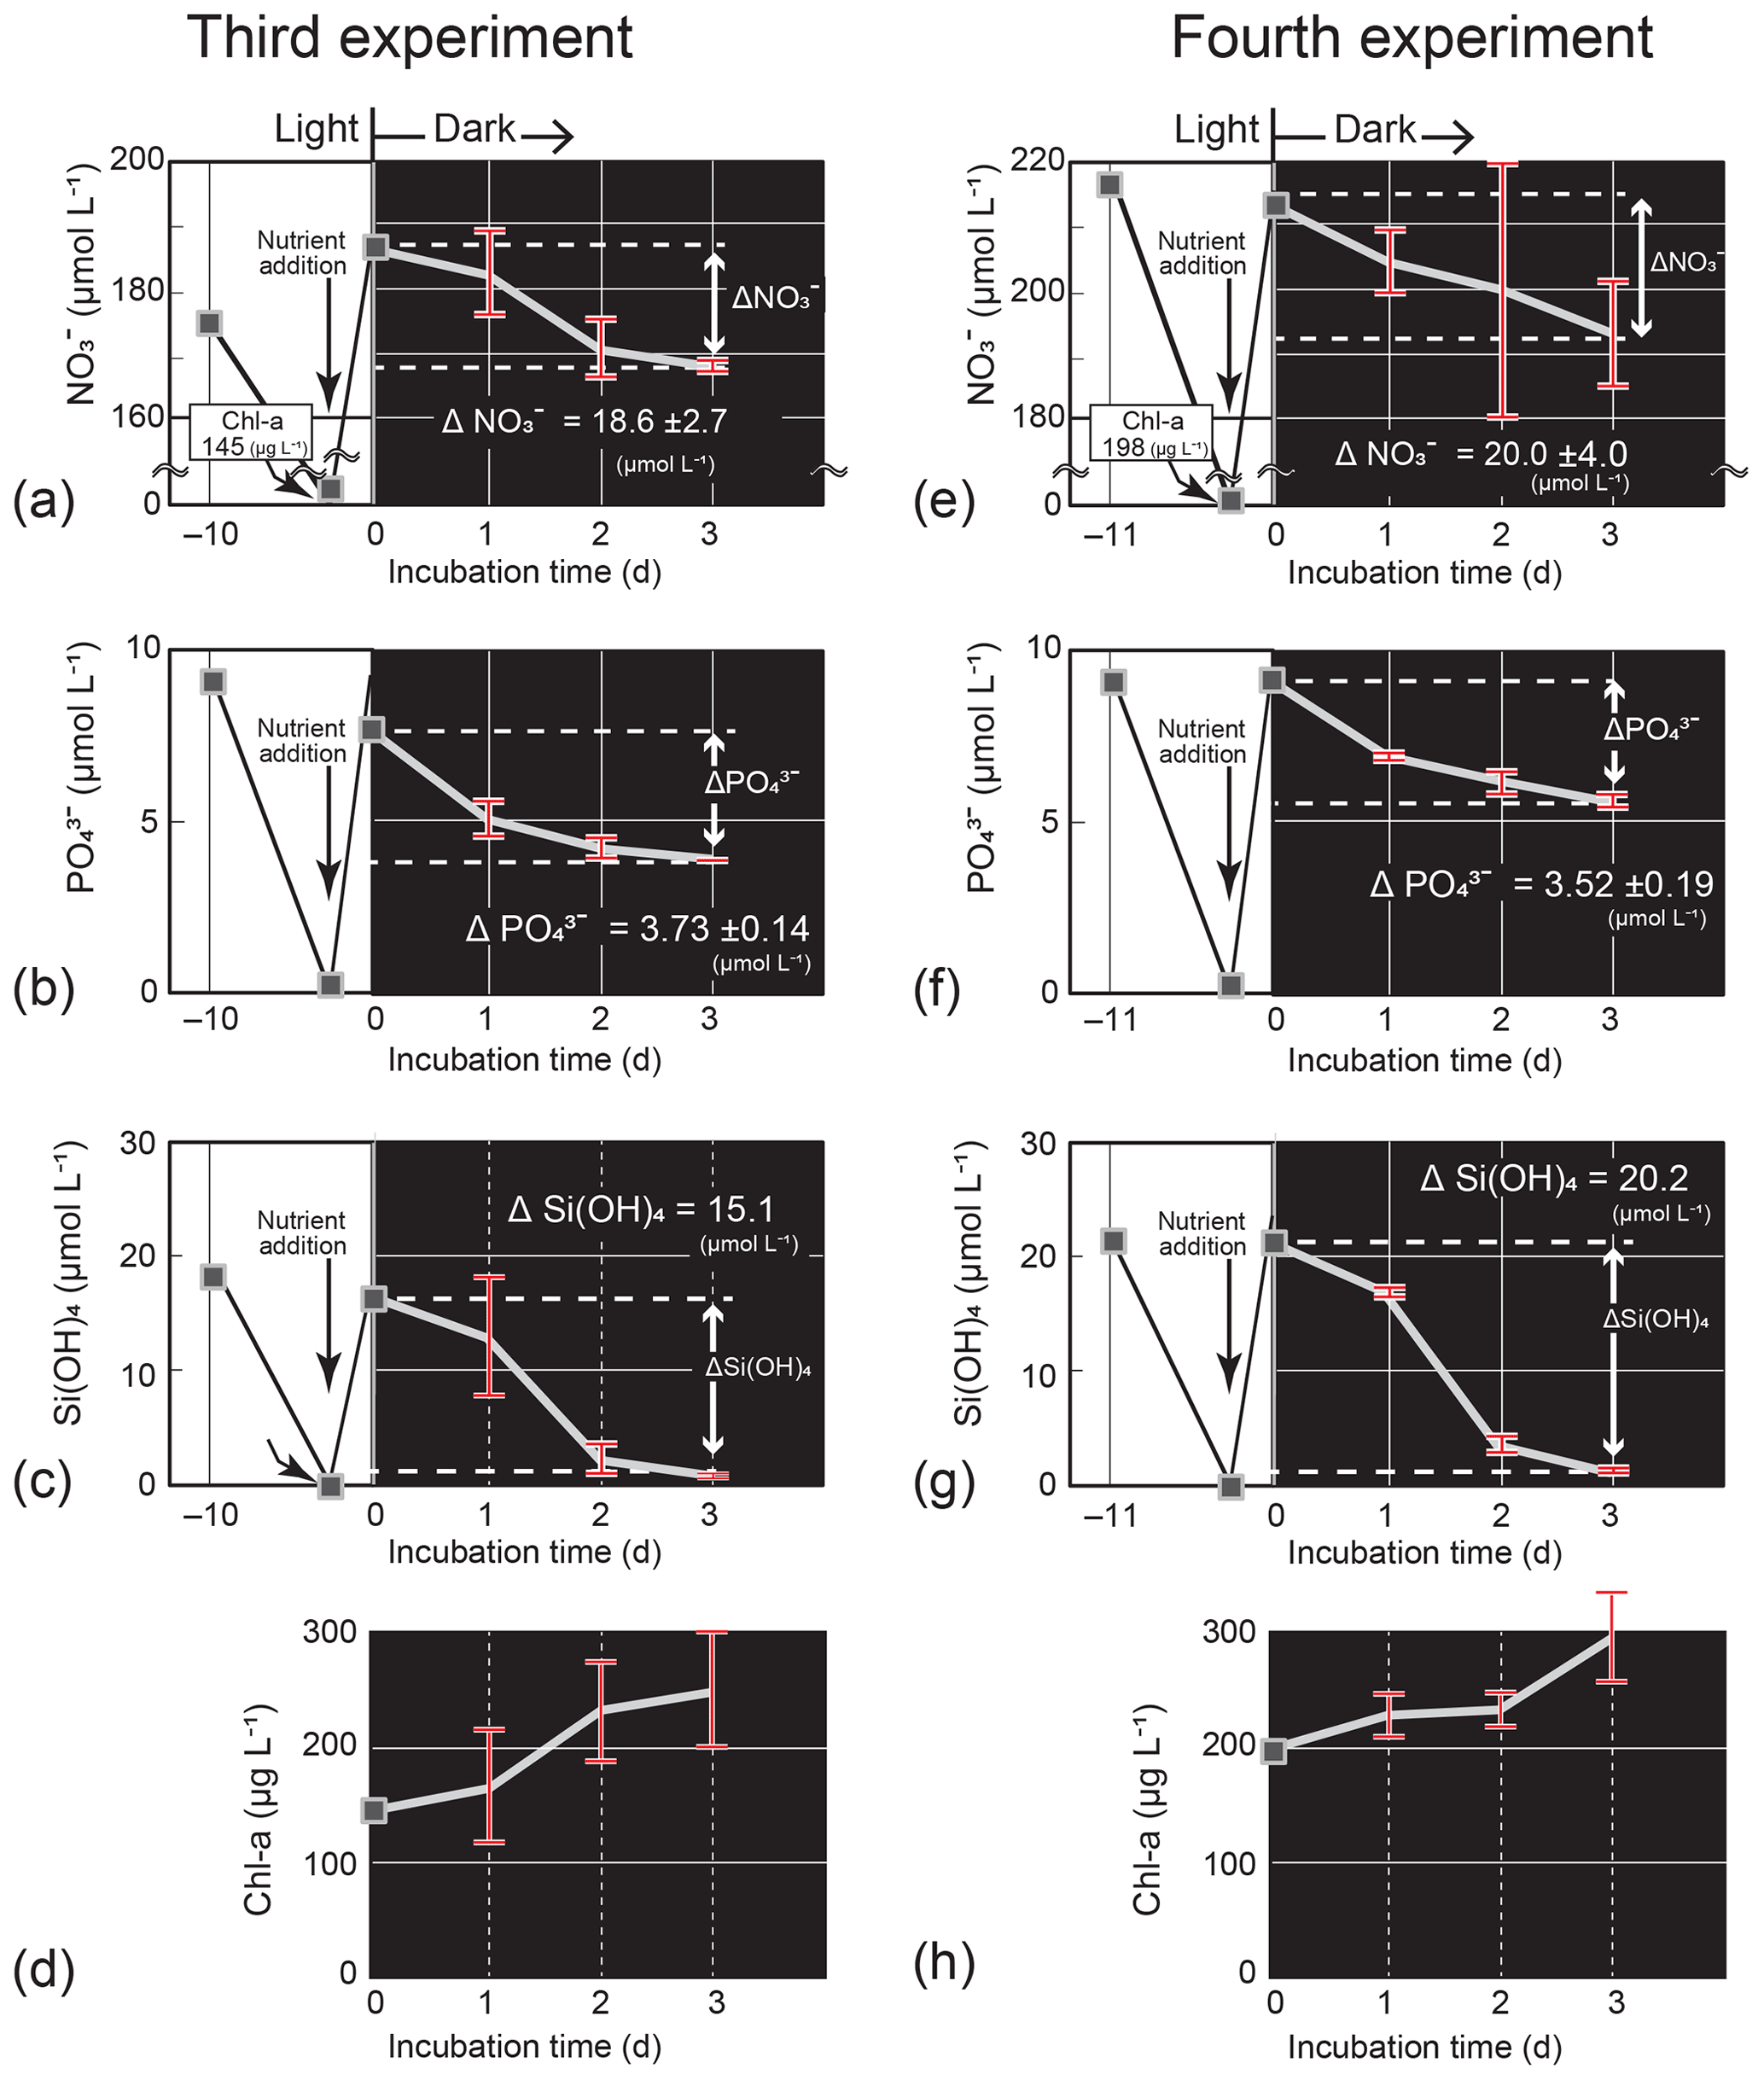
Figure 7Temporal change in the nutrient and Chl-a concentrations (mean ± 1 SD, n = 4) in the dark-incubation experiment using the diatom Thalassiosira nordenskioeldii for (a) NO, (b) PO, (c) Si(OH)4, and (d) Chl a in the third experiment and for (e) NO, (f) PO, (g) Si(OH)4, and (h) Chl a in the fourth experiment. The diatom was cultured for 10 or 11 d under lit conditions before nutrients were added. Each incubation bottle (n=4) with nutrient addition was put in the dark on Day 0.

Figure 8Temporal change in Chl-a and nutrient concentrations (mean ± 1 SD: n = 8 in the lit period and n = 4 in the dark period) in the incubation experiment using natural seawater (5 and 40 m depths) collected from station 30 in Funka Bay on 8 March 2022. Phytoplankton in the seawater at 5 m depth were pre-cultured for 5 d under lit conditions to deplete nutrients before nutrients were added to the seawater on Day 0 of the dark period (nutrient addition) or not added (no nutrient addition); (a) Chl a, (b) NO, (c) PO, and (d) Si(OH)4 were examined for the light and dark experiment. Phytoplankton in seawater at 5 and 40 m depths were cultured under continuous dark conditions without nutrient addition after the seawater collection; (e) Chl a, (f) NO, (g) PO, and (h) Si(OH)4 were examined for the continuous dark experiment.
3.4.1 Thalassiosira nordenskioeldii incubation experiment
In the first Thalassiosira experiment, we added nutrients into the nutrient-depleted culture medium. The added amount of NO per unit Chl a (0.022 = 31.1 µmol L−1 1426 µg L−1) was 6 % of the concentration ratio of NO : Chl a (0.40 = 4.8 µmol L−1 12 µg L−1) in seawater at 40 m on 4 March. The first incubation experiment results demonstrated that the diatom culture, which had been depleted of nutrients before the start of the dark incubation, rapidly exhausted nutrients in the dark within 6 d of nutrient addition (Fig. 6a–c). As we did not check for bacterial contamination after the experiment, bacterial consumption and/or recycling of nutrients in the culture might have influenced the results. We assumed that bacterial activity had less effect on nutrient changes in the high-density diatom culture. The daily consumption rates per unit Chl a calculated from the concentration difference in nutrients between Day 0 and Day 2 and the initial concentration of Chl a (1426 µg L−1) of the dark incubation were 0.0084 µmol (µg Chl a)−1 d−1 for NO, 0.00036 µmol (µg Chl a)−1 d−1 for PO, and 0.0015 µmol (µg Chl a)−1 d−1 for Si(OH)4. From these consumption rates, we estimated the concentration decreases (Δ nutrients) in the subsurface layer for the 11 d between 4 and 15 March using an observed Chl-a concentration of 11.54 µg L−1 (average on 4 March). The estimated ΔNO (−1.1 µmol L−1), ΔPO (−0.05 µmol L−1), and ΔSi(OH)4 (−0.18 µmol L−1) values were to of the actual decreases in the subsurface layer between 4 and 15 March: ΔNO, −2.0 µmol L−1; ΔPO, −0.12 µmol L−1; and ΔSi(OH)4, −3.7 µmol L−1. Silicic acid was almost depleted on Day 2 of the dark incubation. If the diatoms had exhausted Si(OH)4 earlier than we collected the culture sample on Day 2, the daily consumption rates would be underestimated.
In the second Thalassiosira experiment, we added excess amount of nutrients into the nutrient-depleted medium, in which cultured diatoms were in a declining phase of growth. The added amount of NO per unit Chl a (10.3 = 743.5 µmol L−1 72.5 µg L−1) was 26 times that of the seawater concentration ratio at 40 m on 4 March 2019. The results of the second incubation experiment (Fig. 6d–f) demonstrated that the diatom culture consumed nutrients in the dark. The daily consumption rates were 0.11 µmol (µg Chl a)−1 d−1 for NO, 0.053 µmol (µg Chl a)−1 d−1 for PO, and 0.41 µmol (µg Chl a)−1 d−1 for Si(OH)4, 12–173 times those of the first experiment. We deduced that the high consumption rates per unit Chl a in the second experiment were due to high consumption rates per unit cell, as Chl a was low, although we did not count the cell number density. The estimated ΔNO (−13.9 µmol L−1), ΔPO (−6.74 µmol L−1), and ΔSi(OH)4 (−51.5 µmol L−1) values were 7–56 times those of the actual decreases in the subsurface layer.
In the third and fourth Thalassiosira experiments, the added amount of NO per unit Chl a (0.77–0.96) was 1.9–2.4 times that of the seawater concentration ratio at 40 m on 4 March. The results of the third and fourth experiments (Fig. 7a–h) demonstrated that the diatom culture consumed nutrients in the dark. The consumption rates, which were calculated from the concentration difference in nutrients between Day 0 and Day 3 of the dark incubation and the initial Chl-a concentrations on Day 0, were 0.034–0.043 µmol (µg Chl a)−1 d−1 for NO, 0.0059–0.0086 µmol (µg Chl a)−1 d−1 for PO, and 0.034–0.035 µmol (µg Chl a)−1 d−1 for Si(OH)4. The estimated ΔNO from −4.3 to −5.4 µmol L−1, ΔPO from −0.75 to −1.1 µmol L−1, and ΔSi(OH)4 from −4.3 to −4.4 µmol L−1 were close to the actual decreases between the two dates: ΔNO, −2.0 µmol L−1; ΔPO, −0.12 µmol L−1; and ΔSi(OH)4, −3.7 µmol L−1. The Chl-a concentrations increased in the dark: from 145 µg L−1 (Day 0) to 250 µg L−1 (Day 3) for the third experiment and from 198 µg L−1 (Day 0) to 294 µg L−1 (Day 3) for the fourth experiment.
3.4.2 Natural seawater incubation experiment
In the natural seawater incubation experiment using seawater samples collected on 8 March 2022, the added amount of NO per unit Chl a (0.50 = 12.6 µmol L−1 25.1 µg L−1) into nutrient-depleted seawater was between the concentration ratio of NO : Chl a (0.33 = 4.9 µmol L−1 14.5 µg L−1) in seawater at 5 m and the ratio of 0.81 (= 7.4 µmol L−1 9.1 µg L−1) at 40 m on 8 March 2022. The results of the natural seawater experiment, in which nutrients were added into the nutrient-depleted seawater after pre-culturing under lit conditions, are shown in Fig. 8a–d. We found decreases in nutrient concentrations in the dark period after nutrient addition. The consumption rates, which were calculated from the concentration difference in nutrients between Day 0 and Day 7 of dark incubation and the initial Chl-a concentration on Day 0, were 0.053 µmol (µg Chl a)−1 d−1 for NO, 0.0018 µmol (µg Chl a)−1 d−1 for PO, and 0.010 µmol (µg Chl a)−1 d−1 for Si(OH)4. The consumption rates were close to the rates found in the dark subsurface layer (30–50 m) between 4 and 15 March 2019. The estimated ΔNO (−6.7 µmol L−1), ΔPO (−0.23 µmol L−1), and ΔSi(OH)4 (−12.9 µmol L−1) values were greater than the nutrient decreases in the dark subsurface layer between 4 and 15 March 2019. However, the results of the natural seawater experiment under continuous dark conditions without nutrient addition (Fig. 8e–h) demonstrated that all nutrients were not consumed by phytoplankton in the dark. We considered that the phytoplankton collected from natural seawater on 8 March 2022 did not require nutrients under continuous dark conditions, as there was enough NO (4.6 µmol L−1) when the water at 5 m depth was collected in the growing phase of the bloom.
4.1 Nitrate consumption in the dark layer between 15 February and 4 March
We propose two explanations for the decrease in the NO concentration in the dark layer (60–95 m) between 15 February and 4 March. The first possible explanation is that NO was consumed by diatoms during their growth in the upper euphotic zone after 15 February and that this water, in which NO had been consumed during photosynthesis, then mixed vertically with deeper water (60–95 m) due to winter cooling before the water became stratified by 4 March. The possibility of vertical mixing between these two dates is supported by the temporal variation in the AOU, which is defined as the difference between the equilibrium saturation concentration and the measured concentration of oxygen in the water – i.e., positive and negative AOU values suggest net consumption (respiration) or net production (photosynthesis) of oxygen in water, respectively. On 15 February, the absolute value of the AOU over most of the water column was the lowest noted during the observation period (average of 6.2 µmol L−1, range of −3 to 23 µmol L−1), suggesting that there was no significant net O2 production throughout the total water column. By 4 March, the AOU values had dropped to a range of between −14 and −94 µmol L−1 at 0–50 m and of between −7 and −42 µmol L−1 at 60–95 m, even in the dark. Note that the decrease in the water temperature between the two dates (Δtemp = −0.45 ∘C) could have caused an increase in the AOU (ΔAOU 3.6 µmol L−1) due to the increase in the solubility of oxygen. The large negative AOU in the euphotic zone on 4 March was apparently due to photosynthetic O2 production. The negative AOU in the deeper dark layer (60–95 m) on 4 March was thought to be due to mixing with surface water, in which the AOU had been lowered by photosynthesis, before the water became stratified by 4 March.
The second possible explanation is that the diatoms, which had grown at the surface and then settled to the deeper layer, consumed NO in the dark without photosynthetic growth. The possibility of nutrient consumption in the dark is discussed in Sect. 4.2.1. We believe that both explanations apply to the decrease in NO concentrations in the deeper layer between these two dates; however, we could not separate their effects.
4.2 Nutrient consumption in the dark subsurface layer between 4 and 15 March
We found decreases in the nutrient concentrations in the dark subsurface layer between 15 February and 4 March and also between 4 and 15 March. The latter reduction could not have been affected by photosynthetic consumption by diatoms because there was almost no light available for photosynthesis. Here, we discuss the possible reasons for the nutrient reductions between 4 and 15 March.
4.2.1 Nutrient consumption by diatoms in the dark
First, we considered nutrient consumption by diatoms that were sinking from the surface and suspended in the dark subsurface layer during the bloom as a possible explanation for nutrient reduction in the subsurface layer. To examine this possibility, we conducted dark-incubation experiments using the diatom Thalassiosira nordenskioeldii, which dominates during the spring bloom in Funka Bay (Ban et al., 2000). From microscopic image analysis, Thalassiosira nordenskioeldii occupied 14.2 % of the number of phytoplankton cells (n = 1209) collected by a plankton net (mesh size of 100 µm) on 15 March 2019. Other dominant species were Chaetoceros spp. and other Thalassiosira sp. We confirmed that Thalassiosira nordenskioeldii was one of the dominant species in the spring bloom 2019. From the results of dark-incubation experiments using Thalassiosira nordenskioeldii and natural seawater collected on 8 March 2022, we demonstrated that nutrient consumption by diatoms in the dark had the potential to cause a nutrient reduction in the dark subsurface layer.
Cochlan et al. (1991) carried out onboard incubations with a diatom-dominated natural seawater, setting dark periods of 2–4 h after light periods. They reported nutrient consumption rates in the dark of 0.09–0.14 µmol (µg Chl a)−1 d−1 for NO, which are close to the results from our second Thalassiosira incubation. Many previous studies have focused on nutrient consumption in the dark within the day–night cycle in the euphotic zone. Onboard simulated in situ incubations yielded NO consumption rate dark : light ratios of 0–0.67 (Nelson and Conway, 1979), 0–1.0 (Conway and Whitledge, 1979), and 0–0.51 (Cochlan et al., 1991). These previous works have reported wide ranges of nutrient consumption rates in the dark and ratios. Cochlan et al. (1991) reported that the dark : light uptake ratio was greater in N-impoverished waters than in N-replete waters, suggesting that nutrient uptake in the dark is enhanced by nutrient stress. They also mentioned the importance of N uptake by heterotrophic bacteria, citing studies where uptake by heterotrophic bacteria ranged from half the uptake by phytoplankton to half of the total N uptake.
In the dark subsurface layer of Funka Bay between 4 and 15 March 2019, N-depleted diatoms that sunk from the surface after the peak of the bloom could have enhanced NO consumption in the dark. However, N-depleted diatoms in the growing phase of the bloom on 8 March 2022 would not have had the potential to consume nutrients under continuous dark conditions (see Fig. 8e–h). Although the nutrient consumption rates in the dark had wide ranges, we concluded that nutrient consumption by diatoms in the dark after the peak of the bloom had the potential to reduce nutrients by half in the dark subsurface layer of Funka Bay.
4.2.2 Water mixing as a possible explanation for nutrient reduction
Second, we discuss the possibility that vertical mixing between the surface mixed layer, which already had reduced nutrient levels, and the subsurface layer (30–50 m) resulted in the observed decrease in nutrient concentrations in the subsurface layer. Because the density (σ) gradient between depths of 20 and 30 m, (σ30 m–σ20 m) (30–20 m), of 0.0033 (kg m−3 m−1) on 4 March substantially increased to 0.021 (kg m−3 m−1) on 15 March, the stratification between these layers had strengthened (Fig. 2c). Additionally, there was no bad weather during this period; the wind speeds were relatively low, with daily averages of 3.0–5.9 m s−1, although low air temperature lasted, with daily averages of 1.0–5.3 ∘C (data from Muroran meteorological observatory, Meteorological Agency of Japan; https://www.data.jma.go.jp/risk/obsdl/index.php, last access: 15 January 2023).). The effect of low-salinity water inflow on the density decrease in the surface layer overcame the effect of cooling on the density increase (Fig. 2). From these observations, we excluded the possibility of vertical mixing between the two layers as an explanation for the decrease in nutrients in the subsurface layer.
We also considered the possibility of horizontal mixing of subsurface water with Oyashio water entering from the surface of the bay. Oyashio water is characterized by its low salinity. Because the salinity at 30 m declined from 33.58 on 4 March to 33.47 on 15 March, it is possible that the influence of low-salinity Oyashio water extended to 30 m. As the salinity of Oyashio water at 10 m depth on 15 March, where the minimum temperature (2.6 ∘C) was found suggesting the appearance of the main body of Oyashio water, was 33.0, we assumed that the salinity of original Oyashio water was 33.0. A mixing between 20 % Oyashio water and 80 % Funka Bay water at 30 m would change the salinity at 30 m depth from 33.58 (on 4 March) to 33.47 (on 15 March). Even if the concentrations of nutrients in the original Oyashio water were 0 µmol L−1, the mixing ratio of 8:2 (Funka Bay water : Oyashio water) would reduce the nutrient concentrations at 30 m depth by only 20 %. In reality, the NO concentration at 30 m was decreased by half between these two dates (Fig. 5a), and the salinity values at 40 and 50 m depths did not change (Fig. 2b). Thus, we excluded the possibility of mixing with Oyashio water as a reason for nutrient reduction in the subsurface layer.
4.2.3 Diffusive transport between the surface and the subsurface layers
Third, we discuss the effect of the diffusive transport of NO on the concentration decrease in the subsurface layer (30–50 m) on 15 March. Diffusive coefficients (Kρ) have not been measured in Funka Bay. We referred to a range of Kρ (10−6–10−5 m2 s−1) measured just below the mixed layer (∼ 30 m) in the western subarctic Pacific in summer (Dobashi et al., 2021). Concentration gradients of NO were −0.000221 µmol m−4 (ΔNO 10 m), −0.000141 µmol m−4 (ΔNO 10 m), −0.000115 µmol m−4 (ΔNO 10 m), and −0.0000135 µmol m−4 (ΔNO 10 m). The range of the diffusive transport of NO was calculated to be 0.00022–0.0022 µmol m−2 s−1 between 20 and 30 m, which could result in a concentration change of 0.021–0.21 µmol L−1 at 30 m for 11 d. Concentration changes between 30 and 40 m and between 40 and 50 m were calculated to be 0.013–0.13 µmol L−1 and 0.011–0.11 µmol L−1, respectively. The sum of the concentration changes at 30 m, including transport from the 20 m layer and from the 40 m layer, ranges from −0.20 µmol L−1 (−0.21 + 0.013) to +0.11 µmol L−1 (−0.021 + 0.13). The ranges of the sum of concentration changes at 40 and 50 m were from −0.12 to +0.096 µmol L−1 and from −0.11 to −0.024 µmol L−1, respectively. The observed decreases were 1.6 µmol L−1 at 30 m, 2.0 µmol L−1 at 40 m, and 2.4 µmol L−1 at 50 m between these dates. Thus, we concluded that diffusive transport of NO had a minor effect on the concentration decreases in the subsurface layer.
4.2.4 Subduction of surface water into the subsurface layer
Fourth, we discuss the possibility that the subduction of surface water caused a decrease in the nutrient concentrations in the subsurface layer (30–50 m) at observation station 30. At the medium depth (40 m) of the subsurface layer, the temperature, salinity, and density were 3.5–3.6 ∘C, 33.64, and 26.7σ, respectively, on 4 and 15 March (Fig. 2). If the surface water in certain area of the bay had subducted and reached 40 m depth at the observation station on 15 March, the subducted water would have had the same temperature, salinity, and density as at the surface. The average current speed at 40 m depth between these dates was 3.3 cm s−1 (unpublished data), which was obtained from an acoustic Doppler current profiler (ADCP) set on the seafloor at the station. Water anywhere in the bay could have reached the middle layer at the station within 11 d, where the water moved at the current speed of 3.3 cm s−1. We obtained the spatial distributions of temperature, salinity, and density at the sea surface (1 m) on 4 March using the ocean reanalysis product provided by the Meteorological Research Institute in Japan (Fig. 9a–c). From these spatial distributions, there were no areas that satisfied the abovementioned required temperature (3.5–3.6 ∘C), salinity (33.64), and density (26.7σ) criteria with respect to forming subduction water at 40 m depth at the observation station (see the enlarged map in Fig. 9c). We considered that the subsurface layer water at the station was not associated with subduction. Note that the modeled vertical profiles of temperature, salinity, and density were not in good agreement with the observed profiles (Fig. S3): based on the model results, the influence of low-salinity Oyashio water, which flowed on the surface of Funka Bay, was estimated to be stronger than the observational results. If the influence of Oyashio water had been as strong as the model indicated, the subsurface water (30–50 m) might have changed between 4 and 15 March 2019. We considered that the subsurface water remained stable between the aforementioned dates due to weak Oyashio water inflow.

Figure 9Horizontal distributions of (a) temperature, (b) salinity, and (c) density at the surface (1 m) of Funka Bay on 4 March 2019. Boundary lines at the 3.5–3.6 ∘C temperature range, at 33.6 salinity, and at 26.7σ density are shown in the respective figures. All boundary lines are shown in the enlarged figure of density. The location of the observation station is marked with a cross. The ocean reanalysis product, produced using an operational system for monitoring and forecasting the status of coastal and open-ocean waters around Japan (the JPN system), was provided by Meteorological Research Institute in Japan.
From the above discussions, we concluded that nutrient reductions in the dark subsurface layer between 4 and 15 March were mainly caused by nutrient consumption by diatoms in the dark.
4.3 The influence of nutrient consumption by diatoms in the dark subsurface layer
Nutrient uptake by diatoms in the dark subsurface layer after the peak of the bloom would have impacts on primary production and the distribution of phytoplankton during the bloom and post-bloom periods. We propose the following two alternative hypotheses to deduce the influence of nutrient uptake in the dark subsurface layer:
-
If the diatom population that had consumed half of the nutrients in the dark subsurface layer sank to the deeper layer during the bloom, primary production in the subsurface layer after the bloom (at which time this layer would be part of the euphotic zone) would be reduced by half at maximum compared with production if there was no nutrient consumption during the dark period.
-
If the diatoms that had consumed nutrients in the dark subsurface layer remained in that layer after the bloom or migrated to the upper layer, they could potentially undergo rapid growth under returning light conditions when the euphotic zone deepened after the bloom.
In the case of Funka Bay, we note that the consumption of nutrients in the dark subsurface layer would have an impact outside of the bay, as the subsurface water is exchanged with Oyashio water.
In relation to the second hypothesis, an interesting survival strategy for the diatom Rhizosolenia, which forms large aggregations (mats), has been proposed (Villareal et al., 1996; Richardson et al., 1998; Villareal et al., 1999, 2014): Rhizosolenia diatoms consume NO in the dark subsurface layer and then migrate to the euphotic zone where they have a growth advantage in oligotrophic subtropical open-ocean areas. The coastal marine diatom Thalassiosira weissflogii has also been studied to examine changes in buoyancy in relation to carbohydrate : protein ratios which determine the cell density (Richardson and Cullen, 1995). That study revealed that the accumulation of carbohydrate as a result of nitrate depletion leads to rises in cellular density and sinking speed and that the accumulation of protein as a result of nitrate addition after nitrate depletion leads to a positive buoyancy. A modeling study estimated that vertically migrating phytoplankton contribute 7 % of the net primary production at the subarctic gyre in the western Pacific (Witz and Lan Smith, 2020).
These previous studies (Villareal et al., 1996; Richardson et al., 1998; Villareal et al., 1999) have not yet found any evidence of a decrease in NO in the dark subsurface layer based on observations. If the diatom migration strategy hypothesis proposed by previous studies is true, the results of our study will provide evidence of a decrease in NO in the dark subsurface layer associated with the diatom migration strategy. As for the reduction in Si(OH)4 concentrations found in the dark subsurface layer of the Barents Sea, it has been suggested that diatoms settling from the surface consume Si(OH)4 in the dark subsurface layer to form spores (Rey and Skjoldal, 1987).
However, there is not yet sufficient observational data for a complete explanation. Thus, further research is needed to examine these possible strategies and their impacts on biogeochemical cycles.
We conducted repetitive observations in Funka Bay, Hokkaido, Japan, from 15 February to 14 April 2019 during and after the spring bloom. We found decreases in the nutrient concentrations in the dark subsurface layer both before and after the peak of the bloom and concluded that the latter reduction was caused by nutrient consumption in the dark by diatoms that had grown in the euphotic zone and then sank to the dark subsurface layer. We reached this conclusion using the following rationale:
-
From the dark-incubation experiments, we confirmed that the diatom Thalassiosira nordenskioeldii, which is one of the dominant diatom species in the Funka Bay bloom, could consume added nutrients in the dark at substantial rates after pre-culturing to deplete nutrients and that phytoplankton in nutrient-depleted natural seawater collected in the bay before the peak of diatom bloom on 8 March 2022 could also consume added nutrients in the dark. Although the consumption rates varied over a wide range, we concluded that the consumption of nutrients by diatoms in the dark subsurface layer had the potential to reduce nutrient concentrations by half in this layer (30–50 m).
-
We excluded water mixing, diffusive transport, and subduction as possible reasons for nutrient reduction in the subsurface layer between 4 and 15 March. First, the stratification between the surface and subsurface layers was strengthened after 4 March; therefore, we considered vertical mixing of water between the layers to be limited. The small decline in salinity at 30 m and no change in salinity at 40–50 m meant that mixing with low-salinity Oyashio water could not explain the nutrient reduction, even if the Oyashio water had no nutrients. Second, we estimated the diffusive transport of NO to have a minor effect on the concentration decrease in the subsurface layer. Third, we showed that there were no areas that satisfied the required surface temperature, salinity, and density criteria with respect to forming subduction water in the subsurface layer (medium depth of 40 m) at the observation station on 15 March 2019. Thus, we excluded subduction as the main reason for nutrient reduction.
The consumption of nutrients in the dark has been studied in many simulated in situ incubation experiments, with the goal of understanding the consumption of nutrients in the dark during a daily cycle within the euphotic zone. We believe that this is the first study to demonstrate observational evidence of consumption of the three main nutrients (NO, PO, and Si(OH)4) by diatoms in the dark subsurface layer during a bloom. This consumption could result in reduced new production in the subsurface layer after the bloom, when this layer would once again become part of the euphotic zone, if the diatoms sank to deeper layers. Further research is needed to examine the survival strategies of diatoms consuming nutrients in the dark subsurface layer.
The data sets used in this paper can be found at Zenodo: https://doi.org/10.5281/zenodo.7537961 (Ooki, 2023)
The supplement related to this article is available online at: https://doi.org/10.5194/bg-20-421-2023-supplement.
AO designed the research, conducted the observations, and undertook the diatom dark incubations. SU analyzed the data. YN prepared the axenic diatom culture for the dark incubations. MT, HA, and DN supported the data analysis. HA provided the spatial map of temperature, salinity, and potential density. HO provided the ADCP data. HO and TT designed the T/S Ushio-maru observations. AO and SU wrote the manuscript with contributions from all co-authors.
The contact author has declared that none of the authors has any competing interests.
Publisher's note: Copernicus Publications remains neutral with regard to jurisdictional claims in published maps and institutional affiliations.
We thank the captains and crews of T/S Ushio-maru (Hokkaido University). The first draft of this article was edited and reviewed by professional scientific editors (ELSS, Inc., Tsukuba, Japan).
This research was financially supported by the Hokusui Society Foundation (FY2018–FY2019 research projects), Sapporo, Japan, and by the Japan Society for the Promotion of Science (JSPS; KAKENHI grant nos. 16H02929 and 16H01586).
This paper was edited by Jack Middelburg and reviewed by Taketoshi Kodama and two anonymous referees.
Ban, S., Lee, H-W., Shinada, A., and Toda, T.: In situ egg production and hatching success of the marine copepod Pseudocalanus newmani in Funka Bay and adjacent waters off southwestern Hokkaido, Japan: associated to diatom bloom, J. Plankton Res., 22, 907–922, 2000.
Cochlan, W. P., Price, N. M., and Harrison, P. J.: Effects Of Irradiance On Nitrogen Uptake By Phytoplankton – Comparison Of Frontal And Stratified Communities, Mar. Ecol. Prog. Ser., 69, 103–116, https://doi.org/10.3354/meps069103, 1991.
Conway, H. L. and Whitledge, T. E.: Distribution, Fluxes And Biological Utilization Of Inorganic Nitrogen During A Spring Bloom In The New-York Bight, J. Mar. Res., 37, 657–668, 1979.
Cullen, J. J. and Horrigan, S. G.: Effects Of Nitrate On The Diurnal Vertical Migration, Carbon To Nitrogen Ratio, And The Photosynthetic Capacity Of The Dinoflagellate Gymnodinium-Splendens, Mar. Biol., 62, 81–89, https://doi.org/10.1007/bf00388169, 1981.
Dobashi, R., Ueno, H., Okada, Y., Tanaka, T., Nishioka, J., Hirawake, T., Ooki, A., Itoh, S., Hasegawa, D., Sasai, Y., Sasaki, H., and Yasuda, I.: Observations of anticyclonic eddies in the western subarctic North Pacific, J. Oceanogr., 77, 229–242, https://doi.org/10.1007/s10872-020-00586-y, 2021.
Hansen, H. P.: Determination of oxygen, in: The methods of seawater analysis, edited by: Grasshoff, K., Kremling, K., and Ehrhard, M., WILEY – VCH Verlag GmbH, 75–89, https://doi.org/10.1002/9783527613984.ch4, 1999.
Harrison, P. J., Whitney, F. A., Tsuda, A., Saito, H., and Tadokoro, K.: Nutrient and plankton dynamics in the NE and NW gyres of the subarctic Pacific Ocean, J. Oceanogr., 60, 93–117, https://doi.org/10.1023/B:JOCE.0000038321.57391.2a, 2004.
Hioki, N., Kuma, K., Morita, Y., Miura, D., Ooki, A., Tanaka, S., Onishi, H., Takatsu, T., Kobayashi, N., and Kamei, Y.: Regeneration dynamics of iron and nutrients from bay sediment into bottom water of Funka Bay, Japan, J. Oceanogr., 71, 703–714, https://doi.org/10.1007/s10872-015-0312-6, 2015.
Hirose, N., Sakamoto, K., Usui, N., Yamanaka, G., and Kohno, N.: The 10-year reanalysis dataset of an operational system for monitoring and forecasting coastal and open-ocean status around Japan (JPN Atlas 2020), Technical Reports Of The Meteorological Research Institute No.83, Meteorological Research Institute, Japan Meteorological Agency, https://doi.org/10.11483/mritechrepo.83, 2020.
Japan Meteorological Agency: meteorological data archives, https://www.data.jma.go.jp/obd/stats/etrn/index.php/, last access: 15 January 2023.
Kudo, I. and Matsunaga, K.: Environmental factors affecting the occurrence and production of the spring phytoplankton bloom in Funka Bay, Japan, J. Oceanogr., 55, 505–513, 1999.
Kudo, I., Yoshimura, T., Yanada, M., and Matsunaga, K.: Exhaustion of nitrate terminates a phytoplankton bloom in Funka Bay, Japan: change in SiO4 : NO3 consumption rate during the bloom, Mar. Ecol. Prog. Ser., 193, 45–51, https://doi.org/10.3354/meps193045, 2000.
Kudo, I., Yoshimura, T., Lee, C. W., Yanada, M., and Maita, Y.: Nutrient regeneration at bottom after a massive spring bloom in a subarctic coastal environment, Funka Bay, Japan, J. Oceanogr., 63, 791–801, https://doi.org/10.1007/s10872-007-0067-9, 2007.
Kudo, I., Hisatoku, T., Yoshimura, T., and Maita, Y.: Primary productivity and nitrogen assimilation with identifying the contribution of urea in Funka Bay, Japan, Estuar. Coast. Shelf Sci., 158, 12–19, https://doi.org/10.1016/j.ecss.2015.03.012, 2015.
Maita, Y. and Odate, T.: Seasonal changes in size fractionated primary production and nutrient concentrations in the temperate neritic water of Funka Bay, Japan, J. Oceanogr. Soc. Jpn., 44, 268–279, 1988.
Marra, J.: The compensation irradiance for phytoplankton in nature, Geophys. Res. Lett., 31, L06305, https://doi.org/10.1029/2003gl018881, 2004.
Miyake, H., Yanada, M., Nishi, T., and Hoshizawa, K.: Short-time variation in low trophic level productivity and hydrographic conditions in Funka Bay, Mem. Fac. Fish. Hokkaido Univ., 45, 36–41, 1998.
Nakada, S., Ishikawa, Y., Awaji, T., In, T., Koyamada, K., Watanobe, M., Okumura, H., Nishida, Y., and Saitoh, S. I.: An integrated approach to the heat and water mass dynamics of a large bay: High-resolution simulations of Funka Bay, Japan, J. Geophys. Res.-Ocean., 118, 3530–3547, https://doi.org/10.1002/jgrc.20262, 2013.
Nelson, D. M. and Conway, H. L.: Effects of the light regime on nutrient assimilation by phytoplankton in the Baja California and Northwest Africa upwelling systems, J. Mar. Res., 37, 301–318, 1979.
Nishioka, J., Ono, T., Saito, H., Sakaoka, K., and Yoshimura, T.: Oceanic iron supply mechanisms which support the spring diatom bloom in the Oyashio region, western subarctic Pacific, J. Geophys. Res.-Ocean., 116, C02021, https://doi.org/10.1029/2010jc006321, 2011.
Odate, T.: Temporal and horizontal distribution of the diatom community during the spring bloom in Funka Bay, southern Hokkaido, Bull. Plank. Soc. Jpn., 34, 33–42, 1987.
Odate, T, Yanada, M., Mizuta, H., and Maita, Y.: Phytoplankton carbon biomass estimated from the size-fractionated chlorophyll a concentration and cell density in the northern coastal waters from spring bloom to summer, Bull. Plank. Soc. Jpn., 39, 127–144, 1993.
Ohtani, K.: Studies on the change of the hydrographic conditions in the Funka Bay, II. Characteristics of the water occupying the Funka Bay, Bull. Fac. Fish., Hokkaido Univ., 22, 58–66, 1971 (in Japanese).
Ohtani, K. and Kido, K.: Oceanographic structure in Funka Bay, Bull. Fac. Fish. Hokkaido Univ., 31, 84–114, 1980 (in Japanese with English abstract).
Ooki, A.: Funka Bay observation bottle data (Nutrients, chlorophyll-a, and oxygen) from February to April of 2019, Zenodo [data set], https://doi.org/10.5281/zenodo.7537961, 2023.
Ooki, A., Shida, R., Otsu, M., Onishi, H., Kobayashi, N., Iida, T., Nomura, D., Suzuki, K., Yamaoka, H., and Takatsu, T.: Isoprene production in seawater of Funka Bay, Hokkaido, Japan, J. Oceanogr., 75, 485–501, https://doi.org/10.1007/s10872-019-00517-6, 2019.
Ooki, A., Miyashita, N., Umezawa, S., Tozawa, M., Nosaka, N., Nomura, D., Onishi, H., Abe, H., and Takatsu, T.: Isoprene production in the water column and sediment in Funka Bay, Hokkaido, Japan, Geochem. J., 56, 142–150, https://doi.org/10.2343/geochemj.GJ22013, 2022.
Regaudie-De-Gioux, A. and Duarte, C. M.: Compensation irradiance for planktonic community metabolism in the ocean, Global Biogeochem. Cy., 24, GB4013, https://doi.org/10.1029/2009gb003639, 2010.
Rey, F. and Skjoldal, H. R.: Consumption of silicic-acid below the Euphotic Zone by sedimenting diatom blooms in the Barents Sea, Mar. Ecol. Prog. Ser., 36, 307–312, https://doi.org/10.3354/meps036307, 1987.
Richardson, T. L. and Cullen, J. J.: Changes in buoyancy and chemical composition during growth of a coastal marine diatom: Ecological and biogeochemical consequences, Mar. Ecol. Prog. Ser., 128, 77–90, https://doi.org/10.3354/meps128077, 1995.
Richardson, T. L., Cullen, J. J., Kelley, D. E., and Lewis, M. R.: Potential contributions of vertically migrating Rhizosolenia to nutrient cycling and new production in the open ocean, J. Plank. Res., 20, 219–241, https://doi.org/10.1093/plankt/20.2.219, 1998.
Rosa, A. L., Isoda, Y., Uehara, K., and Aiki, T.: Seasonal variations of water system distribution and flow patterns in the southern sea area of Hokkaido, Japan, J. Oceanogr., 63, 573–588, https://doi.org/10.1007/s10872-007-0051-4, 2007.
Shimizu, Y., Ooki, A., Onishi, H., Takatsu, T., Tanaka, S., Inagaki, Y., Suzuki, K., Kobayashi, N., Kamei, Y., and Kuma, K.: Seasonal variation of volatile organic iodine compounds in the water column of Funka Bay, Hokkaido, Japan, J. Atmos. Chem., 74, 205–225, https://doi.org/10.1007/s10874-016-9352-6, 2017.
Spall, M. A.: A diagnostic study of the wind-driven and buoyancy-driven north-atlantic circulation, J. Geophys. Res.-Ocean., 96, 18509–18518, https://doi.org/10.1029/91jc01957, 1991.
Thomson, R. E. and Fine, I. V.: Estimating mixed layer depth from oceanic profile data, J. Atmos. Ocean. Technol., 20, 319–329, https://doi.org/10.1175/1520-0426(2003)020<0319:emldfo>2.0.co;2, 2003.
Villareal, T. A., Woods, S., Moore, J. K., and CulverRymsza, K.: Vertical migration of rhizosolenia mats and their significance to NO fluxes in the central north Pacific gyre, J. Plank. Res., 18, 1103–1121, https://doi.org/10.1093/plankt/18.7.1103, 1996.
Villareal, T. A., Pilskaln, C., Brzezinski, M., Lipschultz, F., Dennett, M., and Gardner, G. B.: Upward transport of oceanic nitrate by migrating diatom mats, Nature, 397, 423-425, https://doi.org/10.1038/17103, 1999.
Villareal, T. A., Pilskaln, C. H., Montoya, J. P., and Dennett, M.: Upward nitrate transport by phytoplankton in oceanic waters: balancing nutrient budgets in oligotrophic seas, Peerj, 2, e302, https://doi.org/10.7717/peerj.302, 2014.
Welschmeyer, N. A.: Fluorometric analysis of chlorophyll a in the presence of chlorophyll b and pheopigments, Limnol. Oceanogr., 39, 1985–1992, https://doi.org/10.4319/lo.1994.39.8.1985, 1994.
Wirtz, K. and Lan Smith, S.: Vertical migration by bulk phytoplankton sustains biodiversity and nutrient input to the surface ocean, Sci. Rep., 10, 1142, https://doi.org/10.1038/s41598-020-57890-2, 2020.
Yoshimura, T. and Kudo, I.: Seasonal phosphorus depletion and microbial responses to the change in phosphorus availability in a subarctic coastal environment, Mar. Chem., 126, 182–192, https://doi.org/10.1016/j.marchem.2011.06.003, 2011.