the Creative Commons Attribution 4.0 License.
the Creative Commons Attribution 4.0 License.
 | 18 Oct 2023
Above-treeline ecosystems facing drought: lessons from the 2022 European summer heat wave
Philippe Choler
In 2022, a large part of Europe experienced an extremely dry and hot summer. In the Alps, this episode occurred after an unusually low-snowfall winter, which aggravated the dryness of soils. This study examines the impact of this particular year on the canopy greenness of above-treeline ecosystems by comparison with previous heat waves that hit the Alps during the last 2 decades. Normalized difference vegetation index (NDVI) time series derived from the Moderate Resolution Imaging Spectroradiometer (MODIS) satellite were processed to extract the temporal variability in yearly maximum NDVI (NDVImax). The responsiveness of NDVImax to snow cover duration and growing-season weather conditions was evaluated in contrasting hydroclimate regions of the Alps using linear mixed-effect models. The year 2022 was unique in that the summer heat wave led to a widespread negative anomaly of NDVImax. The magnitude of this anomaly was unprecedented in the southwestern, driest part of the Alps, where vegetation activity was found to be particularly responsive to snow cover duration and early summer precipitation. In the colder and wetter regions, all warm to very warm summers before 2022 had led to increased canopy greenness, but the combination of a reduced snow cover and low early summer precipitation counteracted this expected beneficial effect in 2022. This study provides evidence that the control of canopy greenness by temperature and water balance differs markedly across regions of the Alps and that the year 2022 bears witness to a shift toward an increasing importance of moisture availability for regulating plant growth at high elevation. This is viewed as a warning sign of what could become the new norm in the years ahead in the context of increasing frequency and intensity of extreme droughts throughout temperate mountain ecosystems.
- Article
(2722 KB) - Full-text XML
-
Supplement
(590 KB) - BibTeX
- EndNote


A severe heat wave and drought hit a large part of the Northern Hemisphere during the 2022 summer (Lu et al., 2023). Over the last 2 decades, similar long-lasting warm and dry summer events have been recorded in Europe, such as in 2003 and 2015, and the recurrence of these events has no equivalent in the last centuries (Buntgen et al., 2021). In a warmer climate, it is widely acknowledged that the duration, frequency, and intensity of extreme meteorological events will increase and that an increasing proportion of lands will be affected (Coumou and Rahmstorf, 2012; Russo et al., 2014). The combination of drought and heat has an overall negative effect on the gross primary productivity of terrestrial ecosystems (von Buttlar et al., 2018). However, a range of factors are known to modulate ecosystem responses, for example the type of vegetation, its sensitivity to water and temperature, the phenological period during which extreme events occur, and the soil moisture content during warm episodes (Sippel et al., 2018, 2016; Von Buttlar et al., 2018). Most of these factors operate at a local scale, rendering a comprehensive analysis of these impacts particularly challenging.
The primary productivity of above-treeline ecosystems is primarily controlled by temperature and the length of the growing season (Churkina and Running, 1998; Choler, 2015; Myers-Smith et al., 2015). Over the last decades, most of these ecosystems have benefitted from warmer conditions during the snow-free period – and this all the more so as the rate of warming is particularly pronounced at high elevation (Beniston, 2005; Pepin et al., 2015). As a result, a long-term increase in fractional vegetation cover and primary productivity has been documented in temperate mountains using remote sensing studies (Choler et al., 2021; Anderson et al., 2020; Zhong et al., 2019) and vegetation surveys (Rogora et al., 2018; Steinbauer et al., 2018), although contrary results exist (Lamprecht et al., 2018). In terms of seasonal variation, several reports have outlined the positive effects of very warm summers on the peak productivity of high-elevation ecosystems (Jolly et al., 2005b; Corona-Lozada et al., 2019). However, these reports also highlighted marked regional differences in ecosystem responsiveness, suggesting that other factors in addition to temperature are modulating the interannual variations in their primary productivity. When drought coincides with heat wave, the positive effects of a warm summer fade away, and this is more likely to happen in the driest and warmest parts of mountain ranges (Jolly et al., 2005b; Corona-Lozada et al., 2019; De Boeck et al., 2016; Cremonese et al., 2017). Other reports examining ecosystem phenology (Fu et al., 2015) or radial growth of mountain shrubs (Francon et al., 2021) also suggested that carbon gain has become more sensitive to water availability in the last decades. All these results call for further investigation to determine where and when water availability becomes a co-dominant limiting factor of primary productivity at high elevation.
Above-treeline temperate ecosystems are seasonally snow-covered ecosystems, characterized by complex interactions between snowmelt dynamics and vegetation properties, including plant distribution, growth, and functional traits (Jonas et al., 2008; Walker et al., 1993; Choler, 2015). On the one hand, early snowmelt can be beneficial to canopy greenness as it increases the favorable period for carbon gain. On the other hand, it may exacerbate the dryness of soils and the exposure to early frosts, both of which are detrimental to plant growth (Francon et al., 2020). Regarding prolonged snow cover duration, the negative effect of a short growing season can be partially or totally compensated by an increasing rate of early growth because of enhanced water supply and nutrient availability liberated by the snowpack during the optimal, warm growth period. Understanding this interplay between snow cover duration and meteorological conditions during the early summer is pivotal in order to disentangle the underlying causes of variability in the vegetation productivity of above-treeline ecosystems.
Long-term ground surveys of primary productivity are notoriously difficult to carry out in complex high-elevation terrain, and the few data available cannot inform us about the trends and their geographical variations at the massif scale. Earth observation is the only way to evaluate how ecosystems have responded to extreme events and to what extent this response varies across regions. Medium-resolution remotely sensed data with daily revisiting times have proven useful to track snow cover dynamics and vegetation activity in arctic and alpine ecosystems (Beck et al., 2006; Choler, 2015; Xie et al., 2020). Specifically, the peak value of vegetation indices is commonly used as a proxy for annual maximum canopy greenness, capturing vegetation growth occurring during the first part of the growing season (Tucker, 1979; Rossini et al., 2012). This approach provides an avenue for developing empirical models of canopy greenness with the aim of unraveling the relative importance of snow and meteorological drivers to vegetation activity at a broad spatial scale (Choler, 2015; Xie et al., 2020; Fu et al., 2021).
In the European Alps, previous remote sensing approaches have mainly focused on the long-term trends of greenness (Choler et al., 2021) and between-site variations in ecosystem phenology (Xie et al., 2020). By contrast, there has been no comprehensive study examining the interannual variability in canopy greenness, its sensitivity to extreme events, and the extent to which this sensitivity differs among regions. The European Alps provide an interesting case study to address these questions given the variety of hydroclimate subregions (Rubel et al., 2017). The Alps exhibit strong gradients of precipitation between the wet external ranges and the rather dry inner alpine valleys (Isotta et al., 2014), as well as the influence of the Mediterranean climate in southern regions, whereas the northeastern ranges are exposed to oceanic influences (Brunetti et al., 2006; Hiebl et al., 2009). In this context, I addressed three main questions. (i) What were the effects of the 2022 heat wave and drought on the canopy greenness of above-treeline ecosystems in the European Alps and to what extent did these effects differ from those observed during previous extreme events? (ii) What is the sensitivity of these ecosystems to interannual variation in snow cover, water availability, and temperature? (iii) Does the relative strength of these drivers differ between the contrasting bioclimatic subregions of the European Alps?
I delineated bioclimate clusters for the European Alps using growing-season climate variables. Then, I evaluated the variability in canopy greenness using the annual peak value of the normalized difference vegetation index (NDVImax) of the Moderate Resolution Imaging Spectroradiometer (MODIS) for the period 2000–2022. I used the ERA5-Land reanalyses to evaluate early summer meteorological conditions. Finally, I developed a linear mixed-effect (lme) model to assess the effects of snow cover duration, water stress, and temperature on the variability in productivity in the different bioclimate clusters and over the MODIS period.
2.1 Study area
This study focuses on the above-treeline ecosystems of the European Alps, a mountain range stretching over 1200 km from Nice (France) to Vienna (Austria). The 250 m resolution MOD09Q1 products in the native sinusoidal projection were used as a reference grid to select the pixels of interest based on ancillary data. I used the Tree Cover Density of the year 2018 (https://land.copernicus.eu/en/products/high-resolution-layer-tree-cover-density, last access: 11 October 2023) to extract non-forested pixels (< 5 %) and a 25 m resolution digital elevation model to discard non-forested pixels below the natural treeline. The elevation of the natural treeline was set for each latitudinal band according to the polynomial regression given in Korner (1998). To account for locally lower treeline positions, I also included non-forested pixels located 100 m lower than the regression line. Very sparsely vegetated pixels with a long-term average NDVImax below 0.15 showed inconsistent annual peaks of greenness and were discarded. Densely vegetated pixels with a NDVImax above 0.75 were also removed because the sensitivity of NDVImax to canopy greenness decreases when biomass is high due to saturation issues (Huete et al., 2002). The final dataset comprised 227 318 pixels. According to the 100 m resolution land cover product of Copernicus Global Land Service (CGLS) (Buchhorn et al., 2020), the selected pixels were a majority of herbaceous vegetation and a minority of sparsely vegetated areas (Supplement Table S1). I calculated pairwise dissimilarities between NDVI time series using Euclidean distance and used the Partition Around Medoids algorithm of the Cluster R package (Maechler et al., 2022) to identify clusters. This allowed me to check that selected pixels exhibited the characteristic phenology of seasonally snow-covered vegetated ecosystems, i.e., with an abrupt rise in greenness after snowmelt and a maximum NDVImax achieved at the end of July–early August (Supplement Fig. S1).
2.2 Snow and climate datasets
I used CHELSA v2.1 and CHELSA-BIOCLIM+ datasets (Brun et al., 2022; Karger et al., 2021) to retrieve the climate averages of the reference period 1981–2010. CHELSA is a high-resolution climatology that provides downscaled surface variable estimates at a horizontal resolution of 30 arcsec (Karger et al., 2017). The following variables were used to characterize the summer (June, July, and August) climate in the study area: mean daily air temperatures (bio10), mean monthly precipitation amount (bio18), surface downwelling shortwave radiation (rsds), and vapor pressure deficit (vpd). To identify climate subregions, I computed pairwise dissimilarities between observations using Euclidean distance and performed a cluster analysis with the Partition Around Medoids algorithm of the Cluster R package (Maechler et al., 2022). I varied the number of prescribed clusters from four to nine. For the sake of simplicity, results are only presented for six clusters. This was a fair compromise between a fine-scale regionalization and a sufficient number of pixels per cluster for further analyses.
I used ERA5-Land gridded datasets to estimate early summer meteorological conditions during the MODIS period. ERA5-Land is a process-based, climate reanalysis providing 0.1∘ resolution variables related to the energy and water balance of land surfaces (Muñoz-Sabater et al., 2021). The study area encompassed 1053 ERA5-Land cells (Table S1). I extracted the pre-calculated monthly means of air temperature (T2M), monthly accumulation of precipitation (PRE), and potential evapotranspiration (PET) for the months of June and July, i.e., the early growing season. In the absence of available data on soil water capacity, I calculated the difference between PRE and PET, which represents atmospheric water balance used as a proxy for plant water availability during the early summer and which is hereafter referred to as WBA. Using daily products, I also computed a heat wave index (HWI) for the June–July period. This index, proposed by Russo et al. (2014), accounts for the magnitude and duration of heat waves. It was calculated following the simplified methodology described in Corona-Lozada et al. (2019). Briefly, heat waves corresponded to sequences of at least 3 consecutive days during which the maximum daily air temperature was above the eighth decile for the reference period (1981–2010). For each heat wave, I computed the difference between the daily maximum air temperature and the eighth decile and summed all these differences for the June–July period.
To evaluate the interannual variability in snow cover extent, I extracted the number of snow-covered days during the first 6 months of the year from the 8 d composite MODIS Terra (MOD10A1) Collection 6 products (Riggs et al., 2016). The estimate is based on a 500 m resolution Normalized Difference Snow Index, an indicator of the snow cover that uses the blue and middle-infrared bands (Salomonson and Appel, 2004).
2.3 Variability in MODIS-derived NDVImax
The study exploits MOD09Q1 Terra Collection 6 products, which consist of 250 m resolution 8 d composites of the Moderate Resolution Spectroradiometer (MODIS) sensor on board the Terra satellite. The decision to select this particular product was justified due to its extended time coverage starting from the year 2000, the short revisit period of 1–2 d, and the moderate spatial resolution. Specifically, these attributes enabled (i) the comparison of several heat waves over the past 23 years, including the significant one in 2003; (ii) the analysis of abrupt changes in vegetation during the brief growing season at high elevation; and (iii) the implementation of a more robust statistical analysis of the drivers of NDVI response in a topographically heterogeneous landscape. To the best of my knowledge, achieving these outcomes would not have been feasible with alternative remote sensing products like those provided by the Copernicus Global Land Service. MODIS data are distributed by the Land Processes Distributed Active Archive Center (https://e4ftl01.cr.usgs.gov/). I downloaded images from 18 February 2000 to 31 December 2022 for the tiles h18.v4 and h19v04 to cover the European Alps. Reflectance values (ρ) in the red and infrared bands that were produced at high quality (according to the MOD09Q1 Quality Control flag) were used to generate raw NDVI time series, i.e., the ratio (). A vast range of techniques now exists to reduce the noise of these NDVI time series, and it is important to examine the sensitivity of the retrieved NDVI metrics to the chosen algorithms (Zeng et al., 2020). Here, I compared two curve-fitting methods: the Savitzky–Golay (SG) smoother (Savitzky and Golay, 1964; Chen et al., 2004), based on a local window, and the Whittaker (Wh) smoother (Eilers, 2003; Whittaker, 1922), which utilizes a penalized least square regression on the whole time series. For the SG smoother, I varied the window size from 7 to 14 observations and a polynomial degree (filter order) of n= 3. For the Wh smoother, I varied the lambda parameter from 5 to 15 and used a second-order difference. The weight update function of TIMESAT was used for successive iterations (Jonsson and Eklundh, 2004), and I compared results after three and five iterations. Finally, I extracted the following annual metrics from the denoised time series and for each pixel: the start of the season (SOS) as the first day of the year when NDVI surpasses 15 % of NDVImax and the maximum NDVI of the growing season (NDVImax). I used the MODIStsp R package (Busetto and Ranghetti, 2016) to download the native hdf MOD09Q1 files and the phenofit R package (Kong et al., 2023) to process raw NDVI time series.
As this study focuses on variability, an important initial step consisted of detrending NDVImax time series. The NDVImax variability for a given data span is defined as the residue of the NDVImax after the removal of the trend (Wu et al., 2007). For each pixel, I fitted a monotonic function of NDVImax over time using both the whole data span (22 years) and subperiods of 13 years. I used either the non-parametric Theil–Sen estimator or a least-squares estimator to assess the linear trend, the first being often preferred when data strongly depart from normality (Hirsch et al., 1991). The final results were not affected by this choice, and I only showed the results produced with the non-parametric method implemented in the Kendall R package (Mcleod, 2005). Our previous study based on the same raw dataset (Choler et al., 2021) showed that NDVImax trends were robust to a ±5 % perturbation of the red and infrared reflectances, a value which corresponds to uncertainties associated with MODIS products (Miura et al., 2000), and so I did not reiterate this numerical simulation for this paper.
To test for a collective, or per cluster, significance of anomaly, I used a test based on the counting of signs (Huth and Dubrovsky, 2021). This test allows for fast computing and performs as well as other tests such as the false detection rate (Wilks, 2016) when spatial autocorrelation is moderate (Huth and Dubrovsky, 2021). To limit spatial autocorrelation, all tests were based on the random sampling of 10 % of pixels per cluster, and I report the median value of the statistics. The null hypothesis states that the number of pixels showing a positive anomaly will not significantly differ from the number of sites showing a negative one and therefore will follow a binomial distribution with parameters p= 0.5 and N the number of trials corresponding to the number of sites that were randomly sampled per cluster. A two-tailed binomial test allowed for calculating the probability of the alternative hypothesis, i.e., that positive anomalies may be either greater than or less than negative anomalies.
2.4 Linear mixed-effect modeling
I implemented a linear mixed-effect (lme) model to characterize the variability in NDVImax over time within pixels and its variation between clusters. Lme models extend linear models by allowing for fixed and random effects in a hierarchical design. The lme model can be expressed as the following:
where Y is the response or dependent variable, X is predictors or fixed effects, β is the size of the fixed effects, Z is a matrix of random effects that depends on data structure, γ is the size of the random effects, and ε is a vector of unobserved random errors. I tested the following fixed effects: snow cover (MSE), air temperature (T2M), heat wave index (HWI), precipitation (PRE), and atmospheric water balance (WBA), i.e., the difference between PRE and PET. I also included an interaction term between a temperature-related variable and a water-related variable. Random effects included clusters as the main effect, hereafter CLU, and an interaction between cluster and cells specifying that cells are grouped within clusters. Because NDVImax and predictors were not available at the same spatial resolution (250 m vs. 9 km for ERA5, and 500 m for MSE), I computed the median value of NDVImax per ERA5 cell and used this median as the response variable. When ERA5 cells included MODIS pixels belonging to different bioclimate clusters, I assigned to that cell the cluster containing the highest number of pixels. Complementary lme models were also fitted for specific subsets of MODIS pixels based on (i) the long-term average of NDVImax (0.15–0.35; 0.35–0.55; 0.55–0.75) to enable comparison of ecosystem responses along a gradient of fractional vegetation cover and (ii) the value of the diurnal anisotropic index (DAH) to enable comparison of ecosystem responses along a gradient of exposure to solar radiation (Böhner and Antonić, 2009).
All models were fitted using standardized anomalies of the response and the predictors. A stepwise procedure was used in which I first tested whether a random structure was justified and subsequently whether including a particular fixed effect or an interaction between fixed effects was justified. The comparison of competing models was based on the Akaïke information criteria (AIC), and I retained models with the lowest AIC score. Models were fitted by maximizing the restricted log-likelihood with the lme function of the nlme R package (Pinheiro et al., 2022). The Broyden–Fletcher–Goldfarb–Shanno (BFGS) algorithm was chosen for nonlinear optimization. Model parameters, variance explained by the fixed effects (or marginal variance), and variance explained by both fixed and random effects (or conditional variance) were estimated using the MuMIn R package (Barton, 2023).
The cluster analysis of summer climate revealed a marked precipitation gradient that stretched from the southwestern to the northeastern Alps (Fig. 1). Along with the decrease in precipitation, there was a strong increase in shortwave radiation. These two gradients were not only driven by latitude. For a given latitude, external ranges are wetter and less sunny than the dry inner valleys, indicating that the well-known rain shadow effect was correctly captured by the CHELSA high-resolution climate model. The summer temperature gradient did not fully coincide with the precipitation gradient because of an overlapping effect of elevation occurring locally. This explained for example the difference between the two dry clusters (2 and 3), the latter including pixels at lower elevation compared to the former. In the colder and wetter context of the northeastern Alps, the same contrast was observed between clusters 5 and 6 (Fig. 1).
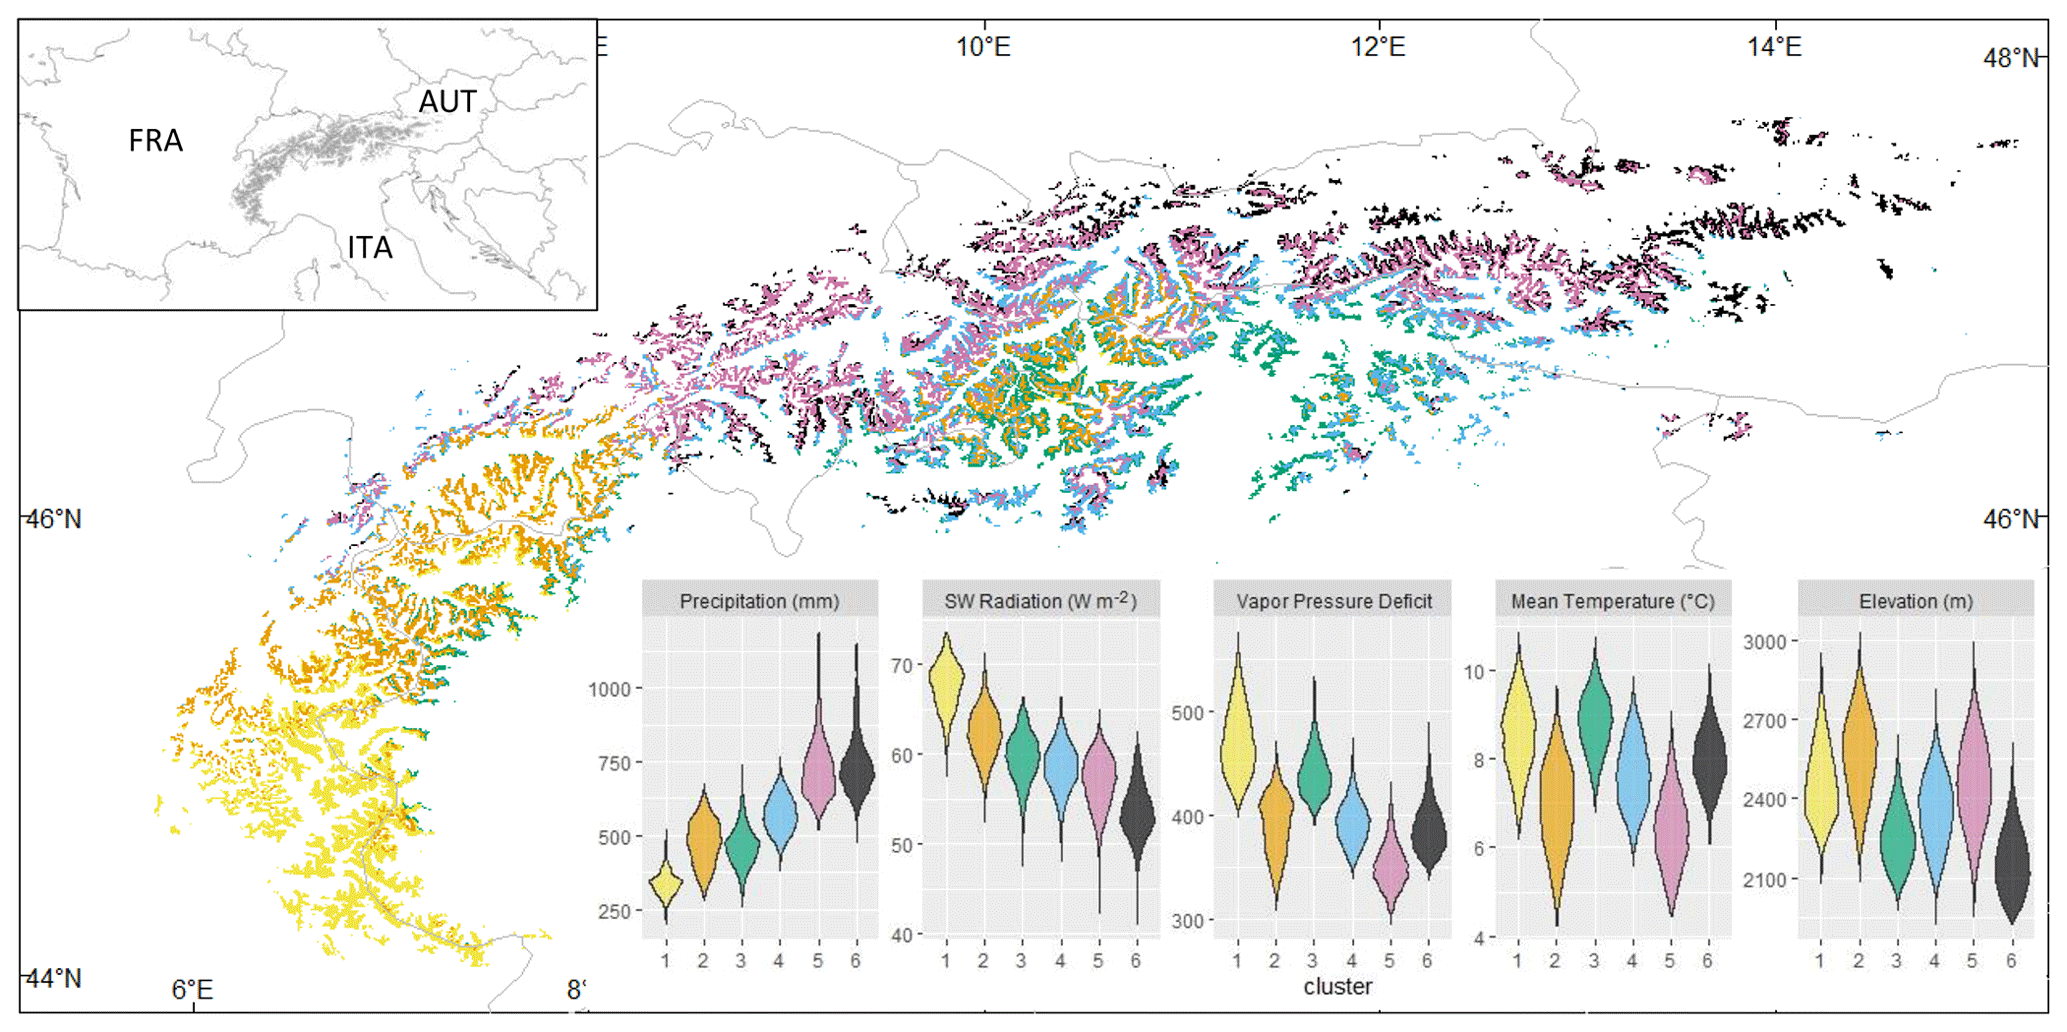
Figure 1Geographical distribution of above-treeline ecosystems in the European Alps and delineation of the six subregions based on the clustering of summer climate averages for the 30-year reference period (1981–2010). The top-left panel shows the study area's location. Violin plots in the lower-right panels depict the distribution of summer climate normals across the six subregions. The climate information utilized was sourced from the high-resolution climatology dataset CHELSA v2.1.
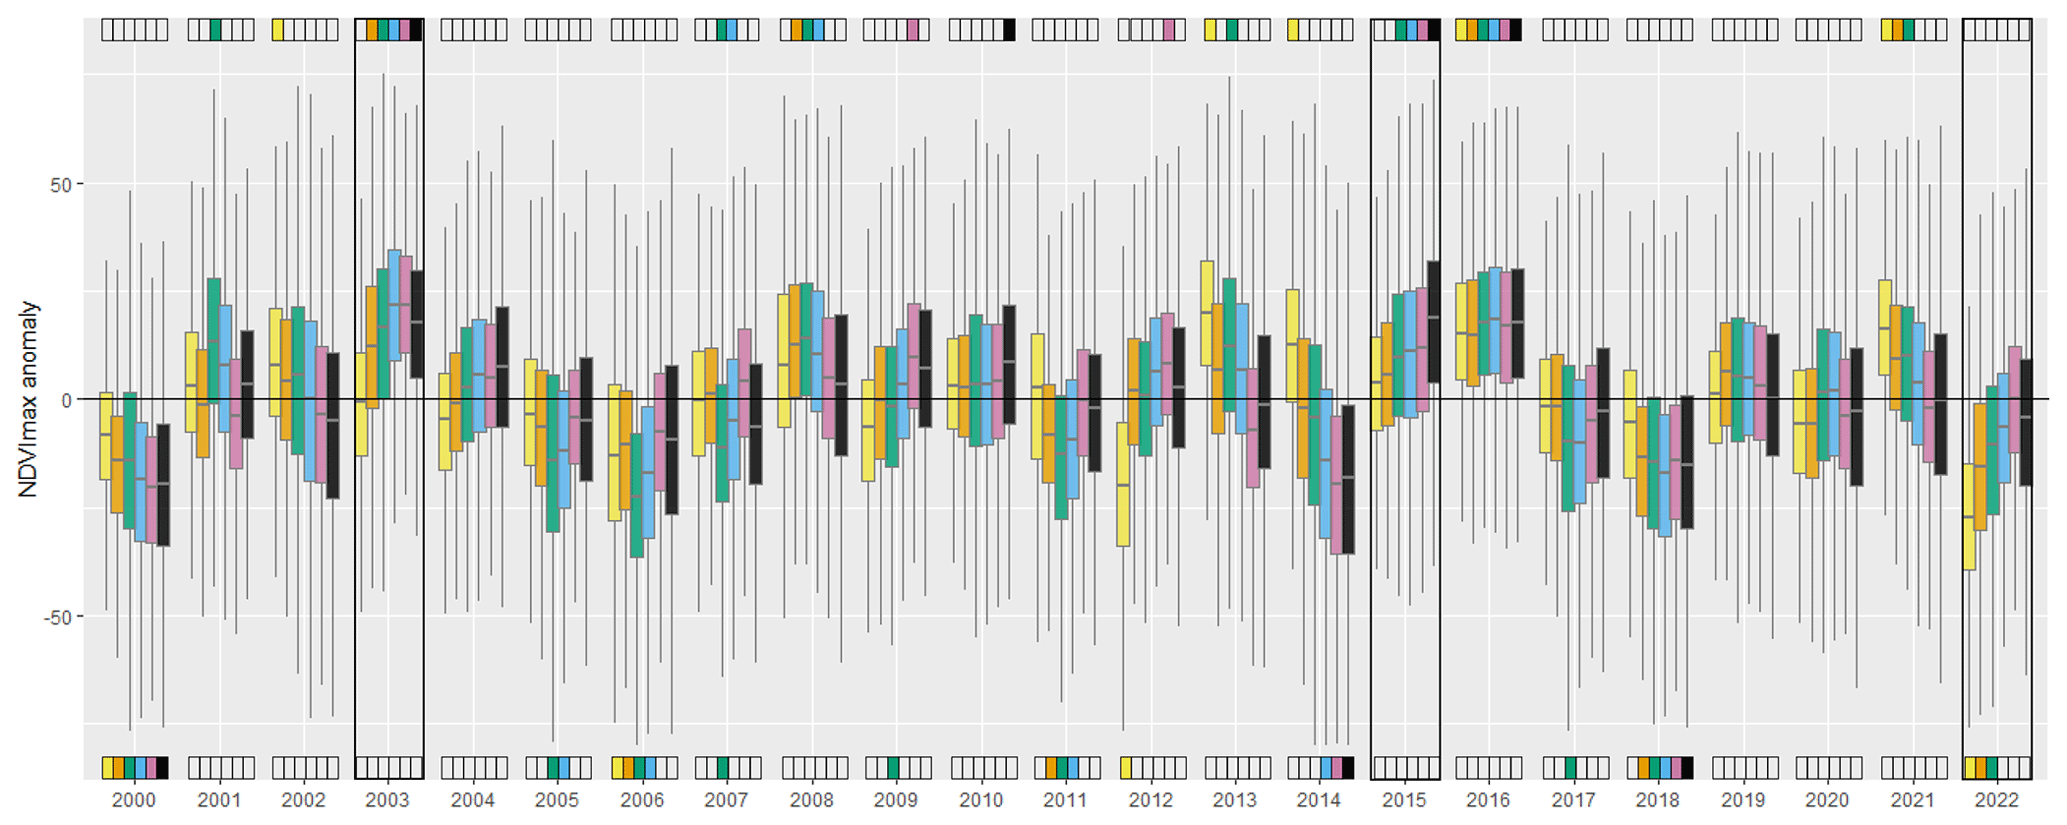
Figure 2Anomalies of NDVImax (yearly maximum value of NDVI) for the six climate clusters identified in the European Alps. The NDVImax time series underwent detrending using a monotonic function, and the anomalies illustrate the difference from the established trend. The values are scaled by a factor of 1000. The upper (lower) colored indicators signify whether the anomaly, per cluster, was significantly above (or below) 0, as based on a counting-of-signs test applied to a randomly sampled 10 % of pixels within each cluster. To enhance clarity, the colored indicators only highlight the most significant results (P < 0.001). Three rectangles point to the occurrences of three major heat wave events that occurred in the Alps over the last 2 decades. See Fig. 1 for the color legends of the clusters.
NDVImax anomalies for the period 2000–2022 are presented for each climate cluster (Fig. 2). The year 2022 was characterized by a widespread, negative NDVImax anomaly and by the lowest NDVImax anomaly ever recorded for cluster 1. This was in sharp contrast with the 2003 and 2015 summer heat waves, when the NDVImax anomalies were either significantly positive (clusters 3, 4, 5, 6) or not significantly different from 0 (clusters 1, 2). Noticeably, the ranking of NDVImax anomalies during these three warm years closely aligned with the warm/dry to cold/wet gradient; i.e., there was an increasing value of NDVImax anomaly as one goes from cluster 1 to cluster 5 (or 6). An opposite pattern was found for cold and wet years, such as in 2013, 2014, and 2021, when the NDVImax anomaly of dry and warm clusters was systematically above that of cold and wet ones (Fig. 2).
Figure 3 presents the relationships between anomalies of NDVImax and anomalies of snow cover duration and early summer conditions for clusters 1 and 6, i.e., the two clusters lying at the extremes of the climate gradients (see Fig. S3 for the other four clusters). For cluster 1, the four best years for NDVImax were associated with a positive water balance (Fig. 3b). The year 2011 was an exception, which could be explained by the relatively cold conditions prevailing in the early summer (Fig. 3c). The two worst years for NDVImax were 2022, which combined early snowmelt with a negative water balance and high temperatures later in the summer, and 2001, which was characterized by very early snowmelt (Fig. 3a). For cluster 6, the opposite situation was found with three of the four warmer summers (2003, 2006, 2010, and 2015) associated with a significantly positive NDVImax anomaly (Fig. 3f). In 2006, it is plausible that this effect was offset by a very negative water balance (Fig. 3e). As for cluster 1, early snowmelt was associated with a negative anomaly, although the year 2006 marked an exception (Fig. 3d).
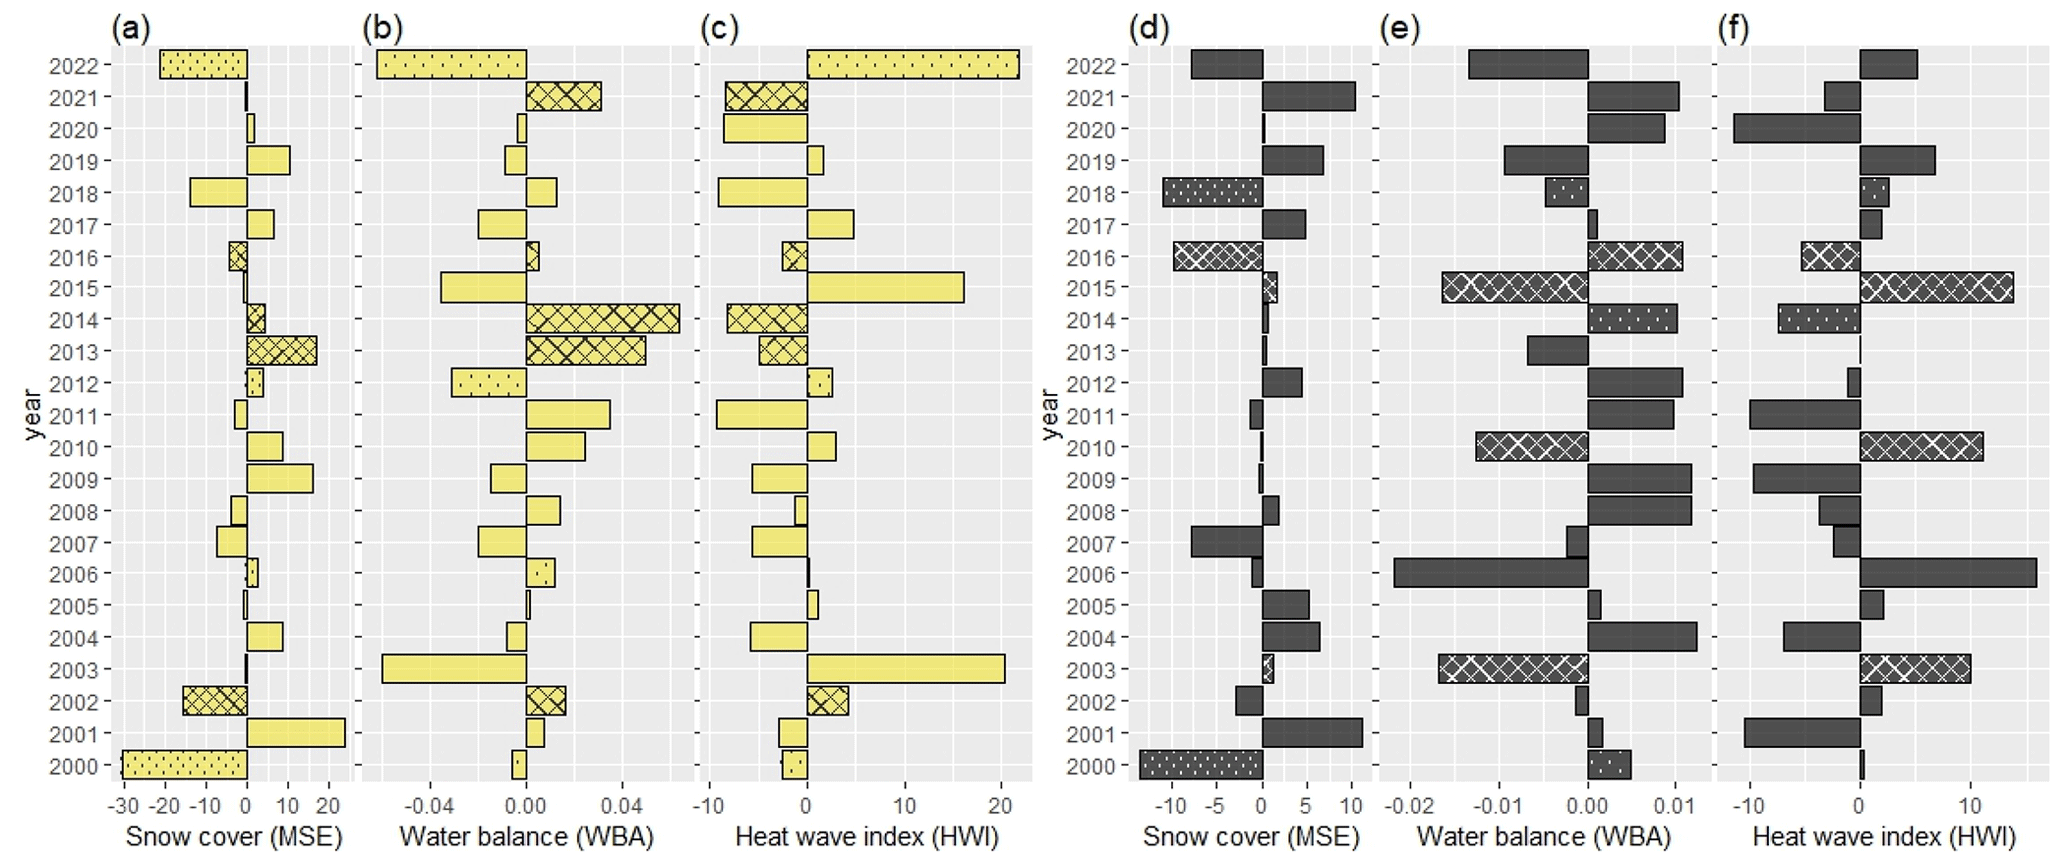
Figure 3Anomalies in the duration of snow cover extent (MSE), the summer atmospheric water balance (WBA), and the heat wave index (HWI) for climate cluster 1 (a, b, c) and cluster 6 (d, e, f). Crosshatched bars indicate significant positive anomalies in NDVImax, while dotted bars indicate significant negative anomalies. Comparable visualizations for the remaining clusters can be found in Fig. S2.
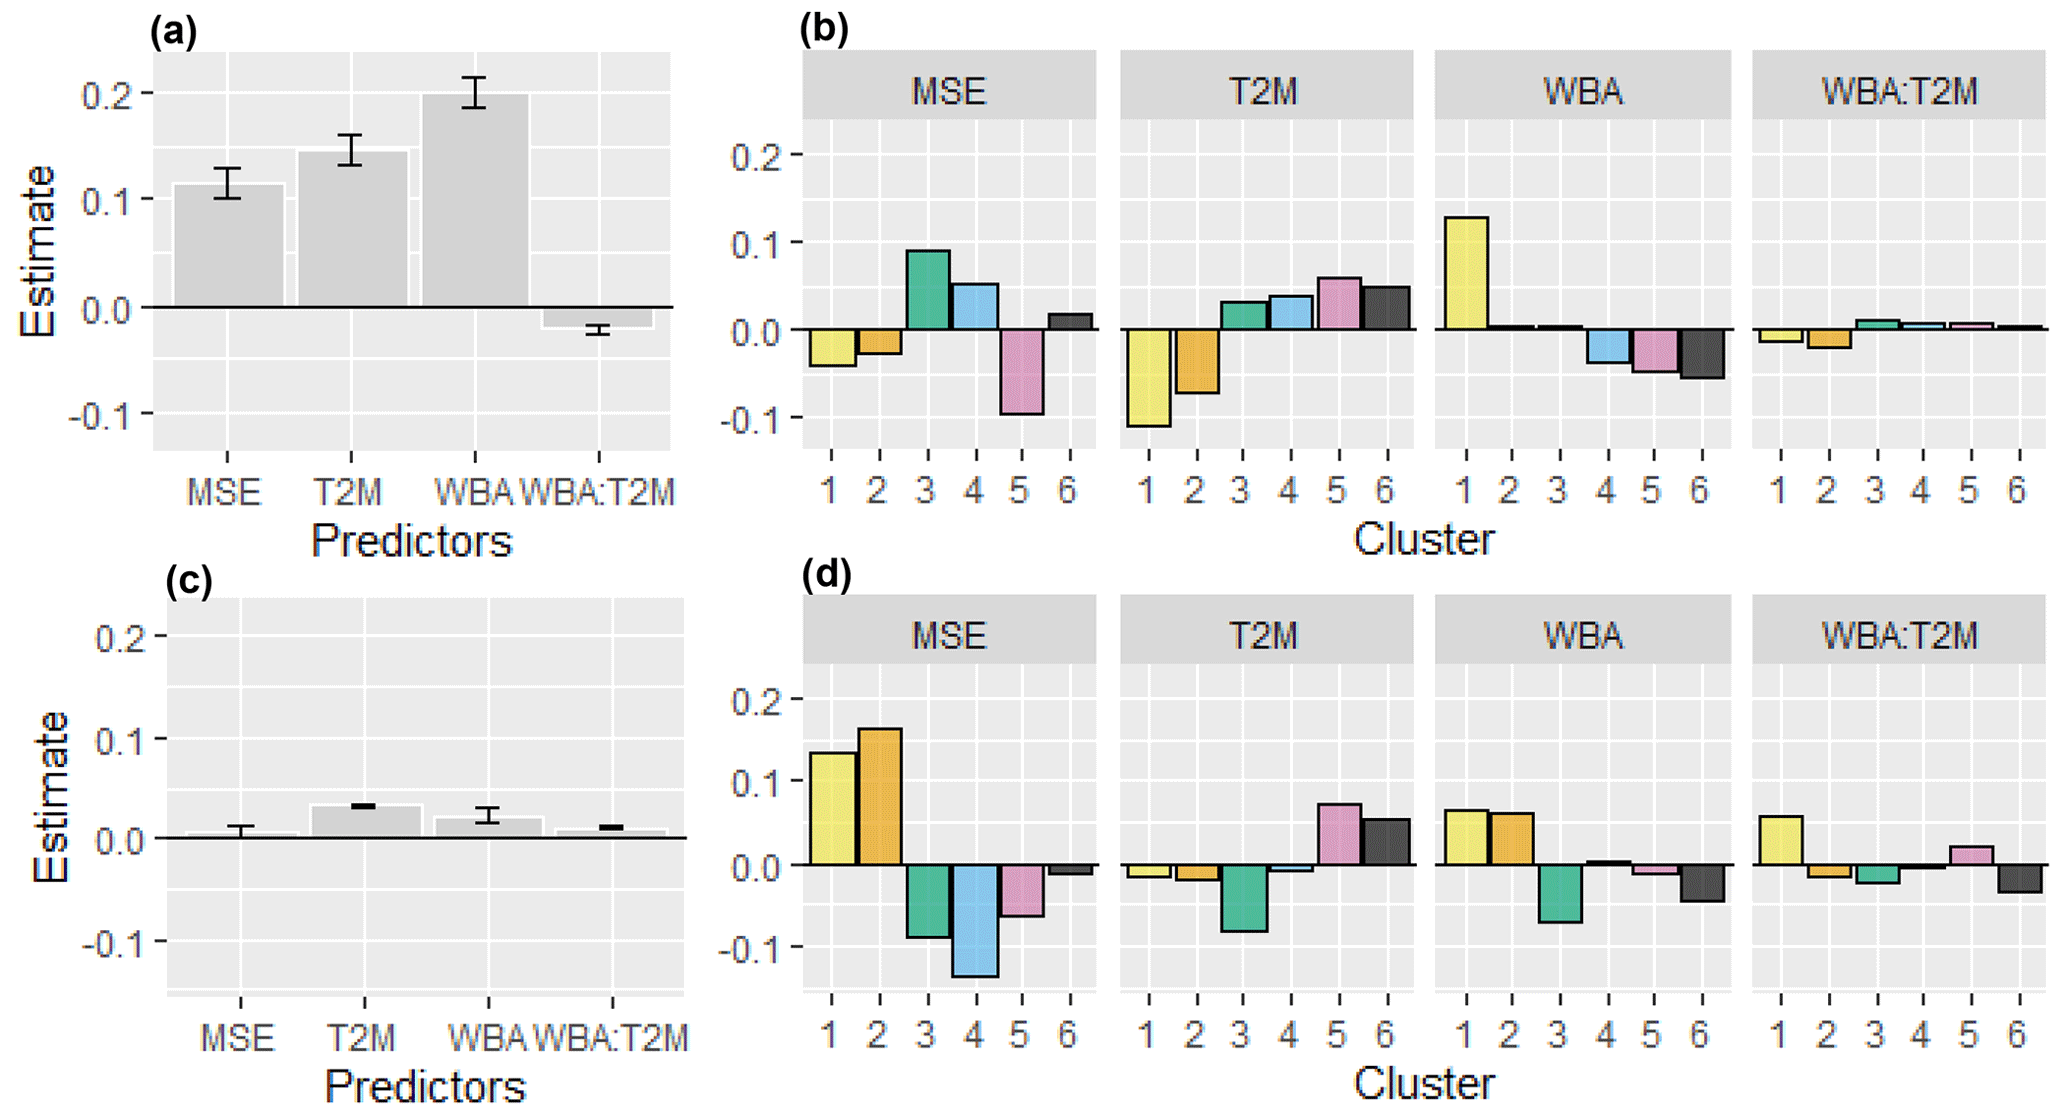
Figure 4Predictors of NDVImax variability. The panels display the estimates of the fixed effects (gray bars) and of the cluster random effects (colored bars) for the snow cover extent (MSE), the summer air temperature (T2M), the summer atmospheric water balance (WBA), and the interaction between WBA and T2M. Panels (a) and (b) present results for the entire period (2000–2022), while panels (c) and (d) show the differences in the estimates between the second 13-year period (2011–2022) and the first 13-year period (2000–2012). The results correspond to those achieved in the best linear mixed-effect model outlined in Table 1. Further details can be found in the “Material and methods” section.
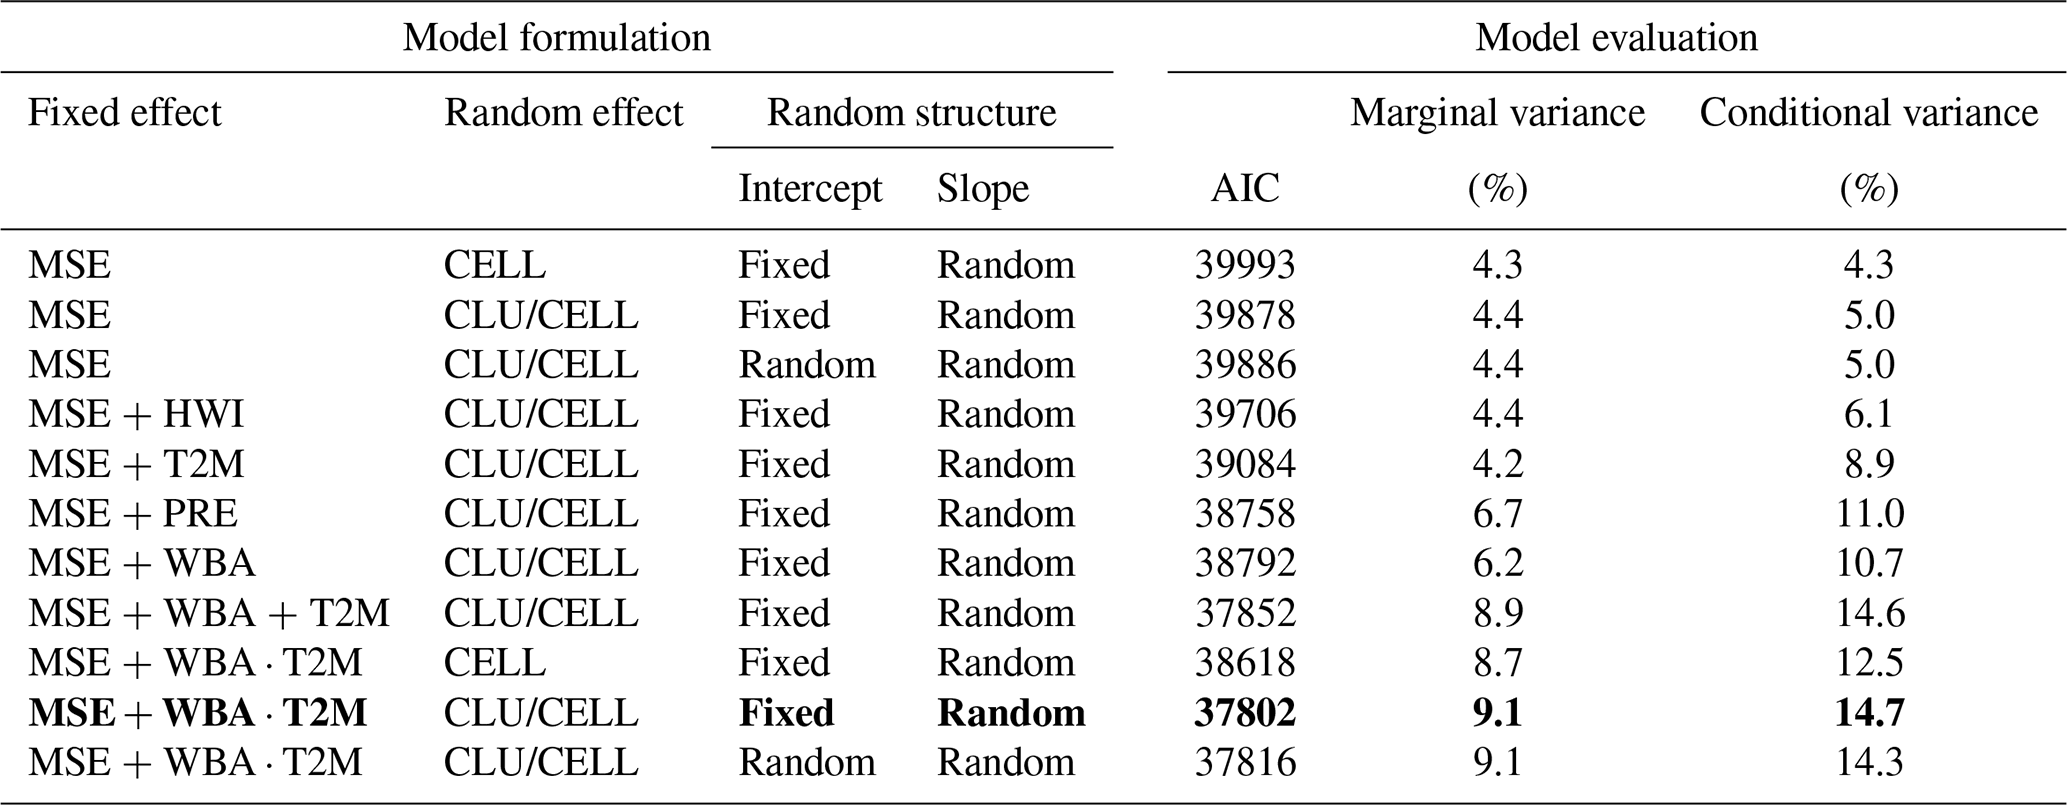
Results from the linear mixed-effect model provided a quantitative analysis of the drivers of NDVImax variability. Models including a hierarchical random structure, i.e., clusters and cells within clusters, performed significantly better than models without (Table 1). The water-related variable (WBA) and the temperature-related variable (T2M) were better predictors than PRE and HWI, respectively (Table 1). The model exhibiting the lowest AIC included the three fixed effects (MSE, WBA, and T2M), the interaction between WBA and T2M, and random slopes. The variance explained by the fixed effects, or marginal variance, was 9.1 % and that including fixed and random effects, or conditional variance, was 14.7 % (Table 1). Overall, the fixed effects MSE, WBA, and T2M were significantly positive, and the interaction between WBA and T2M was significantly negative (Fig. 4a, Table S2). These findings were highly robust to the parameters used for NDVI curve-fitting methods (Table S3).
Table 1Structure and evaluation of competing linear mixed-effect models to characterize the variability in NDVImax for above-treeline ecosystems of the European Alps. Models were fitted using response and predictors for a total of 1053 cells (CELL) within six bioclimate clusters (CLU). MSE: maximum snow cover extent for the first 6 months; PRE: precipitation; WBA: atmospheric water balance (the difference between precipitation and potential evapotranspiration); T2M: air temperature; HWI: heat wave index. Meteorological variables correspond to total (PRE, WBA, HWI) or means (T2M) for the early summer months of June–July. The model in bold with the lowest AIC is the selected model. The Savitzky–Golay smoother was used as the NDVI curve-fitting method.
Noticeably, the size of the random effect cluster showed considerable variations for WBA and T2M (Fig. 4b). For WBA, there was a shift from high to low sensitivity along the southwest to northeast gradient (clusters 1 to 6), and an inversely related shift from low to high sensitivity for T2M. The negative interaction between WBA and T2M was stronger in the southernmost clusters (1 and 2), meaning that the negative effect of temperature was amplified when the positive effect of water availability was strong. By contrast, a positive interaction for cluster 5 was indicative of a synergistic effect of temperature and water availability. The lowest sensitivity to MSE was detected in cluster 5, which combines cold and wet conditions (Fig. 1).
The comparison of lme models fitted for the first (2000–2012) and the second (2011–2022) periods showed a slight increase in the fixed-effect estimates (Fig. 4c). Changes were more noticeable at the cluster level, with an increasing sensitivity to MSE and WBA for the two driest clusters (1 and 2) and a somewhat reverse pattern for the other clusters (Fig.4d). Finally, temperature showed more positive effects in the recent period for clusters 5 and 6, whereas trends were negligible for the other clusters.
Using a remote sensing approach, I carried out a comprehensive analysis of year-to-year variation in canopy greenness of above-treeline ecosystems in the European Alps, with a special emphasis on vegetation responses to the summer heat waves and extreme droughts that have affected the range during the last 2 decades. First, I showed that the positive effect of warm summers on plant growth vanishes when water becomes limited. This was particularly noticeable in 2022, a year of a negative NDVImax anomaly that sharply contrasted to what happened during the previous heat waves in 2003 and 2015. Second, the shift from water-limited growth in the southwestern Alps to temperature-limited growth in the northeastern Alps parallels the shift from warm/dry to cold/wet bioclimate gradient in the range. Finally, I provided evidence that water-limited ecosystems are increasingly sensitive to interannual variations in water availability, whereas the most temperature-limited ecosystems are still benefitting from recent warm summers.
4.1 Causes of NDVImax variability
Phenomenologically, between-site differences in NDVImax anomalies have two possible causes: (i) contrasting exposure to the key factors controlling canopy greenness and (ii) the different sensitivity of ecosystems to these factors. The lme model supported the second explanation, considering that the fixed effects, which quantify the sensitivity of canopy greenness to drivers, differed between the bioclimate clusters. Global-scale assessments of vegetation sensitivity to climate have pointed out the high sensitivity of arctic and alpine ecosystems to temperature and cloud cover (Higgins et al., 2023; Seddon et al., 2016). The present study provides a more balanced picture, accounting for water availability and highlighting important subregional variability in the drivers/limiting factors of canopy greenness for above-treeline ecosystems. The spatial variability was consistent with Liebig's law of the minimum, which states that growth is primarily controlled by the most limiting resource. In the southernmost part of the study area, water balance is a strong co-limiting factor of canopy greenness, and the high temperatures recorded during heat waves exacerbate the negative impact of drought on NDVImax. In the northeastern part of the massif, vegetation activity still benefits from hot summers, a finding that aligns with previous observations of cold ecosystems (Jolly et al., 2005b).
Although the model captured broad-scale patterns of ecosystem responsiveness, a large part of the NDVImax variability remained unexplained, which could be attributed to multiple causes. First, land surface meteorological variables are notoriously difficult to model at high elevation because of the scarcity of available observations and the importance of processes that depend on topography and that are not accounted for by climate reanalyses (Vionnet et al., 2019). The ERA5-Land products have proven useful for capturing the main features of surface variable trends in the European Alps (Monteiro and Morin, 2023) and have outcompeted other climate gridded products, such as E-OBS, in areas where the density of weather stations is low (Bandhauer et al., 2022), as is the case in the southwestern Alps. However, its coarse spatial resolution limits its usefulness for representing local heterogeneity in bioclimatic conditions on the ground. Further efforts should strive to reduce the mismatch between the spatial resolution of climate drivers and that of remotely sensed vegetation indices. One possible approach includes the statistical downscaling of climate variables to MODIS resolution using a digital elevation model (Baba et al., 2018).
Further unexplained NDVImax variability could be attributed to the fact that each pixel includes a variety of plant communities that may respond differently to climate. To tackle this issue, we need a deeper and more process-based understanding of interactions between vegetation and climate variables in order to produce microclimate layers at the landscape scale (Zellweger et al., 2019; Lenoir, 2020). Several studies have emphasized how biotic–abiotic interactions shape the microclimate variables that are key for controlling the functioning of cold ecosystems, such as woody vegetation trapping windblown snow (Beringer et al., 2001; Sturm et al., 2001; Lett et al., 2020). Of utmost importance will be improved modeling of soil moisture and soil temperature dynamics in heterogeneous mountain landscapes. Unfortunately, this is currently hampered by our very poor knowledge of key mountain soil properties, such as soil water capacity or thermal conductivity. Finally, we overlooked the possibility that variability in canopy greenness might reflect interannual variability in land management practices. Summer grazing is the dominant form of land-use in the study area. Although a decline in mountain livestock systems has been reported in parts of the European Alps (Tappeiner et al., 2008), no dataset is available to depict trends and anomalies in stocking rates and land management at the scale of the European Alps. So far, there is limited evidence that grazing activity has a significant effect on the NDVImax of mountain grasslands in the southwestern Alps (Carlson et al., 2017), probably because extensive grazing by sheep predominates. Further studies should examine whether similar patterns are observed in more intensively managed livestock systems.
4.2 Sensitivity of canopy greenness to snow cover
My findings pointed out an overall positive effect of snow cover on canopy greenness. Snow cover is a complex ecological factor having multiple direct and indirect effects on vegetation activity and phenology (Gao et al., 2013; Choler, 2015; Walker et al., 1993). Control of the length of the growing season, reduced risk of early frosts because of snow's insulating properties, and supply of water and nutrients by the melting snowpack are among the most commonly cited processes. While many studies have examined the sensitivity of the timing of spring leaf unfolding to snow cover duration (Jolly et al., 2005a; Fu et al., 2021, 2015; Currier and Sala, 2022; Xie et al., 2020; Stockli and Vidale, 2004), the effect of snow cover duration on the maximum canopy greenness, i.e., peak biomass, has received less attention. Trujillo et al. (2012) reported on the positive response of mountain forests to snowy winters in California's Sierra Nevada. Similar responses were recorded in the forested ecosystems of central Siberia (Grippa et al., 2005). It was also suggested that negative anomalies of snow cover do not cascade to increased canopy greenness likely because the intrinsic growth constraints limit the ability of alpine plants to benefit from early snowmelt (Baptist et al., 2010). In mountain grasslands, I previously showed that a low amount of NDVImax variance was explainable by the interannual variations in snow cover duration, essentially because faster growth after a delayed snowmelt and a slower growth after an early snowmelt both resulted in similar NDVImax values. However, this study was carried out on a more limited spatial (French Alps) and temporal (2000–2012) scale (Choler, 2015). The present results suggest greater sensitivity to snow cover, especially in the driest areas. It is likely that negative anomalies of snow cover duration in the recent warm years resulted in more detrimental effects than before because of increasing evaporative demand during the early summer. In the context of declining snow cover in the European Alps (Matiu et al., 2021), one may expect increasing detrimental effects of early snowmelt, particularly in the driest parts of the range.
4.3 Impact of drought on long-term greening trends
Over the last 2 decades, a significant increase in NDVImax has been detected for most of the above-treeline ecosystems of the European Alps (Choler et al., 2021). Similar greening trends have been detected in arctic ecosystems though with large spatial heterogeneity (Berner et al., 2020; Myers-Smith et al., 2011). In the Alps, these trends were attributed to the combination of summer warming, maintained snow cover duration at high elevation (above 1800 m), and the density-dependent nature of plant cover increase. Interestingly, the southwestern Alps, which are shown here to be the most sensitive region to drought, were also previously identified as a hotspot of greening (Choler et al., 2021). The present results suggest that recurrent dry years may halt or even reverse this greening trend, calling for the need for ongoing earth observation monitoring in order to identify potential break points (Filippa et al., 2019). Recent observed decreases in global net primary productivity trends have been attributed to drought in the context of water-sensitive ecosystems (Zhao and Running, 2010). Transitions from greening to browning trends were observed by de Jong et al. (2013) in several water-limited regions including Patagonia, the Sahel, and northern Kazakhstan. Even if no major trend in precipitation has so far been detected in the Alps over the last decades, warmer summer temperatures will lead to increased evaporative demand, with detrimental effects on vegetation activity in the driest regions. Additional studies are needed to further investigate how decadal trends in climate and short-term responses of vegetation to meteorological extremes interact to influence trajectories of high-elevation plant growth. A recent account from Poppe et al. (2023) demonstrated increasing water use efficiency in European grasslands, with the most positive trends observed in highly productive grasslands. In areas combining fast greening (i.e., trends of primary productivity) and evidence of water limitation, it would be of particular interest to examine whether vegetation changes lead to a functional shift toward drought tolerance and to changes in water use efficiency. In the European Alps, the Global Observation Research Initiative in Alpine Environments (GLORIA) provides long-term surveys of the summit flora (Pauli et al., 2005) and would offer opportunities to tackle this issue, if water-related functional plant attributes were documented.
This study shows that the drought accompanying the most recent 2022 heat wave had unprecedented negative impacts on the canopy greenness of above-treeline ecosystems in the European Alps. This main finding emerged from a broader attempt to improve our understanding of the drivers of interannual variation in vegetation activity and their geographical variations across different subregions of the Alps. Although the developed model proved useful to capture the contribution of temperature- and water-related variables at this broad scale, it fell short of predicting the substantial amount of local variability that is detectable using remote sensing. Efforts should be devoted toward improved representation of the local conditions that matter for plant growth in complex mountain landscapes. High-spatial-resolution products such as Sentinel-2 will undoubtedly contribute to address this issue. In this line of thought, better accounting for the interplay between snowmelt dynamics, soil water availability, and local temperature is pivotal. I anticipate that the implementation of such fine-grained soil climate layers will enable us to take greater advantage of remotely sensed proxies for vegetation activity, allowing us to develop empirical models of ecosystem functioning and to forecast how these ecosystems will respond to the increasing frequency and intensity of extreme meteorological events during the coming years.
The estimates of NDVImax climate layers and all ancillary data for selected pixels (coordinates, attribution to climate clusters) are available at https://doi.org/10.5281/zenodo.8170661 (Choler, 2023). All other data used in this study were from the following open-access sources: CHELSA products (https://chelsa-climate.org/bioclim/, CHELSA, 2023), ERA5 Land (https://cds.climate.copernicus.eu/cdsapp#!/home, Copernicus Climate Data Store, 2023), MODIS products (https://e4ftl01.cr.usgs.gov/, NASA's Land Processes Distributed Active Archive Center, 2023), and Copernicus Global Land Service products (https://land.copernicus.eu/en/products/high-resolution-layer-tree-cover-density, Copernicus Land Monitoring Service, 2023).
The supplement related to this article is available online at: https://doi.org/10.5194/bg-20-4259-2023-supplement.
The author has declared that there are no competing interests.
Publisher’s note: Copernicus Publications remains neutral with regard to jurisdictional claims in published maps and institutional affiliations.
Thanks are due to Brad Carlson, Arthur Bayle, and Simon Gascoin for fruitful discussions during the preparation of this paper. This work received funding from the LIFE PASTORALP project (LIFE16 CCA/IT/000060) and from the Agence Nationale de la Recherche (ANR) in the framework of the project TOP, Trajectories of agrO-Pastoral systems in mountains (ANR-20-CE32-0002). LECA is part of the Recherche Labex OSUG@2020 (IA-10-LABX-0056).
This research has been supported by the Agence Nationale de la Recherche (project TOP, Trajectories of agrO-Pastoral systems in mountains, grant no. ANR-20-CE32-0002) and by the European Commission LIFE program (PASTORALP project – LIFE16 CCA/IT/000060). LECA is supported by the Agence Nationale de la Recherche (grant nos. Labex OSUG@2020 and IA-10-LABX-0056).
This paper was edited by Erika Buscardo and reviewed by two anonymous referees.
Anderson, K., Fawcett, D., Cugulliere, A., Benford, S., Jones, D., and Leng, R. L.: Vegetation expansion in the subnival Hindu Kush Himalaya, Glob. Change Biol., 26, 1608–1625, https://doi.org/10.1111/gcb.14919, 2020.
Baba, M. W., Gascoin, S., Jarlan, L., Simonneaux, V., and Hanich, L.: Variations of the Snow Water Equivalent in the Ourika Catchment (Morocco) over 2000–2018 Using Downscaled MERRA-2 Data, Water, 10, 1120, https://doi.org/10.3390/w10091120, 2018.
Bandhauer, M., Isotta, F., Lakatos, M., Lussana, C., Baserud, L., Izsak, B., Szentes, O., Tveito, O. E., and Frei, C.: Evaluation of daily precipitation analyses in E-OBS (v19.0e) and ERA5 by comparison to regional high-resolution datasets in European regions, Int. J. Climatol., 42, 727–747, https://doi.org/10.1002/joc.7269, 2022.
Baptist, F., Flahaut, C., Streb, P., and Choler, P.: No increase in alpine snowbed productivity in response to experimental lengthening of the growing season, Plant Biol., 12, 755–764, https://doi.org/10.1111/j.1438-8677.2009.00286.x, 2010.
Barton, K.: MuMIn: multi-model inference, R package version 1.47.2/r505. https://R-Forge.R-project.org/projects/mumin/ (last access: 11 October 2023), 2023.
Beck, P. S. A., Atzberger, C., Hogda, K. A., Johansen, B., and Skidmore, A. K.: Improved monitoring of vegetation dynamics at very high latitudes: A new method using MODIS NDVI, Remote Sens. Environ., 100, 321–334, https://doi.org/10.1016/j.rse.2005.10.021, 2006.
Beniston, M.: Mountain climates and climatic change: An overview of processes focusing on the European Alps, Pure Appl. Geophys., 162, 1587–1606, 2005.
Beringer, J., Lynch, A. H., Chapin, F. S., Mack, M., and Bonan, G. B.: The representation of arctic soils in the land surface model: The importance of mosses, J. Climate, 14, 3324–3335, https://doi.org/10.1175/1520-0442(2001)014<3324:troasi>2.0.co;2, 2001.
Berner, L. T., Massey, R., Jantz, P., Forbes, B. C., Macias-Fauria, M., Myers-Smith, I., Kumpula, T., Gauthier, G., Andreu-Hayles, L., Gaglioti, B. V., Burns, P., Zetterberg, P., D'Arrigo, R., and Goetz, S. J.: Summer warming explains widespread but not uniform greening in the Arctic tundra biome, Nat. Commun., 11, 4621, https://doi.org/10.1038/s41467-020-18479-5, 2020.
Böhner, J. and Antonić, O.: Land-surface parameters specific to topo-climatology, Dev. Soil Sci., 33, 195–226, 2009.
Brun, P., Zimmermann, N. E., Hari, C., Pellissier, L., and Karger, D. N.: CHELSA-BIOCLIM+ A novel set of global climate-related predictors at kilometre-resolution, EnviDat [data set], https://doi.org/10.16904/envidat.332, 2022.
Brunetti, M., Maugeri, M., Nanni, T., Auer, I., Bohm, R., and Schoner, W.: Precipitation variability and changes in the greater Alpine region over the 1800–2003 period, J. Geophys. Res.-Atmos., 111, D11107, https://doi.org/10.1029/2005jd006674, 2006.
Buchhorn, M., Lesiv, M., Tsendbazar, N. E., Herold, M., Bertels, L., and Smets, B.: Copernicus Global Land Cover Layers-Collection 2, Remote Sensing, 12, 1044, https://doi.org/10.3390/rs12061044, 2020.
Buntgen, U., Urban, O., Krusic, P. J., Rybnicek, M., Kolar, T., Kyncl, T., Ac, A., Konasova, E., Caslavsky, J., Esper, J., Wagner, S., Saurer, M., Tegel, W., Dobrovolny, P., Cherubini, P., Reinig, F., and Trnka, M.: Recent European drought extremes beyond Common Era background variability, Nat. Geosci., 14, 190–196, https://doi.org/10.1038/s41561-021-00698-0, 2021.
Busetto, L. and Ranghetti, L.: MODIStsp: An R package for automatic preprocessing of MODIS Land Products time series, Comput. Geosci., 97, 40–48, 2016.
Carlson, B. Z., Corona, M. C., Dentant, C., Bonet, R., Thuiller, W., and Choler, P.: Observed long-term greening of alpine vegetation-a case study in the French Alps, Environ. Res. Lett., 12, 114006, https://doi.org/10.1088/1748-9326/aa84bd, 2017.
CHELSA: Bioclim, https://chelsa-climate.org/bioclim/ (last access: 15 October 2023), 2023.
Chen, J., Jonsson, P., Tamura, M., Gu, Z. H., Matsushita, B., and Eklundh, L.: A simple method for reconstructing a high-quality NDVI time-series data set based on the Savitzky-Golay filter, Remote Sens. Environ., 91, 332–344, 2004.
Choler, P.: Growth response of temperate mountain grasslands to inter-annual variations in snow cover duration, Biogeosciences, 12, 3885–3897, https://doi.org/10.5194/bg-12-3885-2015, 2015.
Choler, P.: Above-treeline ecosystems facing drought: lessons from the European 2022 summer heatwave, Zenodo [data set], https://doi.org/10.5281/zenodo.8170661, 2023.
Choler, P., Bayle, A., Carlson, B. Z., Randin, C., Filippa, G., and Cremonese, E.: The tempo of greening in the European Alps: Spatial variations on a common theme, Glob. Change Biol., 27, 5614–5628, https://doi.org/10.1111/gcb.15820, 2021.
Churkina, G. and Running, S. W.: Contrasting climatic controls on the estimated productivity of global terrestrial biomes, Ecosystems, 1, 206–215, 1998.
Copernicus Climate Data Store: ERA5 Land, https://cds.climate.copernicus.eu/cdsapp#!/home (last access: 15 October 2023), 2023.
Copernicus Land Monitoring Service: High Resolution Layer Tree Cover Density, https://land.copernicus.eu/en/products/high-resolution-layer-tree-cover-density (last access: 15 October 2023), 2023.
Corona-Lozada, M. C., Morin, S., and Choler, P.: Drought offsets the positive effect of summer heat waves on the canopy greenness of mountain grasslands, Agr. Forest Meteorol., 276, 107617, https://doi.org/10.1016/j.agrformet.2019.107617, 2019.
Coumou, D. and Rahmstorf, S.: A decade of weather extremes, Nat. Clim. Change, 2, 491–496, https://doi.org/10.1038/nclimate1452, 2012.
Cremonese, E., Filippa, G., Galvagno, M., Siniscalco, C., Oddi, L., di Cella, U. M., and Migliavacca, M.: Heat wave hinders green wave: The impact of climate extreme on the phenology of a mountain grassland, Agr. Forest Meteorol., 247, 320–330, https://doi.org/10.1016/j.agrformet.2017.08.016, 2017.
Currier, C. M. and Sala, O. E.: Precipitation versus temperature as phenology controls in drylands, Ecology, 103, e3793, https://doi.org/10.1002/ecy.3793, 2022.
De Boeck, H. J., Bassin, S., Verlinden, M., Zeiter, M., and Hiltbrunner, E.: Simulated heat waves affected alpine grassland only in combination with drought, New Phytol., 209, 531–541, https://doi.org/10.1111/nph.13601, 2016.
de Jong, R., Verbesselt, J., Zeileis, A., and Schaepman, M. E.: Shifts in Global Vegetation Activity Trends, Remote Sensing, 5, 1117–1133, https://doi.org/10.3390/rs5031117, 2013.
Eilers, P. H. C.: A perfect smoother, Anal. Chem., 75, 3631–3636, https://doi.org/10.1021/ac034173t, 2003.
Filippa, G., Cremonese, E., Galvagno, M., Isabellon, M., Bayle, A., Choler, P., Carlson, B. Z., Gabellani, S., di Cella, U. M., and Migliavacca, M.: Climatic Drivers of Greening Trends in the Alps, Remote Sens., 11, 2527, https://doi.org/10.3390/rs11212527, 2019.
Francon, L., Corona, C., Till-Bottraud, I., Choler, P., Carlson, B. Z., Charrier, G., Ameglio, T., Morin, S., Eckert, N., Roussel, E., Lopez-Saez, J., and Stoffel, M.: Assessing the effects of earlier snow melt-out on alpine shrub growth: The sooner the better?, Ecol. Indic., 115, 106455, https://doi.org/10.1016/j.ecolind.2020.106455, 2020.
Francon, L., Corona, C., Till-Bottraud, I., Choler, P., Roussel, E., Carlson, B. Z., Morin, S., Girard, B., and Stoffel, M.: Shrub growth in the Alps diverges from air temperature since the 1990s, Environ. Res. Lett., 16, 074026, https://doi.org/10.1088/1748-9326/ac0b67, 2021.
Fu, Y. H., Zhao, H., Piao, S., Peaucelle, M., Peng, S., Zhou, G., Ciais, P., Huang, M., Menzel, A., Uelas, J. P., Song, Y., Vitasse, Y., Zeng, Z., and Janssens, I. A.: Declining global warming effects on the phenology of spring leaf unfolding, Nature, 526, 104–107, https://doi.org/10.1038/nature15402, 2015.
Fu, Y. S. H., Zhou, X. C., Li, X. X., Zhang, Y. R., Geng, X. J., Hao, F. H., Zhang, X., Hanninen, H., Guo, Y. H., and De Boeck, H. J.: Decreasing control of precipitation on grassland spring phenology in temperate China, Global Ecol. Biogeogr., 30, 490–499, https://doi.org/10.1111/geb.13234, 2021.
Gao, Y. H., Zhou, X., Wang, Q., Wang, C. Z., Zhan, Z. M., Chen, L. F., Yan, J. X., and Qu, R.: Vegetation net primary productivity and its response to climate change during 2001–2008 in the Tibetan Plateau, Sci. Total Environ., 444, 356–362, https://doi.org/10.1016/j.scitotenv.2012.12.014, 2013.
Grippa, M., Kergoat, L., Le Toan, T., Mognard, N. M., Delbart, N., L'Hermitte, J., and Vicente-Serrano, S. M.: The impact of snow depth and snowmelt on the vegetation variability over central Siberia, Geophys. Res. Lett., 32, L21412, https://doi.org/10.1029/2005gl024286, 2005.
Hiebl, J., Auer, I., Boehm, R., Schoener, W., Maugeri, M., Lentini, G., Spinoni, J., Brunetti, M., Nanni, T., Tadic, M. P., Bihari, Z., Dolinar, M., and Mueller-Westermeier, G.: A high-resolution 1961–1990 monthly temperature climatology for the greater Alpine region, Meteorol. Z., 18, 507–530, https://doi.org/10.1127/0941-2948/2009/0403, 2009.
Higgins, S. I., Conradi, T., and Muhoko, E.: Shifts in vegetation activity of terrestrial ecosystems attributable to climate trends, Nat. Geosci., 16, 147–153, https://doi.org/10.1038/s41561-022-01114-x, 2023.
Hirsch, R. M., Alexander, R. B., and Smith, R. A.: Selection of methods for the detection and estimation of trends in water quality, Water Resour. Res., 27, 803–813, https://doi.org/10.1029/91wr00259, 1991.
Huete, A., Didan, K., Miura, T., Rodriguez, E. P., Gao, X., and Ferreira, L. G.: Overview of the radiometric and biophysical performance of the MODIS vegetation indices, Remote Sens. Environ., 83, 195–213, https://doi.org/10.1016/s0034-4257(02)00096-2, 2002.
Huth, R. and Dubrovsky, M.: Testing for Trends on a Regional Scale: Beyond Local Significance, J. Climate, 34, 5349–5365, https://doi.org/10.1175/jcli-d-19-0960.1, 2021.
Isotta, F. A., Frei, C., Weilguni, V., Tadic, M. P., Lassegues, P., Rudolf, B., Pavan, V., Cacciamani, C., Antolini, G., Ratto, S. M., Munari, M., Micheletti, S., Bonati, V., Lussana, C., Ronchi, C., Panettieri, E., Marigo, G., and Vertacnik, G.: The climate of daily precipitation in the Alps: development and analysis of a high-resolution grid dataset from pan-Alpine rain-gauge data, Int. J. Climatol., 34, 1657–1675, https://doi.org/10.1002/joc.3794, 2014.
Jolly, W. M., Nemani, R., and Running, S. W.: A generalized, bioclimatic index to predict foliar phenology in response to climate, Glob. Change Biol., 11, 619–632, 2005a.
Jolly, W. M., Dobbertin, M., Zimmermann, N. E., and Reichstein, M.: Divergent vegetation growth responses to the 2003 heat wave in the Swiss Alps, Geophys. Res. Lett., 32, L18409, https://doi.org/10.1029/2005GL023252, 2005b.
Jonas, T., Rixen, C., Sturm, M., and Stoeckli, V.: How alpine plant growth is linked to snow cover and climate variability, J. Geophys. Res.-Biogeo., 113, G03013, https://doi.org/10.1029/2007jg000680, 2008.
Jonsson, P. and Eklundh, L.: TIMESAT – a program for analyzing time-series of satellite sensor data, Comput. Geosci., 30, 833–845, https://doi.org/10.1016/j.cageo.2004.05.006, 2004.
Karger, D. N., Conrad, O., Boehner, J., Kawohl, T., Kreft, H., Soria-Auza, R. W., Zimmermann, N. E., Linder, H. P., and Kessler, M.: Data Descriptor: Climatologies at high resolution for the earth's land surface areas, Sci. Data, 4, 170122, https://doi.org/10.1038/sdata.2017.122, 2017.
Karger, D. N., Conrad, O., Böhner, J., Kawohl, T., Kreft, H., Soria-Auza, R. W., Zimmermann, N. E., Linder, H. P., and Kessler, M.: Climatologies at high resolution for the earth's land surface areas, EnviDat [data set], https://doi.org/10.16904/envidat.228, 2021.
Kong, D., Xiao, M., Zhang, Y., Gu, X., and Cui, J.: phenofit: Extract Remote Sensing Vegetation Phenology. R package version 0.3.8, https://CRAN.R-project.org/package=phenofit (last access: 11 October 2023), 2023.
Korner, C.: A re-assessment of high elevation treeline positions and their explanation, Oecologia, 115, 445–459, https://doi.org/10.1007/s004420050540, 1998.
Lamprecht, A., Semenchuk, P. R., Steinbauer, K., Winkler, M., and Pauli, H.: Climate change leads to accelerated transformation of high-elevation vegetation in the central Alps, New Phytol., 220, 447–459, https://doi.org/10.1111/nph.15290, 2018.
Lenoir, J.: Rethinking climate context dependencies in biological terms, P. Natl. Acad. Sci. USA, 117, 23208–23210, https://doi.org/10.1073/pnas.2016537117, 2020.
Lett, S., Teuber, L. M., Krab, E. J., Michelsen, A., Olofsson, J., Nilsson, M. C., Wardle, D. A., and Dorrepaal, E.: Mosses modify effects of warmer and wetter conditions on tree seedlings at the alpine treeline, Glob. Change Biol., 26, 5754–5766, https://doi.org/10.1111/gcb.15256, 2020.
Lu, R. Y., Xu, K., Chen, R. D., Chen, W., Li, F., and Lv, C. Y.: Heat waves in summer 2022 and increasing concern regarding heat waves in general, Atmos. Ocean. Sci. Lett., 16, 100290, https://doi.org/10.1016/j.aosl.2022.100290, 2023.
Maechler, M., Rousseeuw, P. J., Struyf, A., Hubert, M., and Hornik, K.: cluster: Cluster Analysis Basics and Extensions, R package version 2.1.4 [code], https://cran.r-project.org/web/packages/cluster/ (last access: 11 October 2023), 2022.
Matiu, M., Crespi, A., Bertoldi, G., Carmagnola, C. M., Marty, C., Morin, S., Schöner, W., Cat Berro, D., Chiogna, G., De Gregorio, L., Kotlarski, S., Majone, B., Resch, G., Terzago, S., Valt, M., Beozzo, W., Cianfarra, P., Gouttevin, I., Marcolini, G., Notarnicola, C., Petitta, M., Scherrer, S. C., Strasser, U., Winkler, M., Zebisch, M., Cicogna, A., Cremonini, R., Debernardi, A., Faletto, M., Gaddo, M., Giovannini, L., Mercalli, L., Soubeyroux, J.-M., Sušnik, A., Trenti, A., Urbani, S., and Weilguni, V.: Observed snow depth trends in the European Alps: 1971 to 2019, The Cryosphere, 15, 1343–1382, https://doi.org/10.5194/tc-15-1343-2021, 2021.
McLeod, A. I.: Kendall rank correlation and Mann-Kendall trend test, R package version 2.2, https://CRAN.R-project.org/package=Kendall (last access: 11 October 2023), 2005.
Miura, T., Huete, A. R., and Yoshioka, H.: Evaluation of sensor calibration uncertainties on vegetation indices for MODIS, IEEE T. Geosci. Remote, 38, 1399–1409, https://doi.org/10.1109/36.843034, 2000.
Monteiro, D. and Morin, S.: Multi-decadal past winter temperature, precipitation and snow cover information over the European Alps using multiple datasets, EGUsphere [preprint], https://doi.org/10.5194/egusphere-2023-166, 2023.
Muñoz-Sabater, J., Dutra, E., Agustí-Panareda, A., Albergel, C., Arduini, G., Balsamo, G., Boussetta, S., Choulga, M., Harrigan, S., Hersbach, H., Martens, B., Miralles, D. G., Piles, M., Rodríguez-Fernández, N. J., Zsoter, E., Buontempo, C., and Thépaut, J.-N.: ERA5-Land: a state-of-the-art global reanalysis dataset for land applications, Earth Syst. Sci. Data, 13, 4349–4383, https://doi.org/10.5194/essd-13-4349-2021, 2021.
Myers-Smith, I. H., Forbes, B. C., Wilmking, M., Hallinger, M., Lantz, T., Blok, D., Tape, K. D., Macias-Fauria, M., Sass-Klaassen, U., Levesque, E., Boudreau, S., Ropars, P., Hermanutz, L., Trant, A., Collier, L. S., Weijers, S., Rozema, J., Rayback, S. A., Schmidt, N. M., Schaepman-Strub, G., Wipf, S., Rixen, C., Menard, C. B., Venn, S., Goetz, S., Andreu-Hayles, L., Elmendorf, S., Ravolainen, V., Welker, J., Grogan, P., Epstein, H. E., and Hik, D. S.: Shrub expansion in tundra ecosystems: dynamics, impacts and research priorities, Environ. Res. Lett., 6, 045509, https://doi.org/10.1088/1748-9326/6/4/045509, 2011.
Myers-Smith, I. H., Elmendorf, S. C., Beck, P. S. A., Wilmking, M., Hallinger, M., Blok, D., Tape, K. D., Rayback, S. A., Macias-Fauria, M., Forbes, B. C., Speed, J. D. M., Boulanger-Lapointe, N., Rixen, C., Levesque, E., Schmidt, N. M., Baittinger, C., Trant, A. J., Hermanutz, L., Collier, L. S., Dawes, M. A., Lantz, T. C., Weijers, S., Jorgensen, R. H., Buchwal, A., Buras, A., Naito, A. T., Ravolainen, V., Schaepman-Strub, G., Wheeler, J. A., Wipf, S., Guay, K. C., Hik, D. S., and Vellend, M.: Climate sensitivity of shrub growth across the tundra biome, Nat. Clim. Change, 5, 887–891, https://doi.org/10.1038/nclimate2697, 2015.
NASA's Land Processes Distributed Active Archive Center: MODIS products, https://e4ftl01.cr.usgs.gov/ (last access: 15 October 2023), 2023.
Pauli, H., Gottfried, M., Hohenwallner, D., Reiter, K., and Grabherr, G.: Ecological climate impact research in high mountain environments: GLORIA (global observation research initiative in alpine environments) – its roots, purpose and long-term perspectives, in: Global change and mountain regions, Springer, 383–391, ISBN 978-1-4020-3506-7, 2005.
Pepin, N., Bradley, R. S., Diaz, H. F., Baraer, M., Caceres, E. B., Forsythe, N., Fowler, H., Greenwood, G., Hashmi, M. Z., Liu, X. D., Miller, J. R., Ning, L., Ohmura, A., Palazzi, E., Rangwala, I., Schoener, W., Severskiy, I., Shahgedanova, M., Wang, M. B., Williamson, S. N., Yang, D. Q., and Mountain Research Initiative EDW Working Group: Elevation-dependent warming in mountain regions of the world, Nat. Clim. Change, 5, 424–430, https://doi.org/10.1038/nclimate2563, 2015.
Pinheiro, J., Bates, D., and R Core Team: Linear and Nonlinear Mixed Effects Models, R package version 3.1-160, [code], https://CRAN.R-project.org/package=nlme (last access: 11 October 2023), 2022.
Poppe Terán, C., Naz, B. S., Graf, A., Qu, Y., Hendricks Franssen, H.-J., Baatz, R., Ciais, P., and Vereecken, H.: Rising water-use efficiency in European grasslands is driven by increased primary production, Communications Earth & Environment, 4, 95, https://doi.org/10.1038/s43247-023-00757-x, 2023.
Riggs, G. A., Hall, D. K., and Román, M. O.: MODIS Snow Products Collection 6. National Snow and Ice Data Center: Boulder, CO, USA, 66 pp., https://modis-snow-ice.gsfc.nasa.gov/uploads/C6_MODIS_Snow_User_Guide.pdf (last access: 11 October 2023), 2016.
Rogora, M., Frate, L., Carranza, M. L., Freppaz, M., Stanisci, A., Bertani, I., Bottarin, R., Brambilla, A., Canullo, R., Carbognani, M., Cerrato, C., Chelli, S., Cremonese, E., Cutini, M., Di Musciano, M., Erschbamer, B., Godone, D., Iocchi, M., Isabellon, M., Magnani, A., Mazzola, L., di Cella, U. M., Pauli, H., Petey, M., Petriccione, B., Porro, F., Psenner, R., Rossetti, G., Scotti, A., Sommaruga, R., Tappeiner, U., Theurillat, J. P., Tomaselli, M., Viglietti, D., Viterbi, R., Vittoz, P., Winkler, M., and Matteucci, G.: Assessment of climate change effects on mountain ecosystems through a cross-site analysis in the Alps and Apennines, Sci. Total Environ., 624, 1429–1442, https://doi.org/10.1016/j.scitotenv.2017.12.155, 2018.
Rossini, M., Cogliati, S., Meroni, M., Migliavacca, M., Galvagno, M., Busetto, L., Cremonese, E., Julitta, T., Siniscalco, C., Morra di Cella, U., and Colombo, R.: Remote sensing-based estimation of gross primary production in a subalpine grassland, Biogeosciences, 9, 2565–2584, https://doi.org/10.5194/bg-9-2565-2012, 2012.
Rubel, F., Brugger, K., Haslinger, K., and Auer, I.: The climate of the European Alps: Shift of very high resolution Koppen-Geiger climate zones 1800–2100, Meteorol. Z., 26, 115–125, https://doi.org/10.1127/metz/2016/0816, 2017.
Russo, S., Dosio, A., Graversen, R. G., Sillmann, J., Carrao, H., Dunbar, M. B., Singleton, A., Montagna, P., Barbola, P., and Vogt, J. V.: Magnitude of extreme heat waves in present climate and their projection in a warming world, J. Geophys. Res.-Atmos., 119, 12500–12512, https://doi.org/10.1002/2014jd022098, 2014.
Salomonson, V. V. and Appel, I.: Estimating fractional snow cover from MODIS using the normalized difference snow index, Remote Sens. Environ., 89, 351–360, https://doi.org/10.1016/j.rse.2003.10.016, 2004.
Savitzky, A. and Golay, M. J. E.: Smoothing and Differentiation of Data by Simplified Least Squares Procedures, Anal. Chem., 36, 1627–1639, 1964.
Seddon, A. W. R., Macias-Fauria, M., Long, P. R., Benz, D., and Willis, K. J.: Sensitivity of global terrestrial ecosystems to climate variability, Nature, 531, 229–232, https://doi.org/10.1038/nature16986, 2016.
Sippel, S., Zscheischler, J., and Reichstein, M.: Ecosystem impacts of climate extremes crucially depend on the timing, P. Natl. Acad. Sci. USA, 113, 5768–5770, https://doi.org/10.1073/pnas.1605667113, 2016.
Sippel, S., Reichstein, M., Ma, X. L., Mahecha, M. D., Lange, H., Flach, M., and Frank, D.: Drought, Heat, and the Carbon Cycle, Current Climate Change Reports, 4, 266–286, https://doi.org/10.1007/s40641-018-0103-4, 2018.
Steinbauer, M. J., Grytnes, J.-A., Jurasinski, G., Kulonen, A., Lenoir, J., Pauli, H., Rixen, C., Winkler, M., Bardy-Durchhalter, M., Barni, E., Bjorkman, A. D., Breiner, F. T., Burg, S., Czortek, P., Dawes, M. A., Delimat, A., Dullinger, S., Erschbamer, B., Felde, V. A., Fernandez-Arberas, O., Fossheim, K. F., Gomez-Garcia, D., Georges, D., Grindrud, E. T., Haider, S., Haugum, S. V., Henriksen, H., Herreros, M. J., Jaroszewicz, B., Jaroszynska, F., Kanka, R., Kapfer, J., Klanderud, K., Kuhn, I., Lamprecht, A., Matteodo, M., di Cella, U. M., Normand, S., Odland, A., Olsen, S. L., Palacio, S., Petey, M., Piscova, V., Sedlakova, B., Steinbauer, K., Stockli, V., Svenning, J.-C., Teppa, G., Theurillat, J.-P., Vittoz, P., Woodin, S. J., Zimmermann, N. E., and Wipf, S.: Accelerated increase in plant species richness on mountain summits is linked to warming, Nature, 556, 231–234, https://doi.org/10.1038/s41586-018-0005-6, 2018.
Stockli, R. and Vidale, P. L.: European plant phenology and climate as seen in a 20-year AVHRR land-surface parameter dataset, Int. J. Remote Sens., 25, 3303–3330, 2004.
Sturm, M., McFadden, J. P., Liston, G. E., Chapin, F. S., Racine, C. H., and Holmgren, J.: Snow-shrub interactions in Arctic tundra: A hypothesis with climatic implications, J. Climate, 14, 336–344, https://doi.org/10.1175/1520-0442(2001)014<0336:ssiiat>2.0.co;2, 2001.
Tappeiner, U., Borsdorf, A., and Tasser, E.: Mapping the Alps: Society – Economy – Environment, Spektrum Akademischer Verlag, Heidelberg, ISBN 978-3-8274-2004-6, 2008.
Trujillo, E., Molotch, N. P., Goulden, M. L., Kelly, A. E., and Bales, R. C.: Elevation-dependent influence of snow accumulation on forest greening, Nat. Geosci., 5, 705–709, https://doi.org/10.1038/ngeo1571, 2012.
Tucker, C. J.: Red and photographic infrared linear combinations for monitoring vegetation, Remote Sens. Environ., 8, 127–150, https://doi.org/10.1016/0034-4257(79)90013-0, 1979.
Vionnet, V., Six, D., Auger, L., Dumont, M., Lafaysse, M., Queno, L., Reveillent, M., Dombrowski-Etchevers, I., Thibert, E., and Vincent, C.: Sub-kilometer Precipitation Datasets for Snowpack and Glacier Modeling in Alpine Terrain, Front. Earth Sci., 7, 182, https://doi.org/10.3389/feart.2019.00182, 2019.
von Buttlar, J., Zscheischler, J., Rammig, A., Sippel, S., Reichstein, M., Knohl, A., Jung, M., Menzer, O., Arain, M. A., Buchmann, N., Cescatti, A., Gianelle, D., Kiely, G., Law, B. E., Magliulo, V., Margolis, H., McCaughey, H., Merbold, L., Migliavacca, M., Montagnani, L., Oechel, W., Pavelka, M., Peichl, M., Rambal, S., Raschi, A., Scott, R. L., Vaccari, F. P., van Gorsel, E., Varlagin, A., Wohlfahrt, G., and Mahecha, M. D.: Impacts of droughts and extreme-temperature events on gross primary production and ecosystem respiration: a systematic assessment across ecosystems and climate zones, Biogeosciences, 15, 1293–1318, https://doi.org/10.5194/bg-15-1293-2018, 2018.
Walker, D. A., Halfpenny, J. C., Walker, M. D., and Wessman, C. A.: Long-term studies of snow-vegetation interactions, Bioscience, 43, 287–301, https://doi.org/10.2307/1312061, 1993.
Whittaker, E. T.: On a new method of graduation, P. Edinburgh Math. Soc., 41, 63–75, 1922.
Wilks, D. S.: “The Stippling Shows Statistically Significant Grid Points” How Research Results are Routinely Overstated and Overinterpreted, and What to Do about It, B. Am. Meteorol. Soc., 97, 2263–2273, https://doi.org/10.1175/bams-d-15-00267.1, 2016.
Wu, Z. H., Huang, N. E., Long, S. R., and Peng, C. K.: On the trend, detrending, and variability of nonlinear and nonstationary time series, P. Natl. Acad. Sci. USA, 104, 14889–14894, https://doi.org/10.1073/pnas.0701020104, 2007.
Xie, J., Jonas, T., Rixen, C., de Jong, R., Garonna, I., Notarnicola, C., Asam, S., Schaepman, M. E., and Kneubuehler, M.: Land surface phenology and greenness in Alpine grasslands driven by seasonal snow and meteorological factors, Sci. Total Environ., 725, 138380, https://doi.org/10.1016/j.scitotenv.2020.138380, 2020.
Zellweger, F., De Frenne, P., Lenoir, J., Rocchini, D., and Coomes, D.: Advances in Microclimate Ecology Arising from Remote Sensing, Trends Ecol. Evol., 34, 327–341, https://doi.org/10.1016/j.tree.2018.12.012, 2019.
Zeng, L. L., Wardlow, B. D., Xiang, D. X., Hu, S., and Li, D. R.: A review of vegetation phenological metrics extraction using time-series, multispectral satellite data, Remote Sens. Environ., 237, 111511, https://doi.org/10.1016/j.rse.2019.111511, 2020.
Zhao, M. and Running, S. W.: Drought-Induced Reduction in Global Terrestrial Net Primary Production from 2000 Through 2009, Science, 329, 940–943, https://doi.org/10.1126/science.1192666, 2010.
Zhong, L., Ma, Y., Xue, Y., and Piao, S.: Climate Change Trends and Impacts on Vegetation Greening Over the Tibetan Plateau, J. Geophys. Res.-Atmos, 124, 7540–7552, https://doi.org/10.1029/2019jd030481, 2019.