the Creative Commons Attribution 4.0 License.
the Creative Commons Attribution 4.0 License.
 | 25 Oct 2023
Conceptual models of dissolved carbon fluxes in a two-layer stratified lake: interannual typhoon responses under extreme climates
Hao-Chi Lin
Keisuke Nakayama
Jeng-Wei Tsai
Chih-Yu Chiu
Extreme climates affect the seasonal and interannual patterns of carbon (C) distribution in lentic ecosystems due to the regimes of river inflow and thermal stratification. Typhoons rapidly load substantial amounts of terrestrial C into smaller subtropical lakes (i.e., Yuan-Yang Lake in Taiwan, hereafter referred to as YYL), renewing and mixing the water column. We developed a conceptual dissolved C model and hypothesized that allochthonous C loading and river inflow intrusion may affect the dissolved inorganic C (DIC) and dissolved organic C (DOC) distributions in a small subtropical lake under these extreme climates. A two-layer conceptual C model was developed to explore how the DIC and DOC fluxes respond to typhoon disturbances on seasonal and interannual timescales in YYL while simultaneously considering autochthonous processes such as algal photosynthesis, remineralization, and vertical transformation. To compare the temporal patterns of fluxes between typhoon years (2015–2016) and non-typhoon years (2017–2018), monthly field samples were obtained and their DIC, DOC, and chlorophyll a (Chl a) concentrations measured. The results demonstrated that net ecosystem production was 3.14 times higher in typhoon years than in non-typhoon years. These results suggested that a loading of allochthonous C was the most crucial driver of the temporal variation in C fluxes in typhoon years because of changes in physical and biochemical processes, such as photosynthesis, mineralization, and vertical transportation. However, the lowered vertical transportation rate shaped the seasonal C in non-typhoon years due to thermal stratification within this small subtropical lake.
- Article
(3784 KB) - Full-text XML
-
Supplement
(890 KB) - BibTeX
- EndNote


The Sixth Assessment Report from the Intergovernmental Panel for Environmental Change (Masson-Delmotte, 2021) suggests that not only is air temperature going to increase by at least about 1.5 ∘C by 2050 but high-intensity storms and drought events will also become more frequent as a result of global warming and climate change. With respect to freshwater ecosystems, extreme climates may change the mixing regimes of freshwater columns (Kraemer et al., 2021; Maberly et al., 2020; Woolway et al., 2020) and induce heat wave events (Woolway et al., 2021a, b), droughts (Marcé et al., 2019), and floods (Woolway et al., 2018). Freshwater ecosystems store around 0.32–1.8 Pg C yr−1, which is approximately equivalent to shallow coastal areas, thereby providing carbon (C) to food webs that support human resources by, for example, acting as processing hot spots in regional C cycles (Aufdenkampe et al., 2011; Cole et al., 2007; Engel et al., 2018; Lauerwald et al., 2015; Raymond et al., 2013).
Carbon fluxes in small lakes (lake area < 1 km2) are sensitive to climate change due to the ease with which C mixes within water columns (Doubek et al., 2021; MacIntyre et al., 2021; Winslow et al., 2015). Moreover, storms induce dramatic changes in thermal stratification and water inflows (Lin et al., 2022; Olsson et al., 2022b; Vachon and Del Giorgio, 2014; Woolway et al., 2018). River inflows and wind turbulence have been shown to release allochthonous C from sediments into the water column after storm events in small stratified lakes (Bartosiewicz et al., 2015; Czikowsky et al., 2018; Vachon and Del Giorgio, 2014). These small lakes account for 25 % to 35 % of the total area of the Earth's surface lakes (Cole et al., 2007; Downing et al., 2006; Raymond et al., 2013). Compared with the case in larger lakes, our understanding of C fluxes in small lakes remains uncertain, as small lakes have usually been ignored in calculations of C fluxes on a global scale (Cole et al., 2007; Raymond et al., 2013). Thus, elucidation of the C fluxes in small lakes under extreme weather conditions is the key to optimizing estimations of global C fluxes in extreme climates.
Understanding the influences of physical, hydrological, and biogeochemical processes on the fate of C fluxes in smaller lake ecosystems is challenging work (Aufdenkampe et al., 2011; Cole et al., 2007; Raymond et al., 2013; Tranvik et al., 2009; Vachon et al., 2021; Woolway et al., 2018). The physical and biogeochemical regimes under climate change remain uncertain, such as biological compositions, mixing regimes, morphometric characteristics, and air–water energy fluxes (evaporation and transpiration) (Woolway et al., 2020). The dissolved inorganic carbon (DIC) concentration is an important factor in estimating CO2 fluxes within lake ecosystems (Smith, 1985). Among C fluxes in a freshwater body, the partial pressure of CO2 (pCO2), defined as CO2 emission across the air–water interface, is affected by DIC, water temperature, wind speed, and pH (Jähne et al., 1987; Smith, 1985). River inflows, sediment C burial, and heterotrophic respiration in the water column contribute to DIC dynamics in lakes (Hope et al., 2004; Vachon et al., 2021); simultaneously, autotrophic organisms, such as plankton and submerged vegetation, capture DIC via photosynthesis (Amaral et al., 2022; Nakayama et al., 2020, 2022). Moreover, calcification and mineralization may consume dissolved oxygen within water, inducing uncertainty in pCO2 estimation (Hanson et al., 2015; Lin et al., 2022; Nakayama et al., 2022). Dissolved organic carbon (DOC) might contribute to CO2 emission from lake water to the atmosphere through mineralization and remineralization within lake ecosystems (Hanson et al., 2015; Sobek et al., 2005). In subtropical freshwater ecosystems, the DOC concentration is a vital factor in describing variances in mineralization and remineralization rates for dissolved C (Lin et al., 2022; Shih et al., 2019).
Typhoons might significantly impact C distributions within the water columns in subtropical regions (Chiu et al., 2020; Lin et al., 2022). Kossin et al. (2013) investigated global storm events with an accumulated rainfall of about 50 mm, which accounts for approximately 10 %–40 % of precipitation in a subtropical typhoon event. Some studies found that extreme rainstorms not only impact the dissolved carbon in large lakes and catchments due to weathering (Sun et al., 2021; Zhou et al., 2023) but also that typhoon disturbances quickly mix, renew, or dilute the water in small subtropical lakes (Kimura et al., 2012, 2017; Lin et al., 2022). However, the complex interactions between biogeochemical and physical regimes for autochthonous and allochthonous C introduce uncertainty in elucidating the complete patterns between typhoons and dissolved C concentrations in small subtropical lakes. This uncertainty hinders our understanding of the seasonal and interannual variations in DIC and DOC concentrations (Lin et al., 2022). Thus, to understand the seasonal regimes and to estimate C fluxes in subtropical lakes, we investigated the variations in DIC and DOC due to typhoon disturbances.
Typhoons' effects on C fluxes have previously been studied in a small, two-layer stratified subtropical lake, Yuan-Yang Lake (YYL) in Taiwan (Chiu et al., 2020; Jones et al., 2009; Lin et al., 2021, 2022). Jones et al. (2009) used a conceptual hydrology model and sensor data to estimate CO2 emission in YYL during typhoon disturbances that occurred in October 2004: 2.2–2.7 of CO2 was released into the atmosphere. CO2 emissions into the atmosphere were recorded at around 3.0–3.7 in summer and autumn 2015 because of substantial loads of terrestrial C via river inflows after strong typhoons in YYL (Chiu et al., 2020). In particular, vertical mixing, thermal stratification, and river retention regimes were found to be essential physical processes in the C fluxes in YYL (Lin et al., 2021, 2022). The results of these studies suggest that river intrusion and thermal stratification are key factors shaping the seasonal and interannual patterns of C fluxes during typhoon disturbances. River intrusion controls not only the C fluxes, algal biomass, and nutrient loading but also influences the length of stratification and hydraulic retention times (Lin et al., 2021, 2022; Maranger et al., 2018; Nakayama et al., 2020; Olsson et al., 2022a, b; Zwart et al., 2017; Vachon and Del Giorgio, 2014). Therefore, we hypothesized that allochthonous C loading and river inflow intrusion might affect DIC and DOC distributions. Further, autochthonous processes in small subtropical lakes, such as algal photosynthesis, remineralization, and vertical transportation, must also be considered. Here, we tested our hypothesis by developing two-layer conceptual C models to assess C flux responses to typhoon disturbances in small subtropical lakes.
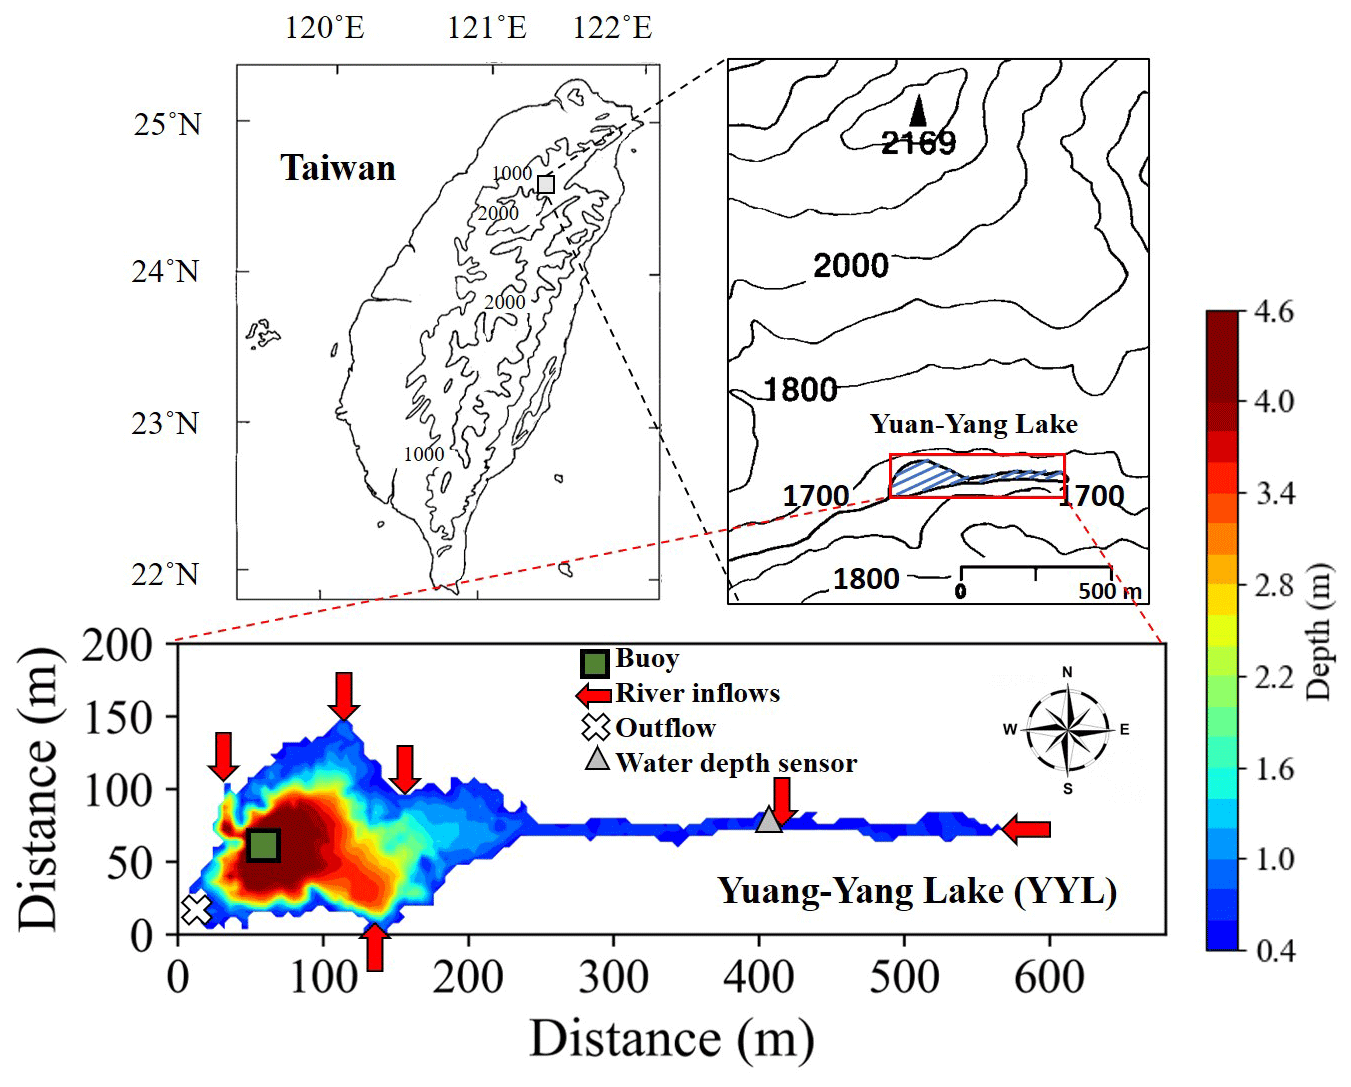
Figure 1Sampling locations and bathymetry maps of Yuan-Yang Lake (YYL). The dark green rectangle shows the buoy station, which is located at the deepest site of the lake. The red arrows and white cross show the river mouths of the inflows and outflows, respectively. The gray triangle shows the location of the water depth sensor.
2.1 Study site
YYL is a shallow (mean water depth: 4.3 m), oligotrophic (total phosphorous: 10–20 µg P L−1; total nitrogen: 20–60 µg N L−1) subtropical mountain lake (Chou et al., 2000; Tsai et al., 2008; Wu et al., 2001) on Chilan Mountain at around 1640 in northern central Taiwan (24.58∘ N, 121.40∘ E) (Fig. 1). Its water is brown due to its humic acid content (colored dissolved organic matter: 20–50 ppb quinine sulfate equivalent; specific ultraviolet absorbance at 254 nm assessed by a portable fluorometer – model C3, Turner Designs, Sunnyvale, CA, USA; mean pH: 5.4). YYL is surrounded by old-growth trees such as Chamaecyparis formosensis, Chamaecyparis obtusa var. formosana, and Rhododendron formosanum Heiml (Chou et al., 2000). Precipitation is over 3000 mm yr−1, and typhoon precipitation contributes up to half of the total precipitation input to YYL annually (Chang et al., 2007; Lai et al., 2006). Due to the rapid renewal of the waterbody, the water retention time (or residence time) was around 4.4 d during Typhoon Megi from 27 September to 1 October 2016 (Lin et al., 2022). The water surface temperature ranges from 15 to 25 ∘C during March to August, and the water column overturns in September (Kimura et al., 2012, 2017; Lin et al., 2021). The concentrations of DIC, DOC (Lin et al., 2021), total nitrogen, and total phosphate (Chiu et al., 2020; Tsai et al., 2008) as well as bacterial compositions (Shade et al., 2011) increase within YYL from autumn to winter. YYL has been registered as a long-term ecological study site by the Ministry of Science and Technology (MOST) of Taiwan since 1992 and became part of the Global Lake Ecological Observatory Network (GLEON) in 2004.
2.2 Water sampling and chemical analysis
We collected water quality samples (DOC, DIC, and Chl a) at water depths of 0.04, 0.50, 1.00, 2.00, and 3.50 m at the buoy site (Fig. 1). From January 2015 to December 2018, we measured the water surfaces of six river inflows and one outflow each month using a horizontal van Dorn bottle (2.20 L, acrylic) (Fig. 1). These liquid samples were collected using a portable hand pump and glass microfiber filter papers (47 mm GF/F, nominal pore size 0.70 µm; Whatman, Maidstone, Kent, UK) to obtain filtrate samples. Water samples were stored at around 4 ∘C in a refrigerator until analysis. Samples were analyzed using an infrared gas detector to detect DIC and DOC concentrations with persulfate digestion (model 1088 Rotary TOC autosampler; OI Analytical, College Station, TX, USA). The filter papers were kept refrigerated in opaque bottles at around −25 ∘C in a refrigerator until the samples were analyzed. In the laboratory, the filter papers were extracted with methanol to obtain the Chl a concentration using a portable fluorometer (model 10-AU-005-CE; Turner Designs, Sunnyvale, CA, USA), with specific wavelengths of 430 nm (blue) and 662 nm (red). All analysis was completed within 72 h of exposure to light in order to reduce degradation.
Table 1Comparison of Yuan-Yang Lake's rainfall and hydrological records in typhoon and non-typhoon years.
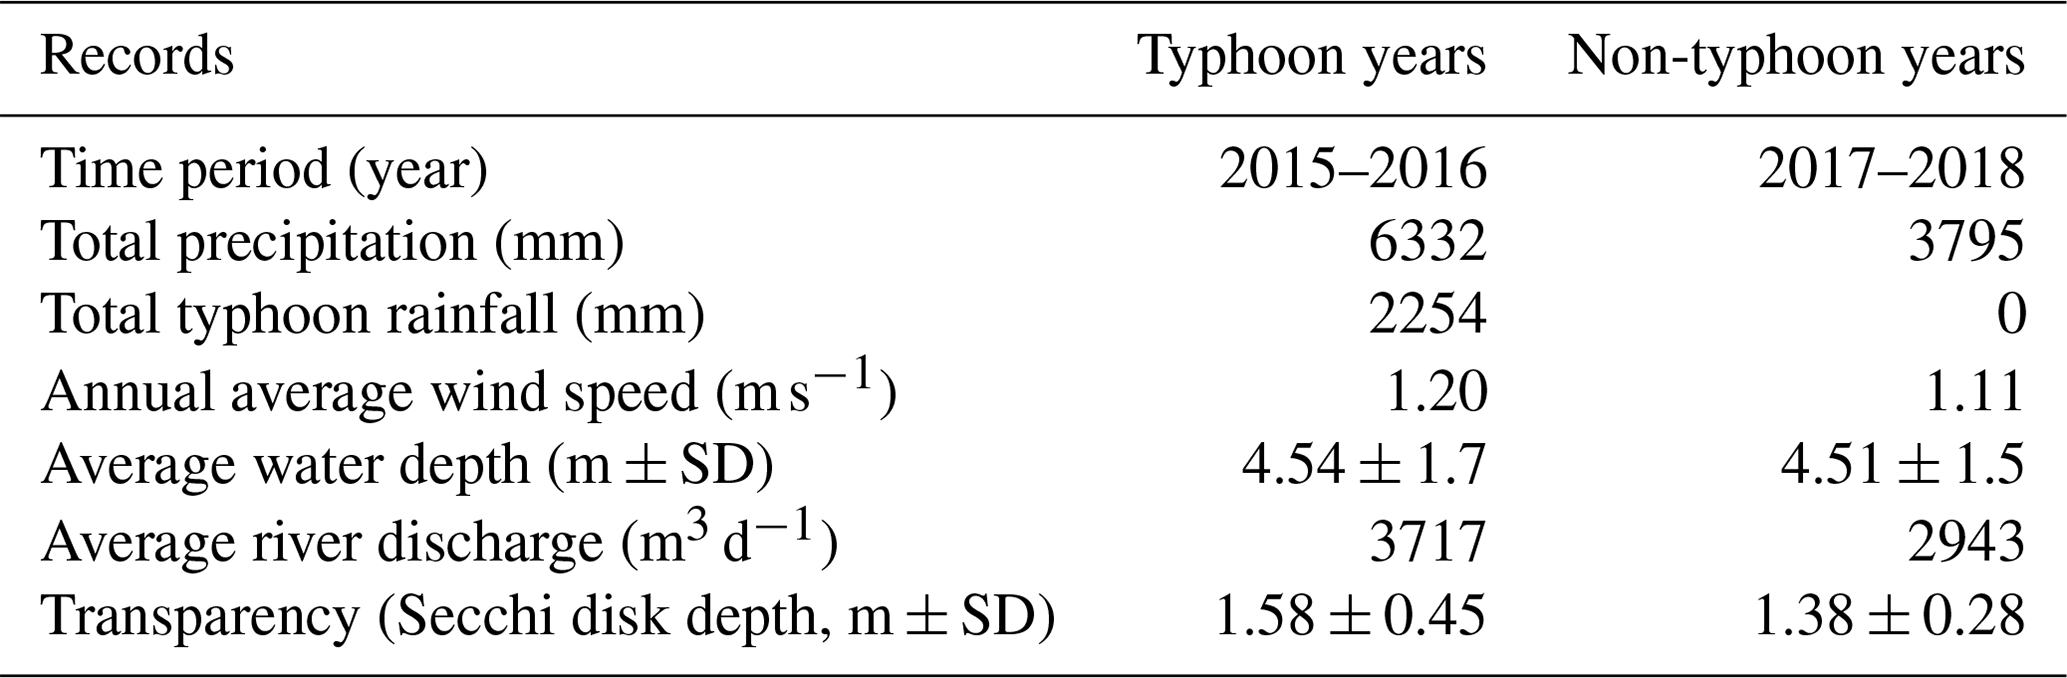
SD denotes standard deviation.
2.3 Data analysis and numerical modeling
Three water quality variables (DIC, DOC, and Chl a) were compared between different layers (upper and lower layers), years (typhoon and non-typhoon years), and seasons (spring, summer, autumn, and winter). First, we separated our investigation data into typhoon years and non-typhoon years, as described in Sect. 2.3.1. Next, to simulate the DIC and DOC concentrations under extreme weather scenarios in YYL, we developed a conceptual equations model to generate continuous DIC and DOC data for the upper and lower layers, as shown in Sect. 2.3.2. This also helped us understand the transportation, photosynthesis, and remineralization rates between seasons and between typhoon and non-typhoon years.
2.3.1 Typhoon and non-typhoon years
We collected meteorological data from a tower located about 1.0 km from YYL (Lin et al., 2021, 2022). Data on rainfall (model N-68; Nippon Electric Instrument, Tokyo, Japan) and wind speed (model 03001; R. M. Young, Traverse City, MI, USA) were stored in a datalogger (model CR1000; Campbell Scientific, Logan, UT, USA) every 10 min. River discharge (Qin, m3 d−1) was estimated every 10 min using the rainfall data and a water depth meter (model HOBO U20; Onset Computer, Bourne, MA, USA) at the end of a river inflow (Fig. 1) using the Manning formula. Transparency was estimated using Secchi disk data measured at a certain interval in the time frame from 10:00 to 14:00 LT (local time, GMT + 08:00).
Four strong typhoons were recorded using wind speed and rainfall meteorological parameters. As Table 1 shows, these events contributed a total of 2254 mm of precipitation in all 24 months of 2015 and 2016; this accounted for 35.6 % of the typical rainfall across 2 years (> 3000 mm yr−1). However, no typhoon rainfall was recorded at YYL in 2017 or 2018; the total precipitation was around 1398 mm yr−1, below half of average years. The annual average wind speed from 2015 to 2016 was 0.09 m s−1 higher than in 2017 and 2018 (Table 1). Despite no significant difference in the average water depth between 2017 and 2018, the average discharge in 2015 and 2016 was 774 m3 d−1 higher than in 2017 and 2018 (Table 1). Thus, we considered 2015 and 2016 to be typhoon years and 2017 and 2018 to be non-typhoon years.
2.3.2 Conceptual two-layer DIC and DOC model
Nakayama et al. (2010) successfully developed a conceptual two-layer dissolved oxygen model based on strong wind turbulence at Tokyo Bay. Lin et al. (2021) pointed out that thermal stratification that inhibits vertical C flux between the upper and lower layers in shallow stratified lakes makes it possible to develop conceptual two-layer C models (Lin et al., 2022; Nakayama et al., 2022). The phytoplankton and remineralization effects on DIC and DOC fluxes ( and , respectively, ) were considered in a conceptual two-layer equation model as shown in Eqs. (1)–(4). The fluxes in the upper layer (from the water surface to 2.5 m water depth) were calculated as follows:
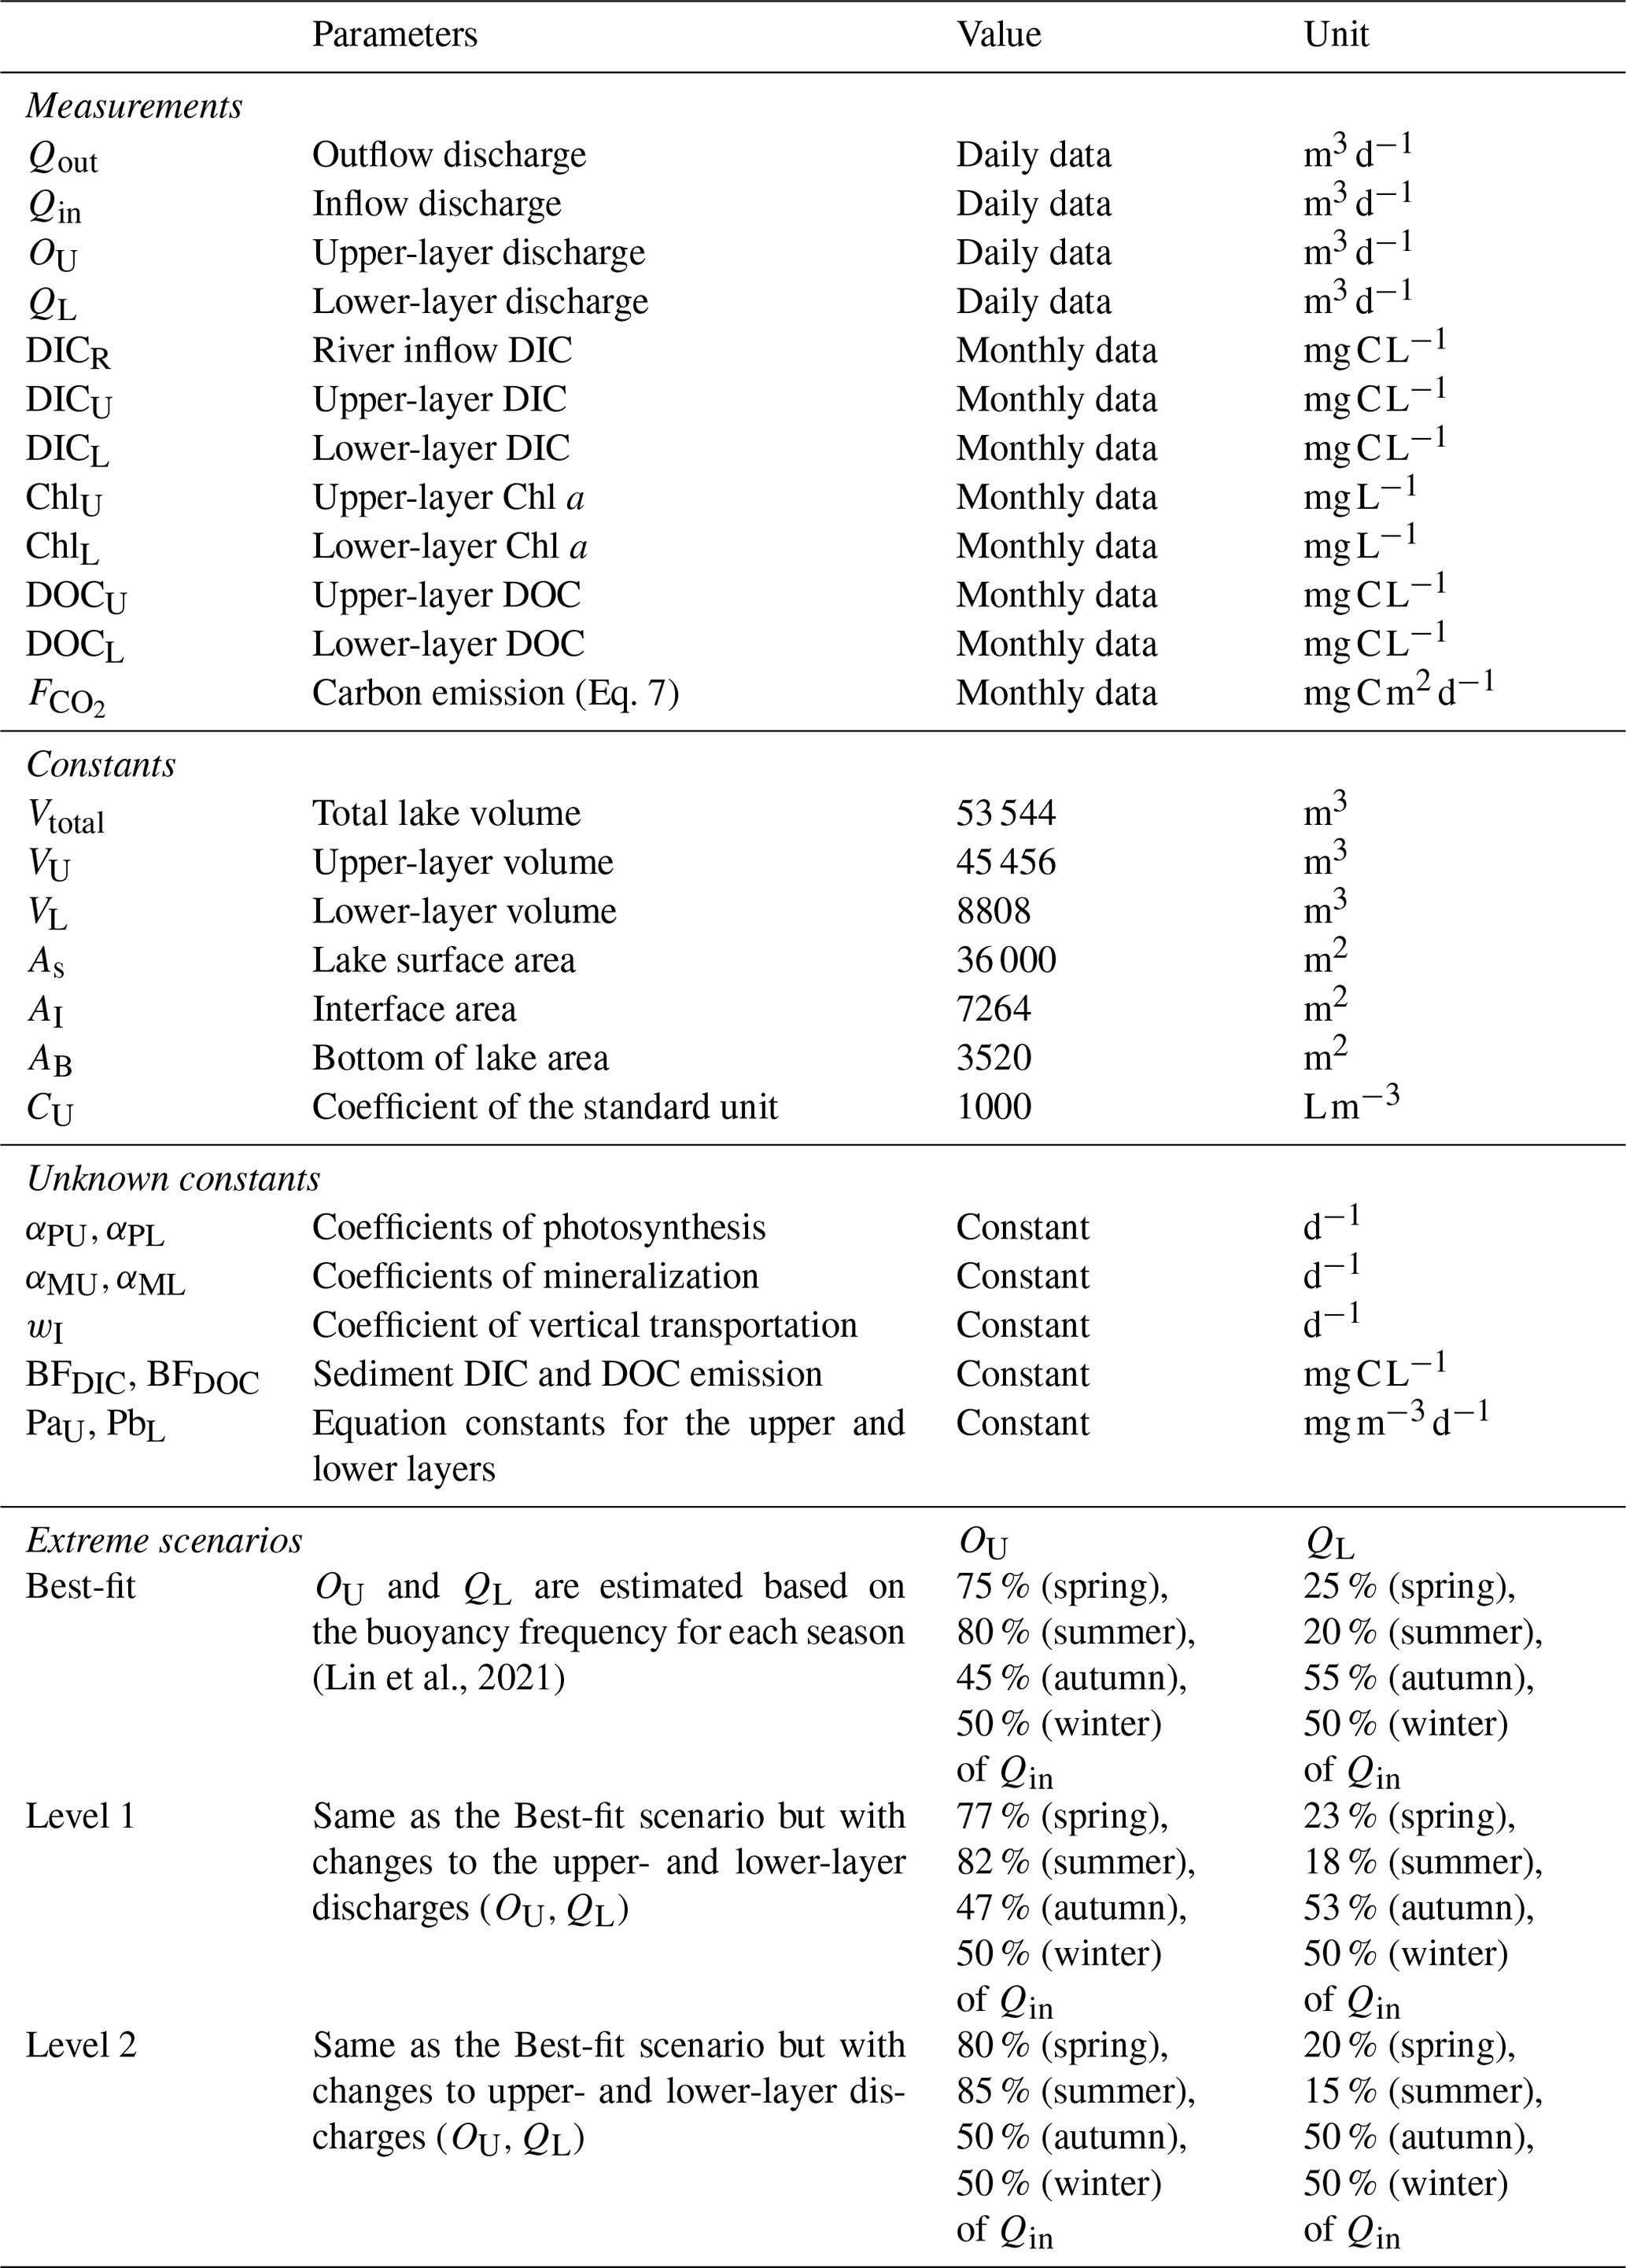
Table 2Parameters of the two-layer conceptual model in Yuan-Yang Lake.
Those in the lower layer (from 2.5 to 4.0 m water depth) were calculated as follows:
In the above expressions, as shown in Table 2, the total lake volume (Vtotal, 53 544 m3) comprises the upper layer (VU, 45 456 m3) and the lower layer (VL, 8808 m3) (Eq. 5), the lake surface area (As) is 36 000 m2, and the bottom of the lake area (AB) is 3520 m2. The interface is 2.5 m vertically, and the interface area (AI) is 7264 m2 in YYL. The water depth varied from 4.56 to 4.66 m during the typhoon period (Chiu et al., 2020; Lin et al., 2022). Therefore, we can assume that changes in the lake volume and area were negligible. The coefficient CU, with a value of 1000, was used to establish a standard unit for (), considering the air–water CO2 exchange using Fick's law, as follows:
Here, is the gas transfer velocity from empirical wind speed equations (Cole and Caraco, 1998; Jähne et al., 1987; Smith, 1985; Wanninkhof, 1992); KH is Henry's coefficient calculated using water temperature empirical equations (Plummer and Busenberg, 1982); (µatm) is the CO2 partial pressure in the atmosphere using air pressure data (Lin et al., 2021, 2022), where the atmospheric CO2 concentration is assumed to be 400 ppm; and (µatm) is the CO2 partial pressure at the water surface at around 0.04 m water depth from water quality data (temperature, pH, and DIC concentrations). The empirical equation (Cai and Wang, 1998) was also used by Lin et al. (2021). contributed approximately half of the net ecosystem production (NEP) across the water surface to the atmosphere for YYL (Lin et al., 2021). Further, because sediment carbon may be an important flux into shallow subtropical lakes, the sediment C flux (BFDIC or BFDOC, mg C L−1) in the lower layer was considered (Lin et al., 2022).
We assumed that the river discharge and outflow discharge (Qout, m3 d−1) were in a quasi-steady state (Qin=Qout), divided into upper-layer discharge (OU, m3 d−1) and lower-layer discharge (QL, m3 d−1) (Eq. 6). Lin et al. (2021) showed that the buoyancy frequencies in YYL were 0.011 ± 0.004 s−1, 0.013 ± 0.004 s−1, 0.006 ± 0.003 s−1, and 0.007 ± 0.004 s−1 for spring (March–May), summer (June–August), autumn (September–November), and winter (December–February), respectively, inhibiting the vertical profile of DIC mixing due to stratification. We estimated the percentages of OU and QL based on the buoyancy frequency following Lin et al. (2021, 2022). OU values were 75 %, 80 %, 45 %, and 50 % of Qin for spring, summer, autumn, and winter, respectively, and QL values were 25 %, 20 %, 55 %, and 50 % of Qin for the corresponding respective seasons (Table 2).
Extreme weather events might induce stronger seasonal thermal stratification from spring to summer and longer overturns from autumn to winter, thereby changing C distribution and transportation within waterbodies (Kraemer et al., 2021; Olsson et al., 2022a; Woolway et al., 2020). Thus, we attempted to simulate extreme climate scenarios; we shifted the ratio of Qin for each season and tested the river intrusion hypothesis. We established two extreme conditions: “Level 1” and “Level 2”. Level 2 is the more extreme condition: OU is 80 % (spring), 85 % (summer), 50 % (autumn), and 50 % (winter) of Qin; QL is 20 % (spring), 15 % (summer), 50 % (autumn), and 50 % (winter) of Qin. Level 1 is the condition between the present and the Level 2 condition: OU is 77 % (spring), 82 % (summer), 47 % (autumn), and 50 % (winter) of Qin; QL is 23 % (spring), 18 % (summer), 53 % (autumn), and 50 % (winter) of Qin (Table 2).
The contributions of photosynthesis production depended on the chlorophyll a (Chl a) concentration (ChlU or ChlL, mg L−1) and on the absorption coefficients in the upper layer (αPU, d−1) and lower layer (αPL, d−1). The coefficients of DOC remineralization rates in the upper layer (αMU, d−1) and lower layer (αML, d−1) were also considered in the conceptual models. PaU, PaL, PbU, and PbL are constants in the conceptual models. To obtain unknown values (αPU, αMU, αPL, αMU, αML, wI, BFDIC, BFDOC, PaU, PaL, PbU, and PbL), we applied multiple linear regression analysis. Further, these unknown values were tested by trial and error to obtain the parameters of the “Best-fit” condition (Nakayama et al., 2022). The same parameters of the Best-fit condition were used to obtain the extreme conditions for Level 1 and Level 2. We used the coefficient of determination (R2) and the Nash–Sutcliffe efficiency (NSE) coefficient (Nash and Sutcliffe, 1970) to quantify the performance of the equation model with DIC and DOC sampling data (observation data) for each simulation as follows:
where Obs represents observation data of DIC and DOC concentrations, and Sim represents Best-fit scenario data for the conceptual model.
2.3.3 DIC and DOC fluxes
Net ecosystem production (NEP) was defined as the difference between gross primary production (GPP) and ecological respiration (ER), NEP = GPP − ER, due to photosynthesis and respiration via biota (Dodds and Whiles, 2020). Given that we assumed that the C fluxes were dependent on the river inflows in YYL (Fig. 1), we estimated the NEP via end-member analysis using the C concentration of the river inflow and outflow (Lin et al., 2021; Nakayama et al., 2020), following Eqs. 9–12. The upper-layer NEP of the DIC flux (mg C d−1) was obtained from Eq. (1) as follows:
The upper-layer flux of the DOC flux () was estimated from Eq. (2):
The lower-layer flux of DIC flux () was estimated from Eq. (3):
The lower-layer flux of DOC flux () was estimated from Eq. (4):
Thus, the respective total fluxes of DIC and of DOC are as follows:
Here, FC is , and trU and trL are residence times (d)T in the upper and lower layers, respectively. These parameters were used for the Best-fit condition, as shown in Table 2.
3.1 Measurement data (monthly DIC, DOC, and Chl a concentrations) in typhoon and non-typhoon years
The comparisons between the two typhoon years (2015 and 2016) revealed no significant differences in DIC, DOC, or Chl a concentrations between the upper and lower layers; however, all of these parameters differed significantly between the layers in the non-typhoon years of 2017 and 2018 (Fig. 2). This was due to typhoon-induced mixing and lower thermal stratification between the upper and lower layer (Lin et al., 2021, 2022). Overall, the average DICU and DICL were 2.06 and 3.66 mg C L−1, respectively; the average DOCU and DOCL were 5.87 and 8.02 mg C L−1, respectively; and ChlU and ChlL were 2.13 and 18.5 µg C L−1, respectively. In typhoon years, the average DICU and DICL were 2.34 and 4.07 mg C L−1, respectively; the average DOCU and DOCL were 6.10 and 8.38 mg C L−1, respectively; and the ChlU and ChlL were 2.38 and 12.2 µg C L−1, respectively (Fig. 2). In non-typhoon years, the average DICU and DICL were 1.81 and 3.28 mg C L−1, respectively; the average DOCU and DOCL were 5.66 and 7.67 mg C L−1, respectively; and ChlU and ChlL were 1.89 and 24.4 µg C L−1, respectively (Fig. 2).
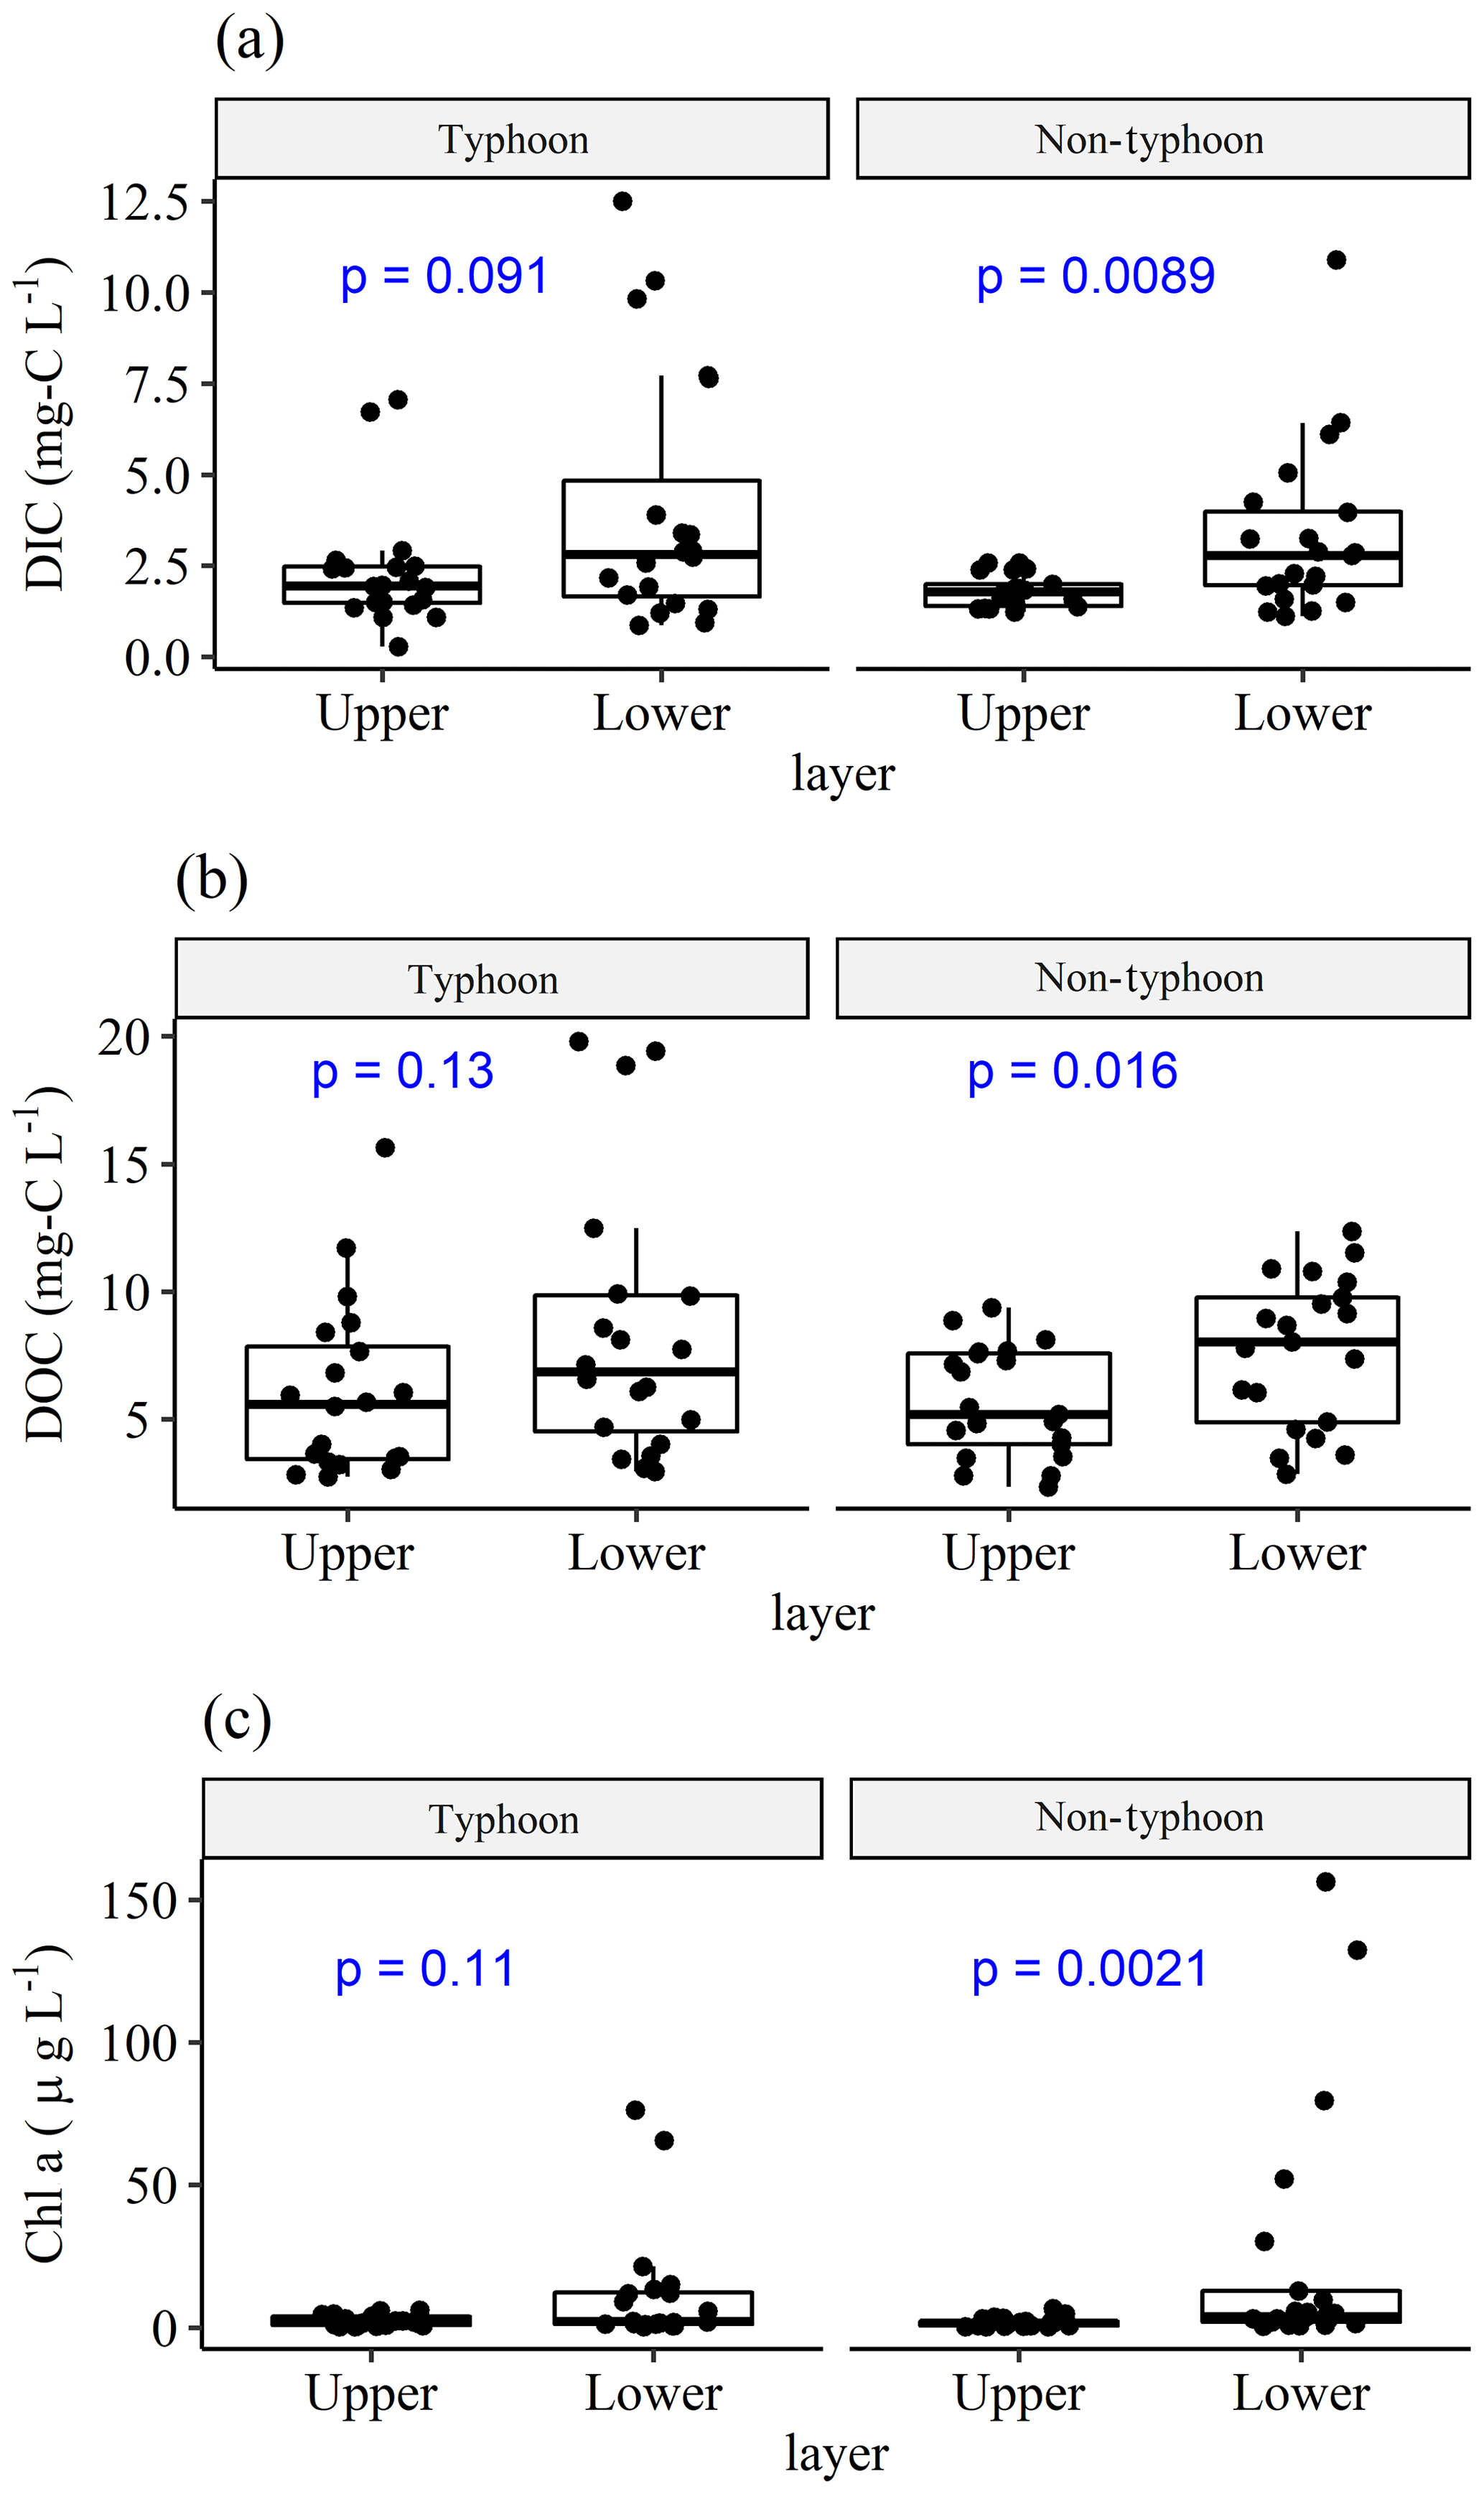
Figure 2Comparisons of (a) DIC, (b) DOC, and (c) Chl a between upper (DICU, DOCU, and ChlU) and lower (DICL, DOCL, and ChlL) layers, grouped by typhoon and non-typhoon years. Bullet points show the water sampling data. We used a t test to obtain the p values (blue text). Total sampling numbers are 41 (n=41) for each measurement from January 2015 to December 2018; n=20 in typhoon years and n=21 in non-typhoon years.
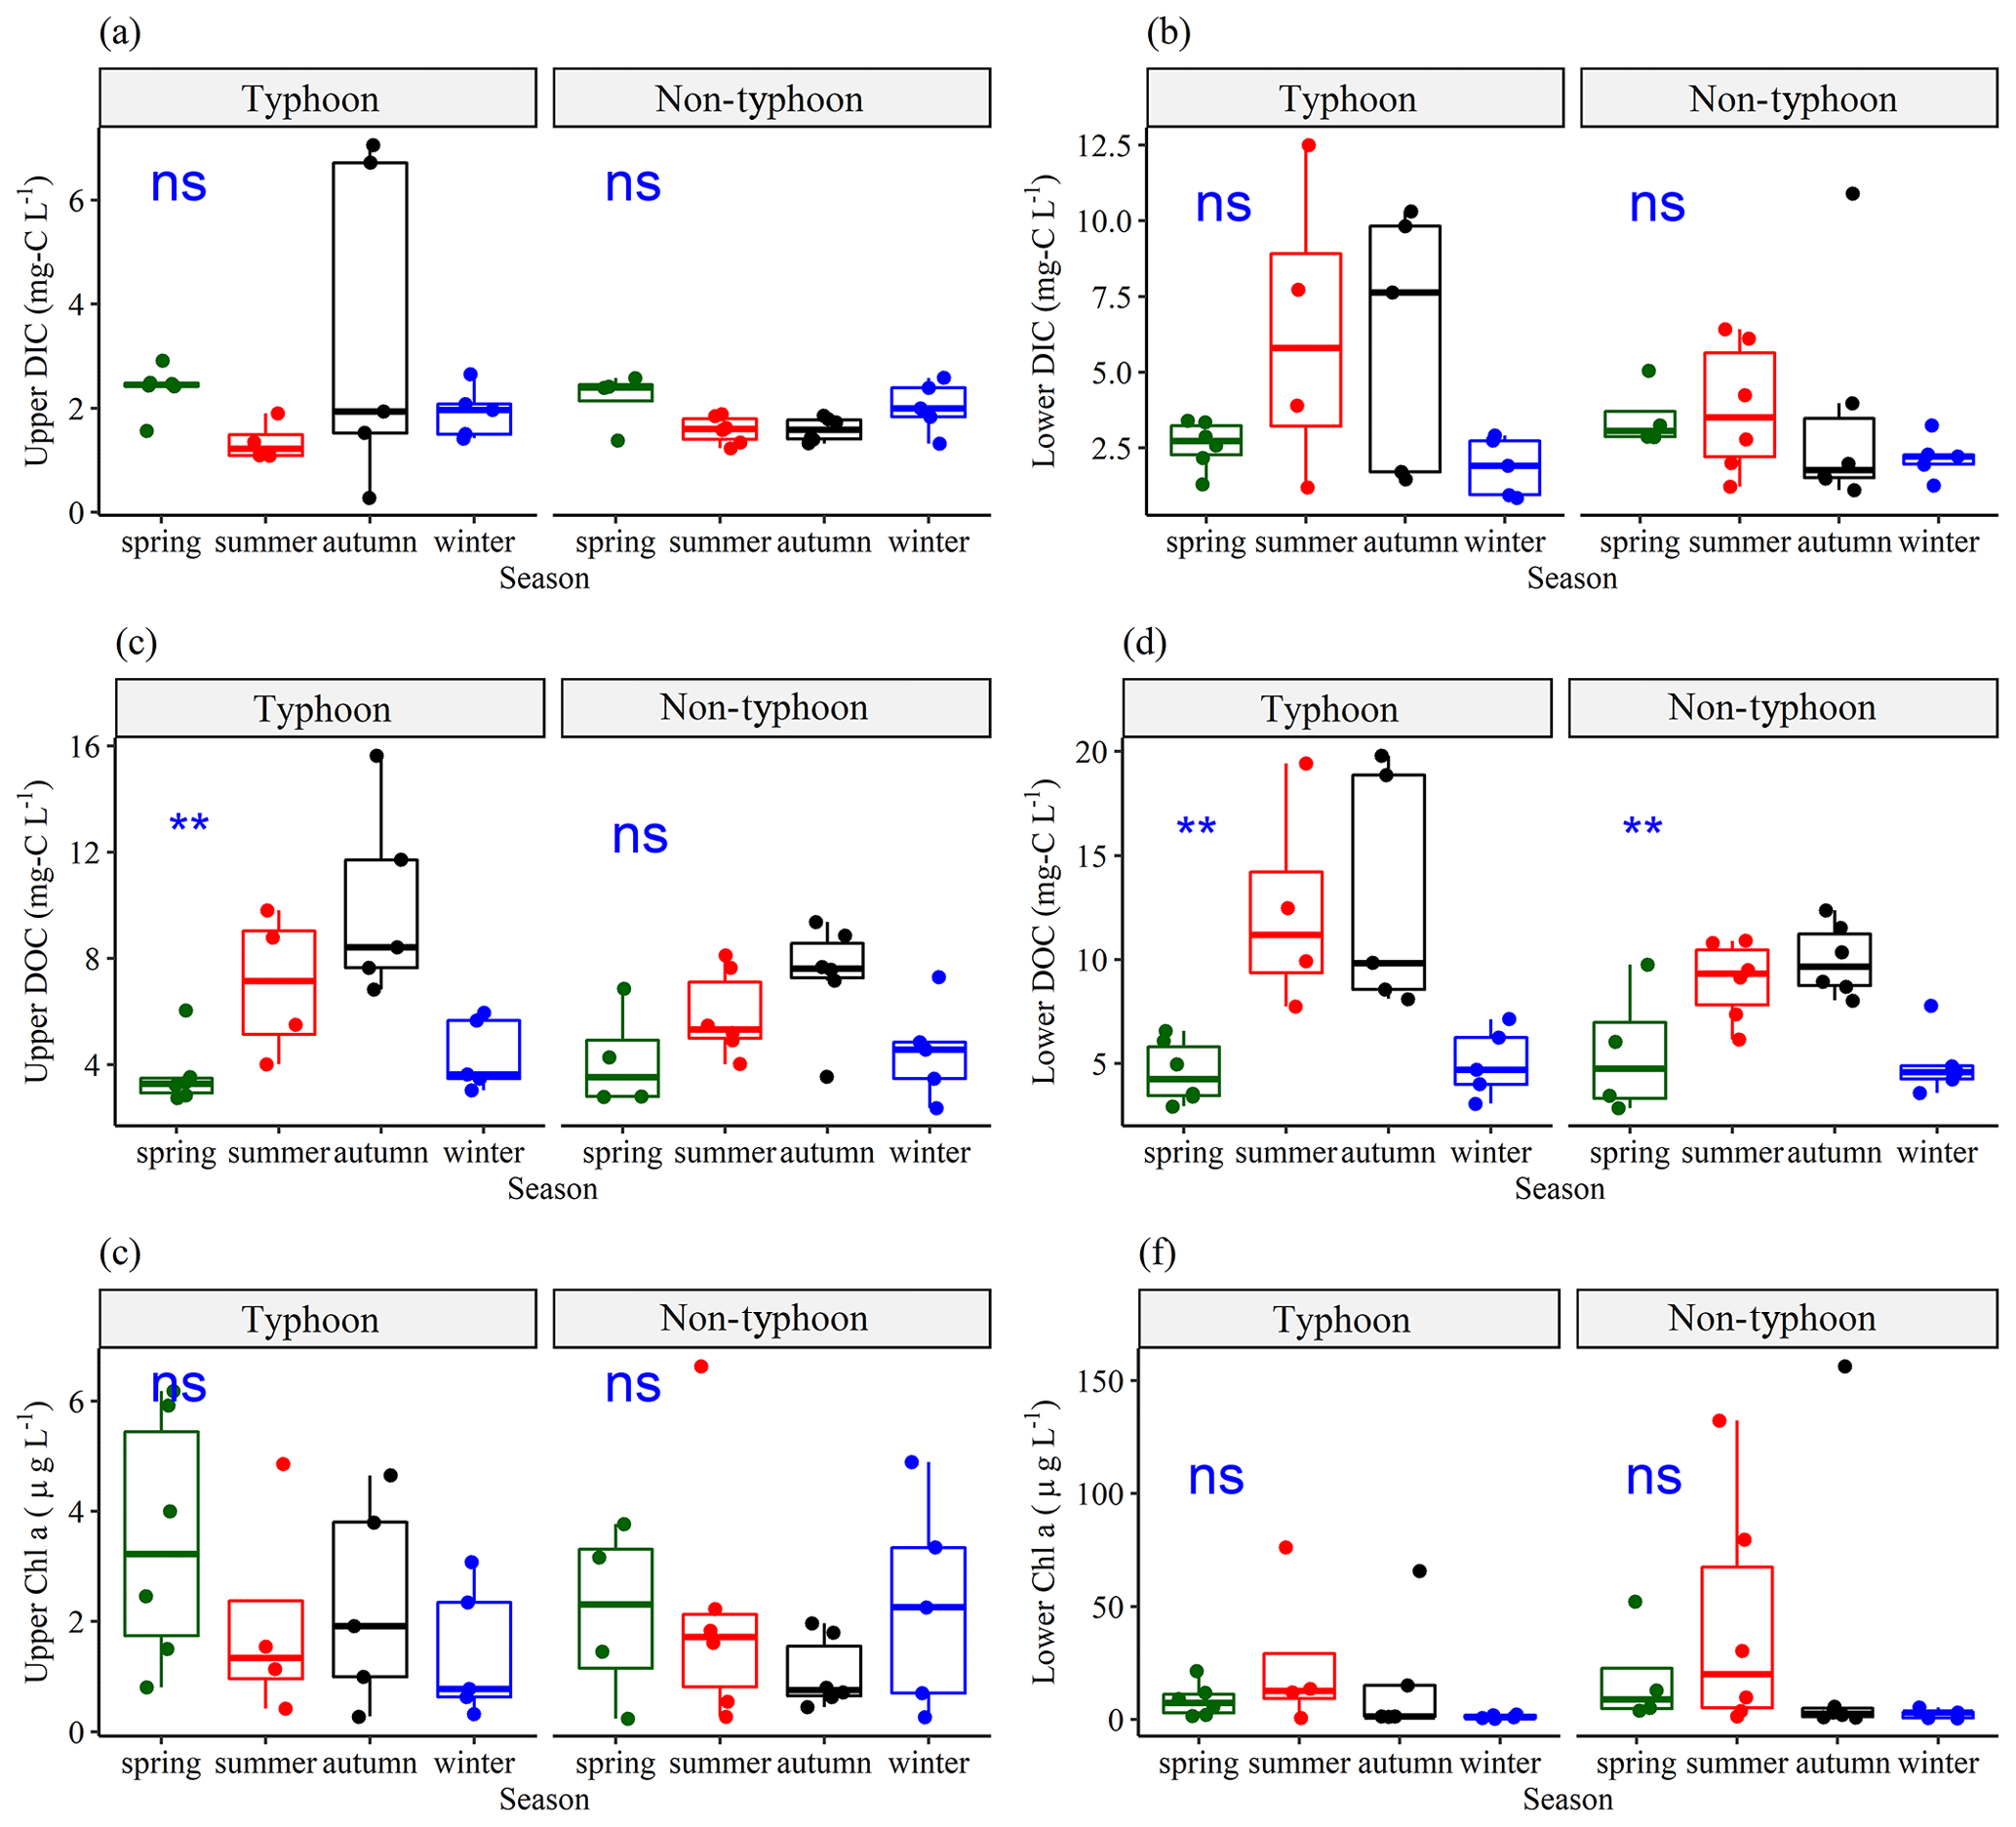
Figure 3Seasonal variations in (a) upper-layer DIC (DICU), (b) lower-layer DIC (DICL), (c) upper-layer DOC (DOCU), (d) lower-layer DOC (DOCL), (e) upper-layer Chl a (ChlU), and (f) lower-layer Chl a (ChlL), grouped by typhoon and non-typhoon years. The bullet points show the water sampling data. To determine seasonality, we used a one-way ANOVA to obtain the p values. The significance of the p values is defined as follows: “ns” (not significant) represents p values ≥ 0.05, “∗” shows p values from 0.05 to 0.01, and “” represents p values from 0.01 to 0.001.
ANOVA results indicated no significant differences in DIC concentrations among seasons during typhoon years (p values ≥ 0.05), suggesting a lack of statistically significant variation in DIC data across seasons (Fig. 3a, b). However, the DOC concentration showed significant differences between seasons in typhoon years (Fig. 3c, d). No significant differences between ChlU and ChlL were observed among the seasons (Fig. 3e, f), whereas the standard deviation (SD) values of DIC and DOC were higher in summer and autumn (Fig. 3) due to terrestrial C loading (Chiu et al., 2020). In summer, the SD values of DICU and DOCU were 3.51 mg C L−1 and 3.69 mg C L−1, respectively (Fig. 3a, c, e). In autumn, DICL and DOCL had the highest SD values (4.06 and 4.17 mg C L−1, respectively) (Fig. 3b, d). Notably, the maximums of DICU and DOCU were 7.06 and 15.6 mg C L−1, respectively, and those of DICL and DOCL were 10.9 and 19.8 mg C L−1, respectively, in typhoon years (Fig. 3a, b, c, d).
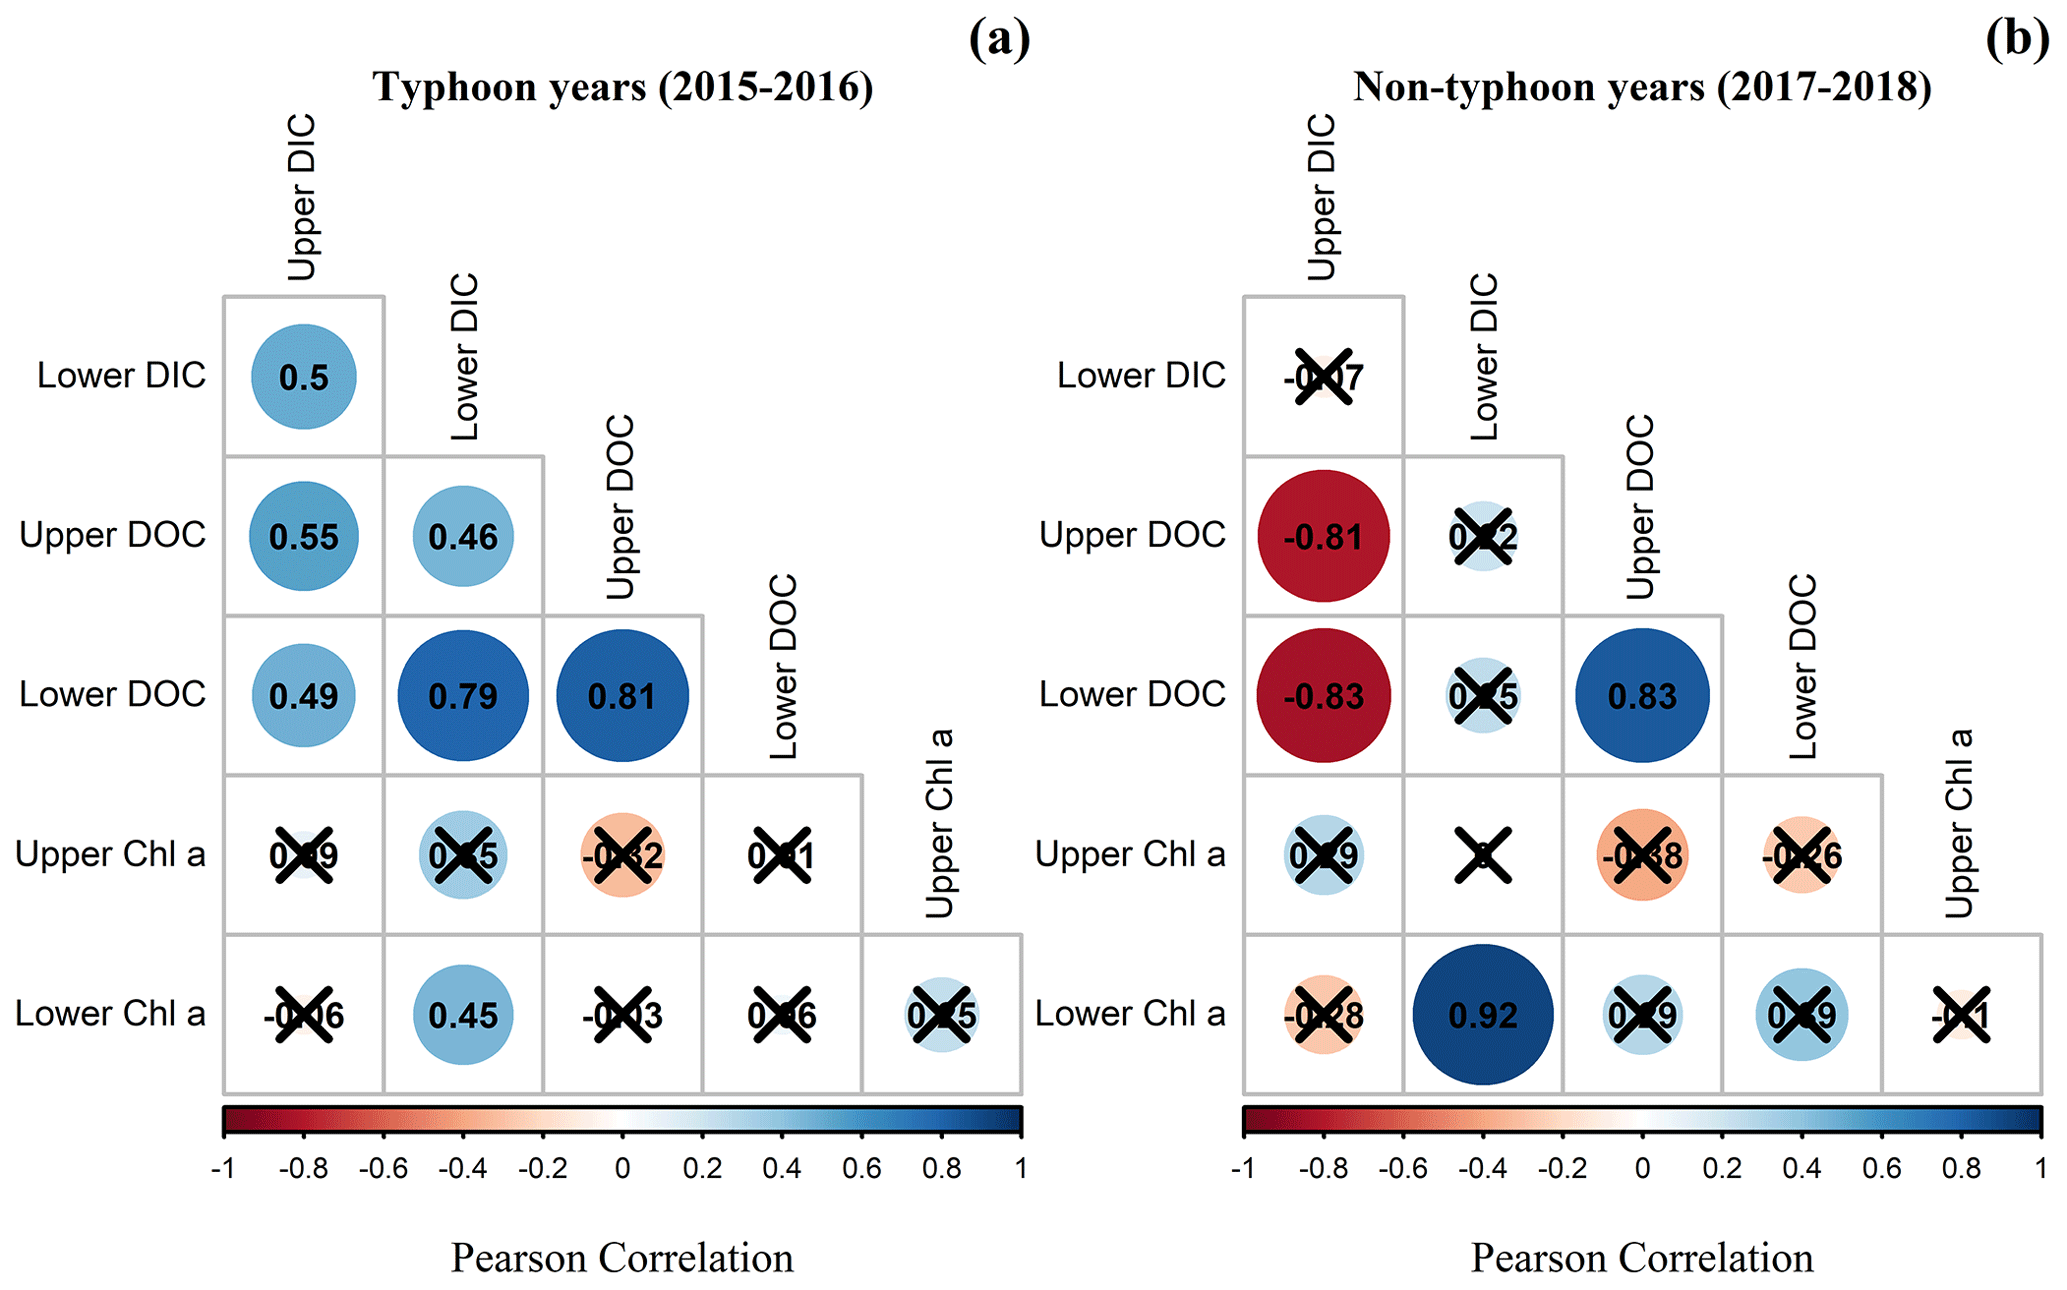
Figure 4Pearson correlation coefficients of the DIC, DOC, and Chl a concentrations for upper-layer and lower-layer DIC (DICU and DICL, respectively), upper-layer and lower-layer DOC (DOCU and DOCL, respectively), and upper-layer and lower-layer Chl a (ChlU and ChlL, respectively) during (a) typhoon years and (b) non-typhoon years. Black-crosses show insignificant values (p values are > 0.05).
Positive Pearson correlations of 0.45 to 0.80 were observed between the DOC and DIC in typhoon years (Fig. 4a). In the non-typhoon years, the upper-layer DIC was the only variable that was negatively correlated with DOC in the upper and lower layers (Fig. 4b). DIC in the lower layer was positively correlated with the ChlL (Fig. 4) due to the abundant respiration in the lower layer (Lin et al., 2021; Tsai et al., 2008).
Table 3Best-fit parameters of a two-layer conceptual model of DIC and DOC for Yuan-Yang Lake from 2015 to 2018.
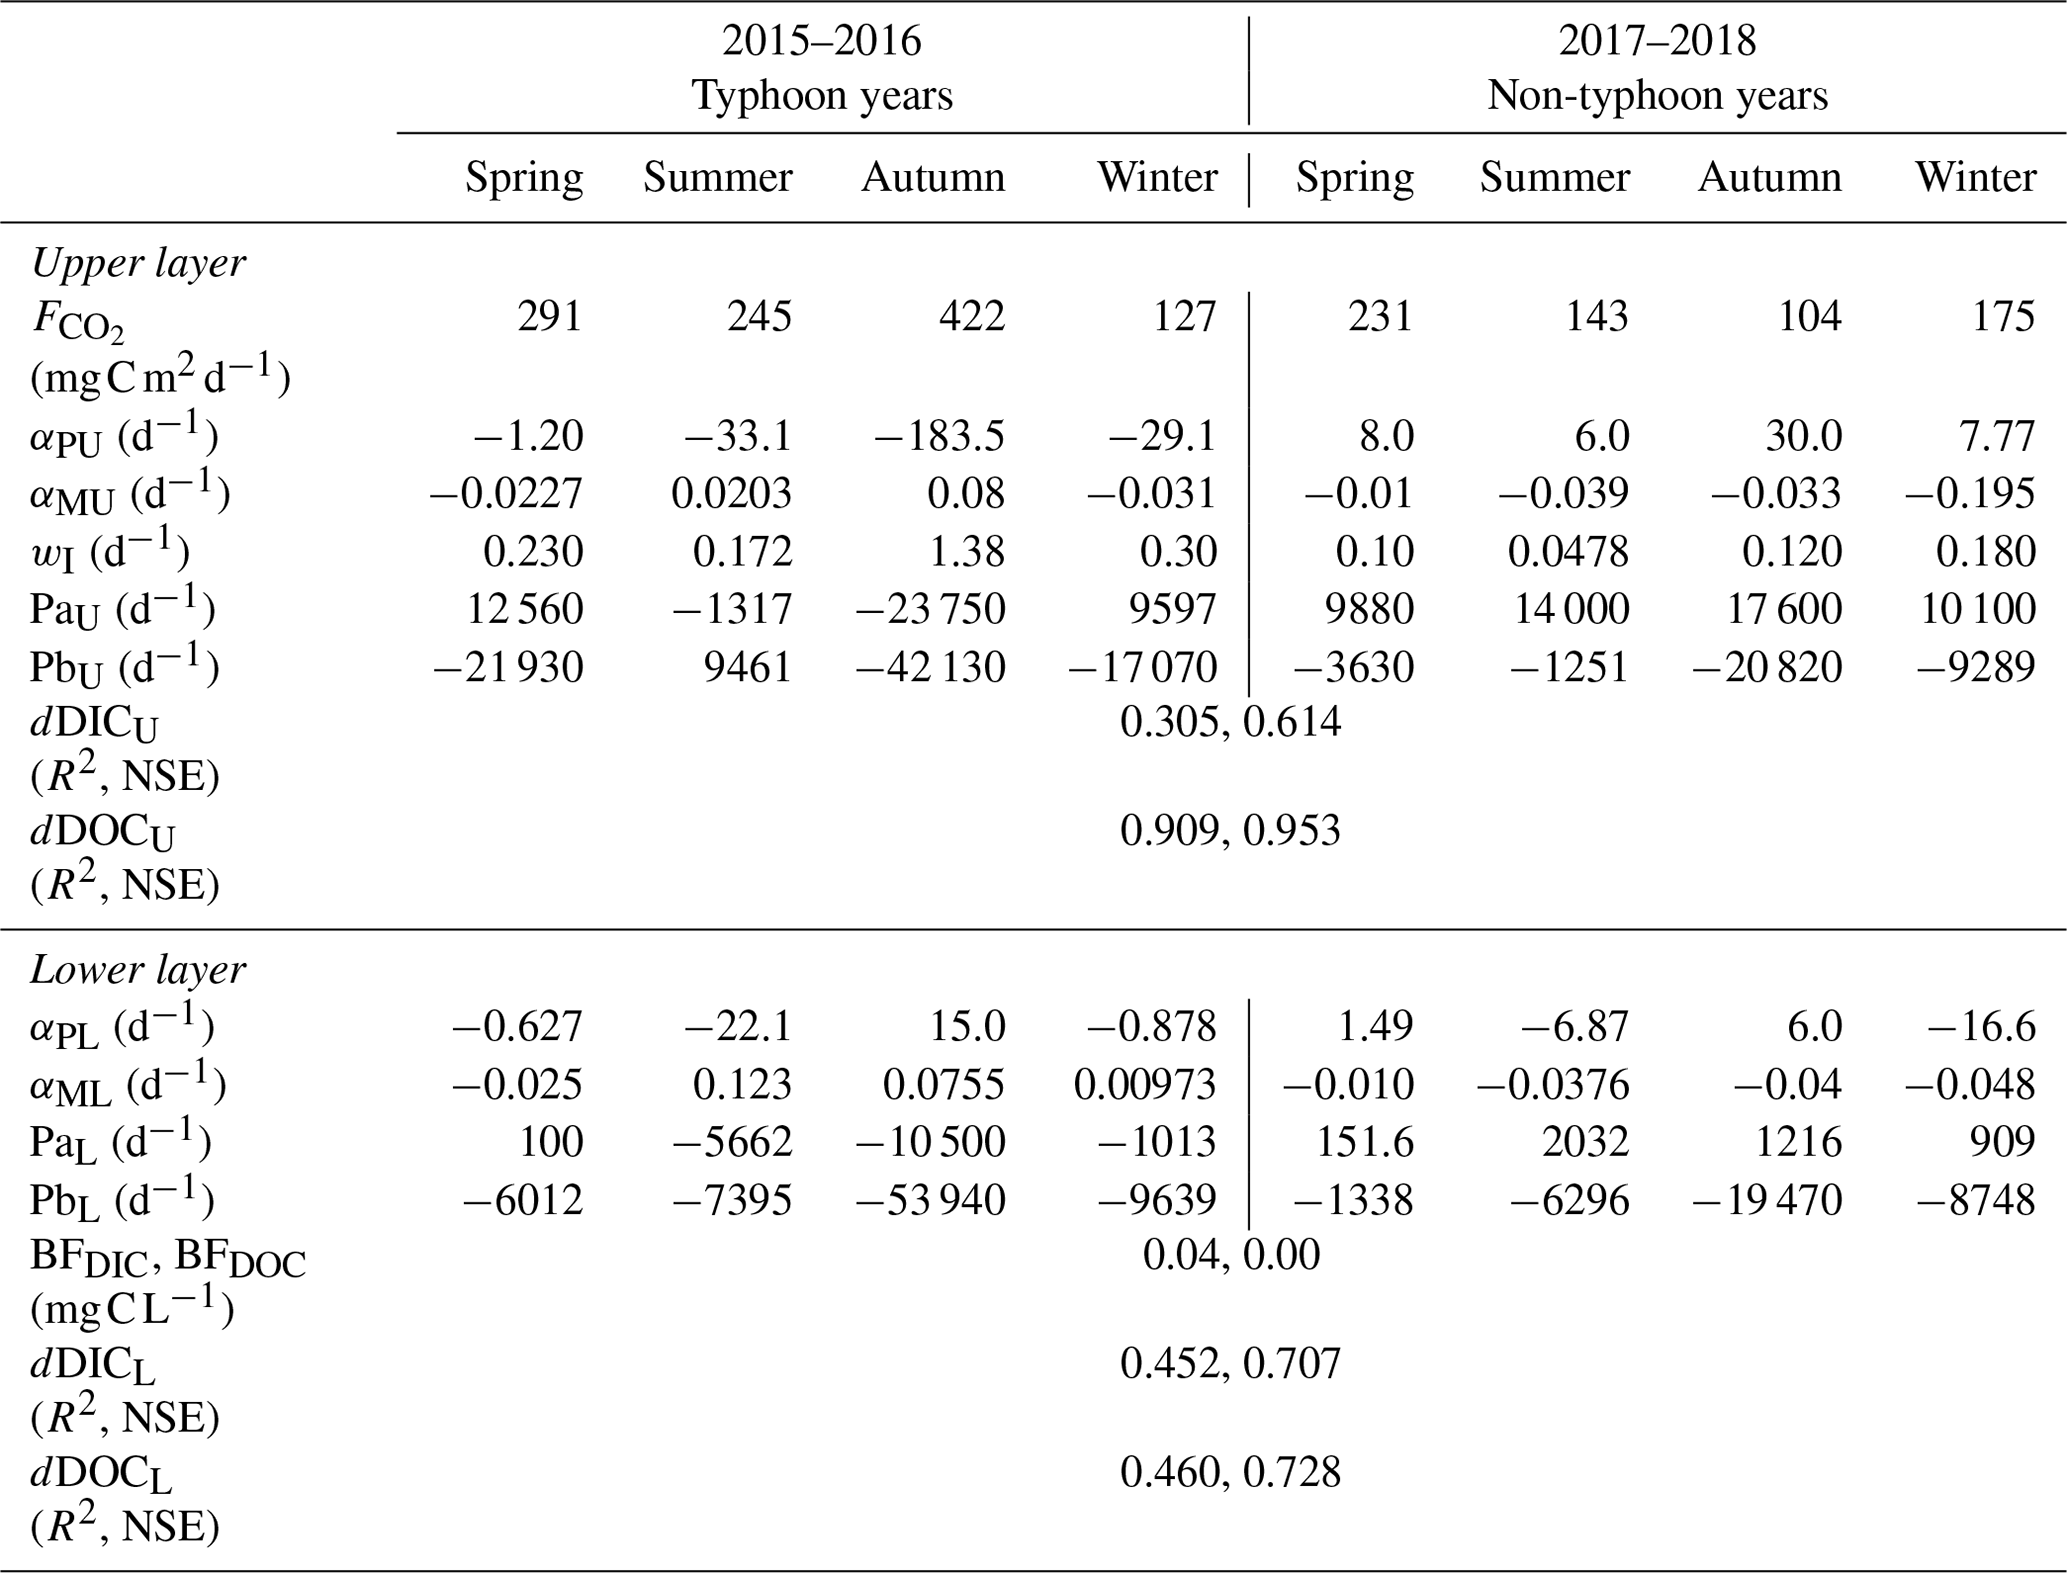
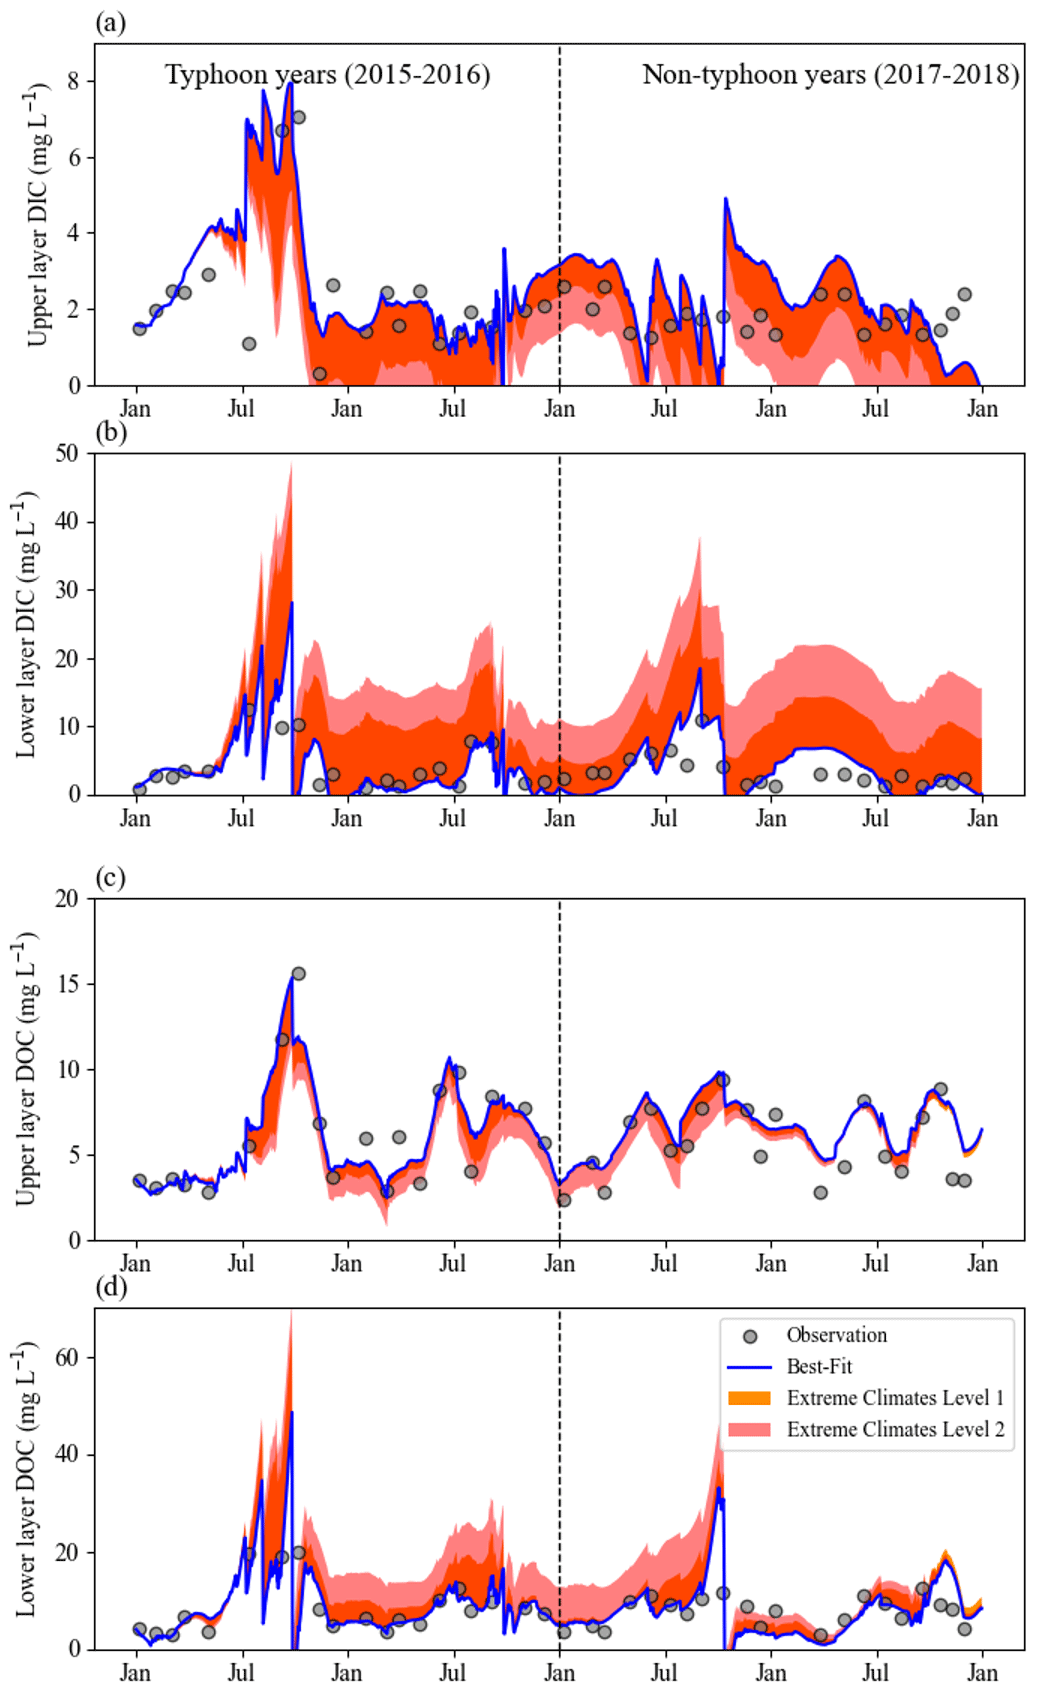
Figure 5Continuous daily DIC and DOC data for the (a, c) upper layer (DICU and DOCU, respectively) and (b, d) lower layer (DICL and DOCL, respectively) using the conceptual equation model under extreme climates from 2015 to 2018. Blue lines are the original Best-fit scenario data, for which the parameters of the DIC model in non-typhoon years are as shown in Table 3, and gray dots show water sampling (observation) data for each month (n=41) from January 2015 to December 2018. Orange regions show the Level 1 scenario and pink regions show the Level 2 scenario.
3.2 Performance of simulation data in the conceptual two-layer DIC and DOC models
The results for typhoon years demonstrated that DICU was around 1.5–5.0 mg C L−1 (Fig. 5a, b) and DICL was around 5.0 mg C L−1 (Fig. 5d). In the non-typhoon years (2017–2018), the NSE values of DICU and DICL were 0.61 and 0.70, respectively. On the other hand, the DOC values fit our observation data (R2 values are 0.91 and 0.46; the NSE coefficients from Eq. 8 are 0.95 and 0.73) (Fig. 5c, d; Table 3). The parameters for the conceptual two-layer DIC and DOC models showed different regimes between typhoon and non-typhoon years (Table 3). In typhoon years, the photosynthesis absorption rate coefficients (αPU and αPL) were negative (photosynthesis < respiration) for each season. YYL was a C source due to a large allochthonous C loading during typhoons; the respiration was elevated by around 30- to 150-fold from summer to autumn. However, the values of the transportation coefficients (wI) were higher in autumn than in the other seasons (Table 3). Further, the higher remineralization rates during typhoon disturbances from summer to autumn resulted in positive αMU and αML. In non-typhoon years, the remineralization rates were negative (Table 3).
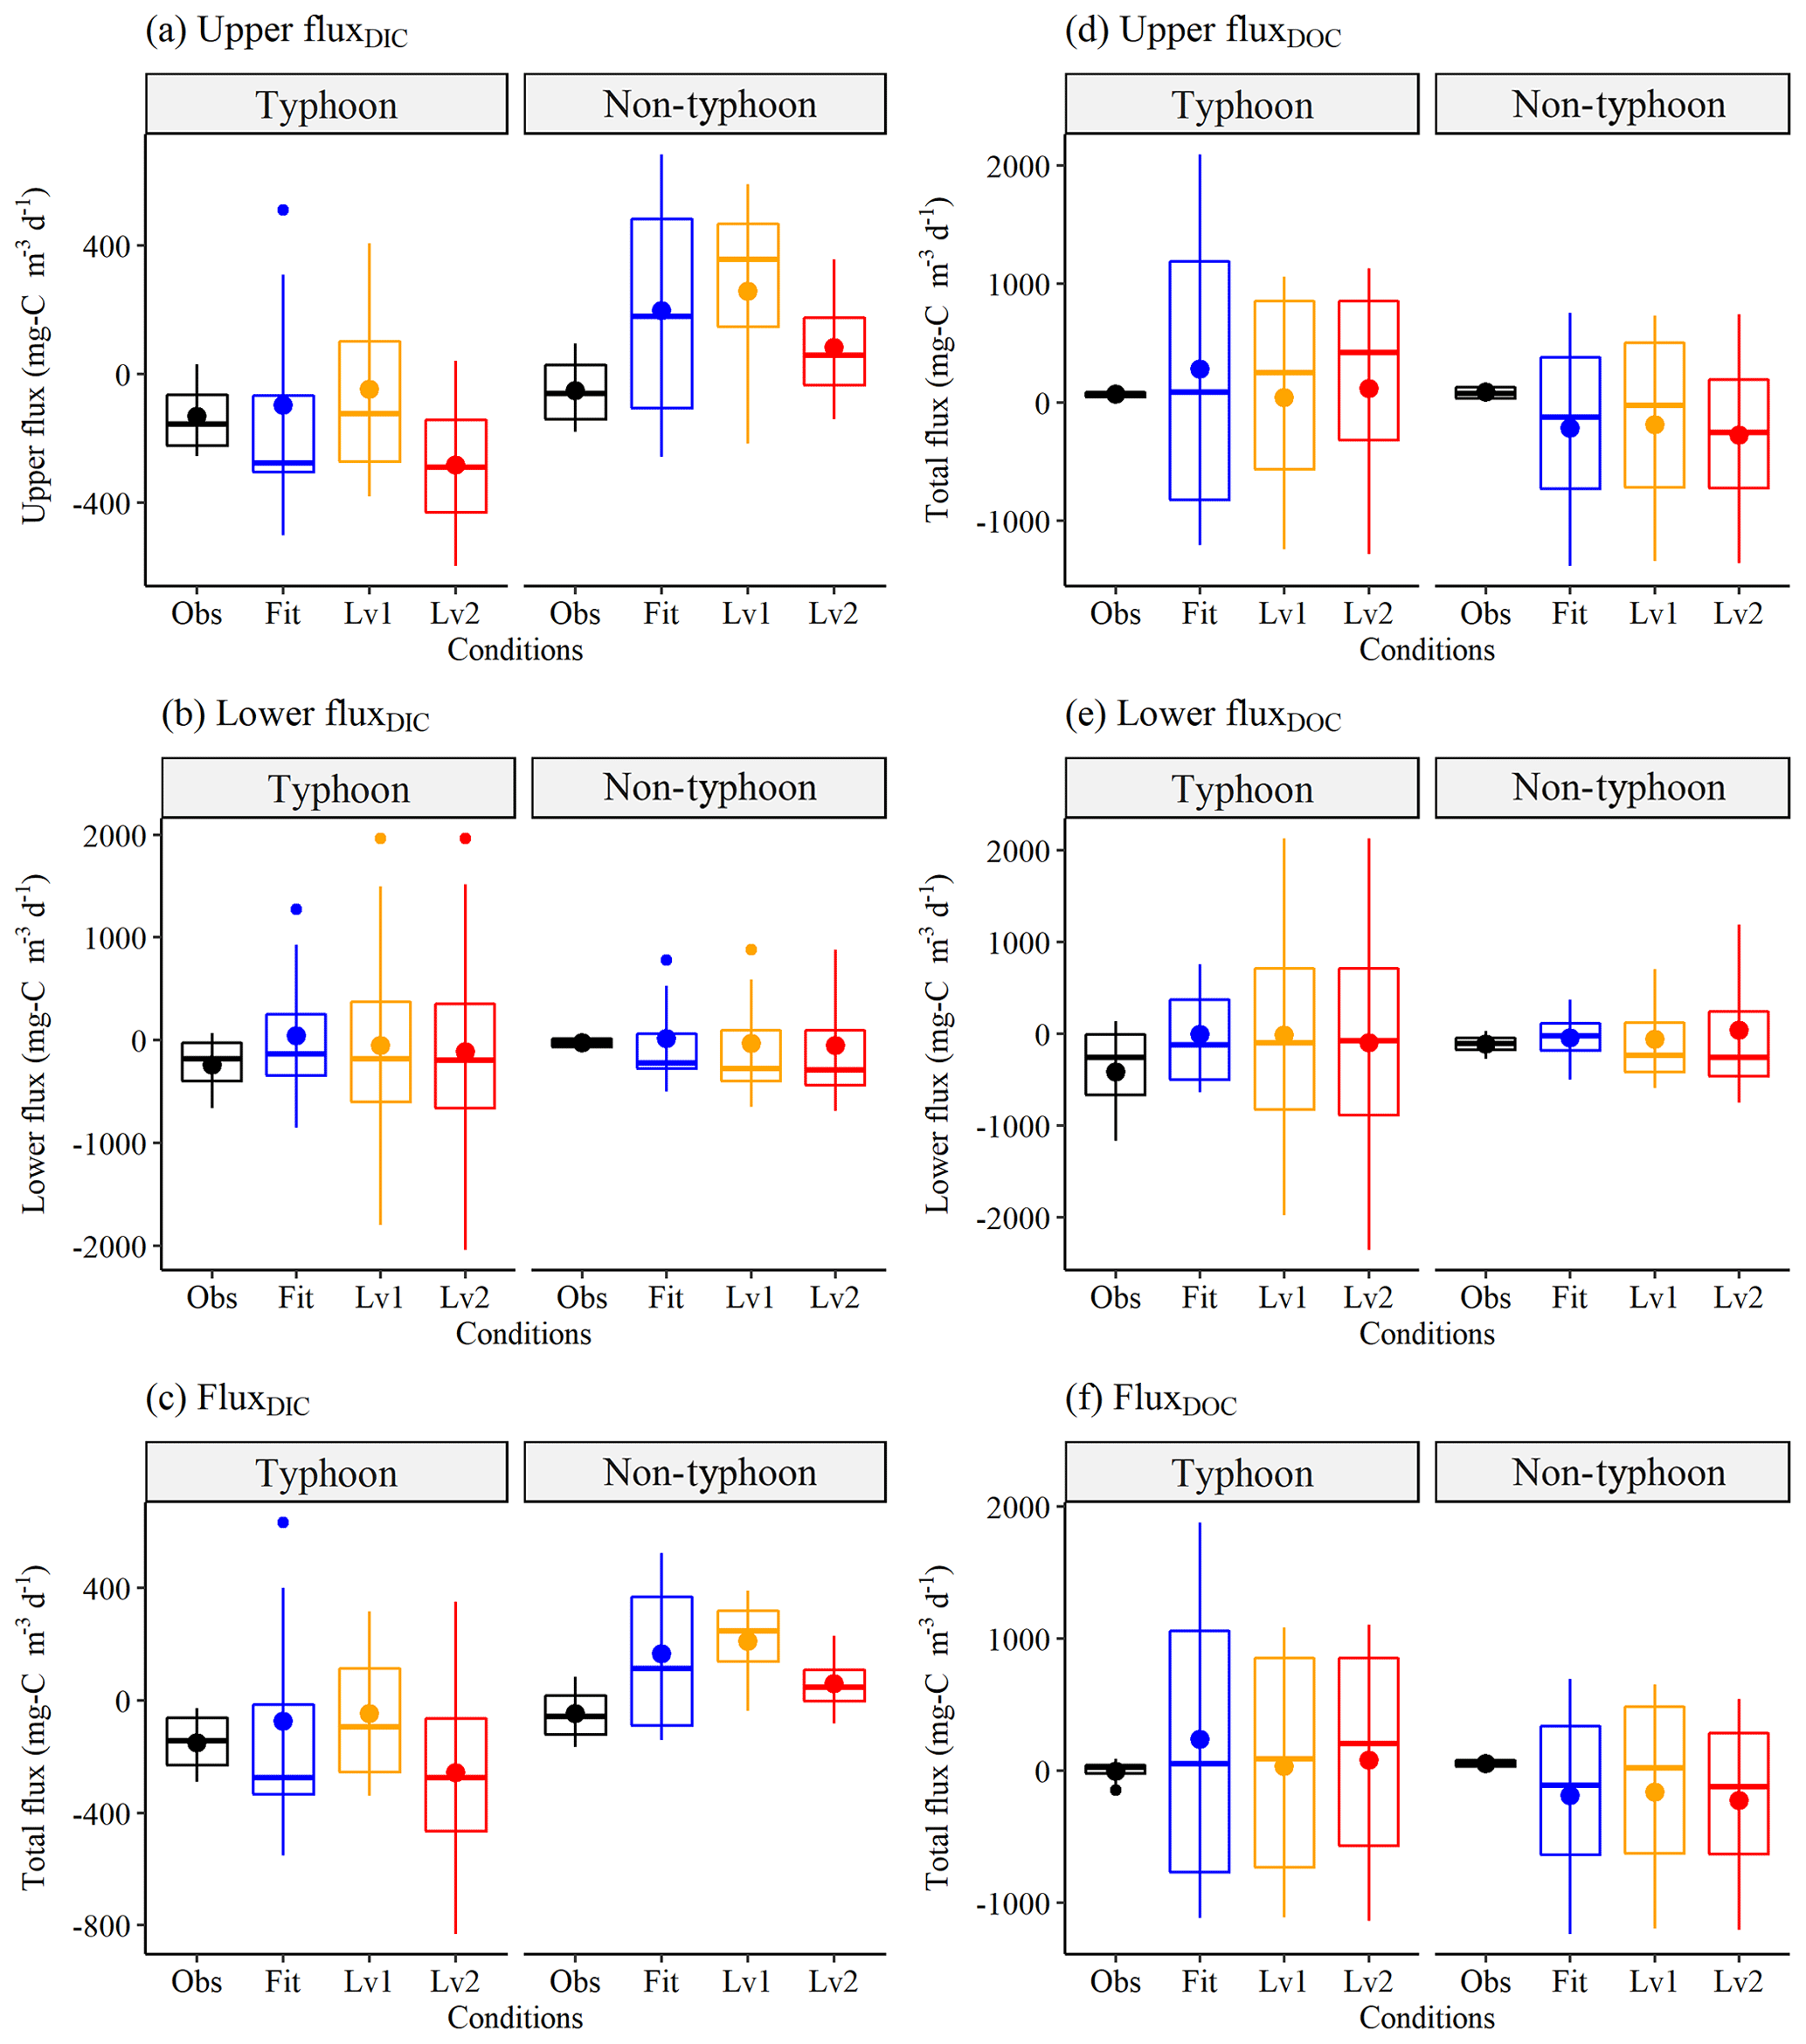
Figure 6Interannual (a) Upper fluxDIC, (b) Lower fluxDIC, (c) FluxDIC, (d) Upper fluxDOC, (e) Lower fluxDOC, and (f) FluxDOC values () grouped by typhoon and non-typhoon years. The Obs condition (black boxes) shows the observation data, as in Fig. 5. The Fit condition (blue boxes) shows the Best-fit scenario data using the conceptual two-layer carbon model, as in Fig.5. Level 1 (yellow boxes) and Level 2 (red boxes) show the extreme scenarios, as in Fig. 6. For the definitions of fluxes, the reader is referred to Sect. 2.3.3. Positive values refer to a carbon sink, whereas negative values show carbon released within YYL.
We simulated the responses of DIC and DOC to typhoons using conceptual two-layer C models. The results showed that the DIC was more sensitive to typhoon disturbances than DOC under the Level 1 and Level 2 scenarios (Fig. 5). Overall, the C level declined in the upper layers but increased in the lower layers (Fig. 5). DIC and DOC in the upper layer tended to decline from 1.0 mg C L−1 (Level 1) to 2.0 mg C L−1 (Level 2) (Fig. 5a, c); however, they increased to 10.0 and 20.0 mg C L−1 in the lower layer under the Level 1 and Level 2 scenarios, respectively (Fig. 5b, d). Under extreme weather conditions, Level 2 usually shifted to different typhoon responses for each season (Figs. S1 and S2 in the Supplement) due to extreme river intrusions and the strength of the thermal stratification (Lin et al., 2021). DIC changed more than DOC under the Level 1 and Level 2 scenarios (Fig. 5) because photosynthesis, transportation, and remineralization rates may crucially affect the seasonal and interannual patterns of DOC as well.
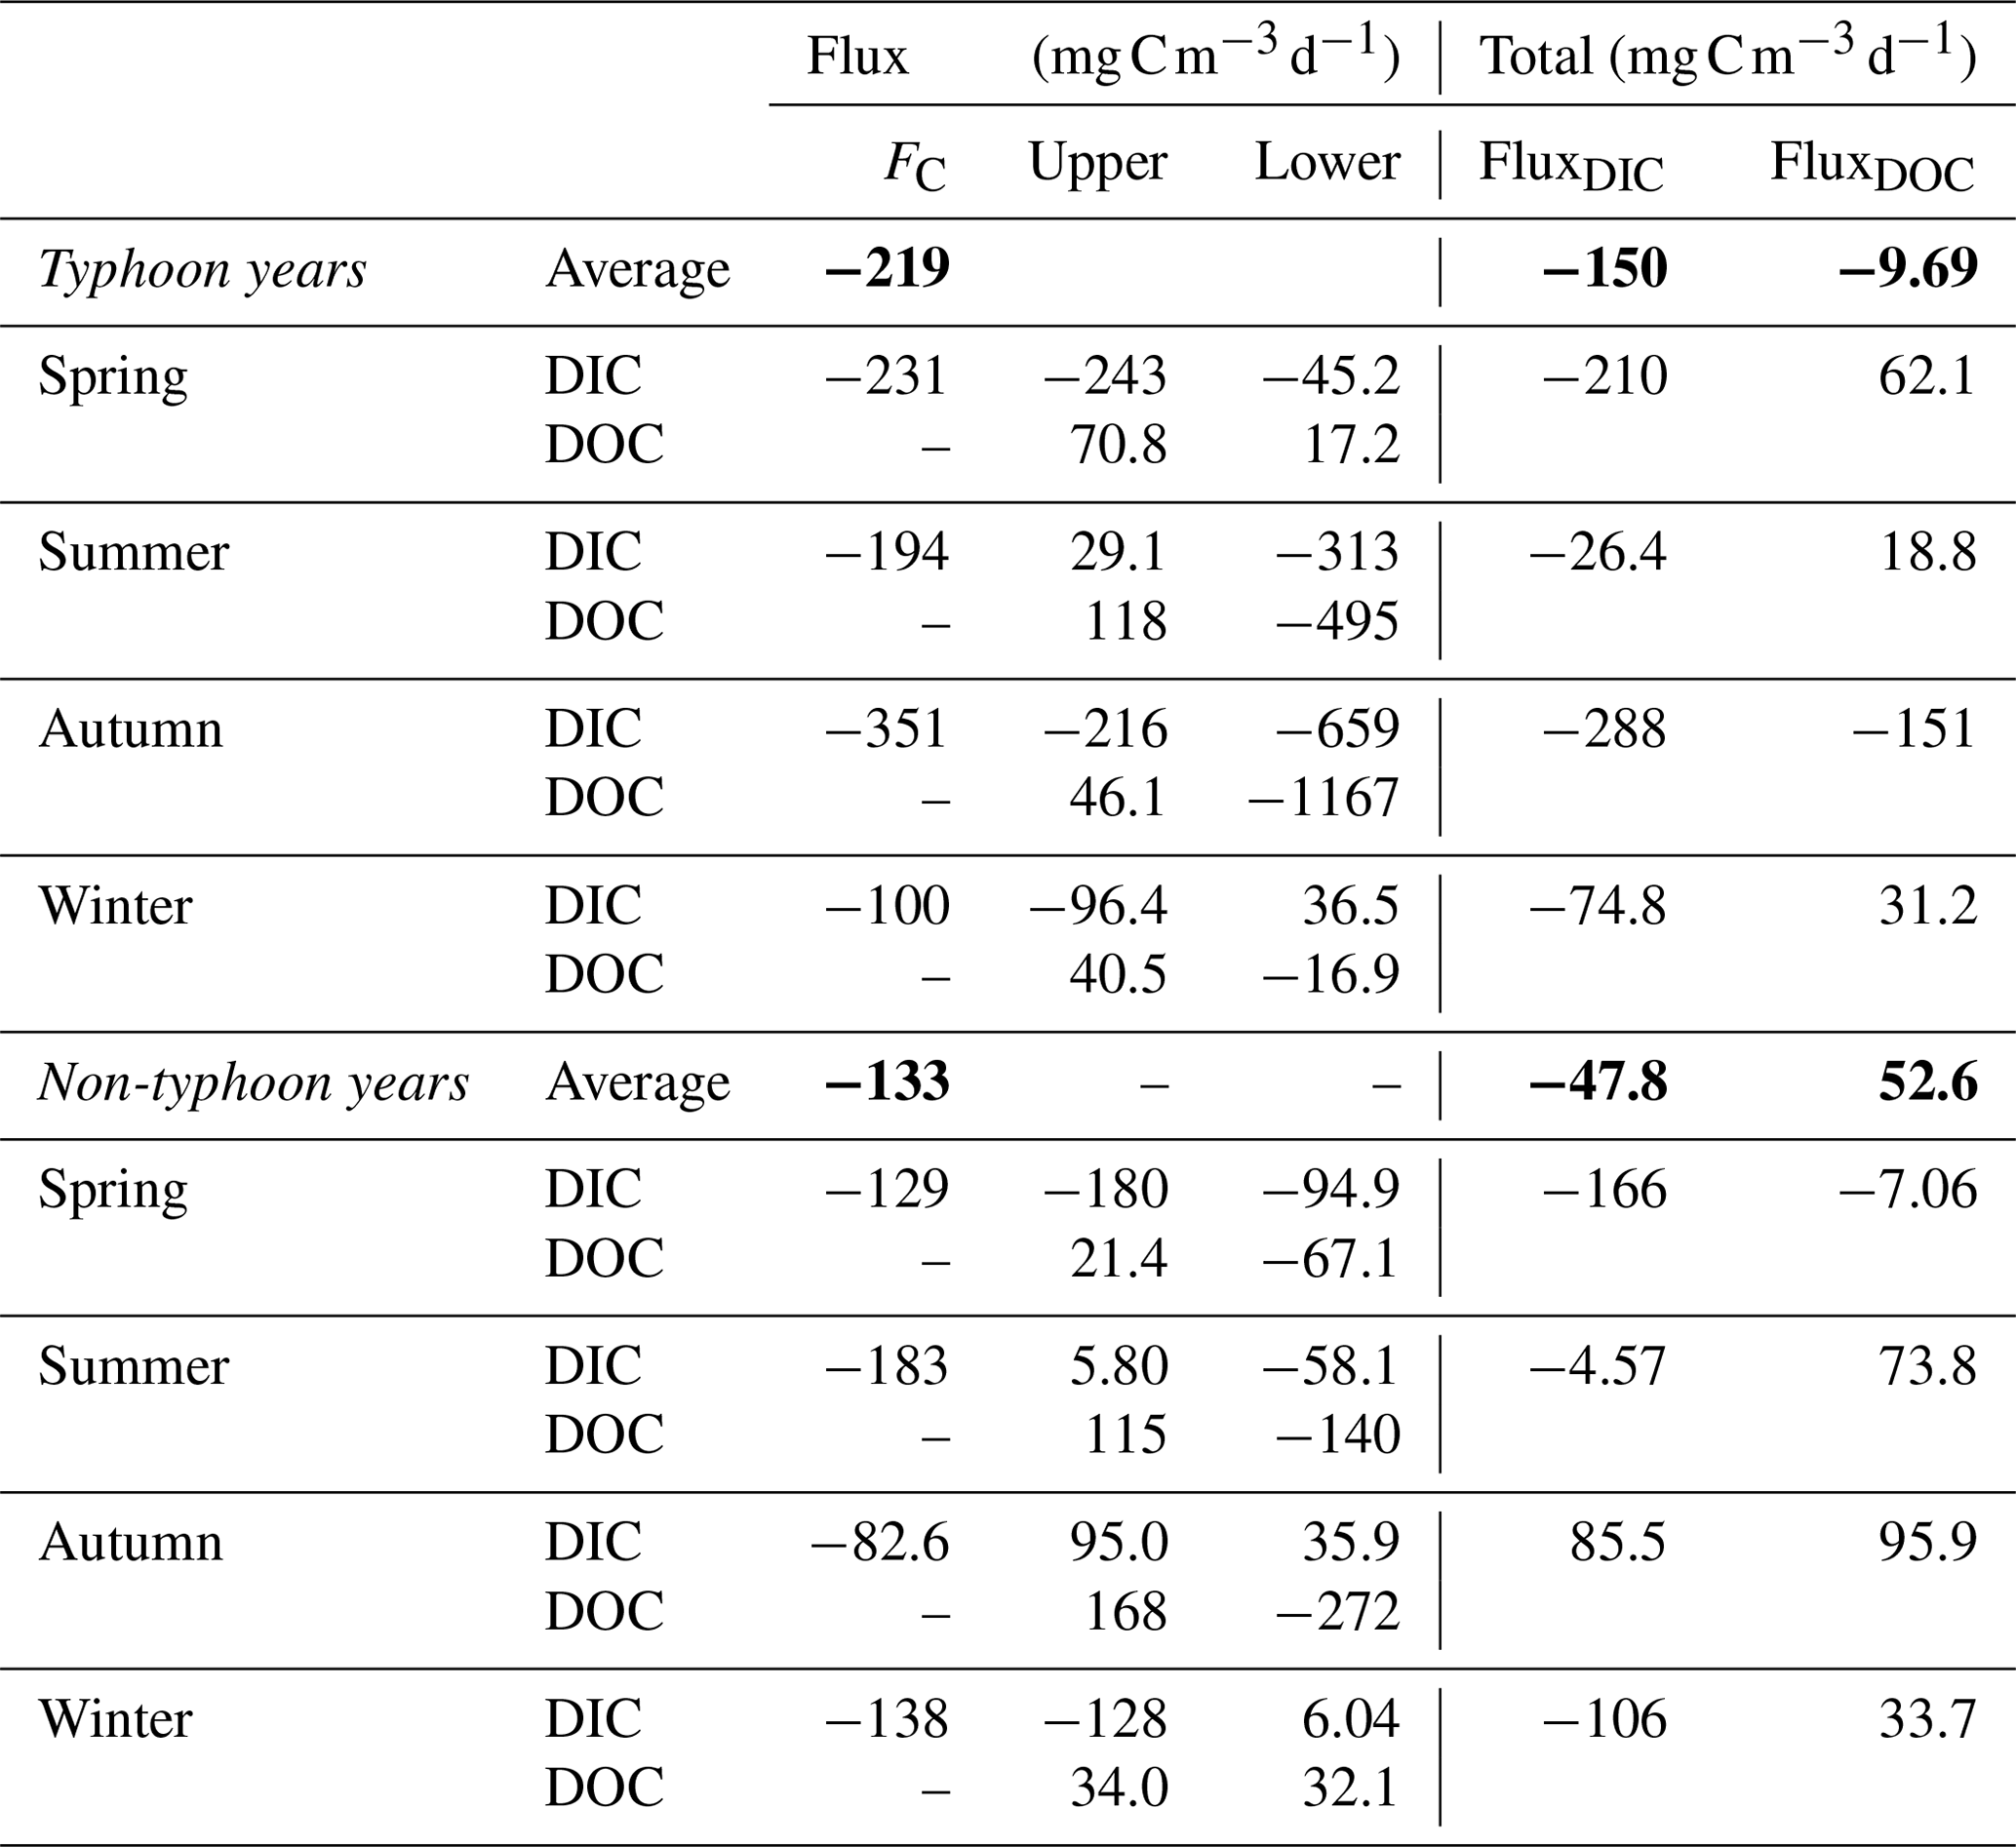
Table 4Seasonal carbon flux averages () for each season in Yuan-Yang Lake. Positive values represent a carbon sink, whereas negative values show that carbon was released. FC denotes carbon emission across water to air using the empirical equations method (Lin et al., 2021). The bold font represents average values from spring to winter.
3.3 Interannual responses of the NEP to typhoons under extreme weather scenarios
We used field observation data (Fig. 5) to estimate the C fluxes in Table 4. The typhoon disturbances in summer and autumn played an important role in promoting C release by YYL (Table 4). Overall, YYL released 245 of DIC and 415 of DOC during the typhoon years; during non-typhoon years, it released 51.7 of DIC and 22.8 of DOC (Table 4). The average FC was 219 and 133 released from YYL into the atmosphere in typhoon and non-typhoon years, respectively, which was 1–2 times larger than FluxDIC (Table 4). In summer, the upper layer exhibited declines in both the DIC and DOC concentrations, with DIC being approximately 3.7 times higher in typhoon years than in non-typhoon years (Table 4). In autumn, 216 mg C d−1 of upper-layer DIC was released in typhoon years, but 46.1 of upper-layer DOC was produced. The upper-layer FluxDIC was negative in autumn in typhoon years, as 268 more FC was released than in non-typhoon years. In addition, the lower layer exhibited the largest release of C into the outflow in typhoon years; however, the flux in the lower layer was more than twice as high in the summer compared with the autumn of those years (Table 4). The average total FluxDIC was a release of approximately 3.14 times more C in typhoon years than in non-typhoon years. The average total FluxDOC showed an increase of 62.3 of DOC between typhoon and non-typhoon years due to the over 10-fold higher flux in the upper layer (Table 4).
We compared the fluxes with different model conditions (Best-fit, Level 1, and Level 2), as shown in Fig. 6, demonstrating that the responses of FluxDIC to typhoons differed dramatically between the Level 1 and Level 2 scenarios (Fig. 6a, b, c); in particular, the Upper FluxDIC released more C in typhoon years and absorbed more C in non-typhoon years than Obs (Fig. 6a). Not only were the absolute values of FluxDIC over 3 times higher in typhoon years than in non-typhoon years (Table 4), but the SD was higher in typhoon years as well (Fig. 6). However, DOC fluxes changed less under the Level 1 and Level 2 scenarios (Fig. 6d, e, f), a finding that is consistent with our continuous DOC data (Fig. 5c, d).
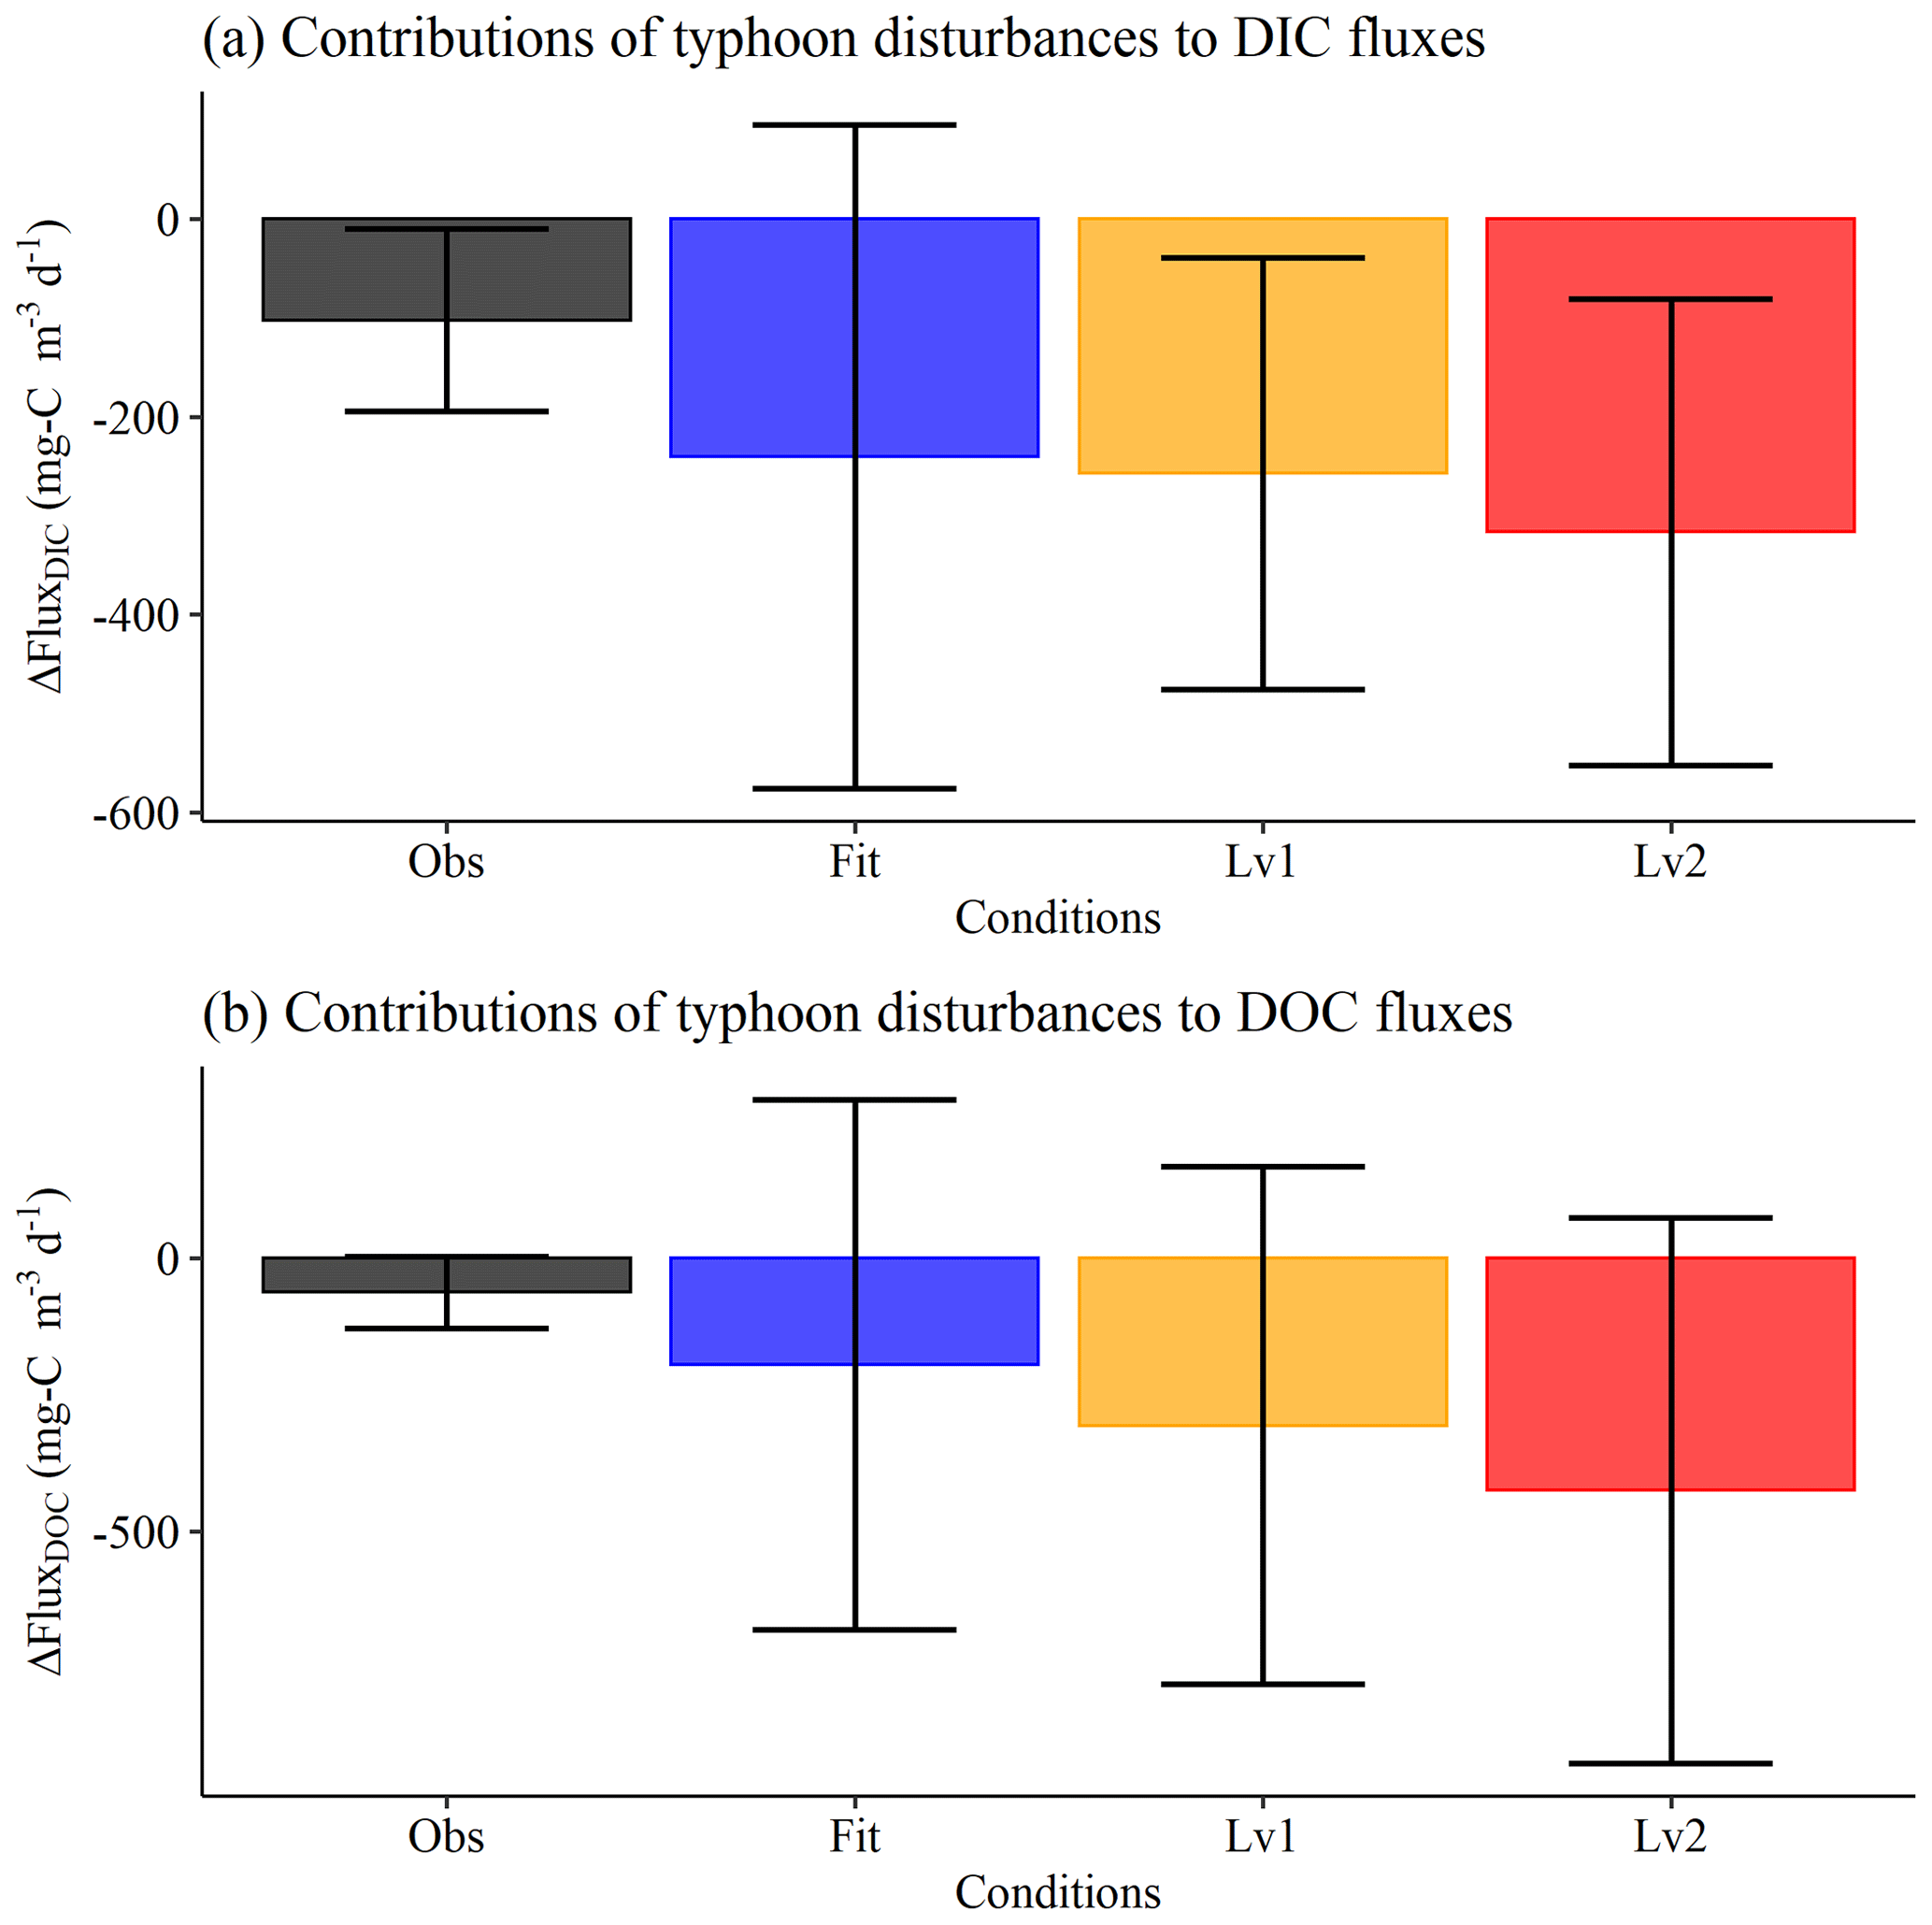
Figure 7Contributions of typhoon disturbances to (a) DIC and (b) DOC fluxes (). The contributions of typhoons to C fluxes (ΔFluxDIC and ΔFluxDOC) represented the intervals of FluxDIC (or FluxDOC) in typhoon years and non-typhoon years (e.g., ΔFluxDIC = FluxDIC in typhoon years − FluxDIC in non-typhoon years).
We not only attempted to establish the contributions of thermal stratification and river intrusion to DIC and DOC fluxes using the Level 1 and Level 2 scenarios in this conceptual model but we also examined the contributions of typhoon disturbances to DIC and DOC fluxes (Fig. 7). We found that DIC and DOC fluxes were both released (ΔFluxDIC and ΔFluxDOC, respectively) under the Level 1 and Level 2 scenarios (Fig. 7). Typhoon disturbances contributed −102.2 and −62.3 mg C m3 d−1 with respect to FluxDIC and FluxDOC in measurement (observation) data (Obs), respectively (Fig. 7). The averages of ΔFluxDIC under Best-fit conditions decreased by 7.0 % (Level 1) and 30.0 % (Level 2); ΔFluxDOC decreased by 56.9 % (Level 1) and 118 % (Level 2), respectively (Fig. 7).
4.1 Biochemical and physical differences in DIC and DOC fluxes between typhoon and non-typhoon years in YYL
The total precipitation was 35.6 % higher in typhoon years than in non-typhoon years (Table 1). Water retention and typhoon-induced upwelling controlled the dynamics of DIC and DOC during the summer and autumn (Chiu et al., 2020; Jones et al., 2009; Tsai et al., 2008, 2011). The absence of typhoon-induced upwelling affected water quality data differences between the upper and lower layers (Chiu et al., 2020; Lin et al., 2022; Tsai et al., 2008, 2011). DIC, DOC, and Chl a concentrations differed significantly between the upper and lower layers in non-typhoon years (Fig. 2). Further, the abundance of microorganisms can lead to intensive respiration in the lower layers during the non-typhoon period in YYL; for example, an anoxic condition at the hypolimnion may decrease the efficiency of C mineralization and remineralization in non-typhoon years (Carey et al., 2022; Chiu et al., 2020; Lin et al., 2022; Shade et al., 2010; Shade et al., 2011). Thus, the thermal stratification and anoxic condition may have been controlled by the seasonal and interannual patterns of DIC and DOC fluxes in non-typhoon years (Fig. 5; Tables 3, 4).
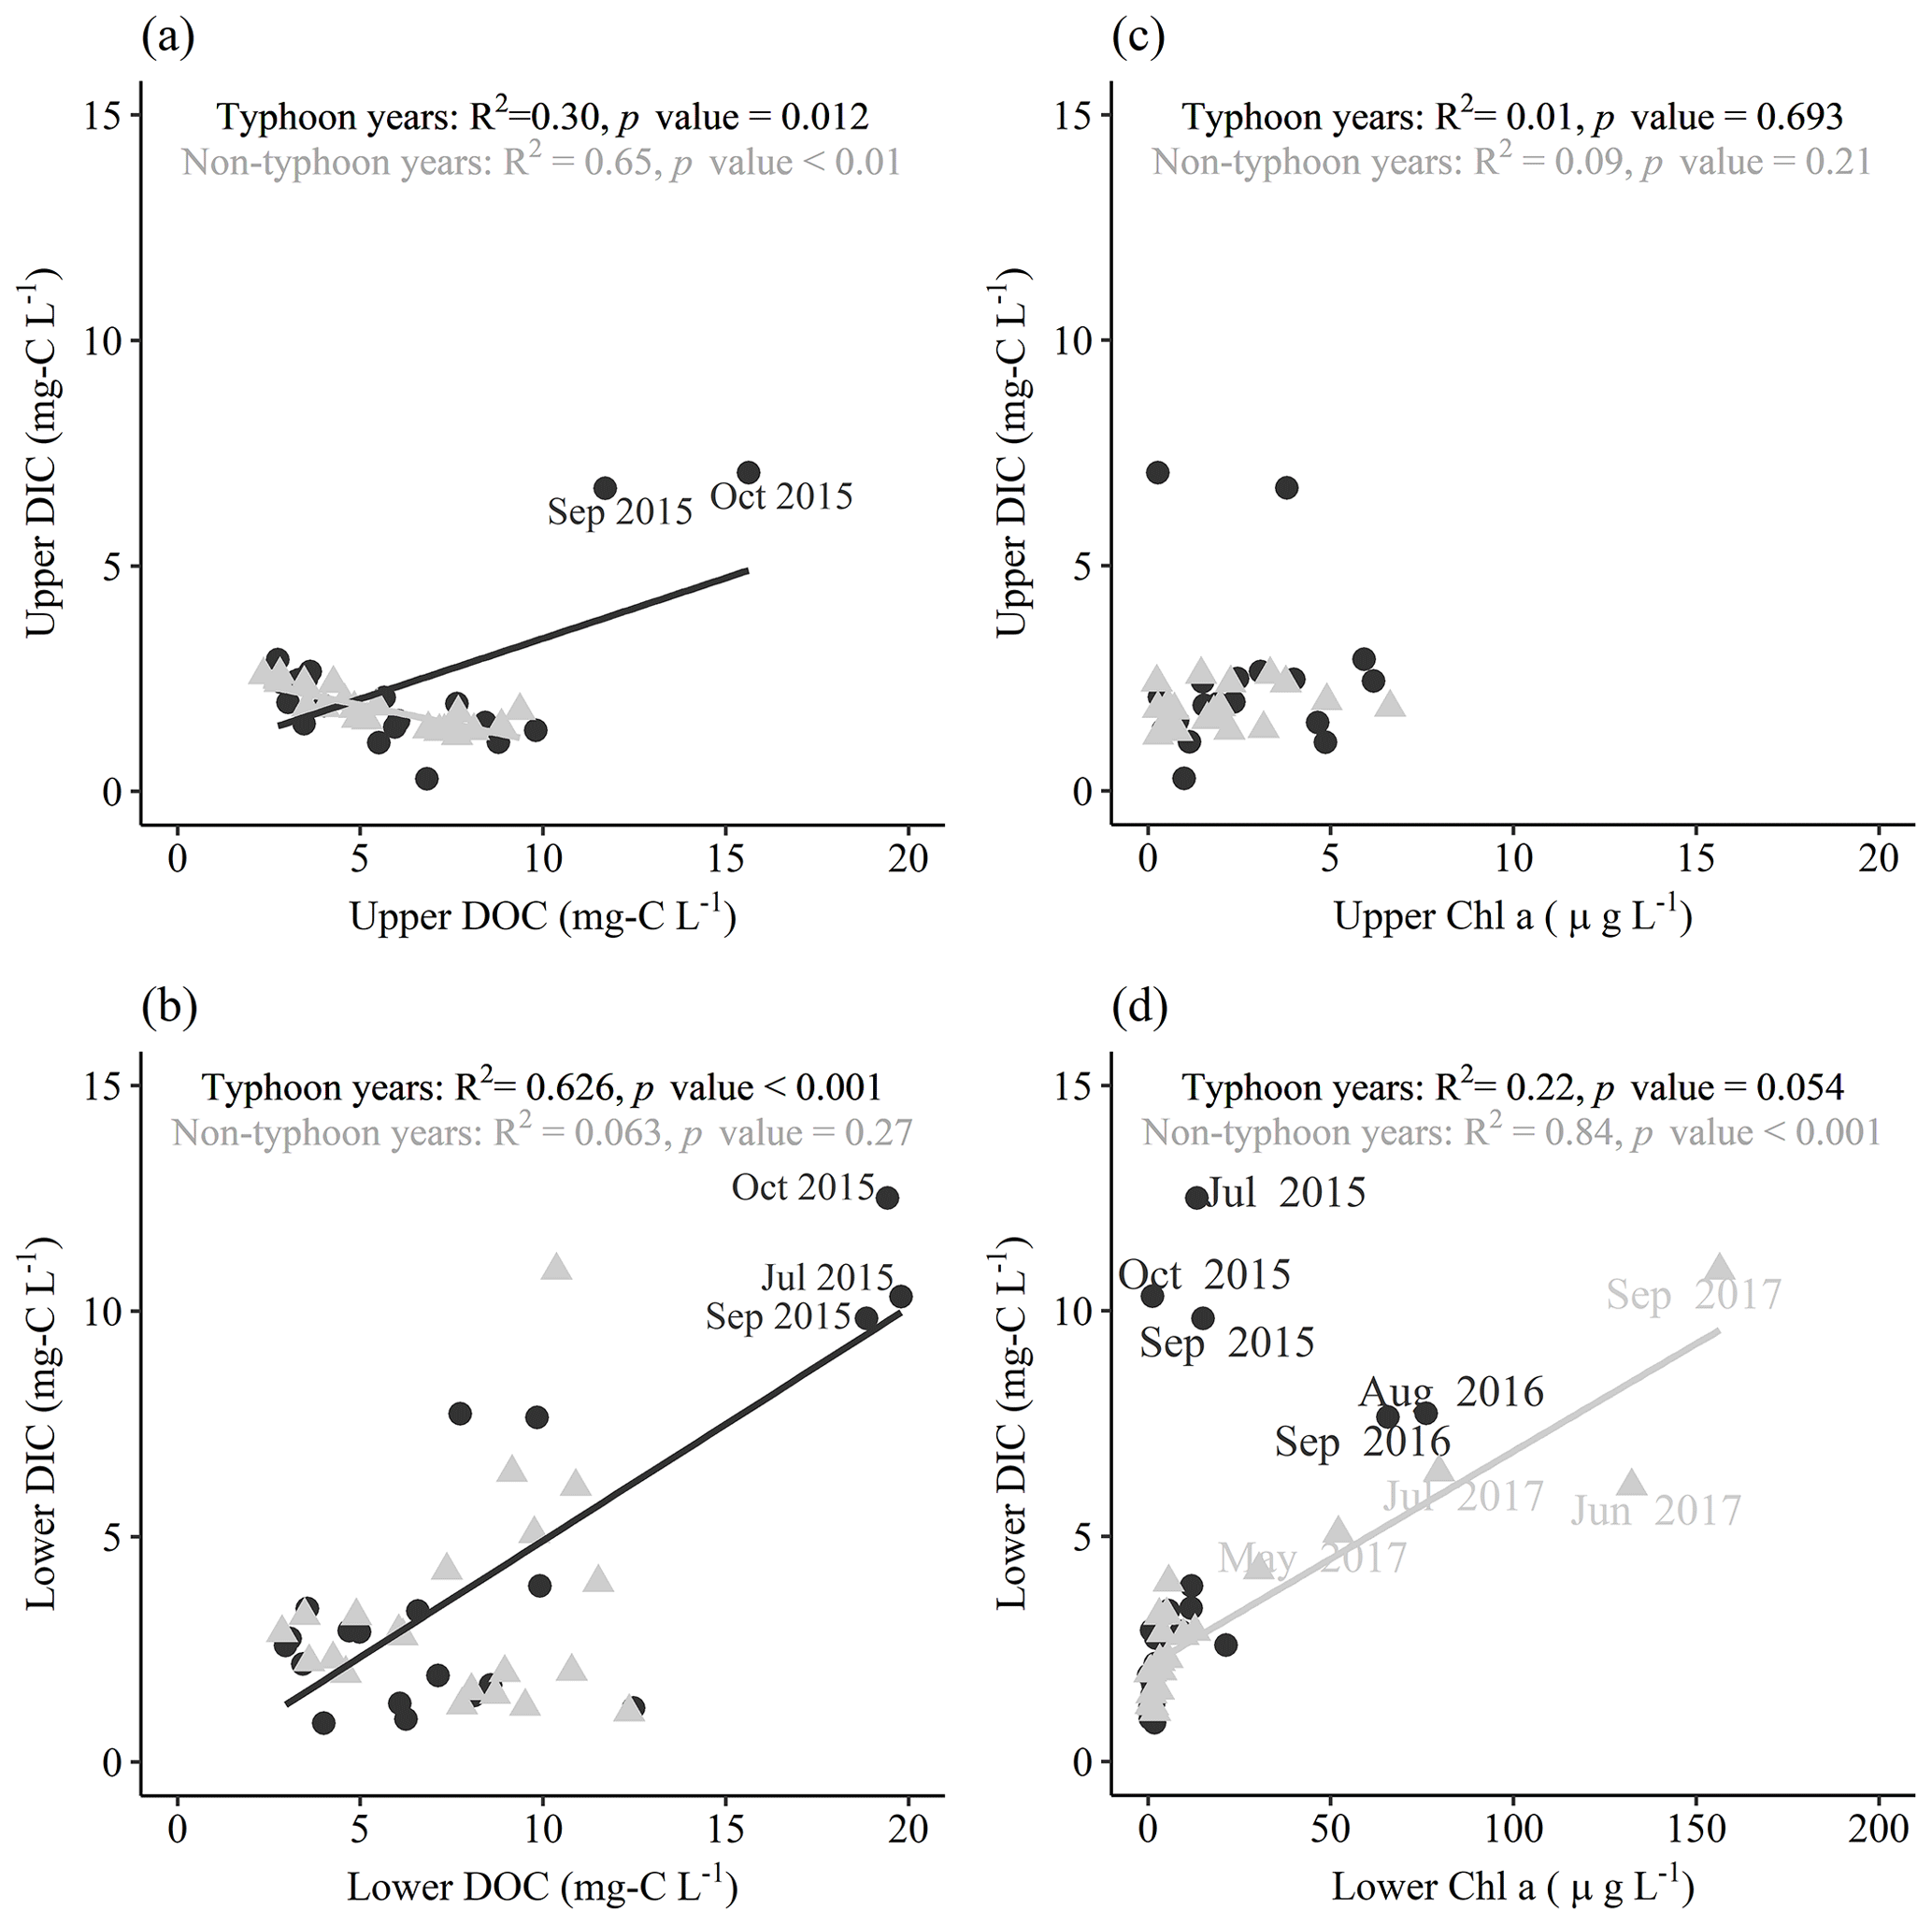
Figure 8Interactions of measurement data in typhoon years and non-typhoon years. The black circles represent typhoon years, gray triangles are non-typhoon years, and the solid lines represent the linear regression line in typhoon years (black lines) and non-typhoon years (gray lines).
We found significantly positive correlations between DOC and DIC concentrations in typhoon years (Fig. 4); this was caused by substantial amounts of C loading into YYL during the strong typhoon period in 2015 (Fig. 8a, b) due to the occurrence of the last drought year in 2014 (Chiu et al., 2020). Not only did prolonged (or hysteresis) effects lead to dramatic C emissions in 2015 due to the drought year in 2014 (Chiu et al., 2020) but the rapid water retention and C loading during strong typhoon periods (Lin et al., 2022) also induced vigorous algal biomass production in the lower layer from May to September 2017 (Fig. 8d). Conversely, without the typhoon-induced mixing and refreshing of the water column, DIC and DOC concentrations in non-typhoon years might be mineralization dominated (Chiu et al., 2020; Hanson et al., 2015; Lin et al., 2022; Vachon et al., 2021), which could result in the positive linear relationship between DIC and DOC concentrations (Figs. 4b, 8a) as well as negative remineralization rates in non-typhoon years (Table 3). Therefore, these hydraulic, biogeochemical processes and the hysteresis effects might describe different patterns in the measurement data between typhoon years and non-typhoon years.
Thermal stratification and allochthonous C loading may drive the responses of fluxes to typhoons in YYL. The absolute values of fluxes were higher in typhoon years than in non-typhoon years (Table 4). We found that precipitation from typhoons loaded large amounts of allochthonous C into YYL during summer and autumn, which might explain the higher fluxes in autumn compared with the other seasons (Table 4). Typhoons dramatically changed the seasonal and interannual patterns of DIC fluxes due to river intrusion (Figs. 5a, b, S1), which proves to our hypothesis and concurs with the results of previous studies (Chiu et al., 2020; Lin et al., 2021, 2022). In summer, the DOC and DIC concentrations were spatially different between layers, observed as a two-layer system within the water column, because the upper and lower layers were inhibited due to strong thermal stratification (Lin et al., 2021, 2022), thereby resulting in positive upper DIC and DOC fluxes and negative lower DIC and DOC fluxes (Table 4).
Because of the absence of typhoon-induced mixing and allochthonous C loading, the total fluxes were lower in non-typhoon years than those in typhoon years (Table 4). In typhoon years, our results showed that typhoon-induced upwelling and loading increased by 102.2 and 62.3 in YYL (Table 4). Additionally, CO2 emission (FC) was 43 % higher (∼ 83 ) in typhoon years than in non-typhoon years (Table 4). Therefore, we found that typhoon disturbances control DIC loading and C emissions in YYL, consistent with our previous studies (Chiu et al., 2020; Lin et al., 2021, 2022). Simultaneously, bio-photochemical mineralization and degradation may play a key role in shaping C fluxes, as colored DOC reduces ultraviolet radiation (UVR) and active photosynthetic radiation (PAR) (Allesson et al., 2021; Chiu et al., 2020; Schindler et al., 1996; Scully et al., 1996; Williamson et al., 1999), resulting in higher light intensity and water temperature in summer and consuming 3.7 times more DIC and DOC than in the other seasons (Table 4). These results suggested that the allochthonous C loading and light duration might be the most crucial factor for DIC and DOC fluxes in typhoon years. Conversely, the transportation rate shaped the seasonal C concentrations due to thermal stratification in non-typhoon years.
4.2 Model limitations under the extreme weather scenarios
Water temperature might be a crucial driver in controlling C fluxes in YYL (Chiu et al., 2020; Lin et al., 2021, 2022). We found that the fluxes and in summer were usually higher than in winter (Tables 3, 4) due to the higher levels of photosynthesis, remineralization, and thermal stratification strength (Lin et al., 2021, 2022). With the conceptual two-layer C models (Table 3), photosynthesis absorption (αPU and αPL), remineralization (αMU and αML), and transportation (wI) represented the seasonal variations in DIC and DOC data well. These parameters of the conceptual two-layer C models appeared in reasonable patterns (Table 3). The higher remineralization and photosynthesis rates resulted in higher absolute values of fluxes in the autumn of typhoon years (Tables 3, 4). In non-typhoon years, the photosynthesis rates contributed to the total fluxes (Tables 3, 4). Thus, the conceptual two-layer C models suitably characterizes the seasonal and interannual responses of DIC and DOC fluxes to typhoons in YYL.
Under the extreme weather event scenarios (Level 1 and Level 2), the release of DIC and DOC was 30 %–118 % higher within YYL, considering thermal stratification and river intrusion. (Fig. 7). In non-typhoon years, FluxDIC was higher than FluxDOC (Fig. 6c, f) under the Level 1 and Level 2 scenarios or events for each season (Figs. S1, S2). However, the results showed that DOC fluxes were more sensitive than DIC fluxes to the impact of typhoon disturbances (Fig. 7). For autumn, our results show that the transportation rate parameter in typhoon years was over 10-fold higher than in non-typhoon years (Table 3) and that the DOC concentration was dominated by mineralization in typhoon years (Fig. 8), as biogeochemical processes within lakes, such as respiration, mineralization, and sediment burial, may impact DOC fluxes (Bartosiewicz et al., 2015; Hanson et al., 2015; Maranger et al., 2018). Simultaneously, the physical processes, such as typhoon-induced mixing and autumn overturns, upwelled the sediment and lower-layer DOC into the surface water in YYL (Kimura et al., 2017; Lin et al., 2022). Therefore, we suggest that autumn overturns and mineralization after typhoon disturbances might be vital with respect to influencing the vertical distribution of DOC concentrations in typhoon years.
Ejarque et al. (2021) successfully developed a conceptual one-layer model of DOC and DIC, considering bacterial respiration, photomineralization, and degradation in a temperate mountain lake. In addition, Nagatomo et al. (2023) revealed the significance of “freshwater carbon” capture due to photosynthesis and suggested that DIC might be underestimated if submerged vegetation is ignored. We suggest that photobiochemical processes (such as photomineralization) and submerged vegetation should be considered in the upper layer to clarify and validate the responses of the total C fluxes under extreme climates in a two-layer stratified lake from the aspect of a freshwater carbon ecosystem.
We successfully developed two-layer conceptual C models to obtain continuous DIC and DOC data in YYL and to simulate extreme conditions. Our conceptual two-layer C models revealed that allochthonous and autochthonous processes both accounted for C flux responses to typhoon disturbances. Without typhoons, thermal stratification was the primary driver of seasonal and interannual patterns of DIC and DOC. In typhoon years, the changes in seasonal river intrusion regimes in YYL resulted in a 3-fold higher total FluxDIC than in non-typhoon years. However, our model should be improved for application to extreme climate scenarios by considering other processes within a lake, such as sediment burial, photodegradation processes, and anoxic conditions. The present results suggest that physical processes (river intrusion and vertical transportation) and biogeochemical processes (mineralization, photosynthesis, and respiration) in a small subtropical lake account for the C flux responses to typhoons on seasonal and interannual timescales.
The data that support the findings of this study have been adopted from our previous works, including Chiu et al. (2020), Lin et al. (2021), and Lin et al. (2022). The DIC data are available from https://doi.org/10.5281/zenodo.3900032 (Nakayama, 2020).
The supplement related to this article is available online at: https://doi.org/10.5194/bg-20-4359-2023-supplement.
HCL: conceptualization, methodology, investigation, formal analysis, and writing – original draft; KN: methodology, supervision, conceptualization, and writing – review and editing; JWT: investigation, funding acquisition, and writing – review and editing; CYC: funding acquisition and writing – review and editing.
The contact author has declared that none of the authors has any competing interests.
Publisher's note: Copernicus Publications remains neutral with regard to jurisdictional claims made in the text, published maps, institutional affiliations, or any other geographical representation in this paper. While Copernicus Publications makes every effort to include appropriate place names, the final responsibility lies with the authors.
The authors thank Yu-Shin Hsueh, Li-Chin Jiang, and Tung-Yun Chen for their help with the water sample collection and chemical analysis. This work was supported by the Japan Society for the Promotion of Science (JSPS; grant nos. 22H05726, 22H01601, and 18KK0119, awarded to Keisuke Nakayama) and by the Academia Sinica, Taiwan, and the Ministry of Science and Technology, Taiwan (grant nos. AS-103-TP-B15 and MOST 106-2621-M-239-001, MOST 107-2621-M-239-001, and MOST 108-2621-M-239-001, respectively, awarded to Chih-Yu Chiu and Jeng-Wei Tsai). This study benefited from participation in the Global Lakes Ecological Observatory Network (GLEON).
This research has been supported by the Japan Society for the Promotion of Science (grant nos. 22H05726, 22H01601, and 18KK0119), the Genomics Research Center, Academia Sinica (grant no. AS-103-TP-B15), and the National Science Council (grant nos. MOST 106-2621-M-239-001, MOST 107-2621-M-239-001, and MOST 108-2621-M-239-001).
This paper was edited by Yuan Shen and reviewed by four anonymous referees.
Allesson, L., Koehler, B., Thrane, J.-E., Andersen, T., and Hessen, D. O.: The role of photomineralization for CO2 emissions in boreal lakes along a gradient of dissolved organic matter, Limnol. Oceanogr., 66, 158–170, https://doi.org/10.1002/lno.11594, 2021.
Amaral, J. H. F., Melack, J. M., Barbosa, P. M., Borges, A. V., Kasper, D., Cortés, A. C., Zhou, W., MacIntyre, S., and Forsberg, B. R.: Inundation, Hydrodynamics and Vegetation Influence Carbon Dioxide Concentrations in Amazon Floodplain Lakes, Ecosystems, 25, 911–930, https://doi.org/10.1007/s10021-021-00692-y, 2022.
Aufdenkampe, A. K., Mayorga, E., Raymond, P. A., Melack, J. M., Doney, S. C., Alin, S. R., Aalto, R. E., and Yoo, K.: Riverine coupling of biogeochemical cycles between land, oceans, and atmosphere, Front. Ecol. Environ., 9, 53–60, https://doi.org/10.1890/100014, 2011.
Bartosiewicz, M., Laurion, I., and MacIntyre, S.: Greenhouse gas emission and storage in a small shallow lake, Hydrobiologia, 757, 101–115, https://doi.org/10.1007/s10750-015-2240-2, 2015.
Cai, W.-J. and Wang, Y.: The chemistry, fluxes, and sources of carbon dioxide in the estuarine waters of the Satilla and Altamaha Rivers, Georgia, Limnol. Oceanogr., 43, 657–668, https://doi.org/10.4319/lo.1998.43.4.0657, 1998.
Carey, C. C., Hanson, P. C., Thomas, R. Q., Gerling, A. B., Hounshell, A. G., Lewis, A. S. L., Lofton, M. E., McClure, R. P., Wander, H. L., Woelmer, W. M., Niederlehner, B. R., and Schreiber, M. E.: Anoxia decreases the magnitude of the carbon, nitrogen, and phosphorus sink in freshwaters, Glob. Change Biol., 28, 4861–4881, https://doi.org/10.1111/gcb.16228, 2022.
Chang, S.-C., Wang, C.-P., Feng, C.-M., Rees, R., Hell, U., and Matzner, E.: Soil fluxes of mineral elements and dissolved organic matter following manipulation of leaf litter input in a Taiwan Chamaecyparis forest, Forest Ecol. Manag., 242, 133–141, https://doi.org/10.1016/j.foreco.2007.01.025, 2007.
Chiu, C.-Y., Jones, J. R., Rusak, J. A., Lin, H.-C., Nakayama, K., Kratz, T. K., Liu, W.-C., Tang, S.-L., and Tsai, J.-W.: Terrestrial loads of dissolved organic matter drive inter-annual carbon flux in subtropical lakes during times of drought, Sci. Total Environ., 717, 137052, https://doi.org/10.1016/j.scitotenv.2020.137052, 2020.
Chou, C.-H., Chen, T.-Y., Liao, C.-C., and Peng, C.-I.: Long-term ecological research in the Yuanyang Lake forest ecosystem I. Vegetation composition and analysis, Bot. Bull. Acad. Sinica, 41, 61–72, 2000.
Cole, J. J. and Caraco, N. F.: Atmospheric exchange of carbon dioxide in a low-wind oligotrophic lake measured by the addition of SF6, Limnol. Oceanogr., 43, 647–656, https://doi.org/10.4319/lo.1998.43.4.0647, 1998.
Cole, J. J., Prairie, Y. T., Caraco, N. F., McDowell, W. H., Tranvik, L. J., Striegl, R. G., Duarte, C. M., Kortelainen, P., Downing, J. A., Middelburg, J. J., and Melack, J.: Plumbing the Global Carbon Cycle: Integrating Inland Waters into the Terrestrial Carbon Budget, Ecosystems, 10, 172–185, https://doi.org/10.1007/s10021-006-9013-8, 2007.
Czikowsky, M. J., MacIntyre, S., Tedford, E. W., Vidal, J., and Miller, S. D.: Effects of Wind and Buoyancy on Carbon Dioxide Distribution and Air-Water Flux of a Stratified Temperate Lake, J. Geophys. Res.-Biogeo., 123, 2305–2322, https://doi.org/10.1029/2017JG004209, 2018.
Dodds, W. K. and Whiles, M. R.: Freshwater Ecology: Concepts and Environmental Applications of Limnology, Third Edition, Elsevier, United Kingdom, 748–762, ISBN: 9780128132555, 2020.
Doubek, J. P., Anneville, O., Dur, G., Lewandowska, A. M., Patil, V. P., Rusak, J. A., Salmaso, N., Seltmann, C. T., Straile, D., Urrutia-Cordero, P., Venail, P., Adrian, R., Alfonso, M. B., DeGasperi, C. L., Eyto, E., Feuchtmayr, H., Gaiser, E. E., Girdner, S. F., Graham, J. L., Grossart, H.-P., Hejzlar, J., Jacquet, S., Kirillin, G., Llames, M. E., Matsuzaki, S.-I. S., Nodine, E. R., Piccolo, M. C., Pierson, D. C., Rimmer, A., Rudstam, L. G., Sadro, S., Swain, H. M., Thackeray, S. J., Thiery, W., Verburg, P., Zohary, T., and Stockwell, J. D.: The extent and variability of storm-induced temperature changes in lakes measured with long-term and high-frequency data, Limnol. Oceanogr., 66, 1979–1992, https://doi.org/10.1002/lno.11739, 2021.
Downing, J. A., Prairie, Y. T., Cole, J. J., Duarte, C. M., Tranvik, L. J., Striegl, R. G., McDowell, W. H., Kortelainen, P., Caraco, N. F., Melack, J. M., and Middelburg, J. J.: The global abundance and size distribution of lakes, ponds, and impoundments, Limnol. Oceanogr., 51, 2388–2397, https://doi.org/10.4319/lo.2006.51.5.2388, 2006.
Ejarque, E., Scholz, K., Wohlfahrt, G., Battin, T. J., Kainz, M. J., and Schelker, J.: Hydrology controls the carbon mass balance of a mountain lake in the eastern European Alps, Limnol. Oceanogr., 66, 2110–2125, https://doi.org/10.1002/lno.11712, 2021.
Engel, F., Farrell, K. J., McCullough, I. M., Scordo, F., Denfeld, B. A., Dugan, H. A., Eyto, E. de, Hanson, P. C., McClure, R. P., Nõges, P., Nõges, T., Ryder, E., Weathers, K. C., and Weyhenmeyer, G. A.: A lake classification concept for a more accurate global estimate of the dissolved inorganic carbon export from terrestrial ecosystems to inland waters, Sci. Nat., 105, 25, https://doi.org/10.1007/s00114-018-1547-z, 2018.
Hanson, P. C., Pace, M. L., Carpenter, S. R., Cole, J. J., and Stanley, E. H.: Integrating Landscape Carbon Cycling: Research Needs for Resolving Organic Carbon Budgets of Lakes, Ecosystems, 18, 363–375, https://doi.org/10.1007/s10021-014-9826-9, 2015.
Hope, D., Palmer, S. M., Billett, M. F., and Dawson, J. J. C.: Variations in dissolved CO2 and CH4 in a first-order stream and catchment: an investigation of soil-stream linkages, Hydrol. Process., 18, 3255–3275, https://doi.org/10.1002/hyp.5657, 2004.
Jähne, B., Münnich, K. O., Bösinger, R., Dutzi, A., Huber, W., and Libner, P.: On the parameters influencing air–water gas exchange, J. Geophys. Res.-Oceans, 92, 1937, https://doi.org/10.1029/JC092iC02p01937, 1987.
Jones, S. E., Kratz, T. K., Chiu, C.-Y., and McMahon, K. D.: Influence of typhoons on annual CO2 flux from a subtropical, humic lake, Glob. Change Biol., 15, 243–254, https://doi.org/10.1111/j.1365-2486.2008.01723.x, 2009.
Kimura, N., Liu, W.-C., Chiu, C.-Y., and Kratz, T.: The influences of typhoon-induced mixing in a shallow lake, Lakes Reserv. Res. Manag., 17, 171–183, https://doi.org/10.1111/j.1440-1770.2012.00509.x, 2012.
Kimura, N., Liu, W.-C., Tsai, J.-W., Chiu, C.-Y., Kratz, T. K., and Tai, A.: Contribution of extreme meteorological forcing to vertical mixing in a small, shallow subtropical lake, J. Limnol., 76, 116–128, https://doi.org/10.4081/jlimnol.2016.1477, 2017.
Kossin, J. P., Olander, T. L., and Knapp, K. R.: Trend Analysis with a New Global Record of Tropical Cyclone Intensity, J. Climate, 26, 9960–9976, https://doi.org/10.1175/JCLI-D-13-00262.1, 2013.
Kraemer, B. M., Pilla, R. M., Woolway, R. I., Anneville, O., Ban, S., Colom-Montero, W., Devlin, S. P., Dokulil, M. T., Gaiser, E. E., Hambright, K. D., Hessen, D. O., Higgins, S. N., Jöhnk, K. D., Keller, W., Knoll, L. B., Leavitt, P. R., Lepori, F., Luger, M. S., Maberly, S. C., Müller-Navarra, D. C., Paterson, A. M., Pierson, D. C., Richardson, D. C., Rogora, M., Rusak, J. A., Sadro, S., Salmaso, N., Schmid, M., Silow, E. A., Sommaruga, R., Stelzer, J. A. A., Straile, D., Thiery, W., Timofeyev, M. A., Verburg, P., Weyhenmeyer, G. A., and Adrian, R.: Climate change drives widespread shifts in lake thermal habitat, Nat. Clim. Change, 11, 521–529, https://doi.org/10.1038/s41558-021-01060-3, 2021.
Lai, I.-L., Chang, S.-C., Lin, P.-H., Chou, C.-H., and Wu, J.-T.: Climatic Characteristics of the Subtropical Mountainous Cloud Forest at the Yuanyang Lake Long-Term Ecological Research Site, Taiwan, Taiwania, 51, 317–329, 2006.
Lauerwald, R., Laruelle, G. G., Hartmann, J., Ciais, P., and Regnier, P. A.: Spatial patterns in CO2 evasion from the global river network, Global Biogeochem. Cy., 29, 534–554, https://doi.org/10.1002/2014GB004941, 2015.
Lin, H.-C., Chiu, C.-Y., Tsai, J.-W., Liu, W.-C., Tada, K., and Nakayama, K.: Influence of Thermal Stratification on Seasonal Net Ecosystem Production and Dissolved Inorganic Carbon in a Shallow Subtropical Lake, J. Geophys. Res.-Biogeo., 126, https://doi.org/10.1029/2020JG005907, 2021.
Lin, H.-C., Tsai, J.-W., Tada, K., Matsumoto, H., Chiu, C.-Y., and Nakayama, K.: The impacts of the hydraulic retention effect and typhoon disturbance on the carbon flux in shallow subtropical mountain lakes, Sci. Total Environ., 803, 150044, https://doi.org/10.1016/j.scitotenv.2021.150044, 2022.
Maberly, S. C., O'Donnell, R. A., Woolway, R. I., Cutler, M. E. J., Gong, M., Jones, I. D., Merchant, C. J., Miller, C. A., Politi, E., Scott, E. M., Thackeray, S. J., and Tyler, A. N.: Global lake thermal regions shift under climate change, Nat. Commun., 11, 1232, https://doi.org/10.1038/s41467-020-15108-z, 2020.
MacIntyre, S., Bastviken, D., Arneborg, L., Crowe, A. T., Karlsson, J., Andersson, A., Gålfalk, M., Rutgersson, A., Podgrajsek, E., and Melack, J. M.: Turbulence in a small boreal lake: Consequences for air–water gas exchange, Limnol. Oceanogr., 66, 827–854, https://doi.org/10.1002/lno.11645, 2021.
Maranger, R., Jones, S. E., and Cotner, J. B.: Stoichiometry of carbon, nitrogen, and phosphorus through the freshwater pipe, Limnol. Oceanogr. Lett., 3, 89–101, https://doi.org/10.1002/lol2.10080, 2018.
Marcé, R., Obrador, B., Gómez-Gener, L., Catalán, N., Koschorreck, M., Arce, M. I., Singer, G., and von Schiller, D.: Emissions from dry inland waters are a blind spot in the global carbon cycle, Earth-Sci. Rev., 188, 240–248, https://doi.org/10.1016/j.earscirev.2018.11.012, 2019.
Masson-Delmotte, V. P., Zhai, P., Pirani, S. L., Connors, C., Péan, S., Berger, N., Caud, Y., Chen, L., Goldfarb, M. I., and Monteiro P. S.: IPCC, 2021: Summary for Policymakers. In: Climate Change 2021: The Physical Science Basis. Contribution of Working Group I to the Sixth Assessment Report of the Intergovernmental Panel on Climate Change, Cambridge University Press, Cambridge, United Kingdom and New York, NY, USA, 2021.
Nagatomo, K., Nakayama, K., Komai, K., Matsumoto, H., Watanabe, K., Kubo, A., Tada, K., Maruya, Y., Yano, S., Tsai, J. W., Lin, H. C., Vilas, M., and Hipsey, M. R.: A Spatially Integrated Dissolved Inorganic Carbon (SiDIC) Model for Aquatic Ecosystems Considering Submerged Vegetation, J. Geophys. Res.-Biogeo., 128, https://doi.org/10.1029/2022JG007032, 2023.
Nakayama, K.: JGR2020BGS (v1.0), Zenodo [data set], https://doi.org/10.5281/zenodo.3900032, 2020.
Nakayama, K., Sivapalan, M., Sato, C., and Furukawa, K.: Stochastic characterization of the onset of and recovery from hypoxia in Tokyo Bay, Japan: Derived distribution analysis based on “strong wind” events, Water Resour. Res., 46, W12532, https://doi.org/10.1029/2009WR008900, 2010.
Nakayama, K., Komai, K., Tada, K., Lin, H. C., Yajima, H., Yano, S., Hipsey, M. R., and Tsai, J. W.: Modeling dissolved inorganic carbon considering submerged aquatic vegetation, Ecol. Model., 431, 109188, https://doi.org/10.1016/j.ecolmodel.2020.109188, 2020.
Nakayama, K., Kawahara, Y., Kurimoto, Y., Tada, K., Lin, H.-C., Hung, M.-C., Hsueh, M.-L., and Tsai, J.-W.: Effects of oyster aquaculture on carbon capture and removal in a tropical mangrove lagoon in southwestern Taiwan, Sci. Total Environ., 156460, https://doi.org/10.1016/j.scitotenv.2022.156460, 2022.
Nash, J. E. and Sutcliffe, J. V.: River flow forecasting through conceptual models, I A discussion of principles, J. Hydrol., 10, 398–409, 1970.
Olsson, F., Mackay, E. B., Barker, P., Davies, S., Hall, R., Spears, B., Exley, G., Thackeray, S. J., and Jones, I. D.: Can reductions in water residence time be used to disrupt seasonal stratification and control internal loading in a eutrophic monomictic lake?, J. Environ. Manage., 304, 114169, https://doi.org/10.1016/j.jenvman.2021.114169, 2022a.
Olsson, F., Mackay, E. B., Moore, T., Barker, P., Davies, S., Hall, R., Spears, B., Wilkinson, J., and Jones, I. D.: Annual water residence time effects on thermal structure: A potential lake restoration measure?, J. Environ. Manage., 314, 115082, https://doi.org/10.1016/j.jenvman.2022.115082, 2022b.
Plummer, L. and Busenberg, E.: The solubilities of calcite, aragonite and vaterite in CO2-H2O solutions between 0 and 90 ∘C, and an evaluation of the aqueous model for the system CaCO3-CO2-H2O, Geochim. Cosmochim. Ac., 46, 1011–1040, https://doi.org/10.1016/0016-7037(82)90056-4, 1982.
Raymond, P. A., Hartmann, J., Lauerwald, R., Sobek, S., McDonald, C., Hoover, M., Butman, D., Striegl, R., Mayorga, E., Humborg, C., Kortelainen, P., Dürr, H., Meybeck, M., Ciais, P., and Guth, P.: Global carbon dioxide emissions from inland waters, Nature, 503, 355–359, https://doi.org/10.1038/nature12760, 2013.
Schindler, D. W., Curtis, P. J., Parker, B. R., and Stainton, M. P.: Consequences of climate warming and lake acidification for UV-B penetration in North American boreal lakes, Nature, 379, 705–708, https://doi.org/10.1038/379705a0, 1996.
Scully, N. M., McQueen, D. J., and Lean, D. R. S.: Hydrogen peroxide formation: The interaction of ultraviolet radiation and dissolved organic carbon in lake waters along a 43–75∘ N gradient, Limnol. Oceanogr., 41, 540–548, https://doi.org/10.4319/lo.1996.41.3.0540, 1996.
Shade, A., Chiu, C.-Y., and McMahon, K. D.: Seasonal and episodic lake mixing stimulate differential planktonic bacterial dynamics, Microb. Ecol., 59, 546–554, https://doi.org/10.1007/s00248-009-9589-6, 2010.
Shade, A., Read, J. S., Welkie, D. G., Kratz, T. K., Wu, C. H., and McMahon, K. D.: Resistance, resilience and recovery: aquatic bacterial dynamics after water column disturbance, Environ. Microbiol., 13, 2752–2767, https://doi.org/10.1111/j.1462-2920.2011.02546.x, 2011.
Shih, Y.-T., Chen, P.-H., Lee, L.-C., Liao, C.-S., Jien, S.-H., Shiah, F.-K., Lee, T.-Y., Hein, T., Zehetner, F., Chang, C.-T., and Huang, J.-C.: Dynamic responses of DOC and DIC transport to different flow regimes in a subtropical small mountainous river, Hydrol. Earth Syst. Sci., 22, 6579–6590, https://doi.org/10.5194/hess-22-6579-2018, 2018.
Smith, S. V.: Physical, chemical and biological characteristics* of CO2 gas flux across the air–water interface, Plant Cell Environ., 8, 387–398, https://doi.org/10.1111/j.1365-3040.1985.tb01674.x, 1985.
Sobek, S., Tranvik, L. J., and Cole, J. J.: Temperature independence of carbon dioxide supersaturation in global lakes, Global Biogeochem. Cy., 19, GB2003, https://doi.org/10.1029/2004GB002264, 2005.
Sun, P., He, S., Yu, S., Pu, J., Yuan, Y., and Zhang, C.: Dynamics in riverine inorganic and organic carbon based on carbonate weathering coupled with aquatic photosynthesis in a karst catchment, Southwest China, Water Research, 189, 116658, https://doi.org/10.1016/j.watres.2020.116658, 2021.
Tranvik, L. J., Downing, J. A., Cotner, J. B., Loiselle, S. A., Striegl, R. G., Ballatore, T. J., Dillon, P., Finlay, K., Fortino, K., Knoll, L. B., Kortelainen, P. L., Kutser, T., Larsen, S., Laurion, I., Leech, D. M., McCallister, S. L., McKnight, D. M., Melack, J. M., Overholt, E., Porter, J. A., Prairie, Y., Renwick, W. H., Roland, F., Sherman, B. S., Schindler, D. W., Sobek, S., Tremblay, A., Vanni, M. J., Verschoor, A. M., Wachenfeldt, E. von, and Weyhenmeyer, G. A.: Lakes and reservoirs as regulators of carbon cycling and climate, Limnol. Oceanogr., 54, 2298–2314, https://doi.org/10.4319/lo.2009.54.6_part_2.2298, 2009.
Tsai, J.-W., Kratz, T. K., Hanson, P. C., Wu, J.-T., Chang, W. Y. B., Arzberger, P. W., Lin, B.-S., Lin, F.-P., Chou, H.-M., and Chiu, C.-Y.: Seasonal dynamics, typhoons and the regulation of lake metabolism in a subtropical humic lake, Freshwater Biol., 53, 1929–1941, https://doi.org/10.1111/j.1365-2427.2008.02017.x, 2008.
Tsai, J.-W., Kratz, T. K., Hanson, P. C., Kimura, N., Liu, W.-C., Lin, F.-P., Chou, H.-M., Wu, J.-T., and Chiu, C.-Y.: Metabolic changes and the resistance and resilience of a subtropical heterotrophic lake to typhoon disturbance, Can. J. Fish. Aquat. Sci., 68, 768–780, https://doi.org/10.1139/F2011-024, 2011.
Vachon, D. and Del Giorgio, P. A.: Whole-Lake CO2 Dynamics in Response to Storm Events in Two Morphologically Different Lakes, Ecosystems, 17, 1338–1353, https://doi.org/10.1007/s10021-014-9799-8, 2014.
Vachon, D., Sponseller, R. A., and Karlsson, J.: Integrating carbon emission, accumulation and transport in inland waters to understand their role in the global carbon cycle, Glob. Change Biol., 27, 719–727, https://doi.org/10.1111/gcb.15448, 2021.
Wanninkhof, R.: Relationship between wind speed and gas exchange over the ocean, J. Geophys. Res.-Oceans, 97, 7373, https://doi.org/10.1029/92JC00188, 1992.
Williamson, C. E., Morris, D. P., Pace, M. L., and Olson, O. G.: Dissolved organic carbon and nutrients as regulators of lake ecosystems: Resurrection of a more integrated paradigm, Limnol. Oceanogr., 44, 795–803, https://doi.org/10.4319/lo.1999.44.3_part_2.0795, 1999.
Winslow, L. A., Read, J. S., Hansen, G. J. A., and Hanson, P. C.: Small lakes show muted climate change signal in deepwater temperatures, Geophys. Res. Lett., 42, 355–361, https://doi.org/10.1002/2014GL062325, 2015.
Woolway, R. I., Simpson, J. H., Spiby, D., Feuchtmayr, H., Powell, B., and Maberly, S. C.: Physical and chemical impacts of a major storm on a temperate lake: a taste of things to come?, Climatic Change, 151, 333–347, https://doi.org/10.1007/s10584-018-2302-3, 2018.
Woolway, R. I., Kraemer, B. M., Lenters, J. D., Merchant, C. J., O'Reilly, C. M., and Sharma, S.: Global lake responses to climate change, Nat. Rev. Earth Environ., 1, 388–403, https://doi.org/10.1038/s43017-020-0067-5, 2020.
Woolway, R. I., Anderson, E. J., and Albergel, C.: Rapidly expanding lake heatwaves under climate change, Environ. Res. Lett., 16, 94013, https://doi.org/10.1088/1748-9326/ac1a3a, 2021a.
Woolway, R. I., Jennings, E., Shatwell, T., Golub, M., Pierson, D. C., and Maberly, S. C.: Lake heatwaves under climate change, Nature, 589, 402–407, https://doi.org/10.1038/s41586-020-03119-1, 2021b.
Wu, J.-T., Chang, S.-C., Wang, Y.-S., and Hsu, M.-K.: Characteristics of the acidic environment of the Yuanyang Lake (Taiwan), Bot. Bull. Acad. Sinica, 42, 17–22, 2001.
Zhou, Y., Yu, X., Zhou, L., Zhang, Y., Xu, H., Zhu, M., Zhu, G., Jang, K.-S., Spencer, R. G. M., Jeppesen, E., Brookes, J. D., Kothawala, D. N., and Wu, F.: Rainstorms drive export of aromatic and concurrent bio-labile organic matter to a large eutrophic lake and its major tributaries, Water Res., 229, 119448, https://doi.org/10.1016/j.watres.2022.119448, 2023.
Zwart, J. A., Sebestyen, S. D., Solomon, C. T., and Jones, S. E.: The Influence of Hydrologic Residence Time on Lake Carbon Cycling Dynamics Following Extreme Precipitation Events, Ecosystems, 20, 1000–1014, https://doi.org/10.1007/s10021-016-0088-6, 2017.