the Creative Commons Attribution 4.0 License.
the Creative Commons Attribution 4.0 License.
 | 08 Nov 2023
Sap flow and leaf gas exchange response to a drought and heatwave in urban green spaces in a Nordic city
Joyson Ahongshangbam
Liisa Kulmala
Jesse Soininen
Yasmin Frühauf
Esko Karvinen
Yann Salmon
Anna Lintunen
Anni Karvonen
Leena Järvi
Urban vegetation plays a role in offsetting urban CO2 emissions, mitigating heat through tree transpiration and shading, and acting as deposition surfaces for pollutants. The frequent occurrence of heatwaves and of concurrent drought conditions significantly disrupts the processes of urban trees, particularly their photosynthesis and transpiration rates. Despite the pivotal role of urban tree functioning in delivering essential ecosystem services, the precise nature of their response remains uncertain. We conducted sap flux density (Js) and leaf gas exchange measurements of four tree species (Tilia cordata, Tilia × europaea, Betula pendula, and Malus spp.) located in different urban green areas (Park, Street, Forest, and Orchard) in Helsinki, Finland. Measurements were made over two contrasting summers 2020 and 2021. Summer 2021 experienced a local heatwave and drought, whereas summer 2020 was more typical of Helsinki. In this study, we aimed to understand the responses of urban tree transpiration (measured with sap flux density) and leaf gas exchange to heatwave and drought conditions, and we examined the main environmental drivers controlling the tree transpiration rate during these periods. We observed varying responses of Js during the heatwave period at the four urban sites. When comparing the heatwave and no heatwave periods, a 35 %–67 % increase in Js was observed at the Park, Forest, and Orchard locations, whereas no significant change was seen at the Street site. Our results also showed that Js was higher (31 %–63 %) at all sites under drought conditions compared with non-dry periods. The higher Js values during the heatwave and dry periods were mainly driven by the high atmospheric demand for evapotranspiration, represented by the high vapor pressure deficit (VPD), suggesting that the trees were not experiencing severe enough heat or drought stress that stomatal control would have decreased transpiration. Accordingly, photosynthetic potential (Amax), stomatal conductance (gs), and transpiration (E) at the leaf level did not change during heatwave and drought periods, excluding the Park site where a significant reduction in gs was seen. VPD explained 55 %–69 % of the variation in the daily mean Js during heatwave and drought periods at all sites. At the Forest site, the increase in Js saturated after a certain VPD level, likely due to low soil water availability during these hot and dry periods. Overall, the heat and drought conditions were untypical of the region but not excessive enough to restrict stomatal control and transpiration, indicating that ecosystem services such as cooling were not at risk.
- Article
(2351 KB) - Full-text XML
- BibTeX
- EndNote


Ongoing urbanization transforms the natural environment, land cover, and ecological functions. Urbanization enhances CO2 emissions and the urban heat island (UHI) effect, leading to harsher conditions in cities and a decrease in thermal comfort when compared with more natural surroundings (Oke et al., 1989; Roth et al., 1989). Urban green spaces have a role in offsetting anthropogenic CO2 emissions and alleviating the UHI effect, given their potential for carbon sequestration and storage, and in water regulation to cool their surroundings (Lindén et al., 2016; Bowler et al., 2010; Havu et al., 2022; Hardiman et al., 2017). Several studies have highlighted the CO2 sequestration potential of urban vegetation (Nowak and Crane, 2002; Davies et al., 2011; Muñoz-Vallés et al., 2013; Nowak et al., 2013) and have addressed urban green areas as a way of mitigating greenhouse gas emissions in cities (Dhakal, 2010; Paloheimo and Salmi, 2013; Pataki et al., 2021). The role of urban trees in mitigating the UHI effect has also been well reported in many urban studies (Rahman et al., 2019; Pataki et al., 2011). Particularly, the potential of urban trees with respect to heat mitigation has been shown to be significant under extremely high temperatures (Gillner et al., 2015; Schwaab et al., 2021). Trees provide cooling through two main mechanisms. Firstly, urban trees reduce the surface temperature by shading, resulting in less absorption and storage of incoming short-wave radiation by surfaces. Secondly, trees cool the environment through transpiration when water taken up by roots is released through leaf stomata. The energy consumed to evaporate water from leaf stomata provides a cooling effect on the leaf surface and lowers the nearby air temperature by advection. Urban trees also provide other ecosystem services such as pollutant deposition, aesthetics, recreation, soil conservation, and a buffer for noise and wind (Brack, 2002; Jo, 2002; Jim and Chen, 2009; Pataki et al., 2009).
Under urban conditions, trees are subjected to harsh environmental conditions, such as elevated air temperature, lower air humidity, and limited soil water and nutrient availability, compared with surrounding areas (Nielsen et al., 2007). Extreme weather, such as heatwaves and drought, affects the physiology of urban trees and, thus, their potential to mitigate the effect of extreme weather and to adapt to climate change. Hence, it is important to understand the response of the physiological processes regulating urban trees' functioning during extreme weather events.
The rise in temperature during summer heatwaves affects tree function, both directly, with increasing leaf temperature potentially leading to leaf damage (Kunert et al., 2022; Atkin and Tjoelker, 2003; Ghannoum and Way, 2011), and indirectly, by increasing the vapor pressure deficit (VPD) with consequences for transpiration and photosynthesis through stomatal control (Lloyd and Farquhar, 2008). Tree responses to heatwaves in urban areas have rarely been studied, but trees in natural forests can adapt to rising temperatures by enhancing growth and utilizing water more efficiently if provided with enough moisture in the soil (Winbourne et al., 2020). However, such acclimation may not be possible for trees in urban settings, as shown by their often higher foliar temperatures, which may limit photosynthesis and transpiration (Bussotti et al., 2014). Droughts have been occurring more frequently in recent times, causing severe symptoms for trees, even in areas that are usually considered to be rather moist, such as high-latitude areas (Hartmann et al., 2022). A tree usually responds to drought by either avoiding a significant decrease in water potential and relative water content through stomatal closure at the cost of reduced photosynthesis, i.e., the isohydric strategy, or maintaining photosynthesis by keeping the stomata open at the cost of letting the water potential decrease, i.e., the anisohydric strategy (Villar-Salvador et al., 2004; De Micco and Aronne, 2012). Moreover, summer droughts are usually associated with a high air temperature that further severely reduces carbon assimilation and transpiration through lowered stomatal conductance and increases potential leaf damage (Bussotti et al., 2014; Winbourne et al., 2020).
However, the specific effects of an urban environment on trees' response to stresses such as drought and heat are not yet fully known. A few studies have investigated the potential cooling effect of urban trees during heatwaves and droughts (Gillner et al., 2015) or the impact of heatwaves and drought on urban trees' functions (Rötzer et al., 2021), where urban trees' functions depend on the species, growing conditions, local climate, and water availability. Nonetheless, because of the complex urban stressors and the spatial heterogeneity of urban landscapes, further studies are needed to quantify the impact of extreme events on urban trees' functions. This information is especially needed for high-latitude cities, as global warming is more prominent at high latitudes, thereby making their urban ecosystems particularly vulnerable.
In this study, we measured a set of typical processes regulating the functions of urban trees, specifically transpiration and leaf gas exchange, during local heatwave and drought conditions in the boreal urban environment of Helsinki, Finland. We used sap flow as a proxy for whole-tree transpiration and studied its response to hot and dry periods in different urban green areas. From these measurements, we further quantified how much the different environmental factors control the sap flow rate. We addressed the following research questions:
-
How does a local heatwave affect the transpiration and leaf gas exchange rates of boreal urban trees?
-
How does drought affect boreal urban tree transpiration and leaf gas exchange rates?
-
What are the main environmental drivers affecting transpiration rates during local heatwave and drought conditions in high-latitude urban green areas?
We hypothesize the following:
- H1
While increasing VPD during heatwaves increases the driving force for transpiration and thus sap flow, it also triggers stomatal closure, ultimately leading to a decrease in photosynthetic rates and a decoupling of VPD and leaf gas exchange rates.
- H2
A drought event decreases both sap flux density and the rate of photosynthesis.
To answer the questions and test the hypotheses, we conducted continuous sap flux and manual leaf gas exchange measurements at four diverse urban green areas in Helsinki during the summers of 2020 and 2021.
2.1 Site descriptions
The study was conducted near the University of Helsinki Kumpula Campus, located 4 km northeast of Helsinki city center. The Kumpula area is characterized by heterogeneous land-use cover (Fig. 1a), particularly due to contrasting urban vegetation. Within the study area, four sites were selected to be studied: a park with sparse trees (“Park”), a single line of roadside trees (“Street”), an urban forest (“Forest”), and an apple orchard (“Orchard”). These sites are located close to a micrometeorological eddy covariance station (FI-Kmp; 60∘12′11.3′′ N, 24∘57′40.4′′ E), which is also an Associated Ecosystem Station of ICOS (Integrated Carbon Observation System) and part of the SMEAR (Station for Measuring Ecosystem Atmosphere Relations) III station (Vesala et al., 2008; Järvi et al., 2009). Overall, Helsinki is a humid continental region (according to the Köppen climate classification), with an annual precipitation of 652 mm yr−1 and a yearly mean temperature of 6.5 ∘C during the 30-year climatic reference period of 1991–2020 (FMI, 2021). The summer of 2021 experienced elevated temperatures of 21.6 ∘C, which were 21 % higher than the average of the reference period, along with minimal rainfall of 86 mm, showing a 51 % deficit compared with the reference period.
The urban park (Park; Fig. 1b) is located in the Kumpula Botanic Garden, southwest of the FI-Kmp measurement tower. The study site is characterized by Tilia cordata trees and a ground layer of short vegetation comprised mainly of lawn species, clovers (Trifolium repens), and mosses. The ground vegetation was mowed daily using an automatic mowing device, leaving the clippings on-site, and irrigation was activated on dry and warm days within the wider park area. The daily mowing and irrigation were restricted in the area around the studied trees (0.25 ha area) during the measurement period, but the tree roots reached the irrigated area.
The roadside plantation (Street; Fig. 1c) is located on a road called “Hermannin rantatie”, 0.8 km east of the FI-Kmp measurement tower. It consists of a row of Tilia × europaea, a hybrid of T. cordata and T. platyphyllos. It is the most commonly planted urban tree in Helsinki and Nordic countries in general, comprising 44 % of the trees planted on the streets of Helsinki (Sjöman et al., 2012). The street trees grow over a 60 m long and 2.7 m wide patch of soil, with an average tree spacing of 8.2 m. Normally, the trees are regularly trimmed and maintained by the city gardening company, but they were not managed during our study.
Table 1Information on the four study sites: the site location; the dominant tree species; the drought strategy; the mean diameter at breast height (DBH), the sapwood area, and the height of three selected individuals; the years since plantation (age); and the soil particle type.
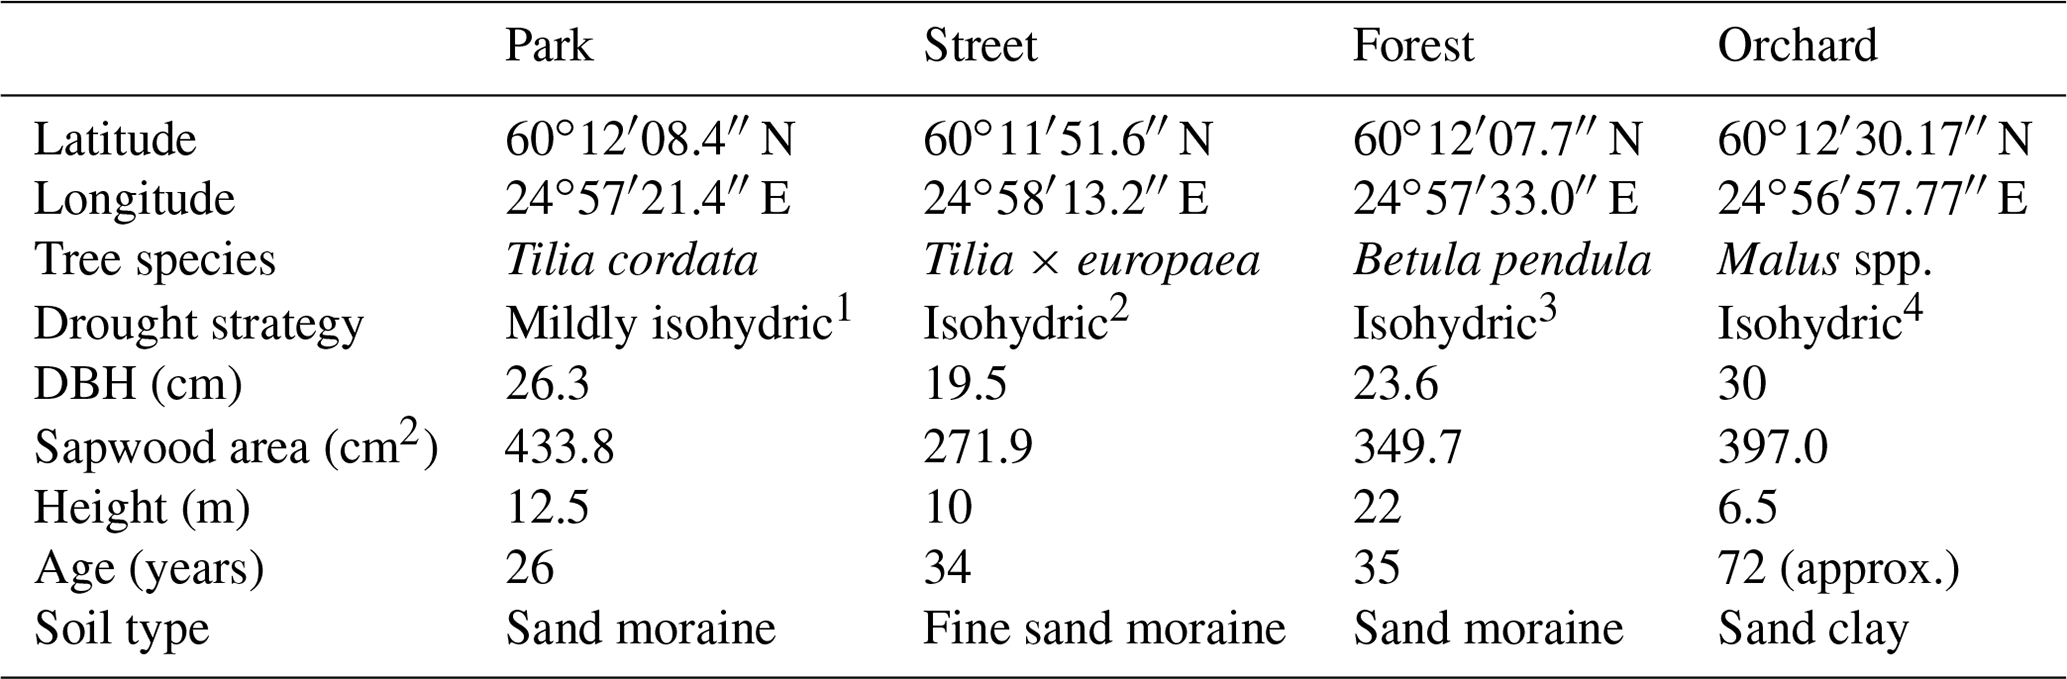
1 Information is from Leuschner et al. (2019). 2 Information is from Liu et al. (2022) and Kunert and Tomaskova (2020). 3 Information is from Zapater et al. (2013). 4 Information is from Lauri et al. (2011).
The urban forest (Forest; Fig. 1d) is a small forest patch (25 m × 30 m) located between the FI-Kmp measurement tower in the north and the Kumpula Botanic Garden in the south. This site is dominated by mature Betula pendula trees, but other deciduous trees, such as Betula pubescens, Alnus glutinosa, Acer platanoides, and Ulmus glabra, are also found at the site. The sparse ground vegetation layer consists mainly of Aegopodium podagraria and bare spots. This site was the only non-managed study site and was regenerated naturally.
The apple orchard (Orchard; Fig. 1e) is located in the Kumpula School Garden, 0.9 km west of the FI-Kmp measurement tower. The site is characterized by scattered apple trees (20 trees per 30 m × 30 m area) planted over a managed lawn. There was no irrigation. The lawn in our measurement area was manually mown a few times during the summers.
More detailed descriptions of all four sites are given in Table 1, and soil properties, particularly soil water retention properties, are presented in the Appendix (Table A1). All sites except the Orchard site (where data were recorded only from June to September 2021) were equipped with continuous measurements of sap flux and meteorological variables from June 2020 to September 2021. Manual leaf gas exchange measurements accompanied the continuous measurements during the summer months (June–August).
2.2 Sap flux measurements
Sap flux measurements were conducted using a thermal dissipation probe (TDP; Granier, 1985). TDP sensors consist of needles (20–30 mm long) equipped with thermocouples, where the downstream needle acts as a heating probe and the upstream needle acts as a reference probe. The thermocouples measure the temperature difference between the heated probe and the reference probe, and this measurement is subsequently used to calculate the sap flux density. Sap flux density can be scaled up to estimate the whole-tree water use. In our study, we selected three trees at each site (for a total of 12 trees) based on high sun exposure and dominant position. For each tree, a TDP sensor was inserted into the stem xylem at a height of 1.3 m. A vertical distance of 10 cm was kept between the heated and reference probes. At the Street and Forest sites, the sensors were installed at 2 m height to avoid damage or disturbance from pedestrians. The sensors were installed on the northern side of the stem. The installed sensors were insulated with reflective aluminum foil to protect them and minimize the thermal gradient effect. The temperature difference (dT) was recorded every 1 min using a datalogger (Datataker DT80M). The sap flux density (Js, ) was calculated at a 1 min interval based on Graniers' equation (Eq. 1):
where dTmax is the maximum dT at which zero Js was observed. The zero-flux condition was based on Lu et al. (2004) and was derived as the average local daily maximum dT of 7 consecutive nights. Processing of raw sap flux data was conducted in R (RStudio Team, 2020). Further, daily tree water use was calculated by multiplying the daily sap flux density by the sapwood area. For Tilia cordata, Tilia × europaea, and Betula pendula, the sapwood area was derived from the literature using species-specific allometric equations based on trunk diameter (Gebauer et al., 2008; Hernandez-Santana et al., 2015); for the Orchard site, we calculated the sapwood area by coring the stem of the apple trees. For further analysis, the sap flux density data were selected only for the growing season (June–September) for 2020 and 2021. Only data from sunny days were considered to compare the sap flux density of the four sites. Sunny days were selected based on the following criteria: the daily total Solar radiation (Rg) was greater than 200 W m−2, there was no precipitation, and the mean daytime VPD was greater than 0.33 kPa (Riikonen et al., 2016). Sap flux data were averaged to half-hourly, daily, and monthly values for each measured tree. In addition, we normalized the sap flux density using the VPD by dividing the half-hourly Js by the corresponding half-hourly VPD data. This was done to remove the effect of VPD and also to examine the dependency of Js on other environmental variables during these heatwave and drought periods.
2.3 Leaf gas exchange
Leaf gas exchange rates were measured using a portable gas exchange system (GFS-3000, Heinz Walz GmbH, Germany) with a standard measuring head (8 cm2 cuvette, 2 cm × 4 cm). At each site, measurements were done during the summers of 2020 and 2021 at approximately 4-week intervals using the trees equipped with TDP sensors. However, at the Park site, one different tree was selected for leaf gas exchange measurements to replace one of the sap-flow-equipped trees, as it was difficult to reach its canopy with an aerial lift. The measurements were recorded on the southern or southwestern side of the trees and conducted mainly during local morning time (8:00–12:00 LT). At the Park site, measurements were made at three canopy heights (top, middle, and bottom), whereas only two heights (the top and bottom) were monitored at the Street and Forest sites. At the Orchard site, only one measurement was made in the middle of the canopy of each tree. The measurements were performed on one healthy leaf per tree and canopy height.
During each measurement, the CO2 level was set to 415 ppm. The temperature followed the ambient conditions. To screen out any potentially damaged leaves, a different leaf was selected from the same branch if the assimilation rate during the first 10 min of the measurement was very low (under 1.5 ). The measurement steps involved setting photosynthetically active radiation (PAR) to 1200 for 12 min and then increasing it to a level of 1500 . After reaching the maximum level, PAR was gradually decreased down to < 1 over 43 min. Altogether, 15 different PAR intensities were included. A simple light response curve was fitted to the net CO2 exchange (NE(PAR), ), as follows:
where R is the leaf respiration, i.e., NE measured at PAR = 0 (); Amax () is the maximum rate of photosynthesis; and β () is the half-saturation constant describing the light intensity where photosynthesis rate is half of Amax.
From the above fitting, only Amax is considered in our analysis. Other variables of leaf gas exchange, namely stomatal conductance (gs, ) and transpiration (E, ), were also recorded during the measurements. Maximum stomatal conductance and transpiration were calculated based on momentary gs and E at PAR = 1100 .
During the manual measurement campaigns in the summer of 2021, three leaf samples per site were also collected every month in order to measure their relative water content (RWC). The samples were collected during the late afternoon (16:00 LT) and the fresh weight (FW) was measured. After that, the leaf samples were soaked overnight and their turgid weight (TW) was measured. Later on, the samples were oven-dried at 60 ∘C for 24 h and their dry weight (DW) was measured. The RWC was calculated based on the equation below:
2.4 Meteorological and soil data
At all four sites, meteorological variables, including air temperature (Air T, ∘C) and relative humidity (RH, %), were measured at a height of 1.5–1.8 m with a weather sensor (HMP110, Vaisala, Vantaa, Finland, at the Park, Street, and Forest sites; HC2A, Rotronic, Bassersdorf, Germany, at the Orchard site). Soil sensors (Hydra-probe 2 SDI-12 sensors, Stevens, Oregon, USA, at the Park, Street, and Forest sites; ML3 ThetaProbe, Delta-T, Cambridge, UK, sensors in the Orchard) were installed at 10 and 30 cm depth to measure soil temperature (Soil T, ∘C) and soil moisture (SM, m3 m−3). Data were recorded continuously at 1 min intervals and then converted into half-hourly averaged data. Furthermore, the vapor pressure deficit (VPD, kPa) was calculated using Air T and RH based on the saturated vapor pressure. Photosynthetically active radiation (PAR, W m−2) and precipitation data were collected from the SMEAR III station FI-Kmp measurement tower and the roof of a nearby building, respectively (Vesala et al., 2008; Järvi et al., 2009).
2.5 Detection of local heatwave and drought periods
According to Fischer and Schär (2010), a heatwave is defined as a spell of at least 6 consecutive days with maximum temperatures exceeding the local 90th percentile of the control period. Accordingly, in our study, a heatwave (Fig. A1 in the Appendix) was defined against a control period spanning from 1991 to 2020. Further, our study period was categorized into the four following periods: heatwave (17 June 2021 to 18 July 2021), pre-heatwave (1 to 16 June 2021), post-heatwave (19 July 2021 to 31 August 2021), and no heatwave (1 to 31 July 2020) periods. These periods had mean daily maximum air temperatures of 26.4, 21.5, 20.4, and 19.6 ∘C, respectively. The daily maximum air temperature during the heatwave period ranged from 20.5 to 30.2 ∘C, with a mean daily difference of 6 ∘C (ranging from 1.8 to 10.8 ∘C) above the average temperature in the control period.
To determine the drought period, a monthly standardized precipitation–evapotranspiration index (SPEI; Vicente-Serrano et al., 2010) was calculated, indicating that June (SPEI = −1.4) and July 2021 (SPEI = −0.8) experienced moderate drought conditions. Here, we considered days with precipitation of less than 1 mm and a mean relative extractable soil water (REW) at a depth of 10 cm of less than 0.45 as a dry period for all sites. As a result, the dry period was from 22 June 2021 to 27 July 2021 and the wet period was from 28 July 2021 to 31 August 2021. We calculated the REW from the soil moisture data, field capacity, and wilting point of the site according to Granier et al. (1999), where the wilting point and field capacity of sandy loam (Park, Street, and Forest) were 10 % and 22.9 %, respectively, and those of clay (Orchard) were 25 % and 38.4 %, respectively, based on Hagemann and Stacke (2015).
Considering the partial overlap between the heatwave and dry periods, we also identified three stress periods: only heat (17 June 2021 to 22 June 2021), both heat and dry (23 June 2021 to 18 July 2021), and only dry (19 July 2021 to 27 July 2021).
2.6 Statistical analysis
To test the hypotheses, a Kruskal–Wallis test followed by Dunn's post hoc test was performed to examine differences in the Js and leaf gas exchange variables (Amax, gs, and E) between the different climatic (dry, wet, heatwave, post-heatwave, and no heatwave) periods. First, a second-order polynomial regression was fitted between the daytime mean Js and the daytime mean VPD. Second, multiple linear regression analysis was performed to determine the effect of the meteorological variables on Js. The tested variables were VPD, PAR, soil moisture, and soil temperature at 30 cm. The relative importance of each meteorological variable with respect to controlling the daily Js was assessed using the t statistic from the multiple linear regression summary. Data processing (post-processing of sap flux, meteorological, and gas exchange data), statistical analysis, and visualization were conducted in Python (version 3).
3.1 Weather conditions
The summer of 2021 (particularly July) was warm and dry compared with the summer of 2020 and the climatic reference period (1991–2020). The mean air temperature in July 2021 was 21.6 ∘C, which was 21 % higher than that in July 2020 (16.7 ∘C) and 19 % higher than the average July temperature during the climatic reference period (18.1 ∘C) (Fig. 2a). At the four urban sites, high air temperature (20.2–21.6 ∘C), high soil temperature (15.7–18.5 ∘C), high VPD (0.9–1.1 kPa), and low soil moisture (0.1–0.4 m3 m−3) were observed during July 2021 (Fig. 3 for the Park site and Figs. A2–A4 for the other sites). The total precipitation for June and July 2021 (86 mm) was 51 % lower than for June and July 2020 (177 mm) and 27 % lower than precipitation on average for the climatic reference period (117 mm) (Fig. 2b).
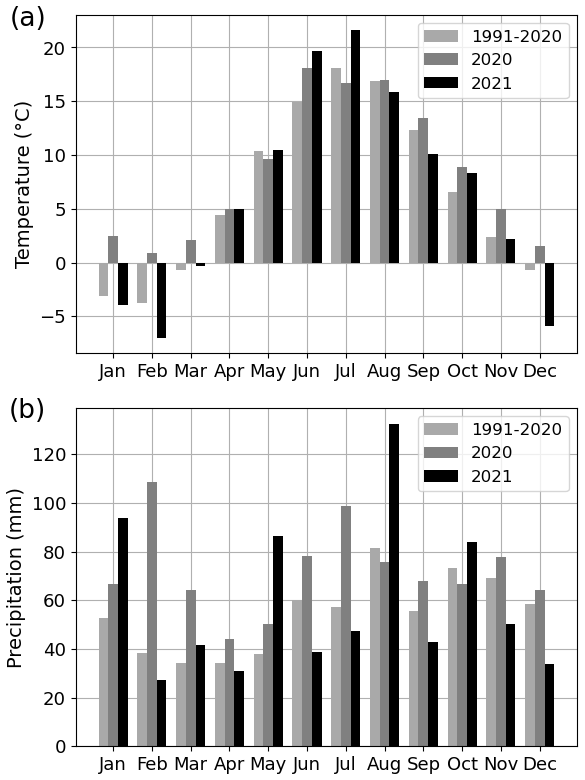
Figure 2(a) Monthly mean air temperature and (b) monthly total precipitation for the years 2020 and 2021 as well as for the 30-year climatic reference period (1991–2020).
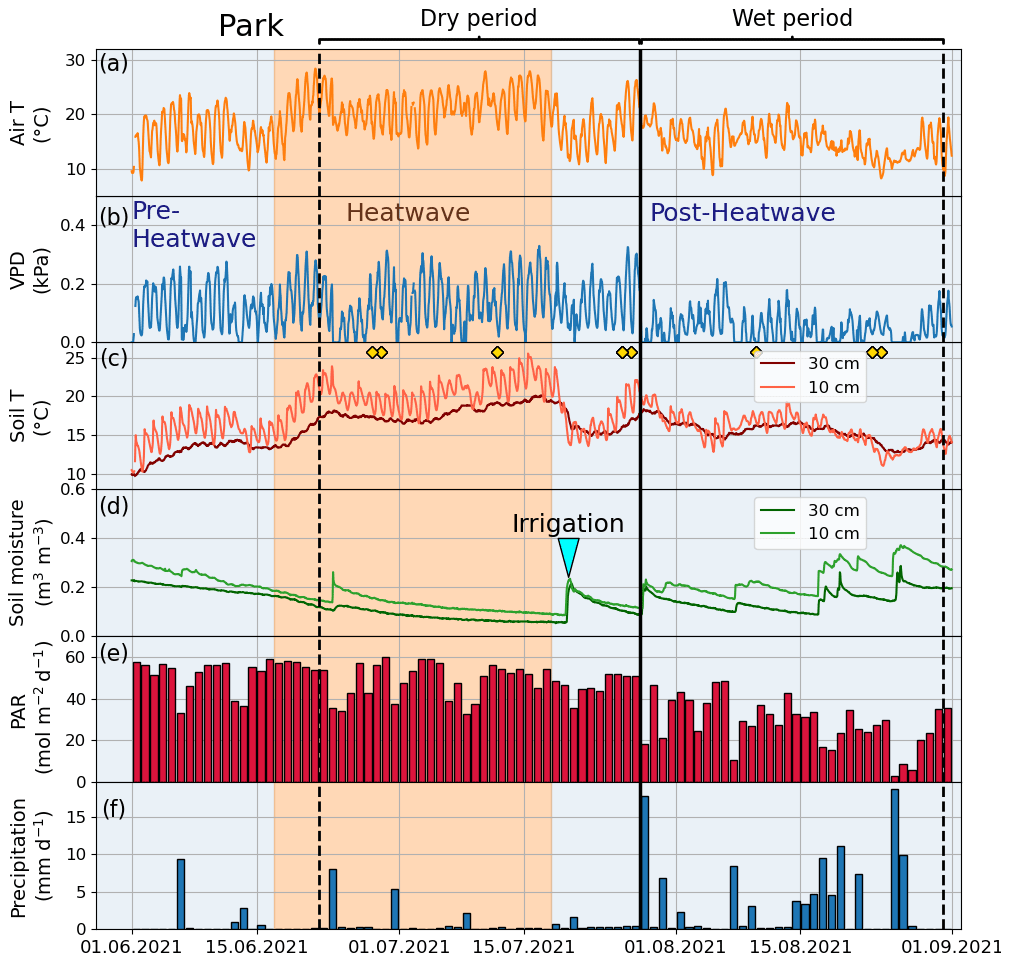
Figure 3Meteorological and soil data from 2021 showing hourly (a) air temperature (Air T), (b) water vapor deficit (VPD), (c) soil temperature (Soil T), and (d) soil moisture measured at the Park site as well as (e) daily mean photosynthetically active radiation (PAR) and daily sum precipitation data measured at the SMEAR III station. The orange shading indicates the heatwave period during the summer of 2021 and the black vertical line indicates the onset of the wet period. The yellow markers in panel (c) denote the manual leaf gas measurement dates.
The climatic conditions differed between the four sites during the summer of 2021. The means of the meteorological variables (air temperature, VPD, soil temperature, and soil moisture) during the summer months (June, July, and August) of 2021 were considered for comparison. A higher mean air temperature was observed at both the Orchard (19.2 ∘C) and Street (19.3 ∘C) sites compared with the Forest (17.9 ∘C) and Park (17.8 ∘C) sites (Table 2). A similar mean VPD was found at the Orchard (0.78 kPa), Park (0.75 kPa), and Forest (0.75 kPa) sites, but VPD was 11 % higher at the Street site (0.84 kPa). Moreover, the mean soil temperature at the Street site (19.9 ∘C) was 24 %–34 % higher than at the Park (16.1 ∘C), Orchard (15.2 ∘C), and Forest (14.8 ∘C) sites. The soil water availability varied from 13 % to 25 % (Fig. A1). Mean soil moisture differed between sites, with the Orchard site having the highest values (0.37 m3 m−3), the Forest site having the lowest values (0.09 m3 m−3), and the Park and Street sites having intermediate values (0.13 and 0.22 m3 m−3, respectively). Soil moisture increased after rainfall events at all sites except the Forest site, where the soil moisture remained low throughout the late summer after the hot and dry July 2021 (Fig. A3). The climatic conditions differed between the four sites during the summer of 2021. The means of the meteorological variables (air temperature, VPD, soil temperature, and soil moisture) during the summer months (June, July, and August) of 2021 were considered for comparison. A higher mean air temperature was observed at both the Orchard (19.2 ∘C) and Street (19.3 ∘C) sites compared with the Forest (17.9 ∘C) and Park (17.8 ∘C) sites (Table 2). A similar mean VPD was found at the Orchard (0.78 kPa), Park (0.75 kPa), and Forest (0.75 kPa) sites, but VPD was 11 % higher at the Street site (0.84 kPa). Moreover, the mean soil temperature at the Street site (19.9 ∘C) was 24 %–34 % higher than at the Park (16.1 ∘C), Orchard (15.2 ∘C), and Forest (14.8 ∘C) sites. The soil water availability varied from 12.9 % to 25 % (Table A1). Mean soil moisture differed between sites, with the Orchard site having the highest values (0.37 m3 m−3), the Forest site having the lowest values (0.09 m3 m−3), and the Park and Street sites having intermediate values (0.13 and 0.22 m3 m−3, respectively). Soil moisture increased after rainfall events at all the sites except the Forest site, where the soil moisture remained low throughout the late summer after the hot and dry July 2021 (Fig. A3).
Table 2Monthly mean air temperature (Air T, ∘C), mean vapor pressure deficit (VPD, kPa), mean soil temperature (Soil T, ∘C), and mean soil moisture content (m3 m−3) for the four study sites in 2021.
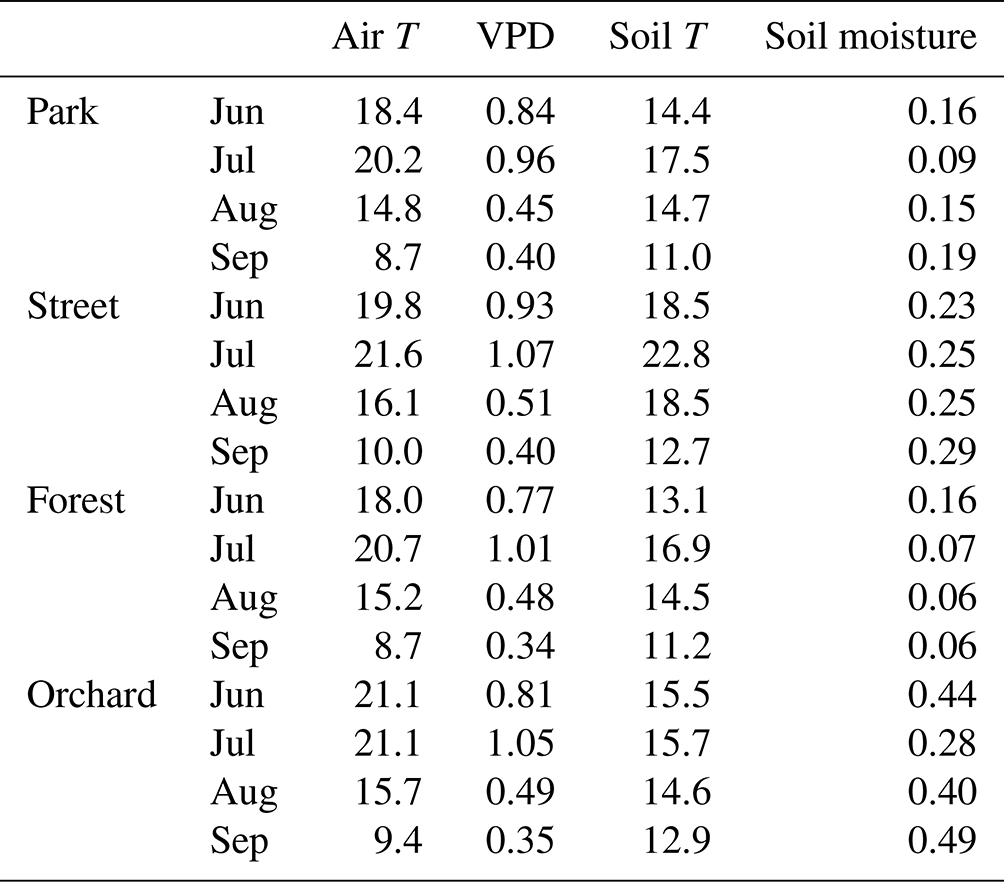
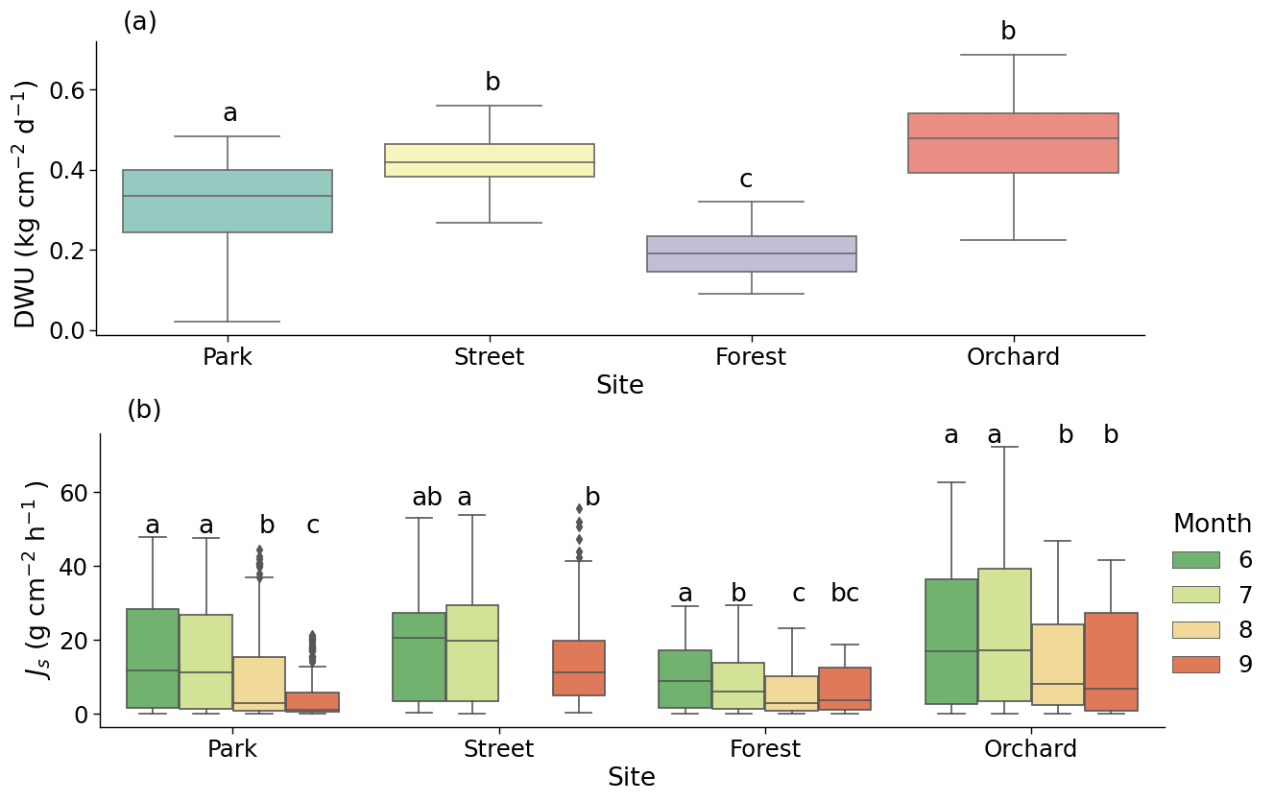
Figure 4(a) Daily water use (DWU) of the trees and (b) monthly mean sap flux density (Js) at the four urban vegetation sites: Park (Tilia cordata), Street (Tilia × europaea), Forest (Betula pendula), and Orchard (Malus spp.). The letters indicate the significant differences between the (a) sites and (b) monthly mean Js at each site (P < 0.05). Note that data were not available for August at the Street site due to technical problems.
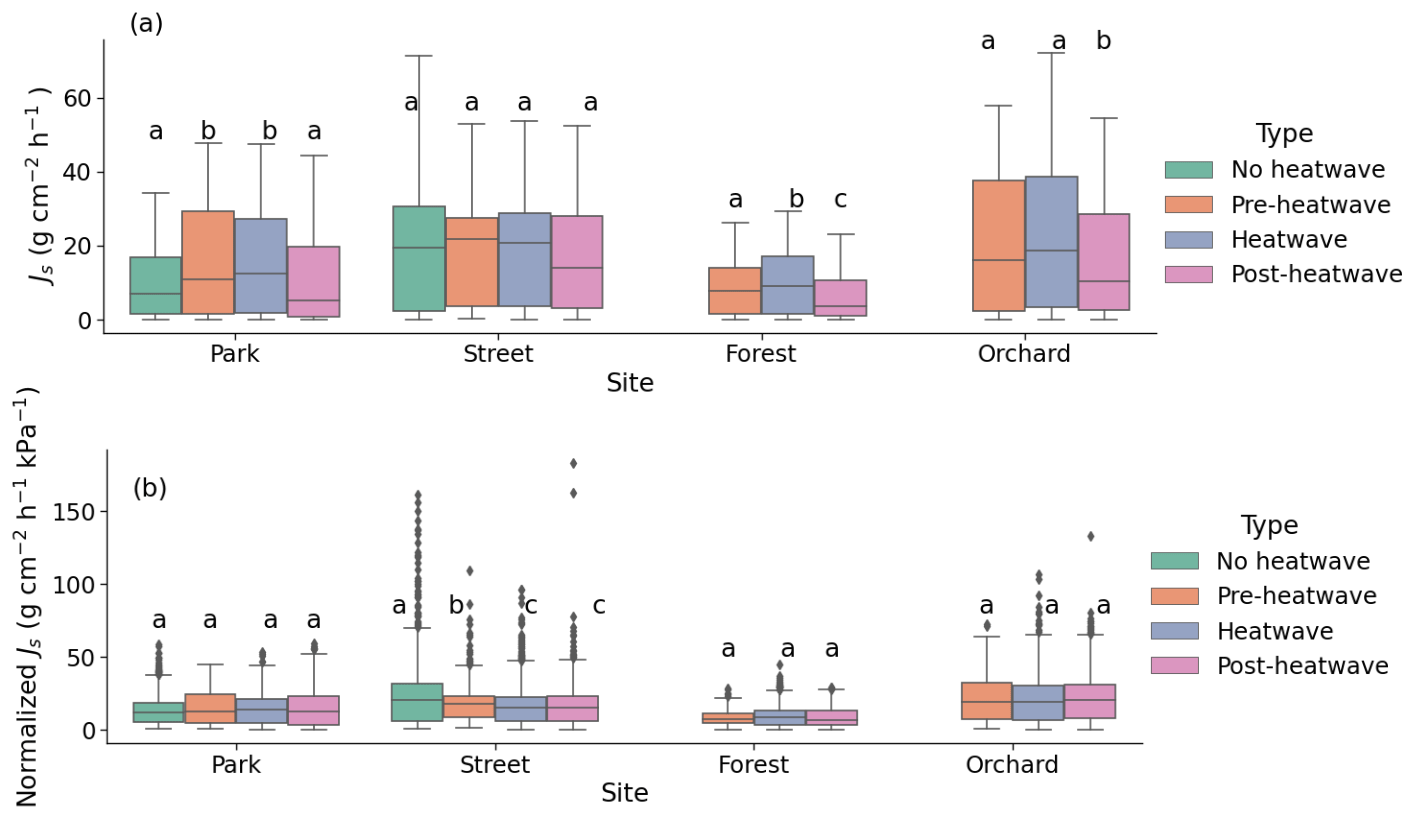
Figure 5Sap flux densities at the four urban vegetation sites during different periods of a heatwave: (a) mean Js of the whole day and (b) mean normalized Js by VPD on sunny days. The letters indicate the significant differences between the different periods at each site (P < 0.05).
3.2 Variability in the sap flow rate in 2021
On sunny days, the mean daily water use values of the trees at the Park, Street, Forest, and Orchard sites were 0.32 ± 0.01, 0.42 ± 0.01, 0.20 ± 0.01, and 0.46 ± 0.01 , respectively (Fig. 4a), and differed significantly from each other (P < 0.05). The mean daytime sap flux density (Js) for the summer period (June–August) was the highest at the Orchard site (20.6 ± 0.3 ), the lowest at the Forest site (8.1 ± 0.1 ), and 14.4 ± 0.2 and 17.7 ± 0.3 at the Park and Street sites, respectively. The monthly mean Js differed significantly, especially between July and September, at the four sites (P < 0.05; Fig. 4b).
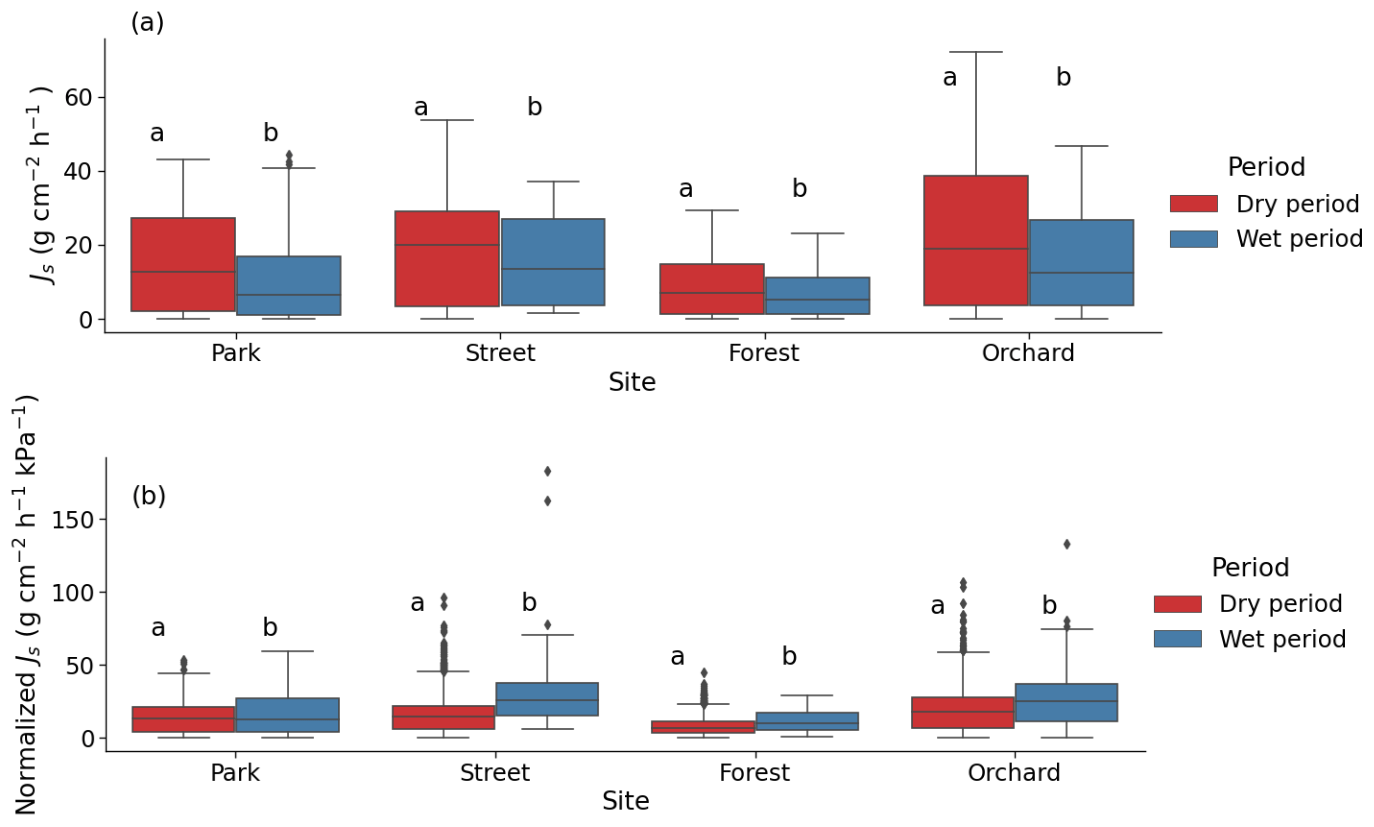
Figure 6Sap flux density (Js) during dry and wet periods at the four study sites. Based on sunny days, data represented (a) the mean Js of the whole day and (b) normalized Js by VPD. The letters indicate significant differences in Js between dry and wet periods at each site (P < 0.05)
3.3 The effect of a heatwave on the sap flux density
During the heatwave period, the mean sap flow rates of the trees at the Park, Street, Forest, and Orchard sites were 0.38 ± 0.02, 0.42 ± 0.02, 0.24 ± 0.01, and 0.52 ± 0.02 , respectively. At the Park site, the mean Js during the heatwave period was 59 % higher than during the no heatwave period and 39 % higher than during the post-heatwave period, but there was no significant difference compared with the pre-heatwave period. At the Street site, there was no significant difference in the mean Js between the heatwave, no heatwave, pre-heatwave, and post-heatwave periods. At the Forest site, the mean Js during the heatwave period was 13 % higher than during the pre-heatwave and 67 % higher than during the post-heatwave periods. At the Orchard site, the mean Js during the heatwave period was 35 % higher than during the post-heatwave period, but there was no significant difference compared with the pre-heatwave period (P < 0.05; Fig. 5a). At the Forest and Orchard sites, no data were recorded during the no heatwave period.
When normalized with the VPD, there were no significant differences in Js between the heatwave, no heatwave, pre-heatwave, and post-heatwave periods in the Park, Forest, or Orchard sites (Fig. 5b). At the Street site, normalized Js during the heatwave period was 33 % lower than during the no heatwave period and 7 % lower than during the pre-heatwave period, but no difference was observed compared with the post-heatwave period.
3.4 The effect of drought on the sap flux density
During the dry period, the mean sap flow rates at the Park, Street, Forest, and Orchard sites were 0.36 ± 0.02, 0.42 ± 0.01, 0.20 ± 0.01, and 0.50 ± 0.02 , respectively. The mean Js was significantly higher during the dry period than during the wet period at all sites (P < 0.05; Fig. 6a). At the Park, Street, Forest, and Orchard sites, the mean Js was 66 %, 31 %, 43 %, and 53 % higher during dry period than during the wet period, respectively.
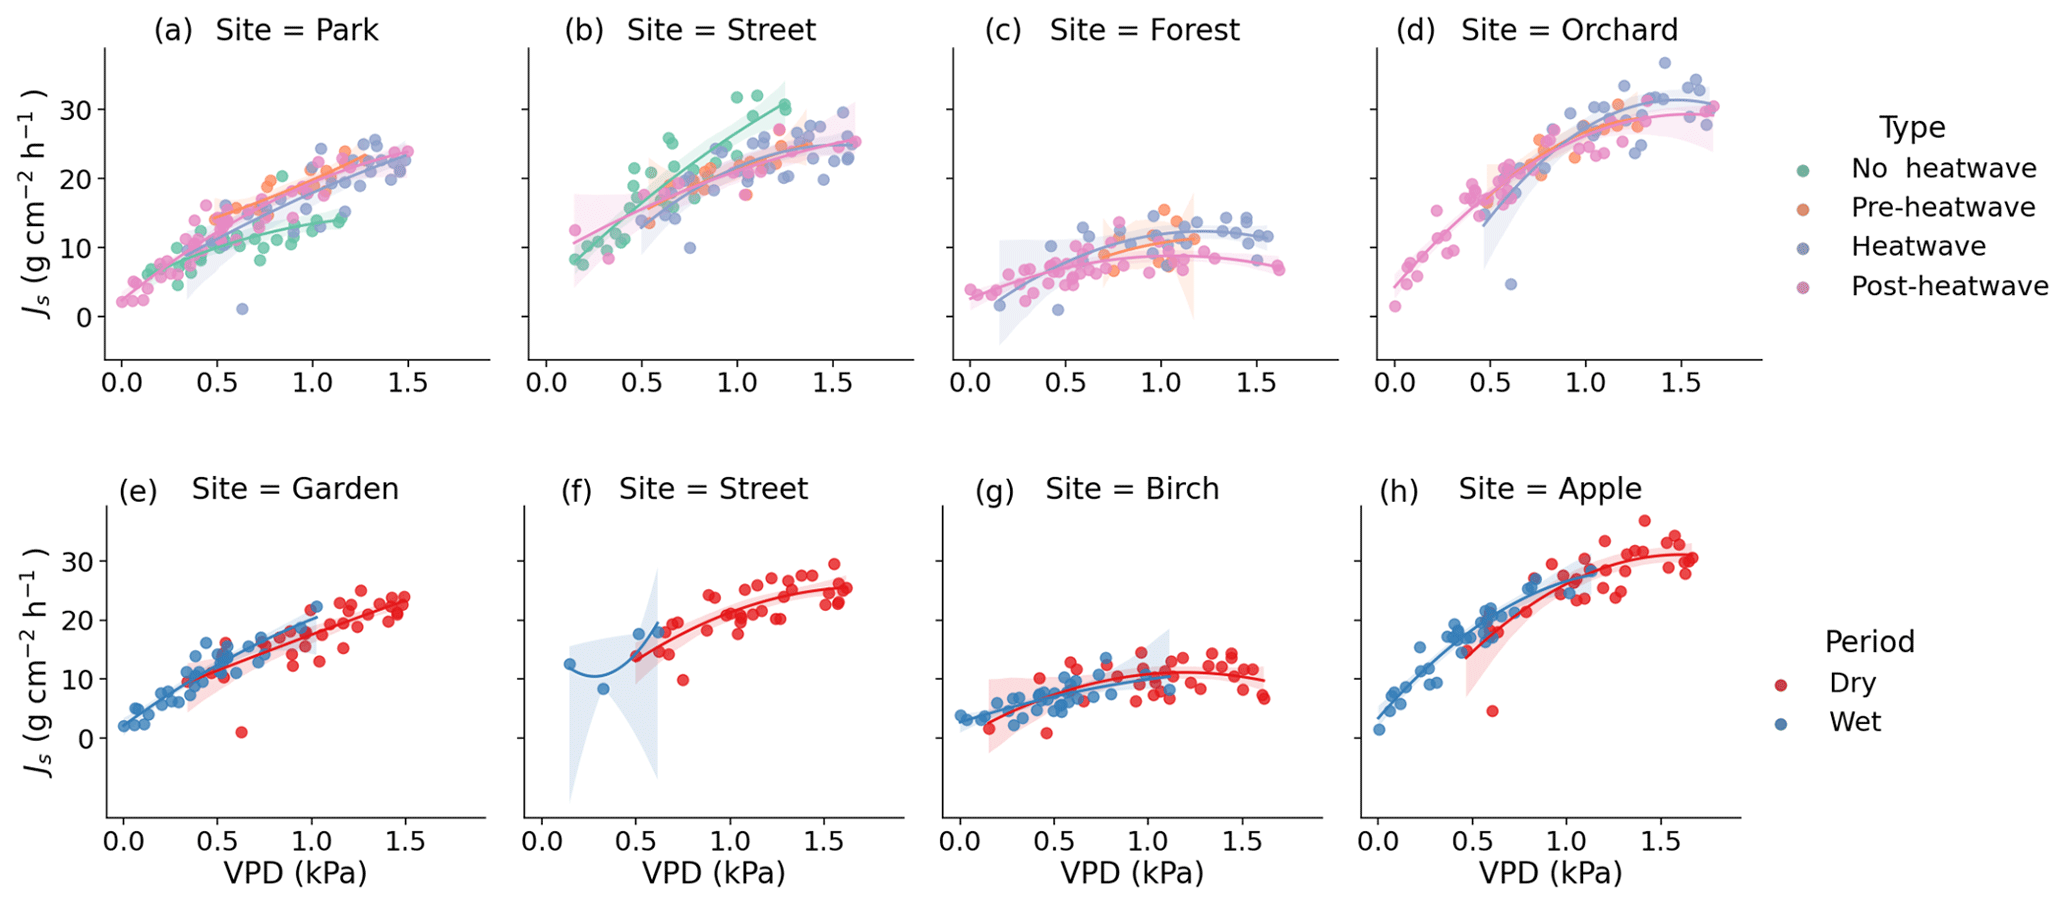
Figure 7Observed (dots) and modeled (lines) relationship between the daytime mean daily VPD and Js during the different heatwave periods as well as the dry and wet periods. Panels (a), (b), (c), and (d) show the relationship between VPD and Js at the respective Park, Street, Forest, and Orchard sites during the different heatwave periods. Panels (e), (f), (g), and (h) show the relationship between VPD and Js at the respective Park, Street, Forest, and Orchard sites during the dry and wet periods. The model is a second-order polynomial fit (see Table 4).
Normalized Js was significantly lower during the dry than during the wet period at all sites, with a reduction of 16 %, 48 %, 28 %, and 26 % in normalized Js during the dry period at the Park, Street, Forest, and Orchard sites, respectively (Fig. 6b).
Considering the partial overlap of the heatwave and dry periods, we identified three stress periods: only heat (17 June 2021 to 22 June 2021), both heat and dry (23 June 2021 to 18 July 2021), and only dry (19 July 2021 to 27 July 2021). We then analyzed the effect of only heat, only dry, and both heat and dry on sap flux density. This analysis revealed that the effect of heat was relatively stronger than the effect of drought or that of both heat and drought at the Park, Forest, and Orchard sites, whereas the effect of heat, drought, and both were similar at the Street site (Fig. A6).
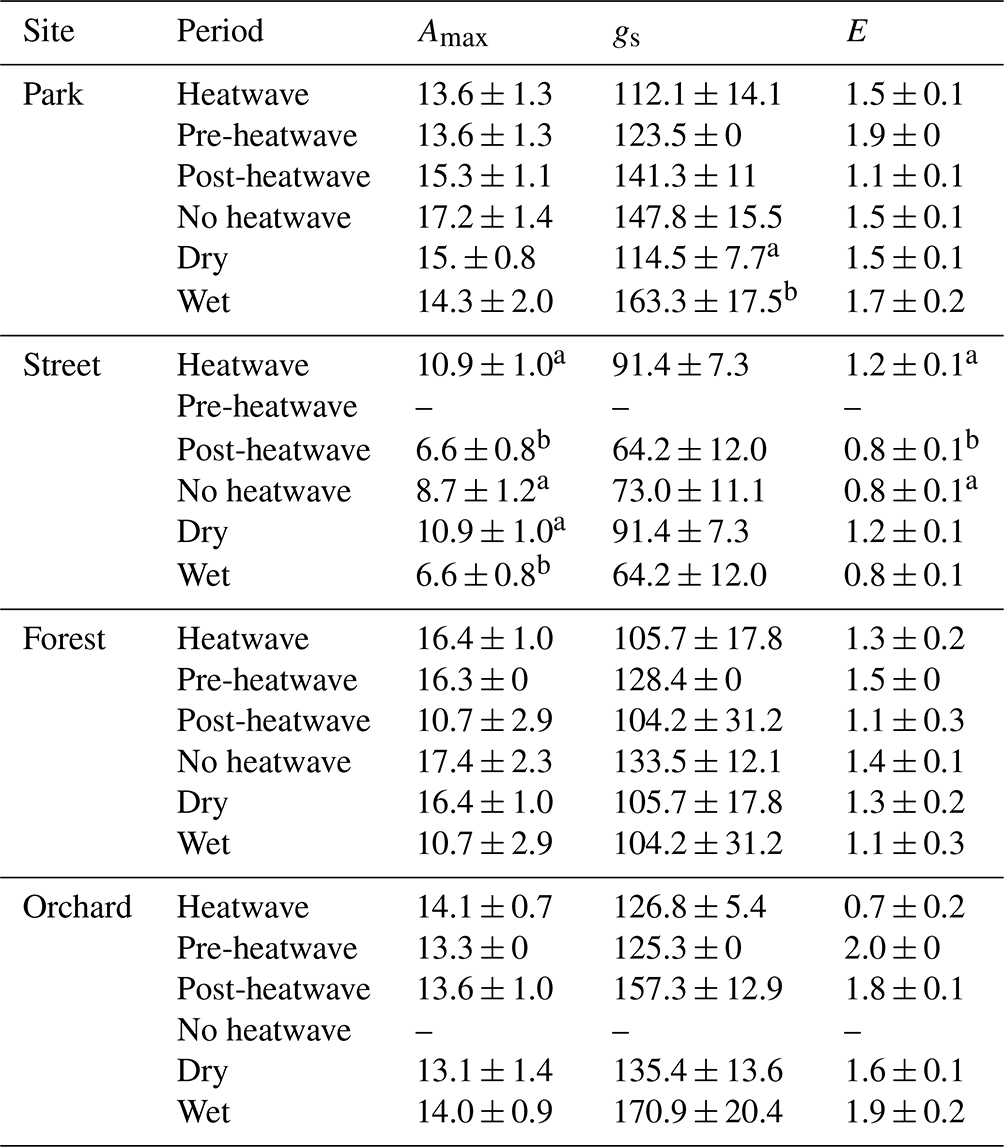
Table 3Averages of leaf gas exchange variables: maximum assimilation (Amax, ), stomatal conductance (gs, ), and transpiration (E, ) during heatwave, no heatwave, pre-heatwave, and post-heatwave periods and during dry and wet periods at the four sites. The letters indicate significant differences between the various heatwave periods or drought periods. No data were available at the Street site during the pre-heatwave period nor at the Orchard site during the no heatwave period.
3.5 Leaf gas exchange during the heatwave and drought periods
We compared leaf gas exchange variables, namely Amax, gs, and E, between the different heatwave periods and between dry and wet periods (Table 3). No significant differences in these three variables were found at the Park, Forest, or Orchard sites between the different heatwave periods; however, at the Street site, Amax and E were significantly (P < 0.05) higher during heatwave than during the post-heatwave periods, but there was no significant difference compared with the no heatwave period. Moreover, gs showed no difference between the different heatwave periods at the Street site.
Comparing leaf gas exchange variables between dry and wet periods at the Street site, we found that Amax was significantly higher (P < 0.05) during dry period than during the wet period, but no significant differences in gs and E between dry and wet periods were found. Moreover, at the Park site, gs was found to be significantly lower (P < 0.05) during the dry period than during the wet period. At the Forest and Orchard sites, no significant differences were found in Amax, gs, or E between dry and wet periods.
The monthly relative leaf water content (RWC) as a proxy for leaf water potential was found to be lower (4 %–35 %) during July compared with June and August at the Forest and Orchard sites. However, the RWC was found to be higher (5 %–8 %) during July than the other summer months at the Park and Street sites (Fig. A5 in the Appendix).
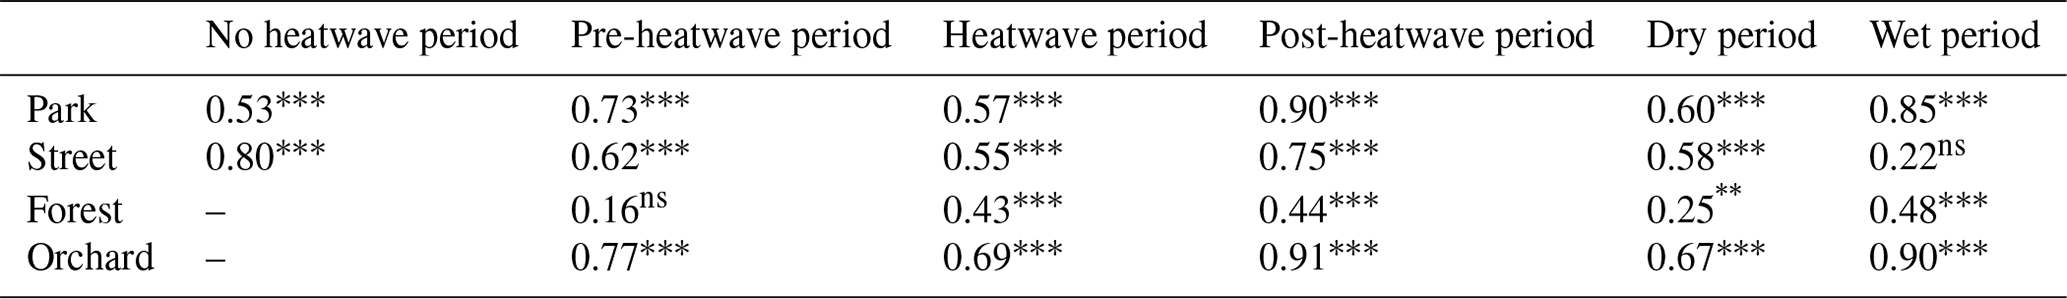
Table 4Relationship between vapor pressure deficit and daily mean sap flux density using a second-order polynomial fit (see Fig. 7). The values indicate the squared coefficient of correlation (adj. R2) between the two variables. Relationships that are statistically significant at the 0.05, 0.01, and 0.001 levels are marked with “∗”, “”, and “”, respectively, whereas non-significant is marked as “ns”.
3.6 Environmental control on the sap flux density
We tested the relationship between the daily daytime mean VPD and Js using a second-order polynomial regression (Fig. 7, Table 4). The VPD explained the variation in Js less during the heatwave period than during the post-heatwave and pre-heatwave periods except for at the Forest site, where the VPD was not a significant driver at all during the pre-heatwave period. During the wet period, the VPD explained a higher share of the variation in Js at the Park, Forest, and Orchard sites. At the Street site, the data availability was low; thus, the relationship could not be tested during the wet period (Fig. 7).
A multiple linear regression between Js and a number of environmental variables (VPD, PAR, Soil T, and SM) showed that PAR and VPD were the significant drivers of Js at the Park, Street, and Orchard sites, whereas PAR was the only significant driver at the Forest site (Table 5). In addition, soil moisture was a significant variable under certain circumstances at certain sites, such as at the Park site during heatwave and dry periods and at the Forest site during the post-heatwave, dry, and wet periods, i.e., in the latter part of the growing season in general.
Table 5Multiple linear regression between the daily mean sap flux density and various environmental drivers (VPD, PAR, soil temperature, and soil moisture) as independent variables. The t statistic value indicates the relative importance of the variables with respect to controlling the daily sap flux variations. Relationships that are statistically significant at the 0.05, 0.01, and 0.001 levels are marked with “∗”, “”, and “”, respectively, whereas non-significant is marked as “ns”.
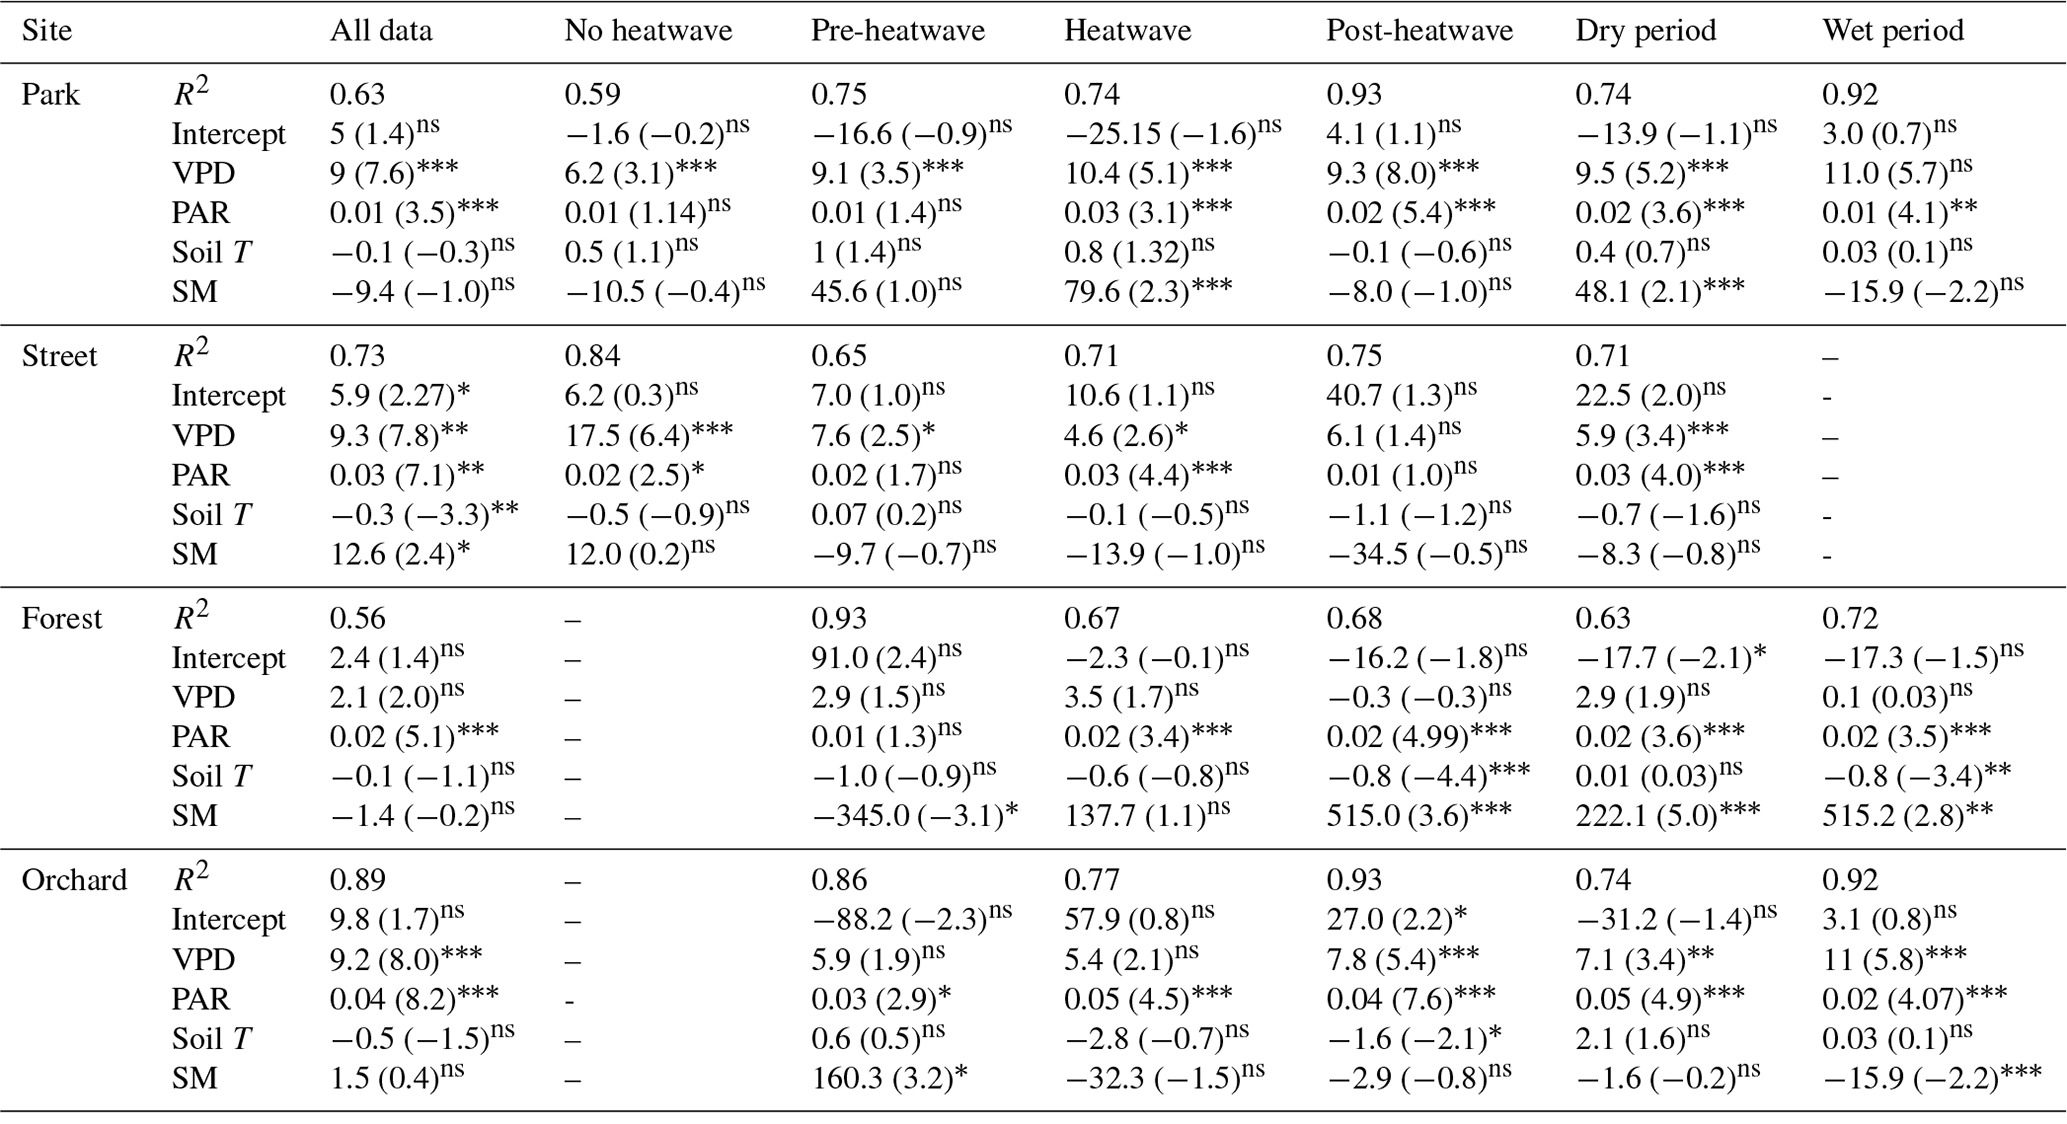
Values indicate coefficient (t)sig.
In this study, we assessed the response of urban tree water use and leaf gas exchange across four urban green areas in Helsinki during the hot and dry summer of 2021. The results indicated an increased sap flux density in trees during the hot and dry periods, whereas carbon assimilation, stomatal conductance, and leaf-level transpiration remained largely unaffected. The sap flux density increase in such periods varied among the studied urban sites with distinct tree species and growth conditions. The VPD emerged as the primary factor influencing tree water use under heatwave and dry conditions. In summary, the urban trees in our study exhibited typical functioning during the summer of 2021, suggesting that the hot and dry conditions did not induce significant physiological changes or adjustments. However, we found some interesting insights that we will discuss further in this section.
4.1 Site variability
Our study observed that the four chosen urban vegetation sites in Helsinki exhibited variable climatic conditions: the air temperature under the canopy, soil temperature, and soil moisture content were different. The highest air and soil temperatures were measured at the Street site, where impervious surfaces increased the temperatures due to heat storage. The high air temperature at the Orchard site was due to the exposure of the site to direct sunlight throughout the day, which heated the garden. Moreover, the high soil moisture at the Orchard site was mainly due to the difference in soil type: the sand clay in the Orchard had a higher water holding capacity than the sand moraine soil type at the other three sites. At the Street site, the VPD was higher than at the other three sites because of the higher air temperature, likely due to the larger cover of impervious surfaces. Similar variability in meteorological conditions between different urban forests has been found in the metropolitan city of Los Angeles, where the urban forests located near the city were warmer with a higher VPD and lower PAR compared with the urban forests situated closer to the coast (Pataki et al., 2011). In a study of 10 different tree species in the city of Basel (Switzerland), Leuzinger et al. (2010) found that the tree crown temperature was lower in the park than in the street, although they reported species-specific differences in the cooling effect of urban trees. Indeed, the difference in microclimatic conditions in urban vegetation has been observed to vary depending on the type of vegetation, the composition of the species, the amount of green cover, and the impervious surfaces present (Perini and Magliocco, 2014; Kjelgren and Clark, 1992). Furthermore, many other studies have shown high variability in transpiration across different urban green areas (Pataki et al., 2011; McCarthy and Pataki, 2010; Sushko et al., 2021). For example, in the high-latitude city of Gothenburg (Sweden), T. europaea had 2-fold higher daytime transpiration rates in a park compared with at a street site (Konarska et al., 2016). Although the asymmetric measurement setup in our study limits us from comparing the sites statistically, we observed that the Street site had the highest sap flow rate during the summer of 2021 and that the Forest site had the lowest. We speculate that the differences might be related to growing conditions, such as high soil moisture content and tree species. The sap flow rate of Tilia cordata at the Park site was lower than that of Malus spp. at the Orchard site and Tilia × europaea at the Street site, but it was higher than that of Betula pendula at the Forest site. The low sap flow rate of Betula pendula at the Forest site could be explained by the rather strong stomatal control typical of Betula pendula, i.e., it closes the stomata easily under dry conditions (Zapater et al., 2013), whereas Tilia cordata found at the Park site has less sensitive stomatal control (Leuschner et al., 2019), i.e., it keeps stomata open even during mild drought because it can tolerate drought better than Betula pendula. Other studies in the streets of Munich and Helsinki have reported variability in transpiration rates, mainly due to differences in the tree species present: in Munich, the water use of Tilia cordata Mill. was 3 times higher than water use of Robinia pseudoacacia L. (Rahman et al., 2019); in the street trees of Helsinki, Alnus glutinosa had 4 times higher tree water use than Tilia × vulgaris (Riikonen et al., 2016).
4.2 Transpiration rate and leaf gas exchange during drought and heatwave conditions
We observed varying responses of the sap flux density during heatwave and drought periods at the studied sites. At the Park, Forest, and Orchard sites, Js increased by 35 %–67 % during the heatwave compared with the no heatwave and post-heatwave periods, whereas the heatwave did not affect Js at the Street site. The pre-heatwave period did not differ from the heatwave period in terms of Js at the Park and Orchard sites, but there was a slight increase (13 %) during the heatwave period at the Forest site. Js was significantly higher during the dry period than during the wet period at all sites. The leaf gas exchanges, such as Amax, gs, and E, did not change during the heatwave period nor during the dry period, thereby indicating no change in the photosynthetic potential during these periods. Hence, we conclude that the weather was not yet severe enough to give support to our study hypotheses H1 and H2.
The VPD is the driving force of transpiration, so an increase in the VPD leads to an increase in Js unless stomata in the leaves close to limit transpiration. The VPD was a significant driver of Js during all periods and at all sites, indicating the substantial role of the VPD; however, the relative importance of the VPD over daily sap flow variation differed at the four sites and during different heatwave and drought periods. The response of sap flow to changes in VPD was less sensitive during heatwave and drought periods than during the other periods (Table 4). In theory, these results could indicate that the trees limited their water transport via stomatal control under harsh conditions. However, that was not captured by the leaf-level measurements, although these measurements may not represent the conditions over the different periods. Moreover, the leaf-level values were based on single-day measurements, which might not fully represent our study's heatwave or drought periods. Together, these results indicate that the observed increase in transpiration at the studied sites was caused by an increase in the driving force for transpiration, the VPD.
Stomatal control limits plant transpiration during drought. For example, Rötzer et al. (2021) found a substantial reduction of 63 % in the transpiration rate in urban Tilia cordata and Robinia pseudoacacia trees in the city of Würzburg, Germany, during the European drought in 2018. During the dry period of this study, the soil moisture content was notably reduced, ranging from 18 % to 62 % less compared with the wet period across all four locations. Similarly, during the heatwave period, the soil moisture content dropped significantly, ranging from 30 % to 58 % lower than the pre-heatwave period at all sites except for the Street site. The availability of soil moisture at the Street site allowed an increase in Amax and E during the heatwave period. However, the observed reductions in soil moisture did not seem to be enough to cause strong stomatal regulation of transpiration (i.e., no change in gs except for the Park site). At the Park site, the relative decrease in gs might have been due to the influence of soil moisture reduction during the dry period and also due to the isohydric behavior typical of Tilia cordata growing in the Park. Moreover, previous studies have reported that transpiration during local extreme high temperatures could be maintained when there was sufficient water availability in the soil in different urban green sites in Los Angeles, USA (Pataki et al., 2011). Similarly, previous studies have shown that the VPD is a significant driver of sap flow in Tilia × vulgaris street trees in Helsinki (Riikonen et al., 2016) and that VPD and solar radiation are significant drivers of daytime transpiration rates in seven different tree species, including Betula pendula, in Gothenburg, Sweden (Konarska et al., 2016). In agreement with our results from the Park site, Konarska et al. (2016) also found that the maximum stomatal conductance was reduced by 50 % in the studied species in Gothenburg, even though the transpiration rate remained high under dry conditions compared with wet conditions.
During the heatwave and the dry period, the VPD explained most of the variation in the daily mean Js at the Park (57 %–60 %), Street (55 %–58 %), and Orchard (62 %–69 %) sites. Similarly, previous studies in high-latitude cities have reported that the VPD correlates well with Js in street trees (adj. R2 = 0.74) in Helsinki, Finland (Riikonen et al., 2016), and in urban trees (R2 = 0.44–0.75) in Gothenburg, Sweden (Konarska et al., 2016). Moreover, in Boston, Massachusetts, the VPD has been shown to correlate with Js (R2 = 0.63; Winbourne et al., 2020). However, the VPD did not explain the daily variation in Js at the Forest site in our study. Furthermore, Js saturated after reaching certain VPD levels, especially at the Forest and Orchard sites, and the saturation began at relatively low VPD levels in the case of the Forest site. The difference in saturation levels may be species-specific or might be caused by differences in soil moisture availability, as the Orchard site had higher soil moisture than the Forest site during the heatwave and dry periods. Js in Tilia at the Park and Street sites seemed to be more linearly correlated with VPD, i.e., transpiration continued to increase with increasing VPD during the stressful periods. With a sufficient water supply from irrigation, less saturation with VPD has previously been observed in urban trees (Winbourne et al., 2020; Marchin et al., 2022). Similarly, the non-saturation of Js with high VPD values observed at the Park site may be due to irrigation during the dry period. Several previous studies on urban trees have shown that the relationship between the VPD and transpiration is species-specific, and it is more typical that the VPD increases linearly in diffuse porous trees but saturates in ring porous trees (Bush et al., 2008; Rahman et al., 2019). All of the species studied here are diffuse porous species.
In addition to the VPD, Js was also influenced by other environmental variables. The relative importance of soil moisture, soil temperature, and solar radiation with respect to influencing Js differed significantly between the four studied urban sites. The PAR was among the main environmental drivers of Js at the Park, Orchard, and Street sites, whereas PAR alone influenced Js at the Forest site (Table 5). Soil temperature was only significantly related to Js at the Street site. When the different climatic periods were analyzed separately, soil conditions (moisture and/or temperature) affected Js during heatwave (t stat = 2.3, P < 0.05) and dry (t stat = 2.1, P < 0.05) periods at the Park site but not at the Street, Forest, and Orchard sites. This can be explained by the irrigation provided at the Park site during the dry period. Overall, the VPD and PAR were the main environmental variables influencing the urban tree transpiration during hot and dry conditions, and the relative importance of these two parameters varied depending on the tree species, growing conditions, and irrigation practices.
The elevated levels of transpiration (represented by high Js) observed in the studied green areas during the heatwave indicate the presence of transpirational cooling. This phenomenon could hold substantial promise for alleviating extreme heat conditions caused by exceedingly high temperatures. Trees at the Orchard and Street sites had the highest transpiration rates, whereas trees at the Forest site had the lowest transpiration rates during the dry and heatwave periods. These differences were mainly due to varying tree species, their drought strategies (Gillner et al., 2017), and the growing conditions at the sites, particularly soil moisture availability. Lower transpiration in Betula pendula at the Forest site indicates that Betula pendula trees growing in an urban forest do not cool the environment as much as Tilia or Malus species. Several previous studies have reported that the transpirational cooling effect of urban trees during hot and dry days increases or sustains the transpiration rates to prevent excessive heat accumulation (Gillner et al., 2015; Duarte et al., 2016; Drake et al., 2018; Urban et al., 2017; Ibsen et al., 2021). Keeping the stomata open under hot and dry conditions cools down the internal leaf temperatures, enabling the maintenance of photosynthesis (De Kauwe et al., 2019; Urban et al., 2017; Drake et al., 2018). The response depends on the species' tolerance to drought and water use efficiency, microclimatic conditions, and site heterogeneity (Bussotti et al., 2014; Winbourne et al., 2020; Rennenberg et al., 2006). Specifically, Tilia cordata is known for its mildly isohydric behavior (i.e., stomatal control is not strong) during heat and drought, resulting in an associated increase in transpiration rates that causes a cooling effect under different urban conditions (Moser et al., 2017). However, Betula pendula, which typically shows isohydric behavior (i.e., strong stomatal control), also increased Js during the heatwave and dry periods in the present study. Thus, contrasting and species-specific responses of trees to heat and drought have been observed in several urban trees in previous publications (Gillner et al., 2017; Osone et al., 2014), whereas a relatively constant response was observed between the studied species in our work.
Our study was limited regarding a detailed comparison of tree species-specific responses or the effect of urban site type on the responses, as the studied tree species were different and were located on different site types. Moreover, the limited measurements of leaf gas exchange (i.e., point measurements) did not allow us to study the leaf-level water in detail during the local extreme periods. Further study capturing the effect of site conditions and tree species' behavior separately would be helpful in addressing the main factors affecting the different responses of urban vegetation during heatwaves and dry periods.
We conclude that the heat and drought conditions in Helsinki in 2021 were still not extreme enough to damage or dampen the gas exchange functioning of urban trees. Against our hypotheses, photosynthetic potential was not reduced due to lowered stomatal conductance under heatwave and drought conditions. The transpiration and photosynthetic potential during these periods remained high, suggesting stable ecosystem services such as cooling and carbon sequestration during relatively rough conditions. However, the significant role of the VPD in tree water use during heatwave and drought periods was evident in our study, although its overall significance decreased during drought periods. Our finding demonstrated that meteorological definitions of weather extremes must not necessarily directly translate into extreme biological responses and that the Nordic perspective on a heatwave is characterized by rare occurrences of air temperatures significantly lower than those seen at lower latitudes. The observed responses in tree transpiration during hot and dry periods across the four urban green areas are mainly due to the VPD, and further investigations would be needed to differentiate the role of other factors, such as growing conditions (soil water availability), tree species, and tree size, using a dedicated sampling design and more complex modeling. As urbanization and the occurrence of extreme weather events are increasing, the role of urban green areas in mitigating climate change and cooling local microclimate is becoming even more significant. Further studies on the cooling potential of urban trees will provide a better understanding of this issue, thereby supporting mitigation strategies and city planning in the future.
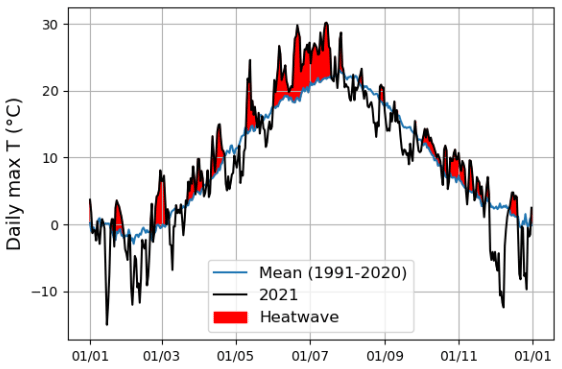
Figure A1Heatwave detection using the daily maximum air temperature of summer 2021 and the control period (1991–2020). The red color indicates the period during which the daily maximum air temperature in the summer of 2021 exceeded the control period.
Table A1The soil properties of the four urban vegetation sites. Soil samples from the top 30 cm of soil were analyzed.
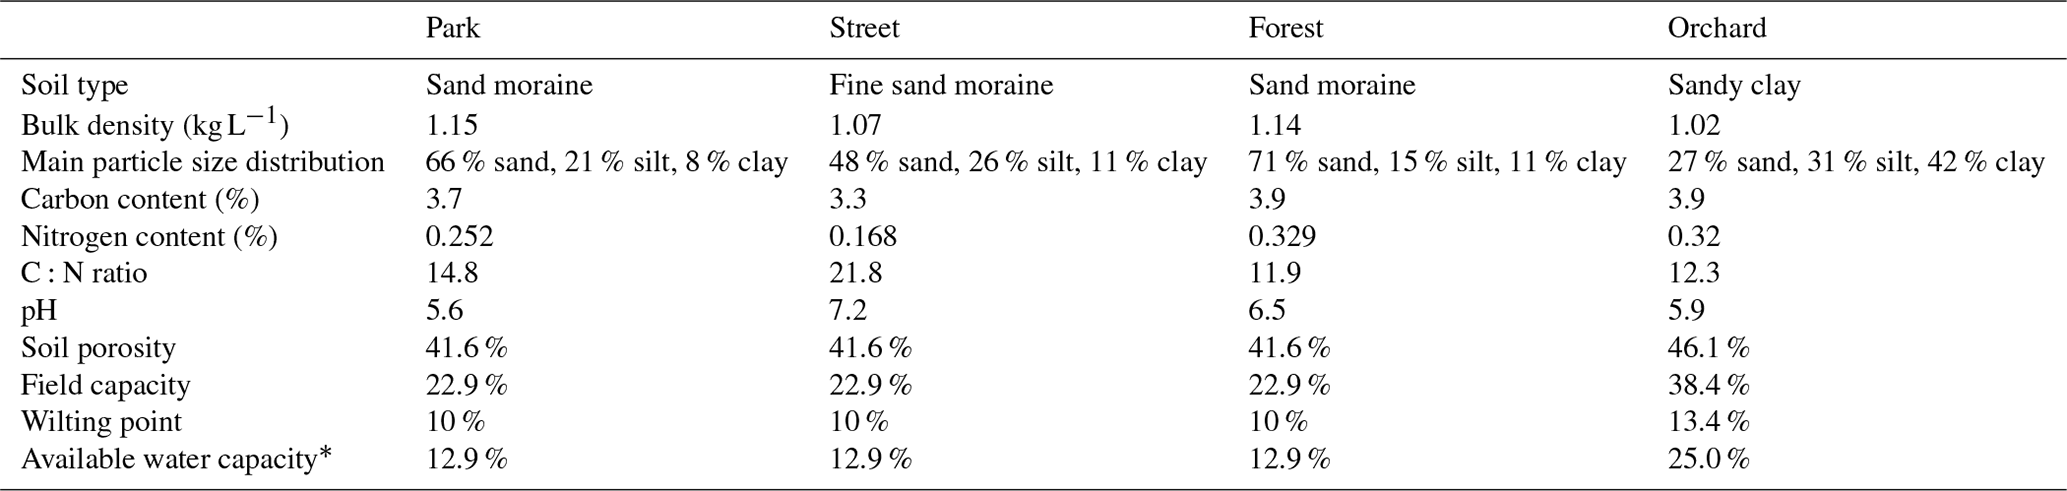
∗ Available water capacity is calculated as the field capacity minus the wilting point.
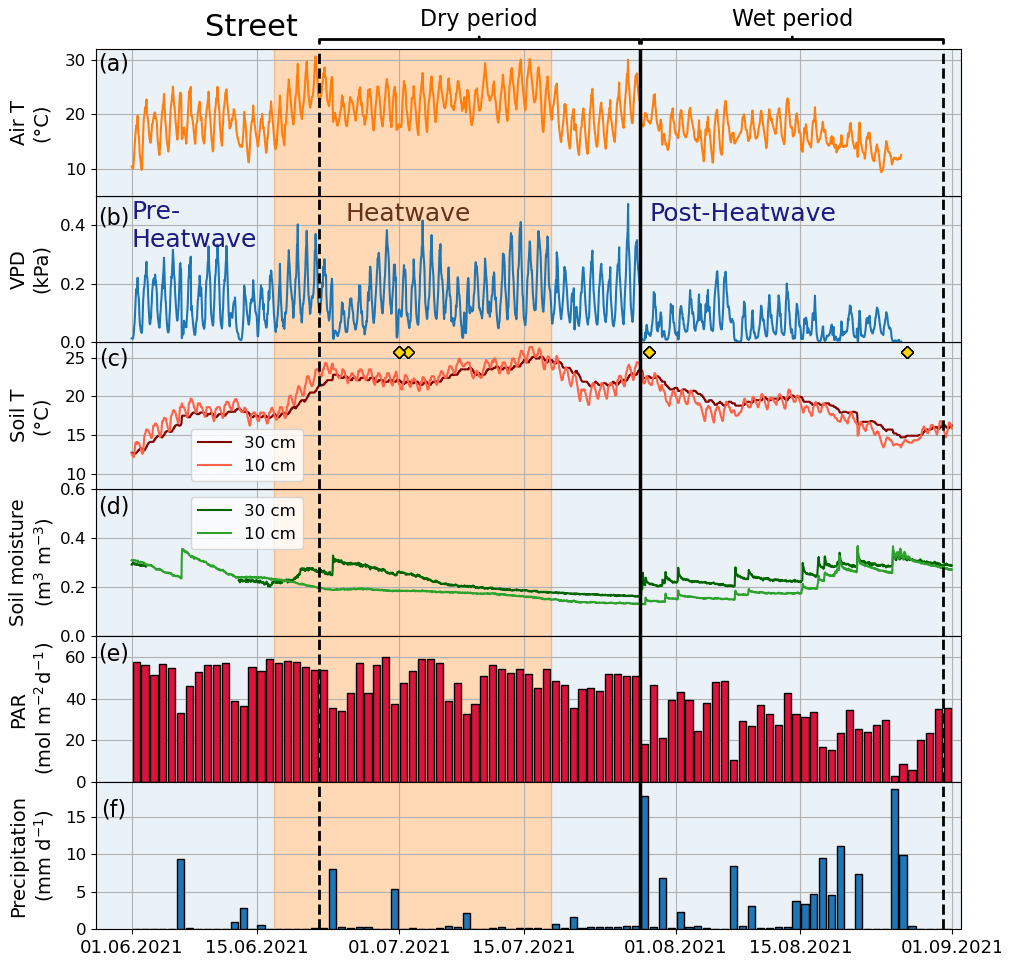
Figure A2Meteorological and soil data showing hourly (a) air temperature (Air T), (b) water vapor deficit (VPD), (c) soil temperature (Soil T), and (d) soil moisture at the Street site as well as (e) daily mean photosynthetically active radiation (PAR) and (f) daily sum precipitation data measured at the SMEAR III station. The yellow markers in panel (c) denote the dates of manual leaf gas measurements.
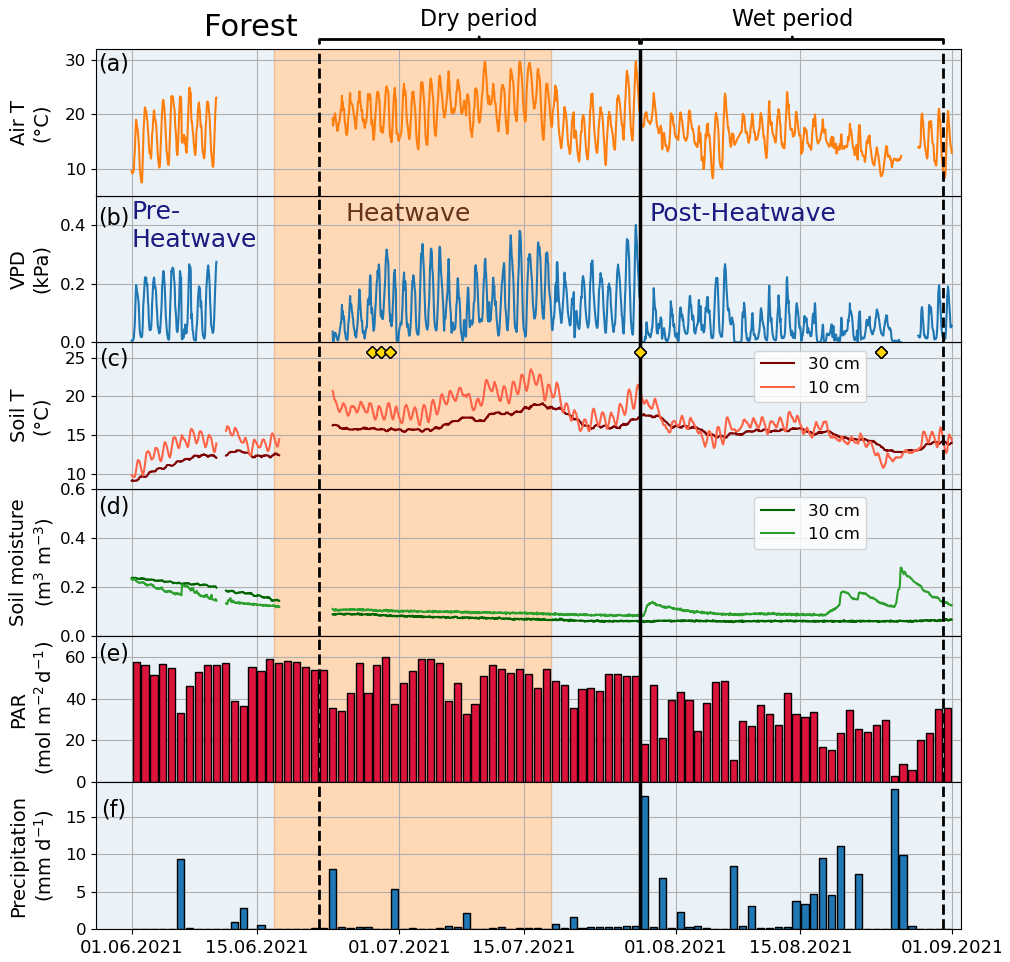
Figure A3Meteorological and soil data showing hourly (a) air temperature (Air T), (b) water vapor deficit (VPD), (c) soil temperature (Soil T), and (d) soil moisture at the Forest site as well as (e) daily mean photosynthetically active radiation (PAR) and (f) daily sum precipitation data measured at the SMEAR III station. The yellow markers in panel (c) denote the dates of manual leaf gas measurements.
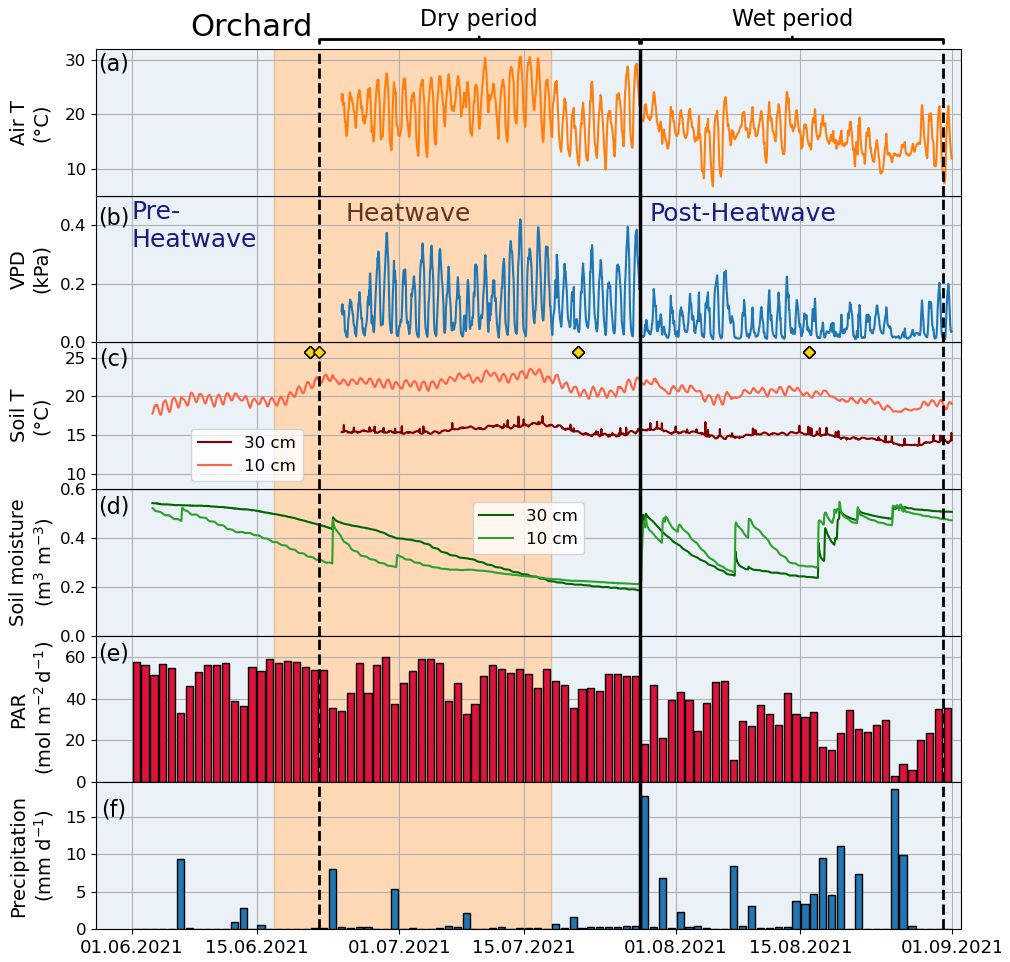
Figure A4Meteorological and soil data showing hourly (a) air temperature (Air T), (b) water vapor deficit (VPD), (c) soil temperature (Soil T), and (d) soil moisture at the Orchard site as well as (e) daily mean photosynthetically active radiation (PAR) and (f) daily sum precipitation data measured at the SMEAR III station. The yellow markers in panel (c) denote the dates of manual leaf gas measurements.
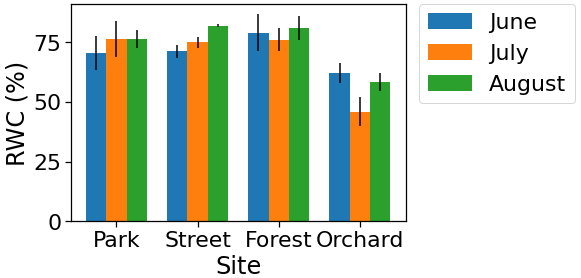
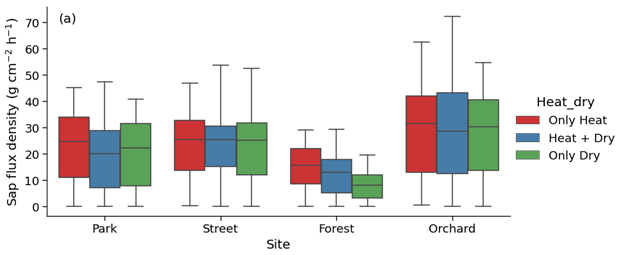
Figure A6The pattern of sap flux density during heatwave and dry period at the four urban sites.
Datasets of sap flux density, meteorological, and leaf gas exchange measurements at the four urban sites in Helsinki can be found in Ahongshangbam et al. (2023).
JA, LK, and LJ: conceptualization; JA, JS, YF, AK, EK, and EV: data collection; JA, JS, and AK: formal analysis; LK and LJ: funding acquisition; LK and LJ: supervision; JA and JS: visualization; JA: writing – original draft preparation; JA, LK, LJ, YS, AL, and EK: writing – review and editing. All authors have read and agreed to the article.
The contact author has declared that none of the authors has any competing interests.
Publisher's note: Copernicus Publications remains neutral with regard to jurisdictional claims made in the text, published maps, institutional affiliations, or any other geographical representation in this paper. While Copernicus Publications makes every effort to include appropriate place names, the final responsibility lies with the authors.
The authors wish to thank the Research Council of Finland (CarboCity projet, grant nos. 321527 and 32554), the Research Council of Finland ACCC Flagship (grant nos. 337549 and 337552), and the Strategic Research Council within the framework of the Research Council of Finland (CO-CARBON project, grant nos. 335201 and 335204). This project has also received funding from the European Union's Horizon 2020 Research and Innovation program (PAUL project, grant no. 101037319). Finally, we would like to thank Erkki Siivola, Jarkko Mäntylä, Elisa Vainio, and Teemu Paljakka for their technical support during the field measurements.
This research has been supported by the Research Council of Finland (grant nos. 321527, 325549, 335201, 335204, 337549, and 337552) and the Horizon 2020 Research and Innovation program (grant no. 10103731).
Open-access funding was provided by the Helsinki University Library.
This paper was edited by Andreas Ibrom and reviewed by Laura Benegas and one anonymous referee.
Ahongshangbam, J., Kulmala, L., and Järvi, L.: Datasets of sap flow, meteorological, leaf gas measurements in urban green areas in Helsinki, Zenodo, https://doi.org/10.5281/zenodo.7525319, 2023. a
Atkin, O. K. and Tjoelker, M. G.: Thermal acclimation and the dynamic response of plant respiration to temperature, Trends Plant Sci., 8, 343–351, https://doi.org/10.1016/S1360-1385(03)00136-5, 2003. a
Bowler, D. E., Buyung-Ali, L., Knight, T. M., and Pullin, A. S.: Urban greening to cool towns and cities: A systematic review of the empirical evidence, Landscape Urban Plan., 97, 147–155, https://doi.org/10.1016/j.landurbplan.2010.05.006, 2010. a
Brack, C. L.: Pollution mitigation and carbon sequestration by an urban forest, Environ. Pollut., 116, S195–S200, https://doi.org/10.1016/S0269-7491(01)00251-2, 2002. a
Bush, S. E., Pataki, D. E., Hultine, K. R., West, A. G., Sperry, J. S., and Ehleringer, J. R.: Wood anatomy constrains stomatal responses to atmospheric vapor pressure deficit in irrigated, urban trees, Oecologia, 156, 13–20, https://doi.org/10.1007/s00442-008-0966-5, 2008. a
Bussotti, F., Pollastrini, M., Killi, D., Ferrini, F., and Fini, A.: Ecophysiology of urban trees in a perspective of climate change., Agrochimica, 58, 247–268, https://www.cabdirect.org/cabdirect/abstract/20153144491 (last access: 4 March 2022), publisher: Università degli Studi di Pisa, 2014. a, b, c
Davies, Z. G., Edmondson, J. L., Heinemeyer, A., Leake, J. R., and Gaston, K. J.: Mapping an urban ecosystem service: quantifying above-ground carbon storage at a city-wide scale, J. Appl. Ecol., 48, 1125–1134, https://doi.org/10.1111/j.1365-2664.2011.02021.x, 2011. a
De Kauwe, M. G., Medlyn, B. E., Pitman, A. J., Drake, J. E., Ukkola, A., Griebel, A., Pendall, E., Prober, S., and Roderick, M.: Examining the evidence for decoupling between photosynthesis and transpiration during heat extremes, Biogeosciences, 16, 903–916, https://doi.org/10.5194/bg-16-903-2019, 2019. a
De Micco, V. and Aronne, G.: Morpho-Anatomical Traits for Plant Adaptation to Drought, in: Plant Responses to Drought Stress: From Morphological to Molecular Features, edited by: Aroca, R., pp. 37–61, Springer, Berlin, Heidelberg, https://doi.org/10.1007/978-3-642-32653-0_2, 2012. a
Dhakal, S.: GHG emissions from urbanization and opportunities for urban carbon mitigation, Curr. Opin. Env. Sust., 2, 277–283, https://doi.org/10.1016/j.cosust.2010.05.007, 2010. a
Drake, J., Tjoelker, M., Varhammar, A., Medlyn, B., Reich, P., Leigh, A., Pfautsch, S., Blackman, C., López, R., Aspinwall, M., Crous, K., Duursma, R., Kumarathunge, D., De Kauwe, M., Jiang, M., Nicotra, A., Tissue, D., Choat, B., Atkin, O., and Barton, C.: Trees Tolerate an Extreme Heatwave via Sustained Transpirational Cooling and Increased Leaf Thermal Tolerance, Glob. Change Biol., 24, 2390–2402, https://doi.org/10.1111/gcb.14037, 2018. a, b
Duarte, A. G., Katata, G., Hoshika, Y., Hossain, M., Kreuzwieser, J., Arneth, A., and Ruehr, N. K.: Immediate and potential long-term effects of consecutive heat waves on the photosynthetic performance and water balance in Douglas-fir, J. Plant Physiol., 205, 57–66, https://doi.org/10.1016/j.jplph.2016.08.012, 2016. a
Fischer, E. M. and Schär, C.: Consistent geographical patterns of changes in high-impact European heatwaves, Nat, Geosci,, 3, 398–403, https://doi.org/10.1038/ngeo866, 2010. a
FMI: The Finnish Meteorological Institute, https://en.ilmatieteenlaitos.fi/open-data (last access: 19 August 2021), 2021. a
Gebauer, T., Horna, V., and Leuschner, C.: Variability in radial sap flux density patterns and sapwood area among seven co-occurring temperate broad-leaved tree species, Tree Physiol., 28, 1821–1830, https://doi.org/10.1093/treephys/28.12.1821, 2008. a
Ghannoum, O. and Way, D. A.: On the role of ecological adaptation and geographic distribution in the response of trees to climate change, Tree Physiol., 31, 1273–1276, https://doi.org/10.1093/treephys/tpr115, 2011. a
Gillner, S., Vogt, J., Tharang, A., Dettmann, S., and Roloff, A.: Role of street trees in mitigating effects of heat and drought at highly sealed urban sites, Landscape Urban Plan., 143, 33–42, https://doi.org/10.1016/j.landurbplan.2015.06.005, 2015. a, b, c
Gillner, S., Korn, S., Hofmann, M., and Roloff, A.: Contrasting strategies for tree species to cope with heat and dry conditions at urban sites, Urban Ecosyst., 20, 853–865, https://doi.org/10.1007/s11252-016-0636-z, 2017. a, b
Granier, A.: Une nouvelle méthode pour la mesure du flux de sève brute dans le tronc des arbres, Ann. Sci. Forest., 42, 193–200, https://doi.org/10.1051/forest:19850204, 1985. a
Granier, A., Bréda, N., Biron, P., and Villette, S.: A lumped water balance model to evaluate duration and intensity of drought constraints in forest stands, Ecol. Model., 116, 269–283, https://doi.org/10.1016/S0304-3800(98)00205-1, 1999. a
Hagemann, S. and Stacke, T.: Impact of the soil hydrology scheme on simulated soil moisture memory, Clim. Dynam., 44, 1731–1750, https://doi.org/10.1007/s00382-014-2221-6, 2015. a
Hardiman, B. S., Wang, J. A., Hutyra, L. R., Gately, C. K., Getson, J. M., and Friedl, M. A.: Accounting for urban biogenic fluxes in regional carbon budgets, Sci. Total Environ., 592, 366–372, https://doi.org/10.1016/j.scitotenv.2017.03.028, 2017. a
Hartmann, H., Bastos, A., Das, A. J., Esquivel-Muelbert, A., Hammond, W. M., Martínez-Vilalta, J., McDowell, N. G., Powers, J. S., Pugh, T. A., Ruthrof, K. X., and Allen, C. D.: Climate Change Risks to Global Forest Health: Emergence of Unexpected Events of Elevated Tree Mortality Worldwide, Annu. Rev. Plant Biol., 73, 673–702, https://doi.org/10.1146/annurev-arplant-102820-012804, 2022. a
Havu, M., Kulmala, L., Kolari, P., Vesala, T., Riikonen, A., and Järvi, L.: Carbon sequestration potential of street tree plantings in Helsinki, Biogeosciences, 19, 2121–2143, https://doi.org/10.5194/bg-19-2121-2022, 2022. a
Hernandez-Santana, V., Hernandez-Hernandez, A., Vadeboncoeur, M. A., and Asbjornsen, H.: Scaling from single-point sap velocity measurements to stand transpiration in a multispecies deciduous forest: uncertainty sources, stand structure effect, and future scenarios, Can. J. Forest Res., 45, 1489–1497, https://doi.org/10.1139/cjfr-2015-0009, 2015. a
Ibsen, P. C., Borowy, D., Dell, T., Greydanus, H., Gupta, N., Hondula, D. M., Meixner, T., Santelmann, M. V., Shiflett, S. A., Sukop, M. C., Swan, C. M., Talal, M. L., Valencia, M., Wright, M. K., and Jenerette, G. D.: Greater aridity increases the magnitude of urban nighttime vegetation-derived air cooling, Environ. Res. Lett., 16, 034011, https://doi.org/10.1088/1748-9326/abdf8a, 2021. a
Jim, C. Y. and Chen, W. Y.: Ecosystem services and valuation of urban forests in China, Cities, 26, 187–194, https://doi.org/10.1016/j.cities.2009.03.003, 2009. a
Järvi, L., Hannuniemi, H., Hussein, T., Junninen, H., Aalto, P. P., Hillamo, R., Mäkelä, T., Keronen, P., Siivola, E., Vesala, T., and Kulmala, M.: The urban measurement station SMEAR III: Continuous monitoring of air pollution and surface–atmosphere interactions in Helsinki, Finland, Boreal Environment Research Publishing Board, https://helda.helsinki.fi/handle/10138/233627 (last access: 26 April 2022), 2009. a, b
Jo, H.-k.: Impacts of urban greenspace on offsetting carbon emissions for middle Korea, J. Environ. Manage., 64, 115–126, https://doi.org/10.1006/jema.2001.0491, 2002. a
Kjelgren, R. and Clark, J.: Microclimates and tree growth in three urban spaces, Journal of Environmental Horticulture, 10, 139–145, https://digitalcommons.usu.edu/psc_facpub/658 (last access: 25 April 2022), 1992. a
Konarska, J., Uddling, J., Holmer, B., Lutz, M., Lindberg, F., Pleijel, H., and Thorsson, S.: Transpiration of urban trees and its cooling effect in a high latitude city, Int. J. Biometeorol., 60, 159–172, https://doi.org/10.1007/s00484-015-1014-x, 2016. a, b, c, d
Kunert, N. and Tomaskova, I.: Leaf turgor loss point at full hydration for 41 native and introduced tree and shrub species from Central Europe, J. Plant Ecol., 13, 754–756, https://doi.org/10.1093/jpe/rtaa059, 2020. a
Kunert, N., Hajek, P., Hietz, P., Morris, H., Rosner, S., and Tholen, D.: Summer temperatures reach the thermal tolerance threshold of photosynthetic decline in temperate conifers, Plant Biol., 24, 1257–1261, https://doi.org/10.1111/plb.13349, 2022. a
Lauri, P. É., Gorza, O., Cochard, H., Martinez, S., Celton, J.-M., Ripetti, V., Lartaud, M., Bry, X., Trottier, C., and Costes, E.: Genetic determinism of anatomical and hydraulic traits within an apple progeny, Plant Cell Environ., 34, 1276–1290, https://doi.org/10.1111/j.1365-3040.2011.02328.x, 2011. a
Leuschner, C., Wedde, P., and Lübbe, T.: The relation between pressure–volume curve traits and stomatal regulation of water potential in five temperate broadleaf tree species, Ann. For. Sci., 76, 1–14, https://doi.org/10.1007/s13595-019-0838-7, number: 2 Publisher: BioMed Central, 2019. a, b
Leuzinger, S., Vogt, R., and Körner, C.: Tree surface temperature in an urban environment, Agr. Forest Meteorol., 150, 56–62, https://doi.org/10.1016/j.agrformet.2009.08.006, 2010. a
Lindén, J., Fonti, P., and Esper, J.: Temporal variations in microclimate cooling induced by urban trees in Mainz, Germany, Urban For. Urban Gree., 20, 198–209, https://doi.org/10.1016/j.ufug.2016.09.001, 2016. a
Liu, M., Pietzarka, U., Meyer, M., Kniesel, B., and Roloff, A.: Annual shoot length of temperate broadleaf species responses to drought, Urban For. Urban Gree., 73, 127592, https://doi.org/10.1016/j.ufug.2022.127592, 2022. a
Lloyd, J. and Farquhar, G. D.: Effects of rising temperatures and [CO2] on the physiology of tropical forest trees, Philos. T. R. Soc. B, 363, 1811–1817, https://doi.org/10.1098/rstb.2007.0032, 2008. a
Lu, P., Urban, L., and Zhao, P.: Granier's thermal dissipation probe (TDP) method for measuring sap flow in trees: theory and practice, J. Integr. Plant Biol., 46, 631–646, https://publications.csiro.au/rpr/pub?list=BRO&pid=procite:ac6fc6af-67dc-4b32-ac82-5d3c9678573a (last access: 15 March 2022), 2004. a
Marchin, R. M., Backes, D., Ossola, A., Leishman, M. R., Tjoelker, M. G., and Ellsworth, D. S.: Extreme heat increases stomatal conductance and drought-induced mortality risk in vulnerable plant species, Glob Change Biol., 28, 1133–1146, 2022. a
McCarthy, H. R. and Pataki, D. E.: Drivers of variability in water use of native and non-native urban trees in the greater Los Angeles area, Urban Ecosyst., 13, 393–414, https://doi.org/10.1007/s11252-010-0127-6, 2010. a
Moser, A., Rahman, M. A., Pretzsch, H., Pauleit, S., and Rötzer, T.: Inter- and intraannual growth patterns of urban small-leaved lime (Tilia cordata mill.) at two public squares with contrasting microclimatic conditions, Int. J. Biometeorol., 61, 1095–1107, https://doi.org/10.1007/s00484-016-1290-0, 2017. a
Muñoz-Vallés, S., Cambrollé, J., Figueroa-Luque, E., Luque, T., Niell, F. X., and Figueroa, M. E.: An approach to the evaluation and management of natural carbon sinks: From plant species to urban green systems, Urban For. Urban Gree., 12, 450–453, https://doi.org/10.1016/j.ufug.2013.06.007, 2013. a
Nielsen, C., Bühler, O., and Kristoffersen, P.: Soil Water Dynamics and Growth of Street and Park Trees, Arboriculture & Urban Forestry, 33, 231–245, https://doi.org/10.48044/jauf.2007.027, 2007. a
Nowak, D. J. and Crane, D. E.: Carbon storage and sequestration by urban trees in the USA, Environ. Pollut., 116, 381–389, https://doi.org/10.1016/S0269-7491(01)00214-7, 2002. a
Nowak, D. J., Greenfield, E. J., Hoehn, R. E., and Lapoint, E.: Carbon storage and sequestration by trees in urban and community areas of the United States, Environ. Pollut., 178, 229–236, https://doi.org/10.1016/j.envpol.2013.03.019, 2013. a
Oke, T. R., Crowther, J. M., McNaughton, K. G., Monteith, J. L., Gardiner, B., Jarvis, P. G., Monteith, J. L., Shuttleworth, W. J., and Unsworth, M. H.: The micrometeorology of the urban forest, Philos. T. Roy. Soc. B, 324, 335–349, https://doi.org/10.1098/rstb.1989.0051, 1989. a
Osone, Y., Kawarasaki, S., Ishida, A., Kikuchi, S., Shimizu, A., Yazaki, K., Aikawa, S.-I., Yamaguchi, M., Izuta, T., and Matsumoto, G. I.: Responses of gas-exchange rates and water relations to annual fluctuations of weather in three species of urban street trees, Tree Physiol., 34, 1056–1068, https://doi.org/10.1093/treephys/tpu086, 2014. a
Paloheimo, E. and Salmi, O.: Evaluating the carbon emissions of the low carbon city: A novel approach for consumer based allocation, Cities, 30, 233–239, https://doi.org/10.1016/j.cities.2012.04.003, 2013. a
Pataki, D. E., Emmi, P. C., Forster, C. B., Mills, J. I., Pardyjak, E. R., Peterson, T. R., Thompson, J. D., and Dudley-Murphy, E.: An integrated approach to improving fossil fuel emissions scenarios with urban ecosystem studies, Ecol. Complex., 6, 1–14, https://doi.org/10.1016/j.ecocom.2008.09.003, 2009. a
Pataki, D. E., McCarthy, H. R., Litvak, E., and Pincetl, S.: Transpiration of urban forests in the Los Angeles metropolitan area, Ecol. Appl., 21, 661–677, https://doi.org/10.1890/09-1717.1, _eprint: https://onlinelibrary.wiley.com/doi/pdf/10.1890/09-1717.1, 2011. a, b, c, d
Pataki, D. E., Alberti, M., Cadenasso, M. L., Felson, A. J., McDonnell, M. J., Pincetl, S., Pouyat, R. V., Setälä, H., and Whitlow, T. H.: The Benefits and Limits of Urban Tree Planting for Environmental and Human Health, Front. Ecol. Evol., 9, 603757, https://www.frontiersin.org/article/10.3389/fevo.2021.603757 (last access: 15 March 2022), 2021. a
Perini, K. and Magliocco, A.: Effects of vegetation, urban density, building height, and atmospheric conditions on local temperatures and thermal comfort, Urban For. Urban Gree., 13, 495–506, https://doi.org/10.1016/j.ufug.2014.03.003, 2014. a
Rahman, M. A., Moser, A., Rötzer, T., and Pauleit, S.: Comparing the transpirational and shading effects of two contrasting urban tree species, Urban Ecosyst., 22, 683–697, https://doi.org/10.1007/s11252-019-00853-x, 2019. a, b, c
Rennenberg, H., Loreto, F., Polle, A., Brilli, F., Fares, S., Beniwal, R. S., and Gessler, A.: Physiological responses of forest trees to heat and drought, Plant Biol., 8, 556–571, https://doi.org/10.1055/s-2006-924084, 2006. a
Riikonen, A., Järvi, L., and Nikinmaa, E.: Environmental and crown related factors affecting street tree transpiration in Helsinki, Finland, Urban Ecosyst., 19, 1693–1715, https://doi.org/10.1007/s11252-016-0561-1, 2016. a, b, c, d
Roth, M., Oke, T. R., and Emery, W. J.: Satellite-derived urban heat islands from three coastal cities and the utilization of such data in urban climatology, Int. J. Remote Sens., 10, 1699–1720, https://doi.org/10.1080/01431168908904002, 1989. a
Rötzer, T., Moser-Reischl, A., Rahman, M. A., Hartmann, C., Paeth, H., Pauleit, S., and Pretzsch, H.: Urban tree growth and ecosystem services under extreme drought, Agr. Forest Meteorol., 308–309, 108532, https://doi.org/10.1016/j.agrformet.2021.108532, 2021. a, b
RStudio Team: RStudio Integrated Development Environment for R, RStudio, PBC., Boston, MA, http://www.rstudio.com (last access: 15 February 2022), 2020. a
Schwaab, J., Meier, R., Mussetti, G., Seneviratne, S., Bürgi, C., and Davin, E. L.: The role of urban trees in reducing land surface temperatures in European cities, Nat. Commun., 12, 6763, https://doi.org/10.1038/s41467-021-26768-w, number: 1 Publisher: Nature Publishing Group, 2021. a
Sjöman, H., Östberg, J., and Bühler, O.: Diversity and distribution of the urban tree population in ten major Nordic cities, Urban For. Urban Gree., 11, 31–39, https://doi.org/10.1016/j.ufug.2011.09.004, 2012. a
StromJan: StromJan/Raster4H: Final version, Zenodo, https://doi.org/10.5281/zenodo.4005833, 2020. a
Sushko, S., Yaroslavtsev, A., Tsuvareva, N., and Valentini, R.: Capacity of Quercus robur L. and Tilia cordata Mill. trees in providing urban ecosystem services in boreal climate, pp. EGU21–7125, https://doi.org/10.5194/egusphere-egu21-7125, the 23rd EGU General Assembly, held online 19–30 April, 2021, EGU General Assembly Conference Abstracts ADS Bibcode: 2021EGUGA..23.7125S, 2021. a
Urban, J., Ingwers, M. W., McGuire, M. A., and Teskey, R. O.: Increase in leaf temperature opens stomata and decouples net photosynthesis from stomatal conductance in Pinus taeda and Populus deltoides x nigra, J. Exp. Bot., 68, 1757–1767, https://doi.org/10.1093/jxb/erx052, 2017. a, b
Vesala, T., Järvi, L., Launiainen, S., Sogachev, A., Rannik, Ü., Mammarella, I., Ivola, E. S., Keronen, P., Rinne, J., Riikonen, A., and Nikinmaa, E.: Surface–atmosphere interactions over complex urban terrain in Helsinki, Finland, Tellus B, 60, 188–199, https://doi.org/10.1111/j.1600-0889.2007.00312.x, 2008. a, b
Vicente-Serrano, S. M., Beguería, S., and López-Moreno, J. I.: A Multiscalar Drought Index Sensitive to Global Warming: The Standardized Precipitation Evapotranspiration Index, J. Climate, 23, 1696–1718, https://doi.org/10.1175/2009JCLI2909.1, 2010. a
Villar-Salvador, P., Planelles, R., Oliet, J., Peñuelas-Rubira, J. L., Jacobs, D. F., and González, M.: Drought tolerance and transplanting performance of holm oak (Quercus ilex) seedlings after drought hardening in the nursery, Tree Physiol., 24, 1147–1155, https://doi.org/10.1093/treephys/24.10.1147, 2004. a
Winbourne, J. B., Jones, T. S., Garvey, S. M., Harrison, J. L., Wang, L., Li, D., Templer, P. H., and Hutyra, L. R.: Tree Transpiration and Urban Temperatures: Current Understanding, Implications, and Future Research Directions, BioScience, 70, 576–588, https://doi.org/10.1093/biosci/biaa055, 2020. a, b, c, d, e
Zapater, M., Bréda, N., Bonal, D., Pardonnet, S., and Granier, A.: Differential response to soil drought among co-occurring broad-leaved tree species growing in a 15- to 25-year-old mixed stand, Ann. For. Sci., 70, 31–39, https://doi.org/10.1007/s13595-012-0233-0, 2013. a, b