the Creative Commons Attribution 4.0 License.
the Creative Commons Attribution 4.0 License.
 | 17 Nov 2023
Leaf carbon and nitrogen stoichiometric variation along environmental gradients
Huiying Xu
Han Wang
Iain Colin Prentice
Sandy P. Harrison
Leaf stoichiometric traits are central to ecosystem function and biogeochemical cycling, yet no accepted theory predicts their variation along environmental gradients. Using data in the China Plant Trait Database version 2, we aimed to characterize variation in leaf carbon and nitrogen per unit mass (Cmass, Nmass) and their ratio and to test an eco-evolutionary optimality model for Nmass. Community-mean trait values were related to climate variables by multiple linear regression. Climatic optima and tolerances of major genera were estimated; Pagel's λ was used to quantify phylogenetic controls, and Bayesian phylogenetic linear mixed models to assess the contributions of climate, species identity, and phylogeny. Optimality-based predictions of community-mean Nmass were compared to observed values. All traits showed strong phylogenetic signals. Climate explained only 18 % of C:N ratio variation among species but 45 % among communities, highlighting the role of taxonomic replacement in mediating community-level responses. Geographic distributions of deciduous taxa were separated primarily by moisture and evergreens by temperature. Cmass increased with irradiance but decreased with moisture and temperature. Nmass declined with all three variables. C:N ratio variations were dominated by Nmass. The coefficients relating Nmass to the ratio of maximum carboxylation capacity at 25 ∘C (Vcmax25) and leaf mass per area (Ma) were influenced by leaf area index. The optimality model captured 68 % and 53 % of variation between communities for Vcmax25 and Ma, respectively, and 21 % for Nmass. We conclude that stoichiometric variations along climate gradients are achieved largely by environmental selection among species and clades with different intraspecific trait values. Variations in leaf C:N ratio are mainly determined by Nmass, and optimality-based modelling shows useful predictive ability for community-mean Nmass. These findings should help to improve the representation of C:N coupling in ecosystem models.
- Article
(7348 KB) - Full-text XML
-
Supplement
(2261 KB) - BibTeX
- EndNote


Nitrogen (N) has long been recognized as a key nutrient that influences photosynthesis, plant biomass, and carbon (C) allocation and therefore the terrestrial C cycle (Fernández-Martínez et al., 2014; Terrer et al., 2019). Many land surface models (LSMs) have recently incorporated representations of coupled C and N cycling, the intention being to increase the realism of model predictions of C cycling under climate change (Wiltshire et al., 2021). The leaf C:N ratio plays an essential role in this coupling; however it is often assigned a constant value per plant functional type (PFT), due to the lack of data and/or theory that would predict more realistic, continuous stoichiometric variation along environmental gradients (Meyerholt et al., 2020). One aspect of model uncertainty could be reduced if such variation were better understood and quantified (Boonman et al., 2020; Niu et al., 2023).
Many studies on leaf C and N along climate gradients have been carried out, but there is still no consensus on the major controls of such leaf traits at individual and community levels, hindering our understanding of trait–environment relationships (Anderegg, 2023). There is evidence for leaf stoichiometry being affected by many factors, including species identity, phylogeny, climate, and soil properties (Elser et al., 2010; Ma et al., 2018; Tang et al., 2018; Yang et al., 2016). The demonstrated roles of species identity and phylogeny indicate that leaf C and N contents (Cmass, Nmass) and their ratios are phylogenetically conservative (Sardans and Penuelas, 2014; Vallicrosa et al., 2021; Zhang et al., 2012). Differences among life forms and vegetation types have also been widely noted (Ma et al., 2018; Tang et al., 2018). On the other hand, few studies have examined the differences between evergreen and deciduous leaves, which are expected to diverge as they represent alternative life-history strategies, expressed in different responses of leaf mass per area (Ma) to climate (Kikuzawa et al., 2013; Wang et al., 2023). The patterns of stoichiometric response to environment remain inconsistent across studies. A potential contributory problem is their reliance on annual average climate variables, such as mean annual temperature – which does not accurately reflect actual growing-season conditions, especially in regions with cold winters (Körner, 2021) – and mean annual precipitation, which is generally not a good metric for plant-available moisture because it does not take account of the large variations in potential evapotranspiration (driven by solar radiation and temperature) across the world.
Many land surface models (LSMs) treat leaf C:N ratios as fixed parameters for PFTs (Boonman et al., 2020; Zaehle et al., 2014); some allow the C:N ratio to vary, within a prescribed range, based on C and N allocation to different tissues (Ghimire et al., 2016; Meyerholt and Zaehle, 2015; Smith et al., 2014; Wang et al., 2010). But the fixed-PFT schemes fail to capture the observed range of leaf stoichiometry within each PFT, while the dynamic schemes have not been extensively tested against observations. Responses of N use efficiency and net primary production (NPP) to elevated CO2 vary considerably among models and are not always realistic (Zaehle et al., 2014). Here eco-evolutionary optimality (EEO) principles may help by providing a route towards testable, general trait predictions (Caldararu et al., 2020; Dong et al., 2022; Harrison et al., 2021; Xu et al., 2021). Caldararu et al. (2020) applied an optimality-based approach (maximizing carbon export and growth) to improve leaf Nmass prediction, but this analysis did not consider the large and potentially confounding effect of Ma variation with environment (Wang et al., 2023). We infer that there is still a need to investigate the eco-evolutionary basis of leaf C:N ratio variations and to reconsider how they are treated in LSMs (Sistla and Schimel, 2012).
In this study, we applied EEO principles to predict Nmass from a trait-correlation perspective. We assumed that the metabolic and structural components of leaf N are proportional to carboxylation capacity (Vcmax25, at a reference temperature of 25 ∘C) and Ma, respectively. The coordination hypothesis provides predictions of Vcmax25: it is assumed that the light- and RuBisCO-limited assimilation rates under daytime conditions tend to equality, thus minimizing both maintenance respiration and the metabolic component of leaf N (Chen et al., 1993). An EEO-based hypothesis for the leaf economics spectrum provides predictions of Ma: it is assumed that the average net carbon gain by a leaf during its life cycle is maximized. The sum of the N in metabolic and structural components then determines the optimal leaf N content (Nmass). We set out (1) to analyse the contributions of climate, species identity, and phylogeny to leaf Cmass, Nmass, and their ratio; (2) to characterize geographic patterns in these traits along environmental gradients; and (3) to test the extent to which variation in Nmass among communities could be captured by the EEO principles outlined above. Using a data set comprising 1705 samples at 79 sites throughout China, we quantified the phylogenetic signal in species' traits and fitted a Bayesian mixed-effects model to partition individual trait variation into effects of climate, species identity, and phylogeny. We examined trait relationships with bioclimate variables (which improve on annual mean quantities by accounting for seasonality and latitude) and gridded data on soil C:N ratios by multiple regression.
2.1 Trait and environmental data
Our analyses are based on trait data in the China Plant Trait Database version 2 (CPTDv2, Wang et al., 2022). The CPTDv2 contains morphometric, chemical, and photosynthetic leaf trait data on 1529 species at 140 sites representing the different biomes in China as well as climate information for each site. In CPTDv2, a stratified sampling strategy was consistently used at each site to ensure that the dominant species in each canopy layer were sampled (detailed in Wang et al., 2018) and to avoid bias from different sampling strategies. A total of 25 trees, 5 shrubs, 5 lianas or vines, and 5 understorey species (grasses and/or forbs) were sampled at each site. When the number of trees was less than 25 at a site, all the tree species were sampled and additional samples from the other life forms were supplemented up to a maximum of 40 species. Thus, the species sampled at each site can be regarded as a representative sample of the plant community and average trait values at each site. We extracted leaf carbon concentration (Cmass, %), nitrogen concentration (Nmass, %), leaf mass per area (Ma, g biomass m−2), stable carbon isotope ratios (δ13C, ‰) and Vcmax25 (µmol C m−2 s−1) data from the CPTDv2. Although Ma data are available from 124 sites, Cmass, Nmass, and δ13C data are only available at 79 (Cmass, Nmass) and 74 sites (δ13C). However, these sites are well distributed across the temperature and aridity gradients (Supplement Fig. S1). Although Vcmax25 data are available only at 32 sites from southwestern and northeastern China and along an elevational transect in the Gongga Mountains, there are 960 measurements from these sites.
Xu et al. (2021) and Wang et al. (2018) provided full details of the species sampled and trait measurements made at each site. Ma was estimated from measurements of leaf area and dry weight following standard protocols (Cornelissen et al., 2003). Leaf area was taken as the projected area of a randomly selected leaf, or leaflet for compound leaves, using a LiDE 220 Scanner (Canon Inc., Huntington, NY, USA). The dry weight was measured after oven-drying at 75 ∘C for 72 h to constant weight. The average of three measurements made on leaves from different individuals was taken as the Ma value of one species at each site. We used a portable infrared gas analyser system (LI-6400; LI-COR Inc., Lincoln, NE, USA) to make leaf-gas-exchange measurements in the field. Terminal branches from the outer canopy were collected and re-cut under water immediately prior to measurement. The relative humidity and chamber block temperature were set close to that of the ambient environment at the time of measurement with a constant airflow rate (500 µmol s−1). Vcmax was calculated from the light-saturated rate of CO2 fixation at ambient CO2 using the one-point method (De Kauwe et al., 2016) and adjusted to a standard temperature of 25 ∘C with the Arrhenius equation (Bernacchi et al., 2001). Due to the time-consuming measurement of leaf-gas exchange, the photosynthetic traits of one sample were measured for each species. For each species at a site, leaf C content, N content, and δ13C were measured using pooled samples of leaves from at least three individuals of the same species with an isotope ratio mass spectrometer (Thermo Fisher Scientific Inc., Carlsbad, CA, USA). Carbon isotope ratios were used to calculate isotopic discrimination (Δ) and then to estimate the ratio of leaf-internal to ambient CO2 partial pressure (χ) using the method of Cornwell et al. (2018) with a standard formula using the recommended values of a′ and b′ of 4.4 ‰ and 27 ‰, respectively (Cernusak et al., 2013; Farquhar et al., 1989):
The bioclimate variables available for each site include an annual plant-available moisture index (αp, an estimate of the ratio of annual actual evapotranspiration to potential evapotranspiration), the mean temperature of the coldest month (MTCO, ∘C), the mean temperature during the thermal growing season, defined as the period with temperatures above 0 ∘C (mGDD0, ∘C), and the leaf-area-index-(LAI-)weighted photosynthetic photon flux density (Iabs, mol m−2 s−1) during the thermal growing season. The climate variables were interpolated to each site from 1814 weather stations in China using ANUSPLIN (Hutchinson and Xu, 2013). The LAI during the sampled month and year for each site from both data sets was extracted from the MODIS LAI product (MCD15A3H: https://modis.gsfc.nasa.gov/, last access: 3 February 2022) to provide a measure of canopy cover. We used the C:N ratio in topsoil (0–30 cm) extracted from the gridded soil data set of Shangguan et al. (2013) as an inverse index of soil fertility.
2.2 Trait prediction
The maximum capacity of carboxylation (Vcmax) was predicted using an EEO model based on the coordination hypothesis (Eq. 2), which states that plants coordinate RuBisCO-limited and light-limited photosynthesis rates to be equal under daytime conditions so that the available light is used without incurring futile maintenance costs (Prentice et al., 2014; Wang et al., 2017):
where φ0 is the intrinsic quantum efficiency of photosynthesis (µmol C µmol−1 photon), which can be estimated for C3 plants using Eq. (3) (Bernacchi et al., 2003); ca is the ambient partial pressure of CO2 (Pa); χ is the ratio of leaf-internal to ambient CO2 partial pressure (Pa Pa−1); K is the effective Michaelis–Menten coefficient of RuBisCO (Pa); Γ∗ is the photorespiratory compensation point (Pa); and T is temperature (∘C). We used mGDD0 as the temperature input.
Ma was predicted using an eco-evolutionary optimality model that predicts the relationship between Ma and leaf longevity, based on the assumption that leaves maximize net carbon gain during their life cycle (Wang et al., 2023). The predicted environmental effects on Ma differ between evergreen and deciduous species:
where Ma,de and Ma,ev are the predicted Ma for deciduous and evergreen species, respectively, and f is the ratio of thermal growing-season length (days) to the number of days in the year.
Dong et al. (2017) proposed a model for Narea as the sum of components proportional to Ma and Vcmax25. A simple manipulation of this model gives:
where a (g N g biomass−1) and b (g N s µmol C−1) are empirical coefficients fitted across all species. To test whether nitrogen allocation varied within the canopy (Charles-Edwards et al., 1987), the random effect of binned LAI on the intercept (a) and slope (b) was tested using a mixed-effects model. The fitted values of a and b can be found in Supplement Table S1.
The C:N ratio was estimated as the ratio of predicted Cmass from Eq. (7) and Nmass from Eq. (6) (Fig. 6). We also calculated C:N ratios using observed Cmass and predicted Nmass (Fig. 7a) to check whether Cmass values influence the prediction of C:N ratios. Due to the lack of an existing theoretical basis to predict Cmass, we fitted the following linear regression using all observed trait data and three climate variables:
2.3 Data analysis
Statistical analyses were carried out in R4.1.1 (R Core Team, 2021). The relative importance of Cmass and Nmass in controlling the leaf C:N ratio was evaluated using the relaimpo package (Groemping, 2006). Within- and between-site variability in traits was measured by the standard deviation (SD). Bioclimatic effects on leaf stoichiometry at the community level (i.e. with unweighted community-mean values as the data points) were examined using standard multiple (fixed-effects) linear regression (lm), and partial effects of each climate variable were visualized using visreg (Breheny and Burchett, 2017). To account for the potential effect of spatial processes on trait variation, we performed multiple regression on distance matrices (MRM) to separate the spatial and bioclimatic effects using the ecodist package (Lichstein, 2006). Phylogenetic analyses were carried out on all species (including 561 genera in 175 families and 57 orders). The phylogenetic trees were constructed and coloured with species-averaged trait values using the S.PhyloMaker and ggtree packages (Qian and Jin, 2016; Yu et al., 2017). Phylogenetic signal was calculated for each trait, using Pagel's λ, which measures the extent to which related species tend to have similar trait values. Pagel's λ varies from 0 to 1, indicating a low to high phylogenetic signal. It was calculated using the phytools package (Münkemüller et al., 2012; Revell, 2012). The significant values obtained indicate that values of these traits tend to be conserved within lineages. A Bayesian phylogenetic linear mixed model was applied at the species level (i.e. each occurrence of each species was treated as a data point), with species identity and phylogeny as random effects, using the MCMCglmm package (Hadfield, 2010). The model was repeated using three different phylogenetic hypotheses to account for the uncertainty in phylogenetic trees generated in these scenarios. Marginal (climate effects alone as fixed effects, without random effects) and conditional r2 (with species and phylogeny as random effects) were compared (Nakagawa et al., 2017; Nakagawa and Schielzeth, 2013). The phylogenetic comparative method, which implicitly attributes overlapping effects of phylogeny and climate entirely to phylogeny (Westoby et al., 1995), was used to estimate trait variations explained by climate alone using the ape package (Paradis et al., 2004).
The temperature and moisture optima and tolerances of frequently occurring genera were calculated as follows (Meng et al., 2015). Each bioclimatic variable was binned and the mean abundance was calculated for the sites within each bin. The frequency distributions of abundance for each species and bioclimatic variable were obtained by selecting widths of the bins. The optimum was estimated as the average of the bioclimatic variable in the bins where a species was present, weighted by its mean abundance in the bins. Similarly, the tolerance was estimated as the abundance-weighted standard deviation of the bioclimatic variable. Frequently occurring species were defined as those that occurred more than 25 times for deciduous and more than 10 times for evergreen species.
We used trait-gradient analysis to access the intraspecific variation along the environmental gradient (Ackerly and Cornwell, 2007). The individual trait values were plotted against community-mean trait values which were strongly determined by external filters at a large scale, such as abiotic factors. By definition, the slope of the relationship between individual and community-mean trait values is unity. To characterize the plasticity (here including both genetic and phenotypic variation) of one species, the regression of individual trait values among one species against community-mean values represents its within-species ability to shift along the environmental gradient. The steep slope indicates plastic species and a large contribution of intraspecific trait variation to the overall trait gradient. Species that were measured at more than five sites were selected to estimate the slope.
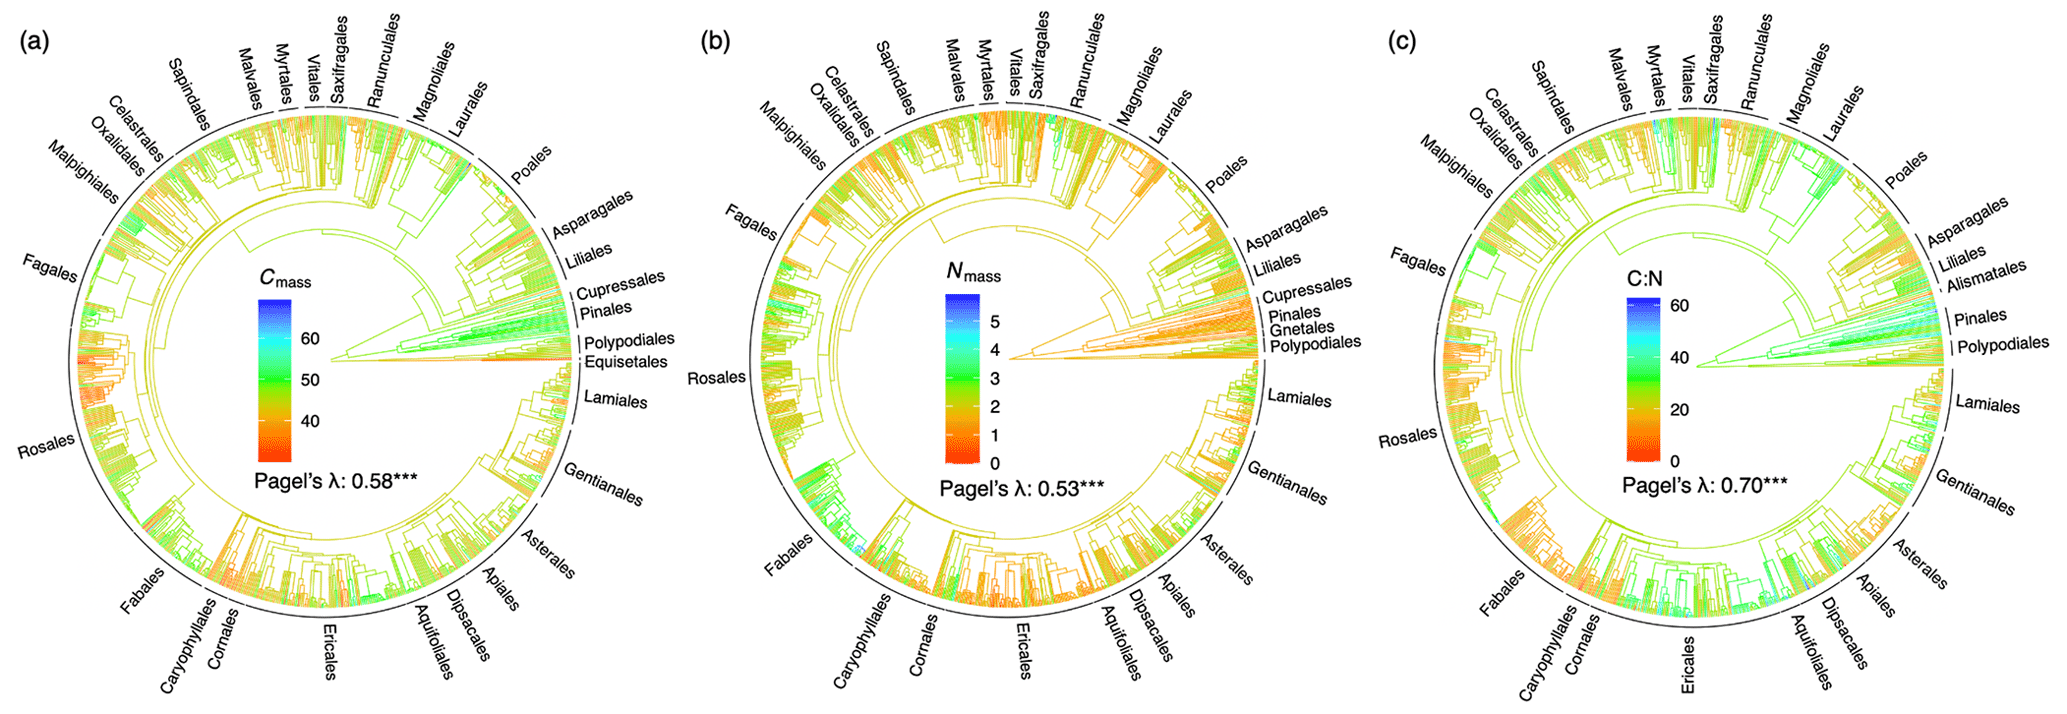
Figure 1Phylogenetic tree and signal for (a) leaf carbon content (%), (b) nitrogen content (%), and (c) carbon-to-nitrogen ratio. The red-to-blue colours of phylogenetic trees indicate low to high trait values. The phylogenetic signal is indicated by a statistic metric of Pagel's λ with its significance level ( p<0.001). Orders with more than five species in the data set are labelled.
3.1 Roles of phylogeny and species in stoichiometric variation
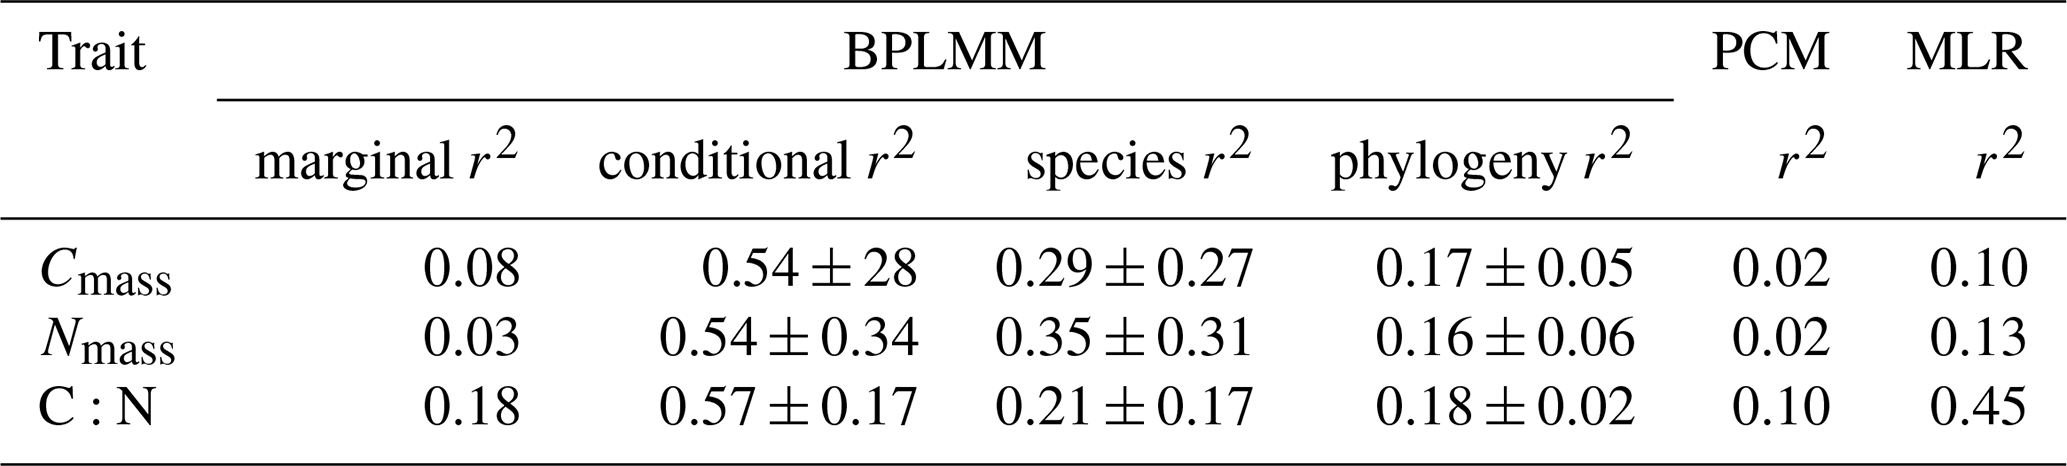
In general, related species tended to have similar stoichiometric traits; Pagel's λ was significant for all traits (Fig. 1). The mixed model produced higher conditional r2 values when species and phylogeny were included as random effects, with species contributing 21 %–35 % and phylogeny contributing 16 %–18 % on average (Table 1). No significant relationships were found between leaf stoichiometric traits and the soil C:N ratio (Supplement Fig. S2).
Table 1Regression models for each trait. The multiple linear regression (MLR) model was fitted at the community level, using only climate predictors. The Bayesian phylogenetic linear mixed model (BPLMM) was fitted at the species level. The marginal r2 includes climate effects only; the conditional r2 also includes species identity and phylogeny as random effects. The phylogenetic comparative method (PCM), also fitted at the species level, quantifies the variation attributed to climate alone, after factoring out effects of phylogenetic relatedness. The standard deviations of r2 in BPLMM come from three different scenarios of phylogeny.
These findings are consistent with species turnover (taxonomic replacement) being a principal mechanism accounting for the observed trends in stoichiometry along environmental gradients. Figure 2 illustrates the turnover of major woody genera along the climatic gradients. The deciduous genera covered a wide range in moisture (αp from 0.2 to 1) and light (Iabs from 7 to 16 mol m−2 s−1) but showed limited temperature tolerance ranges (Fig. 2a). Conversely, evergreen genera occupied a wide range on the temperature axis (from 6 to 21 ∘C) but occurred only in wetter areas with αp>0.6 (Fig. 2b). Growing-season (mGDD0) and coldest-month (MTCO) temperatures were positively correlated (not shown). The distribution of deciduous genera along the MTCO axis was similar to their distribution along the mGDD0 axis (Fig. 2c), whereas evergreen genera were more separated on the mGDD0 gradient than by MTCO – with the exception of Pinus, which showed a wide cold-tolerance range from around −30 to 0 ∘C (Fig. 2d).
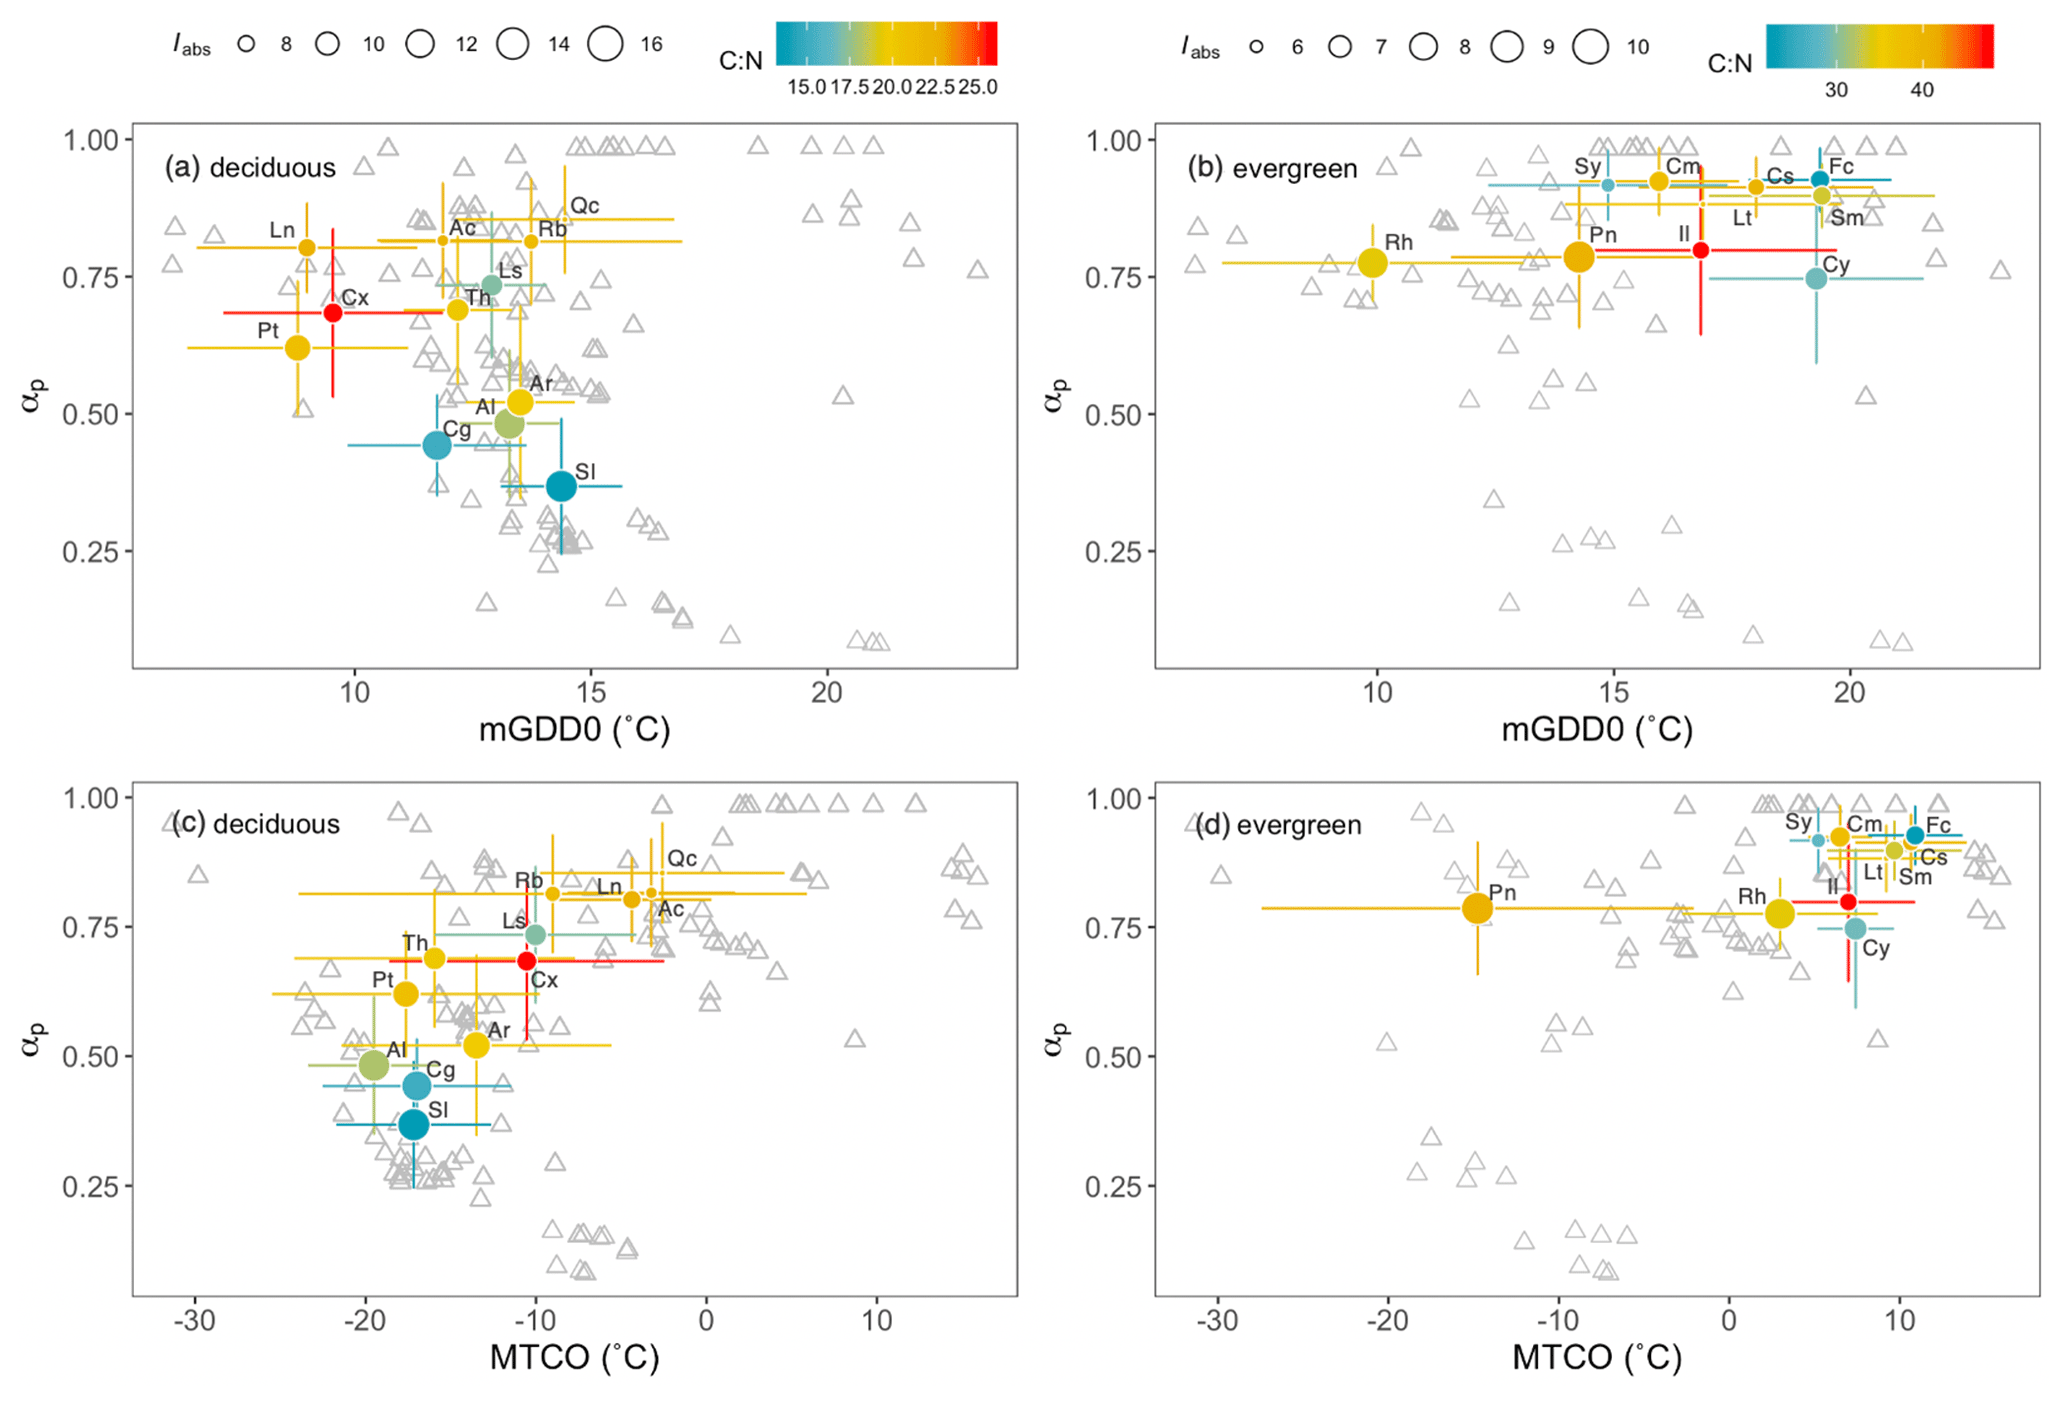
Figure 2Optima and tolerances of major genera in climate space. αp is a moisture index, mGDD0 is the mean temperature during the thermal growing season, MTCO is the mean temperature of the coldest month, and Iabs is the leaf-area-index-weighted photosynthetic photon flux density. Colours of circles represent the values of the leaf C:N ratio and the sizes of circles represent Iabs. The grey triangles are sampling sites. Also shown are abbreviated names of genera: Ac, Acer; Al, Allium; Ar, Artemisia; Cg, Caragana; Cx, Carex; Ls, Lespedeza; Ln, Lonicera; Pt, Potentilla; Qc, Quercus; Rb, Rubus; Sl, Salsola; Th, Thalictrum; Cm, Camellia; Cs, Castanopsis; Cy, Cyclobalanopsis; Fc, Ficus; Il, Ilex; Lt, Lithocarpus; Pn, Pinus; Rh, Rhododendron; Sm, Smilax; Sy, Symplocos.
Trait-gradient analysis showed that in addition to species turnover, intraspecific trait variation played a role in determining trait shifts at a regional scale (Fig. 3). The intraspecific slopes for Cmass, Nmass, and their ratio were calculated for 19, 19, and 42 species, respectively. Only 9, 8, and 16 of these species showed significant slopes. The intraspecific slopes for Nmass and C:N ratio ranged from 0.7 to 2.1 and 0.6 to 1.9, respectively. The slopes for Cmass ranged from 0.8 to 1.4 except for one species (Asparagus dauricus) that had a negative slope.
3.2 Leaf stoichiometric trait responses to climate
At the community level, climatic variables explained 10 %, 13 %, and 45 % of variation in Cmass, Nmass, and C:N ratio, respectively. At the species level, climatic variables explained 8 %, 3 %, and 18 % according to the mixed model. Smaller amounts of variation (2 %, 2 %, and 10 %) were captured by climate according to the phylogenetic comparative method (Table 1). MRM analysis also showed that trait variations were strongly explained by climatic factors but not significantly related to geographic distance – indicating that the purely spatial effect on trait values was weak (Supplement Table S2).
Stoichiometric trait responses to climate were generally similar in deciduous and evergreen species (Fig. 4). Cmass was significantly positively related to light and negatively related to moisture and growing-season temperature in both deciduous and evergreen species (Fig. 4a–c). Nmass significantly decreased with increasing light and moisture in both deciduous and evergreen species. Nmass also decreased with temperature in deciduous species but showed no significant relationship with temperature in evergreen species (Fig. 4d–f). The response of the leaf C:N ratio to climate was a combination of the Cmass and Nmass responses but was dominated by climate effects on Nmass. The leaf C:N ratio was positively related to light and moisture in both deciduous and evergreen species. It was also positively related to temperature for deciduous species but marginally negatively related to temperature for evergreen species (Fig. 4g–i).
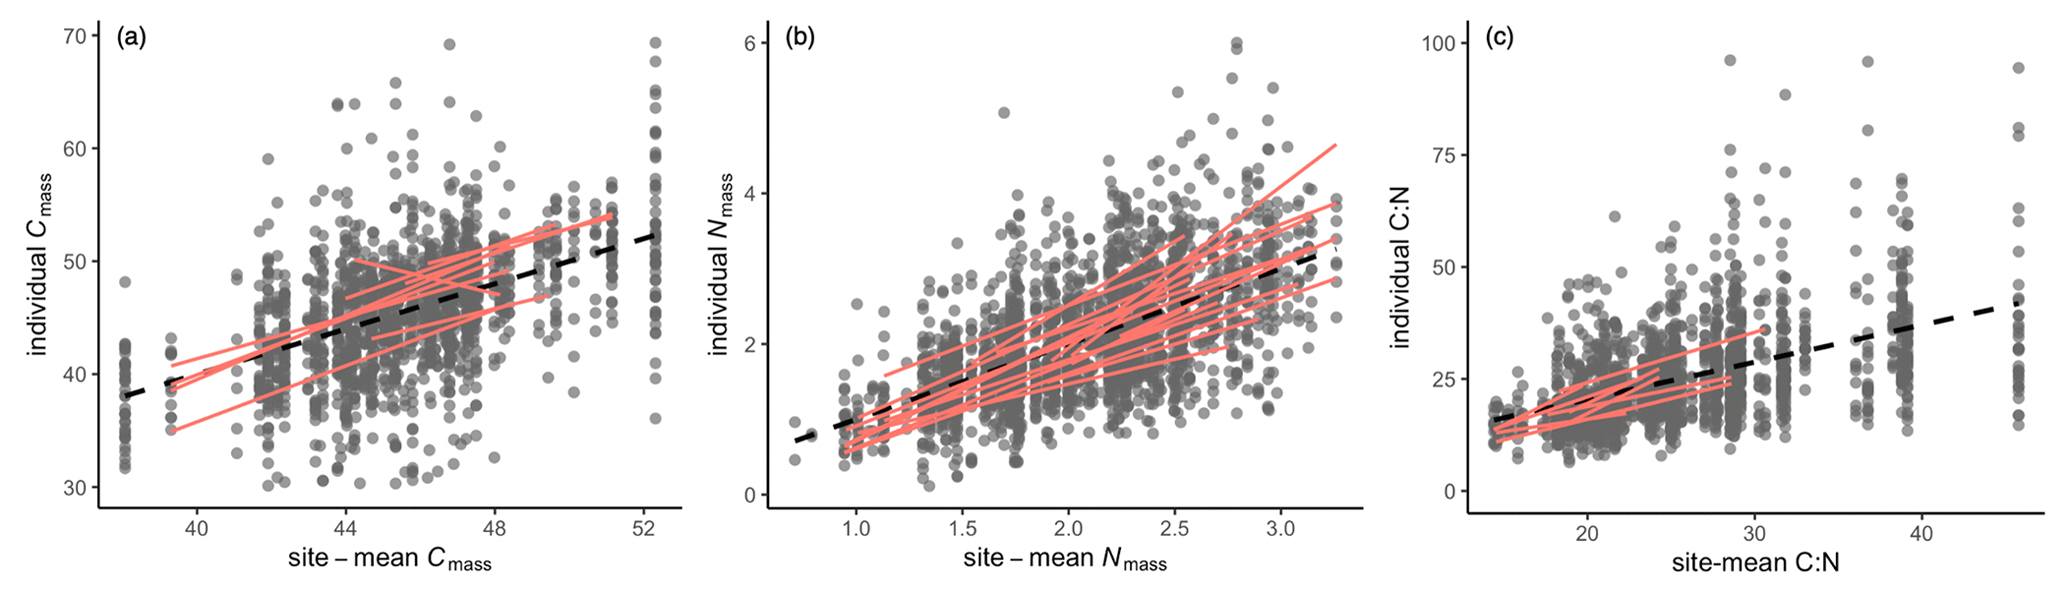
Figure 3Distribution of site-mean trait values and within-species regression lines for leaf stoichiometric traits. The black dots are individuals, and black dashed line is the regression of all individuals with slope equal to 1 by definition. The red lines represent significant regressions within species that were sampled at more than five sites.
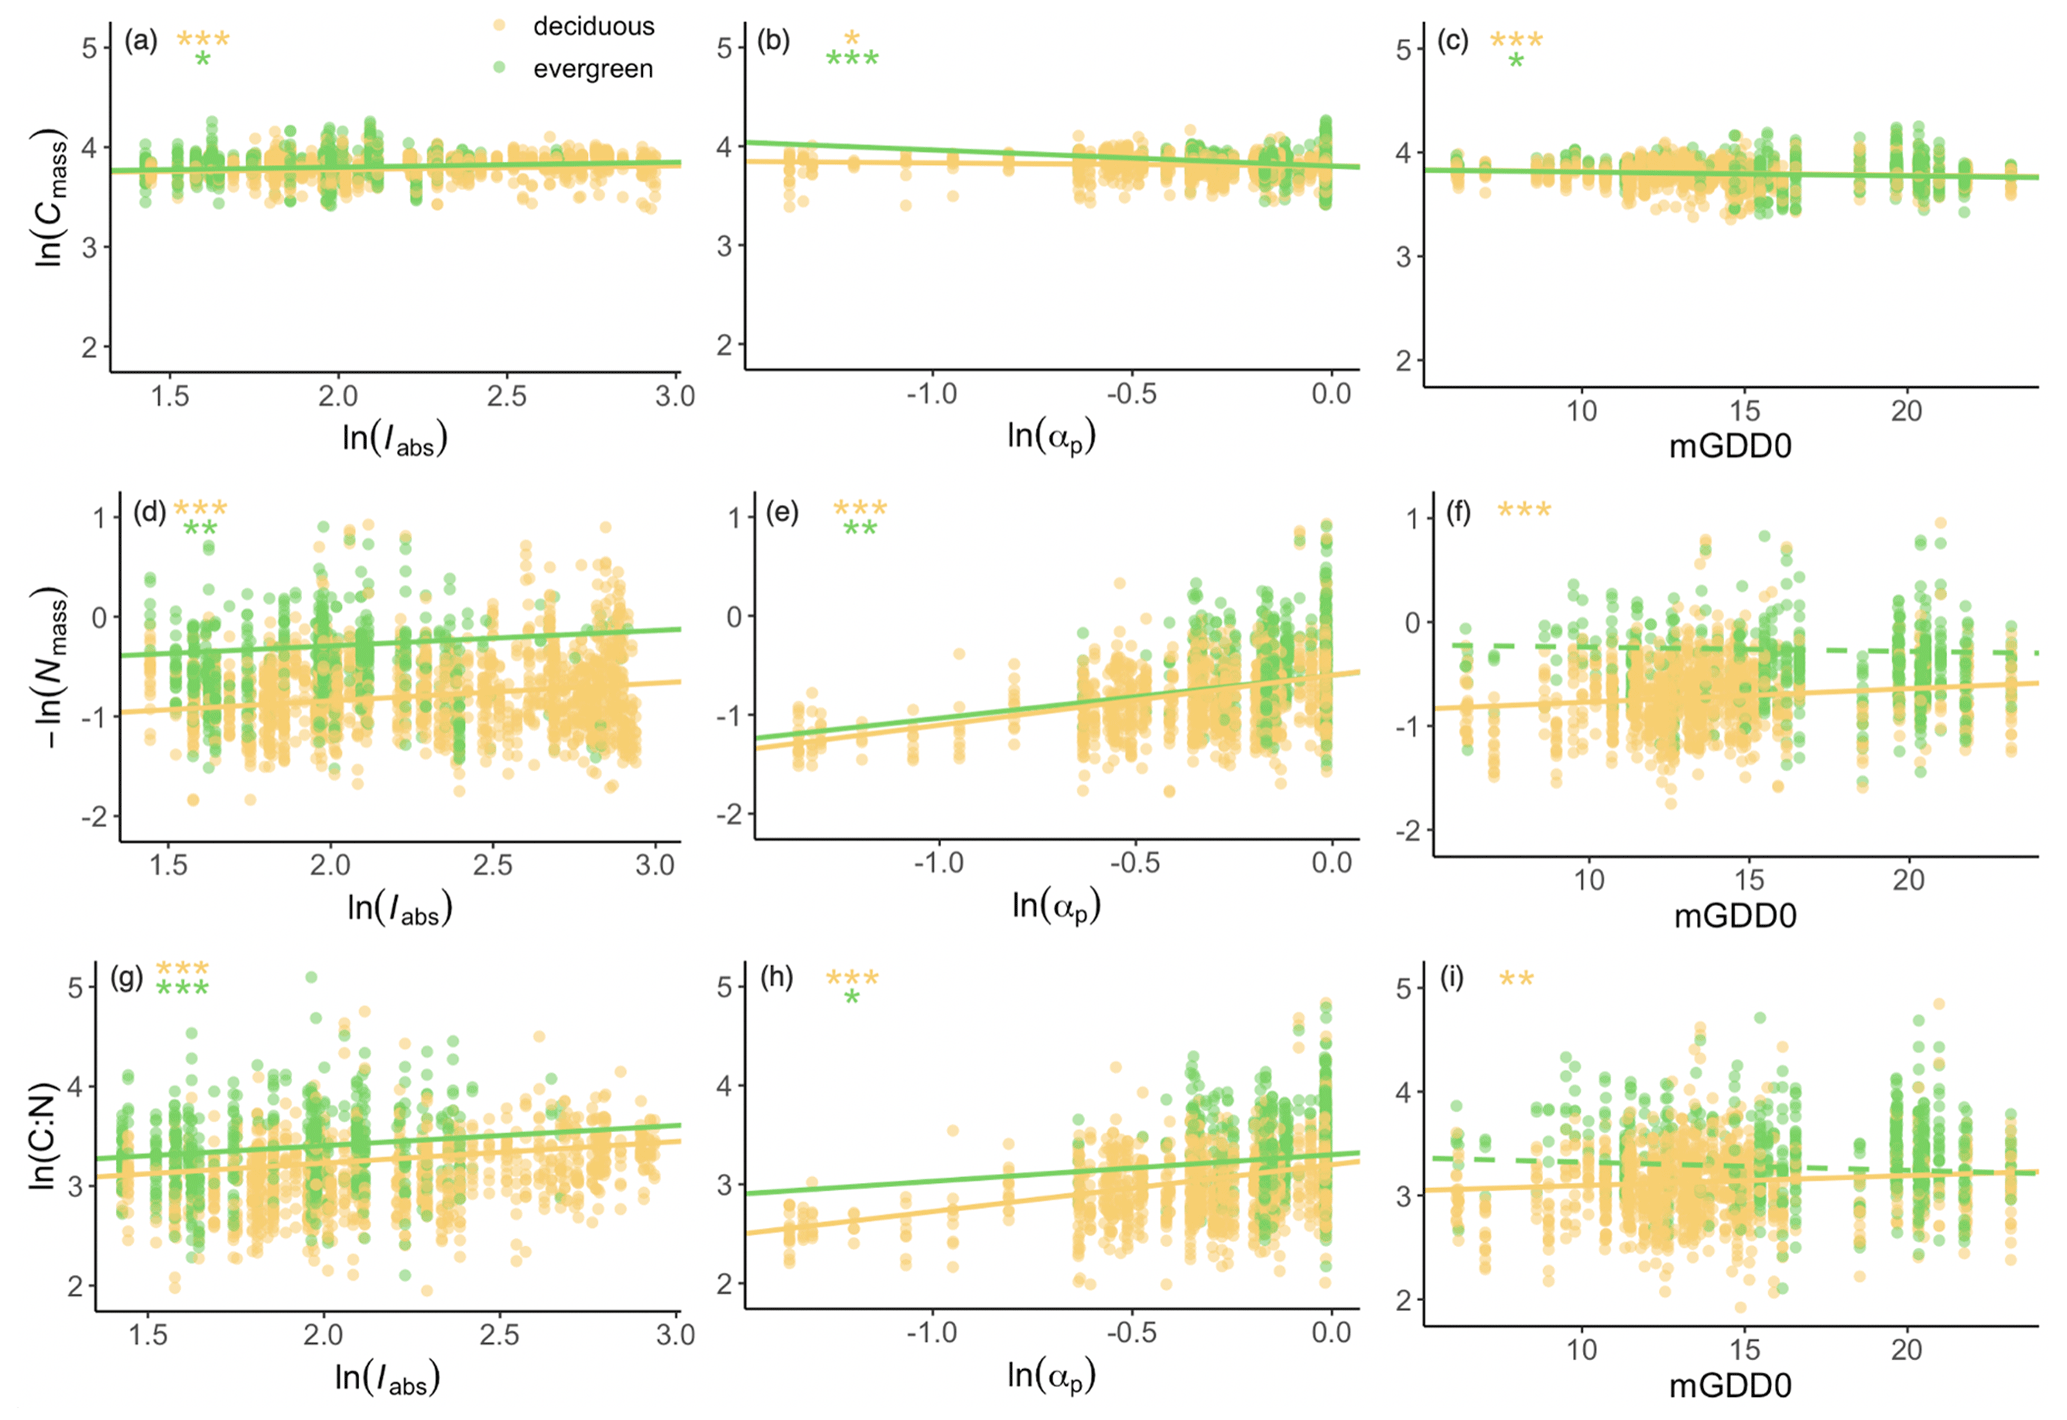
Figure 4Empirical partial relationships between leaf traits and climate. Iabs is the leaf-area-index-weighted photosynthetic photon flux density, αp is a moisture index, and mGDD0 is the mean temperature during the thermal growing season. Yellow dots: deciduous species; green dots: evergreen species. The Nmass scale is inverted, so that the slopes of the regression lines in panels (a)–(c) and (d)–(f) should add up to the slopes in panels (g)–(i). The significance of each regression is listed in the panels. p<0.001; p<0.01; * p<0.05.
3.3 Eco-evolutionary optimality models for leaf traits
Cmass was relatively constant at different values of the leaf C:N ratio (grey lines, Supplement Fig. S3), while Nmass showed much greater variability. This pattern held for both deciduous and evergreen species. The analysis of relative importance showed that Nmass explains on average 90 % of variation in the leaf C:N ratio.
Leaf Nmass was positively related to its theoretical predictor () (Fig. 5). We found a significant LAI effect on the slope (b) and intercept (a) of this relationship, with the slope increasing and intercept decreasing towards greater LAI. The r2 of Eq. (6) was improved from 0.14 to 0.21 at the species level after including the LAI effect. The optimality models captured 68 % and 53 % of the community-level variation in Vcmax25 and Ma, respectively (Fig. 6a, b). Vcmax25 was somewhat underestimated at most sites, with the largest bias when observed Vcmax25 was at alpine sites above 4000 m. Ma was distributed evenly near the 1:1 line, with the largest bias occurring at a semi-arid site with very high observed Ma. The optimality model, with LAI effect included, explained 21 % of Nmass variation using predicted values of Vcmax25 and Ma (Fig. 6c). The predicted leaf C:N ratios fell within the observed range in each PFT and outperformed fixed values prescribed in LSMs for most PFTs (Fig. 7). The prediction of the leaf C:N ratio using constant Cmass (45.6 %) was similar to that using observed Cmass.
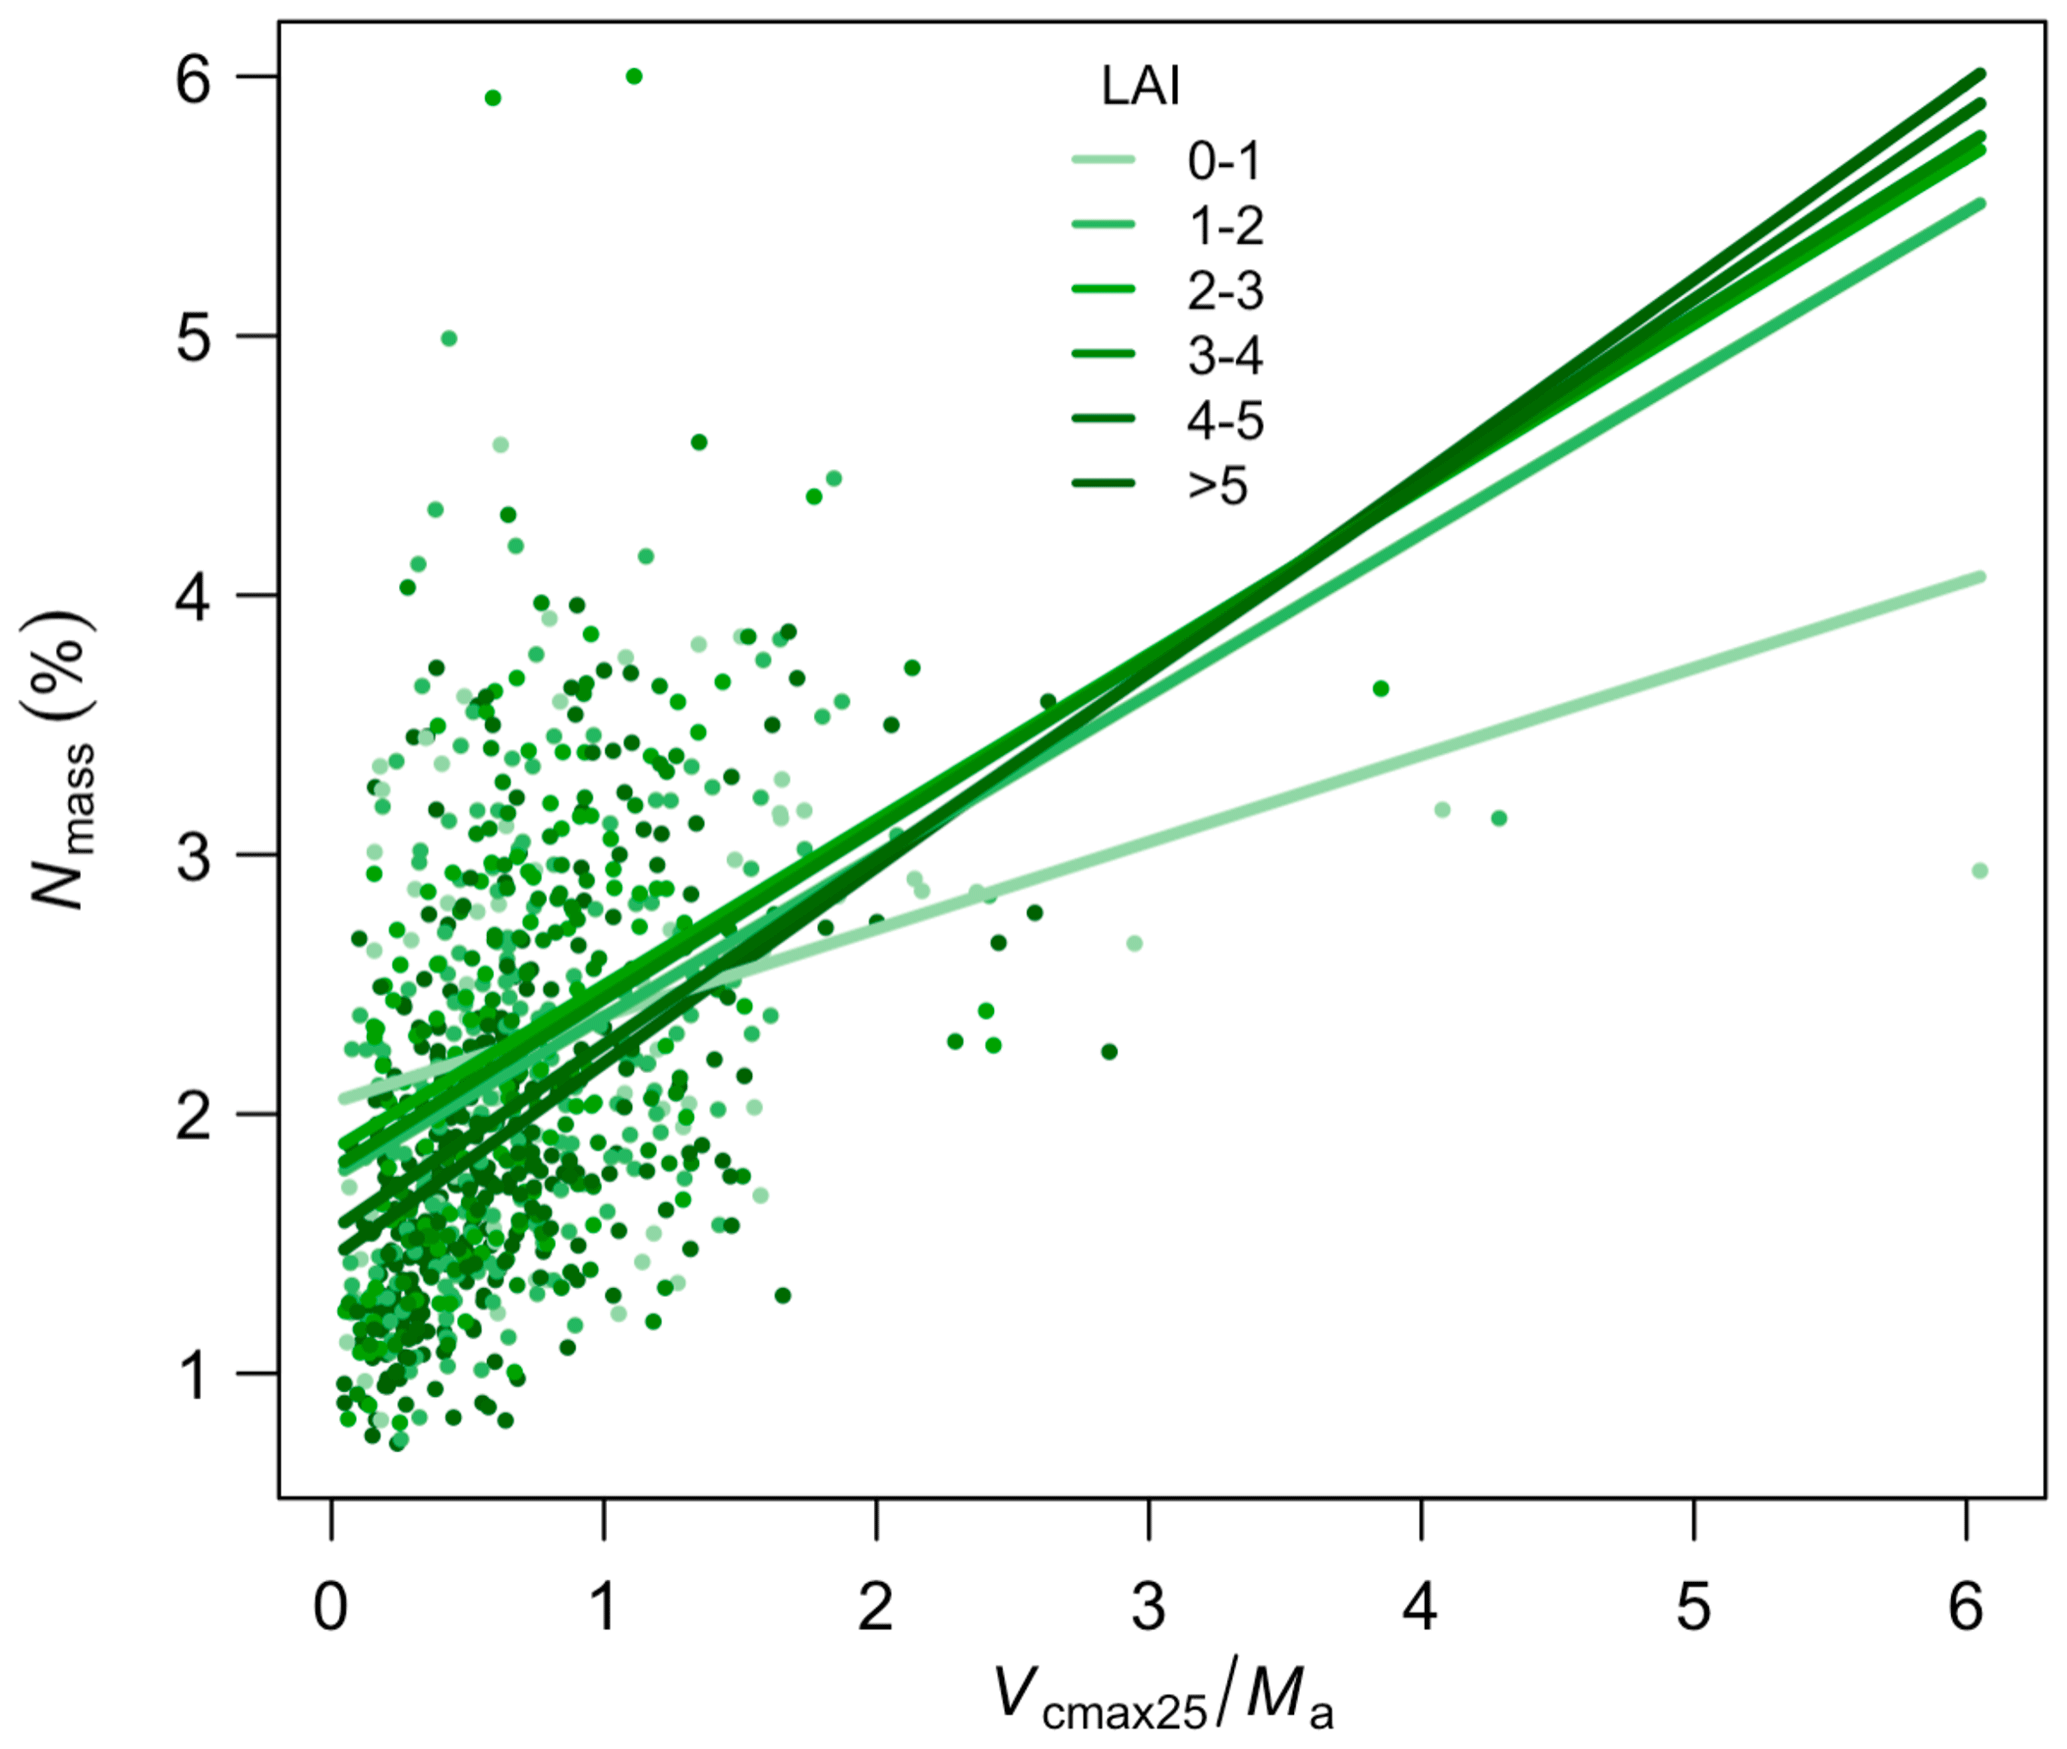
Figure 5The relationship between Nmass and along the leaf area index (LAI) gradient. Colour saturation represents different levels of LAI. Lines are separate regressions for sites within each LAI bin.
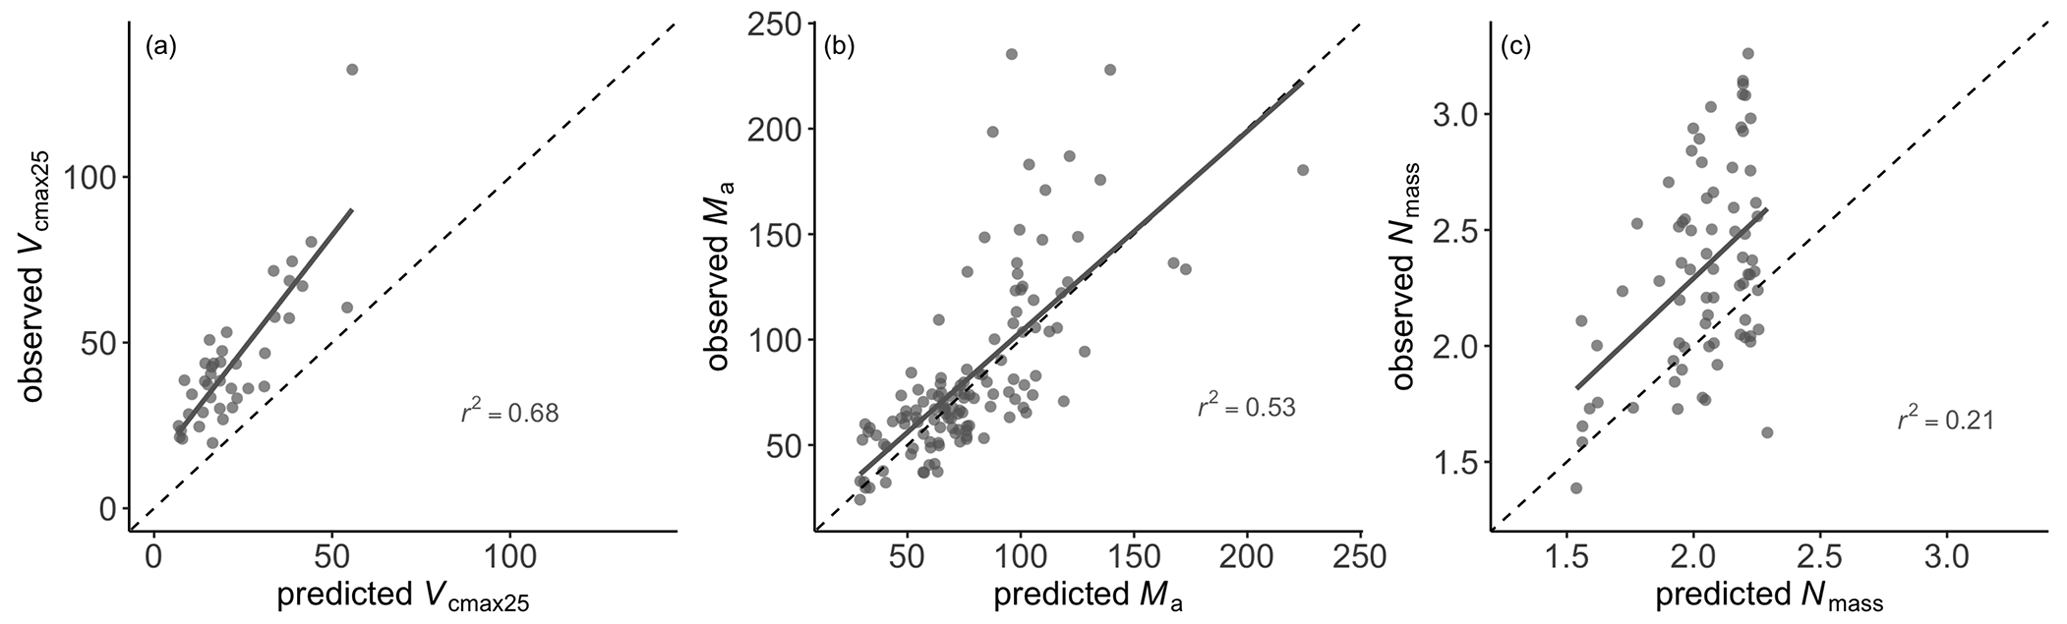
Figure 6Optimality-based predictions versus observations of leaf traits at the site level. Grey lines are ordinary least-squares regressions. The black dashed line is the 1:1 line.
We have demonstrated that across-site variations in leaf stoichiometric traits along climate gradients are driven mainly by species turnover and that an optimality-based model can predict 30 % of Nmass variation, highlighting the potential of applying EEO principles to leaf stoichiometry. Predicted leaf C:N ratios are within the range of observations. These findings provide a potential avenue for improving the representation of leaf stoichiometry in LSMs.
4.1 Climate effects mediated by compositional shifts and intraspecific variation
For Cmass and Nmass separately, the contribution of climate variables in the multiple regression was modest (10 %–13 %), while the mixed model attributed larger fractions of variation to species identity and phylogeny than to climate (Table 1). For the C:N ratio, climate explained 45 % of variation in the multiple regression, while the mixed model attributed similar fractions (19 %–20 %) of variation to species identity, phylogeny, and climate (Table 1). The phylogenetic comparative method (Table 1) attributed only 2 % of variation in Cmass and Nmass and 10 % of variation in the C:N ratio to climate alone. The trait-gradient analysis also indicated an important role of intraspecific variation in trait shift at a regional scale. These results are consistent both with strong phylogenetic control of leaf stoichiometry and with strong patterns of variation (especially for C:N ratio) in community-mean values determined to a substantial degree by environmental selection among species and clades characterized by different trait values (Liu et al., 2022), and they emphasize the contribution of within-species variation, which has often been neglected in community ecology (Violle et al., 2012).
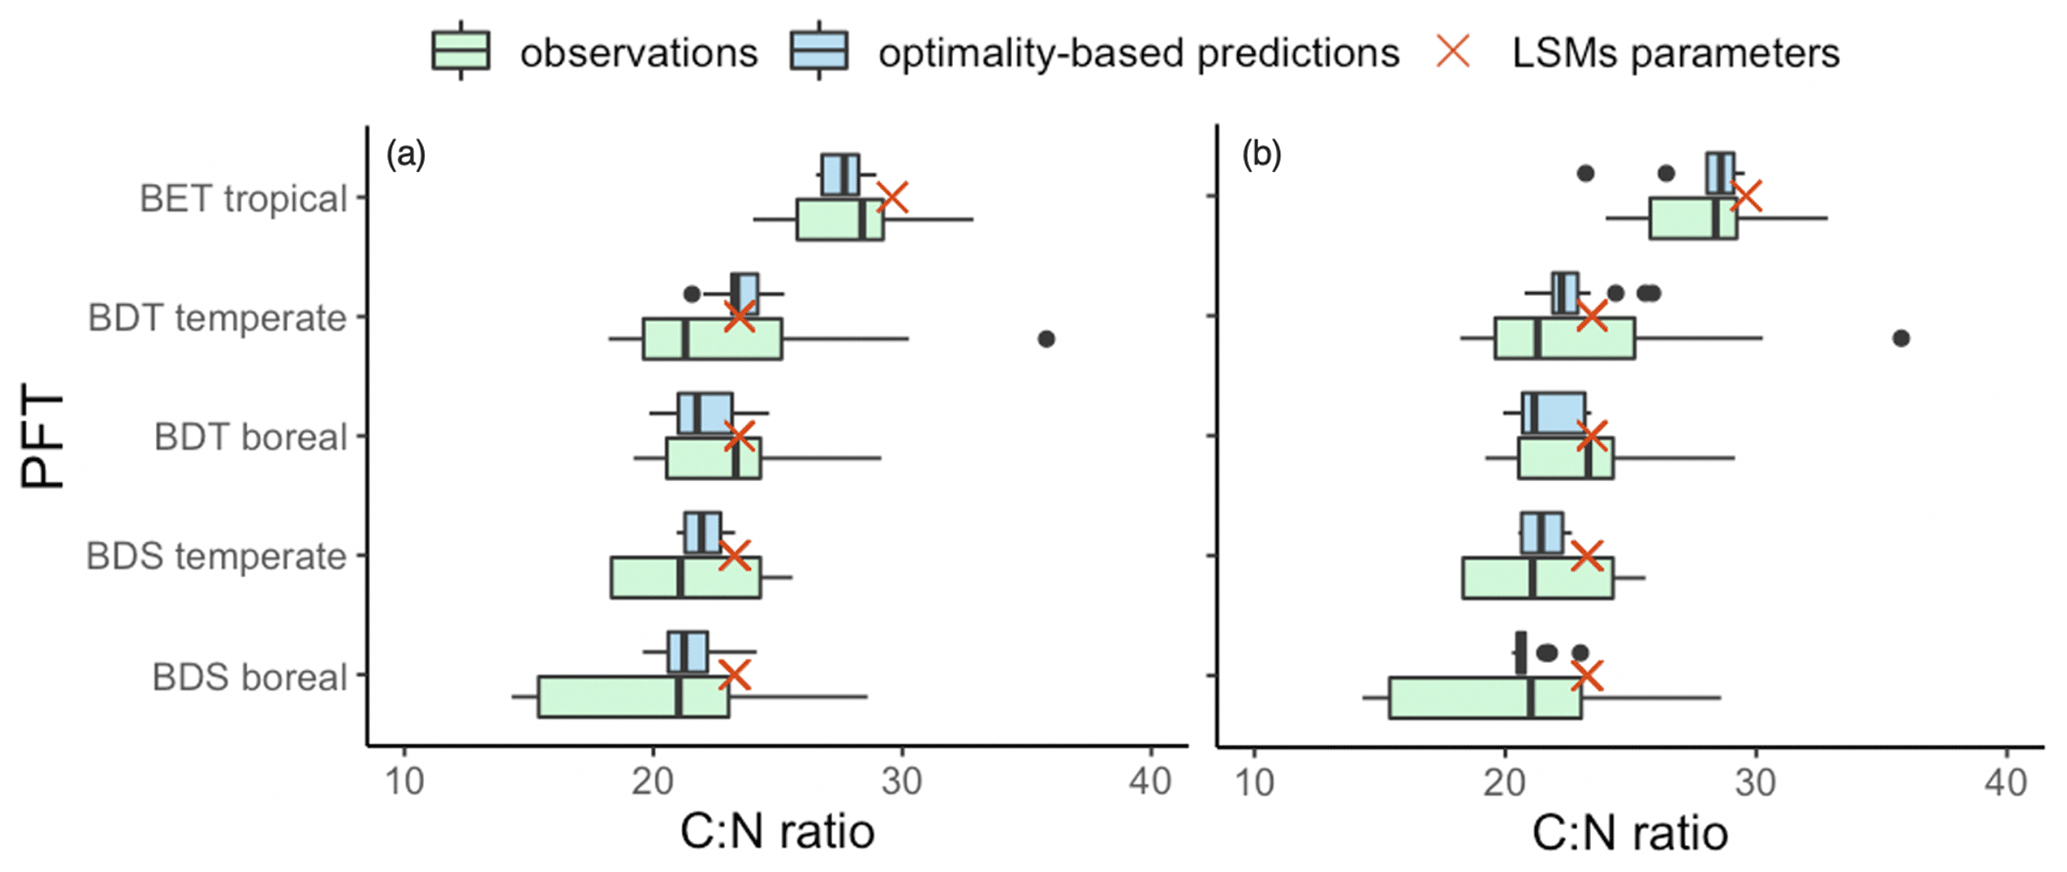
Figure 7Comparison of observed and predicted C:N ratios with target values in LSMs. The blue boxes represent predicted C:N ratios using observed Cmass (a) and using constant mean Cmass (b). The green boxes represent observed C:N ratios. Red crosses show target values in LSMs (adopted from CLM4).
Within-site variations – unconstrained by macroclimate – were usually larger than between-site variations (Supplement Fig. S4). This large within-site variability might explain why no significant effect of climate on leaf stoichiometry was detected in some previous regional studies (Yang et al., 2016; Zhang et al., 2017; Zhao et al., 2018). Zhang et al. (2019) showed a weak phylogenetic signal for the leaf C:N ratio evaluated by Blomberg's K. We used Pagel's λ due to its better performance and reliability with a large number of species (Münkemüller et al., 2012). The significant phylogenetic signals for leaf stoichiometric traits confirmed that species with similar evolutionary history tend to have similar leaf stoichiometry, indicating that leaf stoichiometric traits of extant species at a site may not remain adaptive under a changing environment (He et al., 2010; Li et al., 2021; Yang et al., 2016). It has been suggested that a high phenotypic plasticity of the leaf C:N ratio would be associated with a high mortality risk, supporting the idea that tight regulation of leaf stoichiometry within species helps to ensure plant survival (Luong et al., 2021). Within-site diversity may help communities to maintain their function in the face of climate variability and extremes.
Plant species may occupy different “biogeochemical niches” to ensure the full use of available resources and avoid competition (Sardans and Penuelas, 2014; Sardans et al., 2021). At the community level, climate variables captured more of the observed leaf stoichiometric variations, due to the averaging of data from co-occurring species and intraspecific variability (Vallicrosa et al., 2021). Systematic variation in community-mean leaf stoichiometric traits along climate gradients can be achieved through progressive species replacement at a macroclimatic scale and intraspecific trait variability at a regional scale (Liu et al., 2019; Yang et al., 2016).
The distributions of common deciduous genera were shown to be more sensitive to moisture, while the distributions of evergreen genera were mainly driven by temperature. This distinction may be related to the different adaptation strategies represented by differences in leaf longevity (LL). Kikuzawa et al. (2013) indicated that temperature is the best predictor of LL for evergreen species, while a consideration of an additional moisture factor was expected to improve the explanatory power of climate for LL in deciduous species. According to Kikuzawa's optimality model, LL of evergreen species is higher at low temperatures, in order to compensate for low total carbon gain during the short growing season. For deciduous species, however, LL should not exceed the length of the growing season – which can be affected by moisture as well as temperature in semi-arid and arid areas. Thus, our study suggests that climate shapes leaf stoichiometric variation at a macroclimatic scale via environmental selection among taxa and emphasizes the neglected role of phenology in biogeochemical cycles (He et al., 2006; Vallicrosa et al., 2021; Xiong et al., 2021).
Although some studies have shown an important role of soil fertility in determining plant stoichiometry, published studies have shown inconsistent results (Fang et al., 2019; Fyllas et al., 2009; He et al., 2010; Ordoñez et al., 2009; Xiong et al., 2021). Soil fertility as indexed by the soil C:N ratio had no significant effect on leaf stoichiometry in our analysis, indicating a decoupling of soil and leaf stoichiometry (Delgado-Baquerizo et al., 2017; Elser et al., 2010). Plant–soil interactions may affect whole-plant stoichiometry nonetheless, through effects on C allocation to different tissues. Allocation of N to leaves shows stronger homeostasis than in other tissues, possibly as a consequence of the need to maintain the crucial functions of photosynthesis and leaf respiration; the stoichiometry of other tissues may adjust to soil conditions in order to support leaf-level function (Chen et al., 2013; Delgado-Baquerizo et al., 2017; Zhang et al., 2017). Uncertainty in our soil fertility data may was inevitably introduced due to our reliance on a gridded soil map (Shangguan et al., 2013). More studies including in situ soil measurements are needed to more comprehensively investigate the effect of soil properties on plant stoichiometry.
4.2 Trait responses reflect plant strategies
Leaf stoichiometry integrates traits that reflect different plant functions, resulting in a potentially complex response to climate. In contrast with many previous studies, we have considered (and found significant effects of) functionally significant bioclimatic variables, including light, in leaf-level stoichiometry. Our analyses indicate general relationships that are quite similar between evergreen and deciduous plants.
Higher leaf Cmass was observed in cold and dry areas with high radiation (Fig. 4). Chen et al. (2021) found that leaf Cmass is positively related to vein density, which relates to the efficiency of water transport. At strong light, plants tend to have a higher photosynthetic rate, requiring more water for transpiration to maintain open stomata – which could be achieved by high carbon investment in venation (Sack and Scoffoni, 2013). In dry areas, high vein density is a common adaptation to drought, allowing plants to respond quickly to available water for carbon fixation and to keep leaves cool in the face of high air temperature (Scoffoni et al., 2011; Yao et al., 2021). Meanwhile, plants may accumulate nonstructural carbohydrates to adjust osmotic potential and avoid leaf desiccation (Bartlett et al., 2014). The leaf Cmass response to temperature as observed here, however, is the opposite of some previous reports (Ma et al., 2018; Xing et al., 2021). Global analysis showed an overall positive response to temperature with a range from −10 to 30 ∘C, whereas leaf Cmass decreased when the mean annual temperature was lower than 20 ∘C (Ma et al., 2018). Ma, which is positively related to leaf Cmass (Xing et al., 2021), is generally negatively correlated with temperature (Wright et al., 2004). A higher starch concentration is observed at low temperatures, due to conditions that allow photosynthesis but not growth (Hoch and Körner, 2012). This suggests that the leaf Cmass response to temperature may not be monotonic, owing to different functions dominating at the extremes.
The components of leaf N variation adapt to the climate in different ways (Dong et al., 2017; Peng et al., 2020; Xu et al., 2021). Nmass is also constrained by the trade-offs inherent in the leaf economics spectrum. Leaves with high Ma (and LL) have low photosynthetic rates per unit mass and low nutrient contents by mass (Wright et al., 2004). Thus, climate drives Nmass variation both directly and indirectly. Moisture has a negative effect on Nmass (Yang et al., 2016; Zhang et al., 2019; Zhao et al., 2018). It has been reported that N-containing compounds (such as amides) accumulate in plants in order to adjust osmotic pressure under drought (Raggi, 1994). In addition, N-rich leaf defence compounds increase towards more arid climates, at the expense of C-based defences such as spines and thorns (de Oliveira et al., 2020; Ghimire et al., 2017; Meloni et al., 2012). In the existing optimality model Narea should be positively related to radiation, since light has a positive effect on Ma and Vcmax25 (Smith et al., 2019; Wang et al., 2023). However, when N is expressed on a mass basis (Nmass), light has a negative effect, suggesting a lower sensitivity of Vcmax25 to light than Ma. The negative effect of temperature on Nmass has been observed across vegetation types (Han et al., 2005; He et al., 2008; Tang et al., 2018; Weih and Karlsson, 2001). This is consistent with the hypothesis that more nutrients are required to compensate for low enzyme activity at low temperatures (Reich and Oleksyn, 2004). Although the leaf C:N ratio response to climate is a combination of the responses of both C and N, it is dominated by the variation in N. Thus, understanding of Nmass variation should help elucidate variation in C:N ratios (Reich, 2005). Positive effects of temperature and moisture on leaf C:N ratios have also been observed in previous studies, implying higher N use efficiency in hot and wet areas (Fang et al., 2019; Zhang et al., 2019).
4.3 Leaf nitrogen content predicted by optimality models
C:N ratios couple C and N cycling, thus influencing the estimation of carbon assimilation and plant growth in LSMs (Wang et al., 2010; Zaehle et al., 2014). Fixed leaf C:N ratios assigned to PFTs, as for example in CLM4 and ED2.1, may result in inaccurate representations of this coupling (Bonan and Doney, 2018; Lawrence et al., 2011; Medvigy et al., 2009). Although model outputs such as ecosystem responses to elevated CO2 are more consistent with observations in models where flexible C:N ratios are allowed (Lawrence et al., 2019; Meyerholt and Zaehle, 2015), large differences between models persist (Du et al., 2018).
Meyerholt and Zaehle (2015) highlighted the potential of optimality theory to improve the representation of N cycling in LSMs. Caldararu et al. (2020) showed that models that implement dynamic leaf stoichiometry schemes based on EEO principles can perform better than those with fixed-PFT schemes. Here we have shown that leaf Nmass covariation with Vcmax25 and Ma as predicted by EEO principles can provide further insights. Since Nmass is the key to determining the leaf C:N ratio, given the relative constancy of Cmass (Reich, 2005), we focused on the predictability of Nmass. The variation in leaf N per unit area (Narea) can be represented as the sum of two components, proportional to leaf mass per area (Ma) and the maximum capacity of carboxylation at 25 ∘C (Vcmax25) (Dong et al., 2017), and now both Ma and Vcmax25 can be predicted from EEO principles (Smith et al., 2019; Wang et al., 2023; Xu et al., 2021). Community-level variations in Ma, Vcmax25, and Narea can indeed be largely captured (r2=0.53, 0.68, and 0.62, respectively) using climate variables as predictors. We also showed a tendency for the relationship between Nmass and the ratio to become steeper with increasing LAI. This finding is consistent with N redistribution within the canopy, as an acclimation to light conditions that maximizes total carbon gain (Hirose and Werger, 1987; Niinemets et al., 2015). The strong vertical light gradient in high-LAI canopies implies a large advantage for optimized N distribution, in contrast with more open canopies (Field, 1983). The same model framework as Narea, with this additional LAI effect included, showed good predictive skill for Nmass (and better than that of Boonman et al. (2020), obtained using an ensemble modelling approach) based on climate. However, our predicted Nmass was constrained within a narrow range, despite the well-captured variations in Ma and Vcmax25. The predicted Nmass in tropical forest with high LAI was systematically underestimated due to the low intercept (Supplement Table S1). We recognize that our method to predict Nmass may overlook additional functions of N in leaves, such as chemical defences, perhaps causing greater variation than predicted. This requires further investigation. Some species in this study apparently adjusted their leaf stoichiometry along major environmental gradients, possibly via genetic adaptation over multigenerational timescales. Due to the lack of intraspecific data within communities, we could not assess the degree of variation among conspecific plants in the same environment. Intraspecific variation within communities may, however, increase functional diversity and promote species coexistence (Westerband et al., 2021) and potentially provide a buffer against climatic variation and change (Ahrens et al., 2021). Further studies are needed to better understand intraspecific trait variation (Moran et al., 2016) in order to assign appropriate timescales for the dynamic responses of traits to environmental changes in Earth system models.
Predicted C:N ratios, whether using observed or constant Cmass, lie within the range of observed data, supporting the dominant role of Nmass in driving leaf C:N ratios (Fig. 6). The target (PFT-specific) values used in several LSMs such as CLM4, ORCHIDEE, and YIBs (Fig. 7) are based on data sets nearly 20 years old and fail to represent continuous trait variations that can now be inferred from much larger data sets. Our EEO-based approach thus suggests a way forward to improve the dynamic representation of leaf stoichiometry in LSMs.
This study shows that the leaf C:N ratio is mainly driven by mass-based leaf nitrogen content which can be estimated via the sum of metabolic and structural components of leaf nitrogen using eco-evolutionary optimality-based models. This provides another perspective to improve dynamic representation of stoichiometry in Earth system models. The variations in leaf stoichiometric traits at the individual level are mainly controlled by species identity and phylogeny; thus, the shift in leaf stoichiometry variations at the community level along climate gradient is achieved via species turnover and intraspecific variability. This allows the prediction of community-mean values of leaf stoichiometric traits using EEO-based models. We show that the coefficient representing nitrogen allocation to metabolic and structural components is related to leaf area index, which highlights the importance of nitrogen allocation in its prediction. The unexplained variation in leaf nitrogen content may attribute to other unclear physiological processes, which requires further effort to improve the prediction of the leaf C:N ratio.
All traits and climate data are available from figshare (https://figshare.com/articles/dataset/The_China_Plant_Trait_Database_Version_2_0/19448219, Wang et al., 2022).
The supplement related to this article is available online at: https://doi.org/10.5194/bg-20-4511-2023-supplement.
HX carried out the analyses and prepared the manuscript with contributions from all co-authors. HW conceived the study design. HW, SPH, and ICP contributed to the analyses and interpretation of the results.
The contact author has declared that none of the authors has any competing interests.
Publisher’s note: Copernicus Publications remains neutral with regard to jurisdictional claims made in the text, published maps, institutional affiliations, or any other geographical representation in this paper. While Copernicus Publications makes every effort to include appropriate place names, the final responsibility lies with the authors.
This work has been supported by the National Natural Science Foundation of China (grant nos. 31971495, 32022052, and 72140005). Iain Colin Prentice and Sandy P. Harrison are supported by the High-End Foreign Expert Program of the China State Administration of Foreign Expert Affairs at Tsinghua University (G2023102014). Iain Colin Prentice and Sandy P. Harrison acknowledge support from the European Research Council 787203 REALM and 694481 GC2.0 under the European Union's Horizon 2020 research programme, respectively. This research is a contribution to the LEMONTREE (Land Ecosystem Models based On New Theory, obseRvations and ExperimEnts) project, funded through the generosity of Eric and Wendy Schmidt by recommendation of the Schmidt Futures programme.
This paper was edited by Jens-Arne Subke and reviewed by two anonymous referees.
Ackerly, D. D. and Cornwell, W. K.: A trait-based approach to community assembly: partitioning of species trait values into within- and among-community components, Ecol. Lett., 10, 135–145, https://doi.org/10.1111/j.1461-0248.2006.01006.x, 2007.
Ahrens, C. W., Rymer, P. D., and Tissue, D. T.: Intra-specific trait variation remains hidden in the environment, New Phytol., 229, 1183–1185, https://doi.org/10.1111/nph.16959, 2021.
Anderegg, L. D. L.: Why can't we predict traits from the environment?, New Phytol., 237, 1998–2004, https://doi.org/10.1111/nph.18586, 2023.
Bartlett, M. K., Zhang, Y., Kreidler, N., Sun, S., Ardy, R., Cao, K., and Sack, L.: Global analysis of plasticity in turgor loss point, a key drought tolerance trait, Ecol. Lett., 17, 1580–1590, https://doi.org/10.1111/ele.12374, 2014.
Bernacchi, C. J., Singsaas, E. L., Pimentel, C., Portis Jr., A. R., and Long, S. P.: Improved temperature response functions for models of Rubisco-limited photosynthesis, Plant Cell Environ., 24, 253–259, 2001.
Bernacchi, C. J., Pimentel, C., and Long, S. P.: In vivo temperature response functions of parameters required to model RuBP-limited photosynthesis, Plant Cell Environ., 26, 1419–1430, https://doi.org/10.1046/j.0016-8025.2003.01050.x, 2003.
Bonan, G. B. and Doney, S. C.: Climate, ecosystems, and planetary futures: The challenge to predict life in Earth system models, Science, 359, aam8328, https://doi.org/10.1126/science.aam8328, 2018.
Boonman, C. C. F., Benitez-Lopez, A., Schipper, A. M., Thuiller, W., Anand, M., Cerabolini, B. E. L., Cornelissen, J. H. C., Gonzalez-Melo, A., Hattingh, W. N., Higuchi, P., Laughlin, D. C., Onipchenko, V. G., Penuelas, J., Poorter, L., Soudzilovskaia, N. A., Huijbregts, M. A. J., and Santini, L.: Assessing the reliability of predicted plant trait distributions at the global scale, Glob. Ecol. Biogeogr., 29, 1034–1051, https://doi.org/10.1111/geb.13086, 2020.
Breheny, P. and Burchett, W.: Visualization of regression models using visreg, R J., 9, 56–71, 2017.
Caldararu, S., Thum, T., Yu, L., and Zaehle, S.: Whole-plant optimality predicts changes in leaf nitrogen under variable CO2 and nutrient availability, New Phytol., 225, 2331–2346, https://doi.org/10.1111/nph.16327, 2020.
Cernusak, L. A., Ubierna, N., Winter, K., Holtum, J. A., Marshall, J. D., and Farquhar, G. D.: Environmental and physiological determinants of carbon isotope discrimination in terrestrial plants, New Phytol., 200, 950–965, https://doi.org/10.1111/nph.12423, 2013.
Charles-Edwards, D. A., Stutzel, H., Ferraris, R., and Beech, D. F.: An Analysis of Spatial Variation in the Nitrogen Content of Leaves from Different Horizons Within a Canopy, Ann. Bot., 60, 421–426, https://doi.org/10.1093/oxfordjournals.aob.a087463, 1987.
Chen, J.-L., Reynolds, J. F., Harley, P. C., and Tenhunen, J. D.: Coordination theory of leaf nitrogen distribution in a canopy, Oecologia, 93, 63–69, 1993.
Chen, Y., Han, W., Tang, L., Tang, Z., and Fang, J.: Leaf nitrogen and phosphorus concentrations of woody plants differ in responses to climate, soil and plant growth form, Ecography, 36, 178–184, https://doi.org/10.1111/j.1600-0587.2011.06833.x, 2013.
Chen, Z., Zhang, Y., Yuan, W., Zhu, S., Pan, R., Wan, X., and Liu, S.: Coordinated variation in stem and leaf functional traits of temperate broadleaf tree species in the isohydric–anisohydric spectrum, Tree Physiol., 41, 1601–1610, https://doi.org/10.1093/treephys/tpab028, 2021.
Cornelissen, J. H. C., Lavorel, S., Garnier, E., Díaz, S., Buchmann, N., Gurvich, D. E., Reich, P. B., Ter Steege, H., Morgan, H. D., Van Der Heijden, M. G. A., Pausas, J. G., and Poorter, H.: A handbook of protocols for standardised and easy measurement of plant functional traits worldwide, Austr. J. Bot., 51, 335–380, https://doi.org/10.1071/BT02124, 2003.
Cornwell, W. K., Wright, I. J., Turner, J., Maire, V., Barbour, M. M., Cernusak, L. A., Dawson, T., Ellsworth, D., Farquhar, G. D., Griffiths, H., Keitel, C., Knohl, A., Reich, P. B., Williams, D. G., Bhaskar, R., Cornelissen, J. H. C., Richards, A., Schmidt, S., Valladares, F., Körner, C., Schulze, E.-D., Buchmann, N., and Santiago, L. S.: Climate and soils together regulate photosynthetic carbon isotope discrimination within C3 plants worldwide, Glob. Ecol. Biogeogr., 27, 1056–1067, https://doi.org/10.1111/geb.12764, 2018.
De Kauwe, M. G., Lin, Y. S., Wright, I. J., Medlyn, B. E., Crous, K. Y., Ellsworth, D. S., Maire, V., Prentice, I. C., Atkin, O. K., Rogers, A., Niinemets, U., Serbin, S. P., Meir, P., Uddling, J., Togashi, H. F., Tarvainen, L., Weerasinghe, L. K., Evans, B. J., Ishida, F. Y., and Domingues, T. F.: A test of the 'one-point method' for estimating maximum carboxylation capacity from field-measured, light-saturated photosynthesis, New Phytol., 210, 1130–1144, https://doi.org/10.1111/nph.13815, 2016.
de Oliveira, A. C. P., Nunes, A., Rodrigues, R. G., and Branquinho, C.: The response of plant functional traits to aridity in a tropical dry forest, Sci. Total Environ., 747, 141177, https://doi.org/10.1016/j.scitotenv.2020.141177, 2020.
Delgado-Baquerizo, M., Eldridge, D. J., Maestre, F. T., Ochoa, V., Gozalo, B., Reich, P. B., and Singh, B. K.: Aridity Decouples Stoichiometry Across Multiple Trophic Levels in Terrestrial Ecosystems, Ecosystems, 21, 459–468, https://doi.org/10.1007/s10021-017-0161-9, 2017.
Dong, N., Prentice, I. C., Evans, B. J., Caddy-Retalic, S., Lowe, A. J., and Wright, I. J.: Leaf nitrogen from first principles: field evidence for adaptive variation with climate, Biogeosciences, 14, 481–495, https://doi.org/10.5194/bg-14-481-2017, 2017.
Dong, N., Prentice, I. C., Wright, I. J., Wang, H., Atkin, O. K., Bloomfield, K. J., Domingues, T. F., Gleason, S. M., Maire, V., Onoda, Y., Poorter, H., and Smith, N. G.: Leaf nitrogen from the perspective of optimal plant function, J. Ecol., 110, 2585–2602, https://doi.org/10.1111/1365-2745.13967, 2022.
Du, Z., Weng, E., Jiang, L., Luo, Y., Xia, J., and Zhou, X.: Carbon–nitrogen coupling under three schemes of model representation: a traceability analysis, Geosci. Model Dev., 11, 4399–4416, https://doi.org/10.5194/gmd-11-4399-2018, 2018.
Elser, J. J., Fagan, W. F., Kerkhoff, A. J., Swenson, N. G., and Enquist, B. J.: Biological stoichiometry of plant production: metabolism, scaling and ecological response to global change, New Phytol., 186, 593–608, https://doi.org/10.1111/j.1469-8137.2010.03214.x, 2010.
Fang, Z., Li, D.-D., Jiao, F., Yao, J., and Du, H.-T.: The Latitudinal Patterns of Leaf and Soil Stoichiometry in the Loess Plateau of China, Front. Plant Sci., 10, 85, https://doi.org/10.3389/fpls.2019.00085, 2019.
Farquhar, G. D., Ehleringer, J. R., and Hubick, K. T.: Carbon isotope discrimination and photosynthesis, Annu. Rev. Plant Biol., 40, 503–537, 1989.
Fernández-Martínez, M., Vicca, S., Janssens, I. A., Sardans, J., Luyssaert, S., Campioli, M., Chapin Iii, F. S., Ciais, P., Malhi, Y., Obersteiner, M., Papale, D., Piao, S. L., Reichstein, M., Rodà, F., and Peñuelas, J.: Nutrient availability as the key regulator of global forest carbon balance, Nat. Clim. Change, 4, 471–476, https://doi.org/10.1038/nclimate2177, 2014.
Field, C.: Allocating leaf nitrogen for the maximization of carbon gain: Leaf age as a control on the allocation program, Oecologia, 56, 341–347, https://doi.org/10.1007/BF00379710, 1983.
Fyllas, N. M., Patiño, S., Baker, T. R., Bielefeld Nardoto, G., Martinelli, L. A., Quesada, C. A., Paiva, R., Schwarz, M., Horna, V., Mercado, L. M., Santos, A., Arroyo, L., Jiménez, E. M., Luizão, F. J., Neill, D. A., Silva, N., Prieto, A., Rudas, A., Silviera, M., Vieira, I. C. G., Lopez-Gonzalez, G., Malhi, Y., Phillips, O. L., and Lloyd, J.: Basin-wide variations in foliar properties of Amazonian forest: phylogeny, soils and climate, Biogeosciences, 6, 2677–2708, https://doi.org/10.5194/bg-6-2677-2009, 2009.
Ghimire, B., Riley, W. J., Koven, C. D., Mu, M., and Randerson, J. T.: Representing leaf and root physiological traits in CLM improves global carbon and nitrogen cycling predictions, J. Adv. Model. Earth Sy., 8, 598–613, https://doi.org/10.1002/2015ms000538, 2016.
Ghimire, B., Riley, W. J., Koven, C. D., Kattge, J., Rogers, A., Reich, P. B., and Wright, I. J.: A global trait-based approach to estimate leaf nitrogen functional allocation from observations, Ecol. Appl.s, 27, 1421–1434, https://doi.org/10.1002/eap.1542, 2017.
Groemping, U.: Relative Importance for Linear Regression in R: The Package relaimpo, J. Stat. Softw., 17, 925–933, 2006.
Hadfield, J. D.: MCMC methods for multi-response generalized linear mixed models: the MCMCglmm R package, J. Stat. Softw., 33, 1–22, 2010.
Han, W., Fang, J., Guo, D., and Zhang, Y.: Leaf nitrogen and phosphorus stoichiometry across 753 terrestrial plant species in China, New Phytol., 168, 377–385, https://doi.org/10.1111/j.1469-8137.2005.01530.x, 2005.
Harrison, S. P., Cramer, W., Franklin, O., Prentice, I. C., Wang, H., Brannstrom, A., de Boer, H., Dieckmann, U., Joshi, J., Keenan, T. F., Lavergne, A., Manzoni, S., Mengoli, G., Morfopoulos, C., Penuelas, J., Pietsch, S., Rebel, K. T., Ryu, Y., Smith, N. G., Stocker, B. D., and Wright, I. J.: Eco-evolutionary optimality as a means to improve vegetation and land-surface models, New Phytol., 231, 2125–2141, https://doi.org/10.1111/nph.17558, 2021.
He, J. S., Fang, J., Wang, Z., Guo, D., Flynn, D. F., and Geng, Z.: Stoichiometry and large-scale patterns of leaf carbon and nitrogen in the grassland biomes of China, Oecologia, 149, 115–122, https://doi.org/10.1007/s00442-006-0425-0, 2006.
He, J. S., Wang, L., Flynn, D. F., Wang, X., Ma, W., and Fang, J.: Leaf nitrogen:phosphorus stoichiometry across Chinese grassland biomes, Oecologia, 155, 301–310, https://doi.org/10.1007/s00442-007-0912-y, 2008.
He, J. S., Wang, X., Schmid, B., Flynn, D. F., Li, X., Reich, P. B., and Fang, J.: Taxonomic identity, phylogeny, climate and soil fertility as drivers of leaf traits across Chinese grassland biomes, J. Plant Res., 123, 551–561, https://doi.org/10.1007/s10265-009-0294-9, 2010.
Hirose, T. and Werger, M. J. A.: Maximizing daily canopy photosynthesis with respect to the leaf nitrogen allocation pattern in the canopy, Oecologia, 72, 520–526, https://doi.org/10.1007/BF00378977, 1987.
Hoch, G. and Körner, C.: Global patterns of mobile carbon stores in trees at the high-elevation tree line, Global Ecol. Biogeogr., 21, 861–871, https://doi.org/10.1111/j.1466-8238.2011.00731.x, 2012.
Hutchinson, M. F. and Xu, T.: Anusplin Version 4.4 User Guide, Centre for Resource and Environment Studies, Canberra: Australian National University, http://fennerschool.anu.edu.au/files/anusplin44.pdf (last access: 21 August 2020), 2013.
Kikuzawa, K., Onoda, Y., Wright, I. J., and Reich, P. B.: Mechanisms underlying global temperature-related patterns in leaf longevity, Glob. Ecol. Biogeogr., 22, 982–993, https://doi.org/10.1111/geb.12042, 2013.
Körner, C.: The cold range limit of trees, Trend. Ecol. Evol., 36, 979–989, https://doi.org/10.1016/j.tree.2021.06.011, 2021.
Lawrence, D. M., Oleson, K. W., Flanner, M. G., Thornton, P. E., Swenson, S. C., Lawrence, P. J., Zeng, X., Yang, Z.-L., Levis, S., Sakaguchi, K., Bonan, G. B., and Slater, A. G.: Parameterization improvements and functional and structural advances in Version 4 of the Community Land Model, J. Adv. Model. Earth Sy., 3, M03001, https://doi.org/10.1029/2011ms000045, 2011.
Lawrence, D. M., Fisher, R. A., Koven, C. D., Oleson, K. W., Swenson, S. C., Bonan, G., Collier, N., Ghimire, B., van Kampenhout, L., Kennedy, D., Kluzek, E., Lawrence, P. J., Li, F., Li, H., Lombardozzi, D., Riley, W. J., Sacks, W. J., Shi, M., Vertenstein, M., Wieder, W. R., Xu, C., Ali, A. A., Badger, A. M., Bisht, G., van den Broeke, M., Brunke, M. A., Burns, S. P., Buzan, J., Clark, M., Craig, A., Dahlin, K., Drewniak, B., Fisher, J. B., Flanner, M., Fox, A. M., Gentine, P., Hoffman, F., Keppel-Aleks, G., Knox, R., Kumar, S., Lenaerts, J., Leung, L. R., Lipscomb, W. H., Lu, Y., Pandey, A., Pelletier, J. D., Perket, J., Randerson, J. T., Ricciuto, D. M., Sanderson, B. M., Slater, A., Subin, Z. M., Tang, J., Thomas, R. Q., Val Martin, M., and Zeng, X.: The Community Land Model Version 5: Description of New Features, Benchmarking, and Impact of Forcing Uncertainty, J. Adv. Model. Earth Sy., 11, 4245–4287, https://doi.org/10.1029/2018MS001583, 2019.
Li, Y., He, W., Wu, J., Zhao, P., Chen, T., Zhu, L., Ouyang, L., Ni, G., and Hölscher, D.: Leaf stoichiometry is synergistically-driven by climate, site, soil characteristics and phylogeny in karst areas, Southwest China, Biogeochemistry, 155, 283–301, https://doi.org/10.1007/s10533-021-00826-3, 2021.
Lichstein, J. W.: Multiple regression on distance matrices: a multivariate spatial analysis tool, Plant Ecol., 188, 117–131, https://doi.org/10.1007/s11258-006-9126-3, 2006.
Liu, G., Ye, X., Huang, Z., Dong, M., Cornelissen, J. H. C., and Bello, F.: Leaf and root nutrient concentrations and stoichiometry along aridity and soil fertility gradients, J. Veg. Sci., 30, 291–300, https://doi.org/10.1111/jvs.12717, 2019.
Liu, H., Ye, Q., Simpson, K. J., Cui, E., and Xia, J.: Can evolutionary history predict plant plastic responses to climate change?, New Phytol., 235, 1260–1271, https://doi.org/10.1111/nph.18194, 2022.
Luong, J. C., Holl, K. D., and Loik, M. E.: Leaf traits and phylogeny explain plant survival and community dynamics in response to extreme drought in a restored coastal grassland, J. Appl. Ecol., 58, 1670–1680, https://doi.org/10.1111/1365-2664.13909, 2021.
Ma, S., He, F., Tian, D., Zou, D., Yan, Z., Yang, Y., Zhou, T., Huang, K., Shen, H., and Fang, J.: Variations and determinants of carbon content in plants: a global synthesis, Biogeosciences, 15, 693–702, https://doi.org/10.5194/bg-15-693-2018, 2018.
Medvigy, D., Wofsy, S. C., Munger, J. W., Hollinger, D. Y., and Moorcroft, P. R.: Mechanistic scaling of ecosystem function and dynamics in space and time: Ecosystem Demography model version 2, J. Geophys. Res., 114, G01002, https://doi.org/10.1029/2008jg000812, 2009.
Meloni, F., Lopes, N. P., and Varanda, E. M.: The relationship between leaf nitrogen, nitrogen metabolites and herbivory in two species of Nyctaginaceae from the Brazilian Cerrado, Environ. Exp. Bot., 75, 268–276, https://doi.org/10.1016/j.envexpbot.2011.07.010, 2012.
Meng, T. T., Wang, H., Harrison, S. P., Prentice, I. C., Ni, J., and Wang, G.: Responses of leaf traits to climatic gradients: adaptive variation versus compositional shifts, Biogeosciences, 12, 5339–5352, https://doi.org/10.5194/bg-12-5339-2015, 2015.
Meyerholt, J. and Zaehle, S.: The role of stoichiometric flexibility in modelling forest ecosystem responses to nitrogen fertilization, New Phytol., 208, 1042–1055, https://doi.org/10.1111/nph.13547, 2015.
Meyerholt, J., Sickel, K., and Zaehle, S.: Ensemble projections elucidate effects of uncertainty in terrestrial nitrogen limitation on future carbon uptake, Glob. Change Biol., 26, 3978–3996, https://doi.org/10.1111/gcb.15114, 2020.
Moran, E. V., Hartig, F., and Bell, D. M.: Intraspecific trait variation across scales: implications for understanding global change responses, Glob. Change Biol., 22, 137–150, https://doi.org/10.1111/gcb.13000, 2016.
Münkemüller, T., Lavergne, S., Bzeznik, B., Dray, S., Jombart, T., Schiffers, K., and Thuiller, W.: How to measure and test phylogenetic signal, Method. Ecol. Evol., 3, 743–756, https://doi.org/10.1111/j.2041-210X.2012.00196.x, 2012.
Nakagawa, S. and Schielzeth, H.: A general and simple method for obtaining R2 from generalized linear mixed-effects models, Method. Ecol. Evol., 4, 133–142, 2013.
Nakagawa, S., Johnson, P. C., and Schielzeth, H.: The coefficient of determination R2 and intra-class correlation coefficient from generalized linear mixed-effects models revisited and expanded, J. Roy. Soc. Int., 14, 20170213, https://doi.org/10.1098/rsif.2017.0213, 2017.
Niinemets, U., Keenan, T. F., and Hallik, L.: A worldwide analysis of within-canopy variations in leaf structural, chemical and physiological traits across plant functional types, New Phytol., 205, 973–993, https://doi.org/10.1111/nph.13096, 2015.
Niu, S., Song, L., Wang, J., Luo, Y., and Yu, G.: Dynamic carbon-nitrogen coupling under global change, Sci. China Life Sci., 66, 771–782, https://doi.org/10.1007/s11427-022-2245-y, 2023.
Ordoñez, J. C., Van Bodegom, P. M., Witte, J.-P. M., Wright, I. J., Reich, P. B., and Aerts, R.: A global study of relationships between leaf traits, climate and soil measures of nutrient fertility, Glob. Ecol. Biogeogr., 18, 137–149, https://doi.org/10.1111/j.1466-8238.2008.00441.x, 2009.
Paradis, E., Claude, J., and Strimmer, K.: APE: analyses of phylogenetics and evolution in R language, Bioinformatics, 20, 289–290, 2004.
Peng, Y., Bloomfield, K. J., and Prentice, I. C.: A theory of plant function helps to explain leaf-trait and productivity responses to elevation, New Phytol., 226, 1274–1284, https://doi.org/10.1111/nph.16447, 2020.
Prentice, I. C., Dong, N., Gleason, S. M., Maire, V., and Wright, I. J.: Balancing the costs of carbon gain and water transport: testing a new theoretical framework for plant functional ecology, Ecol. Lett., 17, 82–91, https://doi.org/10.1111/ele.12211, 2014.
Qian, H. and Jin, Y.: An updated megaphylogeny of plants, a tool for generating plant phylogenies and an analysis of phylogenetic community structure, J. Plant Ecol., 9, 233–239, https://doi.org/10.1093/jpe/rtv047, 2016.
R Core Team: R: A language and environment for statistical computing. R Foundation for Statistical Computing, Vienna, Austria, https://www.R-project.org/ (last access: 2 September 2023), 2021.
Raggi, V.: Changes in free amino acids and osmotic adjustment in leaves of water-stressed bean, Physiol. Plantarum, 91, 427–434, https://doi.org/10.1111/j.1399-3054.1994.tb02970.x, 1994.
Reich, P. B.: Global biogeography of plant chemistry: filling in the blanks, New Phytol., 168, 263–266, https://doi.org/10.1111/j.1469-8137.2005.01562.x, 2005.
Reich, P. B. and Oleksyn, J.: Global patterns of plant leaf N and P in relation to temperature and latitude, P. Natl. Acad. Sci. USA, 101, 11001–11006, https://doi.org/10.1073/pnas.0403588101, 2004.
Revell, L. J.: phytools: an R package for phylogenetic comparative biology (and other things), Method. Ecol. Evol., 3, 217–223, 2012.
Sack, L. and Scoffoni, C.: Leaf venation: structure, function, development, evolution, ecology and applications in the past, present and future, New Phytol., 198, 983–1000, https://doi.org/10.1111/nph.12253, 2013.
Sardans, J. and Penuelas, J.: Climate and taxonomy underlie different elemental concentrations and stoichiometries of forest species: the optimum “biogeochemical niche”, Plant Ecol., 215, 441–455, https://doi.org/10.1007/s11258-014-0314-2, 2014.
Sardans, J., Vallicrosa, H., Zuccarini, P., Farre-Armengol, G., Fernandez-Martinez, M., Peguero, G., Gargallo-Garriga, A., Ciais, P., Janssens, I. A., Obersteiner, M., Richter, A., and Penuelas, J.: Empirical support for the biogeochemical niche hypothesis in forest trees, Nat. Ecol. Evol., 5, 184–194, https://doi.org/10.1038/s41559-020-01348-1, 2021.
Scoffoni, C., Rawls, M., McKown, A., Cochard, H., and Sack, L.: Decline of leaf hydraulic conductance with dehydration: relationship to leaf size and venation architecture, Plant Physiol., 156, 832–843, https://doi.org/10.1104/pp.111.173856, 2011.
Shangguan, W., Dai, Y., Liu, B., Zhu, A., Duan, Q., Wu, L., Ji, D., Ye, A., Yuan, H., Zhang, Q., Chen, D., Chen, M., Chu, J., Dou, Y., Guo, J., Li, H., Li, J., Liang, L., Liang, X., Liu, H., Liu, S., Miao, C., and Zhang, Y.: A China data set of soil properties for land surface modeling, J. Adv. Model. Earth Sy., 5, 212–224, https://doi.org/10.1002/jame.20026, 2013.
Sistla, S. A. and Schimel, J. P.: Stoichiometric flexibility as a regulator of carbon and nutrient cycling in terrestrial ecosystems under change, New Phytol., 196, 68–78, https://doi.org/10.1111/j.1469-8137.2012.04234.x, 2012.
Smith, B., Wårlind, D., Arneth, A., Hickler, T., Leadley, P., Siltberg, J., and Zaehle, S.: Implications of incorporating N cycling and N limitations on primary production in an individual-based dynamic vegetation model, Biogeosciences, 11, 2027–2054, https://doi.org/10.5194/bg-11-2027-2014, 2014.
Smith, N. G., Keenan, T. F., Colin Prentice, I., Wang, H., Wright, I. J., Niinemets, U., Crous, K. Y., Domingues, T. F., Guerrieri, R., Yoko Ishida, F., Kattge, J., Kruger, E. L., Maire, V., Rogers, A., Serbin, S. P., Tarvainen, L., Togashi, H. F., Townsend, P. A., Wang, M., Weerasinghe, L. K., and Zhou, S. X.: Global photosynthetic capacity is optimized to the environment, Ecol. Lett., 22, 506–517, https://doi.org/10.1111/ele.13210, 2019.
Tang, Z., Xu, W., Zhou, G., Bai, Y., Li, J., Tang, X., Chen, D., Liu, Q., Ma, W., Xiong, G., He, H., He, N., Guo, Y., Guo, Q., Zhu, J., Han, W., Hu, H., Fang, J., and Xie, Z.: Patterns of plant carbon, nitrogen, and phosphorus concentration in relation to productivity in China's terrestrial ecosystems, P. Natl. Acad. Sci. USA, 115, 4033–4038, https://doi.org/10.1073/pnas.1700295114, 2018.
Terrer, C., Jackson, R. B., Prentice, I. C., Keenan, T. F., Kaiser, C., Vicca, S., Fisher, J. B., Reich, P. B., Stocker, B. D., Hungate, B. A., Peñuelas, J., McCallum, I., Soudzilovskaia, N. A., Cernusak, L. A., Talhelm, A. F., Van Sundert, K., Piao, S., Newton, P. C. D., Hovenden, M. J., Blumenthal, D. M., Liu, Y. Y., Müller, C., Winter, K., Field, C. B., Viechtbauer, W., Van Lissa, C. J., Hoosbeek, M. R., Watanabe, M., Koike, T., Leshyk, V. O., Polley, H. W., and Franklin, O.: Nitrogen and phosphorus constrain the CO2 fertilization of global plant biomass, Nat. Clim. Change, 9, 684–689, https://doi.org/10.1038/s41558-019-0545-2, 2019.
Vallicrosa, H., Sardans, J., Maspons, J., Zuccarini, P., Fernandez-Martinez, M., Bauters, M., Goll, D. S., Ciais, P., Obersteiner, M., Janssens, I. A., and Penuelas, J.: Global maps and factors driving forest foliar elemental composition: the importance of evolutionary history, New Phytol., 233, 169–181, https://doi.org/10.1111/nph.17771, 2021.
Violle, C., Enquist, B. J., McGill, B. J., Jiang, L., Albert, C. H., Hulshof, C., Jung, V., and Messier, J.: The return of the variance: intraspecific variability in community ecology, Trend. Ecol. Evol., 27, 244–252, https://doi.org/10.1016/j.tree.2011.11.014, 2012.
Wang, H., Prentice, I. C., Keenan, T. F., Davis, T. W., Wright, I. J., Cornwell, W. K., Evans, B. J., and Peng, C.: Towards a universal model for carbon dioxide uptake by plants, Nat. Plant., 3, 734–741, https://doi.org/10.1038/s41477-017-0006-8, 2017.
Wang, H., Harrison, S. P., Prentice, I. C., Yang, Y., Bai, F., Togashi, H. F., Wang, M., Zhou, S., and Ni, J.: The China plant trait database: Toward a comprehensive regional compilation of functional traits for land plants, Ecology, 99, 500–500, https://doi.org/10.1002/ecy.2091, 2018.
Wang, H., Harrison, S. P., Li, M., Prentice, I. C., Qiao, S., Wang, R., Xu, H., Mengoli, G., Peng, Y., and Yang, Y.: The China plant trait database version 2, Sci. Data, 9, 769, https://doi.org/10.1038/s41597-022-01884-4, 2022 (data available at https://figshare.com/articles/dataset/The_China_Plant_Trait_Database_Version_2_0/19448219, last access: 5 March 2022).
Wang, H., Harrison, S. P., Li, M., Prentice, I. C., Qiao, S., Wang, R., Xu, H., Mengoli, G., Peng, Y., and Yang, Y.: The China plant trait database version 2, Sci. Data, 9, 769, https://doi.org/10.1038/s41597-022-01884-4, 2022.
Wang, H., Prentice, I. C., Wright, I. J., Warton, D. I., Qiao, S., Xu, X., Zhou, J., Kikuzawa, K., and Stenseth, N. C.: Leaf economics fundamentals explained by optimality principles, Sci. Adv., 9, eadd5667, https://doi.org/10.1126/sciadv.add5667, 2023.
Wang, Y. P., Law, R. M., and Pak, B.: A global model of carbon, nitrogen and phosphorus cycles for the terrestrial biosphere, Biogeosciences, 7, 2261–2282, https://doi.org/10.5194/bg-7-2261-2010, 2010.
Weih, M. and Karlsson, P. S.: Growth response of Mountain birch to air and soil temperature: is increasing leaf-nitrogen content an acclimation to lower air temperature?, New Phytol., 150, 147–155, https://doi.org/10.1046/j.1469-8137.2001.00078.x, 2001.
Westerband, A. C., Funk, J. L., and Barton, K. E.: Intraspecific trait variation in plants: a renewed focus on its role in ecological processes, Ann. Bot., 127, 397–410, https://doi.org/10.1093/aob/mcab011, 2021.
Westoby, M., Leishman, M. R., and Lord, J. M.: On misinterpreting thephylogenetic correction', J. Ecol., 83, 531–534, 1995.
Wiltshire, A. J., Burke, E. J., Chadburn, S. E., Jones, C. D., Cox, P. M., Davies-Barnard, T., Friedlingstein, P., Harper, A. B., Liddicoat, S., Sitch, S., and Zaehle, S.: JULES-CN: a coupled terrestrial carbon–nitrogen scheme (JULES vn5.1), Geosci. Model Dev., 14, 2161–2186, https://doi.org/10.5194/gmd-14-2161-2021, 2021.
Wright, I. J., Reich, P. B., Westoby, M., Ackerly, D. D., Baruch, Z., Bongers, F. J. J. M., Cavenderbares, J., Chapin, T., Cornelissen, J. H. C., and Diemer, M.: The worldwide leaf economics spectrum, Nature, 428, 821–827, 2004.
Xing, K., Niinemets, Ü., Rengel, Z., Onoda, Y., Xia, J., Chen, H. Y. H., Zhao, M., Han, W., and Li, H.: Global patterns of leaf construction traits and their covariation along climate and soil environmental gradients, New Phytol., 232, 1648–1660, https://doi.org/10.1111/nph.17686, 2021.
Xiong, J., Dong, L., Lu, J., Hu, W., Gong, H., Xie, S., Zhao, D., Zhang, Y., Wang, X., Deng, Y., Ran, J., Niklas, K. J., Degen, A., and Deng, J.: Variation in plant carbon, nitrogen and phosphorus contents across the drylands of China, Funct. Ecol., 36, 174–186, https://doi.org/10.1111/1365-2435.13937, 2021.
Xu, H., Wang, H., Prentice, I. C., Harrison, S. P., Wang, G., and Sun, X.: Predictability of leaf traits with climate and elevation: a case study in Gongga Mountain, China, Tree Physiol., 41, 1336–1352, https://doi.org/10.1093/treephys/tpab003, 2021.
Yang, X., Chi, X., Ji, C., Liu, H., Ma, W., Mohhammat, A., Shi, Z., Wang, X., Yu, S., Yue, M., and Tang, Z.: Variations of leaf N and P concentrations in shrubland biomes across northern China: phylogeny, climate, and soil, Biogeosciences, 13, 4429–4438, https://doi.org/10.5194/bg-13-4429-2016, 2016.
Yao, G. Q., Nie, Z. F., Turner, N. C., Li, F. M., Gao, T. P., Fang, X. W., and Scoffoni, C.: Combined high leaf hydraulic safety and efficiency provides drought tolerance in Caragana species adapted to low mean annual precipitation, New Phytol., 229, 230–244, https://doi.org/10.1111/nph.16845, 2021.
Yu, G., Smith, D. K., Zhu, H., Guan, Y., and Lam, T. T. Y.: ggtree: an R package for visualization and annotation of phylogenetic trees with their covariates and other associated data, Method. Ecol. Evol., 8, 28–36, 2017.
Zaehle, S., Medlyn, B. E., De Kauwe, M. G., Walker, A. P., Dietze, M. C., Hickler, T., Luo, Y., Wang, Y. P., El-Masri, B., Thornton, P., Jain, A., Wang, S., Warlind, D., Weng, E., Parton, W., Iversen, C. M., Gallet-Budynek, A., McCarthy, H., Finzi, A., Hanson, P. J., Prentice, I. C., Oren, R., and Norby, R. J.: Evaluation of 11 terrestrial carbon-nitrogen cycle models against observations from two temperate Free-Air CO2 Enrichment studies, New Phytol., 202, 803–822, https://doi.org/10.1111/nph.12697, 2014.
Zhang, J., Zhao, N., Liu, C., Yang, H., Li, M., Yu, G., Wilcox, K., Yu, Q., He, N., and Niu, S.: C:N:P stoichiometry in China's forests: From organs to ecosystems, Funct. Ecol., 32, 50–60, https://doi.org/10.1111/1365-2435.12979, 2017.
Zhang, J., He, N., Liu, C., Xu, L., Chen, Z., Li, Y., Wang, R., Yu, G., Sun, W., Xiao, C., Chen, H. Y. H., and Reich, P. B.: Variation and evolution of C:N ratio among different organs enable plants to adapt to N-limited environments, Glob. Change Biol., 26, 2534–2543, https://doi.org/10.1111/gcb.14973, 2019.
Zhang, S.-B., Zhang, J.-L., Slik, J. W. F., and Cao, K.-F.: Leaf element concentrations of terrestrial plants across China are influenced by taxonomy and the environment, Glob. Ecol. Biogeogr., 21, 809–818, https://doi.org/10.1111/j.1466-8238.2011.00729.x, 2012.
Zhao, W., Reich, P. B., Yu, Q., Zhao, N., Yin, C., Zhao, C., Li, D., Hu, J., Li, T., Yin, H., and Liu, Q.: Shrub type dominates the vertical distribution of leaf stoichiometry across an extensive altitudinal gradient, Biogeosciences, 15, 2033–2053, https://doi.org/10.5194/bg-15-2033-2018, 2018.