the Creative Commons Attribution 4.0 License.
the Creative Commons Attribution 4.0 License.
 | 30 Nov 2023
Marked recent declines in boron in Baltic Sea cod otoliths – a bellwether of incipient acidification in a vast hypoxic system?
Yvette Heimbrand
Karol Kuliński
Ocean acidification is spreading globally as a result of anthropogenic CO2 emissions, but the Baltic Sea has until recently been thought to be relatively well-buffered by terrigenous inputs of alkalinity from its watershed. We discovered a 3- to 5-fold decline in boron (as B : Ca) in otoliths of eastern Baltic cod (EBC) between the late 1990s and 2021. Examining a time series of EBC otoliths, we found varying levels of B : Ca starting in the 1980s, with the most recent years showing an all-time low for this period. This trend correlates with declines in pH and dissolved oxygen but not with changes in salinity. We examined possible physiological influences on B : Ca by including a collection of Icelandic cod as an “out-group”. Icelandic cod otoliths showed strongly positive correlations of B : Ca with physiologically regulated P : Ca; this was not the case for EBC. Finally, B : Ca in EBC otoliths is negatively correlated, to some extent, with Mn : Mg, a proposed proxy for hypoxia exposure. This negative relationship is hypothesized to reflect the dual phenomena of hypoxia and acidification as a result of decomposition of large algal blooms. Taken together, the otolith biomarkers Mn : Mg and B : Ca in cod suggest a general increase in both hypoxia and acidification within the Baltic intermediate and deep waters in the last decade.
- Article
(5011 KB) - Full-text XML
-
Supplement
(435 KB) - BibTeX
- EndNote


Ocean acidification, a known result of greenhouse gas emissions of CO2 loading in the oceans, is highly variable in its distribution in the world's oceans (Doney et al., 2009). This is true in shallow coastal seas such as the brackish Baltic Sea, where in some locations surface pCO2 values in winter greatly exceed other coastal regions (Reusch et al., 2018), but buffering can occur from river inputs bearing proton acceptors weathered from rock and soil (Müller et al., 2016; Kuliński et al., 2017). Alkalinity, defined as the sum of acid neutralizing compounds, is a complicated mix in the Baltic Sea (Kuliński et al., 2022). In the northern Baltic, i.e., the Bothnian Sea, total alkalinity (AT) is low as it is largely driven by AT-poor riverine inputs from the Scandinavian Peninsula, which is built mostly of granite. In the southern and central Baltic, AT is higher due to salt inputs from the North Sea, the influence of AT-rich continental rivers, and an additional contribution from internal cycling of carbon as algal blooms decompose in anoxic conditions (Kuliński et al., 2022). Despite buffering from alkalinity sources, pH is highly variable in space and time with its recent tendency to decline at greater depths in many parts of the Baltic Sea (Kuliński et al., 2022). This decline is associated with the ongoing eutrophication and higher vertical export of organic matter that also leads to worsening deoxygenation (Kuliński et al., 2022).
The population of the eastern Baltic cod (Gadus morhua, hereafter referred to as EBC) has been severely impacted by a number of factors, including past overfishing, hypoxia, parasite infections, and seal predation (Eero et al., 2020), leading to reduced growth and age at maturity (Eero et al., 2015; ICES, 2019). Cod exposed to hypoxia were shown to have lower growth rates and worsened body condition, quantified by the Fulton K index of weight : length ratio (Casini et al., 2016; Limburg and Casini, 2018).
Recent studies that reported links between hypoxia exposure and body condition have relied on the measurement of trace elements in fish otoliths (ear stones). Briefly, otoliths, the calcified structures that form part of the hearing/balance system in teleost fishes, are sectioned with a diamond saw, polished smooth, and then analyzed by ablating micro-transects along the major growth axis and analyzing by using mass spectrometry (see Sect. 2). Hypoxia exposure was quantified by means of a proxy developed from analyzing manganese concentrations in otoliths (Limburg et al., 2015), through its ratio with magnesium, which corrects for growth influences on Mn uptake since both are affected by growth but only manganese is affected directly by hypoxic conditions (Limburg et al., 2018; Limburg and Casini, 2018). The resulting elemental data are lifetime concentration histories, being incorporated at the time of exposure. The use of otolith manganese to track hypoxia exposure is one of the emerging biomarkers in fisheries ecology (Reis-Santos et al., 2022).
Recently, with acquisition of more sensitive instrumentation, we began to experiment with quantifying elements having sub-ppm concentrations in cod otoliths, including the trace element boron. Interestingly, preliminary results from this work showed elevated levels of boron in 2000 but not in 2019. Boron is noteworthy because it is an indicator of salinity. Specifically, boron in seawater generally correlates with salinity (Kuliński et al., 2017) predominantly in the form of weak boric acid (H3BO3) at standard seawater salinity (35 PSU) and pH of 8. However, the dissociated anion borate B(OH) is positively, nonlinearly correlated with pH (Yu and Elderfield, 2007). Borate is the dominant form incorporated in carbonates such as limestones, foraminifera, and corals in proportion to pH (Yu and Elderfield, 2007; Hönisch et al., 2012; Levin et al., 2015) and is often confirmed by δ11B analysis, since it has a large negative fractionation compared to boric acid. However, even bulk boron, as B : Ca ratios, has been found to correlate positively (and linearly) with pH in foraminifera (Yu and Elderfield, 2007), albeit in a species-specific manner.
We measured sub-ppm to low-ppm concentrations of B (ca. 0.5–5 ppm; see Sect. 2) in otoliths of EBC captured in 2000 that showed what appeared to be seasonal variations (example shown in Fig. 1a), albeit not in synchrony with other elements that have proven useful to age cod (Heimbrand et al., 2020). It was therefore surprising when we began to analyze otoliths of EBC captured in 2019 and discovered greatly reduced concentrations (Fig. 1b). The measurements were repeated for verification.
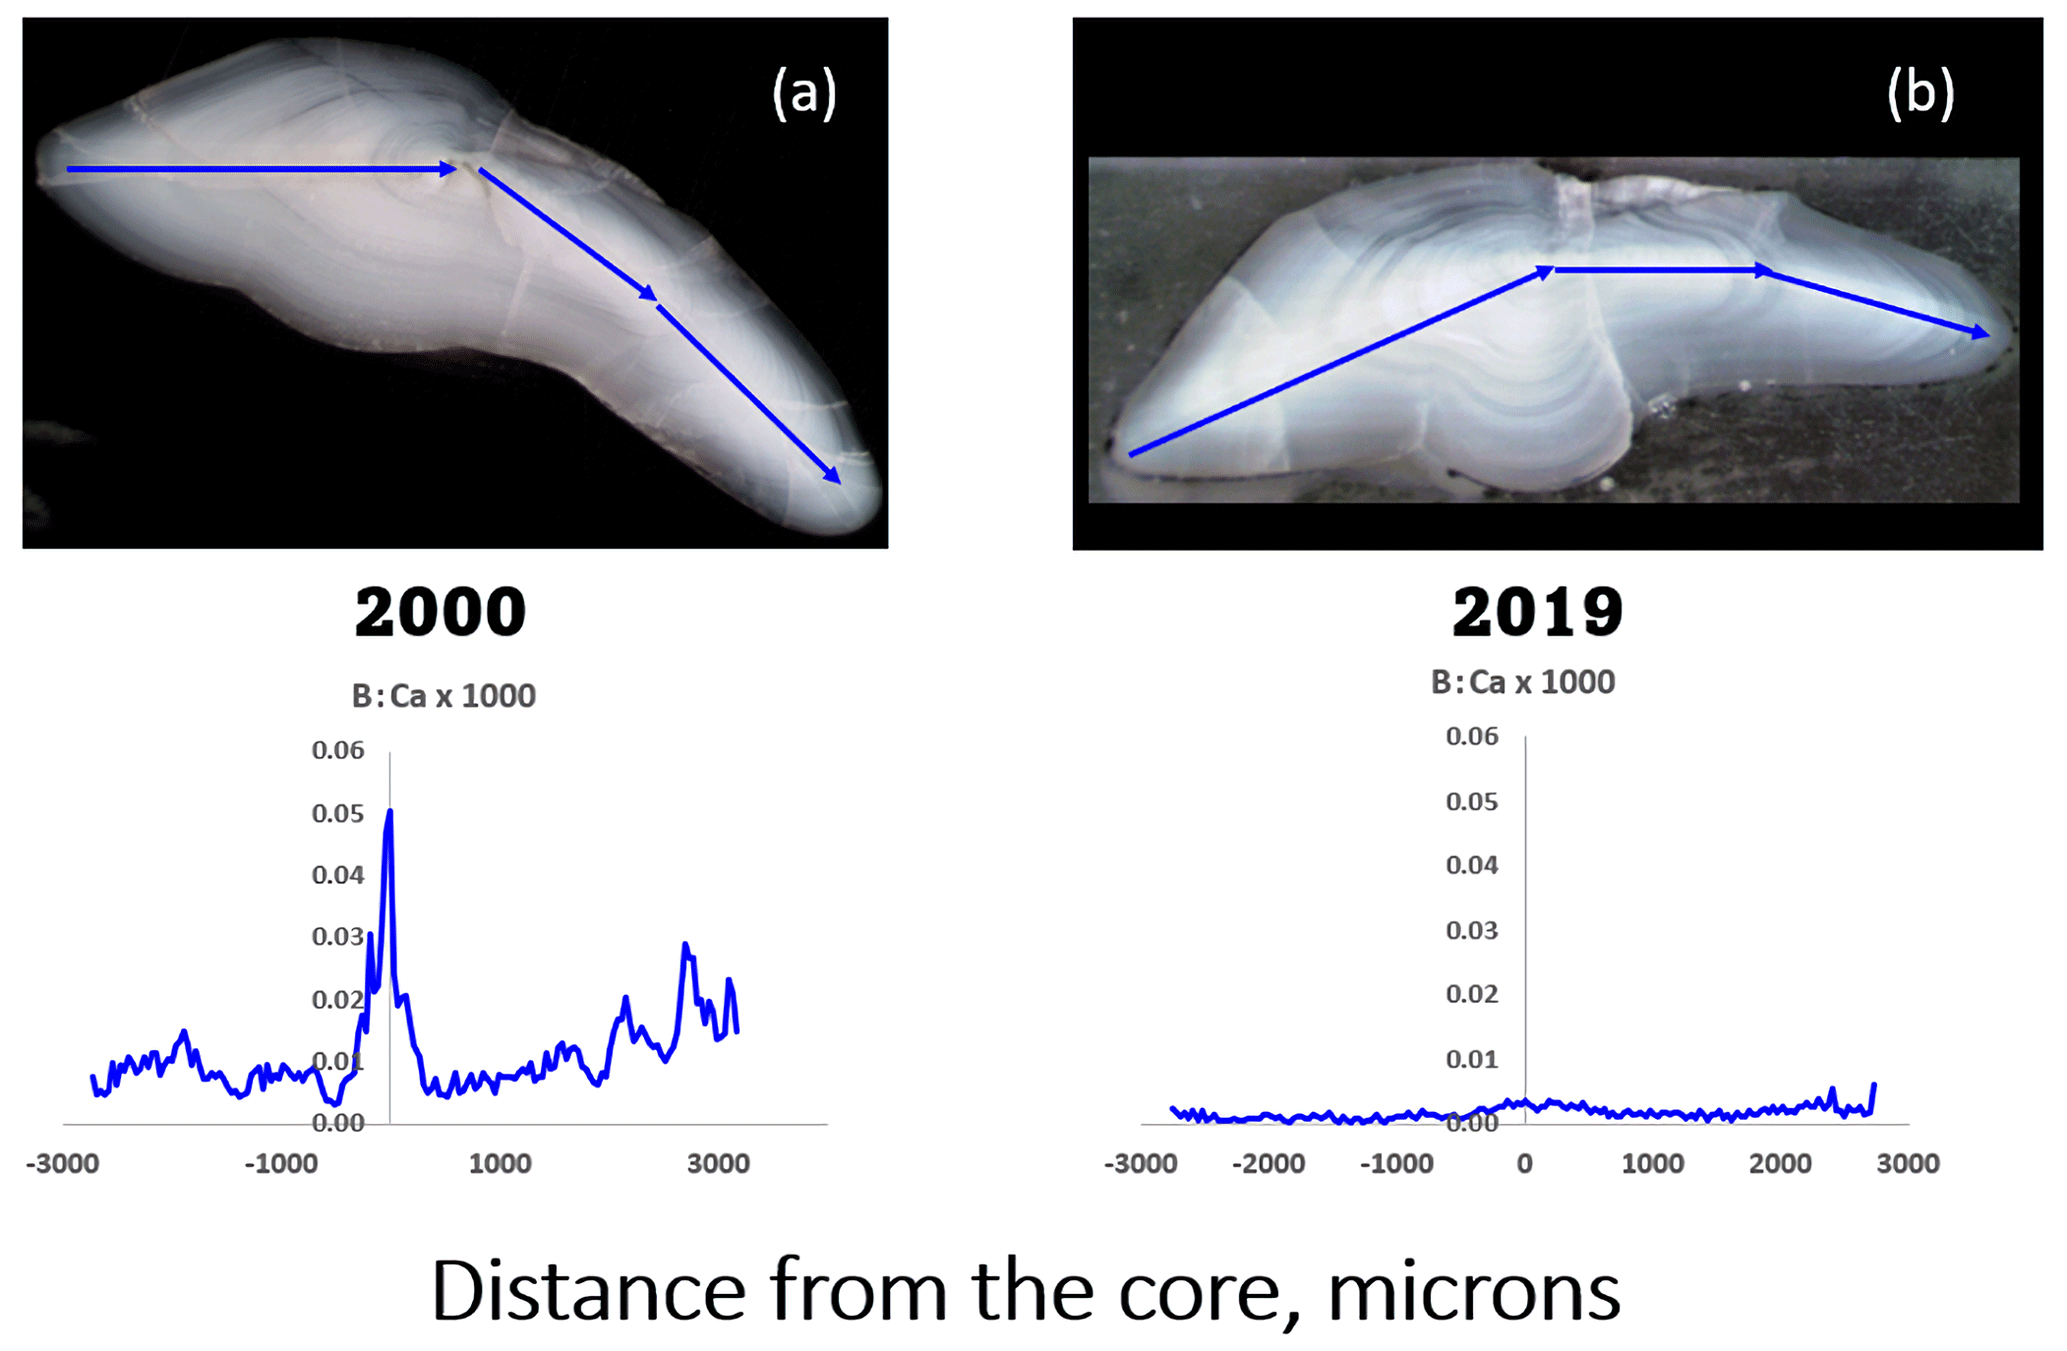
Figure 1Comparison of transect analyses of boron (in its ratio to calcium, mass basis) in sectioned Baltic cod otoliths. Transects were ablated from the ventral edge, through the core, and out to the dorsal edge (arrows on photos). (a) Fish captured in March 2000, age 3, length 46 cm; mean [B] = 3.56 ppm ± 0.156 (SE). (b) Fish captured in November 2019, age 2, length 40 cm, mean [B] = 0.791 ppm ± 0.033 (SE). Both came from the same part of the Baltic Sea (ICES subdivision SD25, see Fig. 2).
With such differences suggestive of change, we returned to an archive of otoliths used for another project (Limburg and Casini, 2018), as well as adding previously un-analyzed otoliths, to develop a time series of otolith B : Ca.
In this study, we explored the extent to which otolith B : Ca varied through time and whether its values were correlated with pH, salinity, or other otolith-derived values that are proxies for environmental or physiological factors. In particular, otolith P : Ca is known to be physiologically influenced (Thomas et al., 2017; Heimbrand et al., 2020). In cod, higher values of P : Ca occur during the growing season and are thus hypothesized to be associated with growth and other activities. We selected this as well as our proxy for hypoxia exposure, otolith Mn : Mg, and posed the following questions.
-
What are the temporal trends in otolith boron (as B : Ca ratios)?
-
How do B : Ca ratios correlate with trends in water chemistry, particularly salinity and pH?
-
If pH declines are associated with hypoxia, do we see a correlation of B : Ca with our hypoxia proxy, manganese : magnesium (Mn : Mg)?
-
If there are any physiological influences, do we see a correlation of B : Ca with elemental ratios known to be physiologically controlled, e.g., phosphorus : calcium (P : Ca)?
2.1 Otolith collections and microchemical analysis
Otoliths of Baltic cod (N=156) were obtained from both fishery-independent and fishery-dependent surveys conducted by the Swedish Fisheries Board and its successor, the Department of Aquatic Resources, Swedish University of Agricultural Sciences. Fish were collected from ICES sub-divisions (SD) 24, 25, 27, and 28 (Fig. 2), spanning the period 1988–2021. To construct the time series, we selected previously analyzed (but not for B : Ca) otoliths that were comparable in age range to those collected in 2019–2021. All otoliths were measured, weighed, and subsequently embedded in epoxy (Struers EpoFix) and sectioned transversely to expose the core. They were smoothed with a succession of lapping films to 3 µm.
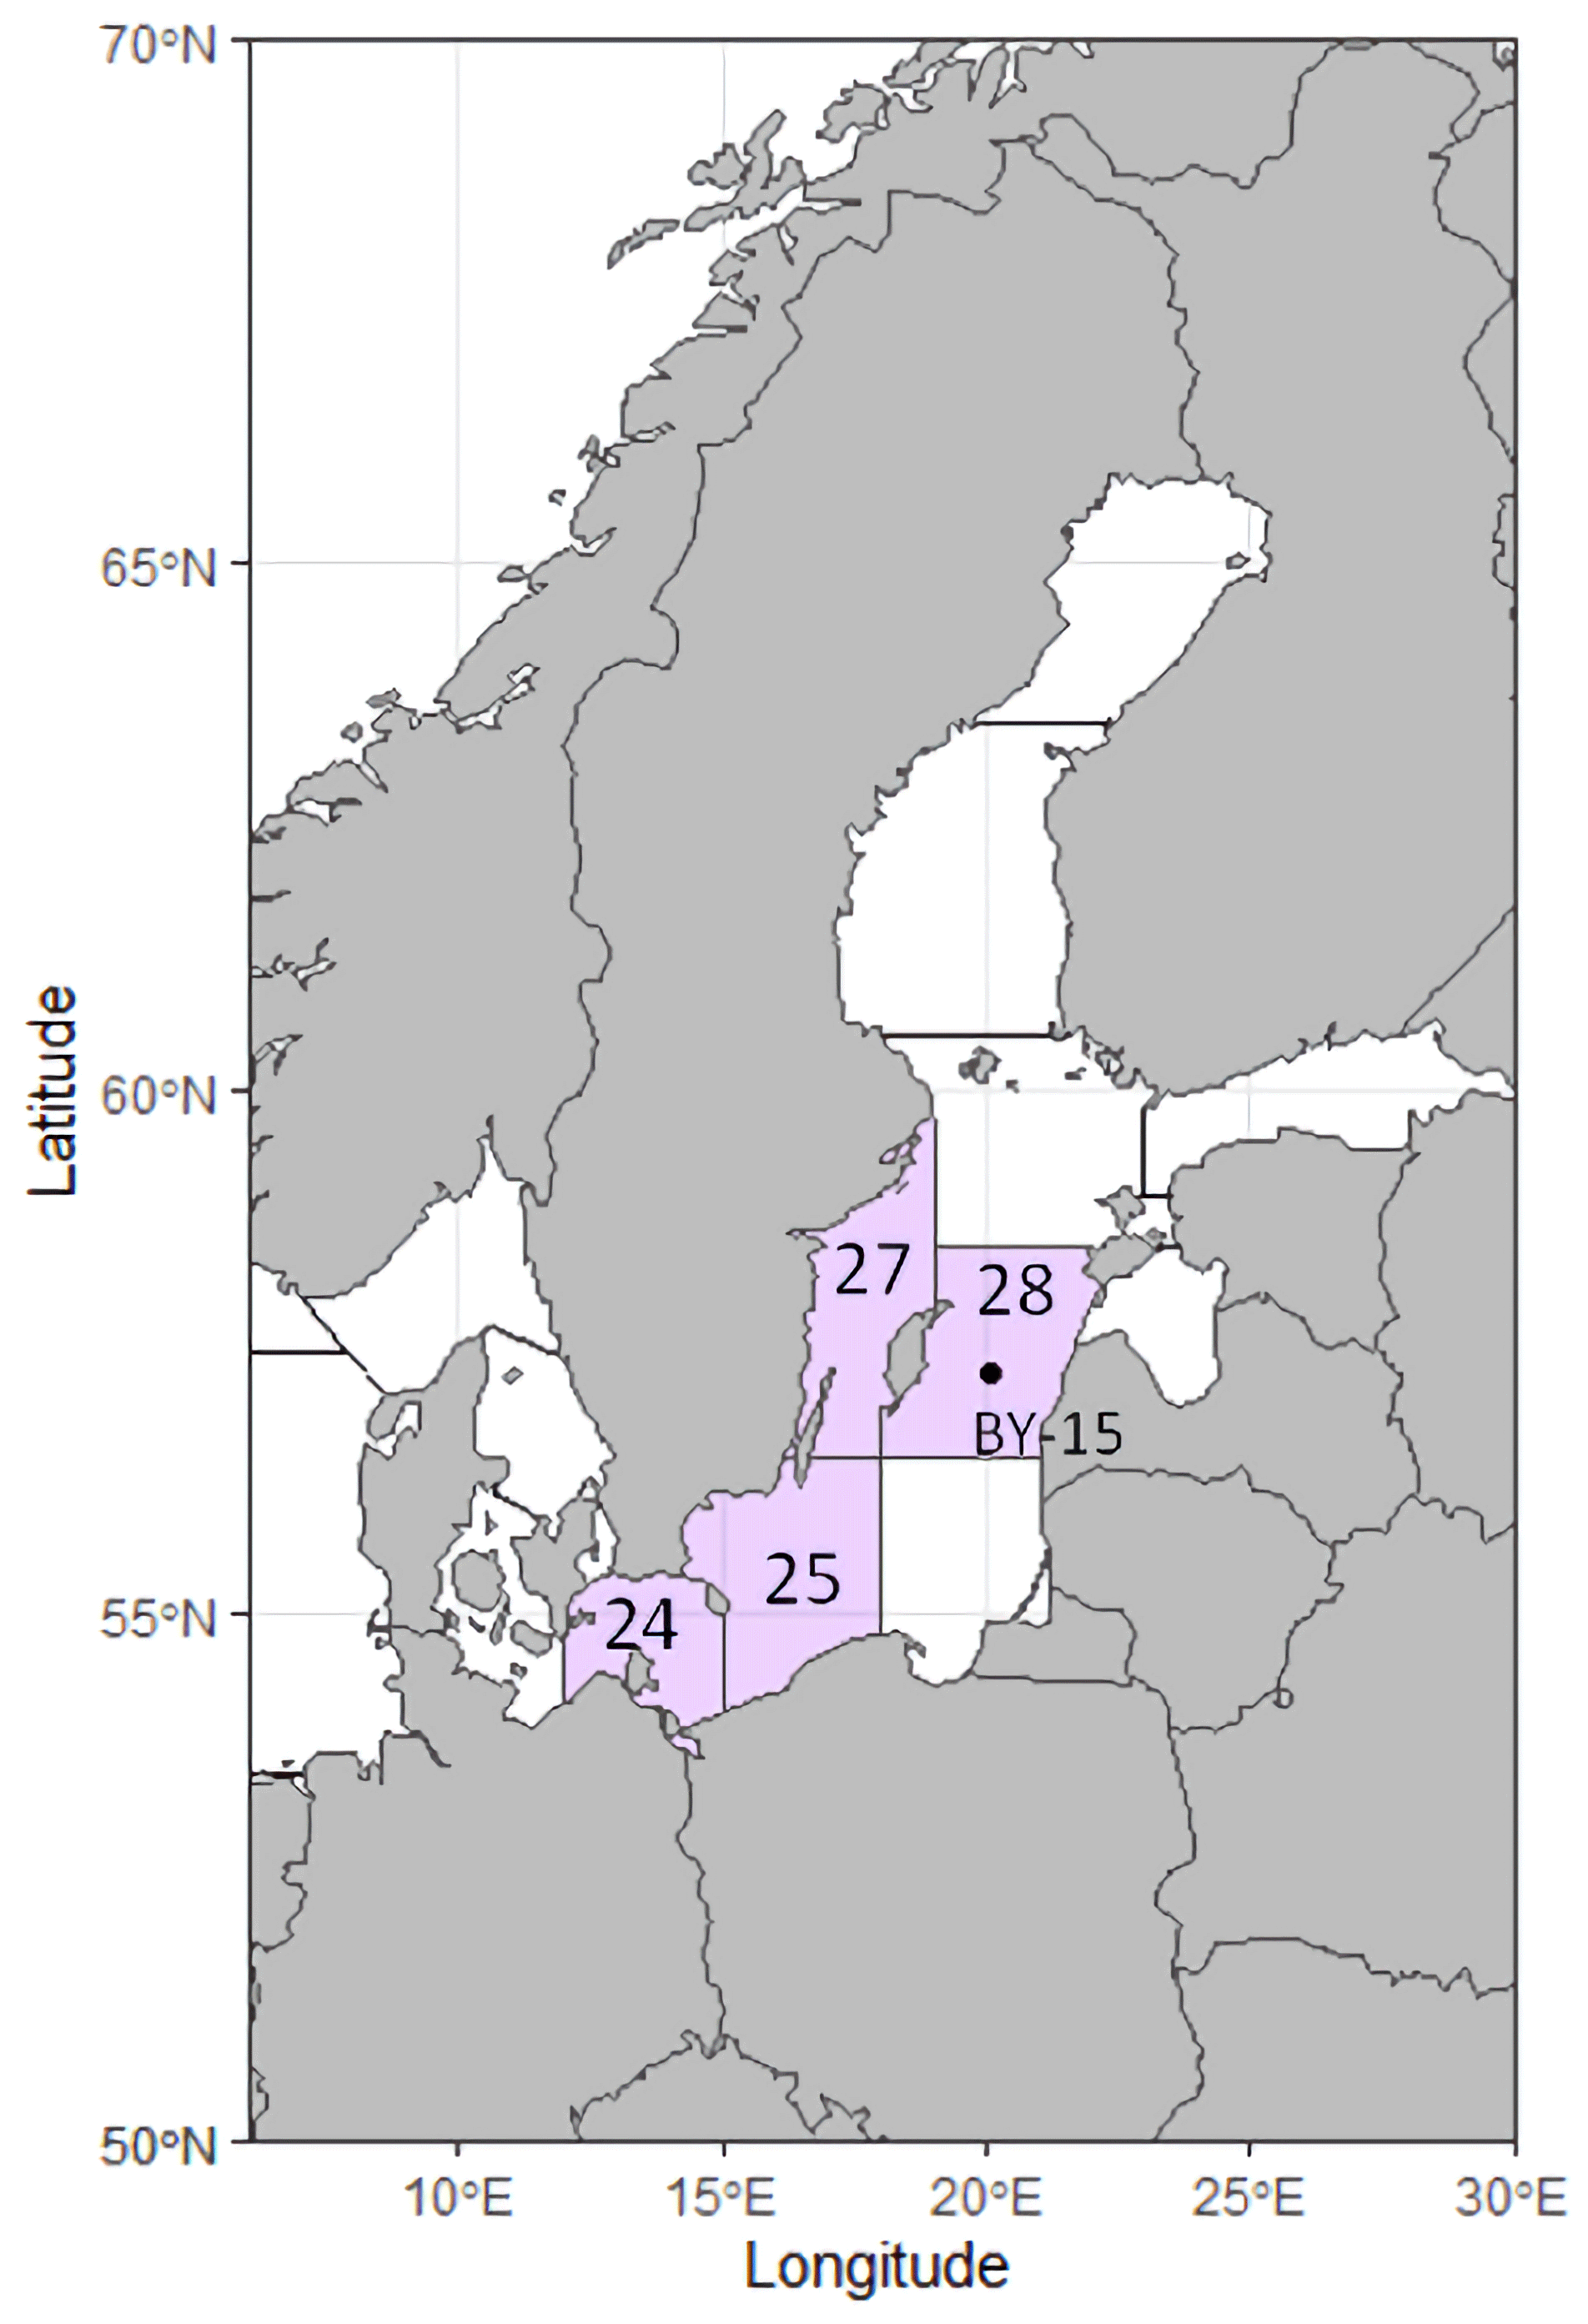
Figure 2Map of the Baltic Sea region, showing the ICES subdivisions from where otoliths were sampled in purple. The black dot marks water monitoring station BY-15, located in the Gotland Deep.
In addition, cod otoliths (N=14) were obtained from fishery-independent surveys from Iceland (ICES SD 5a), as an “out-group” for studies of possible physiological correlations. This part of the North Atlantic does not have hypoxia or acidification issues in deep waters. The Icelandic otoliths were prepared and analyzed in similar fashion.
Baltic cod were aged by examining seasonal patterns in otolith Mg : Ca and P : Ca, following Heimbrand et al. (2020). Icelandic cod were also aged by otolith chemistry, although several of them had been previously aged visually by age readers in Iceland. For the latter otoliths, the seasonal chemical patterns produced age estimations that matched exactly with the visual estimates.
Chemical analyses were performed with laser ablation inductively coupled plasma mass spectrometry (LA-ICP-MS) by the Analytical and Technical Services group at the College of Environmental Science and Forestry, State University of New York. Otoliths were ablated with a 192 nm laser ablation unit (Teledyne Cetac Excite 2) along transects as illustrated in Fig. 1; the ablated material was transported via an Ar–He carrier gas mixture into a Thermo iCAP TQ plasma mass spectrometer, where isotopes were quantified (11B, 25Mg, 31P, 43Ca, 55Mn, 63Cu, 66Zn, 88Sr, 127I, 138Ba, and 208Pb). Daily performance of the system was optimized with the NIST 612 glass standard, and U.S. Geological Survey standards MACS-3, MAPS-4, and MAPS-5 were used for calibration and drift correction. The micro-analytical phosphate standards (MAPS), while showing good matching with the otolith matrix, were slightly softer and were therefore ablated at higher energy (25 % power, 2.03 J cm−2 fluence) than the otoliths (20 % power, 1.62 J cm−2) in order to achieve an otolith calcium value around 38 wt %. Transects were made with 110 µm diameter ablation spots at a speed of 7 µm s−1. Although edge-to-edge laser transects were often made (to check for symmetry), only data collected on the dorsal (longer) axis were used in our analysis due to greater spatial resolution. Once the data were reduced, annual mean values were parsed by the age determination technique in Heimbrand et al. (2020), i.e., averages within annual growth rings were calculated. These were matched to corresponding calendar years.
2.2 Water data
Water property data (temperature (T, ∘C), salinity (S, PSU), dissolved oxygen (DO, mL L−1), pH, and total alkalinity (AT, mmol L−1)) were downloaded from the Swedish Meteorological and Hydrological Institute's database, SHARKWeb (https://sharkweb.smhi.se/, last access: 23 December 2021). Station BY-15, Gotland Deep, was selected as being representative of the central Baltic (Fig. 2) and having one of the longest and most detailed time series. We selected depths that corresponded to where cod had been found in fishery-independent surveys (Casini et al., 2021). Between 1985 and 1995, we averaged water data from 30 to 60 m and from 1996 onward, between 40 and 75 m. Annual mean water values were computed and matched to corresponding otolith chemistry data (annual means of element : Ca data parsed to calendar years as described above).
2.3 Analysis
Visualization (graphs) and statistical analyses were performed in Excel, R (base R, R Core Team, 2022; and ggplot2, Wickham, 2016), and JMP version 17.0 (JMP, 1989–2022). Statistical analyses were separated into examination of the relationships of B : Ca values with potential environmental drivers (primarily pH and S but also AT, DO, and T) and with the internal variables P : Ca and Mn : Mg. For the environmental drivers, a principal component analysis (PCA) was first performed to examine relationships among them. Thereafter, B : Ca was regressed on the first principal component eigenvector to test for its relationship with the main drivers. This was followed by mixed linear models of environmental drivers on B : Ca, with each fish's age (nested within fish ID) being treated as a random effect. This analysis took account of repeated measures within the same individual and was intended to examine more closely the effect of individual drivers.
For the internal variables, the P : Ca and Mn : Mg transect data were regressed on corresponding B : Ca for each fish, and the slopes, intercepts, and R2 values were calculated. These were examined for trends by decade (1980s, 1990s, 2000s, and 2010s) as well as compared with the Icelandic out-group. Positive correlations with P : Ca would suggest a physiological influence on B : Ca incorporation, whereas negative correlations with Mn : Mg would suggest a linkage between B : Ca as an indicator of pH and our indicator of hypoxia exposure (cf. Cavole, 2021). These were tested using ANOVA with slopes as the dependent variable and decades (for the Baltic Sea) and Iceland as grouping variables.
3.1 Trends in water variables
A principal component analysis of the water variables found that the first two components explained 92.9 % of the variance (72.4 % by PC1 and 20.5 % by PC2). The analysis showed three groupings: (1) DO and pH, which were opposite to (2) salinity and AT, respectively; (3) temperature was on a separate axis (Fig. S1 in the Supplement). Linear regression of B : Ca on the first principal component yielded a negative relation (B : Ca = 0.000485(PC1) + 0.00246, R2=0.21, p<0.0001).
Examination of the long-term time series of data from station BY-15 shows that while temperature generally increased (Fig. 3a), the other water variables showed very nonlinear patterns (Fig. 3b–e). Alkalinity is in part a function of salinity; dividing AT by S produces a time series showing a dramatic state change around 1990 (Fig. 3f), particularly in the water layers occupied by cod. Despite the increasing AT, pH has declined more or less monotonically at midwater depths (40–75 m, Fig. 3c).
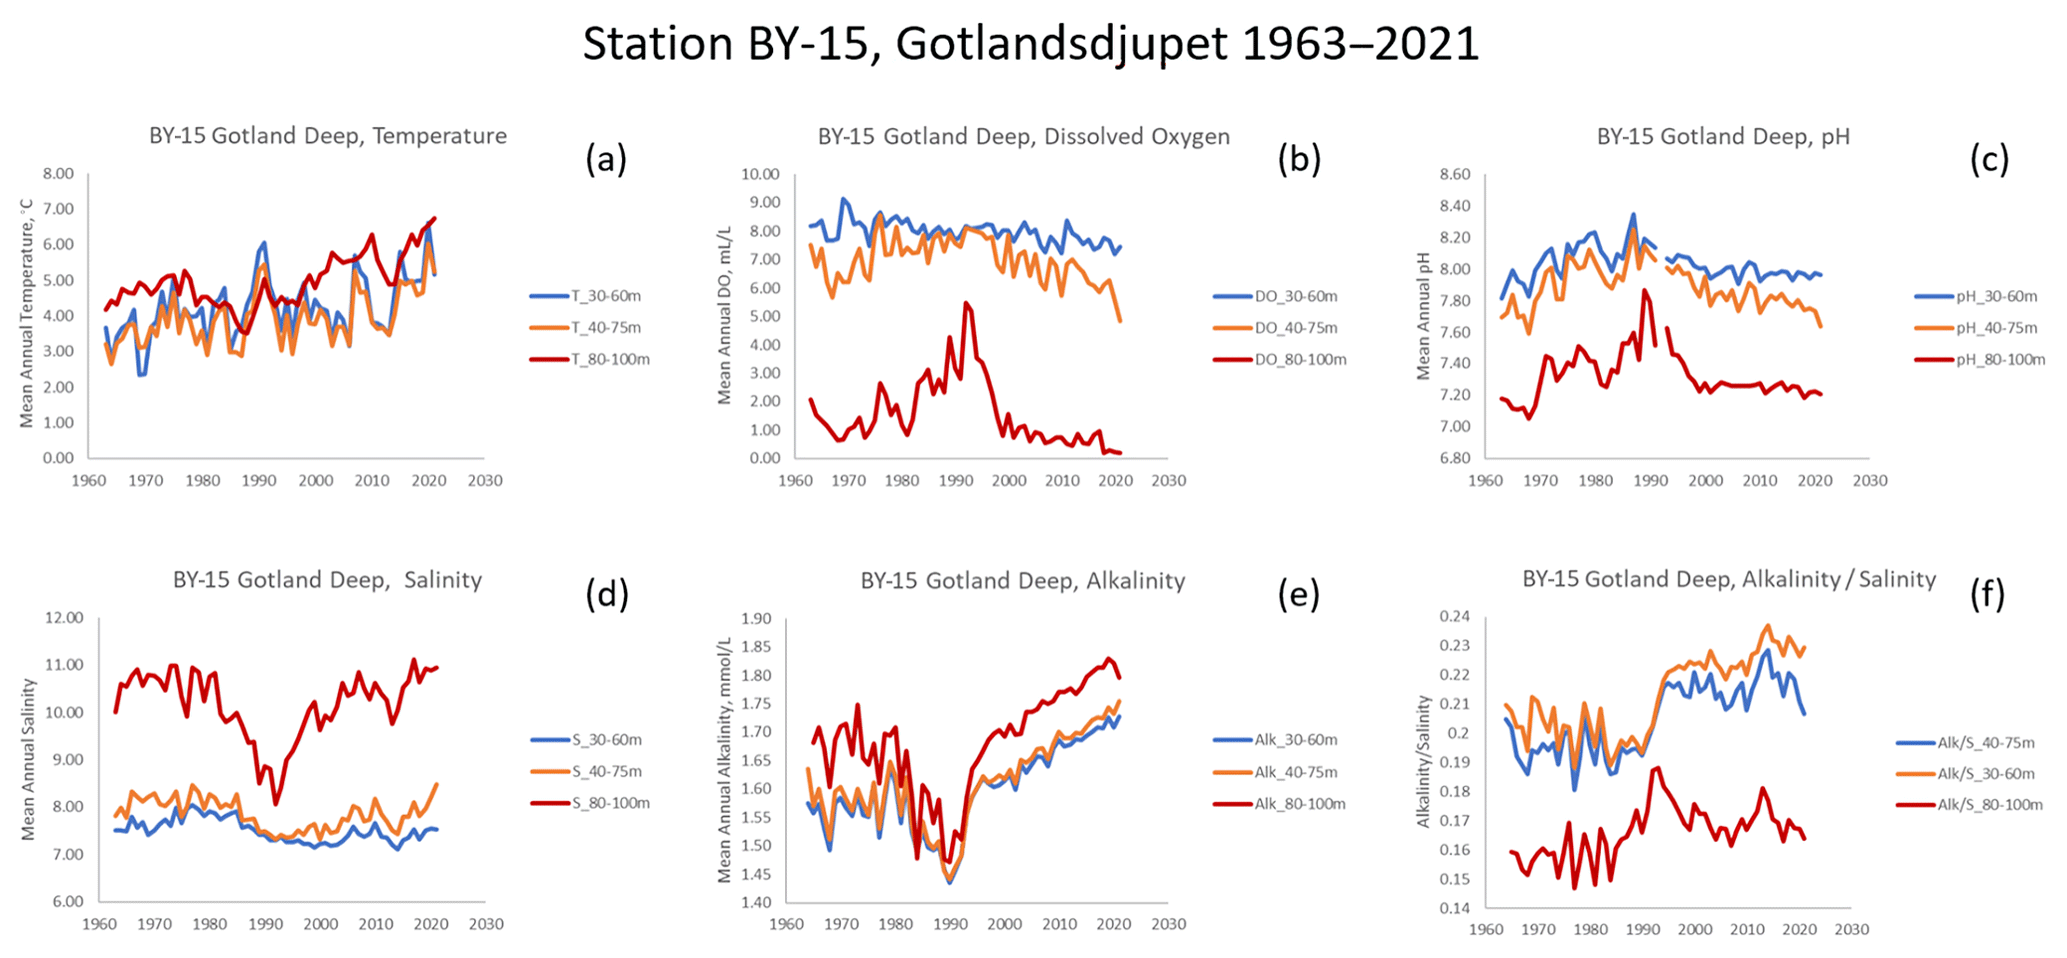
Figure 3Time series of water data for three depth zones, Gotland Deep station BY-15. (a) Temperature. (b) Dissolved oxygen. (c) pH. (d) Salinity. (e) Total alkalinity. (f) Alkalinity normalized to salinity.
3.2 Trends in otolith B : Ca with salinity and pH
Over the period 1985–2019, box plots of B : Ca by year show a pattern of increase toward a maximum, albeit with great variation, in the late 1990s, followed by gradual decline (Fig. 4). Visual comparisons with salinity and pH show that neither explain all the variation in B : Ca, but since 2000, pH and B : Ca have both trended downward whereas salinity has increased. The increase in B : Ca in 2021 is from age 0, which is elevated relative to older ages (see Fig. 1a).
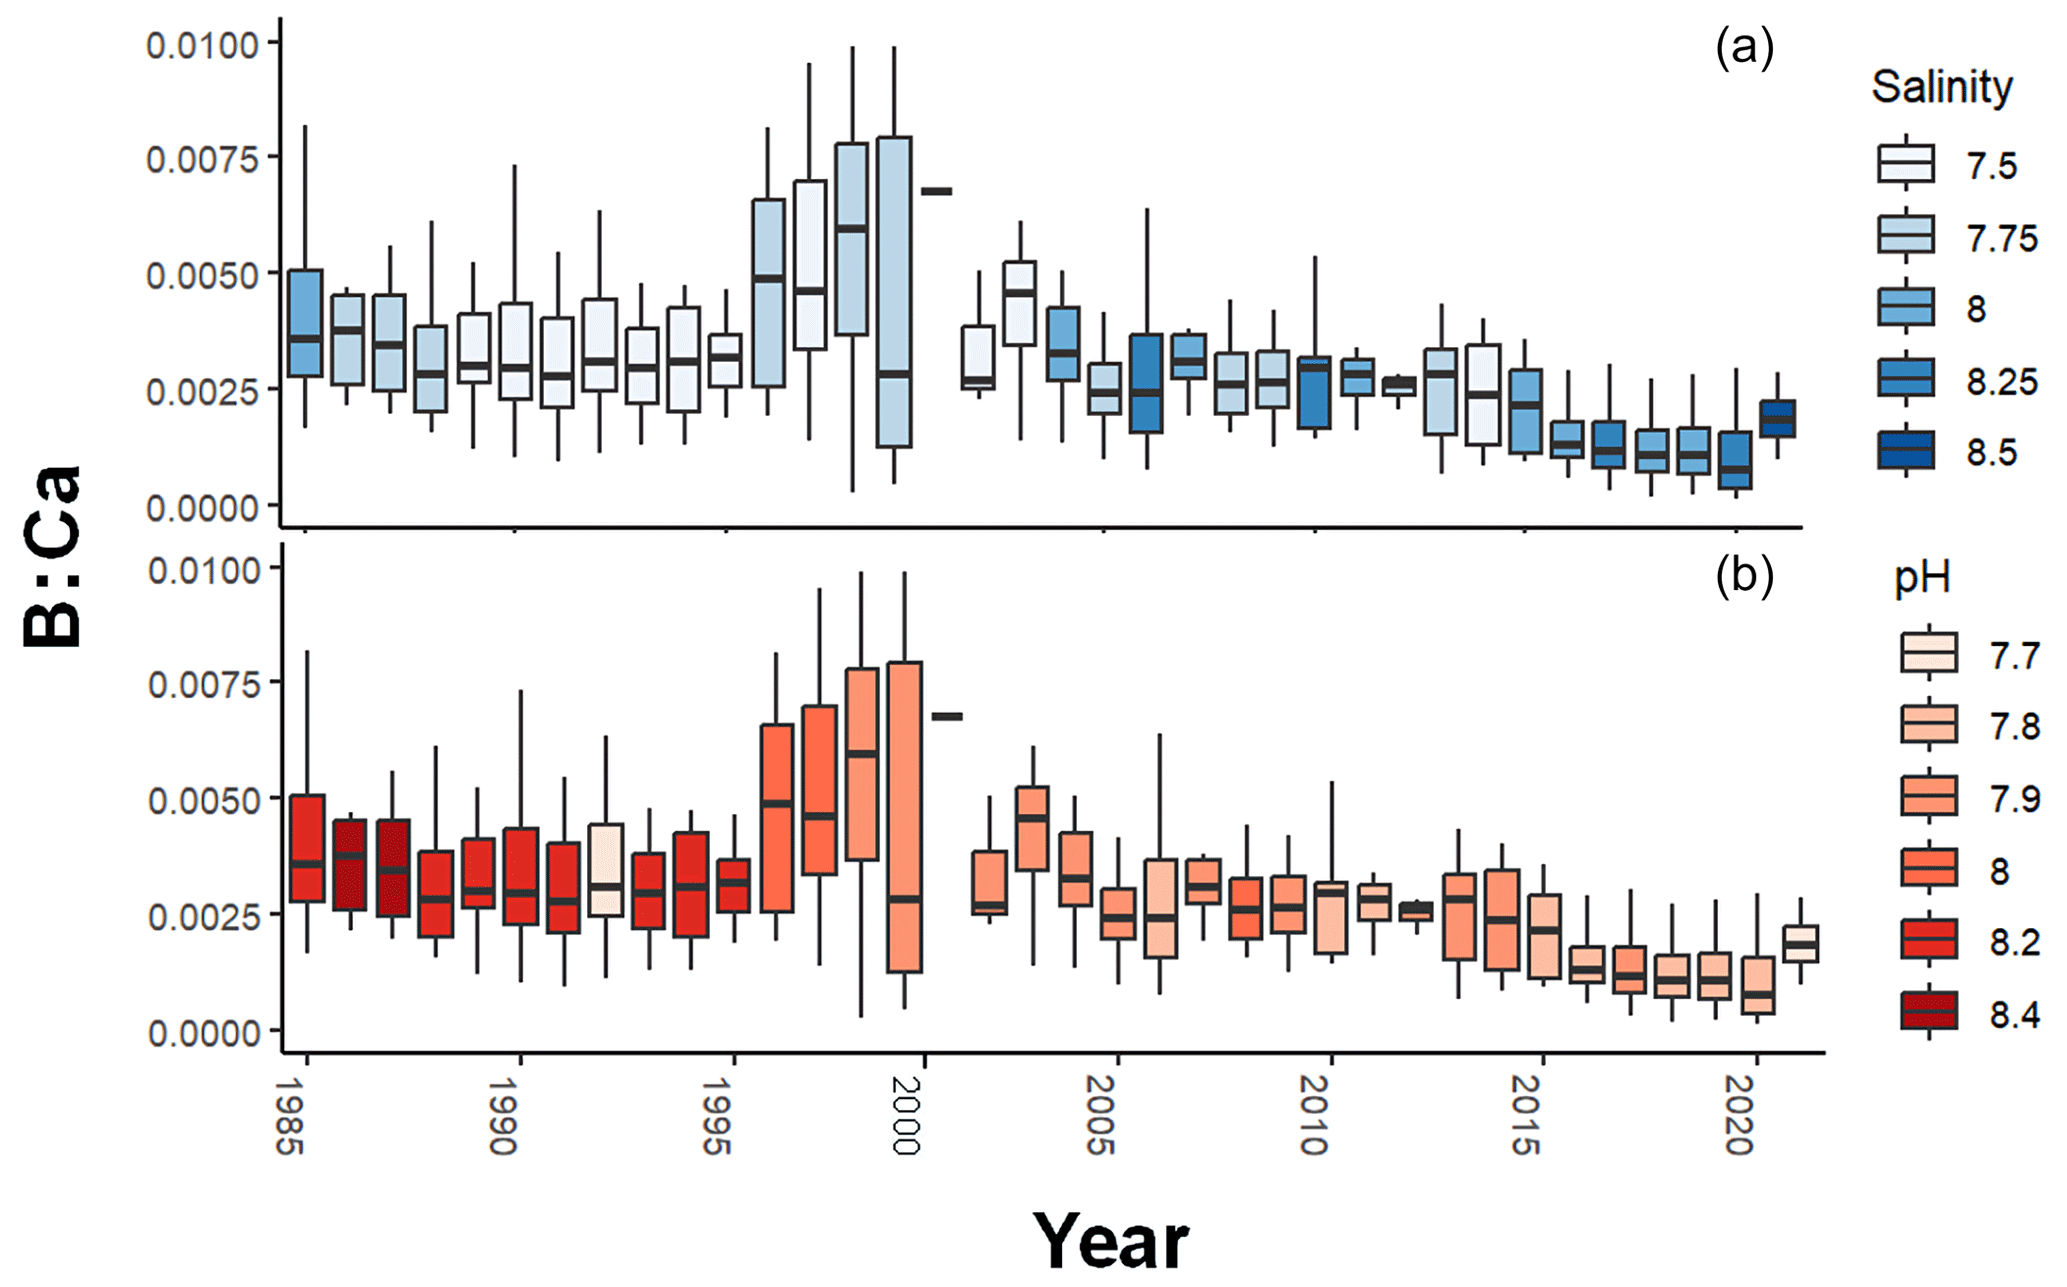
Figure 4Annual B : Ca in Baltic cod otoliths, colored by salinity (a) and pH (b). Boxes represent the upper and lower quartiles, vertical lines show the maximum and minimum values, and the horizontal lines are the median values. Salinity has been increasing and pH declining. Since the late 1990s, there has been a general decline in B : Ca.
3.3 Effects of water parameters on otolith B : Ca
3.3.1 Univariate effects of water parameters on otolith B : Ca
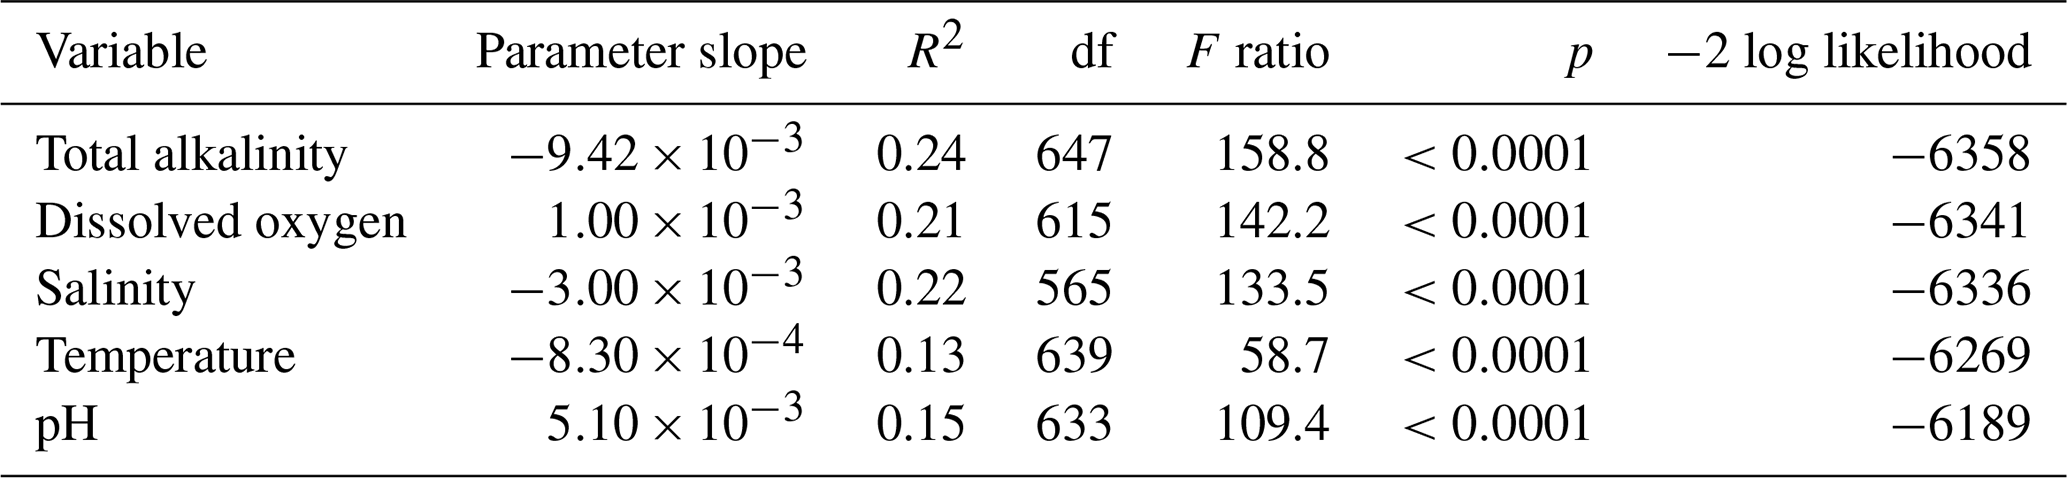
Following the PCA, repeated measures regression of otolith B : Ca on each of the five water variables was conducted to examine effect sizes and significance of each variable alone. These regressions showed significant effects of each of the five water variables on otolith B : Ca (Table 1). AT had the largest effect, which was negative (Table 1). Both dissolved oxygen and pH had positive slopes, and both temperature and salinity were negative. All univariate analyses were highly significant. The age of individual fish was not significant as measured by Wald's p value in restricted maximum likelihood (REML) analysis.
Table 1Repeated measures univariate regression of otolith B : Ca on water variables, ordered by goodness-of-fit (−2 log likelihood criterion; lowest is best).
3.3.2 Two-factor tests of water parameters on otolith B : Ca
Because of the hypothesized positive relationships of salinity and pH in B : Ca, as well as the large effect size of AT, we examined pairwise (two-factor) models of these independent variables on otolith B : Ca (Table 2). This allowed us to examine the relative strength and direction of trends (slope parameters, Table 2) on B : Ca when testing two independent variables together. Aside from an overall model using all the data, these were filtered by decade to examine finer-scale trends.
In both pairwise tests with pH, this parameter had positive slopes in the 1980s and 2010s but negative slopes in the 1990s and 2000s. Alkalinity had mostly a negative relation to otolith B : Ca. Salinity had a positive effect in the 1980s and 1990s but became negative in the 2000s and 2010s. Salinity overall had a negative effect on B : Ca, in contrast to expectations. We note the strong negative effect of pH in the 1990s when paired with AT and the strong positive effect of pH in the 2010s when paired with salinity. Age, when treated as a random variable nested within individual fish (by fish ID), was again not significant. However, in a separate analysis (Fig. S2), age (not treated as a random variable) and otolith B : Ca were inversely related in the 1980s, 1990s, and 2000s, and had a weakly positive trend in the 2010s.
Table 2Repeated measures two-factor models of effects on otolith B : Ca, by decade. Numbers are estimated coefficients. −2 log likelihood is a metric of goodness-of-fit, with smaller numbers indicating better fit.
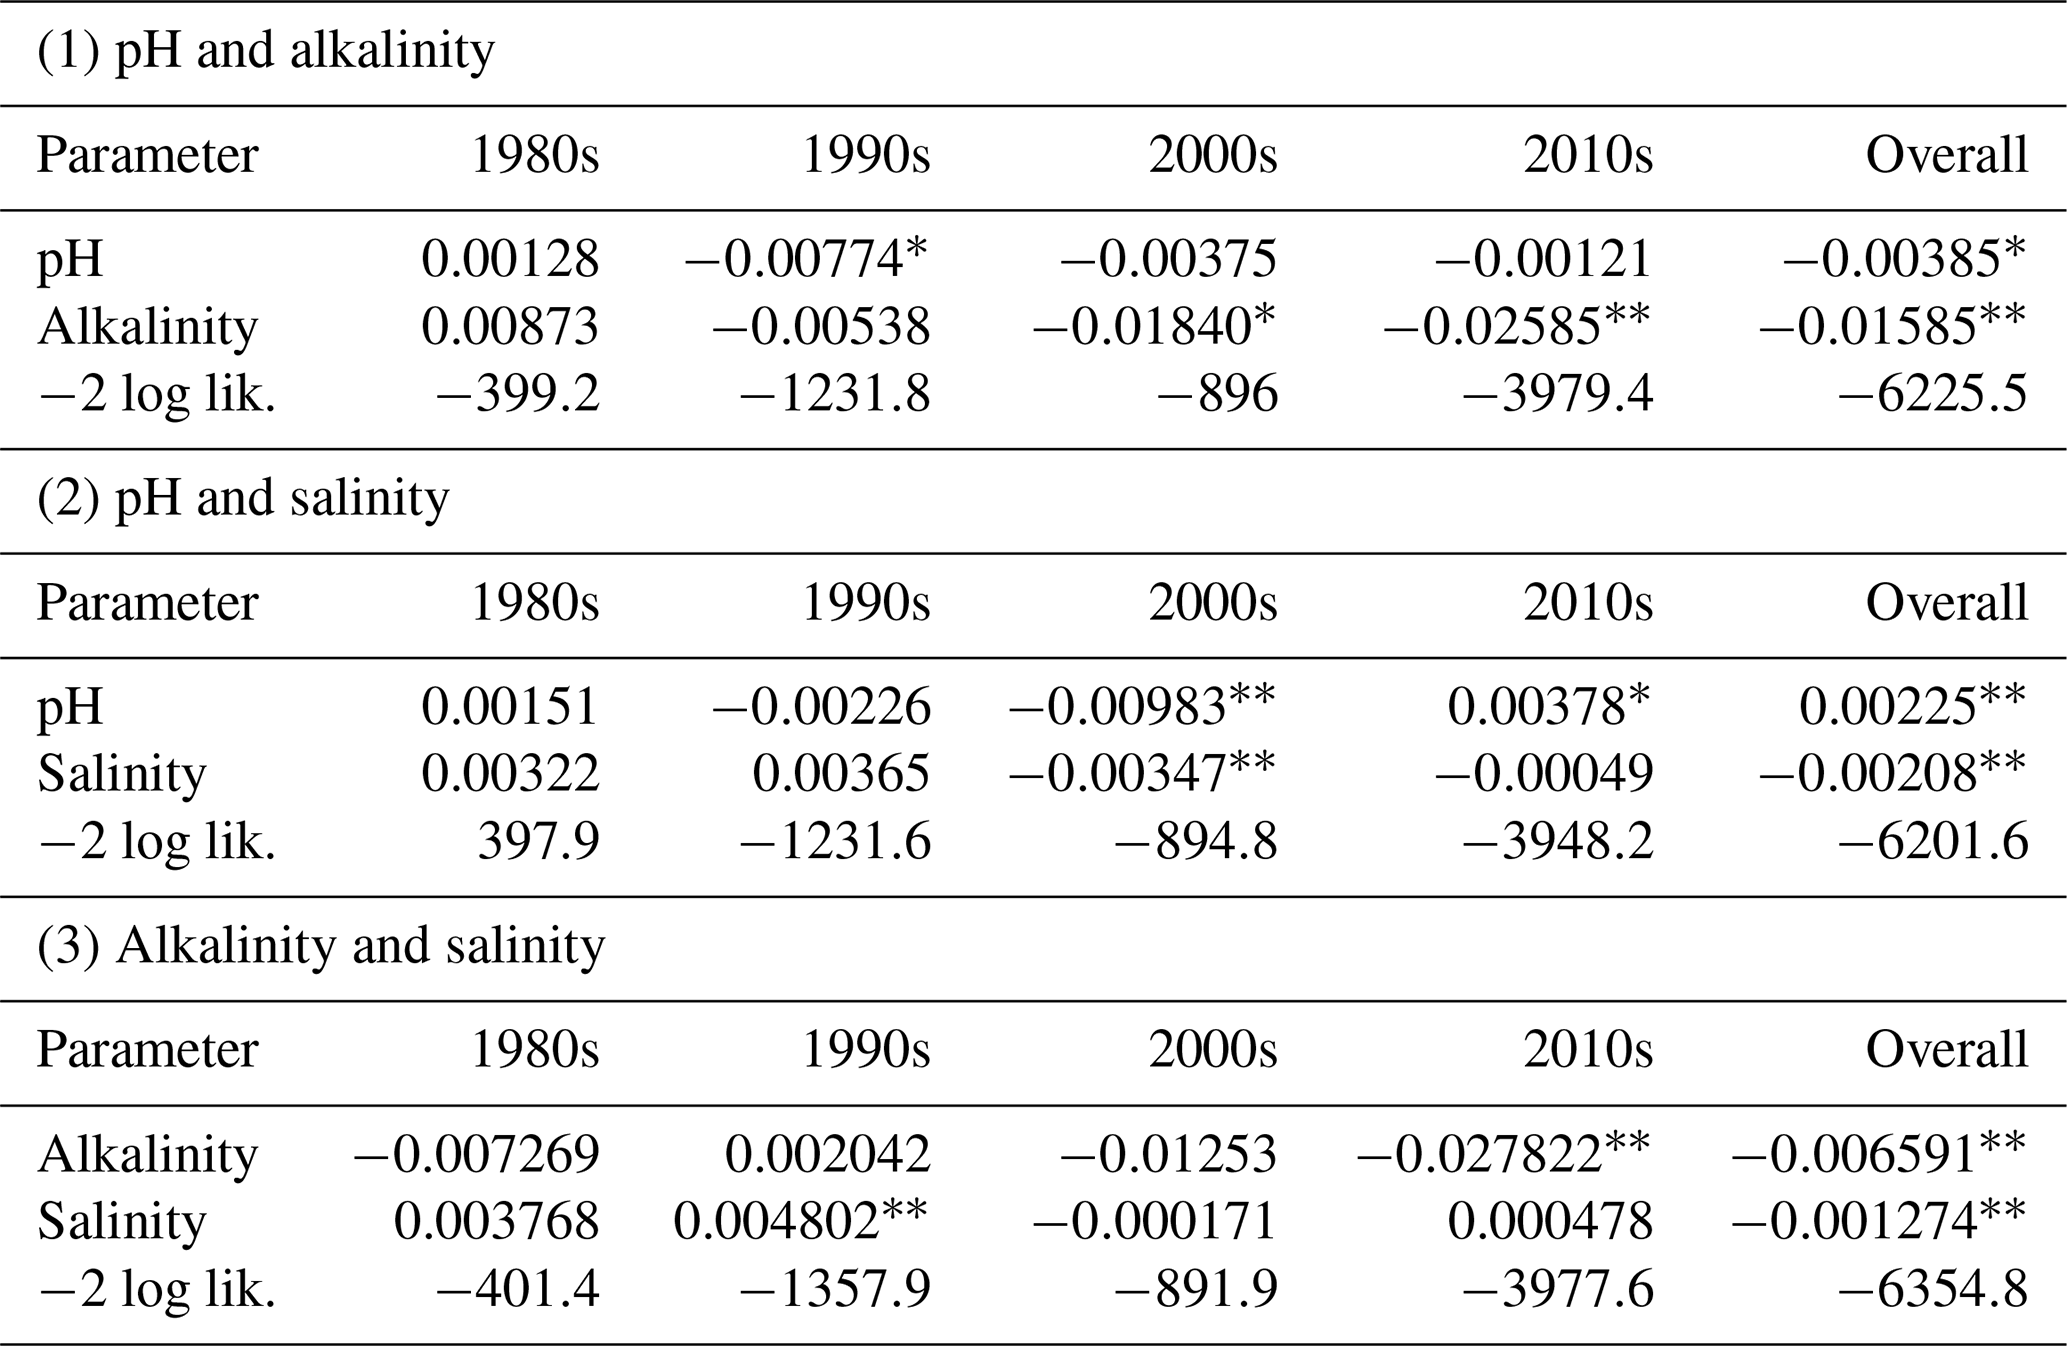
* = significant at p<0.05. = significant at p<0.01.
3.4 Internal parameters and otolith B : Ca
During exploratory examination of the data, P : Ca was found to correlate highly with B : Ca in Icelandic cod otoliths (Fig. 5a). Otolith Mn : Mg, on the other hand, is our proxy for hypoxia exposure (Limburg and Casini, 2018) and is often negatively correlated with B : Ca (Fig. 5b). This is consistent with co-occurrence of reduced conditions in water (and presence of bioavailable ionic Mn2+) and high pCO2 and thus low pH, the former two being the effect of enhanced organic matter remineralization and/or poor ventilation of the water layers occupied by cod.
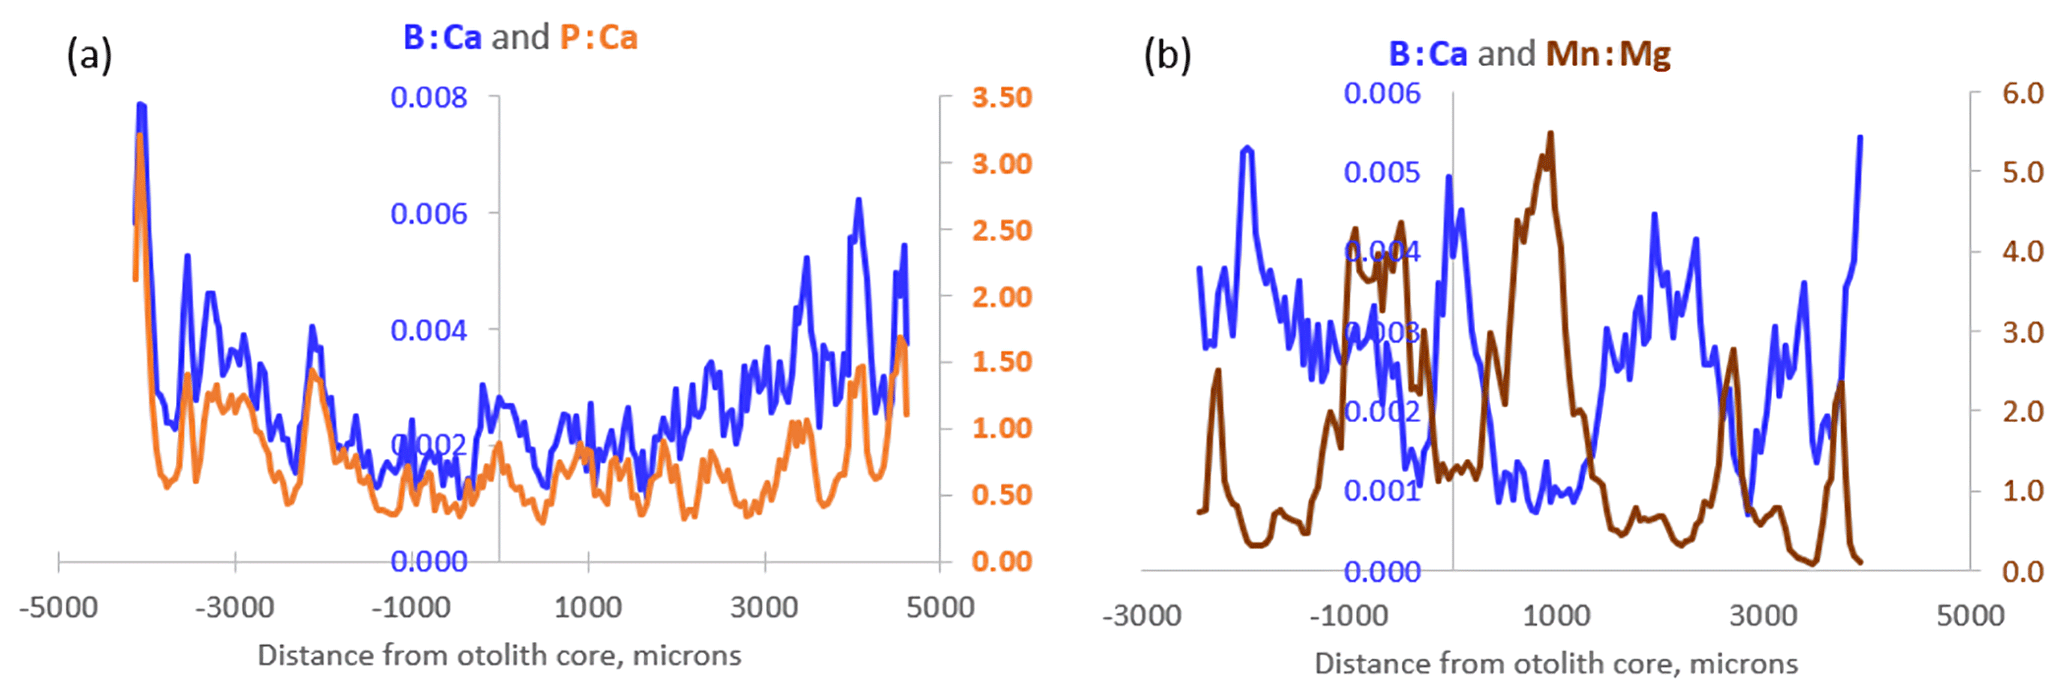
Figure 5(a) Transects of B : Ca and P : Ca from an 8-year-old Icelandic cod captured in 2020. Note the close resemblance of the dynamics. (b) Inverse transects of B : Ca and Mn : Mg from a 4-year-old Baltic cod captured in 2014.
3.4.1 P : Ca as a proxy for physiological status
For this analysis, the Icelandic out-group of cod living in normoxic water was included. Annual average P : Ca was highly correlated with B : Ca in Icelandic cod otoliths but inversely correlated in Baltic cod, with a great deal of scatter (Fig. 6). Although the overall trend for Baltic cod is negative, this hides trends that become more visible at a finer temporal scale. Thus, we examined the slopes and R2 values of individual fish regressions of P : Ca on B : Ca (Fig. S3). The 2010s showed the strongest trends when slopes were plotted on R2 values, with Icelandic cod and the 2000s also trending positively and weaker trends in the 1980s and 1990s (Fig. S3a). Box plots of R2 values by decade and out-group showed wide variation (Fig. S3b). An analysis of variance found no statistical difference among Baltic fish by decade but Icelandic otoliths had significantly higher R2 values (p<0.001).
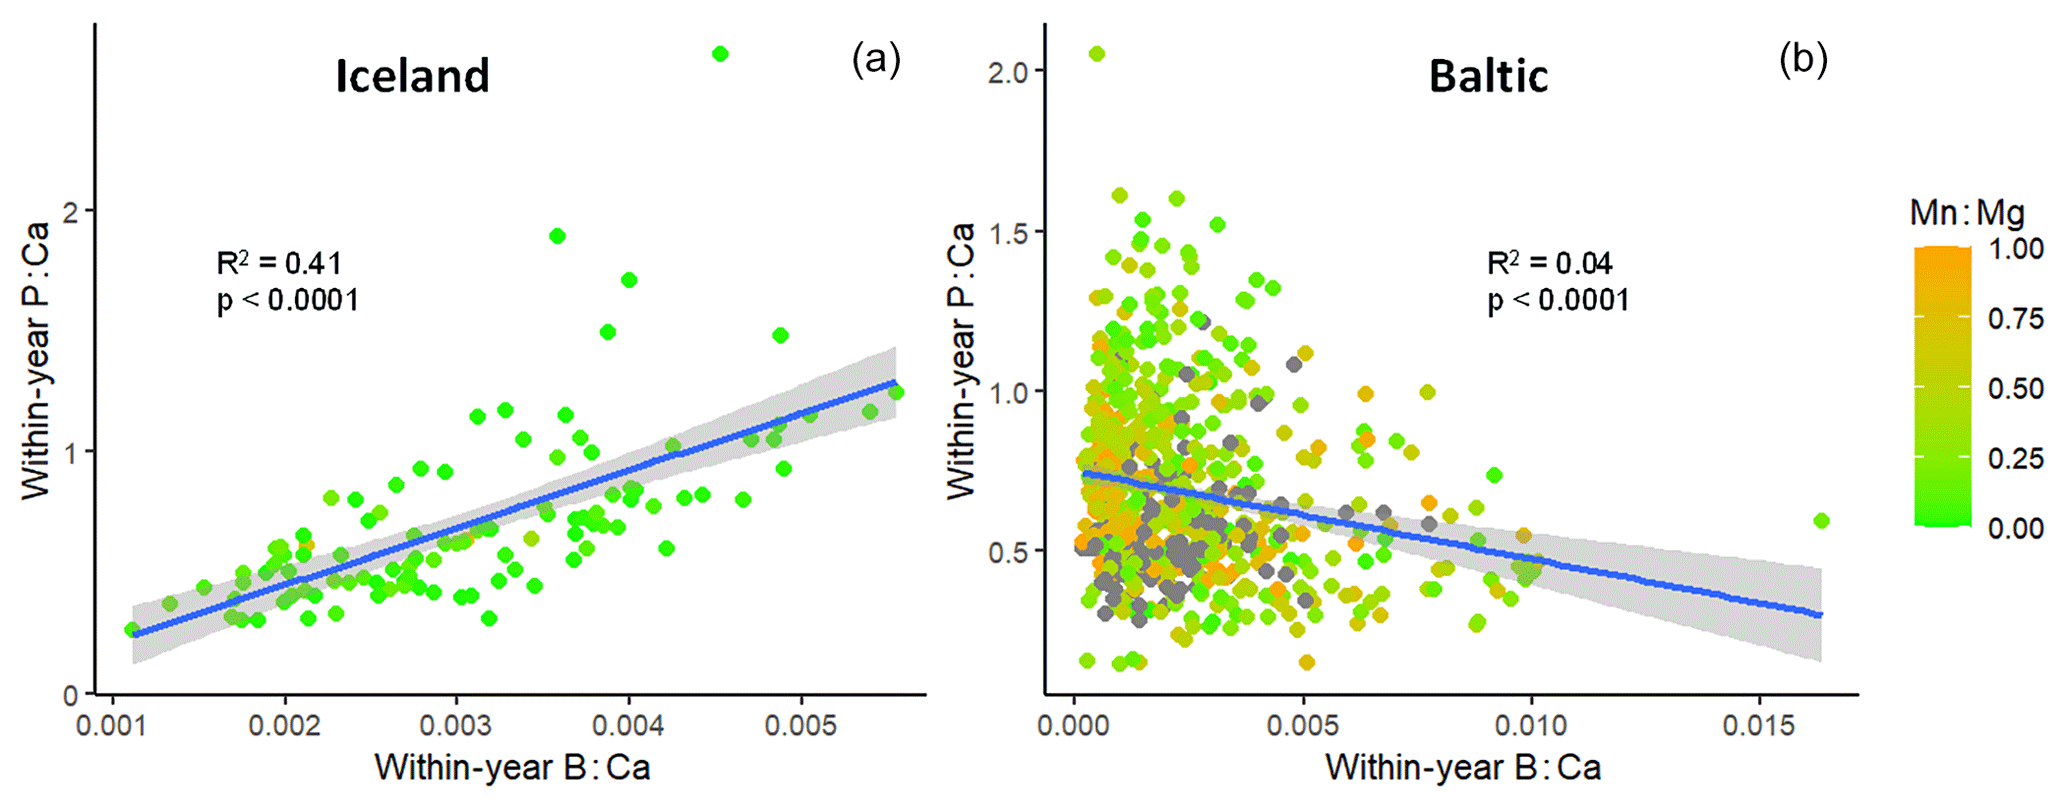
Figure 6Comparison of the relationship of otolith boron : calcium with phosphorus : calcium in (a) healthy Icelandic cod vs. (b) Baltic Sea cod. Color bar shows the corresponding average Mn : Mg values. Points represent annual observations, and most fish have multiple observations (dark points on Baltic graph have Mn : Mg values > 1). Outlier point on right-hand graph actually decreases the slope; its removal improves the goodness-of-fit (R2).
3.4.2 Mn : Mg as a proxy for hypoxia exposure
We tested the hypothesis that hypoxia (indexed by increased otolith Mn : Mg) was coupled to acidification (indexed by declining B : Ca). We used a similar analysis of individual fish regressions of Mn : Mg, our hypoxia exposure proxy, on B : Ca, as was performed with P : Ca (see Sect. 2). This analysis led to somewhat inconclusive results (Fig. S4). The decades of the 1980s, 1990s, and 2000s all had mostly positive slopes of Mn : Mg with B : Ca and slopes increased with increasing R2 values. Only the 2010s displayed a pattern consistent with the hypothesis. Iceland showed no relationship between the slopes and the goodness-of-fit. Further examination of the data included plotting trends of these slopes against fish age (Fig. S5). This revealed that younger EBC otoliths tended to have positive slopes, with slopes becoming more negative with age, over the decades between the 1990s and 2010s; no trend was observed in the 1980s, and Icelandic cod had increasingly positive slopes as they aged (Fig. S5). For the 2010s, this suggests that as Baltic cod age they encounter more hypoxia, perhaps as they use deeper habitats, and with it, a decline in B : Ca that may indicate lower environmental pH. Overall, this analysis suggests that there may be evidence that the decade of the 2010s witnessed acidification driven by the same mechanisms that produced hypoxia.
This study was initiated because a large discrepancy in otolith B : Ca ratios found between fish captured in 2000 and those captured in 2019–2021. Archived otoliths from previous analyses were then used to create a time series of data from 1985 to 2021. Otolith B : Ca ratios were analyzed in relation to long-term records of water chemistry in a central location in the Baltic Sea to represent trends in environmental conditions. Ratios were also examined against an elemental ratio (P : Ca) determined in other studies to be controlled physiologically, as well as against a ratio (Mn : Mg) that serves as a proxy for hypoxia exposure (Limburg and Casini, 2018).
Boron has been included in a number of otolith chemistry studies, mostly as part of a multivariate suite of tracers to determine provenance. Martino et al. (2017) studied boron as part of a suite of trace elements that might be affected by experimentally elevated pCO2 but found no effect. Cavole (2021) performed the first studies of otolith B : Ca as a potential proxy for ocean acidification, using wild fishes across a natural pH gradient (7.4 to 8.1). Cavole et al. (2023), examining potential tracers of warming, hypoxia, and acidification in deep-sea fishes, found wide variation in B : Ca but no consistent trends.
In this study, all univariate regressions of otolith B : Ca for five water variables were highly significant, with dissolved oxygen and pH showing positive relationships while negative relationships were observed with alkalinity, temperature, and salinity (Table 1). These variables are interrelated through ecological processes: warming temperatures and salinity in combination with nutrients produce massive algal blooms in the Baltic Sea, which as they die off and decay, consume oxygen and change the pH and alkalinity (Kuliński et al., 2022). In that analysis, total alkalinity (AT) showed the strongest effect, followed by dissolved oxygen and salinity.
Further pairwise analysis of AT, pH, and salinity by decade showed varying patterns of effect sizes and significance. Importantly, when testing pH and salinity together, pH had a significant positive effect on B : Ca and salinity a significant negative effect. Kuliński et al. (2018), building on earlier studies, showed that dissolved boron is tightly coupled to salinity in the Baltic Sea, with an intercept >0 indicating watershed sources of B input. The decoupling of otolith B : Ca from salinity and its strong relationship to pH and alkalinity in the 2010s suggest that environmental conditions moved into a different regime from the previous 3 decades.
Among the analyzed environmental variables (Fig. 3), temperature shows a clear positive trend starting from the 1980s. This is consistent with analyses performed by Lehmann et al. (2022), who found warming of 0.3–0.5 ∘C per decade in the whole water column in the central Baltic (station BY-15) between 1979 and 2018. For other variables, trends are not that straightforward. For salinity, the variability reveals a stratification pattern typical of the central Baltic, with significantly higher S in deep waters and a brackish surface water layer. However, in the 1980s and early 1990s there was a clear S drop in deep waters as a result of lower-frequency so-called Major Baltic Inflows that bring dense saline water from the North Sea to the Baltic (Meier et al., 2022). This relaxed haline stratification in the central Baltic, which in turn led to better ventilation of deep waters and significantly raised O2 availability (Fig. 3b and d; Lehmann et al., 2022), increased water volume for cod spawning and feeding. However, the 1980s was also the time when the maximum nutrient loads from land occurred, propelling eutrophication in the central Baltic. High organic matter production (and its export to bottom waters) co-occurred with the re-enhancement of water column stratification around the start of the 21st century (increase in bottom S, Fig. 3d). These factors led to a significant drop in O2 in deeper waters (Fig. 3b; Kuliński et al., 2022), which limited the optimal water volume for cod expansion – a negative factor that also coincided with extensive fishing exploitation.
Furthermore, all these changes together with a rising pressure from atmospheric CO2 increase made fundamental changes in the marine CO2 system and seawater pH. First, the relatively low pH in the 1960s was increasing by the 1990s as an initial effect of eutrophication (Fig. 3c). Surprisingly, this trend paralleled a drop in AT (Fig. 3e), which is a counterintuitive phenomenon in marine CO2 system studies. However, the relatively constant ratio (Fig. 3f) clearly suggests that this initial AT decrease was an effect of salinity decrease. We can observe, as early as the 1990s, a change in trends and a clear decoupling of AT from S as revealed by the marked increase, suggesting that the AT increase was greater than observed S changes at that time (Fig. 3d, e, f). While in surface waters this AT increase was likely due to climate-related (or CO2-induced) enhancement of weathering on land and higher riverine AT loads, the AT increase observed in deep waters was probably an effect of hypoxic/anoxic AT generation (Müller et al., 2016; Neumann et al., 2022). The latter is consistent with a large and sudden expansion of hypoxic/anoxic areas in the central Baltic that occurred in the late 1990s (Meier et al., 2022). This phenomenon is also believed to be a root cause of a biogeochemical regime shift to the so-called vicious cycle – a self-supporting eutrophication mechanism (Kuliński et al., 2022). Due to these effects, after reaching its maximum in the late 1980s (effect of eutrophication), pH dropped somewhat and has remained relatively constant in the 21st century, thus expressing the mutually cancelling effects of ocean acidification (effect of rising atmospheric CO2) and hypoxia/anoxia/weathering-driven alkalinization.
As is the case for some other trace elements (Hüssy et al., 2021), in this study boron uptake into otoliths appears to have some unexplained physiological regulation. This conclusion is based on close correspondence between B : Ca and P : Ca in otoliths from Icelandic cod that are not stressed by hypoxia (Figs. 5a, 6a). In contrast to the Icelandic cod, the relationship of P : Ca and B : Ca in Baltic cod otoliths was highly variable, with a negative trend in the aggregate (Fig. 6b). Regressions of P : Ca on B : Ca conducted on individual fish revealed mostly positive slopes, with the highest slopes observed in the 2010s (Fig. S3a) but with lower, more variable R2 values (Fig. S3b). Although not statistically different, R2 values were lowest in the 1980s and next-lowest in the 2010s. Compared to the Icelandic cod, all Baltic otoliths showed less coupling between P : Ca and B : Ca.
The CO and AT-induced pH changes have clearly modified borate availability in water and likely the B : Ca ratio in the Baltic cod otoliths (Fig. 4). However, as shown by the strong correlation of B : Ca and the physiologically regulated P : Ca in the healthy normoxic Icelandic cod otoliths, the B : Ca ratio may also contain built-in information about the overall physiological condition of fish (and not only the pH dependency). This suggests that a complex picture of B : Ca development in the EBC otoliths over the recent decades may be affected by multiple factors: not only by pH changes but also physiological stress caused by overall changes that have recently occurred in the Baltic (Eero et al., 2020). These include expansion of hypoxia/anoxia, eutrophication, and biogeochemical regime shift. Together with overfishing, these factors led to an overall collapse of the EBC population in the Baltic.
Examination of B : Ca in relation to an otolith index of hypoxia exposure, Mn : Mg, revealed mostly positive slopes of individual fish regressions, with the notable exceptions of Baltic cod from the 2010s and Icelandic cod (Fig. S4). Limburg and Casini (2018) adopted the ratio Mn : Mg as a hypoxia exposure proxy rather than Mn : Ca in part to correct for growth influences on Mn (see Limburg et al., 2015) as otolith Mg is related to metabolism and growth (Limburg et al., 2018). The positive relationship of Mn : Mg and B : Ca cannot be fully explained, but the inverse relationships observed in the 2010s is consistent with the hypothesis that cod were exposed to both hypoxia and lower pH (and also higher alkalinity). Some of the positive slopes were due to young ages of fish; we observed more coupling of Mn : Mg and B : Ca in young fish, and we hypothesize that at younger ages the growth effect on otolith Mn is not fully removed by dividing by Mg. Baltic cod had increasingly negative slopes of the Mn : Mg vs. B : Ca regressions as they aged (Fig. S5), with the 2010s displaying the most negative slopes.
Baltic cod showed variable patterns of otolith B : Ca over a 35-year period, with maximum values in the late 1990s, a gradual decline in B : Ca thereafter, and an all-time low in 2019–2020. These trends are imperfectly related to water chemistry data but showed strong correlations that varied by decade. Otolith B : Ca ratios and relationships in the 2010s were suggestive of environmental changes in pH and total alkalinity that could be coupled to deoxygenation. Physiological influences observed in a healthy Icelandic population were diminished in Baltic cod.
Undoubtedly, some of the relationships found could be due to the choice of samples, and a more focused study might select otoliths from areas where trends in acidification are clear. Future work could also examine otoliths from other species, as well as determine, if possible, the form of boron (borate or boric acid) taken up by otoliths. Complex interactions notwithstanding, we suggest B : Ca in cod otoliths as a prospective variable in the palette of important and available tools used to look into the environmental changes through the lens of otolith chemistry.
The codes and data are available upon request to the corresponding author.
The supplement related to this article is available online at: https://doi.org/10.5194/bg-20-4751-2023-supplement.
KEL designed and carried out the study. YH contributed data and figures. KK interpreted the water data. All authors contributed text.
The contact author has declared that none of the authors has any competing interests.
Publisher’s note: Copernicus Publications remains neutral with regard to jurisdictional claims made in the text, published maps, institutional affiliations, or any other geographical representation in this paper. While Copernicus Publications makes every effort to include appropriate place names, the final responsibility lies with the authors.
This article is part of the special issue “Low-oxygen environments and deoxygenation in open and coastal marine waters”. It is a result of the 53rd International Colloquium on Ocean Dynamics (3rd GO2NE Oxygen Conference), Liège, Belgium, 16–20 May 2022.
We thank Stephen Campana, Michele Casini, and Ingibjörg Jonsdottir for providing otoliths; Debra Driscoll for assistance with LA-ICP-MS analysis; Bärbel Hönisch for discussions of δ11B; Christoph Humborg and Bo Gustafsson for discussions of Baltic acidification; Lisa Levin and Leticia Cavole for reading and commenting on an earlier version of this work; the editor, Sean A. Crowe and two anonymous reviewers. Through the input of Karol Kuliński this work contributes to Baltic Earth – Earth System Science for the Baltic Sea Region (https://www.baltic.earth, last access: 24 November 2023).
This research has been supported by the US National Science Foundation (grant no. OCE-1923965).
This paper was edited by Sean A. Crowe and reviewed by two anonymous referees.
Casini, M., Käll, F., Hansson, M., Plikshs, M., Baranova, T., Karlsson, O., Lundström, K., Neuenfeldt, S., Gårdmark, A., and Hjelm, J.: Hypoxic areas, density-dependence and food limitation drive the body condition of a heavily exploited marine fish predator, Roy. Soc. Open Sci., 3, 160416, https://doi.org/10.1098/rsos.160416, 2016.
Casini, M., Hansson, M., Orio, A., and Limburg, K.: Changes in population depth distribution and oxygen stratification are involved in the current low condition of the eastern Baltic Sea cod (Gadus morhua), Biogeosciences, 18, 1321–1331, https://doi.org/10.5194/bg-18-1321-2021, 2021.
Cavole, L. M.: Fish otoliths and fisher knowledge as mobile monitors of environmental conditions: an integrated approach, Ph.D. dissertation, University of California at San Diego, ProQuest ID: Cavole_ucsd_0033D_20228, Merritt ID: ark:/13030/m5868htx, https://escholarship.org/uc/item/3531j2t0 (last access: 24 November 2023), 2021.
Cavole, L. M., Limburg, K. E., Gallo, N. D., Salvanes, A. G. V., Ramirez-Valdez, A., Levin, L. A., Oropeza, O. A., Hertwig, A., Liu, M.-C., and McKeegan, K. D.: Otoliths of marine fishes record evidence of low oxygen, temperature and pH conditions of deep Oxygen Minimum Zones, Deep-Sea Res. Pt. 1, 103941, https://doi.org/10.1016/j.dsr.2022.103941, 2023.
Doney, S. C., Fabry, V. J., Feely, R. A., and Kleypas, J. A.: Ocean acidification: the other CO2 problem, Annu. Rev. Mar. Sci., 1, 169–192, https://doi.org/10.1146/annurev.marine.010908.163834, 2009.
Eero, M., Hjelm, J., Behrens, J., Buchmann, K., Cardinale, M., Casini, M., Gasyukov, P., Holmgren, N., Horbowy, J., Hüssy, K., Kirkegaard, E., Kornilovs, G., Krumme, U., Köster, F. W., Oeberst, R., Plikshs, M., Radtke, K., Raid, T., Schmidt, J., Tomczak, M. T., Vinther, M., Zimmermann, C., and Storr-Paulsen, M.: Eastern Baltic cod in distress: biological changes and challenges for stock assessment, ICES J. Mar. Sci., 72, 2180–2186, 2015.
Eero, M., Cardinale, M., and Storr-Paulsen, M.: Emerging challenges for resource management under ecosystem change: Example of cod in the Baltic Sea, Ocean Coast. Manage., 198, 105314, https://doi.org/10.1016/j.ocecoaman.2020.105314, 2020.
Heimbrand, Y., Limburg, K. E., Hüssy, K., Casini, M., Sjöberg, R., Palmén Bratt, A. M., Levinsky, S. E., Karpushevskaia, A., Radtke, K., and Öhlund, J.: Seeking the true time: Exploring otolith chemistry as an age-determination tool, J. Fish Biol., 97, 552–565, 2020.
Hönisch, B., Ridgwell, A., Schmidt, D. N., Thomas, E., Gibbs, S. J., Sluijs, A., Zeebe, R., Kump, L., Martindale, R. C., Greene, S. E. Kiessling, W., Ries, J., Zachos, J. C., Royer, D. L., Barker, S., Marchitto Jr., T. M., Moyer, R., Pelejero, C., Ziveri, P., Foster, G. L., and Williams, B.: The geological record of ocean acidification, Science, 335, 1058–1063, 2012.
Hüssy, K., Limburg, K. E., de Pontual, H., Thomas, O. R., Cook, P. K., Heimbrand, Y., Blass, M., and Sturrock, A. M.: Trace element patterns in otoliths: the role of biomineralization, Rev. Fish. Sci. Aquac., 29, 445–477, 2021.
ICES (International Council for the Exploration of the Sea): Benchmark Workshop on Baltic Cod Stocks (WKBALTCOD2), ICES Scientific Reports, 1, 1–310, https://doi.org/10.17895/ices.pub.4984, 2019.
JMP®: Version 17.0. SAS Institute Inc., Cary, NC, 1989–2022.
Kuliński, K., Schneider, B., Szymczycha, B., and Stokowski, M.: Structure and functioning of the acid–base system in the Baltic Sea, Earth Syst. Dynam., 8, 1107–1120, https://doi.org/10.5194/esd-8-1107-2017, 2017.
Kuliński, K., Szymczycha, B., Koziorowska, K., Hammer, K., and Schneider, B.: Anomaly of total boron concentrations in the brackish waters of the Baltic Sea and its consequence for the CO2 system calculations, Mar. Chem., 204, 11–19, https://doi.org/10.1016/j.marchem.2018.05.007, 2018.
Kuliński, K., Rehder, G., Asmala, E., Bartosova, A., Carstensen, J., Gustafsson, B., Hall, P. O. J., Humborg, C., Jilbert, T., Jürgens, K., Meier, H. E. M., Müller-Karulis, B., Naumann, M., Olesen, J. E., Savchuk, O., Schramm, A., Slomp, C. P., Sofiev, M., Sobek, A., Szymczycha, B., and Undeman, E.: Biogeochemical functioning of the Baltic Sea, Earth Syst. Dynam., 13, 633–685, https://doi.org/10.5194/esd-13-633-2022, 2022.
Lehmann, A., Myrberg, K., Post, P., Chubarenko, I., Dailidiene, I., Hinrichsen, H.-H., Hüssy, K., Liblik, T., Meier, H. E. M., Lips, U., and Bukanova, T.: Salinity dynamics of the Baltic Sea, Earth Syst. Dynam., 13, 373–392, https://doi.org/10.5194/esd-13-373-2022, 2022.
Levin, L. A., Hönisch, B., and Frieder, C. A.: Geochemical proxies for estimating faunal exposure to ocean acidification, Oceanography, 28, 62–73, https://doi.org/10.5670/oceanog.2015.32, 2015.
Limburg, K. E. and Casini, M.: Effect of marine hypoxia on Baltic Sea cod Gadus morhua: evidence from otolith chemical proxies, Front. Mar. Sci., 5, 482, https://doi.org/10.3389/fmars.2018.00482, 2018.
Limburg, K. E., Walther, B. D., Lu, Z., Jackman, G., Mohan, J., Walther, Y., Nissling, A., Weber, P. K., and Schmitt, A. K.: In search of the dead zone: use of otoliths for tracking fish exposure to hypoxia, J. Marine Syst., 141, 167–178, 2015.
Limburg, K. E., Wuenschel, M. J., Hüssy, K., Heimbrand, Y., and Samson, M.: Making the otolith magnesium chemical calendar-clock tick: plausible mechanism and empirical evidence, Rev. Fish. Sci. Aquac., 26, 479–493, 2018.
Martino, J., Doubleday, Z. A., Woodcock, S. H., and Gillanders, B. M.: Elevated carbon dioxide and temperature affects otolith development, but not chemistry, in a diadromous fish, J. Exp. Mar. Biol. Ecol., 495, 57–64, 2017.
Meier, H. E. M., Kniebusch, M., Dieterich, C., Gröger, M., Zorita, E., Elmgren, R., Myrberg, K., Ahola, M. P., Bartosova, A., Bonsdorff, E., Börgel, F., Capell, R., Carlén, I., Carlund, T., Carstensen, J., Christensen, O. B., Dierschke, V., Frauen, C., Frederiksen, M., Gaget, E., Galatius, A., Haapala, J. J., Halkka, A., Hugelius, G., Hünicke, B., Jaagus, J., Jüssi, M., Käyhkö, J., Kirchner, N., Kjellström, E., Kulinski, K., Lehmann, A., Lindström, G., May, W., Miller, P. A., Mohrholz, V., Müller-Karulis, B., Pavón-Jordán, D., Quante, M., Reckermann, M., Rutgersson, A., Savchuk, O. P., Stendel, M., Tuomi, L., Viitasalo, M., Weisse, R., and Zhang, W.: Climate change in the Baltic Sea region: a summary, Earth Syst. Dynam., 13, 457–593, https://doi.org/10.5194/esd-13-457-2022, 2022.
Müller, J. D., Schneider, B., and Rehder, G.: Long-term alkalinity trends in the Baltic Sea and their implications for CO2-induced acidification, Limnol. Oceanogr., 71, 1983–2002, 2016.
Neumann, T., Radtke, H., Cahill, B., Schmidt, M., and Rehder, G.: Non-Redfieldian carbon model for the Baltic Sea (ERGOM version 1.2) – implementation and budget estimates, Geosci. Model Dev., 15, 8473–8540, https://doi.org/10.5194/gmd-15-8473-2022, 2022.
R Core Team: R: A language and environment for statistical computing, R Foundation for Statistical Computing, Vienna, Austria, https://www.R-project.org/ (last access: 24 November 2023), 2022.
Reis-Santos, P., Gillanders, B. M., Sturrock, A. M., Izzo, C., Oxman, D. S., Lueders-Dumont, J. A., Hüssy, K, Tanner, S. E., Rogers, T, Doubleday, Z. A., Andrews, A. H., Trueman, C., Brophy, D., Thiem, J. D., Baumgartner, L. J., Wilmes, M., Chung, M.-T., Johnson R. C., Heimbrand, Y., Limburg, K. E., and Walther, B. D.: Reading the biomineralized book of life: expanding otolith biogeochemical research and applications for fisheries and ecosystem-based management, Rev. Fish Biol. Fisher., 33, 411–449, https://doi.org/10.1007/s11160-022-09720-z, 2022.
Reusch, T. B., Dierking, J., Andersson, H. C., Bonsdorff, E., Carstensen, J., Casini, M., Czajkowski, M., Hasler, B., Hinsby, K., Hyytiäinen, K., Johannesson K., Jomaa, S., Jormalainen, V., Kuosa, H., Kurland, S., Laikre, L., MacKenzie, B.,R., Margonski, P., Melzner, F., Oesterwind, D., Ojaveer, H., Refsgaard, J. C., Sandström, A., Schwarz, G., Tonderski, K., Winder, M., and Zandersen, M.: The Baltic Sea as a time machine for the future coastal ocean, Sci. Adv., 4, eaar8195, https://doi.org/10.1126/sciadv.aar8195, 2018.
Thomas, O. R. B., Ganio, K., Roberts, B. R., and Swearer, S. E.: Trace element-protein interactions from the inner ear of fish: implications for environmental reconstructions using fish otolith chemistry, Metallomics, 9, 239–249, 2017.
Wickham, H.: ggplot2: Elegant Graphics for Data Analysis, Springer-Verlag, New York, https://doi.org/10.1007/978-3-319-24277-4, 2016.
Yu, J. and Elderfield, H.: Benthic foraminiferal ratios reflect deep water carbonate saturation state, Earth Planet. Sc. Lett., 258, 73–86, 2007.