the Creative Commons Attribution 4.0 License.
the Creative Commons Attribution 4.0 License.
 | 07 Dec 2023
Reviews and syntheses: Greenhouse gas emissions from drained organic forest soils – synthesizing data for site-specific emission factors for boreal and cool temperate regions
Jyrki Jauhiainen
Juha Heikkinen
Nicholas Clarke
Hongxing He
Lise Dalsgaard
Kari Minkkinen
Paavo Ojanen
Lars Vesterdal
Jukka Alm
Aldis Butlers
Ingeborg Callesen
Sabine Jordan
Annalea Lohila
Ülo Mander
Hlynur Óskarsson
Bjarni D. Sigurdsson
Gunnhild Søgaard
Kaido Soosaar
Åsa Kasimir
Brynhildur Bjarnadottir
Andis Lazdins
Raija Laiho
We compiled published peer-reviewed CO2, CH4, and N2O data on managed drained organic forest soils in boreal and temperate zones to revisit the current Tier 1 default emission factors (EFs) provided in the IPCC (2014) Wetlands Supplement: to see whether their uncertainty may be reduced; to evaluate possibilities for breaking the broad categories used for the IPCC EFs into more site-type-specific ones; and to inspect the potential relevance of a number of environmental variables for predicting the annual soil greenhouse gas (GHG) balances, on which the EFs are based. Despite a considerable number of publications applicable for compiling EFs being added, only modest changes were found compared to the Tier 1 default EFs. However, the more specific site type categories generated in this study showed narrower confidence intervals compared to the default categories. Overall, the highest CO2 EFs were found for temperate afforested agricultural lands and boreal forestry-drained sites with very low tree stand productivity. The highest CH4 EFs in turn prevailed in boreal nutrient-poor forests with very low tree stand productivity and temperate forests irrespective of nutrient status, while the EFs for afforested sites were low or showed a sink function. The highest N2O EFs were found for afforested agricultural lands and forestry-drained nutrient-rich sites. The occasional wide confidence intervals could be mainly explained by single or a few highly deviating estimates rather than the broadness of the categories applied. Our EFs for the novel categories were further supported by the statistical models connecting the annual soil GHG balances to site-specific soil nutrient status indicators, tree stand characteristics, and temperature-associated weather and climate variables. The results of this synthesis have important implications for EF revisions and national emission reporting, e.g. by the use of different categories for afforested sites and forestry-drained sites, and more specific site productivity categories based on timber production potential.
- Article
(3001 KB) - Full-text XML
-
Supplement
(893 KB) - BibTeX
- EndNote
- Included in Encyclopedia of Geosciences


Organic soils, characterized by large deposits of organic carbon (C) and nitrogen (N), have potentially large fluxes of the greenhouse gases (GHGs) carbon dioxide (CO2), methane (CH4), and nitrous oxide (N2O). Wetlands characterized by organic soils are found in all climate zones, but the largest areas are found in boreal and cool temperate climate zones (Montanarella et al., 2006; Köchy et al., 2015; Conchedda and Tubiello, 2020). Peat is the most common organic soil formed in wetlands classified as peatlands (Histosols), but other organic soil types (often identified as Gleysols, gyttja, or muck) can be found. Globally, peatlands have been widely subjected to land use change for agriculture and forestry or peat extraction (Joosten, 2010). Of the peatlands and other wetlands in the European Union, ca. 20 % are under anthropogenic land use and land use change (UNFCCC, 2017).
Wetlands, typically characterized by a high soil water table level (i.e. the distance of the water table in soil from the soil surface, and from here onwards we use WT), are usually drained to improve aeration and nutrient availability for crops grown in agriculture and trees in forestry or to ease peat extraction. A lowered WT enhances aerobic decomposition in organic matter and thus the mobilization of C and N stores in organic soils (e.g. Post et al., 1985; Kasimir-Klemedtsson et al., 1997; Ernfors et al., 2008; Petrescu et al., 2015; Abdalla et al., 2016; Pärn et al., 2018). Drainage and land cover changes together alter rates in several processes: biomass growth, dead organic matter (litter) inputs into the soil, and litter and soil organic matter decomposition, leading to changes in GHG fluxes. Measurements of changes in soil and vegetation C stocks and GHG flux rates over time can be used to estimate the ecosystem GHG balance.
Drained organic soils are identified as a significant source of atmospheric GHG emissions in the national inventories under international treaties (IPCC, 2014; Oertel et al., 2016; Wilson et al., 2016). Currently, the IPCC (2006) agriculture, forestry, and other land use (AFOLU) guidance, the IPCC (2014) Wetlands Supplement, and the IPCC (2019) Refinement may be used for reporting annual GHG emissions and removals for soils under anthropogenic land uses, including forests growing on drained organic soils. Area-based emission factors (EFs), describing the net annual GHG (CO2, CH4, and N2O) emissions or removals, have been developed for different land management and environmental conditions. IPCC (2014) provided default EFs for drained organic forest soils (Table 1). The CO2 EF for forest soils describes the annual difference between the amount of C added to the soil as above- and below-ground litter and the CO2 efflux resulting from the decomposition of litter and soil, the estimation depending on the monitoring method used in data collection (Jauhiainen et al., 2019). EFs for CH4 and N2O are based on the net gas exchange between the soil surface and the atmosphere.
Table 1IPCC (2014) Tier 1 CO2, CH4 and N2O emission factors (EFs) for boreal and temperate drained organic forest soils, as the average (Avg), uncertainty (95 % confidence limits, CI) and number of observations (i.e. the number of sites) in the category (N).
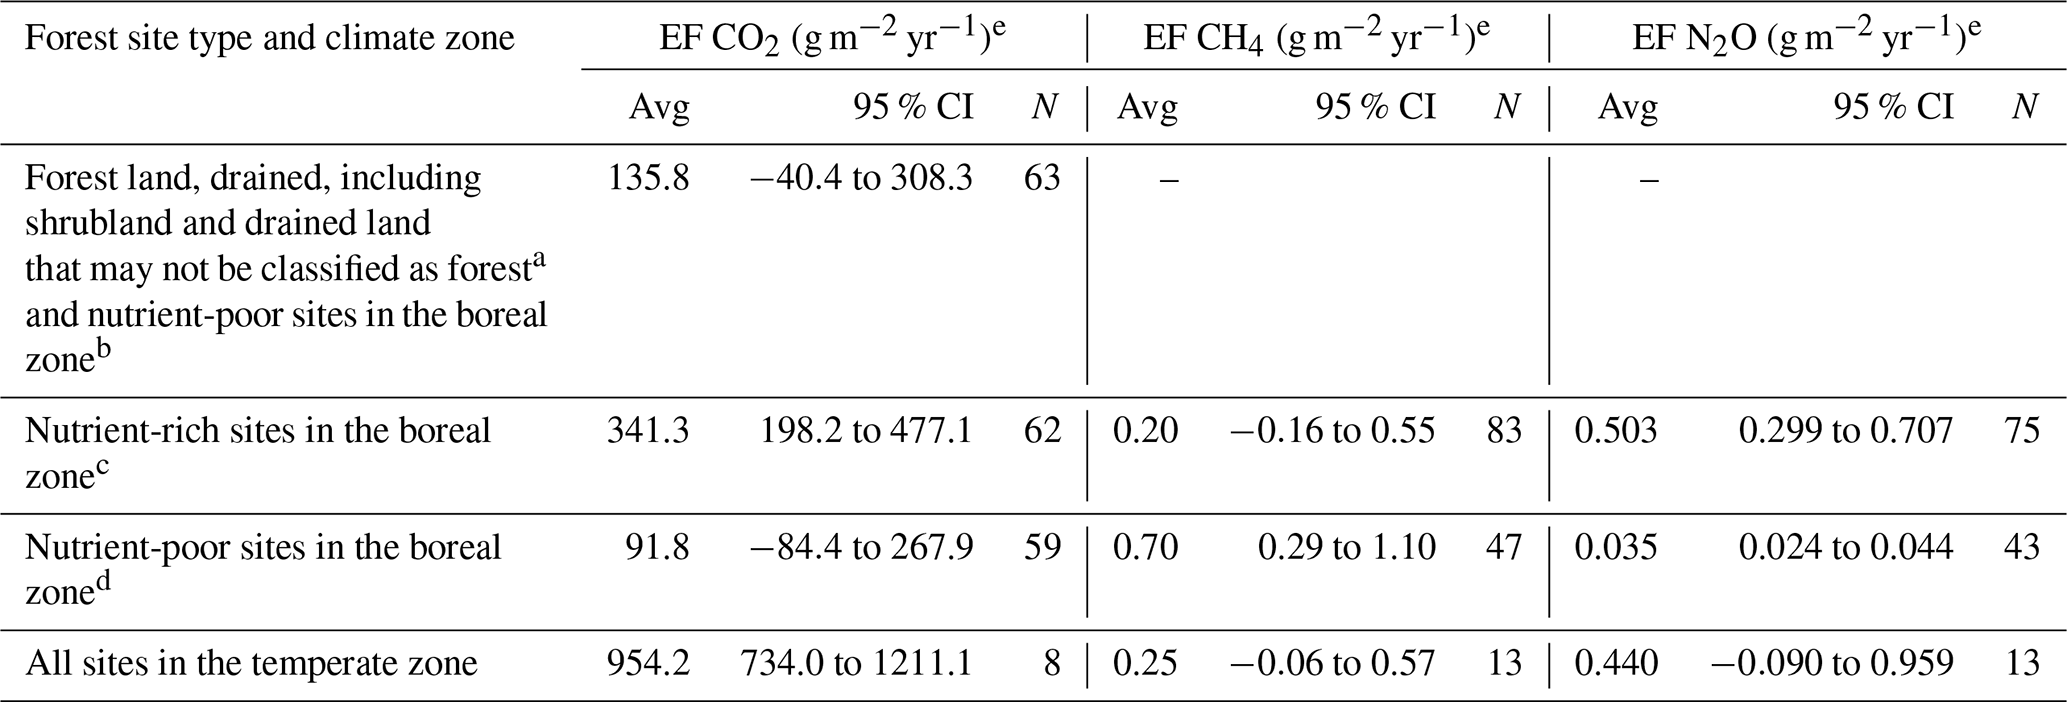
a Sites with poor tree growth due to extremely low nutrient availability, nutrient imbalance or wetness but still fulfilling the minimum criteria as in the FAO's Forest Resources Assessment (FRA, 2018). b This corresponds to “low-productivity and typical-productivity NuP”. c This corresponds to “low-productivity and typical-productivity NuR”. d This corresponds to “typical-productivity NuP”. e Values are converted from Tables 2.1, 2.3, and 2.5 in IPCC (2014), where the unit for CO2 is t CO2–C ha−1 yr−1 and the unit for CH4 and N2O is kg ha−1 yr−1.
Countries may opt for different methodological levels in their GHG reporting by applying the default IPCC EFs (Tier 1), EFs based on country-specific data (Tier 2), or repeated national inventories and/or advanced modelling (Tier 3). The Tier 1 EFs for drained organic forest soils are average emission values based on peer-reviewed studies covering a wide range of situations categorized by climatic zones, and at the most detailed level the EFs are specified for nutrient-poor versus nutrient-rich conditions (Table 1). However, such simple classification lumps together a wide range of conditions and forest types differing in vegetation communities, C-input rates, and GHG efflux from decomposition processes. For the temperate zone, there is only one EF based on an average of all the published emission rates.
The high uncertainties in the Tier 1 EFs motivate developing Tier 2 and Tier 3 EFs and using existing data more efficiently (IPCC, 2014; Oertel et al., 2016; Tubiello et al., 2016; Kasimir et al., 2018). The C balance in the soil is linked to soil nutrient status as the vegetation that contributes to the C balance through tree stand growth, species composition, and thus the amount and quality of litter deposited on the forest floor and below the ground differs between nutrient-rich and nutrient-poor sites (e.g. Minkkinen et al., 1999; Ojanen et al., 2010, 2013, 2019; Uri et al., 2017). Environmental factors influencing the annual release of CO2 from decomposition include temperature conditions that differ from south to north with faster decomposition in the south (Ojanen et al., 2010) and oxygen availability for aerobic decomposers (Pearce and Clymo, 2001; Jaatinen et al., 2008; Ojanen and Minkkinen, 2019). Increasing depth of the oxic soil layer in the growing season, controlled by (artificial) drainage, increases the biomass of aerobic decomposers, fungi, and bacteria in peat soils (Jaatinen et al., 2008), especially at the nutrient-rich sites (Peltoniemi et al., 2021). To further develop the EFs, the essential environmental variables controlling emissions must be identified, monitored, and reported regularly (Jauhiainen et al., 2019).
Drained organic forest soils generally vary from a small source to a small sink of CH4 (e.g. Ojanen et al., 2010; Rütting et al., 2014; Minkkinen et al., 2018). Methane, formed by methanogenic archaea in anoxic, water-saturated soil layers, forms an energy source of methanotrophic bacteria in oxic soil layers, the extent of which depends on the WT (Sundh et al., 1994; Larmola et al., 2010), and the proportion of oxidized CH4 is avoided emission. Further, plant species composition is linked to soil CH4 balance and, especially, the abundance of sedges is a good predictor of CH4 emissions (Nykänen et al., 1998; Dias et al., 2010; Couwenberg and Fritz, 2012; Turetsky et al., 2014). The plant communities at different site types and under different drainage conditions can thus result in different levels and directions of CH4 transfer between the soil and the atmosphere.
High soil N content and redox conditions that vary between oxidative and reductive are favourable for N2O production in organic soils (Regina, 1998; Pärn et al., 2018). Drainage-induced decomposition creates favourable conditions for the nitrification of ammonium (NH) to nitrate (NO. This process leads to N2O production due to inefficient processing to ammonium. If there is an excess of NO under wet conditions, N2O may be produced during the dissimilatory reduction of NO to NH (DNRA). Thus, N-rich drained sites with temporal changes in water saturation have the highest potential for N2O emissions (Martikainen et al., 1993; Ojanen et al., 2013; Minkkinen et al., 2020).
Most drained organic forest soils are a result of the drainage of natural peatlands for forestry. In other words, they are “forestry-drained” sites. However, some drained organic forest soils have been formed by afforesting former agricultural lands (i.e. pastures and croplands) or cutaway peat extraction areas by seeding or planting trees. Afforested agricultural lands have likely been subject to frequent tilling, fertilization, and other soil amendments (e.g. sand or lime) for up to several decades, which have modified the soil nutrient status. Afforested peat extraction areas normally have only the millennia-old bottom peat left, possibly mixed with some underlying mineral matter. Management history may thus possess legacy effects, which potentially change the soil GHG exchange levels in comparison to forestry-drained sites (e.g. Meyer et al., 2013; Mäkiranta et al., 2007; Lohila et al., 2007). Further, different types of organic soils (e.g. peat, muck, gyttja) may have different soil GHG exchange levels due to differences in physical or chemical soil properties. The most common soil type may vary regionally. For example, Andosols are more common than Histosols in Iceland (Arnalds, 2015). So far, many GHG studies have been carried out on organic soils that were not explicitly classified as peat (e.g. Ball et al., 2007; Mander et al., 2008; McNamara et al., 2008; Christiansen et al., 2012), but Tier 1 EFs are an average of data from all organic soil types together (IPCC, 2014). Uncertainty in Tier 1 EFs can thus be expected to decrease by both an increase in the number of soil GHG balance estimates in the present categories and by using more specific categories.
Part of the uncertainty in the IPCC CO2 EFs for drained organic forest soils may derive from differences between GHG flux monitoring methods (chamber versus eddy covariance techniques) and soil C stock inventory methods that produce very different types of data (Jauhiainen et al., 2019). In IPCC (2014), flux and stock inventory data were pooled together. Gaseous flux monitoring enables linkage of the monitored CO2 dynamics to the environmental conditions prevailing during the monitoring period, whereas the estimate in soil C stock inventories is a net change in soil C stocks over decade-long periods in the past. The soil CO2 balance estimates based on these fundamentally different methods could, and should, be compared if sufficient data representing comparable site conditions exist.
Soil chemical and physical characteristics, vegetation community (tree stand composition and stock, ground vegetation), weather and climate (e.g. amount and distribution of precipitation and temperature), and position in the landscape (e.g. altitude, latitude) may influence soil C and N dynamics and are to a varying extent included in the publications collected for this study (Jauhiainen et al., 2019). However, to our knowledge, no previous study has systematically assessed the correlations of soil GHG balance estimates with these characteristics. If significant correlations can be found, they may be utilized in modelling and developing dynamic Tier 3 EFs.
We compiled published peer-reviewed soil CO2, CH4, and N2O exchange data for drained organic forest soils under typical management conditions in the boreal and temperate zones to evaluate the extent to which these data would allow the development of higher-tier EFs. We focused on data that have been used, or that have the potential to be used, to estimate annual soil GHG balances as in the IPCC (2014) Wetlands Supplement. From here onwards we use “annual soil GHG balance” for site-level estimates and “emission factor (EF)” for estimates pooled into different site type categories as averages. Our goals were to investigate (a) how the EFs of CO2, CH4, and N2O and their uncertainties differ between site-type-specific categories and the broad categories applied in the IPCC Tier 1 EFs, i.e. whether this uncertainty can be reduced by the use of more specific categories; (b) comparability of CO2 EFs based on flux data and inventory data; (c) the potential sources of EF uncertainty detectable in the data; and (d) the extent to which the site-specific annual soil GHG balances correlate with site-specific variables for weather, climate, soil, and vegetation and thus could serve the development of models aiming at higher EF tiers. Methodological issues related to different measuring methods were assessed in Jauhiainen et al. (2019) and are thus not generally dealt with in this paper.
We compiled CO2, CH4, and N2O flux data from the peer-reviewed literature focusing on drained organic forest soils in boreal and temperate cool and moist climate areas as defined in the IPCC (2006). We utilized the database compiled by Jauhiainen et al. (2019) and complemented it until the end of the year 2019. The methods applied in the CO2 data collection in the assessed publications included repeated soil C stock inventories and GHG flux measurements by chambers and by eddy covariance, and thus “inventory data” and “flux data” were identified in the database (Sect. S1 in the Supplement). All CH4 and N2O estimates were based on flux data collected by closed chambers. For chamber methods, each annual soil CO2 balance estimate for a site is the estimated net outcome of C fluxes into the soil in above-ground and below-ground litter and C losses in the decomposition of litter and soil organic matter for a 1-year period. For eddy covariance studies, the annual soil CO2 balance is estimated as net ecosystem exchange minus net primary production. For soil inventory methods, annualized soil C stock change is used as the estimate. “Annual soil CH4 and N2O balance” estimates are annual cumulative GHG fluxes based on flux-data collection.
2.1 Criteria for data selection
Organic soils were defined by a thickness of the surface soil organic layer of at least 10 cm and a minimum organic C content of 12 % by mass, even if the soil is mixed to a depth of 20 cm (as in Annex 3A.5 in IPCC, 2006). In practice these organic soils included peat and soils identified as Gleysols or muck (histosol with sapric soil material). The organic soils other than peat were collectively named “other organic soils”. For the definition of forests, we included sites specified as forests in the original publications unless the described site characteristics differed from the specifications applied in IPCC (2014), where the minimum criteria are a forest canopy coverage of at least 10 % of the area, a continuous forest area size of more than 0.5 ha, and trees with a minimum height of 5 m in maturity on the site (as in FRA, 2018).
The studied forests were assumed to be under typical management, so sites with excessive experimental fertilization or extreme hydrology intervention were excluded. If a site was afforested after another land use, a period of at least 20 years as forest land was used as a criterion (as in IPCC, 2014). Forests at drained sites that were already forested before draining or planted at a site specifically drained for forestry are hereafter referred to as “forestry-drained”, and “afforested” is applied for sites that were previously used for other purposes, i.e. in practice agricultural use or peat extraction.
2.2 Pre-processing
Data collection was done by assessing publications that provided either complete annual soil GHG balance estimates or flux estimates with the potential for estimating the annual soil GHG balance by using available supplemental data (see Jauhiainen et al., 2019). Annual soil CO2 balance estimates based on eddy covariance flux monitoring and soil inventories (transformed from C values given in the original publications to CO2) were all added in the database without change.
The need for further processing to obtain an annual soil balance estimate was more common for CO2 data than for CH4 and N2O data. The further processing of flux data was based on site-specific data or site-type-specific data from the same climate zone, which were searched for in the literature or obtained on our request from either the authors or other specialists familiar with the conditions of the site or site type. Data were excluded if specific enough supplemental data for estimating an annual soil balance were not found. The processing is described in Sect. S1. The processing included e.g. the incorporation of annual litter input and decomposition rates in the estimates for studies where the ground surface in CO2 flux monitoring points was kept free of litter (9.2 % of the estimates in the boreal zone). If the total soil CO2 respiration was quantified, the autotrophic root respiration contribution in the total flux was proportioned by a coefficient to form an estimate of CO2 emission from decomposition (0.8 % of the estimates in the boreal zone and 78.8 % of the estimates in the temperate zone). Some studies provided estimates of warm-season flux only (1.9 % of CO2, 9.9 % of CH4, and 0.6 % of N2O estimates in the data), and we supplemented such data with cold-season flux by applying annualization coefficients.
2.3 Structure of the database
While the IPCC (2014) EFs were based on 13 studies for CO2, 23 for CH4, and 20 for N2O, we were able to increase the number of studies to 28 for CO2, 33 for CH4, and 32 for N2O (Sect. S1). Our search resulted in 595 annual soil GHG balance estimates: 210 about CO2, 222 about CH4, and 163 about N2O (Fig. 1). Most of the CO2 estimates were from boreal peatlands in Finland, and temperate zone data were mostly from Sweden. Of the CO2 data, 49 annual soil balance estimates were based on soil C stock inventories and 161 on flux measurements (4 by eddy covariance and 157 by chamber measurements) (Table S1 in the Supplement). In about 95 % of the studies, the soil type was peat.
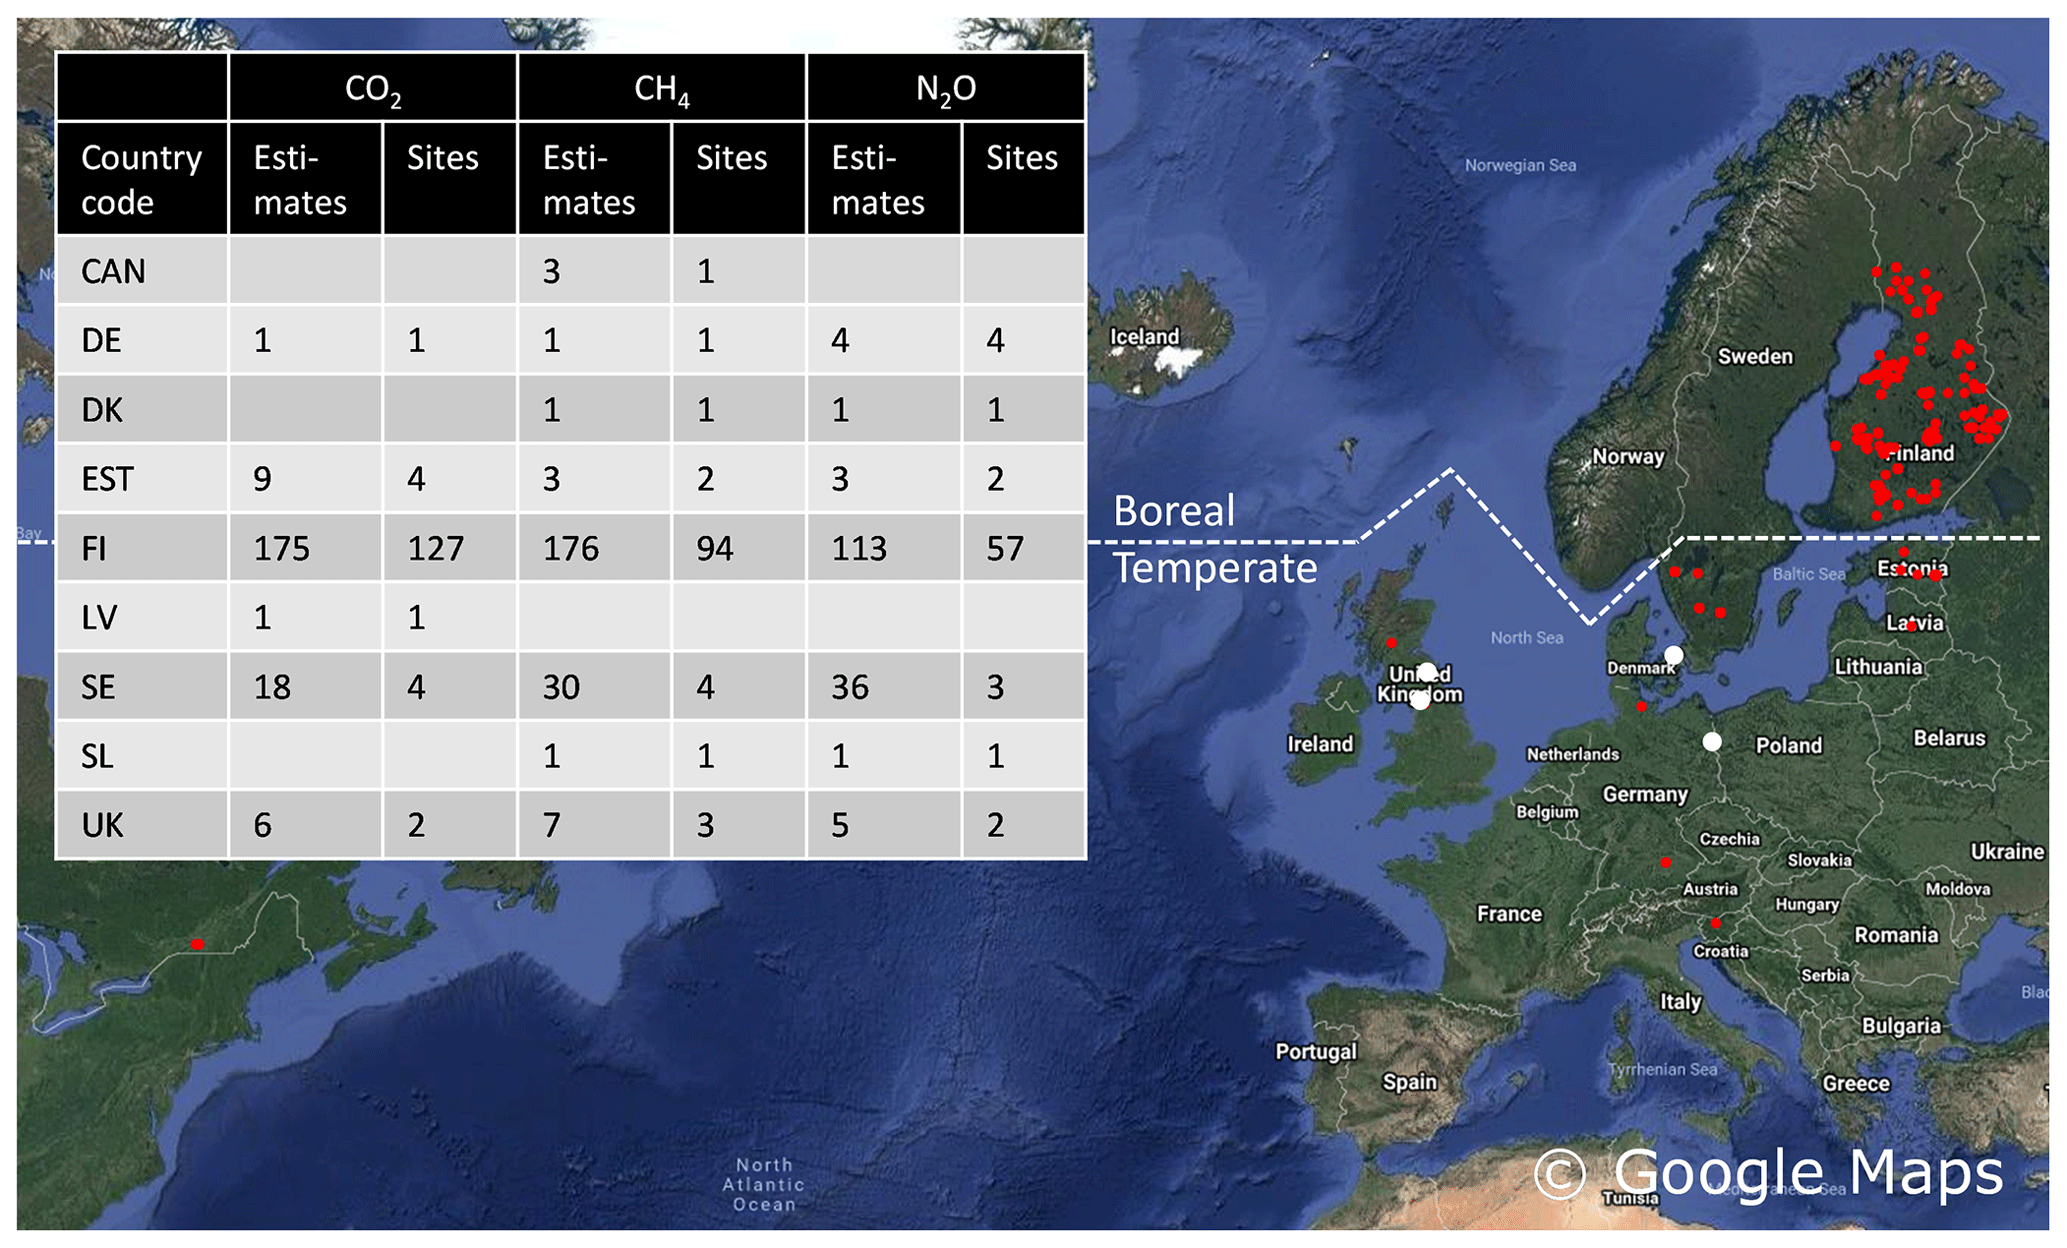
Figure 1Monitoring sites providing annual soil GHG balance estimates for drained organic forest soils (red: peat, white: other organic soils) in the boreal and temperate zones. “Estimates” show how many different annual estimates were available from the sites.
Each site in the database was identified using coordinates and site type information from the original publications. Multi-year GHG fluxes were available for most (55 %–78 %) of the sites, and in these cases we recorded each annual GHG balance estimate as a single observation.
Site-specific data on climate, soil, and vegetation in the database were collected from the publications and used to define the specific categories for which EFs were estimated. Methodology records include the monitoring method, the number of spatial replicates, the data collection year and period, and the flux monitoring frequency. Management records include the documented site management history (e.g. time since drainage, previous land use, fertilization applications, and information on planting and harvesting). Records on soil and hydrology include soil type, soil nutrient concentrations (C, N, P, C : N, P : N), pH, bulk density, peat depth, and WT characteristics. Records on site characteristics include a general nutrient status description (ombrogenic versus minerogenic, nutrient-poor versus nutrient-rich), stand type, ground vegetation characteristics, and tree stand characteristics (stand type, stand-level basal area and stem volume, and number of trees per hectare). Temperature and precipitation conditions at the site locations for the measurement years (“weather”) and over the previous 30 years (“climate”) were also collected from the publications and, if needed, appended by data from the weather services closest to the site.
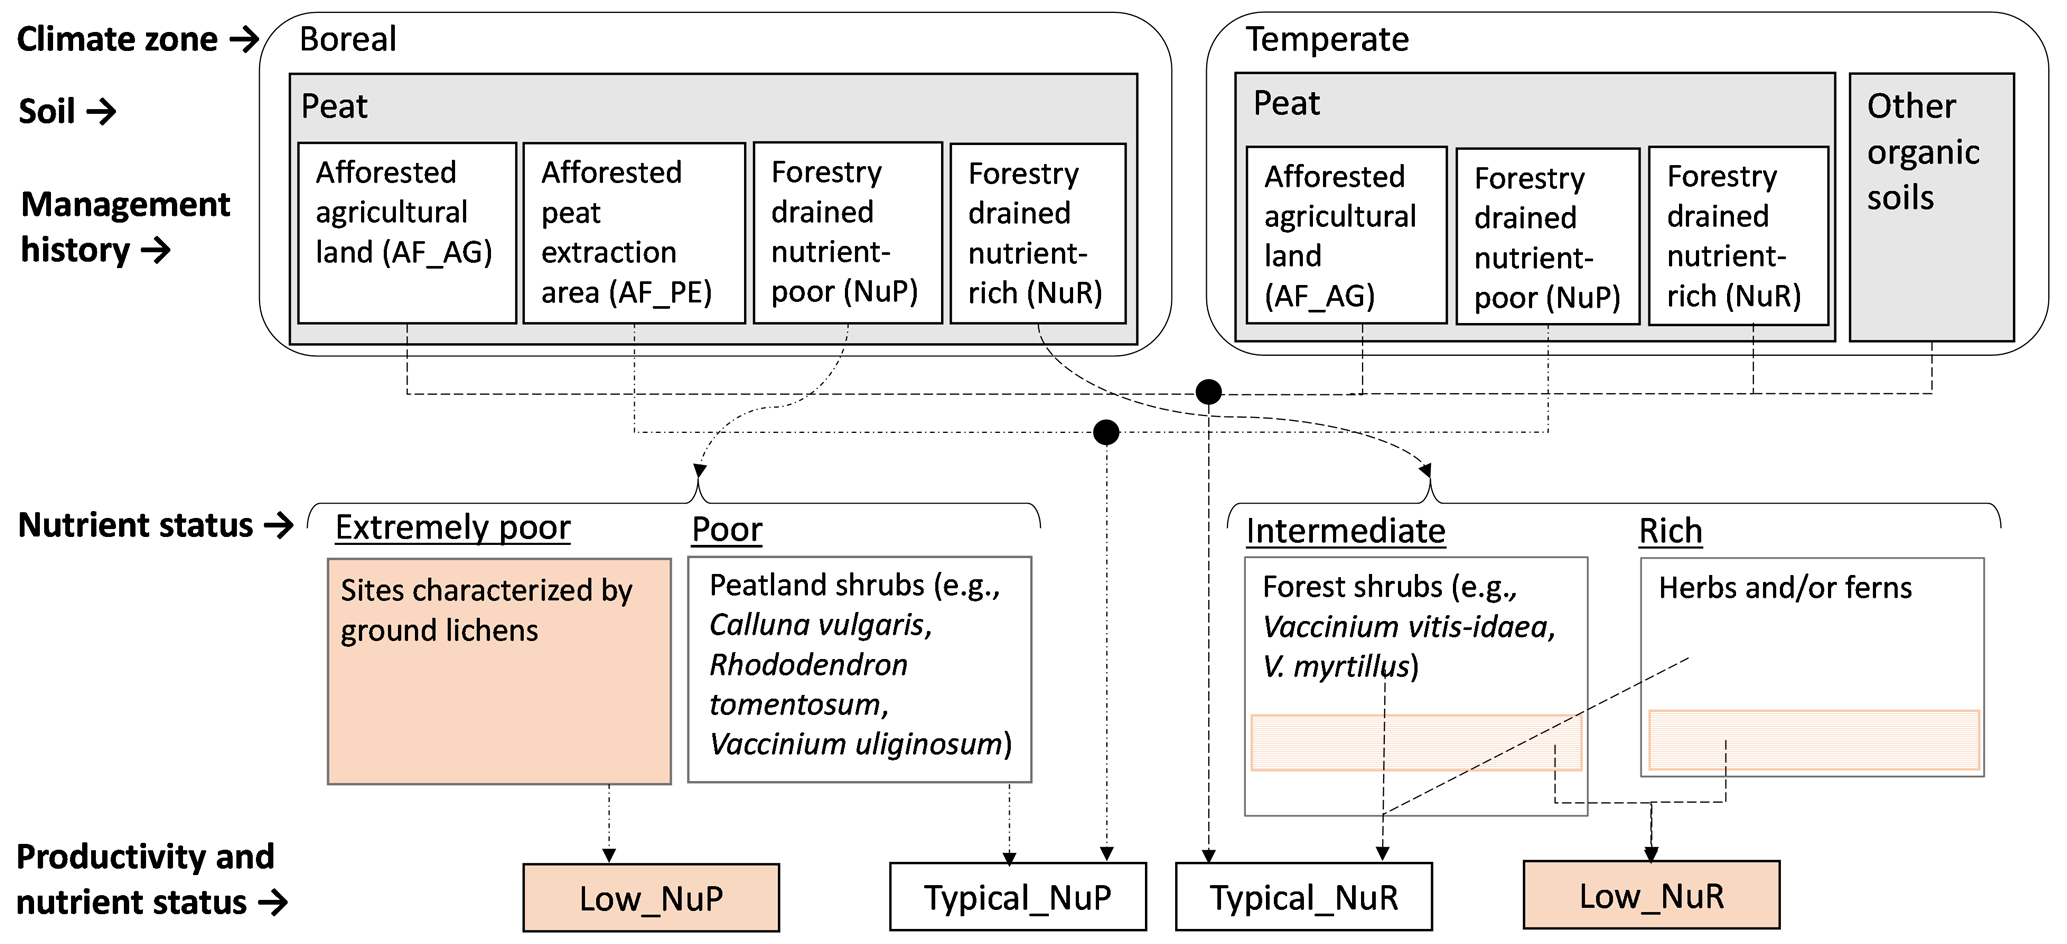
We categorized the monitoring sites in different ways to evaluate how to use the data most efficiently for forming EFs. The most detailed categorization was done to boreal forestry-drained sites only, as they were represented by the clearly highest number of sites. The categories were based on climate, management history, nutrient status, ground vegetation, and forest productivity (Fig. 2 and Fig. S1 in the Supplement).
- –
Climate zone categories “Boreal” and “Temperate” based on FAO climate or vegetation zones (Fig. 4.1 in Vol. 4, Chap. 4, IPCC, 2006)
- –
Soil type categories “Peat” and “Other organic soils”
- –
Land management history categories “Forestry-drained”, “Afforested from agricultural use”, “AF_AG”, and “Afforested from peat extraction”, “AF_PE”. Afforested sites were divided into these two categories since their soils may be considered quite different due to land use legacies: AF_AG is generally nutrient-rich and AF_PE is nutrient-poor, with likely differing soil GHG balances (e.g. Basiliko et al., 2007; IPCC, 2014).
- –
Nutrient status categories (two levels) “Nutrient poor” (“NuP”) and “Nutrient rich” (“NuR”) for forestry-drained sites, based on ombrogenic or minerogenic conditions prevailing before drainage as reported in the publications or deduced from the information presented. In comparisons to IPCC (2014) EFs, “Other organic soils” and AF_AG sites were considered to be nutrient-rich and AF_PE sites nutrient-poor.
- –
Nutrient status categories (four levels) for forestry-drained boreal peatland sites: “Extremely poor”, “Poor”, “Intermediate”, and “Rich”. This categorization was based on ground vegetation characteristics, for which nutrient status indicator information is available from classification studies and guidebooks (Päivänen and Hånell, 2012).
- –
Forest productivity categories “Typical” and “Low” for boreal forestry-drained sites, defined by combining information on site characteristics such as tree stand characteristics, soil nutrient status, and drainage conditions, and when floristically defined, site type was available together with information on site type suitability for wood biomass production (Fig. S1).
- ∘
-
Sites were placed in the “Low” productivity category when they were poorly stocked (due to extremely low nutrient status, nutrient imbalance, or wetness despite ditches, e.g. Ojanen et al., 2019) but still fulfilled the minimum forest criteria as in the FAO's FRA (2018). This was based on data and productivity studies from Finland, where most of the boreal sites were located (e.g. Laine et al., 2018).
- ∘
-
These categories under nutrient-poor conditions were named “Low_NuP” and “Typical_NuP” and, correspondingly under nutrient-rich conditions, “Low_NuR” and “Typical_NuR”.
- –
Forestry-drained boreal peatland sites were further categorized based on their floristically defined site types that group together sites with similar ecology, soil, and vegetation characteristics, following classifications presented by Päivänen and Hånell (2012). This information was commonly included in the publications in a manner that enabled consistent categorization (Figs. 2 and S1). Sites without such information in the publications were not forced into these categories, however.
- –
EFs were formed for all categories for which a minimum of three annual soil GHG balance estimates from different sites were available.
Further categories and continuous variables based on climate, site, and vegetation characteristics were formed to evaluate their correlations with the EF estimates.
-
Tree stand types formed the categories “Conifer”, “Deciduous”, and “Mixed”.
-
Based on ground vegetation characterized by shrubs or herbaceous plants, we formed categories describing ground vegetation “shrubbiness”: “Yes” (shrubby) and “No” (not shrubby). This was motivated by studies indicating that ericoid shrubs may suppress decomposition (Wang et al., 2015; Wiedermann et al., 2017).
-
Soil C, N, P, C : N, P : N, bulk density, and pH formed continuous variables.
-
The tree stand variables basal area, stem volume, and number of trees formed continuous variables.
-
Continuous weather and climate variables included annual air temperature, annual air temperature sum, mean air temperature in February, mean air temperature in July, annual precipitation, annual air temperature over 30 years, air temperature accumulated sum over 30 years, mean air temperature in February over 30 years, mean air temperature in July over 30 years, annual precipitation over 30 years, site altitude from mean sea level, and site distance from the Arctic Circle.
For comparisons with the Tier 1 EFs in IPCC (2014), we divided our data into comparable categories. The IPCC (2014) category for boreal zone “Forest Land, drained, including shrubland and drained land that may not be classified as forest and Nutrient-poor sites” (referred to in Fig. 3 as “FAO & NuP”) equals our three categories pooled together (“Low_NuP”, “Typical_NuP”, and “AF_PE”), and the “Nutrient-poor sites” category in the IPCC is comparable with our two categories pooled (“Typical_NuP”, “AF_PE”). The boreal zone “Nutrient-rich sites” category in IPCC (2014) equals our three categories pooled (“Low_NuR”, “Typical_NuR”, “AF_AG”). The “Temperate” category in IPCC (2014) includes all data found for the temperate zone and is thus comparable with pooled data from all four of our temperate zone categories (“NuP”, “NuR”, “AF_AG”, and “Other organic soils”).
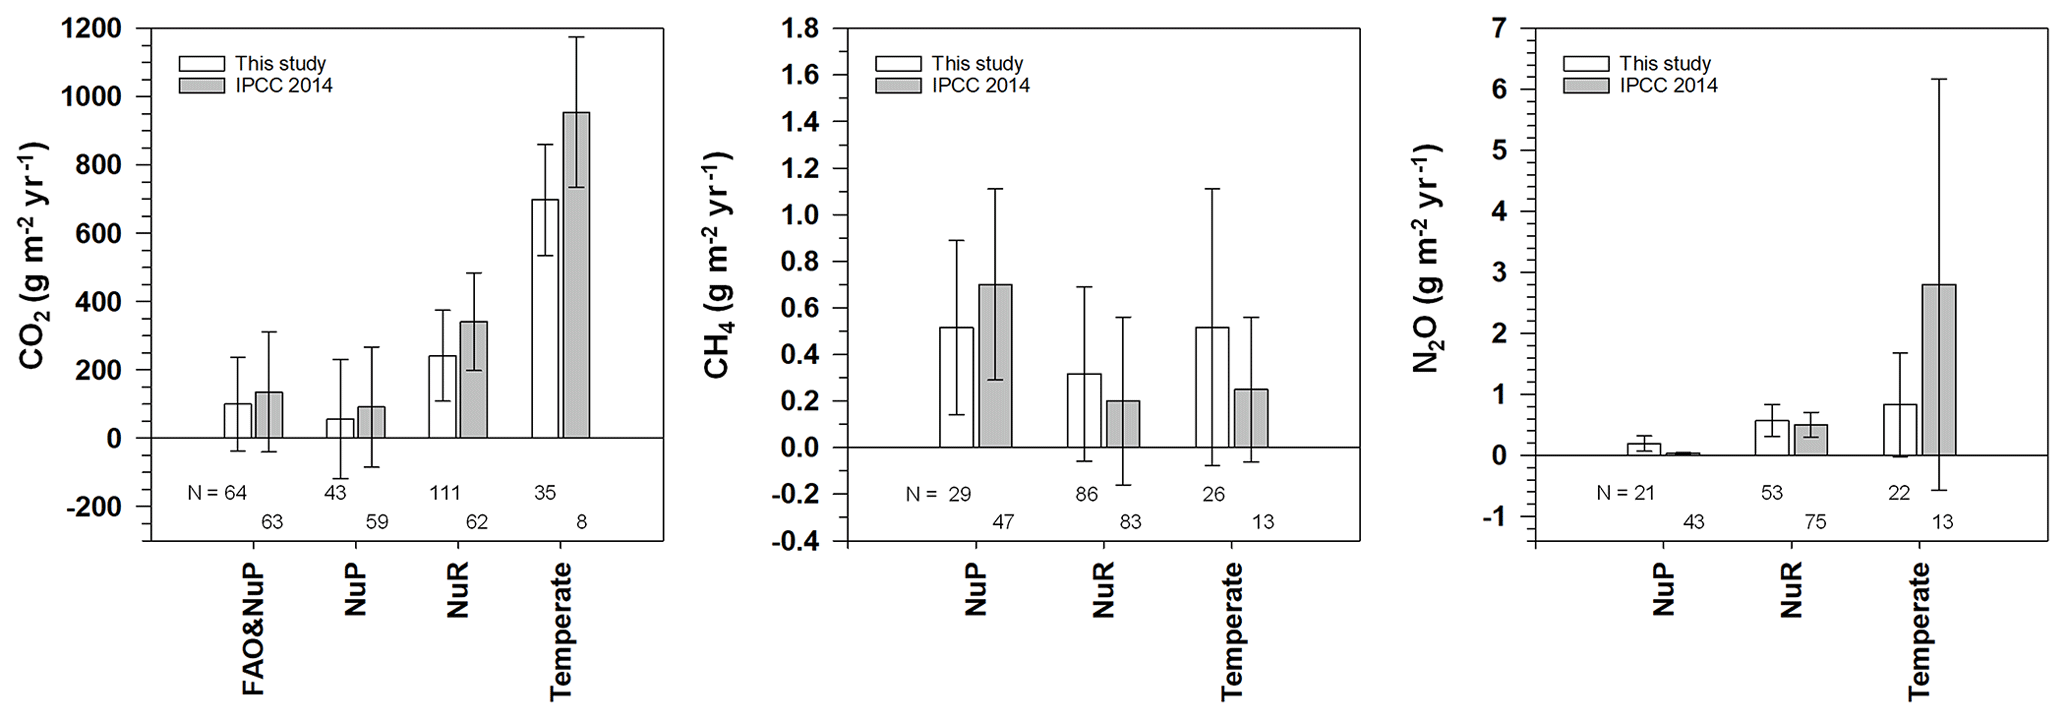
Figure 3Emission factors (EFs) and their 95 % confidence intervals for drained organic forest soils in categories used in IPCC (2014) for boreal and temperate zones: comparison of weighted-mean EFs obtained in this study and EFs in IPCC (2014). The number of sites providing soil annual GHG balance estimates from which the EFs were estimated are below the bars. Categories are explained in Fig. 2 and Table S3, and numerical EF values from IPCC (2014) are in Table 1 and the values from this study are in Table S4.
2.4 Analyses
2.4.1 EFs in different category setups
To form the EFs, we calculated averages only for categories that included at least three soil GHG balance estimates representing different sites (i.e. at least one estimate from three sites in the category). To address differences in flux-data composition based on chamber techniques, e.g. spatial coverage of data collection at the field sites and the origin and quality of data types used for compiling the soil GHG balance estimate, we implemented “relative data reliability weighting” by giving less reliable estimates a weight of 0.5 in selected analyses denoted by “weighted means” (see “Relative data reliability weighting” in Sect. S1 for details). We inspected EFs in the following categories.
-
CO2, CH4, and N2O EFs (weighted means) in categories that were the same as in IPCC (2014)
-
CO2, CH4, and N2O EFs (weighted means) in different nutrient status and productivity categories at forestry-drained and afforested sites and in other organic soils
-
CO2 EFs (weighted means) based on flux data and inventory data
-
CO2, CH4, and N2O EFs (arithmetic means) in forestry-drained peatlands in the boreal climate zone classified into specific site types and site nutrient status categories
2.4.2 Correlations with climate, soil, and vegetation variables
The analysis of annual soil GHG balance correlations with environmental characteristics was restricted to peat soils in forestry-drained sites in the boreal and temperate zones because it formed the largest dataset. This analysis included only GHG data collected by flux monitoring methods because many of the variables were year-specific (e.g. weather variables, tree stand, basal area), and this selection made it possible to combine the annual soil GHG balances with the conditions of specific monitoring years.
In total, 29 variables related to soil, vegetation, weather, or climate were tested for possible correlations with soil GHG balance estimates (Fig. S2). The variables included in the analyses (the reference category for the categorical variables is indicated by an asterisk: *) were the following.
- –
Soil
- ∘
-
Nutrient status (two levels): “Nutrient-poor”* (NuP) and “Nutrient-rich” (NuR)
- ∘
-
Nutrient status (four levels): “Extremely poor”, “Poor”, “Intermediate”*, and “Rich”
- ∘
-
Continuous variables: C, N, C : N, P, P : N, bulk density, pH
- –
Vegetation
- ∘
-
Forest productivity: “Typical”* and “Low”
- ∘
-
Productivity and nutrient status: “Low_NuP”, “Typical NuP”*, “Low NuR”, and “Typical NuR”
- ∘
-
Stand type: “Conifer”*, “Deciduous”, and “Mixed”
- ∘
-
Ground vegetation dominance by shrubs (shrubbiness): “Yes” and “No”*
- ∘
-
Continuous variables describing the tree stand: “Basal area”, “Stand volume of trees”, and “Number of trees”
- –
Weather, climate
- ∘
-
Climate zone: “Boreal”* and “Temperate”
- ∘
-
Continuous variables: “Altitude”, “Distance from the Arctic Circle southwards”, and multiple annual and long-term average temperature and precipitation variables
The analysis was based on linear mixed models with site as a random effect. Data on CH4 and N2O estimates were log-transformed (after adding a small constant to make all the values positive) to make the model residuals more homoscedastic. Less-reliable data (based on the low number of spatial replicates; see “Relative data reliability weighting” in Sect. S1 for details) points contributed to the model fits by half of the weight of others. The means of the soil annual GHG balance by category were estimated using a simple linear mixed model with the intercept only, the site as the random effect, and data restricted to the target category.
Univariate models were first fitted separately for each potential covariate. Multiple linear models were then developed using stepwise regression with backward elimination starting from an initial model containing all covariates that were significant in univariate models, except for the following.
-
Highly collinear covariates were avoided by choosing only one of “Nutrient status”, “Nutrient status” and “Forest productivity”, or their combination “Productivity and nutrient status” and only one of the continuous soil, temperature, and precipitation variables.
-
Of the vegetation variables defining tree stand, the stand volume of the trees was chosen because the others were provided for clearly fewer data points.
-
The climate zone was not used because a wider range of conditions became available for finding correlations between the climate variables and soil GHG balance by using continuous climate variables, and the dataset for the temperate zone was too small to allow within-zone analyses to be done.
The choice between the alternative covariates was based on the Akaike information criterion (AIC) in univariate models fitted to a subset of data for which all the compared covariates were available. In each step of backward elimination, a subset of data was used for which all the current covariates were available, and the least-significant covariate was dropped until all the remaining covariates were significant (p<0.05). For variable selection, continuous covariates were scaled to zero mean and unit variance, but the coefficients presented in the result tables are associated with unscaled covariates.
3.1 EF estimates for the IPCC (2014) Tier 1 EF categories
The EFs estimated in this study were generally in line with the EFs provided by IPCC (2014) (Fig. 3). However, the CO2 EFs in this study were consistently but, based on the confidence intervals, not significantly, lower than the EFs provided by the IPCC. The N2O EFs were higher for boreal nutrient-poor forests (NuP) and clearly smaller for the temperate zone than the EFs by IPCC, but here the confidence intervals also overlap. The confidence intervals were mainly similar in this study and in IPCC (2014), except for a wider interval for the temperate zone CH4 EF and a smaller interval for the temperate zone N2O EF found in this study.
3.2 EF estimates for more specific EF categories
3.2.1 CO2
The average CO2 EFs for the boreal zone showed net emissions (positive flux numbers) in all categories except for a removal for the afforested peat extraction site category (AF_PE: −86 g m−2 yr−1) (Fig. 4; numerical values are available in Table S5). The highest CO2 EFs were in the low-productivity nutrient-poor (“Low NuP”: 269 g m−2 yr−1) and typical-productivity nutrient-rich (“Typical NuR”: 260 g m−2 yr−1) categories using inventory data. The individual soil CO2 balance estimates behind the EFs included both negative and positive values in all the categories, and the lower 95 % confidence limits were negative in all the categories except for the typical NuR category using flux or combined data.
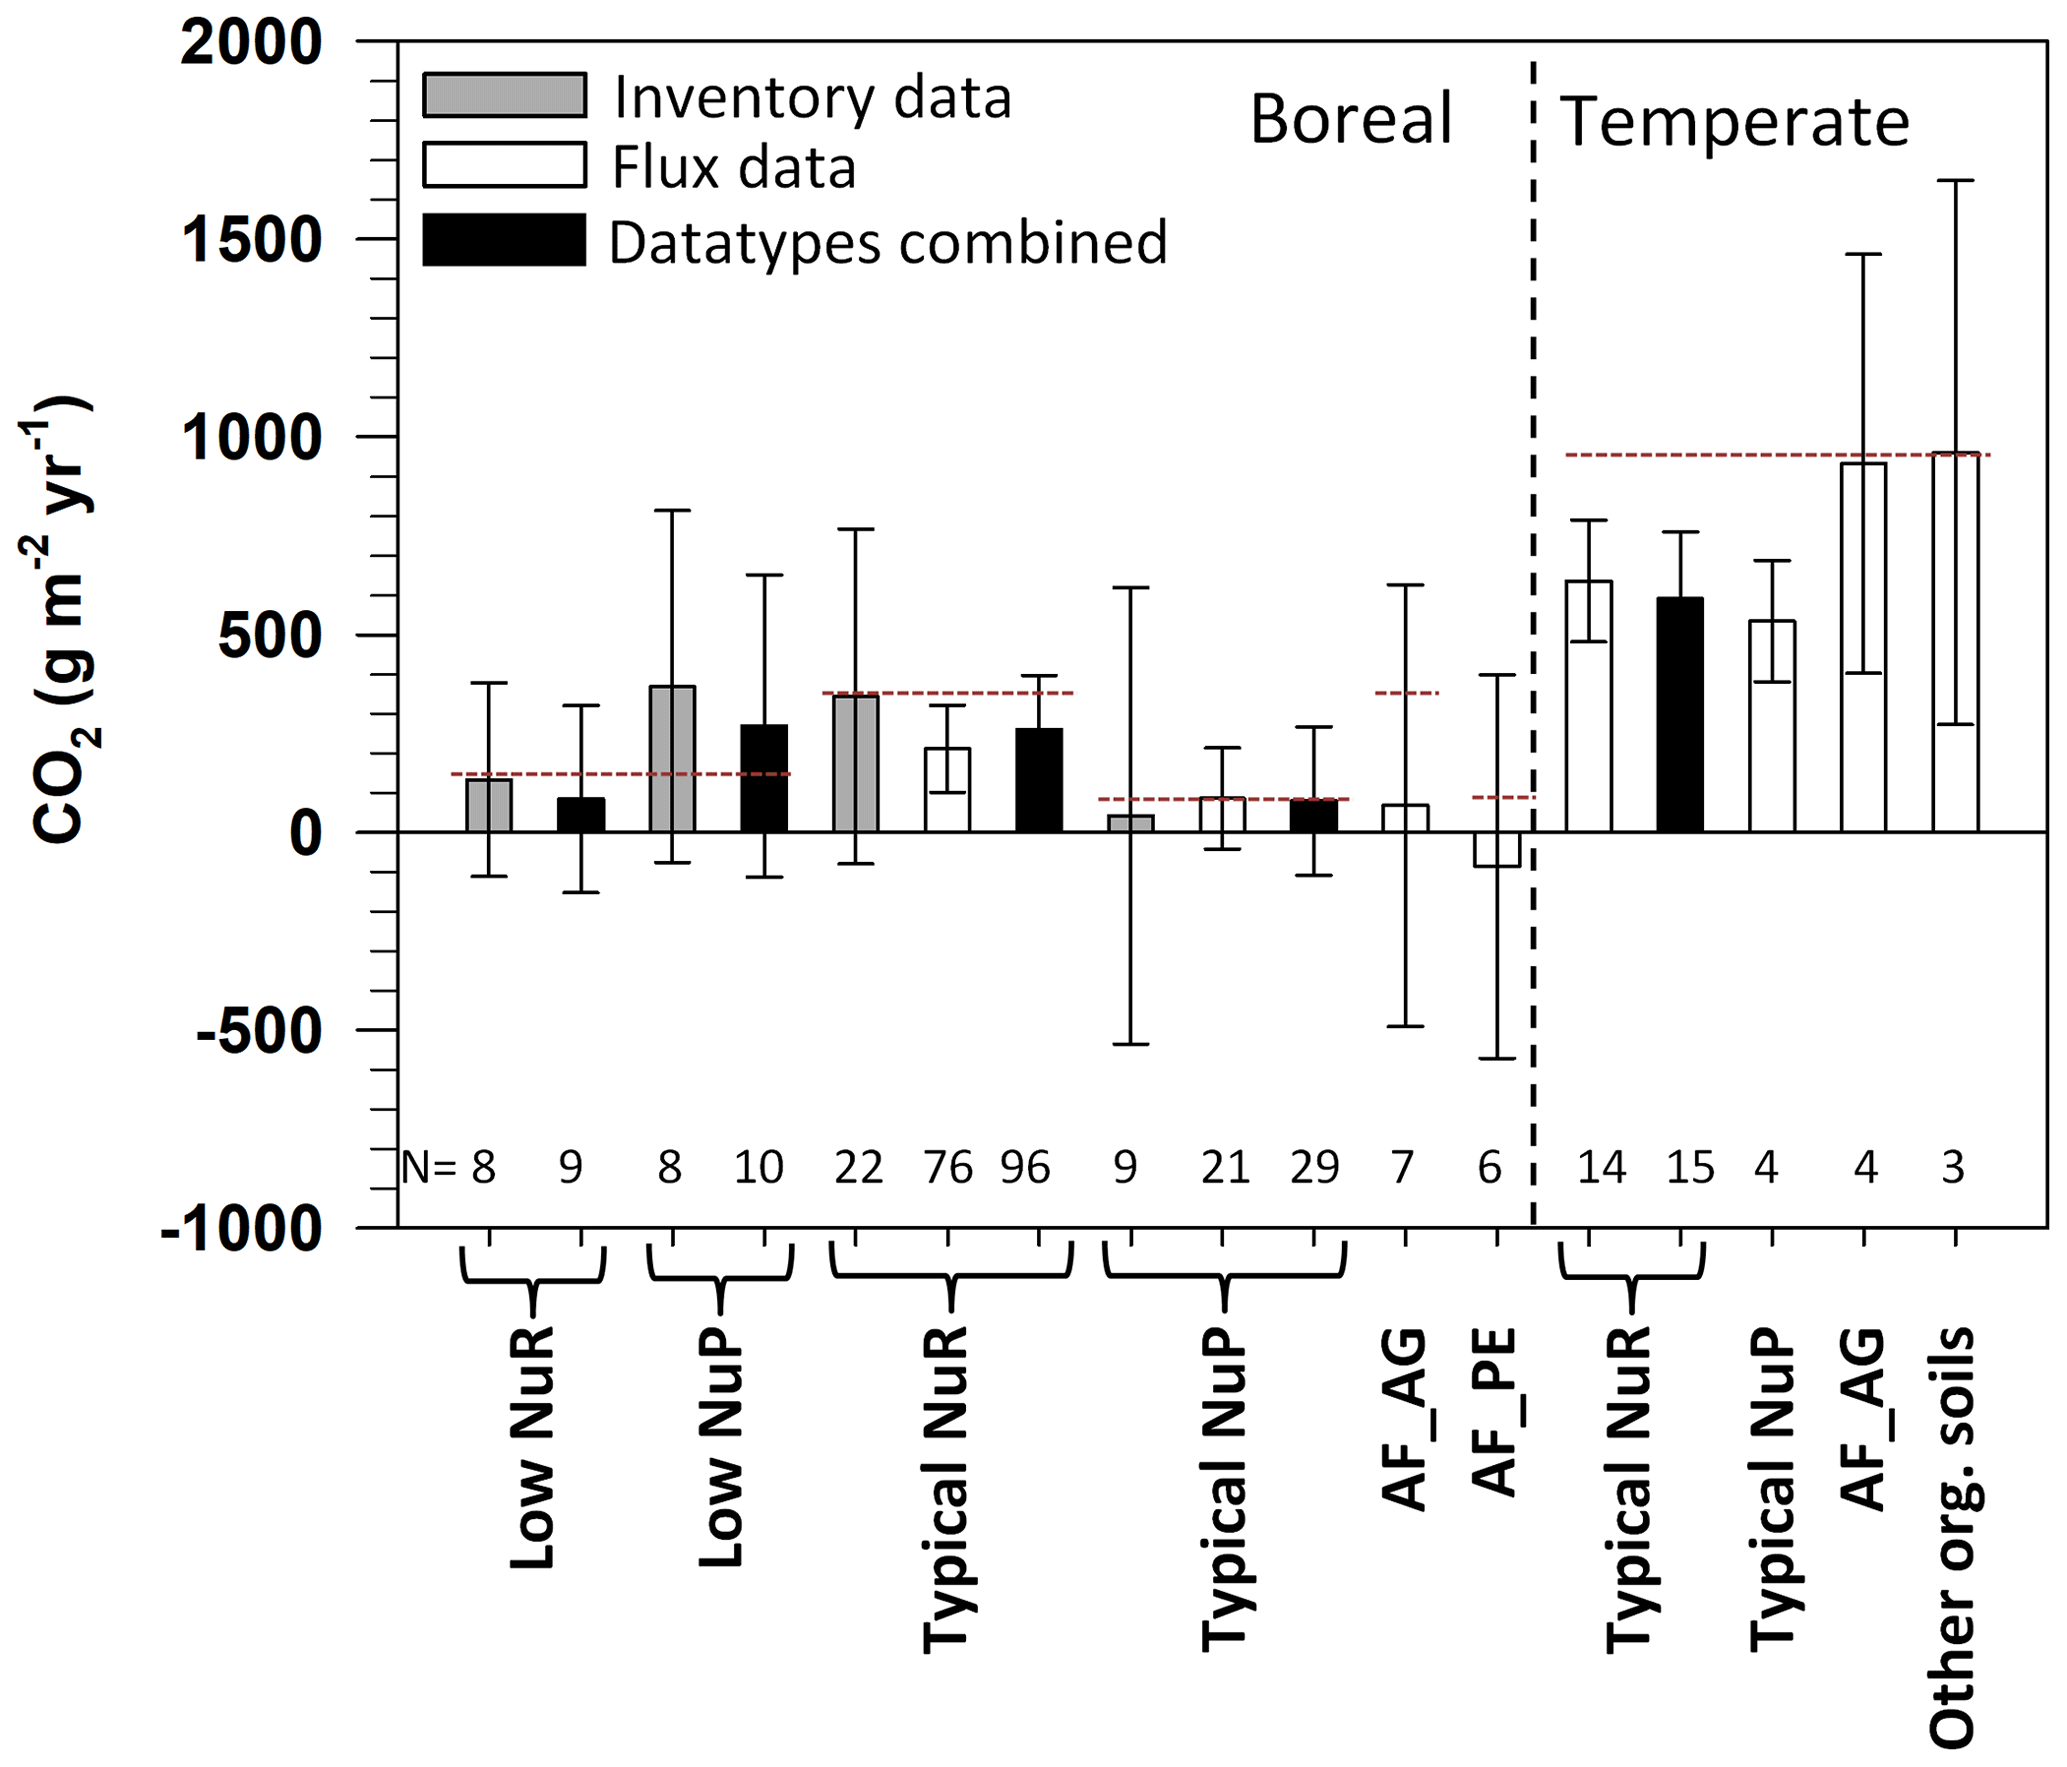
Figure 4CO2 EFs (weighted mean ± 95 % confidence intervals, n) in an expanded set of categories for the boreal and temperate zones. Averages based on only flux data, only inventory data, and combined data are shown when applicable (n≥3). The dotted lines represent IPCC (2014) Tier 1 EF levels for categories including comparable data. Numbers below the bars give the numbers of observations from which the EFs were estimated. Categories are explained in Fig. 2 and Table S3, and the values are in Table S5.
For the temperate zone, the CO2 EFs showed on average emissions in all the categories, and the great majority of the soil CO2 balance estimates were also effluxes (Fig. 4; Table S5). The EFs were highest and the confidence intervals widest in afforested agricultural lands (AF_AG: 932 g m−2 yr−1) and other organic soils (960 g m−2 yr−1). Overall, the EFs were smaller in the boreal zone (maximum 269 g m−2 yr−1) than in the temperate zone (minimum 535 g m−2 yr−1).
Boreal typical-productivity forestry-drained categories included enough estimates based on both flux and inventory data to allow comparison of EFs. Inventory data resulted in higher EFs for nutrient-rich sites, and flux data resulted in somewhat higher EFs for nutrient-poor sites (Fig. 4). The confidence intervals were overlapping, however. For the low-productivity categories there were not enough flux data for specific EFs, but the flux-data estimates were generally smaller than the inventory data estimates, as shown by EFs with pooled data (Fig. 4).
The CO2 EFs averaged for more detailed nutrient status categories were generally emissions into the atmosphere, except for the EF for extremely nutrient-poor sites based on flux data (Fig. 5; Table S4), whereas the median values were closer to zero and could indicate either emission or removal. Both mean and median CO2 values were relatively similar between inventory and flux data in most categories, but a higher count of outlier values was more typical for the flux data. The most notable difference between the measurement approaches was observed for low-productivity forests in the extremely nutrient-poor sites, where inventory data resulted in high emissions (mean 369 g m−2 yr−1, median 495 g m−2 yr−1), but the few available flux-data estimates indicated removals or close-to-zero values (Fig. 5).
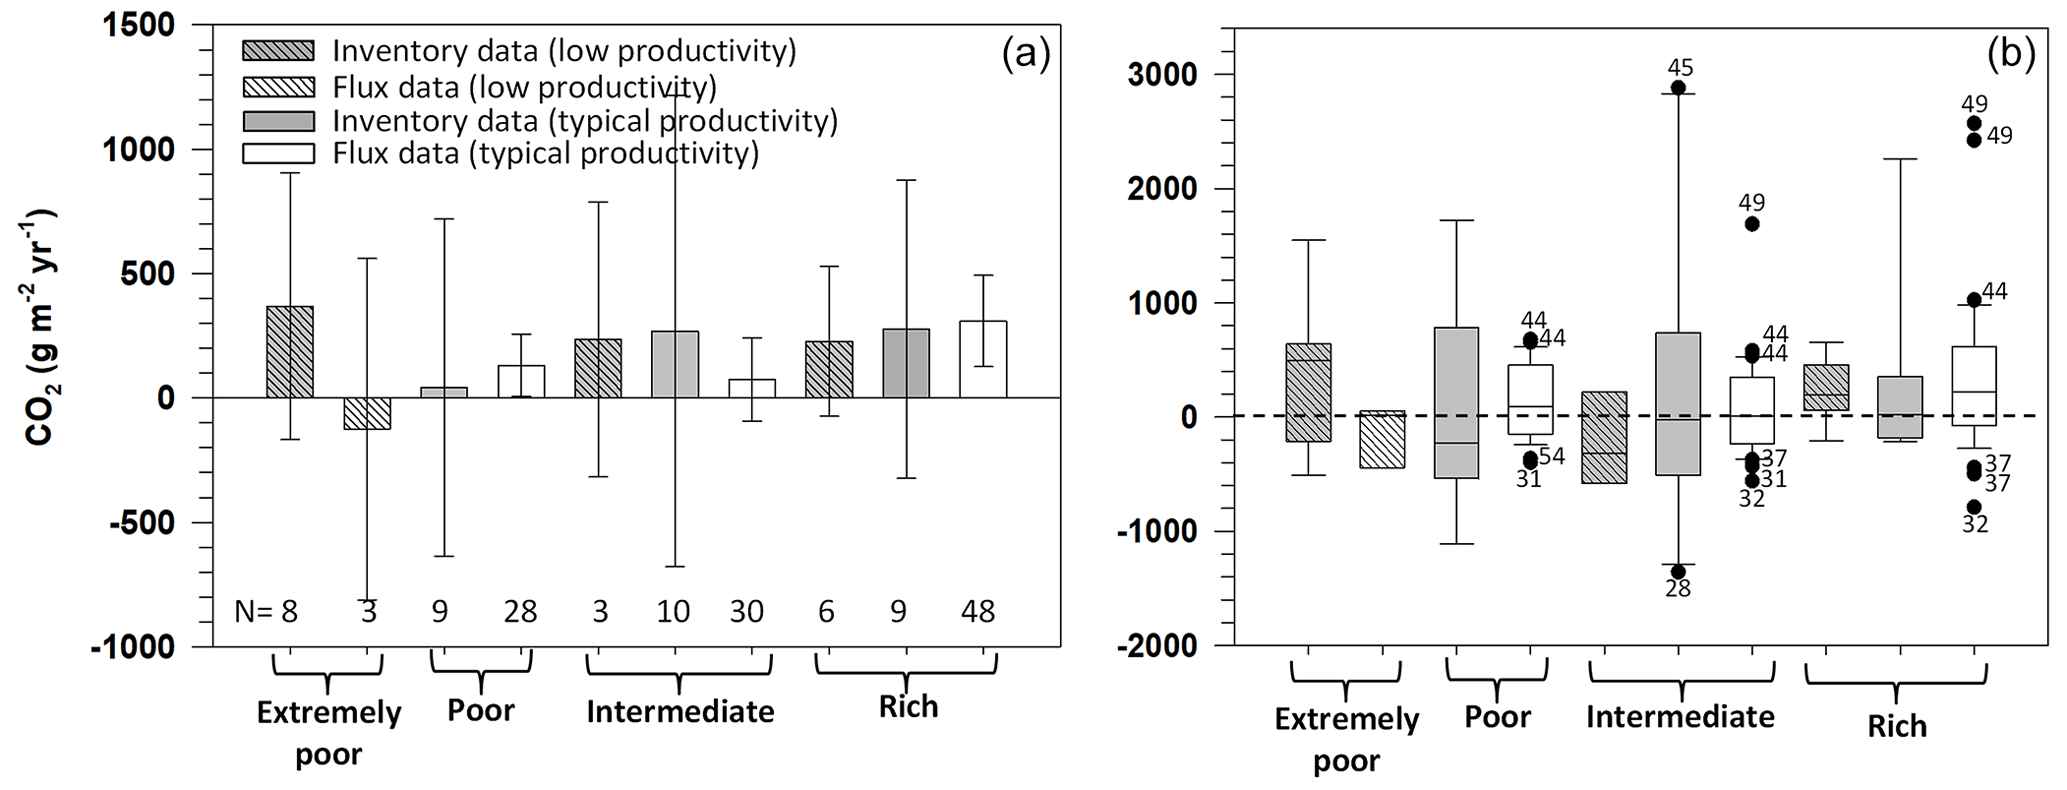
Figure 5CO2 EFs for four nutrient status categories further divided into low and typical productivity of boreal zone forestry-drained peatlands. The estimates are shown as the arithmetic mean ± 95 % confidence intervals (a) and as boxplots (b) and separately for flux and inventory data when applicable (n≥3). In the boxplots, the central line inside the bar shows the median; the bottom and top box lines show the first and third quartiles, respectively; the whiskers show the maximum and minimum values; and the circles represent outliers. Numbers below the bars (a) give the numbers of observations from which the EFs were estimated (the same for both panels), and the numbers next to the outliers in the boxplots (b) refer to the publications listed in Table S1. The categories are explained in Figs. 2 and S1 and in Table S3.
3.2.2 CH4
The highest CH4 EF was observed for boreal low-productivity nutrient-poor forestry-drained peatlands (Low NuP; 2.48 g m−2 yr−1) and was clearly higher than the EF for nutrient-poor sites in IPCC (2014) (Fig. 6; Table S5). The EF for the typical-productivity nutrient-poor category remained at the same level as the IPCC EF, while the EF for nutrient-rich forestry-drained peatlands was somewhat higher than the IPCC one. CH4 EFs in the two boreal afforested site categories showed minor removals (from −0.36 to −0.63 g m−2 yr−1) from the atmosphere, in contrast to the IPCC EFs (Fig. 6).
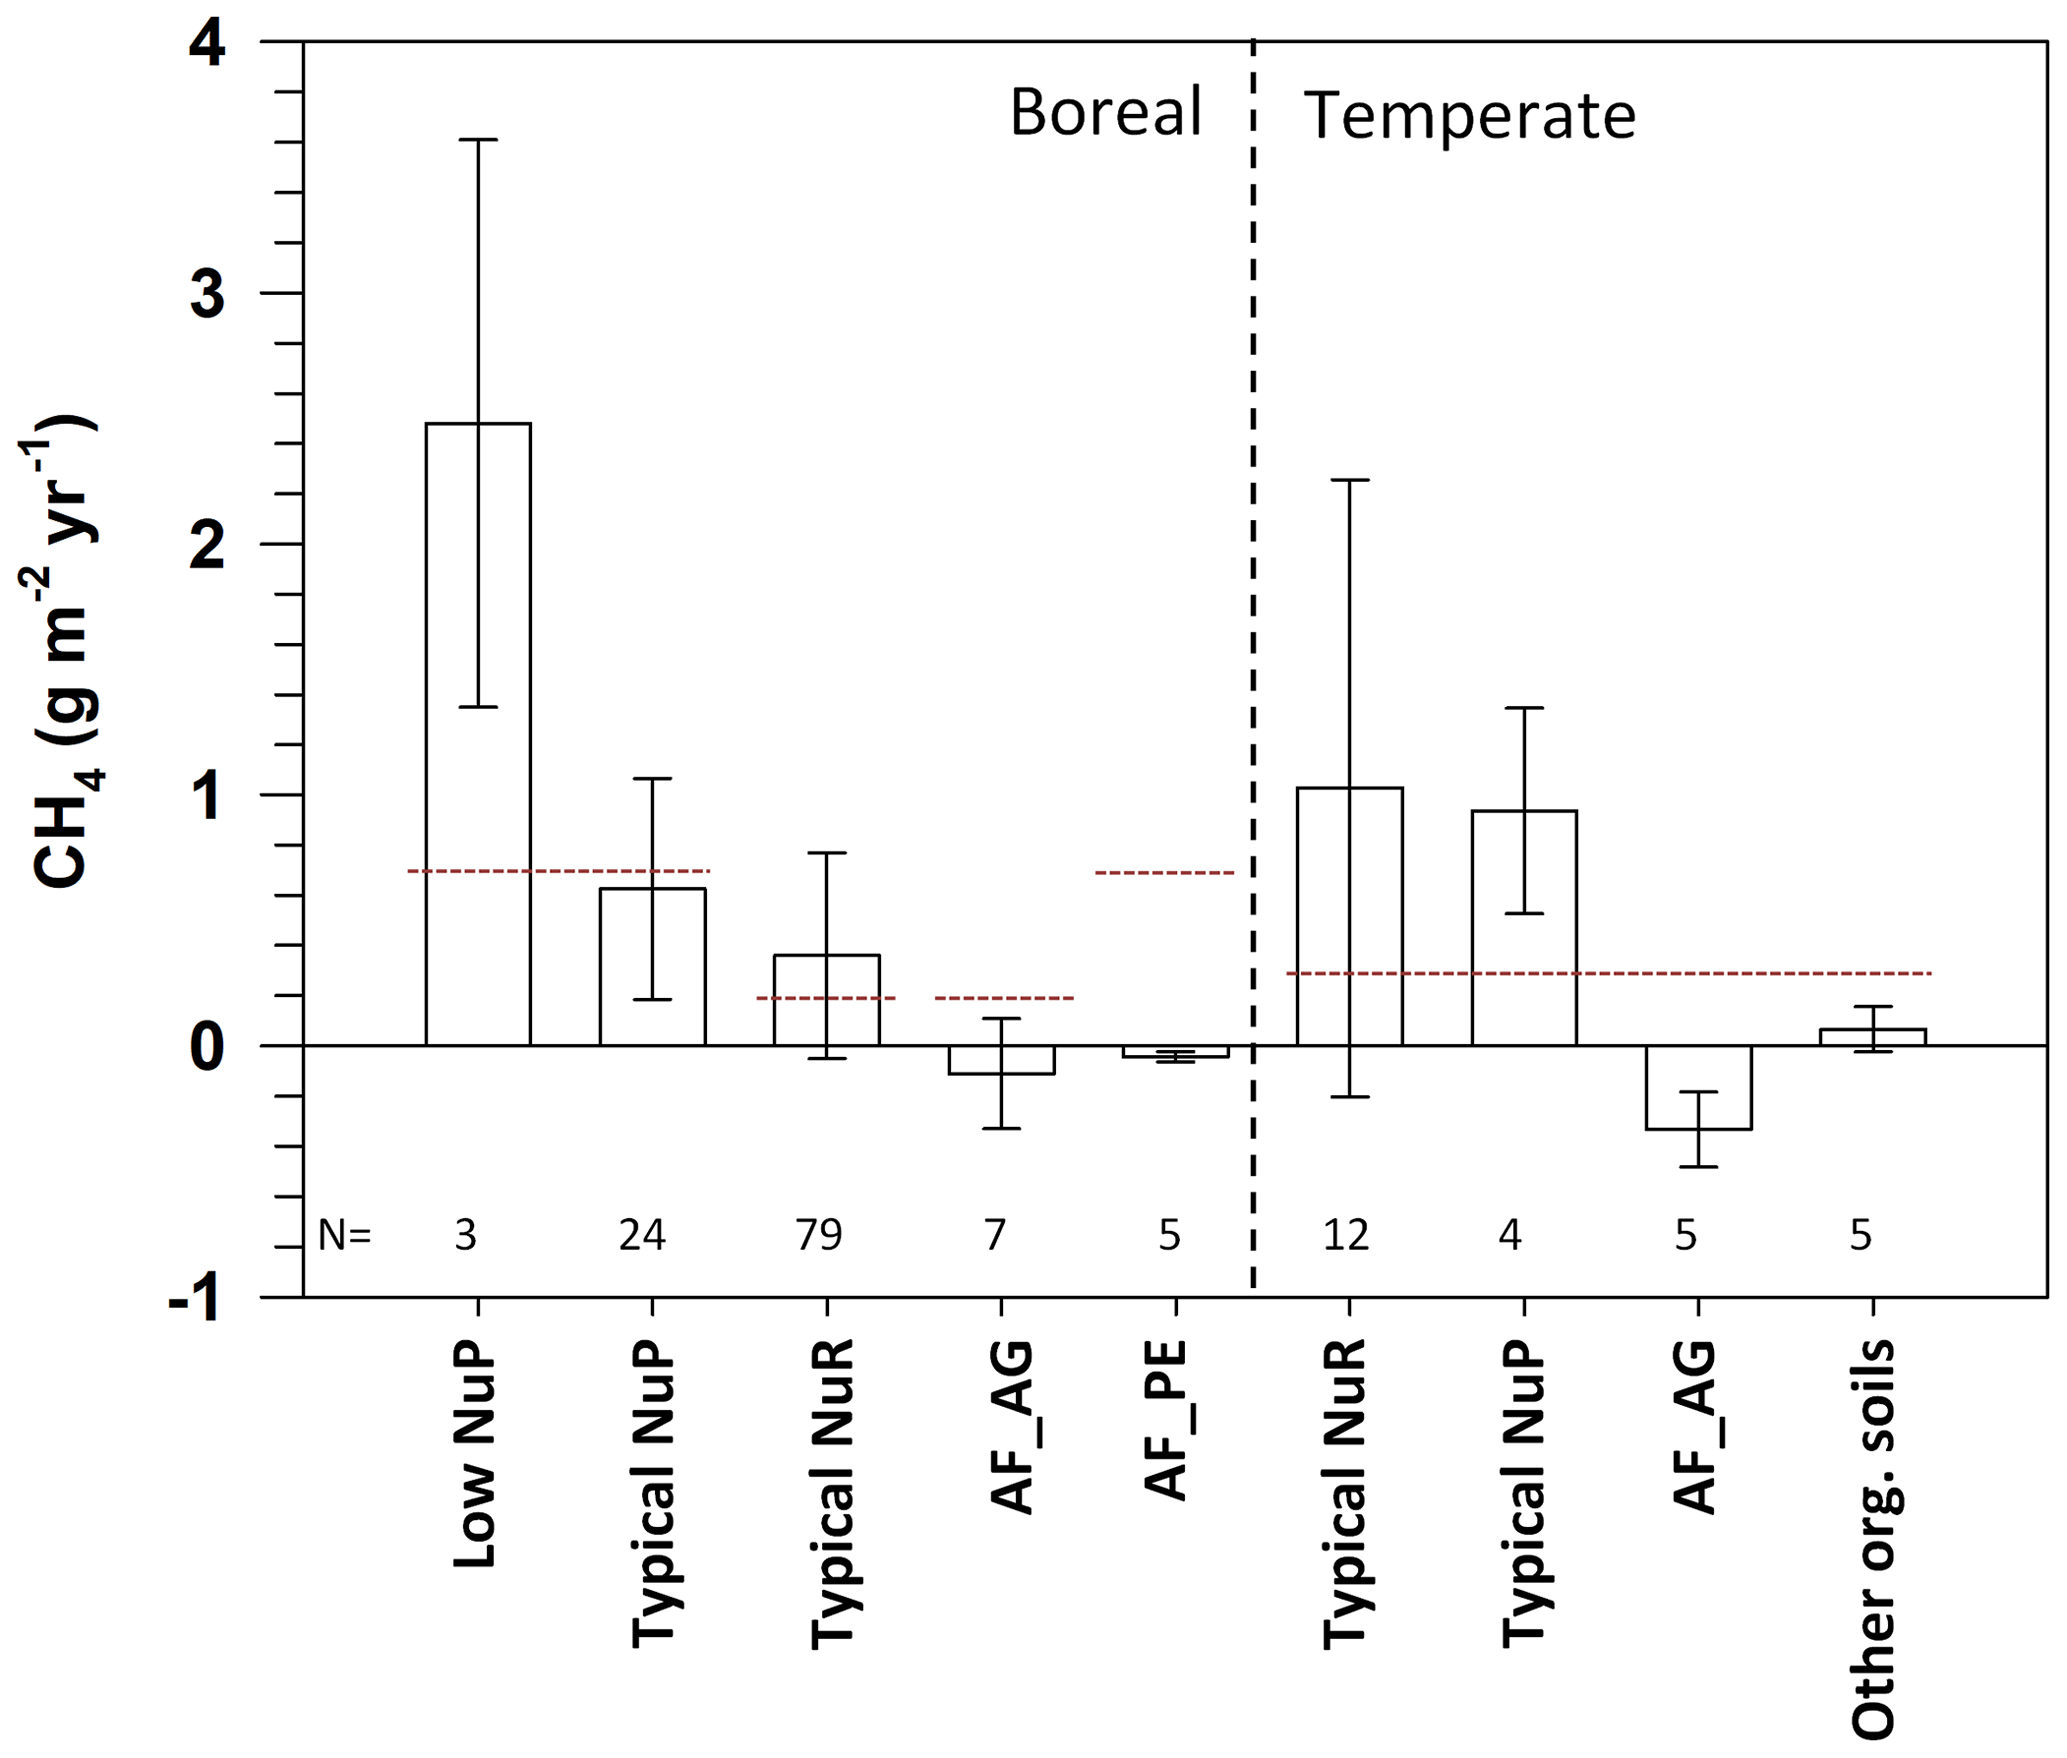
Figure 6CH4, weighted mean ± 95 % confidence intervals) for drained organic forest soils in the boreal and temperate zones. The category “Low NuR” is not included as it had less than three observations. The dotted lines represent IPCC (2014) Tier 1 EF levels for categories including comparable data. The categories are explained in Fig. 2 and Table S3, and the values are in Table S5.
CH4 EFs in the temperate zone showed emissions of ca. 1 g m−2 yr−1 in both forestry-drained peatland categories (0.94, 1.03 g m−2 yr−1) and close to zero (0.07 g m−2 yr−1) in the other organic soils (Fig. 6). The afforested agricultural lands in the temperate zone resulted in average CH4 removals (−0.33 g m−2 yr−1). In the temperate zone, EFs were higher than those by the IPCC for forestry-drained peatlands and lower than the IPCC default for afforested lands and for other organic soils.
When the effect of site nutrient status was examined with more detailed categories for the boreal zone, the extremely nutrient-poor sites showed the highest CH4 EF, and the emissions decreased with increasing site nutrient status (Fig. 7). All the site categories had positive EFs (Fig. 7; Table S5). Medians, on the other hand, indicated zero for intermediate sites and removals for the most nutrient-rich sites (Fig. 7). Outlier CH4 data values on both sides of the median were found in all the categories but were more common under the intermediate and rich conditions (Fig. 7).
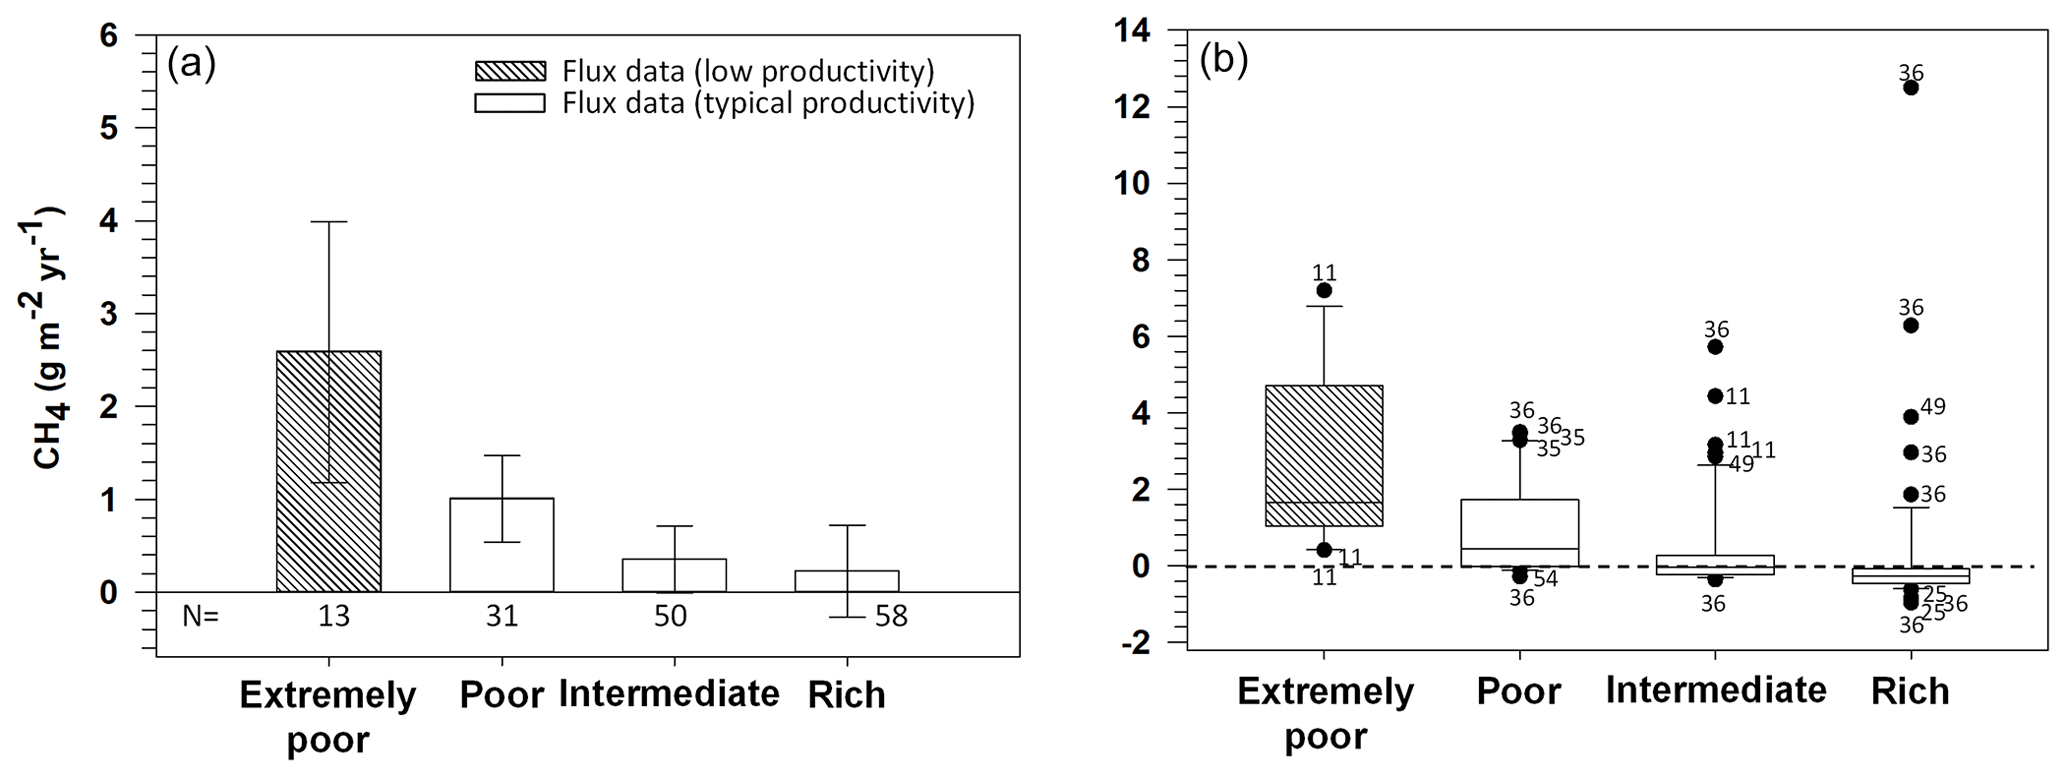
Figure 7CH4 EFs for four nutrient status categories further divided into low and typical productivities of boreal zone forestry-drained peatlands, as the arithmetic mean ± 95 % confidence intervals (a) and as the median in boxplots (b). Boxplot characteristics are explained in Fig. 5. Numbers below the bars (a) give the number of observations in each category, and numbers next to the outliers in the boxplots (b) refer to the publications listed in Table S2. The categories are explained in Figs. 2 and S1 and in Table S3.
3.2.3 N2O
The highest N2O EF (1.38 g m−2 yr−1) was found for afforested agricultural lands in the boreal zone (Fig. 8; Table S5). The N2O EF for the afforested peat extraction areas (0.35 g m−2 yr−1) was similar to the typical-productivity nutrient-rich forestry-drained peatlands (0.34 g m−2 yr−1), followed by the low-productivity nutrient-rich (0.12 g m−2 yr−1) and typical-productivity nutrient-poor (0.14 g m−2 yr−1) forestry-drained peatlands. In the temperate zone, the highest N2O EFs were observed in the typical-productivity nutrient-rich forestry-drained peatlands (1.26 g m−2 yr−1), followed by afforested agricultural lands (0.75 g m−2 yr−1) (Fig. 8). In the other organic soils category, the N2O EF was smaller (0.16 g m−2 yr−1). Confidence intervals were wide in the temperate zone nutrient-rich sites and in the afforested agricultural sites in both climate zones.
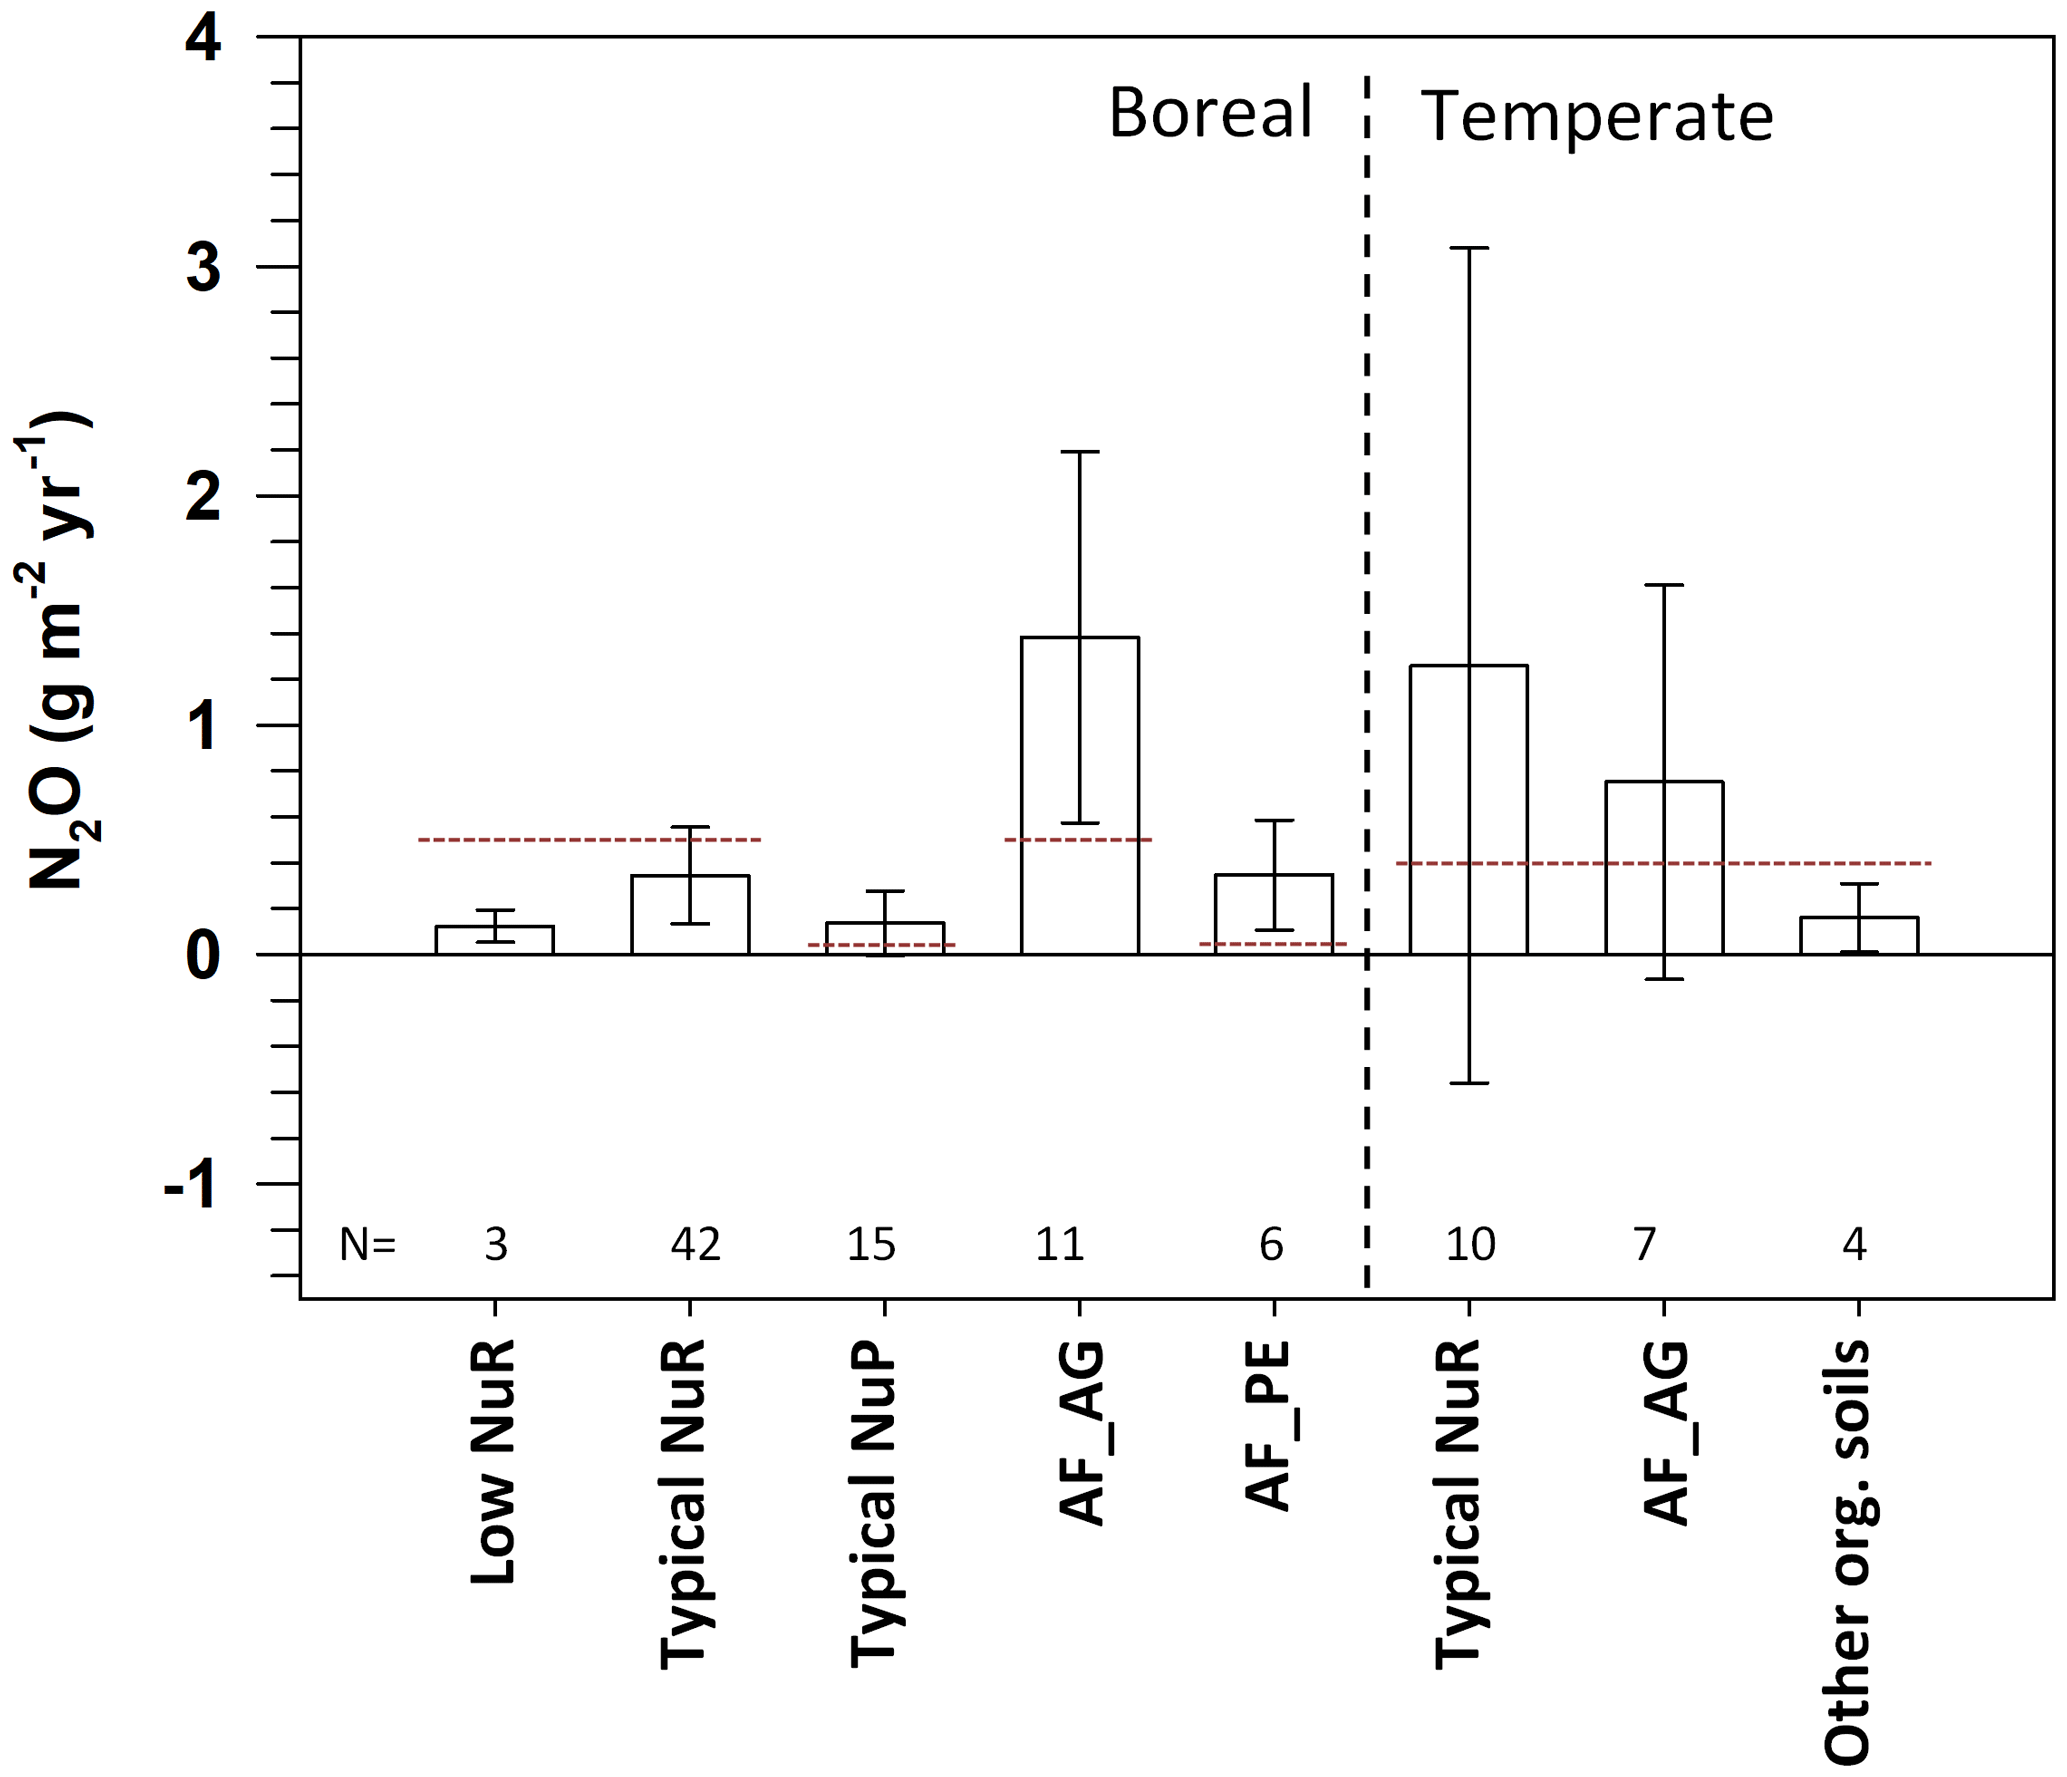
Figure 8N2O EFs (weighted mean ± 95 % confidence intervals) for drained organic forest soils in the boreal and temperate zones. Only categories with n≥3 are included. The dotted lines represent IPCC (2014) Tier 1 EF levels for categories including comparable data. The categories are explained in Figs. 2 and S1, and the values are in Table S5.
N2O EFs in forestry-drained boreal peatlands mostly showed emissions from the soil, but the boxplots show that most of the soil N2O balance estimates are actually close to zero (Fig. 9). The outlier values, mostly in intermediate and rich sites, result in wide confidence intervals and have a major effect on the average as they were typically sites with very high emissions. Overall, the data distribution in the intermediate category was especially highly skewed towards high positive values.
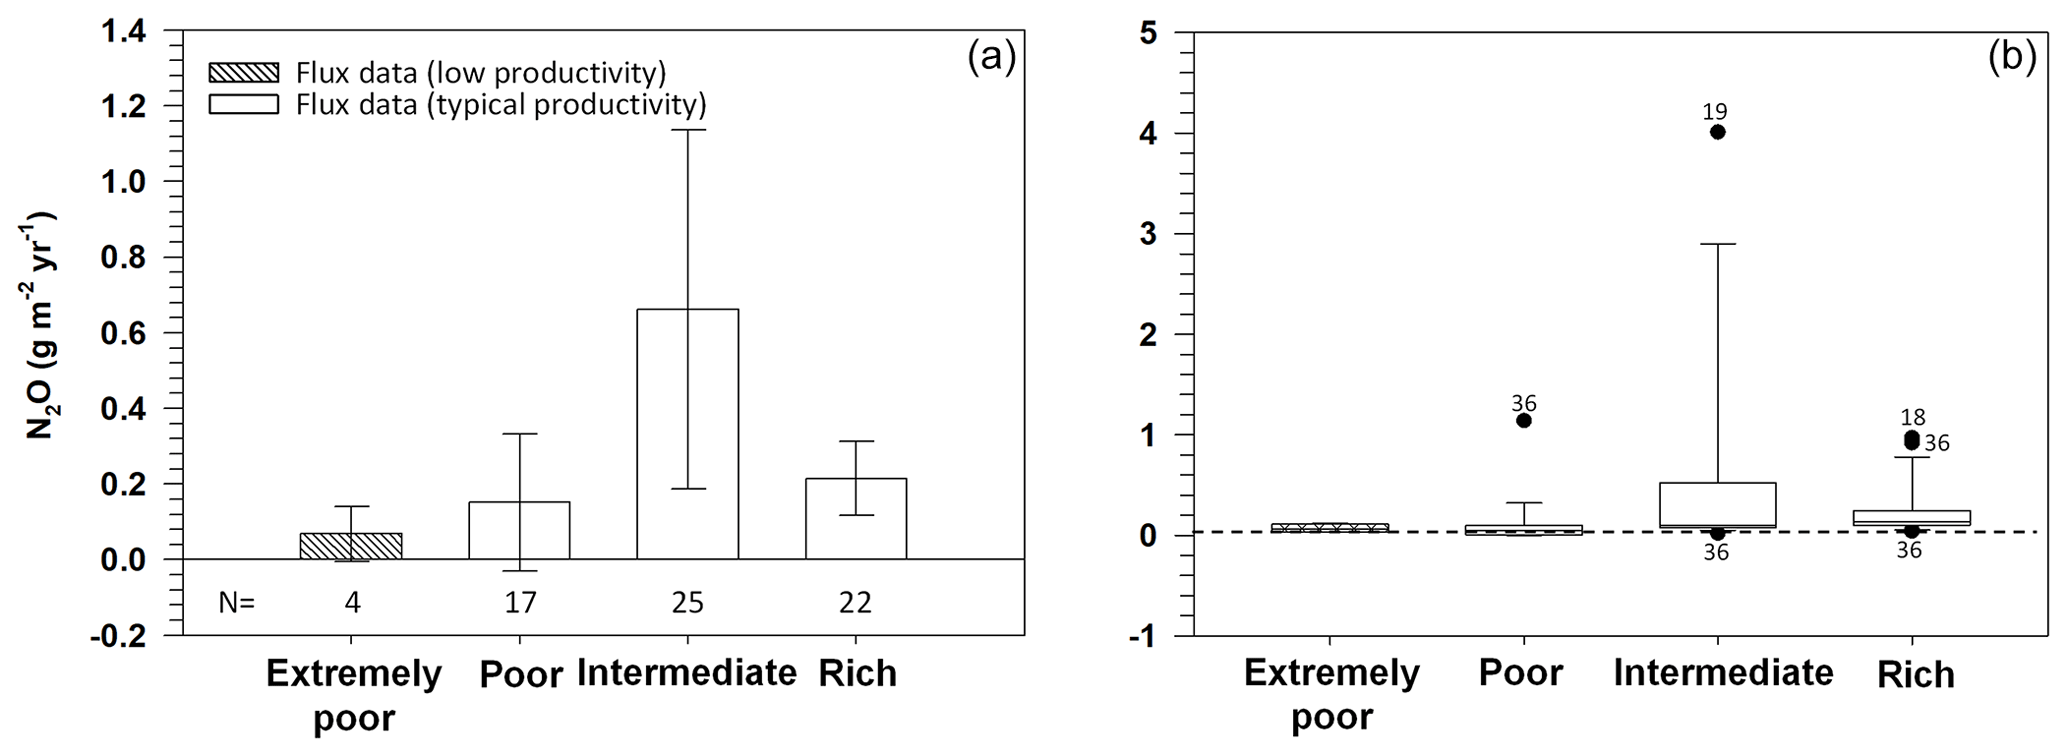
Figure 9N2O EFs for four nutrient status categories further divided into low and typical productivity of boreal forestry-drained peatlands, as the arithmetic mean ± 95 % confidence intervals (a) and as the median in boxplots (b). Boxplot characteristics are explained in Fig. 5. Numbers below the bars (a) give the number of observations in each category, and the numbers next to the outliers in the boxplots (b) refer to the publications listed in Table S1. The categories are explained in Figs. 2 and S1 and in Table S3.
3.3 Correlations with weather, climate, and site type characteristics
Several variables related to soil, vegetation, weather of the monitoring year, and climate were significantly correlated (p value ≤ 0.05) with soil GHG balance estimates (Table S6). Based on the univariate models, the annual soil CO2 balance was negatively correlated with the soil C concentration (i.e. emission decreased with increasing soil C concentration; note that these were all high-C peat soils, where a lower C generally indicates more nutrient-rich conditions) and C : N ratio and positively correlated with soil bulk density and several variables related to long warm-season conditions and elevated temperatures (Table 2). Of the vegetation-related variables, only the stand type correlated with the annual soil CO2 balance. In comparison to conifer stands, deciduous stands showed higher and mixed stands lower soil CO2 emissions (Table 2). The best multiple model explained 41 % of the variation with the soil C : N, stand type and mean temperature over 30 years as explaining covariates (Table 3). In the univariate model, deciduous stands affected the soil CO2 balance more than mixed stands, whereas in the multiple model it was vice versa. This indicates some interaction between stand types, soil characteristics, and climatic conditions.
Table 2Parameter estimates with standard errors (SEs) for significant covariates in univariate models of annual soil GHG balances. For categorical covariates, the number of parameters is one less than the number of categories, and they can be interpreted as differences from the reference category for which no estimate is provided. The p values for the significance of the difference of the parameter estimate from 0 are based on Wald tests. The numbers of data points (n) and sites (nsites) used for each model are given.
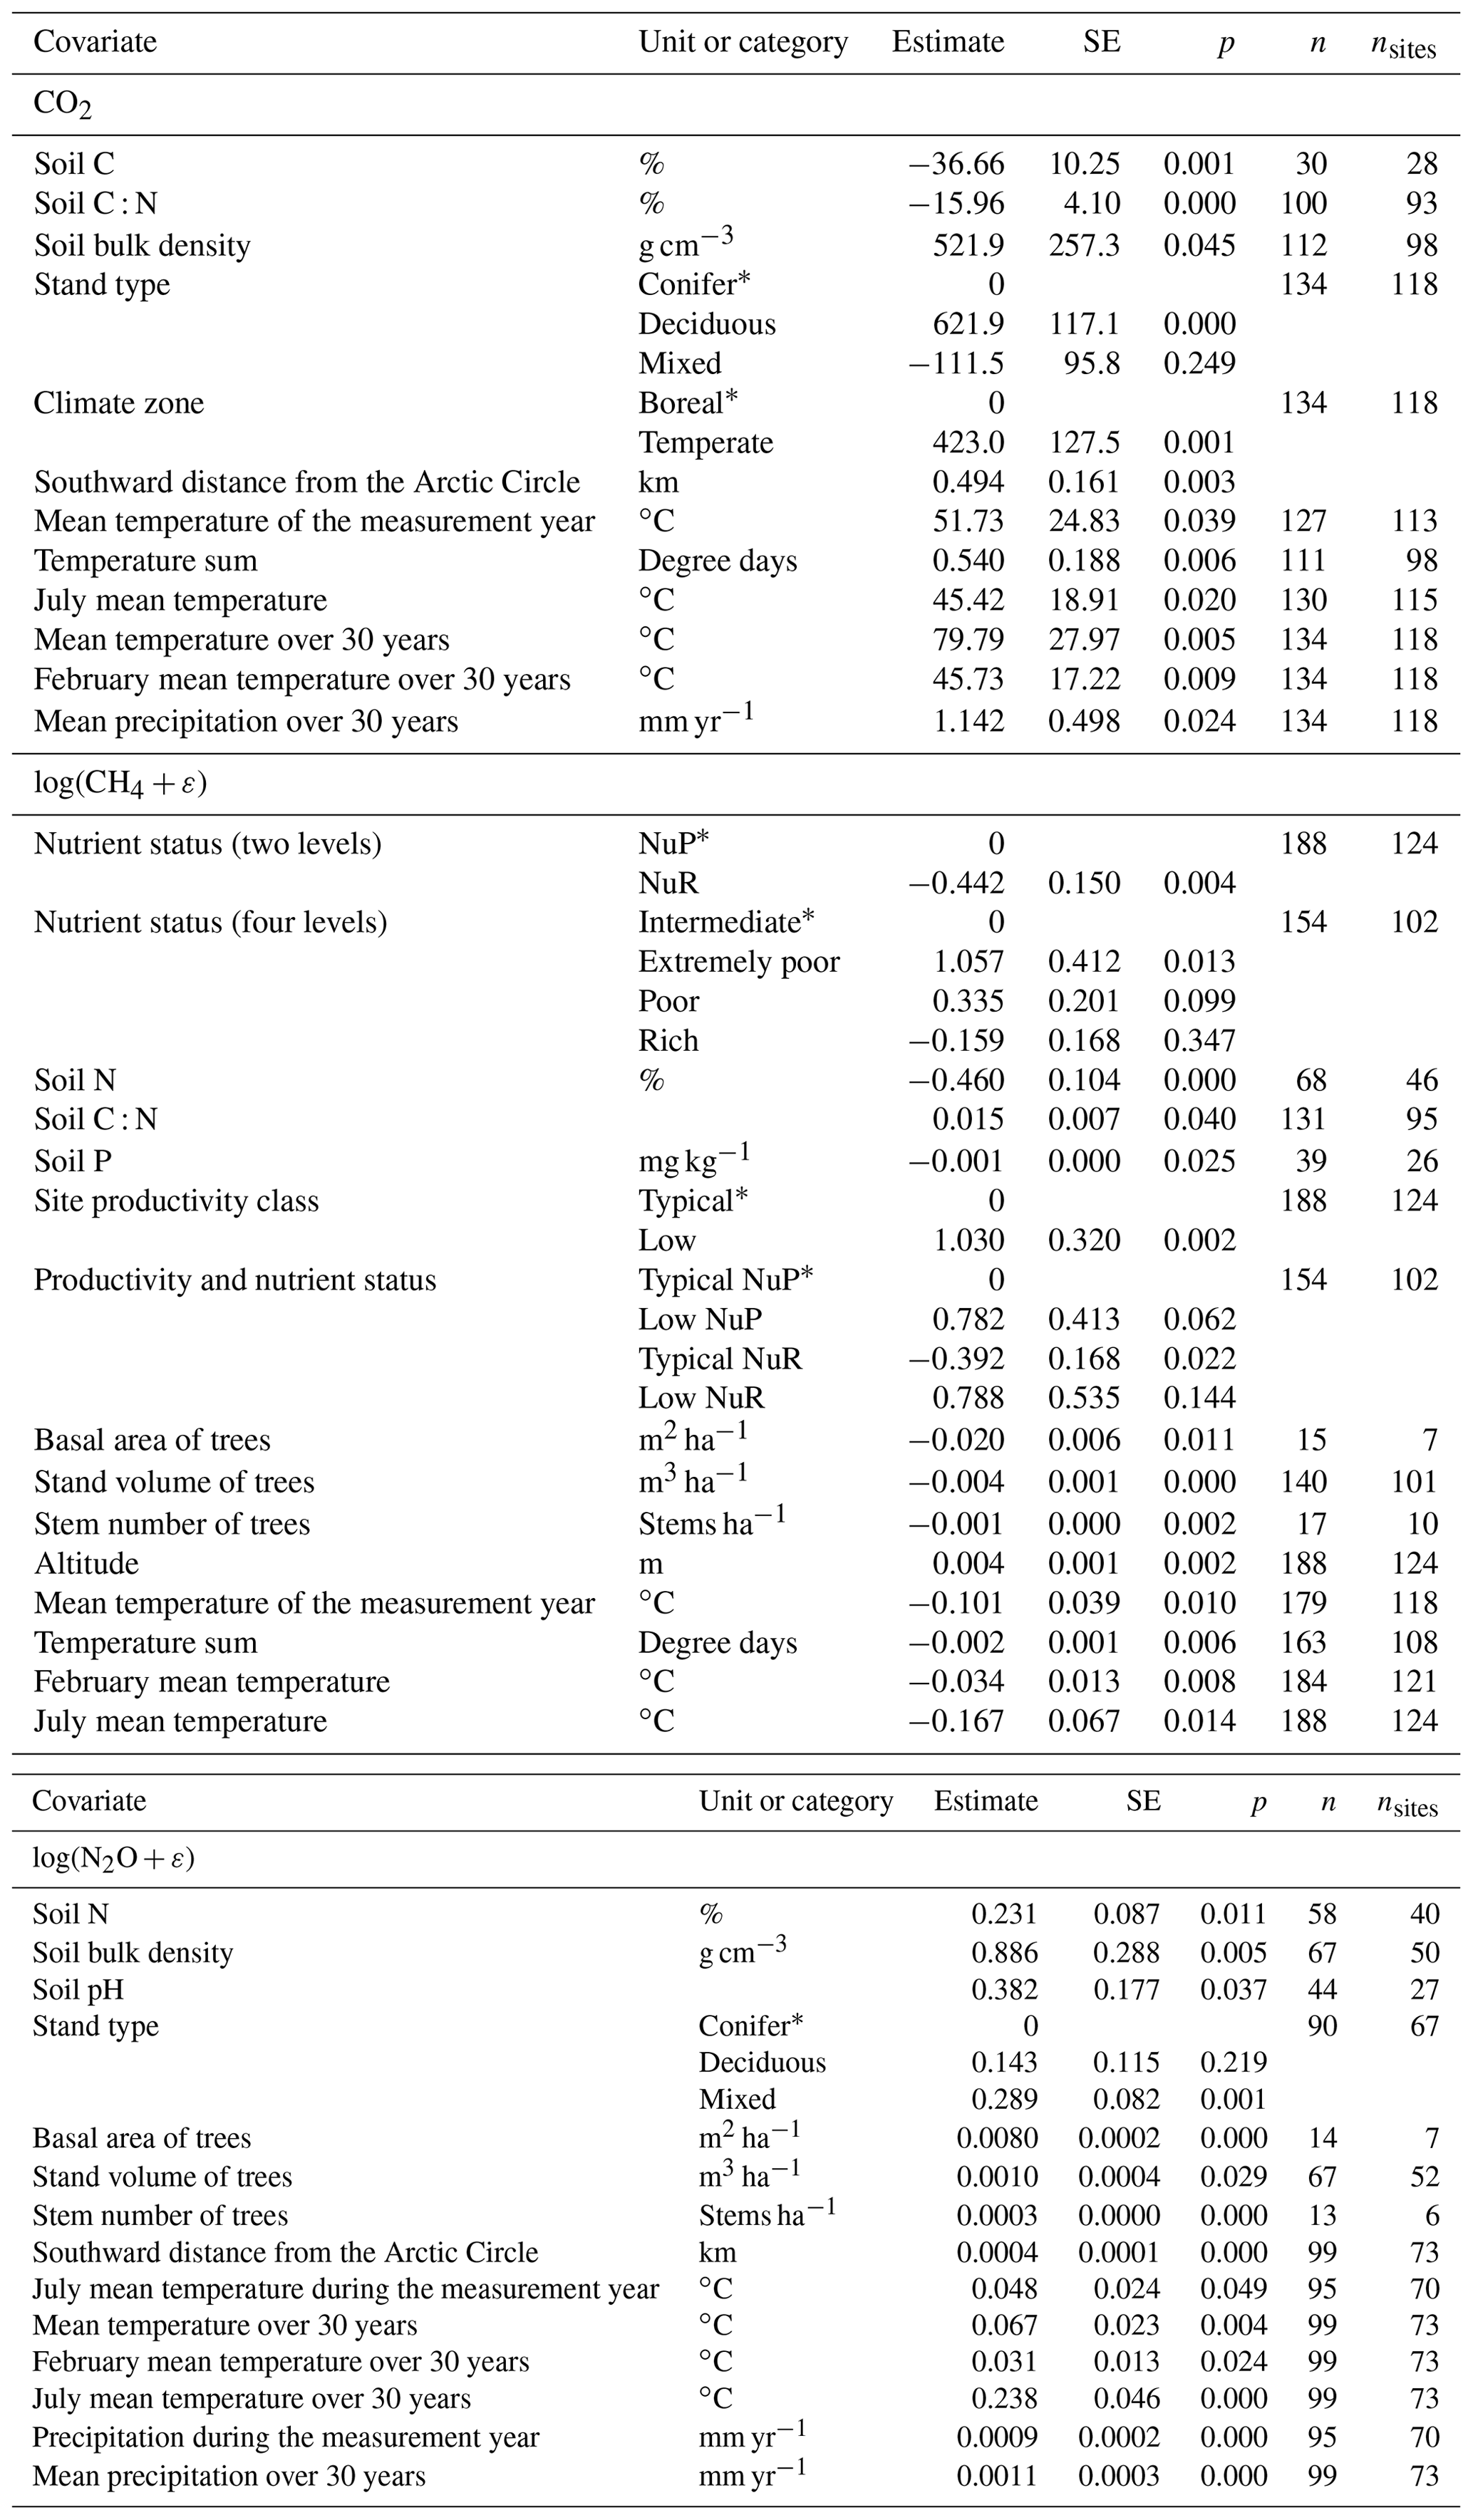
* The reference category.
Table 3Parameter estimates with standard errors (SEs) and the coefficient of determination (pseudo-R2) in multiple linear models obtained by stepwise regression (see the caption of Table 2 for details).
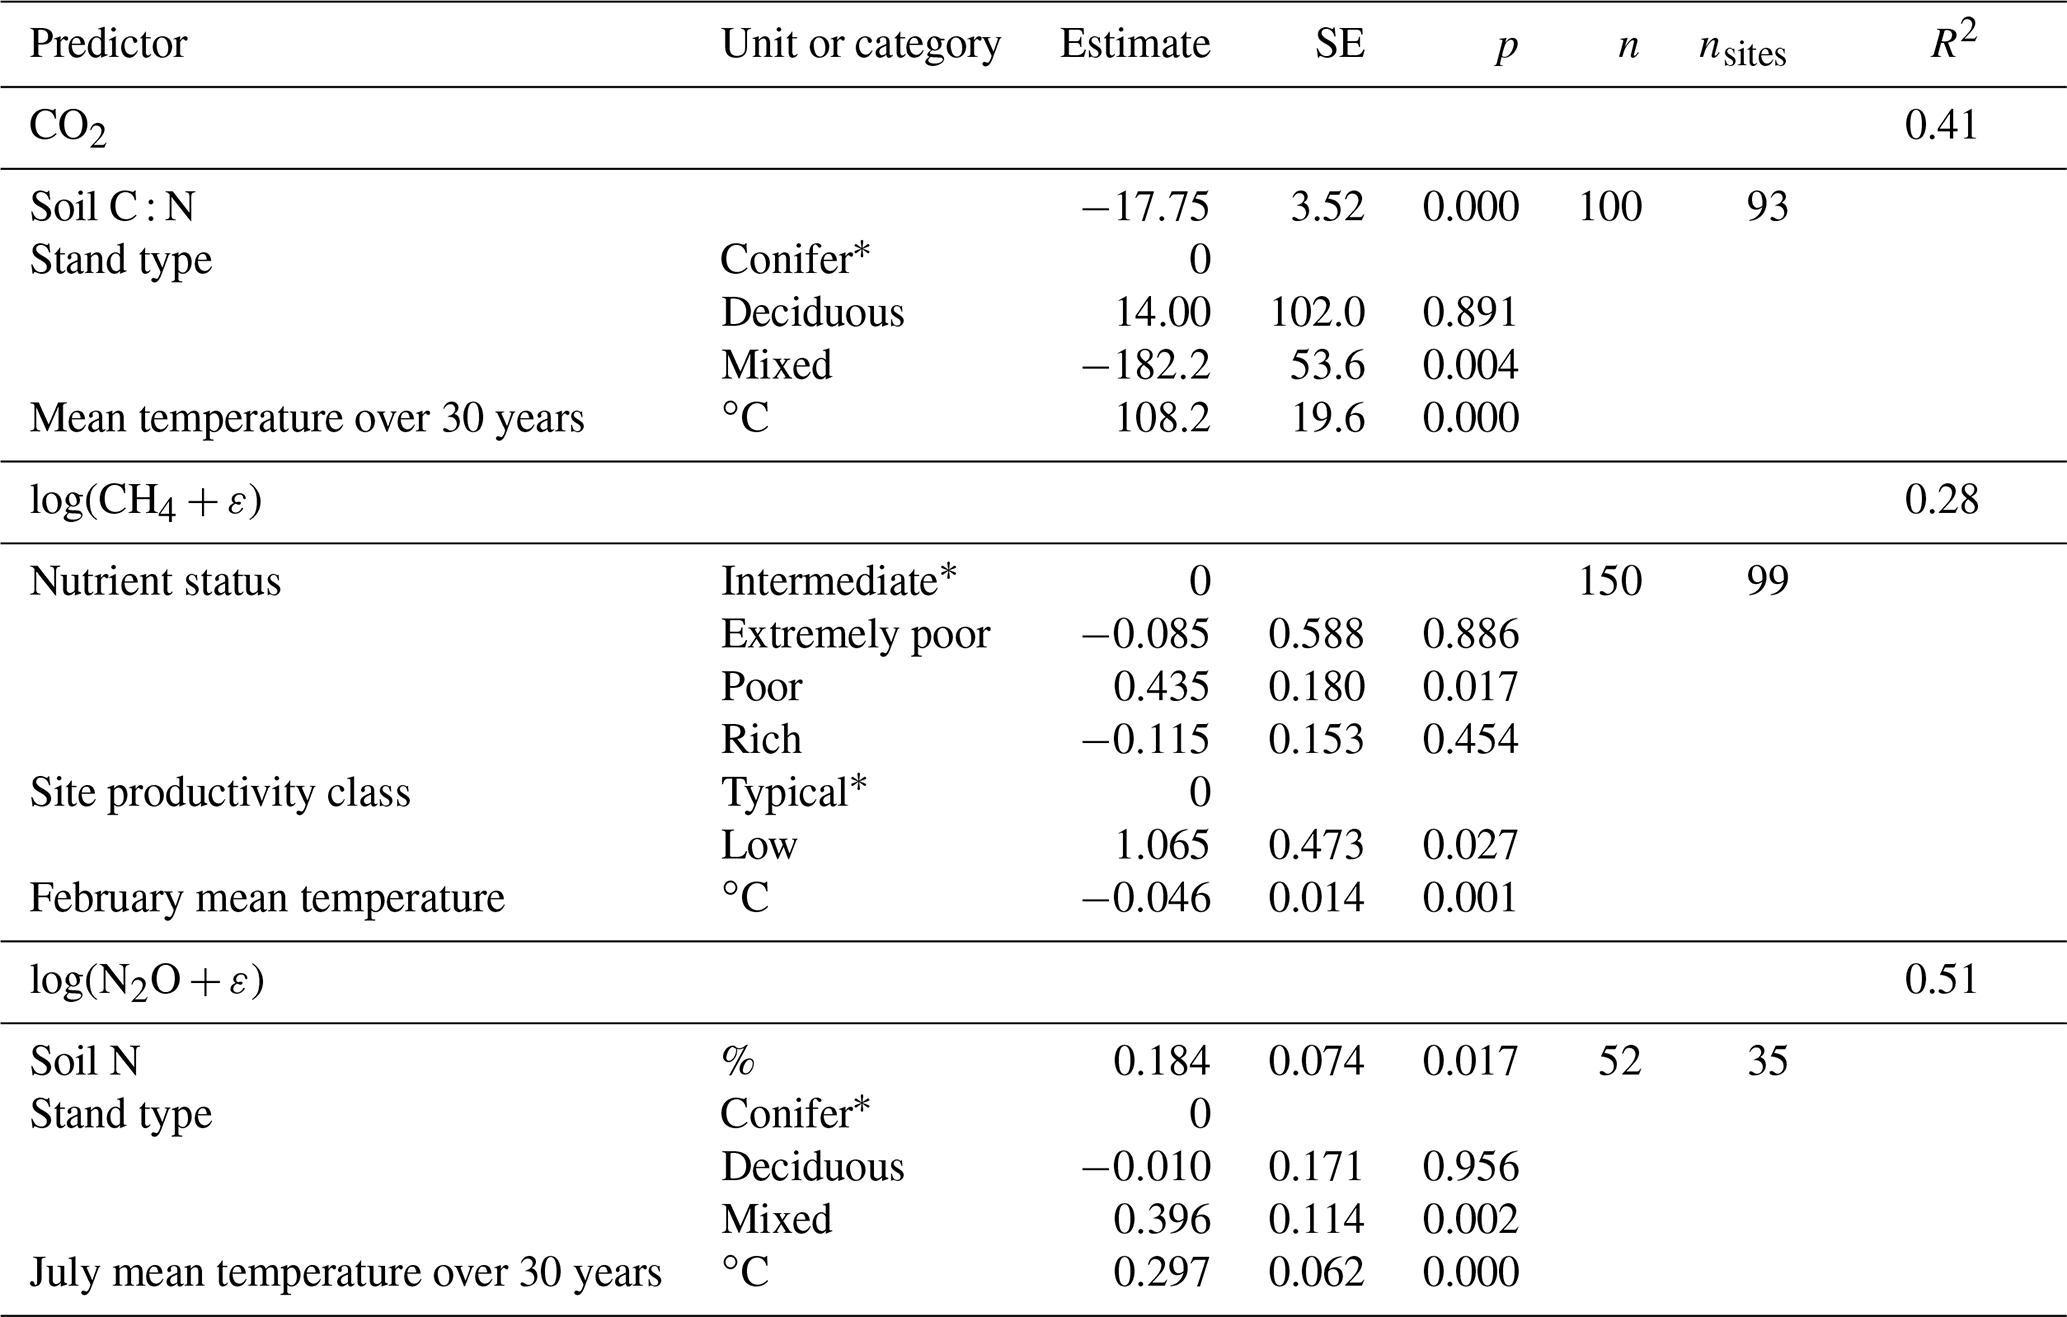
* The reference category.
The annual soil CH4 emissions were higher for nutrient-poor sites than for nutrient-rich sites (Tables 2 and 3). The higher potential for CH4 emissions on nutrient-poor sites was further supported by vegetation-related predictors such as low productivity, low stand volume of trees and the low number of trees. Site nutrient status and productivity are partly correlated, which explains the differing patterns found for these predictors in multiple versus univariate models. Further, CH4 emissions were negatively related to temperature, i.e. colder conditions resulted lower efflux. The best multiple model explained only 28 % of the variation and was a combination of the variables site nutrient status, site productivity class, and February mean temperature (Table 3).
The annual emission of N2O correlated positively with soil bulk density, N concentration, and pH (Table 2). Further, a positive correlation was found with vegetation predictors describing the size and density of the tree stand (basal area, stem number and stand volume), and emission was higher in mixed stands in comparison to conifer stands (Tables 2 and 3). Of weather and climate variables, the annual soil N2O balance correlated positively with indicators of warmer conditions (annual and/or long-term warm season temperatures, annual mean temperature, and southern location), and also with annual precipitation. Soil N concentration, stand type, and July mean temperature over 30 years were combined in the best multiple model which was able to explain 51 % of the variation (Table 3). It should be noted that the multiple models presented here were built with variables that were most widely available in the dataset. With smaller datasets for which a wider set of variables were available, higher explanatory power could be obtained. For example, with two vegetation-related covariates (stand type and stand volume of trees) and soil pH as much as 83 % of the N2O emissions could be explained, but the number of observations was only 21 (Table S7).
4.1 Success in using the data for modelling and creating categories for specific conditions
Since the release of the IPCC report (2014), there have been many new publications reporting annual soil GHG balances. These data are enough for constructing more site-specific EFs, as our results show. However, as we pointed out in an earlier study (Jauhiainen et al., 2019), there has been little consistency in including environmental data in publications that would facilitate efficient re-use and pooling of data. Consequently, the effort to identify the major drivers of the variation in the soil GHG balance (and EFs) from the potential predictors describing soil, vegetation, and climate characteristics may not have led to optimal choices, as we were limited to variables that were at least somewhat consistently reported. In this study, the predictive power of the “best” multivariate models was reasonable, ranging from 28 % for CH4 to 51 % for N2O. As expected, variables describing soil nutrient status, both continuous and categorical, were significantly related to the soil GHG balances, and an increase in soil nutrient status led to higher emissions of CO2 and N2O but lower CH4 emissions or even a switch to a small sink. Overall, the responses of CO2 and N2O often go hand in hand with the opposite direction compared to CH4. This may be explained by the WT that, unfortunately, was not so generally available in the publications that it could have been used in the models (Jauhiainen et al., 2019). A deeper WT will increase the extent of the oxic surface soil layer where CH4 oxidation takes place and thus reduces the emission (Minkkinen and Laine, 2006; Ojanen et al., 2010; Jauhiainen et al., 2019; Rey-Sanchez et al., 2019), while it also allows for more efficient aerobic decomposition that leads to a higher CO2 emission (e.g. Jaatinen et al., 2008; Minkkinen et al., 2018; Ojanen and Minkkinen, 2019) and also, to some extent although not linearly, favours processes that increase N2O emission (Pärn et al., 2018). The relatively low power of the CH4 model may be due to the sources and sinks all being so small in drained forests that their overall variation was clearly smaller than that in the explanatory variables. On the other hand, strong dependence of the annual soil CH4 balance on both WT and tree stand volume was observed in earlier studies (Minkkinen et al., 2007; Ojanen et al., 2010). Tree stand volume and the depth of the WT are generally positively correlated, which is most probably the causal reason for the relationship. The relationship was not very present in these pooled data, possibly due to the skewed distribution of the data that the log transformation may not have fully remedied.
The WT is generally deeper in nutrient-rich sites that are more densely stocked (Ojanen et al., 2013), in warmer climatic conditions where evapotranspiration is higher, and under deciduous trees that show higher evapotranspiration than conifers (Leppä et al., 2020). This was well reflected in the models. Tree stand characteristics, including the stand type (conifer, deciduous, mixed), are thus potentially very useful for predicting emissions as in peatlands they reflect both the site nutrient status and WT regime (e.g. Laine et al., 2004). Litter quality further differs between the stand types (Preston et al., 2000; Cornwell et al., 2008), which may explain the higher CO2 emissions from deciduous stands that generally produce more readily decomposable litter than coniferous stands. However, why N2O emissions were highest in mixed stands remains unexplained. Overall, it must be noted that the data included in this study were solely from stands that had not been recently managed, and thus, any “odd” values are not (or should not be) caused by management events. Short-term management impacts need to be studied separately, and currently there are only data from a very limited number of sites, e.g. on the effects of different tree harvesting intensities (e.g. Korkiakoski et al., 2020, 2023).
In addition to the modelling efforts, the data allowed defining new site categories that distinguish more specific environmental conditions than the IPCC (2014) Tier 1 categories. These included other organic soils than peat, afforested sites with different land use histories (agriculture versus peat extraction), and more detailed categories for forestry-drained sites based on site nutrient status and forest production potential. This resulted in narrower confidence intervals in most categories than in the IPCC (2014) Tier 1 categories. The number of estimates included in each category was typically smaller when applying more categories; however, this did not necessarily lead to higher uncertainty as shown by our results.
The overall soil nutrient status and potential forest productivity can be largely interpreted from the vegetation community characteristics (Päivänen and Hånell, 2012), based on which more specific categories than the very broad “poor” and “rich” can be distinguished. The two broad categories as used in IPCC (2014) describe in a broad sense ombrogenic versus minerogenic groups. Within minerogenic sites, especially, there is, however, high variation from rather nutrient-poor (oligotrophic) to mesotrophic (intermediate) and eutrophic (nutrient-rich) conditions. Within ombrogenic sites, there is also variation from extremely poor sites not at all suitable for forest production because of very low productivity to pine-dominated sites where forest growth may be satisfactory from the forestry point of view (Keltikangas et al., 1986). Within both poor and rich sites, there are also low-productivity variants, i.e. sites where tree growth remains poor due to overall scarcity of nutrients, especially N, or due to strong imbalance of scarce other nutrients versus high N that is typical for drained sites that were originally very wet treeless mires (Moilanen et al., 2010; Ojanen et al., 2019). Such conditions can be recognized and classified based on expert information found in site type classification and forest productivity research reports (e.g. Keltikangas et al., 1986) and described in forestry-oriented site type guidebooks (e.g. Laine et al., 2018; Bušs, 1981). These categories can naturally only be applied if such classification information is available. A challenge is that such national systems of site classification are difficult to combine into consistent international categories.
4.2 EFs in different category setups
By using the categories applied in IPCC (2014), the EFs estimated in this assessment were relatively similar to those provided by the IPCC. The values for the temperate zone changed the most due to the relatively largest addition of new data. In the more site-specific analysis, the annual soil CO2 balances at the afforested sites were, firstly, expected to differ from those at the forestry-drained sites due to the legacy effects of the preceding land management. In the temperate zone, the two afforested site categories and also the “Other organic soils” category represented the high end of annual soil CO2 balances. Data from the afforested and “Other organic soils” sites likely formed the high-end estimates in the only EF category available for the temperate zone in IPCC (2014). In the boreal zone the afforested site soil CO2 balances are closer to zero than the averages at the forestry-drained sites. The modest number of WT data available for this assessment suggest that the afforested and other organic soils category sites have in general a deeper WT than forestry-drained sites (Table S8). This would logically contribute to both higher CO2 emissions and lower CH4 emissions than at forestry-drained sites. However, in boreal data, the afforested sites had lower CO2 EFs than forestry-drained sites, though with very wide confidence intervals. For many of these sites, we had to introduce litter inputs and their decomposition, which adds uncertainty in the estimates. Dividing the data into separate afforested site categories resulted in their annual CH4 balances being small sinks, while forestry-drained peatland sites remained on average as emission sources. The other organic soils in the temperate zone showed a consistently close-to-zero annual soil CH4 balance.
Concerning N2O, the EF of afforested agricultural land in the boreal zone is quite striking, showing higher emissions than in any other category, being also higher than the EFs in the IPCC (2014). We have no immediate explanation for this. In the temperate zone, N2O EFs and confidence intervals in the three categories were narrower in this study compared to that in the single category available in the IPCC (2014). The other organic soils in the temperate zone showed relatively low N2O emission, which together with the EFs of the other two gases suggests that their GHG fluxes differ from peat soils.
The forestry-drained sites in the boreal zone had the most extensive and consistent data, allowing further separation of nutrient status categories and typical-productivity versus low-productivity sites. In IPCC (2014), lower-than-typical productivity was distinguished for nutrient-poor boreal sites, so that EFs were estimated separately for typical-productivity sites and combined typical and low-productivity sites (Table 1). In this study, average soil CO2 balances in low-productivity conditions resulted in emissions in all site nutrient status groups from extremely poor to rich conditions (Figs. 4 and 5). In intermediate and rich site conditions the differences between low-productivity and typical-productivity CO2 emissions were less notable in comparison to the large differences found between poor and extremely poor site conditions. This was unexpected, as earlier research has indicated low decomposition rates for litters and peat formed in nutrient-poor conditions (e.g. Hogg et al., 1992; Straková et al., 2012; Harris et al., 2020), where decomposers are further limited by low nutrient availability (Bragazza et al., 2007). It may be noted that the Low NuP category was almost entirely represented by inventory data, but how that could produce an artifact, especially in extremely nutrient-poor sites, is not explained by the data.
The Low NuP category further showed the highest average CH4 EF among the boreal zone categories. This can be explained by the higher WT in forest stands of low density (Table S8; Minkkinen et al., 2007). The CH4 EF in the Low NuP category is considerably higher than the EFs in the IPCC (2014) assessment where the NuP category includes data from both the typical- and low-productivity sites. Among the three GHGs studied, CH4 EFs varied most consistently along the nutrient status gradient with the highest emissions in the poorest nutrient status environments characterized by ground lichens, and smaller emissions towards increasingly nutrient-rich – and drier due to higher tree stand evapotranspiration – environments. This decreasing trend in emissions was clear in both in average and median values, and visible also in annual averages by site types (available in Fig. S3).
Most of the N2O data were available from N-rich conditions (see Table S8), likely because of a higher interest in studying these environments for their large emission potential. The N2O EFs increased from extremely poor to intermediate environments in forestry-drained peatlands. Soil N2O balance means, medians, and data distribution in the boxplots show that extremely poor and poor sites have smaller emissions than intermediate and rich conditions, where a higher number of extreme values was also observed. In this study, sites classified as intermediate showed especially high emissions. We have no explanation for this that could be based e.g. on site type classification as presented in the original publications and what is known about peat N concentrations in different site type classes (e.g. Westman and Laiho, 2003). Such sites with extreme values should be considered locations for further research, potentially increasing the understanding of GHG flux formation in different environments. If consistent patterns explaining the high emissions were found, specific categories could then be formed for such sites.
4.3 CO2 balance estimates based on inventory versus flux data and means versus medians
CO2 emissions proved to be the most complex fluxes because the flux monitoring and inventory methods use profoundly different approaches (Jauhiainen et al., 2019). The available data structure was not optimal for comparisons between the two methods because only two of the formed categories included enough data produced by both methods. In those categories, the difference in the resulting EF was small considering the differences in the methods and that the data were from different sites.
It remains to be further clarified why inventory data resulted in high C losses from the extremely poor sites, whereas the flux data indicated close-to-zero emission or a C sink for these sites. If the methods contributed to distinctly different site types, this could introduce a bias; the pre-drainage peat in dryish extremely poor sites largely consists of such hummock species, e.g. Sphagnum fuscum, which are generally considered decay-resistant, while the remains of species typical of originally wet extremely poor sites, e.g. S. cuspidatum, decompose more readily (e.g. Bengtsson et al., 2016, 2018). Consequently, if sampling focused on different site groups, different results could be expected; however, such a difference between the methods was not evident from the site descriptions. Further, at extremely poor sites that are generally at late stages of autogenic peatland succession before drainage, deep horizons usually represent different conditions and plant communities that are typically less decay-resistant and that could contribute to C loss over longer periods captured by the inventory methods, but the drainage effect is unlikely to extend very deeply at these sites. Thus, we cannot explain the difference.
Although the average soil CO2 balance values in poor, intermediate, and rich site groups resulted in emissions for both flux and inventory data, median values indicated variably emissions or a sink closer to zero. Several extreme soil CO2 balance values in flux data widen the deviation around the means, which may be an outcome either from differing environmental conditions resulting in widely different values in the groups, temporal-scale differences in the methods (the temporal scale of the flux measurements is annual, whereas for the stock inventory it is decadal – given the importance of e.g. climate, more variability in estimates with flux measurements is expected), or unidentified quality issues in some of the data values (see Jauhiainen et al., 2019).
Both the mean and median values may be used for describing GHG flux data, the mean being the more common descriptor. For example, in IPCC (2014) and in this assessment, only 2 publications out of 54 reported median values. The normal distribution of the data is expected when using means, while medians would best be used for skewed data. The distributions of monitored data were typically not provided, and thus we were not able to assess the normality criterion. In the pooled data, mean EFs were somewhat higher than the corresponding median values in different nutrient status categories (Figs. 5, 7, and 9), which shows the impact of positive extreme values, shown by the boxplots, on the means. The medians likely better describe typical conditions. Consequently, we suggest that medians could in fact be a useful alternative to forming the EFs.
4.4 Data issues
A notable number of new studies have become available since the IPCC (2014) assessment, which allowed inclusion of more specific conditions than the current IPCC Tier 1 categories and inspection of the data structure. The number of estimates in several categories differed in the two assessments, which is likely a combined outcome of a larger database available in this study and also differences in accounting for individual sites. Direct database structure and numerical estimate comparisons between these two assessments cannot be evaluated in detail due to limited access to the IPCC (2014) data. Differences in data processing in the two assessments do exist. As an example, differences in the number of sites in the EF table (see Table 1 and Fig. 2) in the IPCC (2014) assessment and this study cannot be readily explained by new studies becoming available, as the IPCC shows a higher number of measurements. In this study, each site was identified based on coordinates and reported site characteristics irrespective of the publication where the data were presented, which may differ from the method applied in IPCC (2014). This would mean that data from a site reported in different papers may have been used as different independent observations in the IPCC assessment.
Obvious limitations in building a database from the published data are the certain randomness of the site types and conditions included in the publications, the inconsistent or lacking reporting of field conditions (e.g. tree stand and soil characteristics, WT), and differences in the temporal scale of the monitoring (Jauhiainen et al., 2019). The lack of consistently reported WT data, especially, is unfortunate as WT is an important constraint for soil processes leading to GHG emissions. In this study, the generally available information included land use history, soil type (peat, other organic soils), and site nutrient status information. The number of estimates falling into specific data categories could not be controlled, but a lower limit of estimates qualifying inclusion in the analysis (in this study, n≥3 is used) could be set. Differences in data collection procedures in the original studies had to be accepted, likely resulting in inconsistencies in data quality.
Major sources of inconsistencies in the data, reviewed by Jauhiainen et al. (2019), included (a) a large proportion of CO2 flux estimates based on daytime flux data, not assessing the impact of generally cooler nighttime periods; (b) potential biases in CO2 flux estimates in studies not specifying whether ground vegetation efflux was included in the flux monitoring; and (c) some studies using a generic literature-based proportion (50 %) for autotrophic root respiration to modify the total CO2 flux monitored that is not necessarily representative of conditions at the site (e.g. tree stock, climate). The existence of the above-listed inconsistencies was also recognized in this analysis. Consequently, modifications aiming at improvements in the data structure and the use of data reliability weighting were applied to increase the data consistency (see Sect. S1). However, analyses of strengths and weaknesses in the individual data sources were surely out of the scope of this study.
While we were synthesizing the existing data, still more data became available, e.g. Sosulski et al. (2019), Ernfors et al. (2020), Bjarnadottir et al. (2021), Butlers et al. (2021), Jovani-Sancho et al. (2021), and Hermans et al. (2022). All new data may be added to our original database, which is openly available.
This study added considerably to the number of publications applicable for forming emission factors for forests on drained organic soils in the boreal and temperate zones. When using the broad EF categories of the IPCC (2014) assessment, the added data caused only modest changes in the estimated EFs and their confidence intervals, indicating the overall good compatibility of our work with the IPCC assessment. More specific site type categories in our assessment generally resulted in a narrower confidence interval around the category average compared to the present Tier 1 categories (IPCC, 2014), which supports e.g. the use of different categories for afforested sites and forestry-drained sites and more specific site nutrient status and productivity categories based on timber production potential.
We found a strong negative relationship between annual soil CH4 balance and site nutrient status gradient and a relatively clear trend of increase in N2O emissions over an increasing site nutrient status gradient, while the patterns in the CO2 balance were more variable. An occasional wide confidence interval around the mean EF resulted more typically from a single or a few highly deviating estimates rather than because of a wide range in conditions within the categories applied. Despite variably available supporting data in the publications, statistical analyses supported these findings by connecting the annual soil GHG balances to site-specific soil nutrient status indicators, tree stand characteristics, and temperature-associated weather and climate variables. Although the flux and inventory methods are profoundly different in soil C balance monitoring, the EFs and their uncertainties did not differ much when estimated for similar environments with comparable data.
The most obvious further data need is in the temperate zone with regard to all the site categories. The CO2 EFs estimated for temperate afforested sites and organic soils other than peat, especially, have wide confidence intervals. Additional data could also reduce the variation found for CH4 and N2O EFs for temperate nutrient-rich sites. Data on the WT regimes of such sites could potentially lead to more detailed categories with smaller confidence intervals or dynamic EFs depending on the WT. In the boreal zone, the EFs for afforested sites have rather wide confidence intervals and could be improved with additional data.
Another data need relates generally to reporting of background data for the monitoring sites, on both environmental conditions (e.g. WT characteristics) and tree stand descriptors, as both are important for explaining the variation in the annual soil GHG balances. Further, the soil GHG balances may respond to typical management events (e.g. thinning, clear cutting, draining improvements) and vary over a forest rotation cycle, but we found insufficient data for evaluating these patterns. Finally, as soil characteristics, especially in peatlands, evolve when more time passes since drainage, time series of explanatory variables as well as litter input and decomposition dynamics are needed.
Overall, this and our earlier paper focusing on methodological issues (Jauhiainen et al., 2019) have shown how heterogenous and partly uncertain the datasets concerning annual soil GHG balances of drained organic forest soils still are. Efforts to standardize, verify, and improve GHG flux monitoring (e.g. increased use of automated chamber approaches, longer monitoring periods, and isotope methods for flux separation) should be continued.
The research data used in this study are peer-reviewed publications listed in Sect. S1. The main data content is available at Zenodo at https://doi.org/10.5281/zenodo.8425244 (Jauhiainen, 2023).
The supplement related to this article is available online at: https://doi.org/10.5194/bg-20-4819-2023-supplement.
All the authors planned the research jointly and contributed to the data collection. JJ retrieved and reviewed the data, compiled the database, wrote the first draft of the manuscript, compiled the supplementary information, and coordinated the comments and revisions that were provided by all the authors. RL, JJ, and JH planned the statistical analyses correlating GHGs with climate and environmental variables, and JH conducted the analyses. JJ compiled the following versions together with RL and JH.
The contact author has declared that none of the authors has any competing interests.
Publisher’s note: Copernicus Publications remains neutral with regard to jurisdictional claims made in the text, published maps, institutional affiliations, or any other geographical representation in this paper. While Copernicus Publications makes every effort to include appropriate place names, the final responsibility lies with the authors.
This study was initiated in the SNS-120 project “Anthropogenic greenhouse gas emissions from organic forest soils: improved inventories and implications for sustainable management” funded by Nordic Forest Research (SNS) with in-kind funding from all the project partners. To refine it for publication, this study was supported by the “Demonstration of climate change mitigation measures in nutrients rich drained organic soils in Baltic States and Finland” (LIFE OrgBalt, LIFE18 CCM/LV/001158), the European Union Horizon programme under grant agreement no. 101079192 (MLTOM23003R), the European Union Horizon programme under grant agreement no. 101056844, the European Research Council (ERC) under grant agreement no. 101096403 (MLTOM23415R), the European Union through the Centre of Excellence EcolChange in Estonia, European Regional Development fund project no. 1.1.1.1/19/A/064 in Latvia, the Danish Innovation Fund for the Eranet FACCE ERA-GAS project INVENT (grant no. 7108-00003b; FACCE ERA-GAS has received funding from the European Union’s Horizon 2020 research and innovation programme under grant agreement no. 696356), PLATON – a PLATform for Open and Nationally accessible climate policy knowledge (a Norwegian Research Council financed project, grant no. 295789), the Academy of Finland (grant no. 289116), the Ministry of Education and Research of Estonia (grant no. PRG-352), and a University of Helsinki grant to the Peatland Ecology Group.
This paper was edited by Nicolas Brüggemann and reviewed by two anonymous referees.
Abdalla, M., Hastings, A., Truu, J., Espenberg, M., Mander, Ü., and Smith, P.: Emissions of methane from northern peatlands: A review of management impacts and implications for future management options, Ecol. Evol., 6, 7080–7102, https://doi.org/10.1002/ece3.2469, 2016.
Arnalds, O. (Ed.): The Soils of Iceland, Springer, Dordrecht, Heidelberg, New York, London, 183 pp., https://doi.org/10.1007/978-94-017-9621-7, 2015.
Ball, T., Smith, K. A., and Moncriff, J. B.: Effect of stand age on greenhouse gas fluxes from a Sitka spruce [Picea sitchensis (Bong.) Carr.] chronosequence on a peaty gley soil, Glob. Change Biol., 13, 2128–2142, https://doi.org/10.1111/j.1365-2486.2007.01427.x, 2007.
Basiliko, N., Blodau, C., Roehm, C., Bengtson, P., and Moore, T. M.: Regulation of decomposition and methane dynamics across natural, commercially mined, and restored northern peatlands, Ecosystems, 10, 1148–1165, https://doi.org/10.1007/s10021-007-9083-2, 2007.
Bengtsson, F., Granath, G., and Rydin, H.: Photosynthesis, growth, and decay traits in Sphagnum – a multispecies comparison, Ecol. Evol., 6, 3325–3341, https://doi.org/10.1002/ece3.2119, 2016.
Bengtsson, F., Rydin, H., and Hájek, T.: Biochemical determinants of litter quality in 15 species of Sphagnum, Plant Soil, 425, 161–176, https://doi.org/10.1007/s11104-018-3579-8, 2018.
Bjarnadottir, B., Sungur, G. A., Sigurdsson, B. D., Kjartansson, B. T., Oskarsson, H., Oddsdottir, E. S., Gunnarsdottir, G. E., and Black, A.: Carbon and water balance of an afforested shallow drained peatland in Iceland, Forest Ecol. Manage., 482, 118861, https://doi.org/10.1016/j.foreco.2020.118861, 2021.
Bragazza, L., Siffi, C., Iacumin, P., and Gerdol, R.: Mass loss and nutrient release during litter decay in peatland: The role of microbial adaptability to litter chemistry, Soil Biol. Biochem., 39, 257–267, https://doi.org/10.1016/j.soilbio.2006.07.014, 2007.
Bušs, K.: Meža ekoloìija un tipoloìija [Forest ecology and typology], Rīga: Zinātne, 68 pp., 1981 (in Latvian).
Butlers, A., Bārdule, A., Spalva, G., and Muižnieks, E.: N2O and CH4 emissions from naturally wet and drained nutrient-rich organic forest soils, in: Proceedings of the 10th International Scientific Conference Rural Development 2021, edited by: Černiauskienė, J., Vytautas Magnus University Agriculture Academy, 195–200, https://doi.org/10.15544/RD.2021.030, 2021.
Christiansen, J. R., Vesterdal, L., and Gundersen, P.: Nitrous oxide and methane exchange in two small temperate forest catchments – effects of hydrological gradients and implications for global warming potentials of forest soils, Biogeochemistry, 107, 437–454, https://doi.org/10.1007/s10533-010-9563-x, 2012.
Conchedda, G. and Tubiello, F. N.: Drainage of organic soils and GHG emissions: validation with country data, Earth Syst. Sci. Data, 12, 3113–3137, https://doi.org/10.5194/essd-12-3113-2020, 2020.
Cornwell, W. K., Cornelissen, J. H. C., Amatangelo, K., Dorrepaal, E., Eviner, V. T., Godoy, O., Hobbie, S. E., Hoorens, B., Kurokawa, H., Pérez-Harguindeguy, N., Quested, H. M., Santiago, L. S., Wardle, D. A., Wright, I. J., Aerts, R., Allison, S. D., Van Bodegom, P., Brovkin, V., Chatain, A., Callaghan, T. V., Díaz, S., Garnier, E., Gurvich, D. E., Kazakou, E., Klein, J. A., Read, J., Reich, P. B., Soudzilovskaia, N. A., Vaieretti, M. V., and Westoby, M.: Plant species traits are the predominant control on litter decomposition rates within biomes worldwide, Ecol. Lett., 11, 1065–1071, https://doi.org/10.1111/j.1461-0248.2008.01219.x, 2008.
Couwenberg, J. and Fritz, C.: Towards developing IPCC methane “emission factors” for peatlands (organic soils), Mires Peat, 10, 1–17, http://www.mires-and-peat.net/pages/volumes/map10/map1003.php (last access: 16 October 2023), 2012.
Dias, A. T. C., Hoorens, B., Van Logtestijn, R. S. P., Vermaat, J. E., and Aerts, R.: Plant species composition can be used as a proxy to predict methane emissions in peatland ecosystems after land-use changes, Ecosystems, 13, 526–538, https://doi.org/10.1007/s10021-010-9338-1, 2010.
Ernfors, M., von Arnold, K., Stendahl, J., Olsson, M., and Klemedtsson, L.: Nitrous oxide emissions from drained organic forest soils – an up-scaling based on C : N ratios. Biogeochemistry, 89, 29–41, https://doi.org/10.1007/s10533-007-9123-1, 2008.
Ernfors, M., Björk, R. G., Nousratpour, A., Rayner, D., Weslien, P., and Klemedtsson, L.: Greenhouse gas dynamics of a well-drained afforested agricultural peatland, Boreal Environ. Res., 25, 65–89, http://www.borenv.net/BER/archive/pdfs/ber25/ber25-065-089.pdf (last access: 28 November 2023), 2020.
FRA: Terms and Definitions, Forest Resources Assessment Working Paper 188, Food and Agriculture Organization of the United Nations, Rome, 26 pp., https://www.fao.org/3/ca9825en/ca9825en.pdf (last access: 16 October 2023), 2018.
Harris, L. I., Moore, T. R., Roulet, N. T., and Pinsonneault, A. J.: Limited effect of drainage on peat properties, porewater chemistry, and peat decomposition proxies in a boreal peatland, Biogeochemistry, 151, 43–62, https://doi.org/10.1007/s10533-020-00707-1, 2020.
Hermans, R., McKenzie, R., Andersen, R., Teh, Y. A., Cowie, N., and Subke, J.-A.: Net soil carbon balance in afforested peatlands and separating autotrophic and heterotrophic soil CO2 effluxes, Biogeosciences, 19, 313–327, https://doi.org/10.5194/bg-19-313-2022, 2022.
Hogg, E. H., Lieffers, V. J., and Wein, R. W.: Potential carbon losses from peat profiles: effects of temperature, drought cycles, and fire, Ecol. Appl., 2, 298–306, https://doi.org/10.2307/1941863, 1992.
IPCC: 2006 IPCC Guidelines for National Greenhouse Gas Inventories, prepared by the National Greenhouse Gas Inventories Programme, edited by: Eggleston H. S., Buendia, L., Miwa, K., Ngara, T., and Tanabe, K., IGES, Japan, https://www.ipcc-nggip.iges.or.jp/public/2006gl/ (last access: 4 January 2023), 2006.
IPCC: 2013 Supplement to the 2006 IPCC Guidelines for National Greenhouse Gas Inventories: Wetlands, edited by: Hiraishi, T., Krug, T., Tanabe, K., Srivastava, N., Baasansuren, J., Fukuda, M., and Troxler, T. G., IPCC, Switzerland, 353 pp., https://www.ipcc-nggip.iges.or.jp/public/wetlands/ (last access: 4 January 2023), 2014.
IPCC: 2019 Refinement to the 2006 IPCC Guidelines for National Greenhouse Gas Inventories (Vol. 4, Agriculture, Forestry and Other Land Use), edited by: Calvo Buendia, E., Tanabe, K., Kranjc, A., Baasansuren, J., Fukuda, M., Ngarize, S., Osako, A., Pyrozhenko, Y., Shermanau, P., and Federici, S., IPCC, Switzerland, 110 pp., https://www.ipcc-nggip.iges.or.jp/public/2019rf/vol4.html (last access: 19 September 2023), 2019.
Jaatinen, K., Laiho, R., Vuorenmaa, A., del Castillo, U., Minkkinen, K., Pennanen, T., Penttilä, T., and Fritze, H.: Responses of aerobic microbial communities and soil respiration to water-level drawdown in a northern boreal fen, Environ. Microbiol., 10, 339–353, https://doi.org/10.1111/j.1462-2920.2007.01455.x, 2008.
Jauhiainen, J.: Greenhouse gas emissions from drained organic forest soils data, Zenodo [data set], https://doi.org/10.5281/zenodo.8425244, 2023.
Jauhiainen, J., Alm, J., Bjarnadottir, B., Callesen, I., Christiansen, J. R., Clarke, N., Dalsgaard, L., He, H., Jordan, S., Kazanavičiūtė, V., Klemedtsson, L., Lauren, A., Lazdins, A., Lehtonen, A., Lohila, A., Lupikis, A., Mander, Ü., Minkkinen, K., Kasimir, Å., Olsson, M., Ojanen, P., Óskarsson, H., Sigurdsson, B. D., Søgaard, G., Soosaar, K., Vesterdal, L., and Laiho, R.: Reviews and syntheses: Greenhouse gas exchange data from drained organic forest soils – a review of current approaches and recommendations for future research, Biogeosciences, 16, 4687–4703, https://doi.org/10.5194/bg-16-4687-2019, 2019.
Joosten, H.: The Global Peatland CO2 Picture: Peatland Status and Drainage Related Emissions in All Countries of the World, Wetlands International, Ede, the Netherlands, https://www.wetlands.org/publications/the-global-peatland-co2-picture/ (last access: 4 January 2022), 2010.
Jovani-Sancho, A. J., Cummins, T., and Byrne, K. A.: Soil carbon balance of afforested peatlands in the maritime temperate climatic zone, Glob. Change Biol., 27, 3681–3698, https://doi.org/10.1111/gcb.15654, 2021.
Kasimir, Å., He, H., Coria, J., and Nordén, A.: Land use of drained peatlands: Greenhouse gas fluxes, plant production, and economics, Glob. Change Biol., 24, 3302–3316, https://doi.org/10.1111/gcb.13931, 2018.
Kasimir-Klemedtsson, Å., Klemedtsson, L., Berglund, K., Martikainen, P., Silvola, J., and Oenema, O.: Greenhouse gas emissions from farmed organic soils: A review, Soil Use Manage., 13, 245–250, https://doi.org/10.1111/j.1475-2743.1997.tb00595.x, 1997.
Keltikangas, M., Laine, J., Puttonen, P., and Seppälä, K.: Vuosina 1930–1978 metsäojitetut suot: ojitusalueiden inventoinnin tuloksia, (Summary: Peatlands drained for forestry during 1930–1978: results from field surveys of drained area), Acta Forestalia Fennica, 193, 1–94, https://doi.org/10.14214/aff.7639, 1986.
Korkiakoski, M., Ojanen, P., Penttilä, T., Minkkinen, K., Sarkkola, S., Rainne, J., Laurila, T., and Lohila, A.: Impact of partial harvest on CH4 and N2O balances of a drained boreal peatland forest, Agr. Forest Meteorol., 295, 108168, https://doi.org/10.1016/j.agrformet.2020.108168, 2020.
Korkiakoski, M., Ojanen, P., Tuovinen, J. P., Minkkinen, K., Nevalainen, O., Penttilä, T., Aurela, M., Laurila, T., and Lohila, A.: Partial cutting of a boreal nutrient-rich peatland forest causes radically less short-term on-site CO2 emissions than clear-cutting, Agr. Forest Meteorol., 332, 109361, https://doi.org/10.1016/j.agrformet.2023.109361, 2023.
Köchy, M., Hiederer, R., and Freibauer, A.: Global distribution of soil organic carbon – Part 1: Masses and frequency distributions of SOC stocks for the tropics, permafrost regions, wetlands, and the world, SOIL, 1, 351–365, https://doi.org/10.5194/soil-1-351-2015, 2015.
Laine, J., Komulainen, V.-M., Laiho, R., Minkkinen, K., Rasinmäki, A., Sallantaus, T., Sarkkola, S., Silvan, N., Tolonen, K., Tuittila, E.-S., Vasander, H., and Päivänen, J.: Lakkasuo – a guide to mire ecosystem, University of Helsinki Department of Forest Ecology Publications 31, 123 pp., 2004.
Laine, J., Vasander, H., Hotanen, J.-P. Nousiainen, H., Saarinen, M., and Penttilä, T.: Suotyypit ja turvekankaat – kasvupaikkaopas, Metsäkustannus Oy, Jelgava Printing House, Latvia, 160 pp., ISBN 978-952-338-036-3, 2018.
Larmola, T., Tuittila, E., Tiirola, M., Nykänen, H., Martikainen, P. J., Yrjälä, K., Tuomivirta, T., and Fritze, H.: The role of Sphagnum mosses in the methane cycling of a boreal mire, Ecology, 91, 2356–2365, https://doi.org/10.1890/09-1343.1, 2010.
Leppä, K., Korkiakoski, M., Nieminen, M., Laiho, R., Hotanen, J.-P., Kieloaho, A.-J., Korpela, L., Laurila, T., Lohila, A., Minkkinen, K., Mäkipää, R., Ojanen, P., Pearson, M., Penttilä, T., Tuovinen, J.-P., and Launiainen, S.: Vegetation controls of water and energy balance of a drained peatland forest: Responses to alternative harvesting practices, Agr. Forest Meteorol., 295, 108198, https://doi.org/10.1016/j.agrformet.2020.108198, 2020.
Lohila, A., Laurila, T., Aro, L., Aurela, M., Tuovinen, J.-P., Laine, J., and Minkkinen, K.: Carbon dioxide exchange above a 30-year-old Scots pine plantation established on organic-soil cropland, Boreal Environ. Res., 12, 141–157, http://hdl.handle.net/10138/235383 (last access: 28 November 2023), 2007.
Mäkiranta, P., Hytönen, J., Aro, L., Maljanen, M., Pihlatie, M., Potila, H., Shurpali, N. J., Laine, J., Lohila, A., Martikainen, P. J., and Minkkinen, K.: Soil greenhouse gas emissions from afforested organic soil croplands and peat extraction peatlands, Boreal Environ. Res., 12, 159–175, 2007.
Mander, Û., Lõhmus, K., Teiter, S., Uri, V., and Augustin, J.: Gaseous nitrogen and carbon fluxes in riparian alder stands, Boreal Environ. Res., 13, 231–241, http://hdl.handle.net/10138/234735 (last access: 28 November 2023), 2008.
Martikainen, P. J., Nykänen, H., Crill, P., and Silvola J.: Effect of a lowered water-table on nitrous oxide fluxes from northern peatlands, Nature, 366, 51–53, https://doi.org/10.1038/366051a0, 1993.
McNamara, N. P., Black, H. I. J., Piearce, T. G., Reay, D. S., and Ineson, P.: The influence of afforestation and tree species on soil methane fluxes from shallow organic soils at the UK Gisburn Forest Experiment, Soil Use Manage., 24, 1–7, https://doi.org/10.1111/j.1475-2743.2008.00147.x, 2008.
Meyer, A., Tarvainen, L., Nousratpour, A., Björk, R. G., Ernfors, M., Grelle, A., Kasimir Klemedtsson, Å., Lindroth, A., Räntfors, M., Rütting, T., Wallin, G., Weslien, P., and Klemedtsson, L.: A fertile peatland forest does not constitute a major greenhouse gas sink, Biogeosciences, 10, 7739–7758, https://doi.org/10.5194/bg-10-7739-2013, 2013.
Minkkinen, K. and Laine, J.: Vegetation heterogeneity and ditches create spatial variability in methane fluxes from peatlands drained for forestry, Plant Soil, 285, 289–304, https://doi.org/10.1007/s11104-006-9016-4, 2006.
Minkkinen, K., Vasander, H., Jauhiainen, S., Karsisto, M., and Laine, J.: Post-drainage changes in vegetation composition and carbon balance in Lakkasuo mire, Central Finland, Plant Soil, 207, 107–120, https://doi.org/10.1023/A:1004466330076, 1999.
Minkkinen, K., Penttilä, T., and Laine, J.: Tree stand volume as a scalar for methane fluxes in forestry-drained peatlands in Finland, Boreal Environ. Res., 12, 127–132, http://www.borenv.net/BER/archive/pdfs/ber12/ber12-127.pdf (last access: 28 November 2023), 2007.
Minkkinen, K., Ojanen, P., Penttilä, T., Aurela, M., Laurila, T., Tuovinen, J.-P., and Lohila, A.: Persistent carbon sink at a boreal drained bog forest, Biogeosciences, 15, 3603–3624, https://doi.org/10.5194/bg-15-3603-2018, 2018.
Minkkinen, K., Ojanen, P., Koskinen, M., and Penttilä, T.: Nitrous oxide emissions of undrained, forestry-drained, and rewetted boreal peatlands, Forest Ecol. Manage., 478, 118494, https://doi.org/10.1016/j.foreco.2020.118494, 2020.
Moilanen, M., Saarinen, M., and Silfverberg, K.: Foliar nitrogen, phosphorus and potassium concentrations of Scots pine in drained mires in Finland, Silva Fenn., 44, 129, https://doi.org/10.14214/sf.129, 2010.
Montanarella, L., Jones, R. J. A., and Hiederer, R.: The distribution of peatlands in Europe, Mires Peat, 1, 01, http://mires-and-peat.net/pages/volumes/map01/map0101.php (last access: 28 November 2023), 2006.
Nykänen, H., Alm, J., Silvola, J., Tolonen, K., and Martikainen, P. J.: Methane fluxes on boreal peatlands of different fertility and the effect of long-term experimental lowering of the water table on flux rates, Global Biogeochem. Cy., 12, 53–69, https://doi.org/10.1029/97GB02732, 1998.
Oertel, C., Matschullat, J., Zurba, K., Zimmermann, F., and Erasmi, S.: Greenhouse gas emissions from soils – A review, Geochemistry, 76, 327–352, https://doi.org/10.1016/j.chemer.2016.04.002, 2016.
Ojanen, P. and Minkkinen, K.: The dependence of net soil CO2 emissions on water table depth in boreal peatlands drained for forestry, Mires Peat, 24, 27, https://doi.org/10.19189/MaP.2019.OMB.StA.1751, 2019.
Ojanen, P., Minkkinen, K., Alm, J., and Penttilä, T.: Soil – atmosphere CO2, CH4 and N2O fluxes in boreal forestry-drained peatlands, Forest Ecol. Manage., 260, 411–421, https://doi.org/10.1016/j.foreco.2010.04.036, 2010.
Ojanen, P., Minkkinen, K., and Penttilä, T.: The current greenhouse gas impact of forestry-drained boreal peatlands, Forest Ecol. Manage., 289, 201–208, https://doi.org/10.1016/j.foreco.2012.10.008, 2013.
Ojanen, P., Penttilä, T., Tolvanen, A., Hotanen, J.-P., Saarimaa, M., Nousiainen, H., and Minkkinen, K.: Long-term effect of fertilization on the greenhouse gas exchange of low-productive peatland forests, Forest Ecol. Manage., 432, 786–798, https://doi.org/10.1016/j.foreco.2018.10.015, 2019.
Päivänen, J. and Hånell, B.: Peatland ecology and forestry – a sound approach, University of Helsinki Department of Forest Sciences Publications, Vol. 3, University of Helsinki, 267 pp., ISBN 978-952-10-4531-8, 2012.
Pärn, J., Verhoeven, J. T. A., Butterbach-Bahl, K., Dise, N. B., Ullah, S., Aasa, A., Egorov, S., Espenberg, M., Järveoja, J., Jauhiainen, J., Kasak, K., Klemedtsson, L., Kull, A., Laggoun-Défarge, F., Lapshina, E. D., Lohila, A., Lõhmus, K., Maddison, M., Mitsch, W. J., Müller, C., Niinemets, Ü., Osborne, B., Pae, T., Salm, J. O., Sgouridis, F., Sohar, K., Soosaar, K., Storey, K., Teemusk, A., Tenywa, M. M., Tournebize, J., Truu, J., Veber, G., Villa, J. A., Zaw, S. S., and Mander, Ü.: Nitrogen-rich organic soils under warm well-drained conditions are global nitrous oxide emission hotspots, Nat. Commun., 9, 1135, https://doi.org/10.1038/s41467-018-03540-1, 2018.
Pearce, D. M. E. and Clymo, R. S.: Methane oxidation in a peatland core, Global Biogeochem. Cy., 15, 709–720, https://doi.org/10.1029/2000GB001323, 2001.
Peltoniemi, K., Adamczyk, S., Fritze, H., Minkkinen, K., Pennanen, T., Penttilä, T., Sarjala, T., and Laiho, R.: Site fertility and soil water-table level affect fungal biomass production and community composition in boreal peatland forests, Environ. Microbiol., 23, 5733–5749, https://doi.org/10.1111/1462-2920.15368, 2021.
Petrescu, A. M. R., Lohila, A., Tuovinen, J.-P., Baldocchi, D. D., Desai, A. R., Roulet, N., Vesala, T., Dolman, A. J., Oechel, W. C., Marcolla, B., Friborg, T., Rinne, J., Matthes J. C., Merbold, L., Meijide, A., Kiely, G., Sottocornola, M., Sachs, T., Zona, D., Varlagin, A., Lair, D. Y. F., Veenendaal, E., Parmentier, F.-J. W., Skiba, U., Lund, M., Hensen, A., van Huissteden, J., Flanagan, L. B., Shurpali, N. J., Grünwald, T., Humphreys, E. R., Jackowicz-Korczynski, M., Aurela, M. A, Laurila, T., Grüning, C., Corradi, C. A. R., Schrier-Uijls, A. P., Christensen, T. R., Tamstorf, M. P., Mastepanov, M., Martikainen, P. J., Verma, S. B., Bernhofer, C., and Cescatti, A.: The uncertain climate footprint of wetlands under human pressure, P. Natl. Acad. Sci. USA, 112, 4594–4599, https://doi.org/10.1073/pnas.1416267112, 2015.
Post, W. M., Pastor, J., Zinke, P. J., and Stangenberger, A. G.: Global patterns of soil nitrogen storage, Nature, 317, 613–616, https://doi.org/10.1038/317613a0, 1985.
Preston, C. M., Trofymow, J. A., and the Canadian Intersite Decomposition Experiment Working Group: Variability in litter quality and its relationship to litter decay in Canadian forests, Can. J. Bot., 78, 1269–1287, https://doi.org/10.1139/b00-101, 2000.
Regina, K., Nykänen, H., Maljanen, M., Silvola, J., and Martikainen, P. J.: Emissions of N2O and NO and net nitrogen mineralization in a boreal forested peatland treated with different nitrogen compounds, Can. J. Forest Res., 28, 132–140, https://doi.org/10.1139/x97-198, 1998.
Rey-Sanchez, C., Bohrer, G., Slater, J., Li, Y.-F., Grau-Andrés, R., Hao, Y., Rich, V. I., and Davies, G. M.: The ratio of methanogens to methanotrophs and water-level dynamics drive methane transfer velocity in a temperate kettle-hole peat bog, Biogeosciences, 16, 3207–3231, https://doi.org/10.5194/bg-16-3207-2019, 2019.
Rütting, T., Björk, R. G., Meyer, A., Klemedtsson, L., and Sikström, U.: Reduced global warming potential after wood ash application in drained northern peatland forests, Forest Ecol. Manage., 328, 159–166, https://doi.org/10.1016/j.foreco.2014.05.033, 2014.
Sosulski, T., Szara, E., Szymanska, M., Stepien, W., Rutkowska, B., and Szulc, W.: Soil N2O emissions under conventional tillage conditions and from forest soil, Soil Till. Res., 190, 86–91, https://doi.org/10.1016/j.still.2019.03.002, 2019.
Straková, P., Penttilä, T., Laine, J., and Laiho, R.: Disentangling direct and indirect effects of water table drawdown on above- and belowground plant litter decomposition: Consequences for accumulation of organic matter in boreal peatlands, Glob. Change Biol., 18, 322–335, https://doi.org/10.1111/j.1365-2486.2011.02503.x, 2012.
Sundh, I., Nilsson, M., Granberg, G., and Svensson, B. H.: Depth distribution of microbial production and oxidation of methane in northern boreal peatlands, Microbiol. Ecol., 27, 253–265, https://doi.org/10.1007/BF00182409, 1994.
Tubiello, F. N., Biancalani, R., Salvatore, M., Rossi, S., and Conchedda, G.: A Worldwide assessment of greenhouse gas emissions from drained organic soils, Sustainability, 8, 371, https://doi.org/10.3390/su8040371, 2016.
Turetsky, M. R., Kotowska, A., Bubier, J., Dise, N. B., Crill, P., Hornibrook, E. R. C., Minkkinen, K., Moore, T. R., Myers-Smith, I. H., Nykänen, H., Olefeldt, D., Rinne, J., Saarnio, S., Shurpali, N., Tuittila, E.-S., Waddington, J. M., White, J. R., Wickland, K. P., and Wilmking, M.: A synthesis of methane emissions from 71 northern, temperate, and subtropical wetlands, Glob. Change Biol., 20, 2183–2197, https://doi.org/10.1111/gcb.12580, 2014.
UNFCCC: Table 4.1 in the country spesific CRF data, UNFCCC [data set], http://unfccc.int/national_reports/annex_i_ghg_inventories/national_inventories_submissions/items/10116.php (last access: 1 May 2023), 2017.
Uri, V., Kukumägi, M., Aosaar, J., Varik, M., Becker, H., Morozov, G., and Karoles, K.: Ecosystems carbon budgets of differently aged downy birch stands growing on well-drained peatlands, Forest Ecol. Manage., 399, 82–93, https://doi.org/10.1016/j.foreco.2017.05.023, 2017.
Wang, H., Richardson, C. J., and Ho, M.: Dual controls on carbon loss during drought in peatlands, Nat. Clim. Change, 5, 584–587, https://doi.org/10.1038/NCLIMATE2643, 2015.
Westman, C. J. and Laiho, R.: Nutrient dynamics of drained peatland forests, Biogeochemistry, 63, 269–298, https://doi.org/10.1023/A:1023348806857, 2003.
Wiedermann, M., Kane, E., Potvin, L., and Lilleskov, E.: Interactive plant functional group and water table effects on decomposition and extracellular enzyme activity in Sphagnum peatlands, Soil Biol. Biochem., 108, 1–8, https://doi.org/10.1016/j.soilbio.2017.01.008, 2017.
Wilson, D., Blain, D., Couwenberg, J., Evans, C. D., Murdiyarso, D., Page, S. E., Renou-Wilson, F., Rieley, J. O., Sirin, A., Strack, M., and Tuittila, E.-S.: Greenhouse gas emission factors associated with rewetting of organic soils, Mires Peat, 17, 1–28, https://doi.org/10.19189/MaP.2016.OMB.222, 2016.
- Article
(3001 KB) - Full-text XML