the Creative Commons Attribution 4.0 License.
the Creative Commons Attribution 4.0 License.
 | 20 Dec 2023
Environmental controls of winter soil carbon dioxide fluxes in boreal and tundra environments
Alex Mavrovic
Oliver Sonnentag
Juha Lemmetyinen
Carolina Voigt
Nick Rutter
Paul Mann
Jean-Daniel Sylvain
Alexandre Roy
The carbon cycle in Arctic–boreal regions (ABRs) is an important component of the planetary carbon balance, with growing concerns about the consequences of ABR warming for the global climate system. The greatest uncertainty in annual carbon dioxide (CO2) budgets exists during winter, primarily due to challenges with data availability and limited spatial coverage in measurements. The goal of this study was to determine the main environmental controls of winter CO2 fluxes in ABRs over a latitudinal gradient (45∘ to 69∘ N) featuring four different ecosystem types: closed-crown coniferous boreal forest, open-crown coniferous boreal forest, erect-shrub tundra, and prostrate-shrub tundra. CO2 fluxes calculated using a snowpack diffusion gradient method (n=560) ranged from 0 to 1.05 g C m2 d−1. To assess the dominant environmental controls governing CO2 fluxes, a random forest machine learning approach was used. We identified soil temperature as the main control of winter CO2 fluxes with 68 % of relative model importance, except when soil liquid water occurred during 0 ∘C curtain conditions (i.e., Tsoil≈0 ∘C and liquid water coexist with ice in soil pores). Under zero-curtain conditions, liquid water content became the main control of CO2 fluxes with 87 % of relative model importance. We observed exponential regressions between CO2 fluxes and soil temperature in fully frozen soils (RMSE=0.024 ; 70.3 % of mean ) and soils around the freezing point (RMSE=0.286 ; 112.4 % of mean ). increases more rapidly with Tsoil around the freezing point than at Tsoil<5 ∘C. In zero-curtain conditions, the strongest regression was found with soil liquid water content (RMSE=0.137 ; 49.1 % of mean ). This study shows the role of several variables in the spatio-temporal variability in CO2 fluxes in ABRs during winter and highlights that the complex vegetation–snow–soil interactions in northern environments must be considered when studying what drives the spatial variability in soil carbon emissions during winter.
- Article
(6598 KB) - Full-text XML
- BibTeX
- EndNote


Carbon stocks and fluxes in the Arctic and boreal biomes (hereafter called Arctic–boreal regions; ABRs) constitute large components of the planetary carbon balance (Tarnocai et al., 2009; van Huissteden and Dolman, 2012; Carreiras et al., 2017). ABRs store substantial quantities of carbon due to inherently slow decomposition rates, largely attributable to cold temperatures (Ravn et al., 2020). ABRs are warming up to 4 times faster than the rest of the planet with potential feedbacks to the global climate system (Derksen et al., 2019; Rantanen et al., 2022). Although ongoing warming of ABRs has the potential to lengthen growing seasons, enhance plant growth, and increase aboveground carbon storage (Sturm et al., 2005; McMahon et al., 2010), the growing-season vegetation response is variable and complex (Myers-Smith et al., 2020). Warmer air and soil temperatures enhance production and release of carbon dioxide (CO2) from ecosystem respiration, comprising heterotrophic respiration by microbes decomposing soil organic matter, and autotrophic respiration by above- and belowground plant components (Bond-Lamberty and Thomson, 2010). The release of previously frozen carbon stocks is particularly important in regions undergoing permafrost thaw (ground completely frozen for at least 2 consecutive years) (Schuur et al., 2015; Natali et al., 2021; Miner et al., 2022). If increases in ecosystem respiration exceed those of photosynthetic CO2 uptake from enhanced plant growth, ABRs may shift from a weak net CO2 sink to a net CO2 source, thereby generating a potentially non-negligible positive feedback to the global climate system (Hayes et al., 2011; Gauthier et al., 2015; Natali et al., 2019; Bruhwiler et al., 2021; Virkkala et al., 2021; Braghiere et al., 2023).
During winter months in ABRs, landscapes are generally snow-covered and photosynthesis is considered negligible, and therefore winter CO2 fluxes derive primarily from soil respiration (Christiansen et al., 2012; Webb et al., 2016). It is expected that complex soil–vegetation–snow interactions will lead to regional and local variability in soil respiration rates across ABRs because of relationships between vegetation types, snow cover, soil properties, soil moisture, and soil temperature (Gouttevin et al., 2012; Busseau et al., 2017; Loranty et al., 2018; Grünberg et al., 2020; Royer et al., 2021). Higher soil temperatures promote microbial activity and increase CO2 production from soil organic matter decomposition during winter (Natali et al., 2019). A snowpack acts as an important thermal insulative layer for the soil during winter, keeping soils warmer than the ambient air (Domine et al., 2016b). Vegetation affects snow properties by increasing snow depth where wind trapping occurs (Callaghan et al., 2011a, b; Busseau et al., 2017), decreasing snow density and thermal conductivity around shrubs (Gouttevin et al., 2012; Domine et al., 2015, 2016a), decreasing albedo due to protruding branches (Ménard et al., 2012), and causing earlier spring snowmelt due to vegetation thermal conductivity (Wilcox et al., 2019; Kropp et al., 2022). However, Dominé et al. (2022) showed that shrub branches within the snowpack can contribute to mid-winter soil cooling by conducting temperature through the snowpack. Hence, the complex vegetation–snow–soil interactions in northern environments must be considered when studying what drives the spatial variability in soil carbon emissions during winter. Soil microbial activity can also be limited by lack or saturation of available water, meaning that higher amounts of available soil liquid water content (LWC) should allow higher heterotrophic respiration rates by increasing soil microbial activity as long as the soil environment is not anaerobic (Linn and Doran, 1984; Knowles et al., 2015). Anaerobic soil conditions are usually found in fully water saturated soils.
High uncertainties in winter ABR CO2 exchange between the ground surface and atmosphere are in part due to limited data availability because of difficulties in accessing these vast, remote regions and the harsh winter conditions creating technical challenges for CO2 fluxes measurements (Natali et al., 2019; Virkkala et al., 2022). Methods currently available to measure wintertime CO2 fluxes include (1) the eddy covariance technique (Baldocchi, 2003), (2) chamber measurements under or above the snowpack (McDowell et al., 2000), and (3) snowpack gradient diffusion methods (Sommerfeld et al., 1993). Each of these has their advantages and limitations. The eddy covariance (EC) technique exploits the atmosphere's turbulent nature to estimate net CO2 fluxes at high temporal resolution without environmental disturbance (Baldocchi et al., 2001; Pastorello et al., 2020). Data gaps are common during the ABR winter since the EC equipment is energy-intensive and prone to failure in low temperatures. In addition, solar power supply systems are limited by low sunlight (Jentzsch et al., 2021; Pallandt et al., 2022). Furthermore, the EC equipment is stationary and covers a large footprint (250–3000 m). In contrast, plot-scale chamber techniques for measuring CO2 fluxes are portable methods with a small footprint (<1 m) (Subke et al., 2021; Maier et al., 2022). Chambers can be used either above the snowpack or directly on the ground. Placing a chamber on the snowpack does not provide a direct measurement of soil CO2 fluxes due to CO2 retention and lateral diffusion within snowpacks, generally creating a negative bias and uncertainties linking the snow and/or atmosphere fluxes to soil fluxes (McDowell et al., 2000; Björkman et al., 2010; Webb et al., 2016). Chambers can also be placed directly on the ground by excavating the snow cover (Elberling, 2007), providing a direct measurement of soil CO2 fluxes that is, however, prone to a positive bias generated by a tunnel effect due to the snow excavation (McDowell et al., 2000; Björkman et al., 2010). Unavoidable snow cover disturbance also reduces the possibility of revisiting locations for temporal surveys because the soil thermal regime is altered by the snow disturbance. Alternatively, permanent chambers can be installed before the first snowfall, but this disturbs the state of the ground and snow cover around the chamber (Webb et al., 2016). The snowpack diffusion gradient method uses snow porosity and tortuosity to estimate CO2 fluxes from the gas concentration gradient along a vertical snow profile including ambient air above the snowpack (Sommerfeld et al., 1993; Pirk et al., 2016; Kim et al., 2019). In this study, the snowpack diffusion gradient method will be used to evaluate the spatial variability in CO2 fluxes in ABRs because of its portability and minimal environmental disturbance.
The goal of this study was to determine the main environmental controls of winter CO2 fluxes in ABRs. A total of 560 snowpack diffusion gradient measurements were made over a latitudinal gradient of four different ecosystem types common in ABRs in Canada: closed-crown coniferous boreal forest, open-crown coniferous boreal forest, erect-shrub tundra, and prostrate-shrub tundra. Spatio-temporal measurements of snowpack CO2 diffusion gradients were performed at several locations in the four sites during the 2020–2021 and 2021–2022 winters (December to May). Firstly, a random forest (RF) machine learning analysis was used to evaluate the relative importance of the following environmental variables known to exert control over winter CO2 fluxes: soil temperature, soil LWC, vegetation type, snow water equivalent, snow depth, and several snow-density-related measurements. Secondly, the response of and uncertainty in winter CO2 fluxes to the most impactful environment variables determined by the RF model were quantified through regression analysis.
2.1 Study sites
To cover different vegetation types and a wide range of soil temperature (Tsoil) regimes and snow conditions found in ABRs, four study sites were selected across Canada (Fig. 1 and Table 1). Each site represents a specific ecosystem type (Royer et al., 2021), and vegetation types within each of those ecosystems were determined using vegetation maps specific to each site. Cambridge Bay (CB), situated on Victoria Island in the Canadian Arctic Archipelago was the northernmost site located in the Arctic tundra, dominated by lichen and prostrate-shrub tundra. Ponomarenko et al. (2019) generated a detailed ecotype map of the Arctic tundra biome present in the CB study area. Here, these ecotypes were grouped by water availability into three tundra vegetation types from which the sampling locations (S) were selected: dry (S=94), sub-hydric (S=24), and hydric (S=110). Trail Valley Creek (TVC), Northwest Territories, situated just north of the treeline in the transitional zone between the boreal and Arctic biomes close to the Mackenzie Delta, is dominated by erect-shrub tundra with remaining tree patches (Martin et al., 2022). Grünberg et al. (2020) produced a vegetation map of the TVC study area using airborne orthophotos, vegetation height, and field observations from which seven vegetation types and landforms were identified: lichen (S=68), tussock (S=21), dwarf shrub (S=19), tall shrub (S=26), polygon (S=21), riparian shrub (S=17), and black spruce tree patch (S=18). Havikpak Creek (HPC) is located just south of the treeline, at about 50 km south of TVC in an open-crown black-spruce-dominated forest constituting the only type of vegetation present (S=30) (Krogh et al., 2017). Montmorency Forest (MM) is the southernmost site located in a closed-crown balsam-fir-dominated boreal forest constituting the only type of vegetation present (S=110) (Barry et al., 1988). The CB, TVC, and HPC sites are underlain by continuous permafrost, while the MM site is permafrost-free.
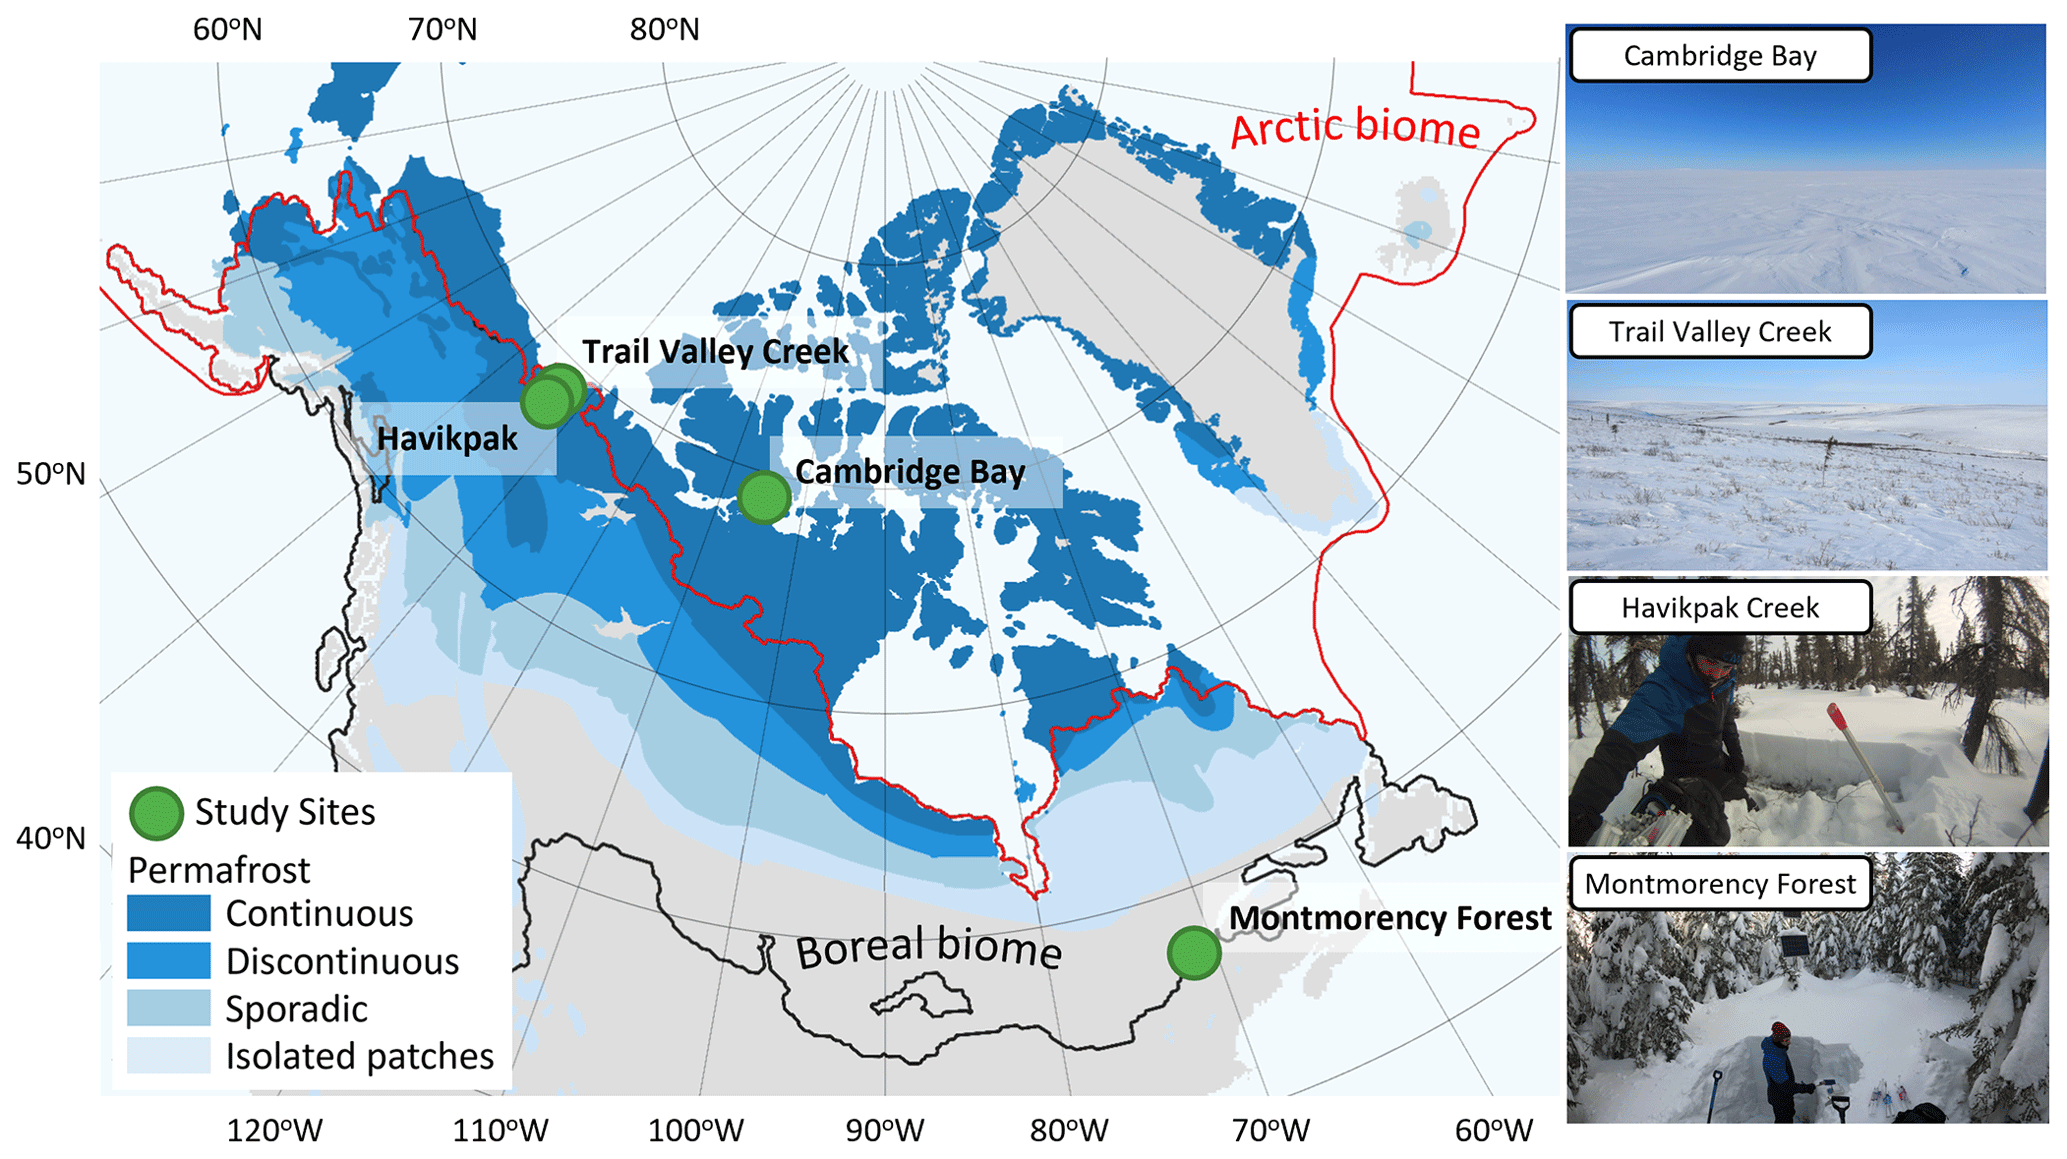
Figure 1Study site locations in Canada. The Arctic biome is delimited following the Conservation of Arctic Flora and Fauna (CAFF) working group of the Arctic Council, and the boreal biome is delimited following Potapov et al. (2008). Permafrost extent (Brown et al., 2002) is estimated in percent area: continuous (>90 %–100 %), discontinuous (>50 %–90 %), sporadic (10 %–50 %), and isolated patches (<10 %).
Table 1Study sites with the number of sampling locations in Canada and the number of CO2 flux measurements (N) for each site.
2.2 Snowpack diffusion gradient method
2.2.1 Theoretical framework for CO2 flux calculation
During winter in ABRs, soil respiration produces CO2 below the snowpack. Consequently, a vertical CO2 diffusion gradient is maintained through the snowpack (; g C m−4), with CO2 concentration ([CO2]; g C m−3) decreasing with snow height from the soil surface (z; m) (Jones et al., 1999). Hereafter, [CO2] is expressed in grams of carbon per cubic meter but units of concentration could also be expressed in relative units (i.e., parts per million – ppm) using the ideal gas law. The snowpack diffusion gradient method uses within the snowpack and Fick's first law for gas diffusion through porous media to estimate CO2 fluxes (; ) (Sommerfeld et al., 1993; Zhu et al., 2014):
where φ represents the porosity of the snow medium, τ its tortuosity, and Da the air diffusion coefficient of the diffused gas in square meters per day. The porosity of snow can be assessed from its density (Kinar and Pomeroy, 2015):
where ρ represents the density of snow, water, and pure ice ( with Tice as ice temperature in ∘C and ρice in g cm−3; Harvey et al., 2017) and θ is the snow liquid water content. The tortuosity is strongly correlated with porosity. Du Plessis and Masliyah (1991) established the following relationship:
Tortuosity can also be approximated as (Millington, 1959; Mast et al., 1998). is obtained by measuring the [CO2] vertical profile at various snow depths. Standard air diffusion coefficients of CO2 (unit: m2 d−1) are available in the literature but must be corrected for temperature and pressure (Marrero and Mason, 1972; Massman, 1998):
where T is the air temperature and To is the freezing point in kelvins. The diffusion gradient method assumes that gas fluxes are the result of simple, linear, gradient-induced diffusion in uniform porosity through snow cover (McDowell et al., 2000). A snowpack with strongly heterogeneous density (i.e., vertical stratification) can induce a bias when gas flow is altered by dense layers or ice crusts, typically leading to overestimation (Seok et al., 2009). Such layers were rarely found in our study sites. The diffusion gradient assumption also does not hold when strong wind events occur, decreasing snowpack CO2 concentration through wind-pumping and inducing a negative bias in CO2 fluxes (Seok et al., 2009). Consequently, was not measured in days following a strong wind event. Monitoring of at a few sampling locations did not show any relationship between and wind speed or atmospheric pressure (e.g., Fig. A1).
2.2.2 Data collection
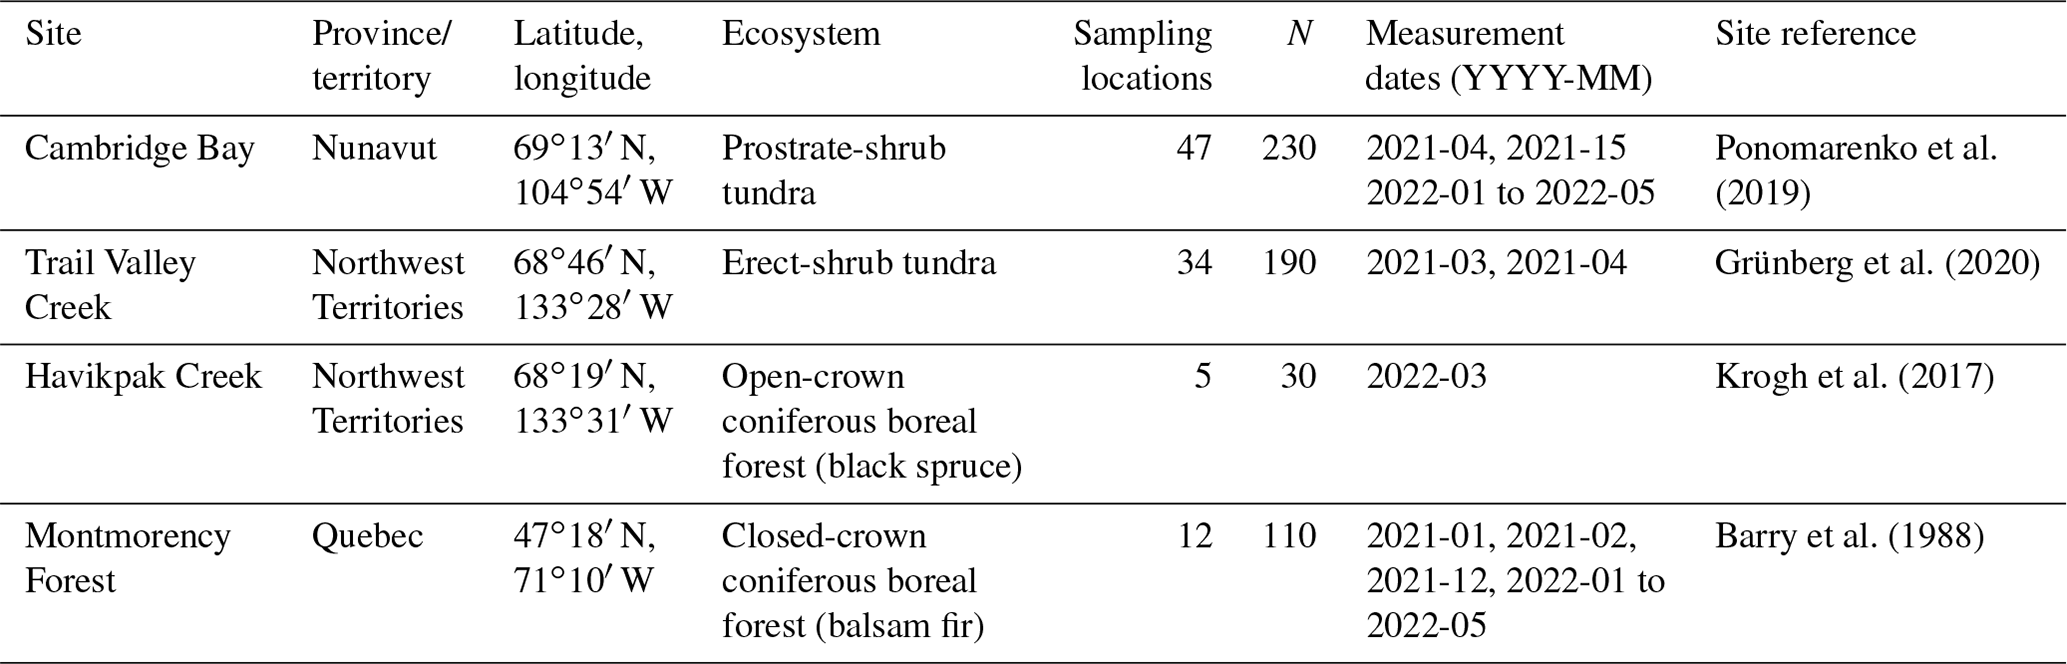
All data were collected during the 2020–2021 and 2021–2022 winters between December and May (Table 1). The CO2 concentration gradient was measured by collecting gas samples at various depths in the snowpack. Each gradient profile consisted of five gas samples collected at (1) 5 cm above the snowpack (ambient air), (2) 5 cm depth below the snowpack surface, (3) of total snow depth, (4) of total snow depth, and (5) the soil–snow interface. Gas present in snow pores was collected with a thin, hollow, stainless-steel rod (50–120 cm long, 4 mm outer diameter, and 2 mm inner diameter), starting with gas samples in the upper snowpack and then pushing the sampling rod downward to collect gas samples deeper in the snowpack to minimize snow disturbance (Fig. 2a). Gas was collected in a 60 mL syringe (Air-Tite Luer Lock, Virginia Beach, Virginia) connected to the rod via a three-way valve. Gases were transferred into 12 mL hermetic glass vials (Labco Exetainer®, Labco Ltd., Lampeter, UK), which were sent to the Université du Québec à Trois-Rivières laboratory to be measured with a gas analyzer to obtain CO2 concentrations. At each site, several sampling locations were selected to cover the maximum range of vegetation types and snowpack characteristics, covering areas of 0.05–22.5 km2. At each sampling location, two to four replicate profiles were measured at 50 cm spacing to test the repeatability of the sampling. A minimal spacing of 57.5 cm was required between sampling positions, since it corresponds to the radius of the 60 mL sampling volume of each gas sample, based on a snow density range of 100–650 kg m−3.
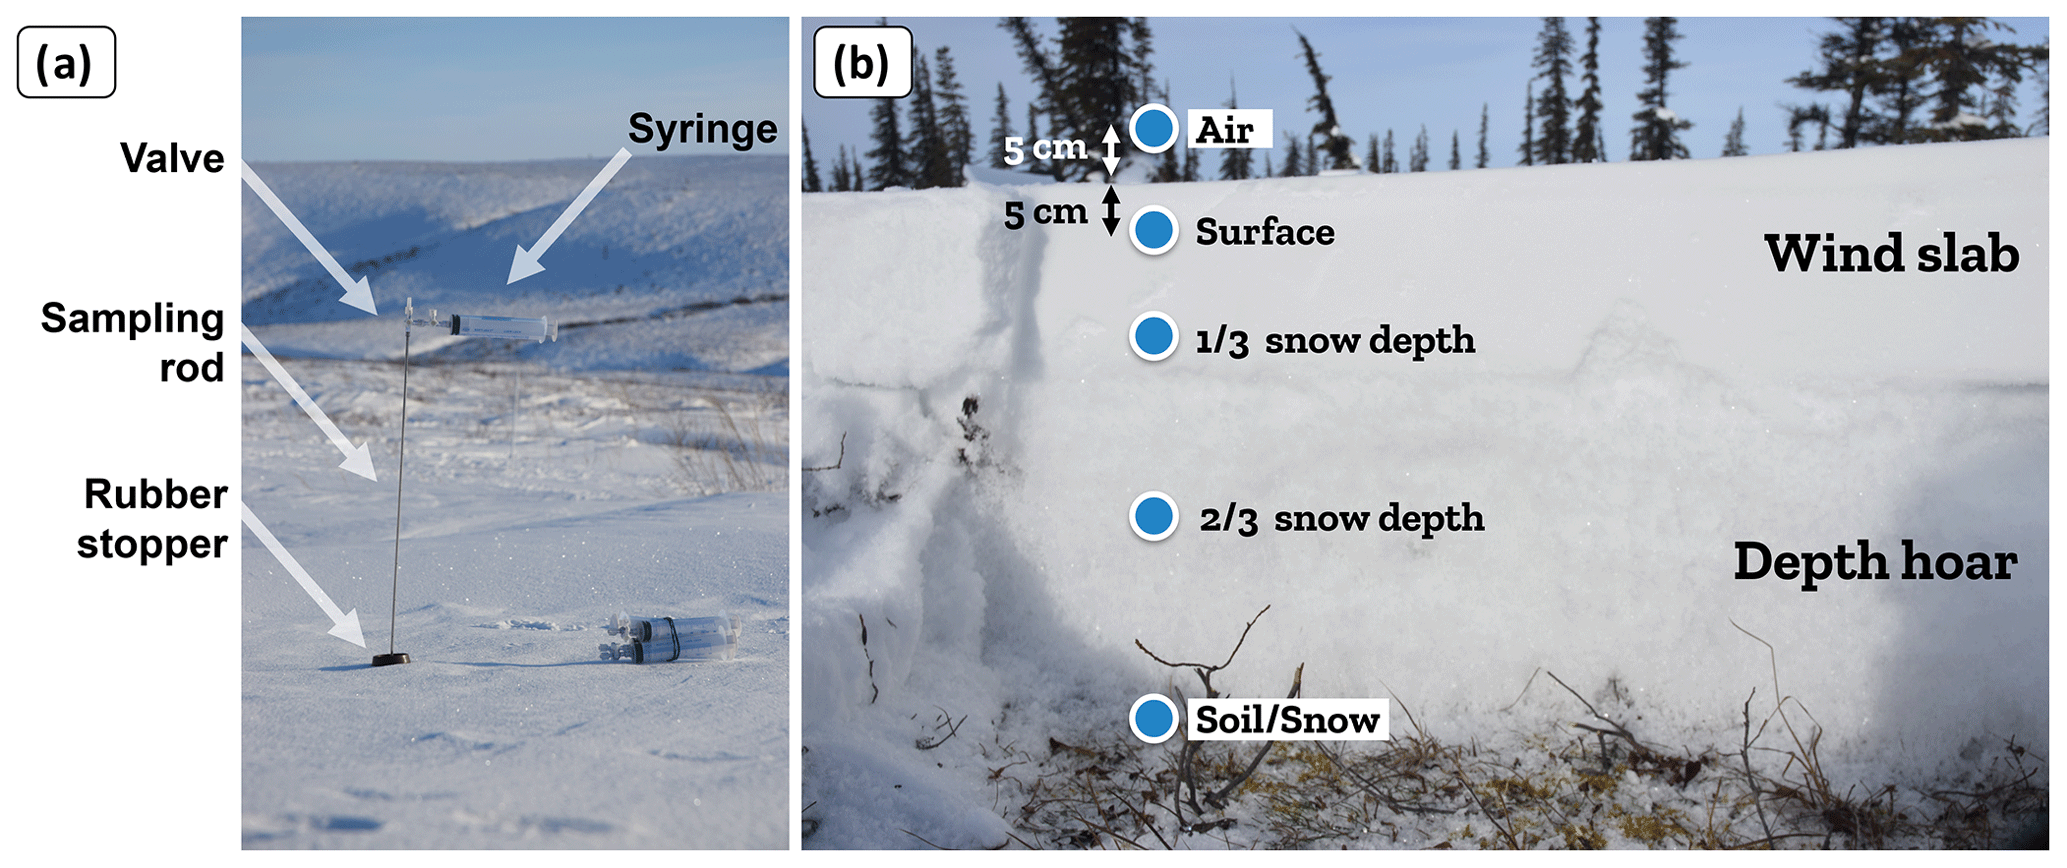
Figure 2(a) Gas sampling equipment for the CO2 concentration gradient measurement. (b) Typical snow depth profile of an Arctic snowpack (picture from Trail Valley Creek close to a tree patch).
For typical Arctic snowpacks, samples at depth are usually in wind slabs, the dense and cohesive surface snow layer formed by strong Arctic winds. Samples at depth are usually in depth hoar, the lower snow layer with low density and cohesion formed by a strong temperature gradient driving vertical vapor flux through the snowpack (Fig. 2b). Typically, boreal snowpacks are deeper than in Arctic tundra and display a more continuous vertical stratification with increasing snow density at the bottom of the snowpack. In HPC, snowpack depths were 40–80 cm in March, while snowpack depths at MM were 100–200 cm (Fig. A2). For comparison, by March, snowpacks at CB were 10–75 cm deep and 15–150 cm at TVC.
Once the gas samples were collected, a vertical profile of snow and soil properties was measured to calculate the CO2 air diffusion coefficient from the snow temperature, as well as snow porosity and tortuosity from snow density. Snow properties were measured every 5 cm, including snow temperature (Snowmetrics digital thermometer; Fort Collins, Colorado; resolution), snow density (Snowmetrics digital scale, 100 and 250 cm3 snow cutters used to weigh snow samples; σ(ρsnow)≈9 %; Proksch et al., 2016), snow liquid water content (hand test from Fierz et al., 2009), and snow stratigraphy. Examples of snow vertical stratification along with CO2 concentration measurements can be found in Appendix A (Fig. A3). Tsoil was measured at 1 cm depth under the soil–snow interface as it was not possible to go deeper in frozen soil and no permanent sensors were installed (Snowmetrics digital thermometer; Fort Collins, Colorado; resolution); three measurements of Tsoil were averaged. Snow depth measurements were done with a ruler graduated every 1 cm (σ(dsnow)≈0.5 cm).
The CO2 concentration of 86 % of gas samples was measured using a LI-COR LI-7810 Trace Gas Analyzer (LI-COR Biosciences, Lincoln, Nebraska; σ<1 %; N=483). The gas samples were passed through an open loop along a continuous flow of a 200 ppm CO2 calibration gas (Linde Canada, Ottawa, Ontario, Canada). Based on a calibration curve using 0, 400, and 1000 ppm CO2 calibration gases (Linde Canada), the CO2 concentration of gas samples was calculated (detailed protocol: https://www.licor.com/documents/xst0ld9jozfby78bmpdqi9i7rmjjjjmg, last access: 9 December 2023).
Randomly distributed gas samples collected during the 2020–2021 winter were analyzed with a Picarro G2201-i CRDS gas analyzer (Picarro, Santa Clara, California; σ<0.1 %; N=26) to validate the method used with the LI-7810 to determine CO2 concentration. CO2 concentrations estimated from the LI-7810 and Picarro G2201-i gas analyzers were not significantly different in their concentration range and distribution (Fig. A4; R2=0.92). At TVC in March 2022, a portable LI-850 Gas Analyzer was used (σ<1.5 %; N=38), allowing for CO2 concentrations to be measured on the same day as sample collection (avoiding the need for bottling and transportation). CO2 concentrations estimated from the LI-7810 and LI-850 gas analyzers were not significantly different in their concentration range and distribution (Fig. A4b; R2=0.82).
2.2.3 Evaluation of CO2 flux uncertainties
An uncertainty assessment was conducted to evaluate CO2 flux precision based on the snowpack diffusion gradient method. The uncertainty assessment focuses on random errors, as systematic errors are discussed at the end of Sect. 2.2.1. From sampling to flux estimation, several steps could add uncertainty to the results. Uncertainties can be subdivided into four sources: gas concentration estimates; gas transfer, transport, and storage; evaluation of the snowpack ; and snow pit measurements (i.e., snow density and temperature). Gas concentration uncertainties were evaluated from the gas analyzer precision as assessed by the manufacturer and tested using calibration gases. Six CO2 reference gases of 400 ppm were bottled during two different field campaigns and were processed among the gas samples from the snowpack to ensure the transfer, transport, and storage protocol did not lead to sample contamination. The uncertainties were evaluated with the standard deviation from the coefficient of determination (; Bowley, 1928). uncertainty was estimated by propagation of the uncertainties in and snow density using Eq. (1) (Taylor, 1997). The uncertainty in ρsnow was fixed at 9 % (Proksch et al., 2016), while the uncertainty in was estimated based on the root mean squared error of the linear regression for each snowpack concentration gradient measurement.
2.3 Soil volumetric liquid water content at the Montmorency Forest site
Conditions of a 0 ∘C curtain exist when the soil temperature is around freezing point (0 ∘C) and a mix of ice and liquid water coexist in the soil pore space because the phase transition between water and ice is slowed due to latent heat (Outcalt et al., 1990). Hence, liquid water content (LWC; m3 m−3) and ice fractions can be used as a freezing–thawing indicator during the zero-curtain period. The MM study sites were equipped with TEROS 12 soil moisture sensors (METER Group) at 5 cm depth. LWC was only monitored at the MM site since it was the only site where Tsoil in upper layers remained around 0 ∘C for the whole winter, allowing the presence of liquid water in the soil throughout winter. The Zhang et al. (2010) empirical soil liquid water and ice mixing model was used to calculate soil liquid water content (muw) (Eqs. 5 to 8). LWC was estimated to be negligible at the CB, TVC, and HPC sites since Tsoil was between −5 and −25 ∘C. The model from Zhang et al. (2010) supports LWC, at Tsoil colder than −5 ∘C, being negligible.
where ρw and ρb (g cm−3) represent liquid water and soil bulk density respectively, Tsoil (∘C) represents soil temperature, and SSA (m−1) represents soil particles' specific surface area described by Sepaskhah et al. (2010).
where dg represents the soil geometric mean particle-size diameter (mm) and f and M represent soil component fraction and mean particle-size diameter (mm). Soil components are clay (Mc=0.001 mm), silt (Msi=0.026 mm), and sand (Msa=1.025 mm). Soil bulk density and gravimetry was evaluated using a soil sampling protocol similar to the National Forest Inventory protocol (CFI, 2008). Undisturbed soil samples were collected in three homogenous horizons of a soil profile using 400 cm2 cores. Volumetric soil samples were dried (103 ∘C) and weighed to determine bulk density. Gravimetric samples were used to determine sand (%, 50–2000 µm), silt (%, 2–50 µm), clay (%, <2 µm), and organic content (g kg−1). The soil texture was determined by the hydrometer method (Bouyoucos, 1962), whereas the organic content was determined with a LECO organic analysis instrument (LECO Corporation, St. Joseph, Michigan).
2.4 Random forest algorithm
Random forest (RF) is an ensemble machine learning method based on a multitude of decision trees (Breiman, 2001). Each decision tree of our RF model (scikit-learn 1.2.1 library from Python 3.10.3) is trained on a random subset of environmental variables drawn from the dataset input: Tsoil, LWC, vegetation type, snow water equivalent, snow depth, snow mean density, snow maximum density, snow porosity, snow tortuosity, wind slab thickness (if present), and wind slab fraction relative to total snow depth (if present). Each decision tree generates a prediction, and the overall RF prediction is the average of all prediction trees. A strength of the RF algorithm is that it performs well even when input variables are correlated with each other (Liaw and Wiener, 2002; Strobl et al., 2008; Kibtia et al., 2020). Our RF model was composed of 500 fully decomposed decision trees. Our dataset was randomly divided into a training subset (75 %) and a testing subset (25 %), preserving the relative distribution between vegetation types. Our RF model performance was assessed using the coefficient of determination (R2), explained variance, and mean absolute error. We used our RF model to identify the relative importance of winter CO2 flux predictors. Relative importance of each environmental variable was computed with the permutation method, i.e., alternatively removing variables from the RF model and evaluating the performance decrease, which was measured via the coefficient of determination.
3.1 CO2 flux uncertainties
Evaluation of precision showed that the two main sources of uncertainty are associated with snow density measurements, in agreement with Sommerfeld et al. (1996), and with linear regression (mean R2=0.790 (σ=0.236) for ; N=398) (Table A1). Snow density uncertainty (σ(ρsnow)≈9 %) impacted snow porosity and tortuosity in Eq. (1). From the linear fit of Fig. 3, the average uncertainty can be estimated at 19.4 %, which provides sufficient accuracy to observe the impact of environmental variables on winter .
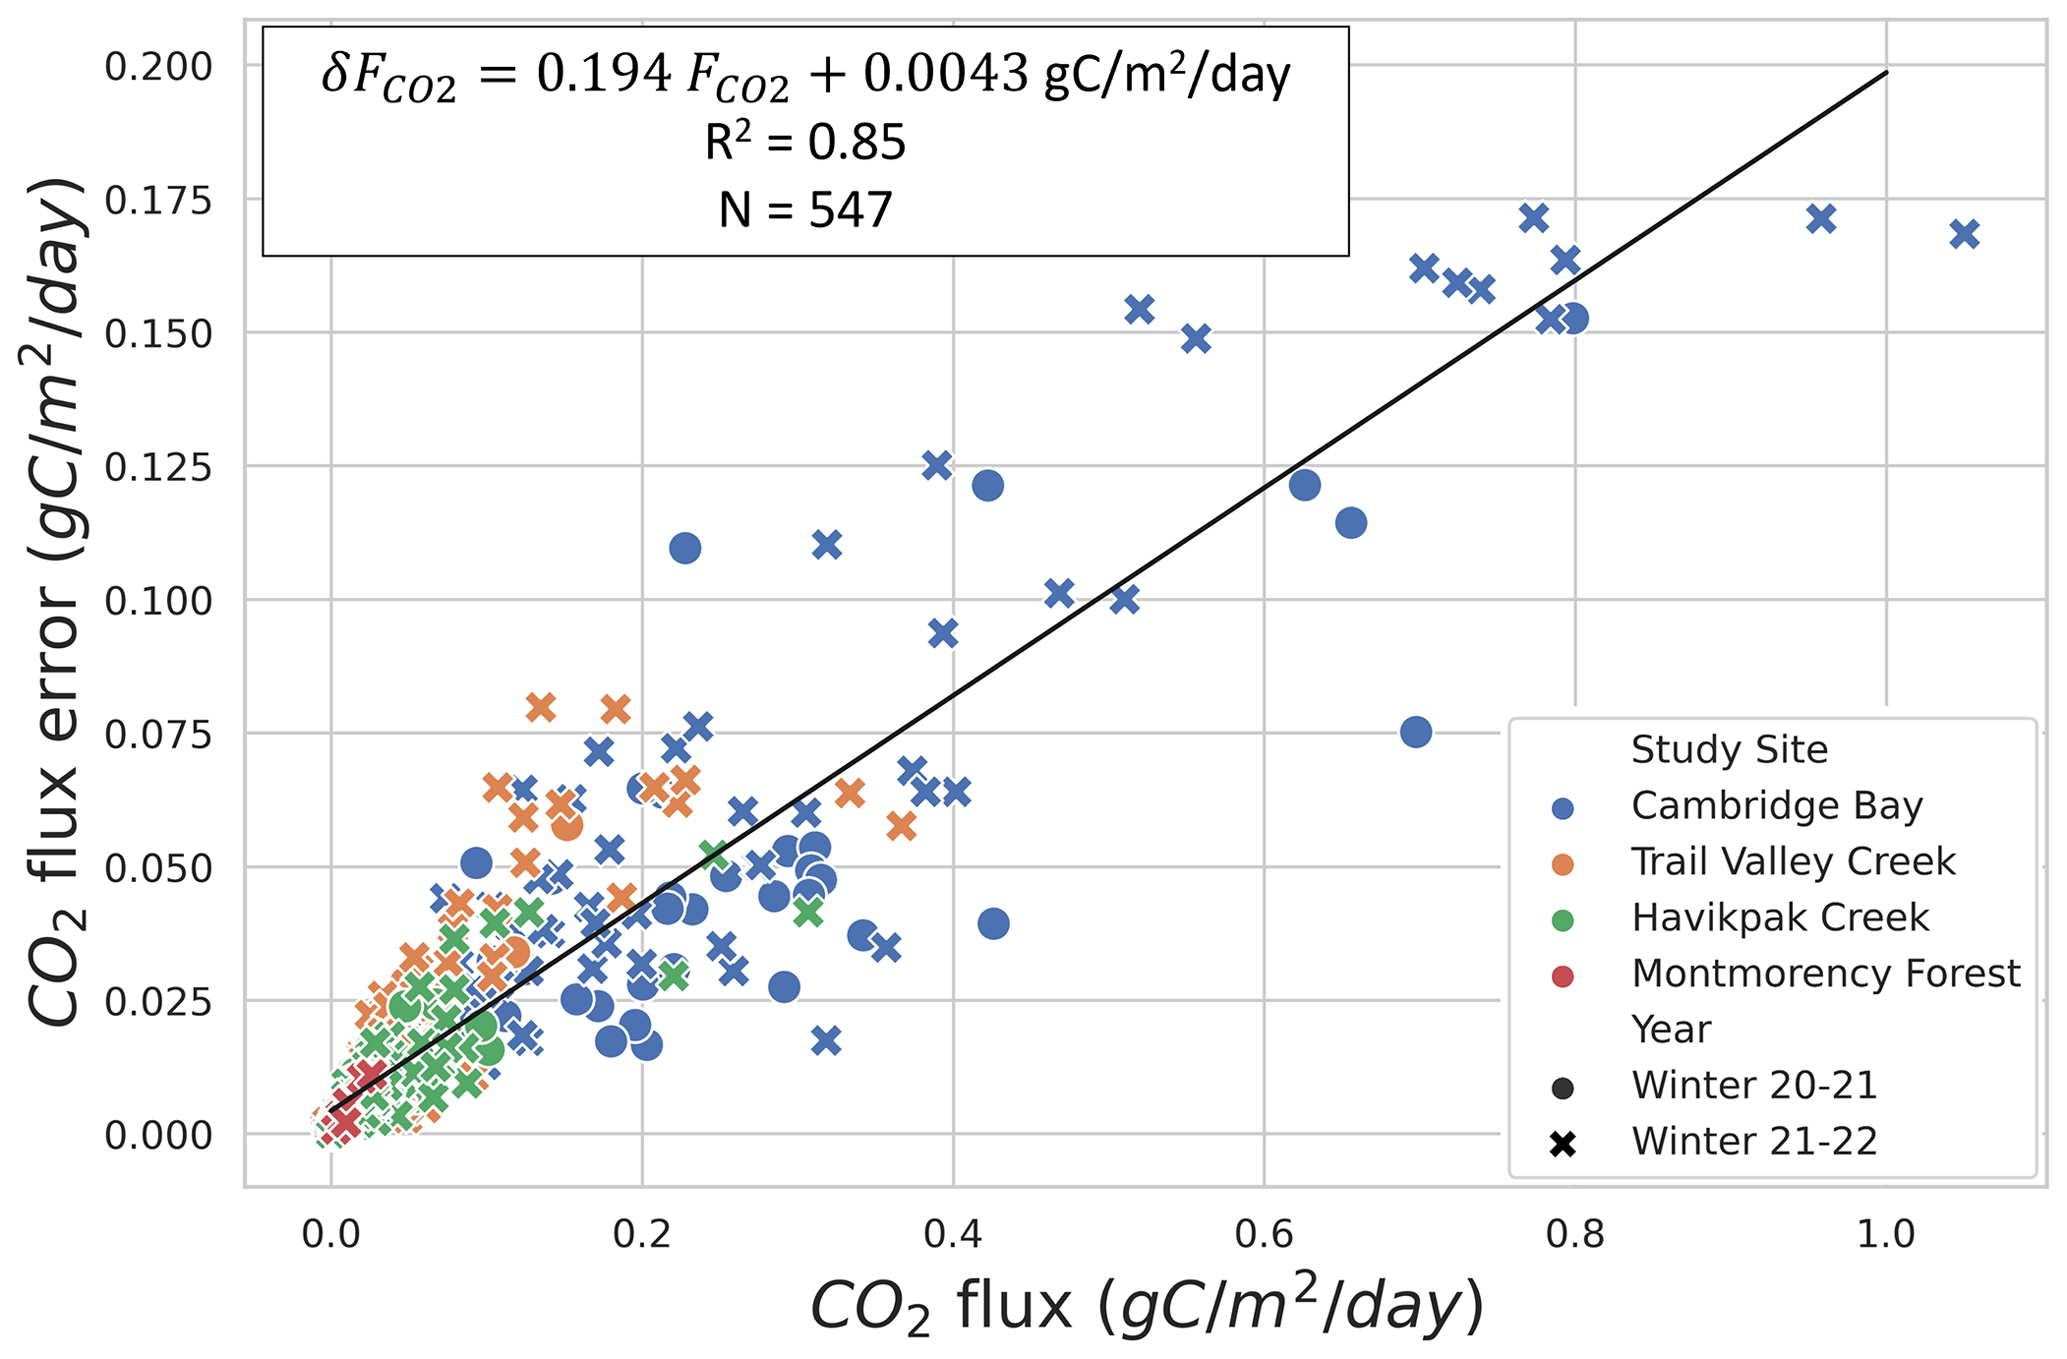
Figure 3CO2 flux () uncertainty relationship to for four study sites and two winters: 2020–2021 and 2021–2022. Specifications of the linear fit can be found in the upper left. The data dot color indicates the study site, and its symbol (i.e., circle or x-shaped) indicates the winter during which it was collected.
The overall [CO2] precision of around 1 % shows that the measurement technique is not a main source of uncertainty in estimates. Gas concentration estimations from the LI-7810 have a precision of 0.88 % at 400 ppm according to the manufacturer. The stability of the [CO2] measurement was evaluated over 169 measurements, displaying a standard deviation of 0.09 %. The LI-7810 was further tested using a 400 ppm calibration gas with a 1 % [CO2] precision (Linde Canada). A linear calibration fit equation was used to estimate [CO2] of small gas samples, using three calibration gases (200, 400, 1000 ppm) plus the theoretical zero intercept. Average uncertainty in the linear regression was 0.76 % over six calibration runs with a standard deviation of 0.15 %. The average accuracy of the reference [CO2] bottled among the gas samples from the snowpack was 1.11 %.
3.2 Spatio-temporal variability in winter CO2 fluxes associated with abiotic controls
The RF model determined Tsoil and LWC to be the two main predictors of winter CO2 fluxes. We found two temperature and LWC regimes of winter (Fig. 4). The first regime was when the soil was frozen with Tsoil<0 ∘C and LWC<0.2 m3 m−3, leading to being mainly controlled by Tsoil. The second regime was when LWC>0.2 and <0.42 m3 m−3 but with a fraction of its water in the form of ice (zero-curtain condition), causing LWC to be the main control of instead of Tsoil. While the first regime mostly corresponds to Arctic study sites, the second regime only includes one study site (MM) located in the southern boreal forest. Therefore, conclusions from the second regime should be less generalized than those from the first regime. Subsequent evaluation focused on the response of winter CO2 fluxes to Tsoil and LWC using exponential regressions in order to better understand the role of these two variables in winter CO2 fluxes.
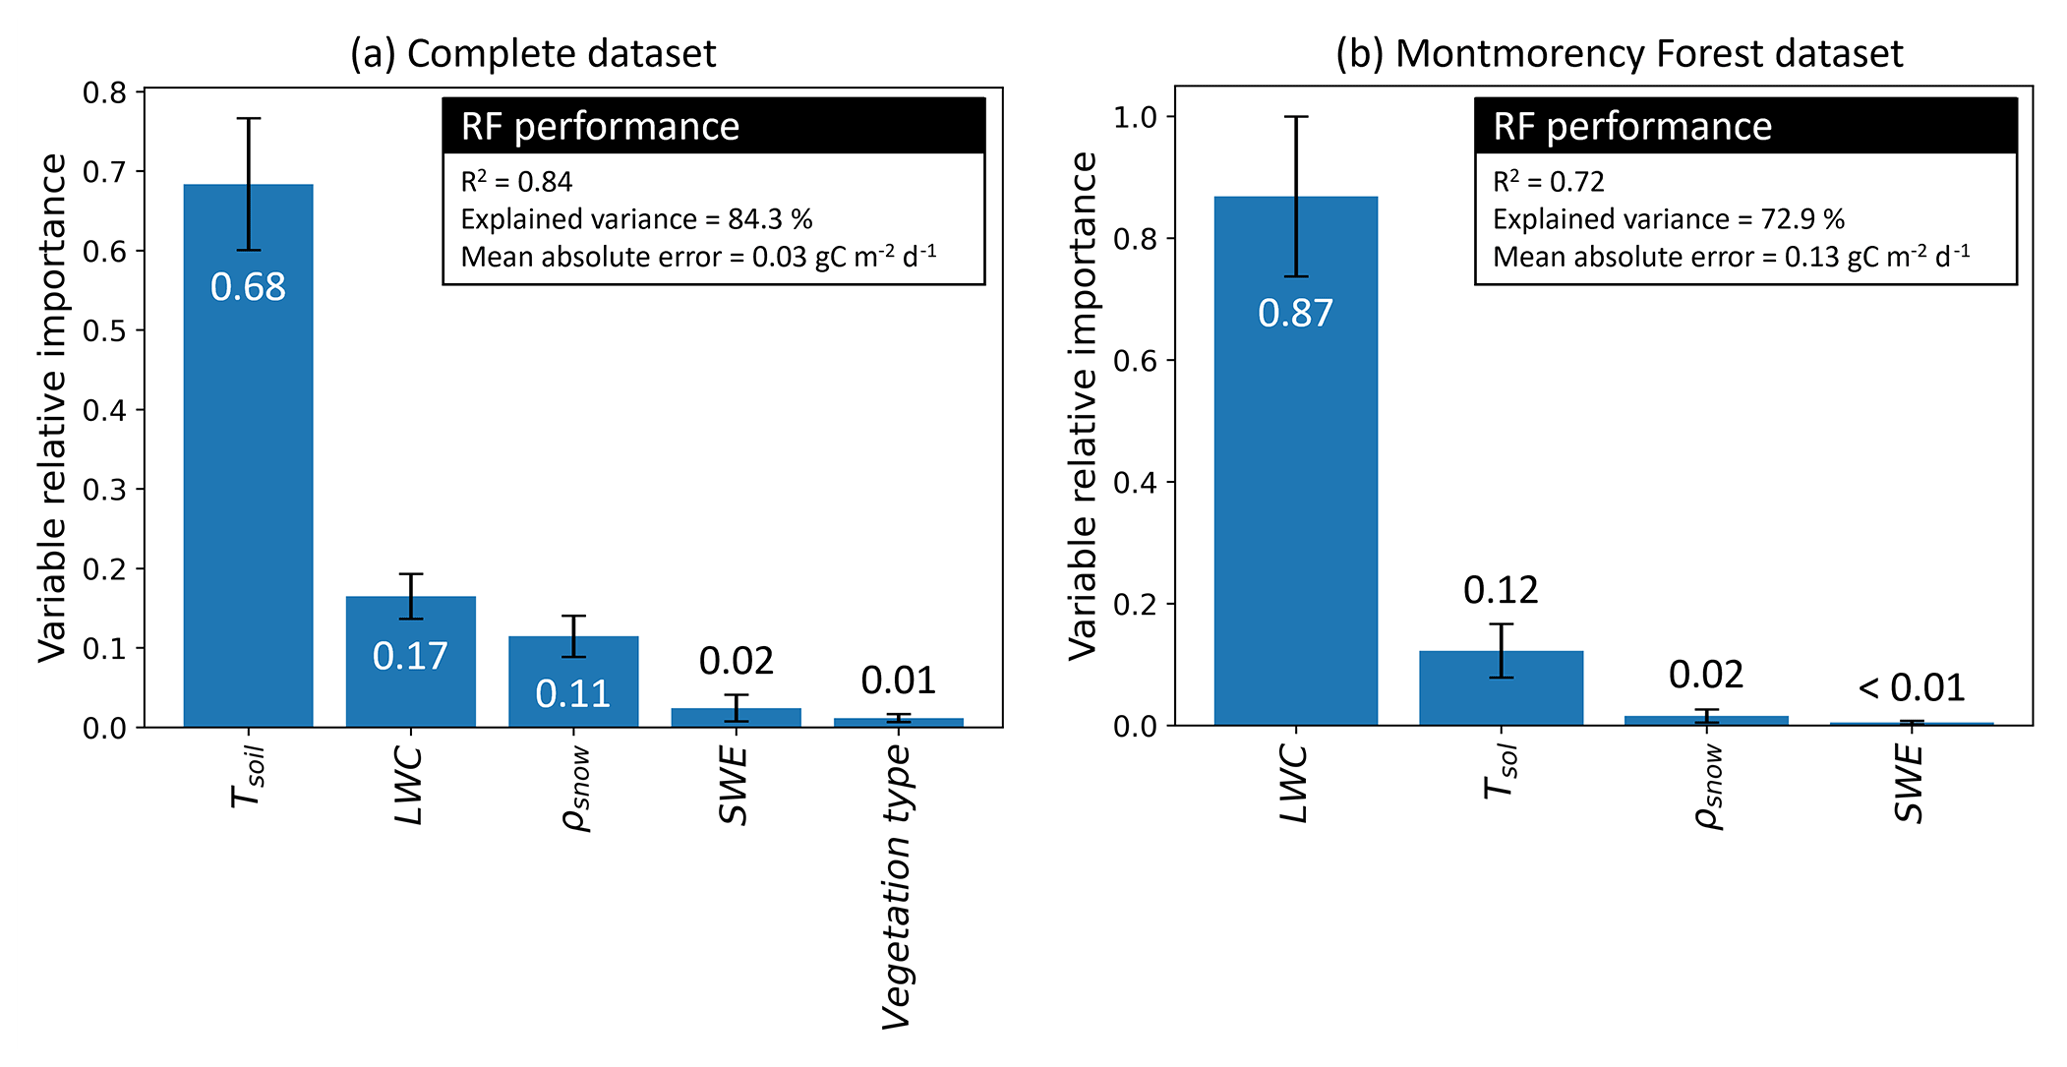
Figure 4Random forest (RF) performance and variable relative importance. Variables used are soil temperature (Tsoil), soil liquid water content (LWC), snow density (ρsnow), snow water equivalent (SWE), and vegetation type. (a) The first iteration integrated the complete dataset, and (b) the second iteration only integrated the Montmorency Forest dataset with LWC>0 m3 m−3. The values displayed by the bar plot are the mean variable relative importance over 100 permutations, while the error bars are the standard deviation.
3.2.1 Variable importance determined by the random forest model
Tsoil was the predictor with the highest relative importance (68 %) when using the complete dataset (Fig. 4a), followed by LWC (17 %). Snowpack characteristics, ρsnow (11 %) and snow water equivalent (SWE) (2 %), had a lower relative importance in the RF model. Contrary to what might be expected, the vegetation type had near-negligible relative importance (1 %) in prediction. The RF model was developed starting with all environmental variables available: Tsoil, LWC, vegetation type, SWE, snow depth, mean ρsnow, max ρsnow, φ, τ, wind slab fraction, and wind slab thickness. Although the correlation of several snow parameters did not decrease the RF model performance, snow parameters impacted the assessment of variable relative importance by splitting the relative importance between the correlated variables. Consequently, variables with lower importance and with no significant impacts on the RF performance were progressively removed. The two selected snow parameters that had significant impact were SWE and ρsnow. MM was the only site where soil LWC was present, enabling the assessment of the relative importance of this variable. When using only data from MM in the RF model (Fig. 4b), the relative importance of Tsoil (12 %) for was lower than with all combined datasets since Tsoil was near 0 ∘C for all measurements. At MM, LWC becomes the main predictor (87 %) of , while ρsnow importance drops (2 %) and SWE importance remains similar (<1 %).
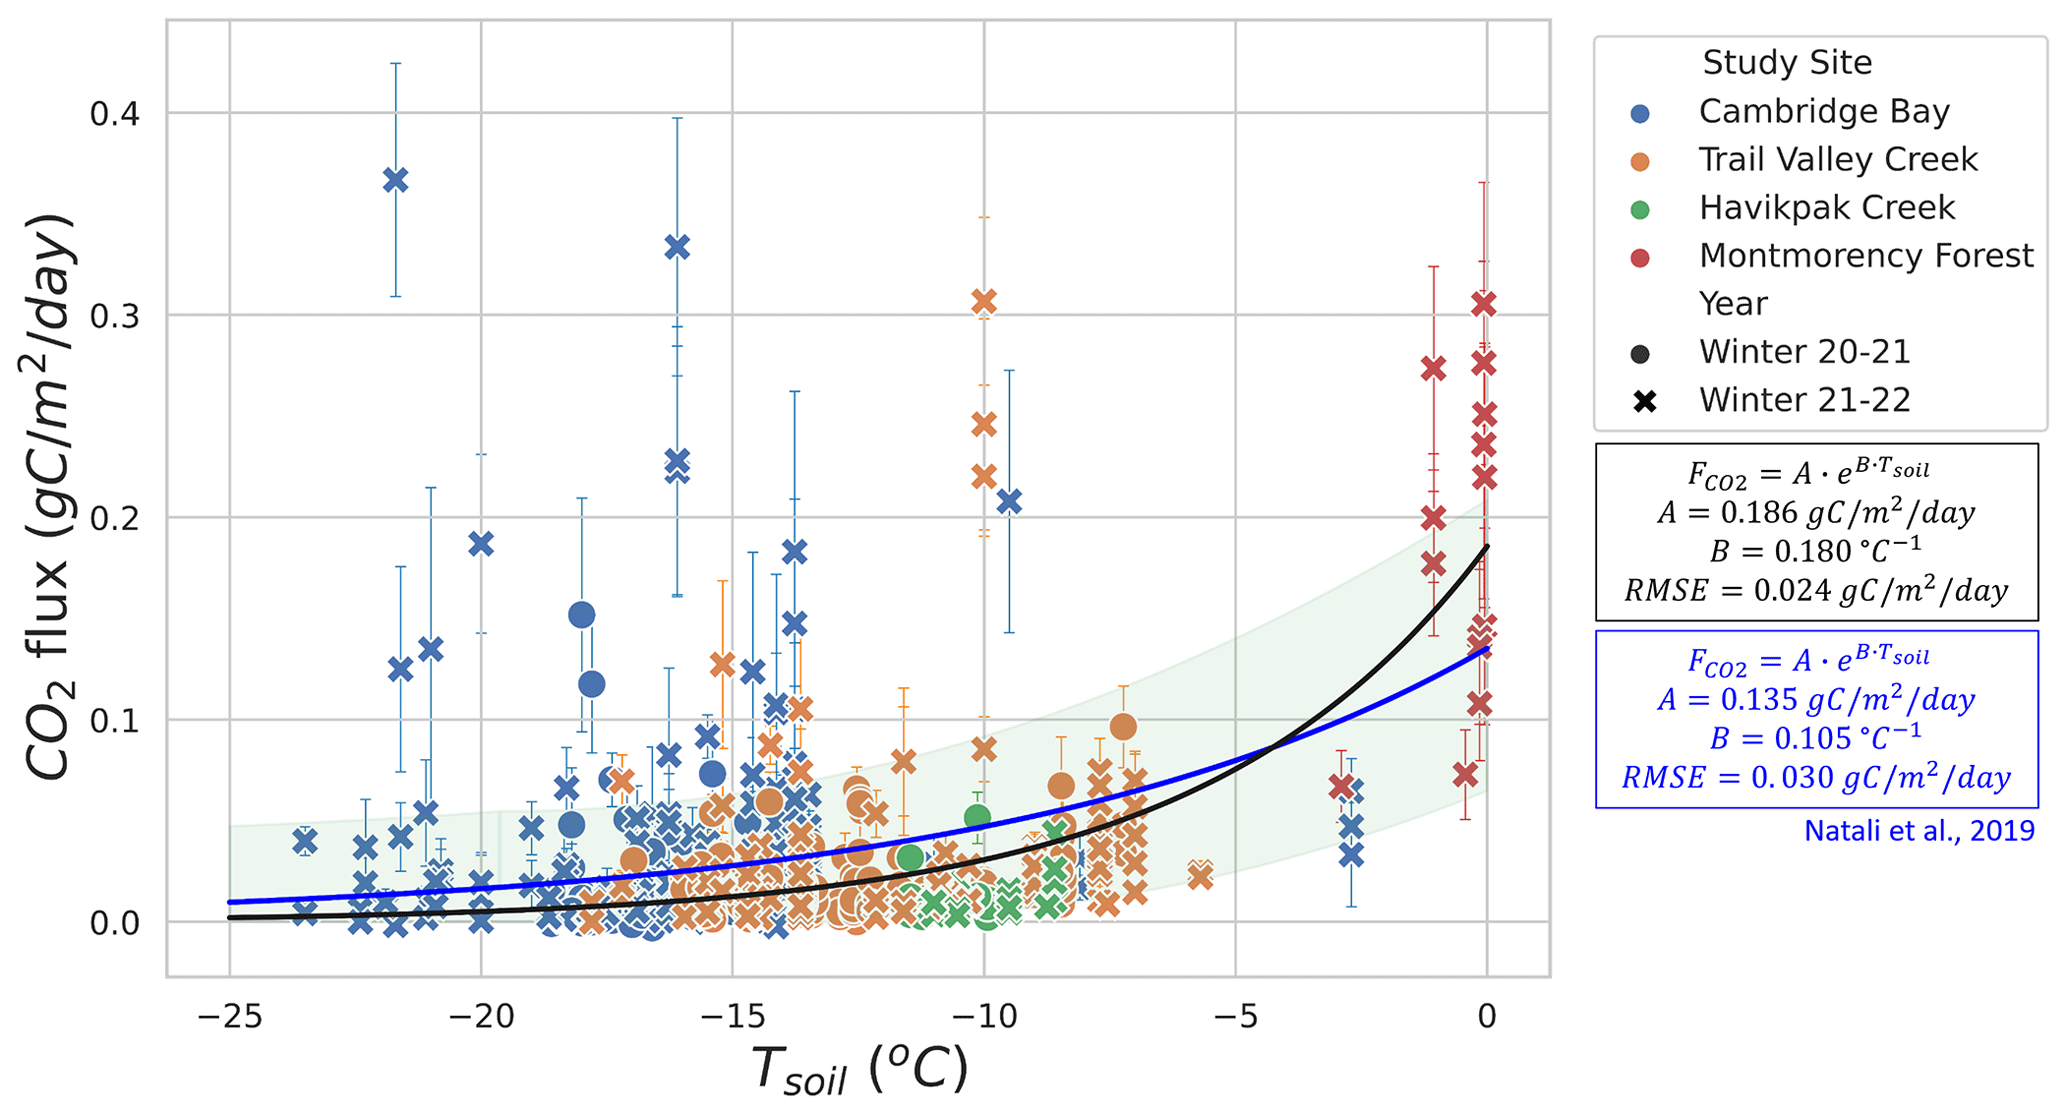
Figure 5CO2 flux () as a function of surface soil temperature (Tsoil) for Tsoil<0 ∘C. An exponential regression was fitted with the data (black line) and compared to the exponential regression by Natali et al. (2019) from an external dataset (blue line).
3.2.2 Soil temperature
Figures 5 and 6 show the relationship between winter and Tsoil. Figure 5 focuses on Tsoil<0 ∘C from CB, TVC, HPC, and MM. An exponential regression was used to evaluate the relationship between Tsoil and estimates (RMSE=0.024 ). values at MM when Tsoil<0 ∘C and LWC <0.2 m3 m−3 were included in this graph because they are more strongly correlated to Tsoil than LWC (see Sect. 3.2.3). Note that the low number of measurements with Tsoil between −6 and −0.5 ∘C restrict the capacity to evaluate the regression within this range. Using the exponential regression of Natali et al. (2019), we obtained an RMSE of 0.030 . The regression of Natali et al. (2019) generally shows an overestimation of fluxes for ∘C but an underestimation for Tsoil>5 ∘C when compared to our exponential regression. The systematic bias between our dataset and the regression of Natali et al. (2019) is minimal (mean bias = −0.0025 ). We also observed the isolated occurrence of comparably large winter of up to 0.36 at temperatures below −10 ∘C (Fig. 5). These measurements of high at low temperature seem to be genuine since the repeatability was verified over the three sampling profiles performed at each site. Nevertheless, we were not able to explain these strong fluxes and no environmental variables measured in our study could be linked to those occurrences. It has been suggested that gas bursts during autumn freeze-up in permafrost environments might be due to gas compression by ice formation and ground cracking (Pirk et al., 2015). This hypothesis can be considered to explain the high observed in this study, although the high observed occurred at a near-surface Tsoil between −25 and −10 ∘C, so the freeze-up would have to occur at lower depths in the soil. Figure 6 displays the higher winter from MM where Tair values are higher and the important snowpack insulation keeps the soil at temperatures of around 0 ∘C through the entire winter. increases more rapidly with Tsoil around freezing point than at Tsoil<5 ∘C, which is shown by the higher temperature-dependency parameter (B=2.82 ) of the MM site exponential regression (RMSE=0.286 ) compared to the exponential regression of Fig. 5 (B=0.18 ). This discrepancy in temperature dependency creates a discontinuity between the measurements at Tsoil<5 ∘C and Tsoil≈0 ∘C that did not allow for a continuous temperature-dependency regression across all the study sites. The lower RMSE of the exponential regression of Fig. 5 (RMSE=0.024 ; 70.3 % of mean ) compared to the exponential regression of the MM site (RMSE=0.286 ; 112.4 % of mean ) might be due to the impact of soil LWC at the MM site (see Sect. 3.2.3).
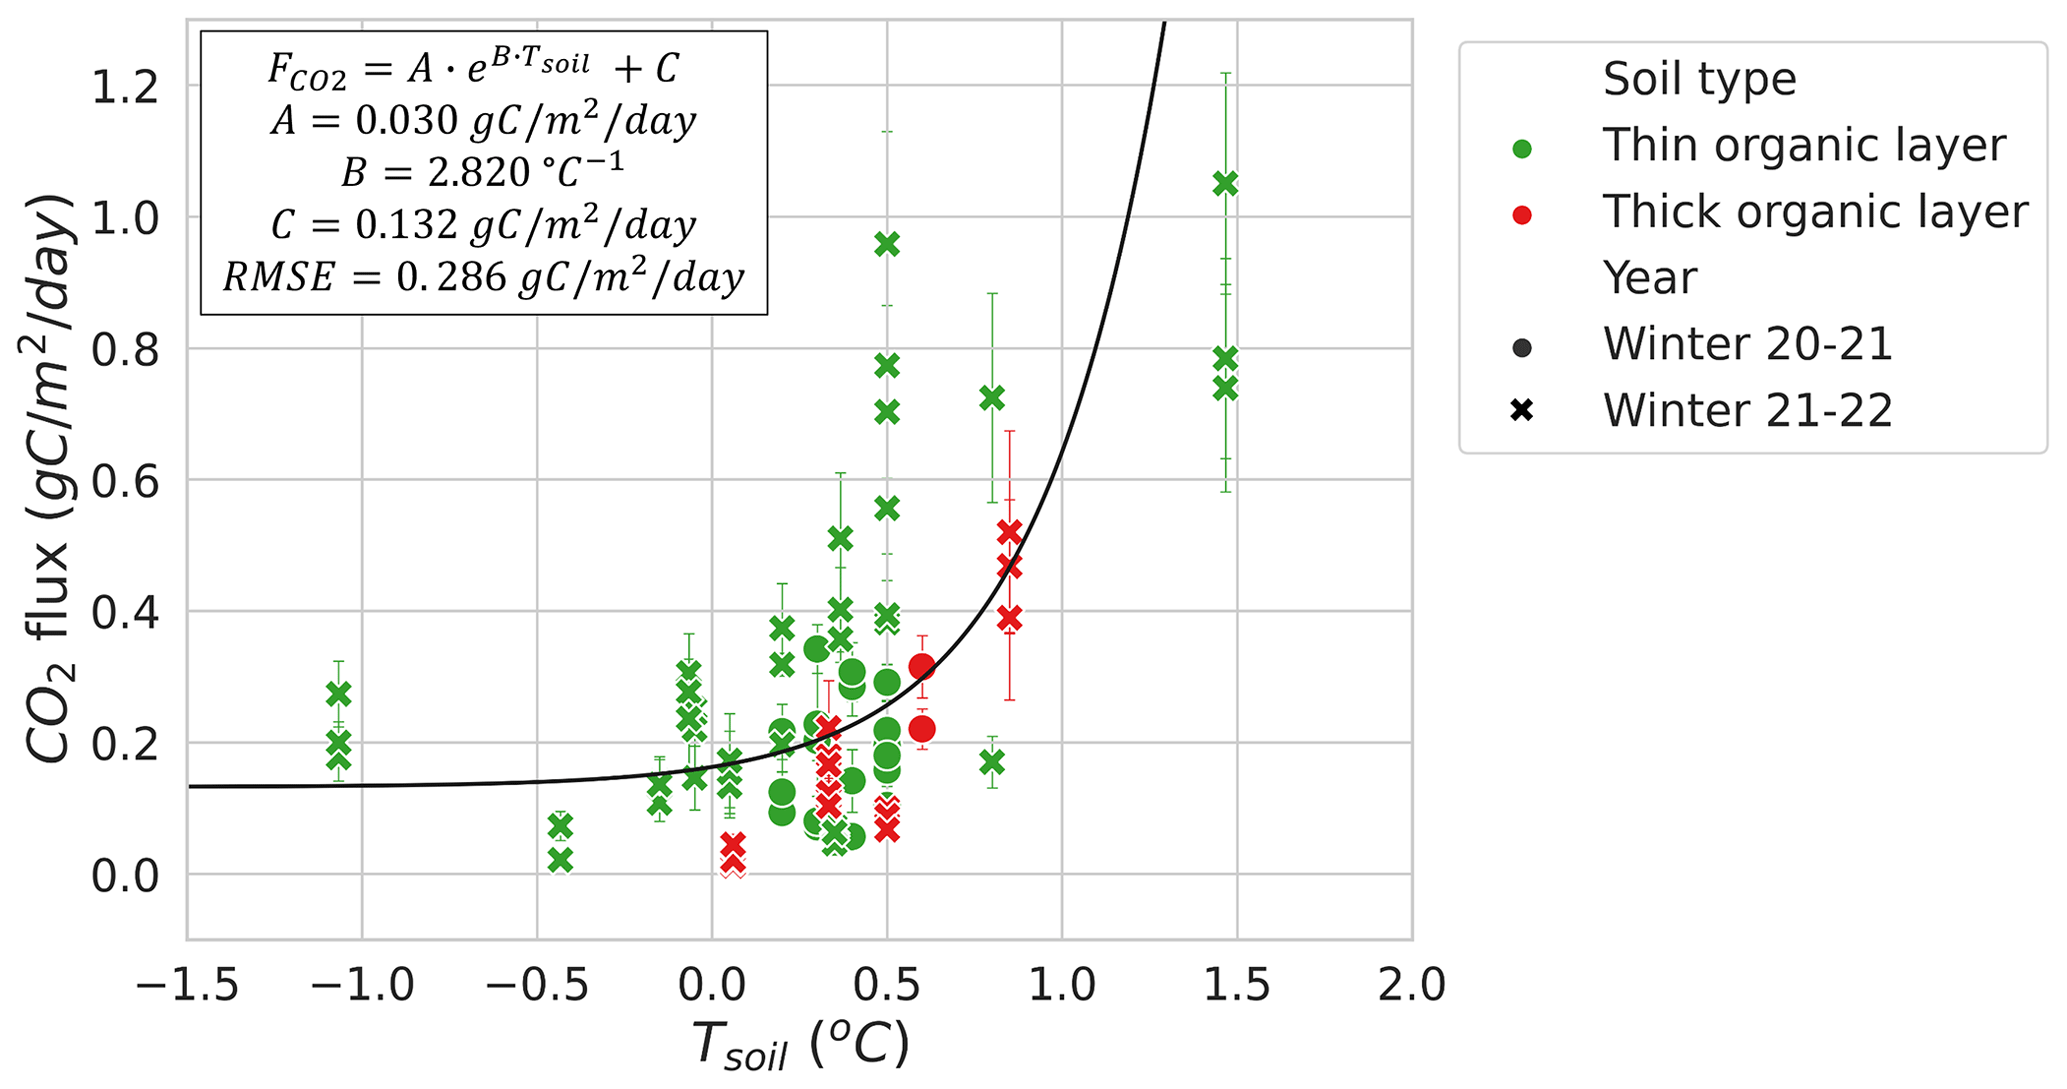
Figure 6CO2 flux () as a function of soil temperature (Tsoil) at the Montmorency Forest study sites where soil liquid water content (LWC) was greater than 0 m3 m−3 throughout winter. An exponential regression was fitted to the data (black line).
3.2.3 Soil liquid water content
The relationship between LWC and during winter at MM (RMSE=0.137 ; 49.1 % of mean ) was stronger than between Tsoil and (RMSE=0.286 ; 112.4 % of mean ), when excluding the sampling location that contained a thick organic soil layer with very high soil moisture due to its location near the bottom of a microtopographic depression (Fig. 7). Other MM sampling locations with a thin organic layer shared a similar soil composition dominated by mineral soils. The strong correlation between LWC and was mostly observed at LWC>0.2 and <0.42 m3 m−3. The plateau observed in Fig. 7 indicates that Tsoil might be a better predictor than LWC at LWC<0.2 m3 m−3.
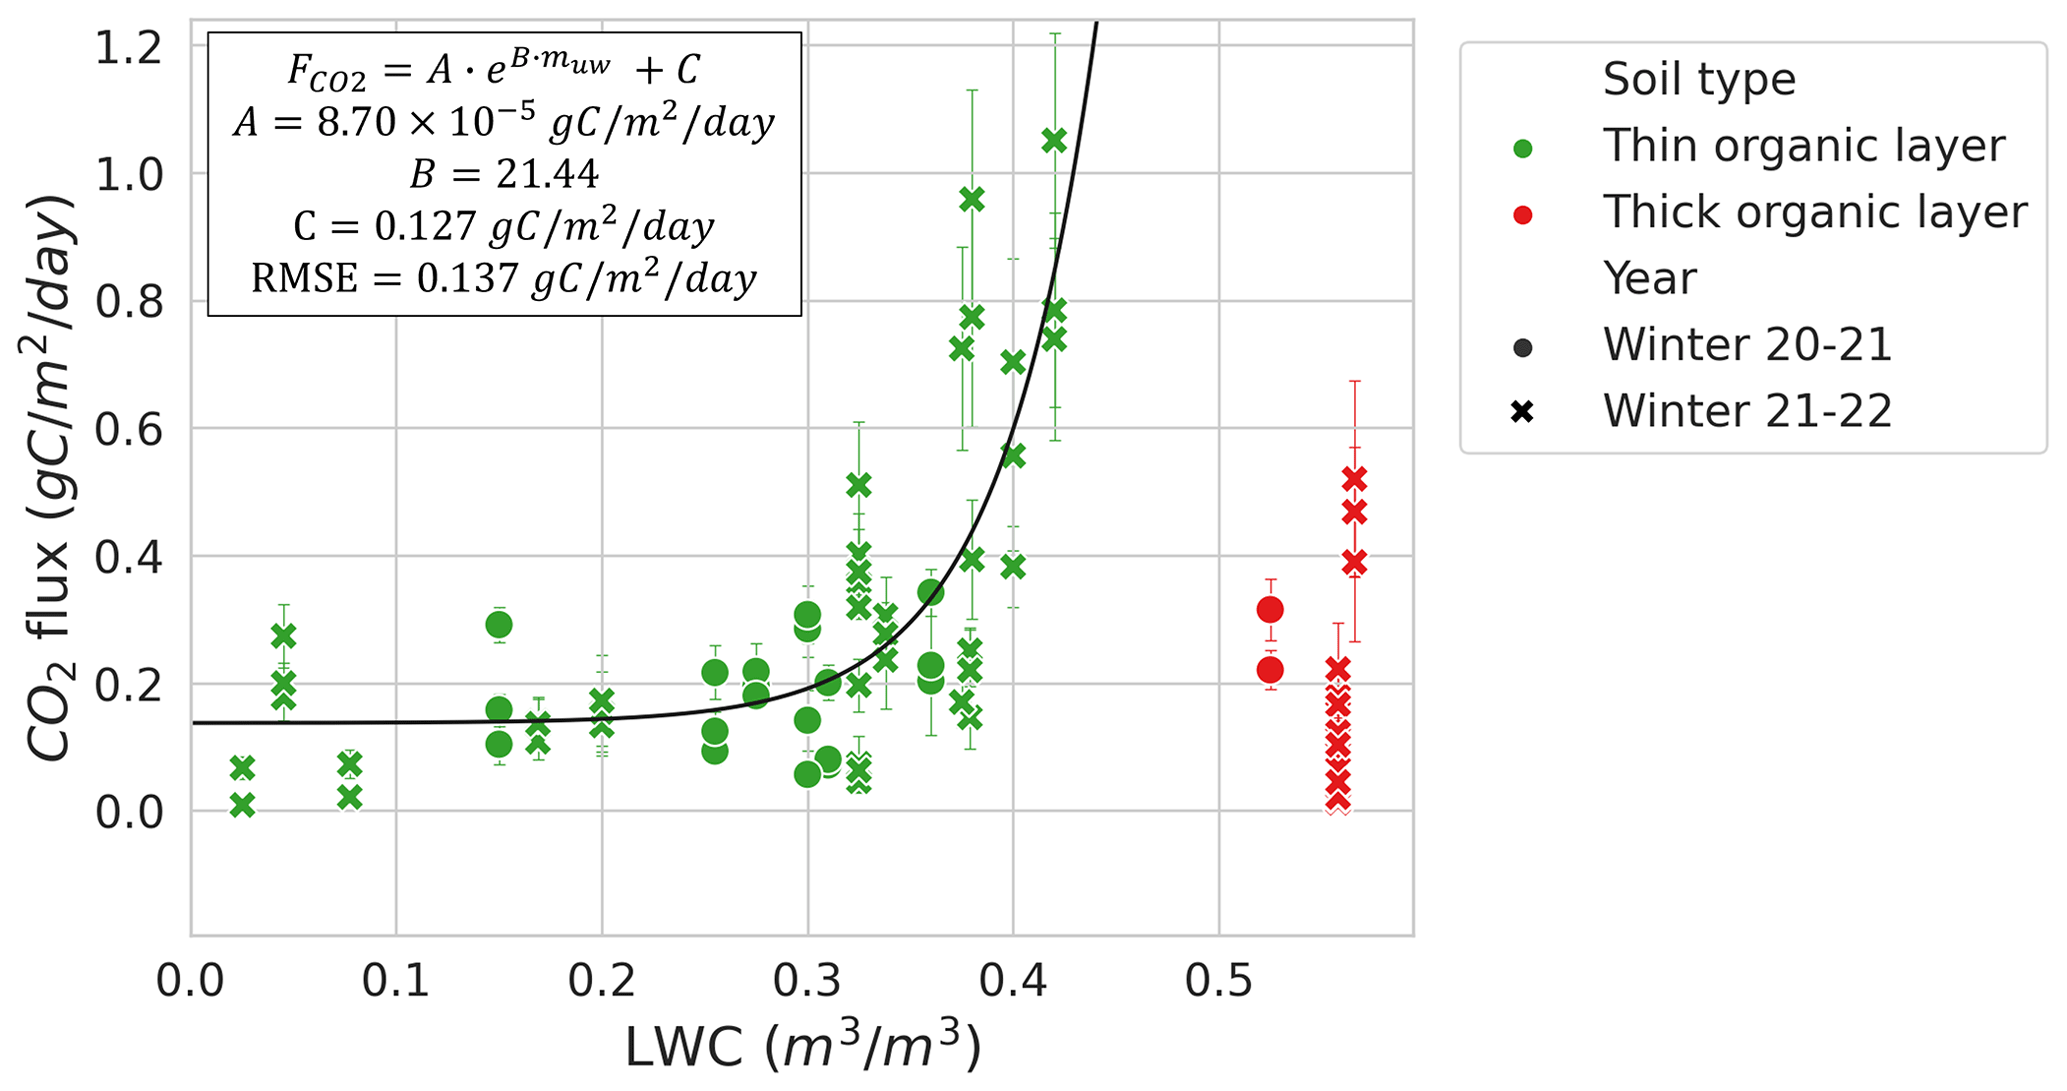
Figure 7CO2 flux () as a function of soil volumetric liquid water content (LWC) at the Montmorency Forest study site. An exponential regression was fitted to the data (black line), excluding the thick-organic-layer site (red markers).
3.2.4 Vegetation types
Figure 8 shows winter across the four study sites for different vegetation types. Since CB vegetation is mostly prostrate-shrub tundra, CB ecosystems were regrouped by water availability. On average, higher winter values at CB were observed in environments experiencing wetter conditions during the growing season. At TVC, several vegetation and land cover types are present. values from MM were higher than for the other sites. Higher can be explained by warmer mean annual average temperature, a deeper snowpack, and winter Tsoil around 0 ∘C (see Sect. 3.4).
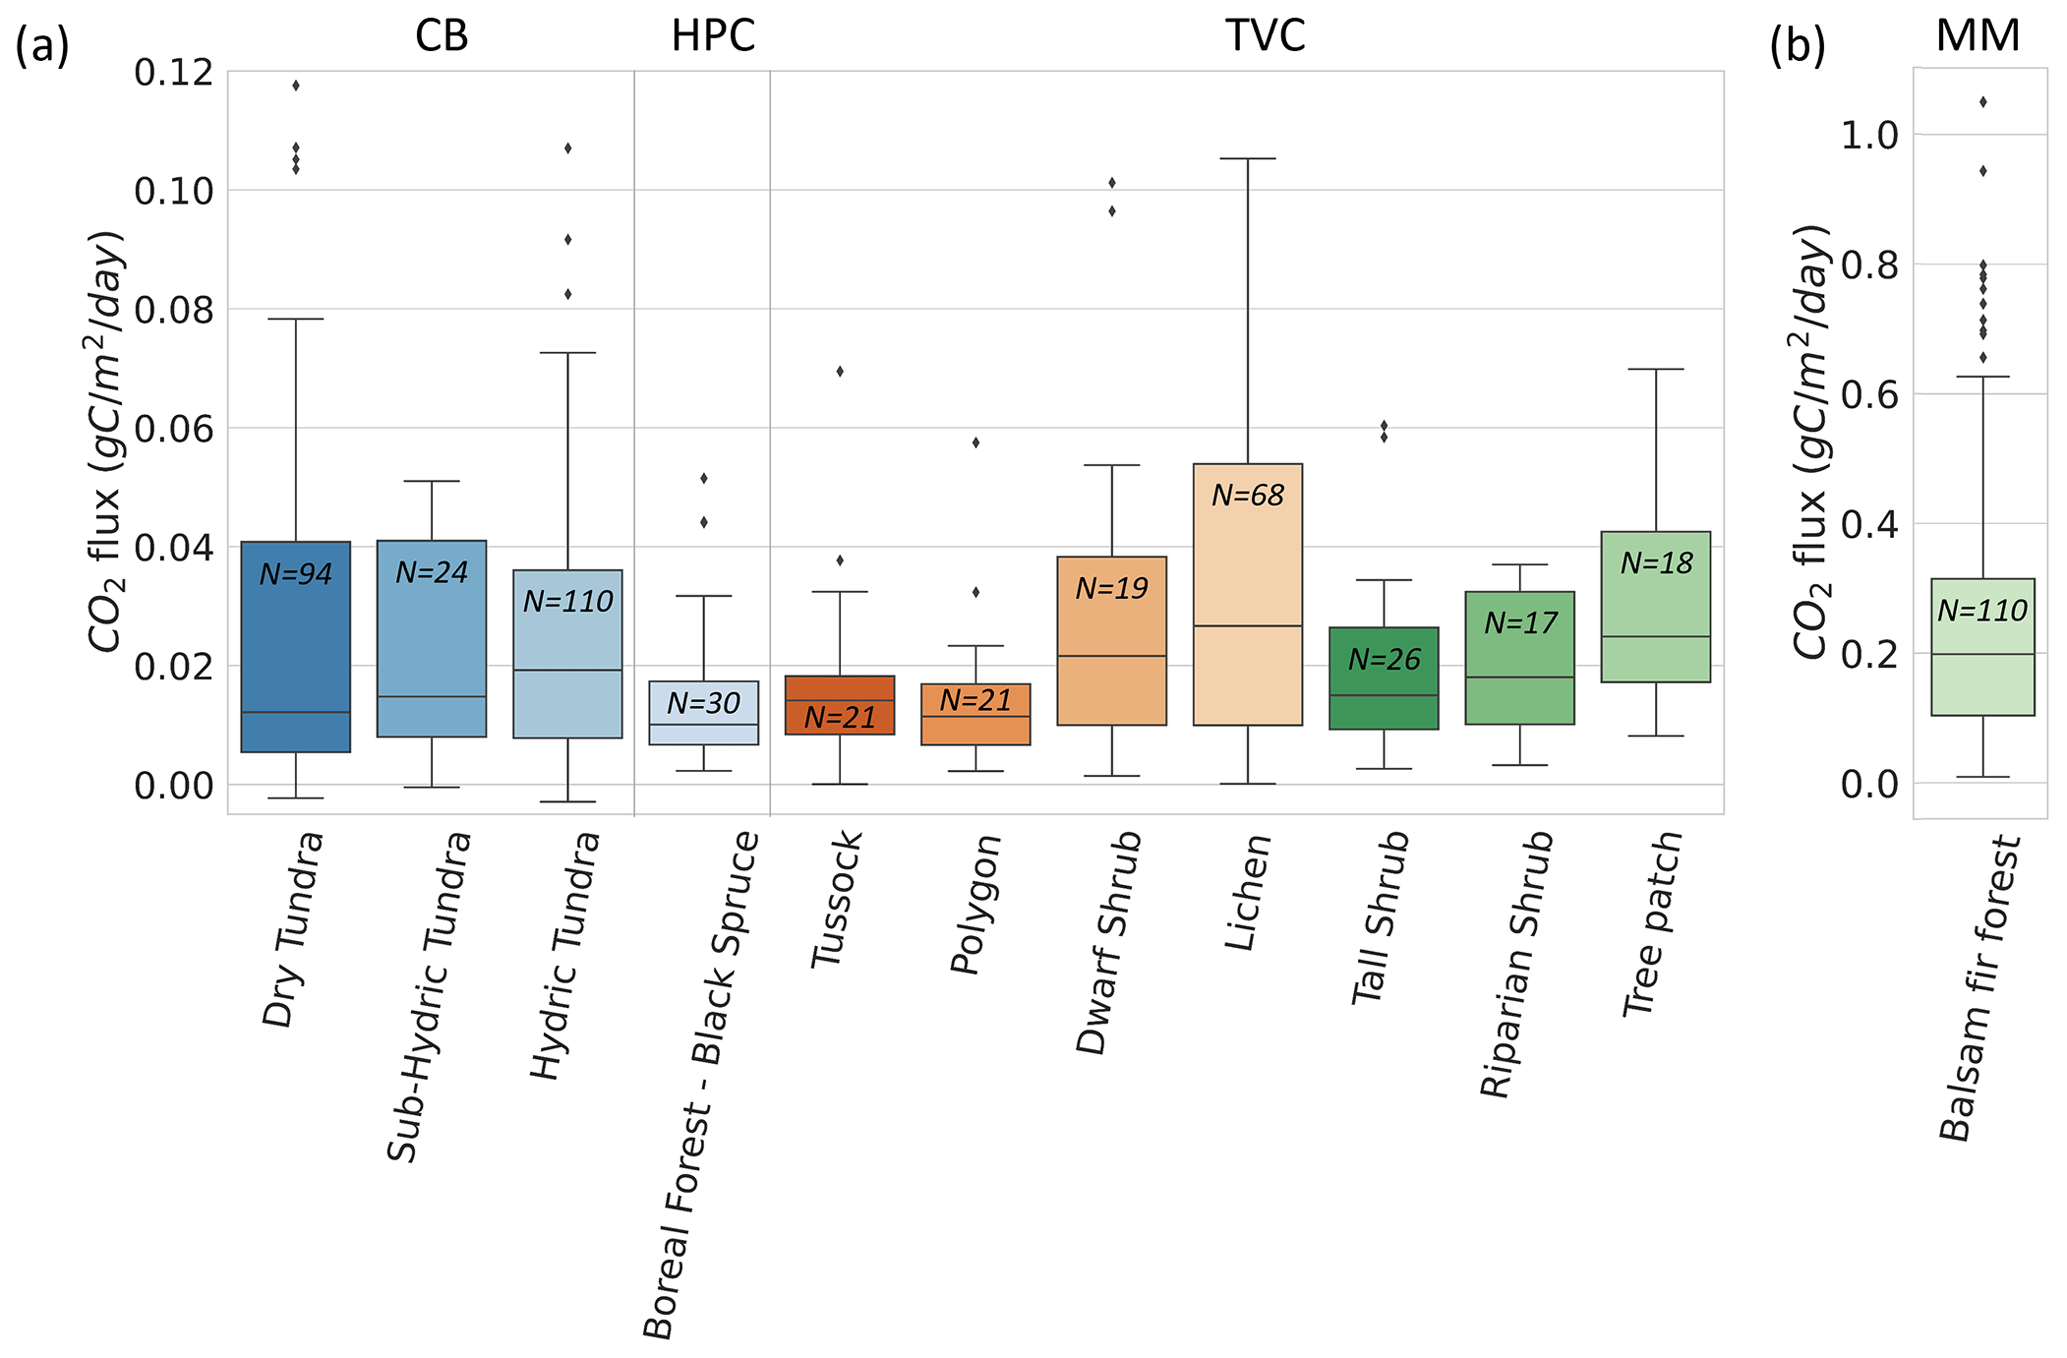
Figure 8Boxplot of CO2 flux () across 12 vegetation types and 4 sites. values from Montmorency Forest (MM) are on a separate scale because they are much higher than the colder environments (b). Cambridge Bay (CB) sites are ordered by increasing water availability, and Trail Valley Creek (TVC) sites are ordered by increasing mean soil surface temperature in March 2021 and 2022 (a). Havikpak Creek (HPC) and MM were composed of a single vegetation type (a). Outliers were defined as IQR, where Q3 is the third quartile and IQR the interquartile range. Outliers are out of the y-axis range for the dry tundra (four), sub-hydric tundra (four), hydric tundra (four) and lichen (three). The outliers can be found in Fig. 5.
Vegetation type was not identified as a strong predictor of by the RF model. Nonetheless, we observed differences in the mean and range of for the various vegetation types probed in this study. This might be due to the strong correlation between vegetation type and soil temperature (Fig. A5), as well as relationships between vegetation and soil type, including soil organic matter content and soil pore size. The RF algorithm showed vegetation type relative importance increased to 42 % when Tsoil was removed from the environmental variables, although the removal of Tsoil decreased RF performance substantially (R2=0.40). Therefore, vegetation could be used as a proxy variable for Tsoil if the latter is not available to predict , but with poorer results.
4.1 Controls of winter CO2 fluxes
The RF model predictors' relative importance showed that during winter, Tsoil emerged as the dominant predictor of when the soil was frozen. Nevertheless, in the closed-crown boreal forest site (i.e., MM) where zero-curtain conditions persisted throughout winter, soil LWC took precedence as the dominant predictor as there was minimal variation in Tsoil under these conditions. Our results confirm the strong winter dependency on Tsoil shown by Natali et al. (2019), although we observed fluxes lower than reported by Natali et al. (2019) at ∘C and mostly higher fluxes at ∘C. Considering the two regressions of the relationship between Tsoil and have large uncertainties attached to them, the difference between them falls inside the uncertainty margin (Fig. 5). It should be noted that the Natali et al. (2019) regression was obtained using estimates from several methods including eddy covariance, chamber methods, and snowpack diffusion measurements, whereas our study exclusively uses the latter. Several studies have shown bias between the different measurement methods; eddy covariance and soil chamber methods displayed positive biases when compared to snowpack diffusion measurements (McDowell et al., 2000; Björkman et al., 2010; Webb et al., 2016), while the snow chamber displayed negative biases when compared to the snowpack diffusion measurements (McDowell et al., 2000). It should be remembered that the Tsoil used in the latter study refers to near-surface temperature; Tsoil at greater depths may vary and affect the correlation with .
4.2 Zero-curtain conditions
Soil LWC was observed only at the MM site, where Tsoil was around 0 ∘C throughout winter. In zero-curtain conditions, LWC was shown to become the dominant control of winter , while Tsoil importance diminished. It should be noted that it would be ill-advised to generalize the relationship between soil LWC and as it is only based on data from one study site, and it cannot be ruled out that this relationship is site-specific depending on soil and vegetation composition. Nevertheless, our study highlighted the important impact of LWC on around the soil freezing point when there is a mixed state of ice and free water in soils. When the soil is under zero-curtain conditions, the latent heat governs the ice and liquid water ratio in the soil (Devoie et al., 2022). Hence, LWC and ice fractions can be used as a freezing–thawing indicator during the zero-curtain period and help better quantify the fluxes in boreal forest environments where zero-curtain conditions prevail (Prince et al., 2019). This result is particularly important in ABRs since the duration and frequency of zero-curtain periods are expected to increase in a warming climate (Yi et al., 2015, 2019; Tao et al., 2021). Further research on winter in zero-curtain conditions should investigate different sites to assess if the relationship between and soil LWC is site-specific or dependent on soil properties. It should be noted that one of the measurement locations at MM displayed low despite its LWC being the highest of all sites. The soil composition of this site consisted of a thick (>30 cm) soil organic top layer, whereas all other measurements were done at sites with thinner (3–10 cm) organic layers on top of mineral soil. It is well known that anaerobic conditions created by high soil moisture (at least >50 %) constrain soil CO2 respiration rates during the growing season because many microorganisms require oxygen for organic matter decomposition, which they lack if soil pores are filled with water (Linn and Doran, 1984; Davidson and Janssens, 2006).
4.3 Snowpack importance
Our study shows that abiotic variables related to Tsoil, LWC, and physical snowpack properties explain the majority of variance in winter CO2 fluxes. It should be noted that we did not incorporate variables related to temporal dynamics such as the previous days' soil temperature and LWC, which have been shown by Harel et al. (2023) to be of importance during the growing season. However, winter soil variables are not expected to be as dynamic as during the growing season because of the snowpack insulating properties. The RF model showed that SWE and mean snow density were the snow characteristics that provided the greatest improvement of the RF model, although to a lesser degree than Tsoil and LWC. The importance of snow characteristics in is linked with the strong correlation to Tsoil (Domine et al., 2016b; Pedron et al., 2023), although a snapshot of snow conditions provides limited abilities to infer Tsoil, as shown in Slater et al. (2017). Snow properties' temporal information is required to predict the impact of snow insulation on Tsoil, with the most important period being in the autumn freeze-up when air temperature decreases below the freezing point. Snow characteristics are closely linked to topography (Meloche et al., 2021) and thus soil wetness and soil carbon content (Gouttevin et al., 2012). Regarding the snowpack diffusion gradient method, the snowpack is used to estimate winter CO2 fluxes. An average snow density was used to estimate snow porosity and tortuosity used in CO2 flux calculations (Eq. 1), which does not consider the vertical stratification of the snowpack. However, the diffusion gradient remained linear despite vertical stratification in snow density (e.g., Fig. A3 where the average ratio between the standard deviation and mean of is around 10 %), which points toward a minimal impact of this assumption on our results.
4.4 Soil biogeochemistry
The unexplained variance (16 %) suggests that winter CO2 fluxes might have been controlled by other environmental variables such as soil physical–chemical properties regulating soil biogeochemistry and soil redox conditions, which were neither addressed nor measured in this study. CO2 production is governed by the availability and quality of labile C compounds regulating the decomposition of soil organic matter (Michaelson and Ping, 2005; Wang et al., 2011) and by the activity and composition of the soil microbial community (Monson et al., 2006). Soil type and structure, for example the thickness of the organic layer, soil pore size distribution, and soil pH, may be further strong controls on CO2 production (Steponavičienė et al., 2022; Yli-Halla et al., 2022). All these variables vary widely across the heterogeneous tundra terrain (Virtanen and Ek, 2014), where small-scale moisture, vegetation, and soil conditions occur among hummock and inter-hummock depressions (Wilcox et al., 2019). Further analysis is required to understand the role of physical–chemical soil properties in during winter.
4.5 Relevance for terrestrial biosphere models
Large uncertainties remain in terrestrial biosphere models used to estimate CO2 fluxes in ABRs (Fisher et al., 2014; Tei and Sugimoto, 2020; Birch et al., 2021; Virkkala et al., 2021), especially regarding the respiratory release of CO2 via soil respiration (the sum of heterotrophic respiration and belowground autotrophic respiration) during winter (Natali et al., 2019). The limited number of observational data available has restricted model improvements, testing, and evaluation (Virkkala et al., 2022). Modeling the ABR carbon cycle is critical for climate projections since a warmer climate should lead to higher Tsoil, thus increasing ABR winter (Mellander et al., 2007; Throop et al., 2012; Wieder et al., 2019). Several terrestrial biosphere models are currently in use (Fisher et al., 2022), such as CLM (Community Land Model; Lawrence et al., 2019) and CLASSIC (Canadian Land Surface Scheme Including Biogeochemical Cycles; Melton et al., 2020; Seiler et al., 2021). The relationships to Tsoil and LWC observed in this study could be used to inform terrestrial biosphere models through the parametrization of winter soil respiration sensitivity to soil temperature (e.g., Q10 temperature coefficient) and LWC in zero-curtain conditions. Our study shows that permanent installation of the snow gradient method (Seok et al., 2009; Zhu et al., 2014; Graham and Risk, 2018) would be suitable for gathering the temporal non-growing-season CO2 fluxes in ABRs required to fully test terrestrial biosphere models.
Our study showed that Tsoil is the main control of winter at Tsoil<0 ∘C in ABRs. The relative importance analysis of our RF model showed that Tsoil was the main predictor of , followed by LWC. However, we found that at our site maintaining zero-curtain conditions throughout winter, LWC becomes the main control of winter . We observed non-negligible winter that may partially offset growing-season CO2 uptake in ABRs. Consequently, winter must be properly estimated in terrestrial biosphere models and climate models. Additionally, future research should focus on linking the effects of abiotic variables on during winter, as we determined here, with soil biogeochemistry, microbial functioning, and vegetation.
Table A1Uncertainty sources in and their uncertainty. [CO2] precision was evaluated at a concentration of 400 ppm.
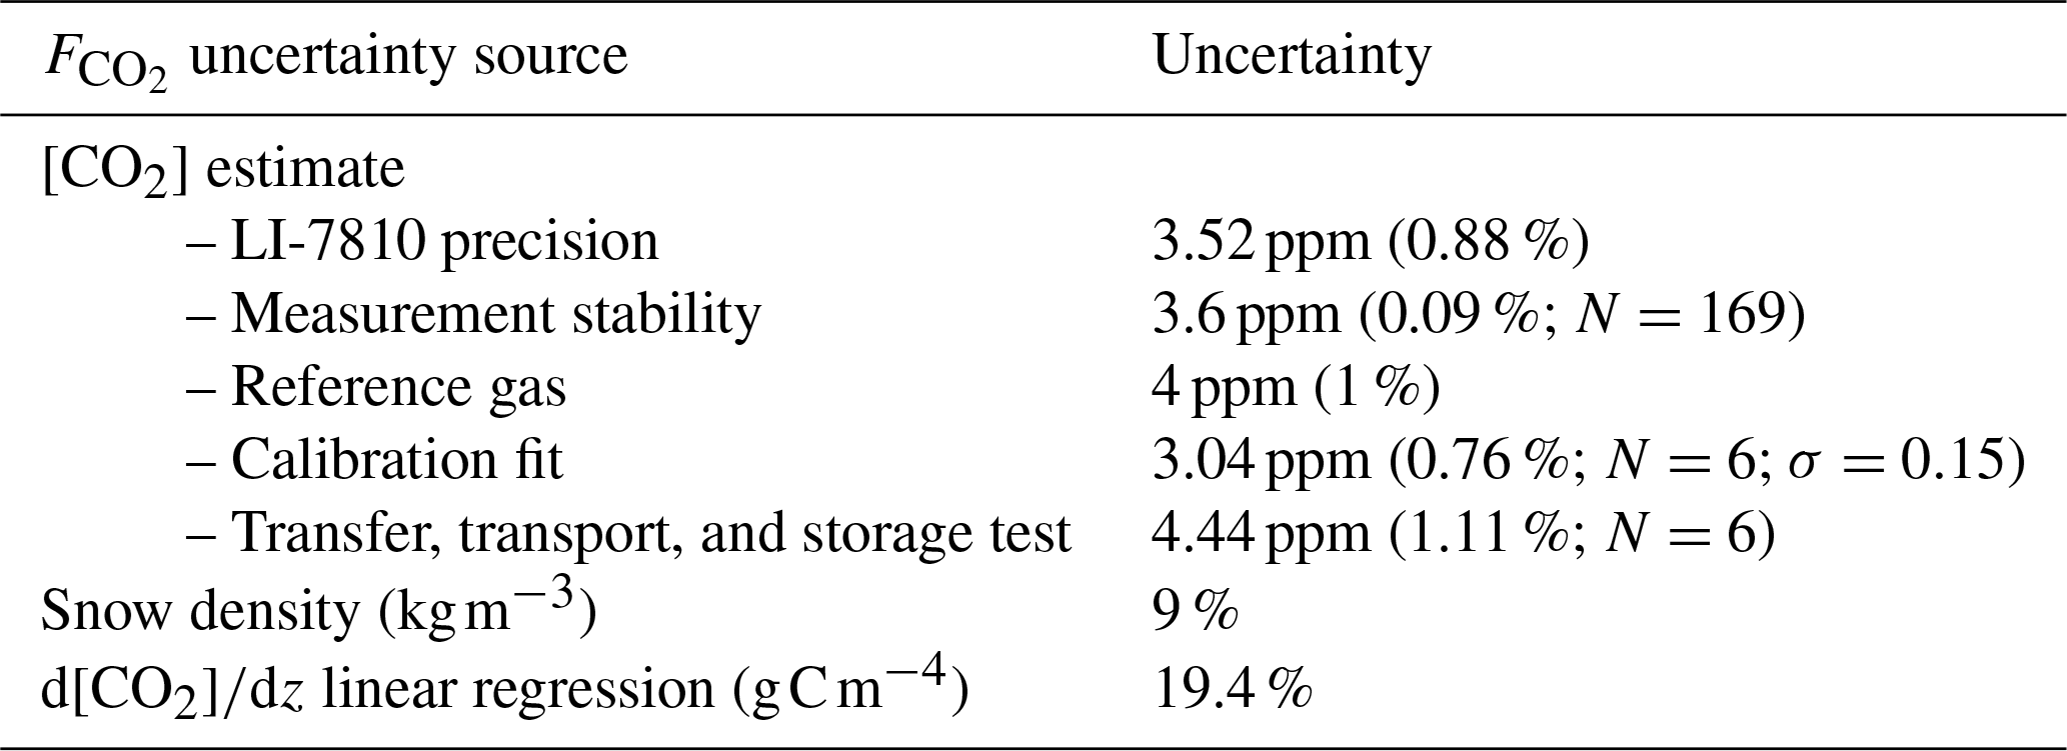
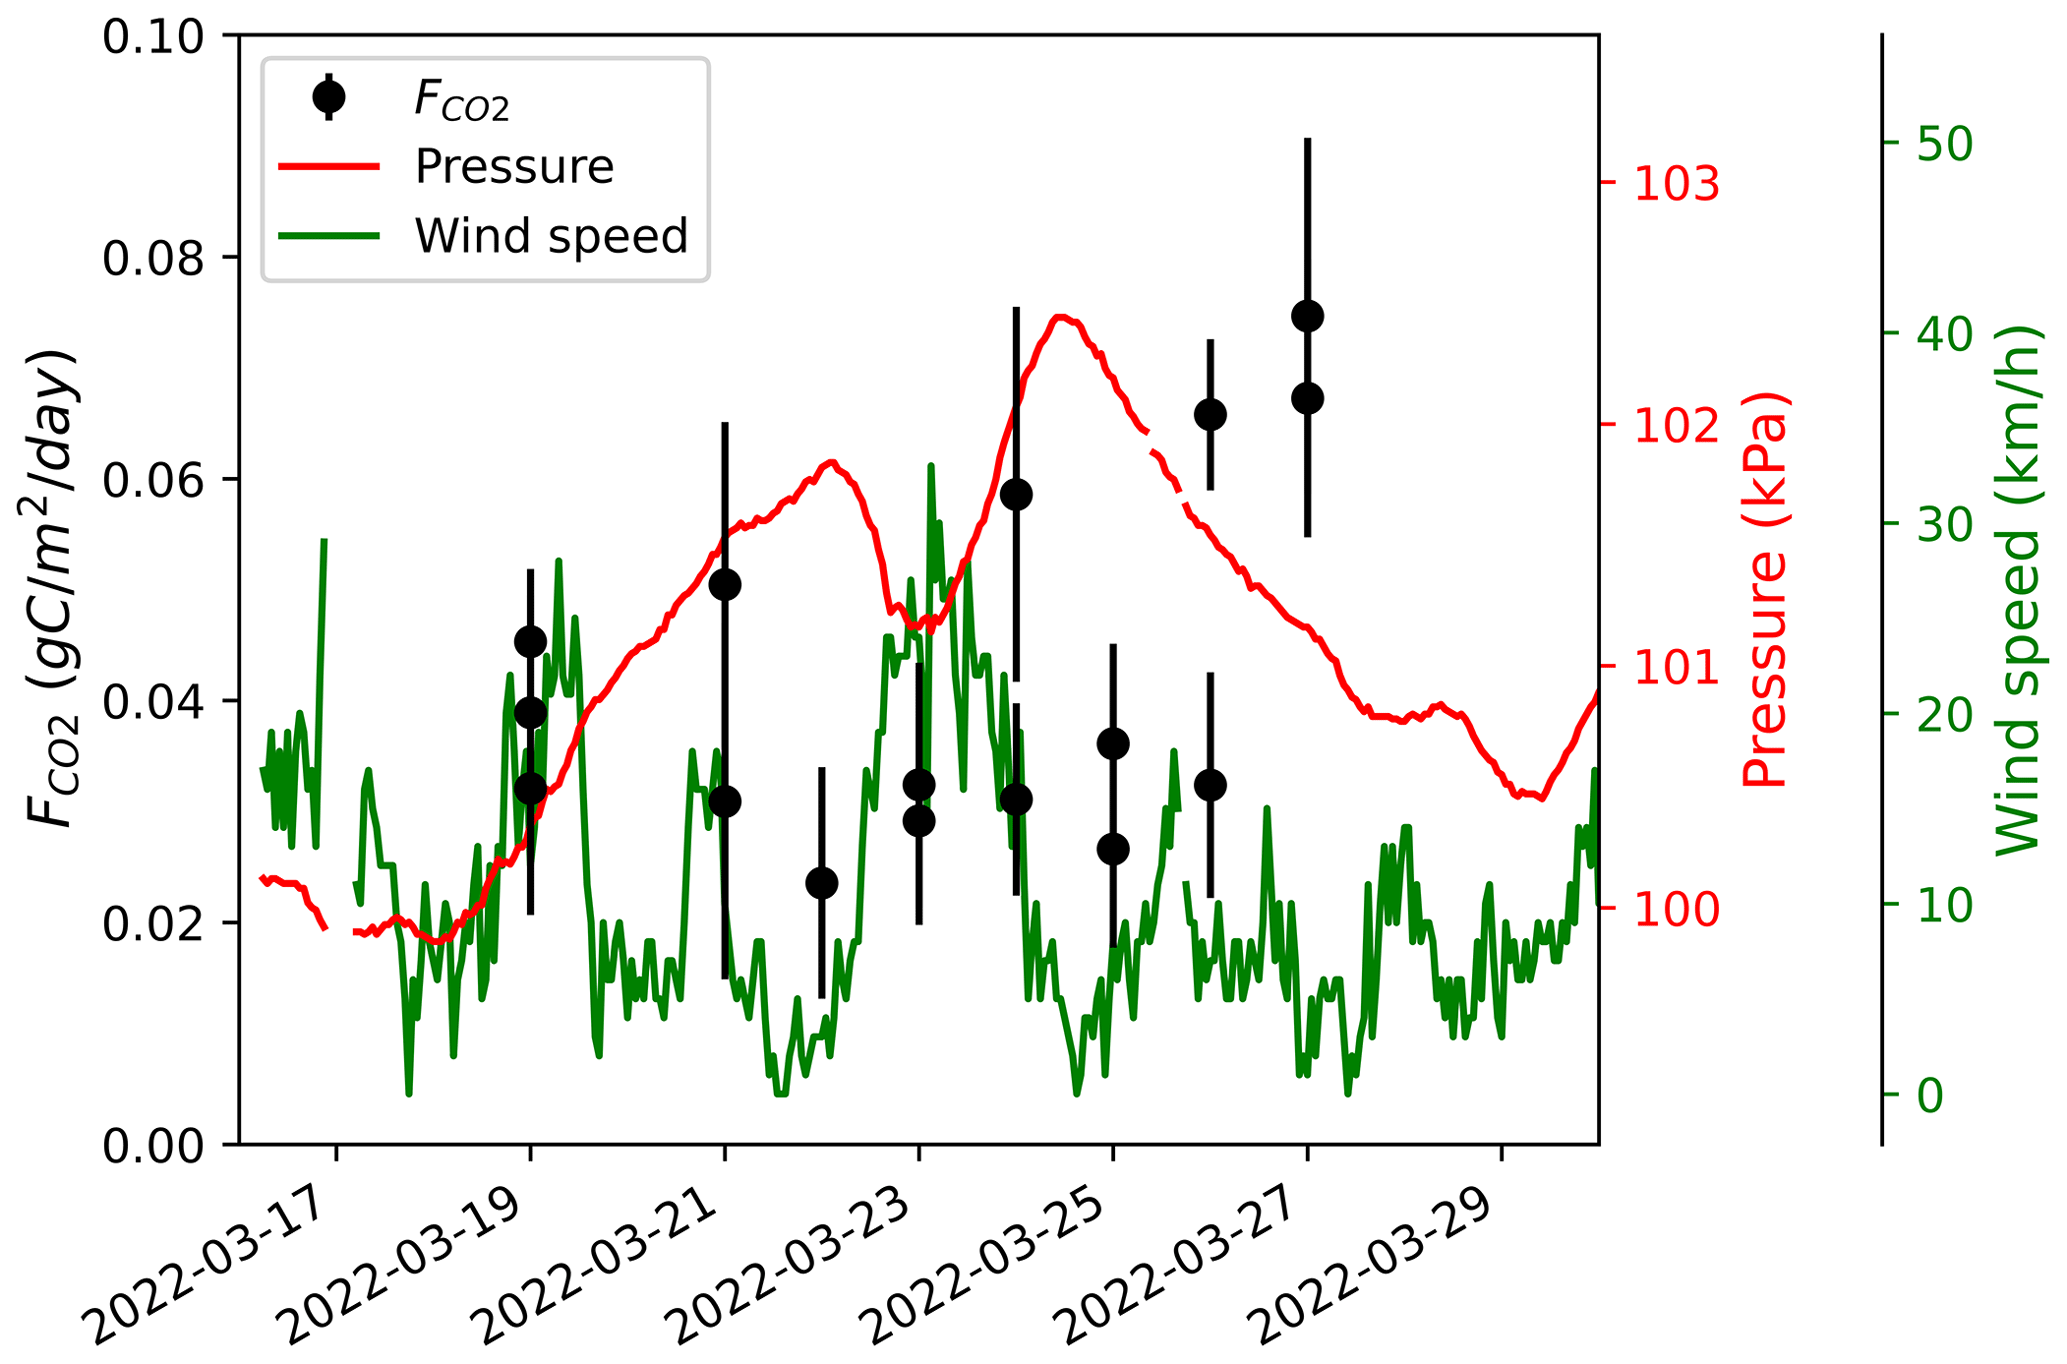
Figure A1CO2 fluxes () at a sampling location in the Trail Valley Creek erect-shrub tundra (lichen) between 19 March and 27 March 2022. Atmospheric pressure and wind speed were obtained from Environment and Climate Change Canada's Meteorological Service of Canada meteorological station at Trail Valley Creek (https://climate.weather.gc.ca/historical_data/search_historic_data_e.html, last access: 21 November 2023). The date format is YYYY-MM-DD.
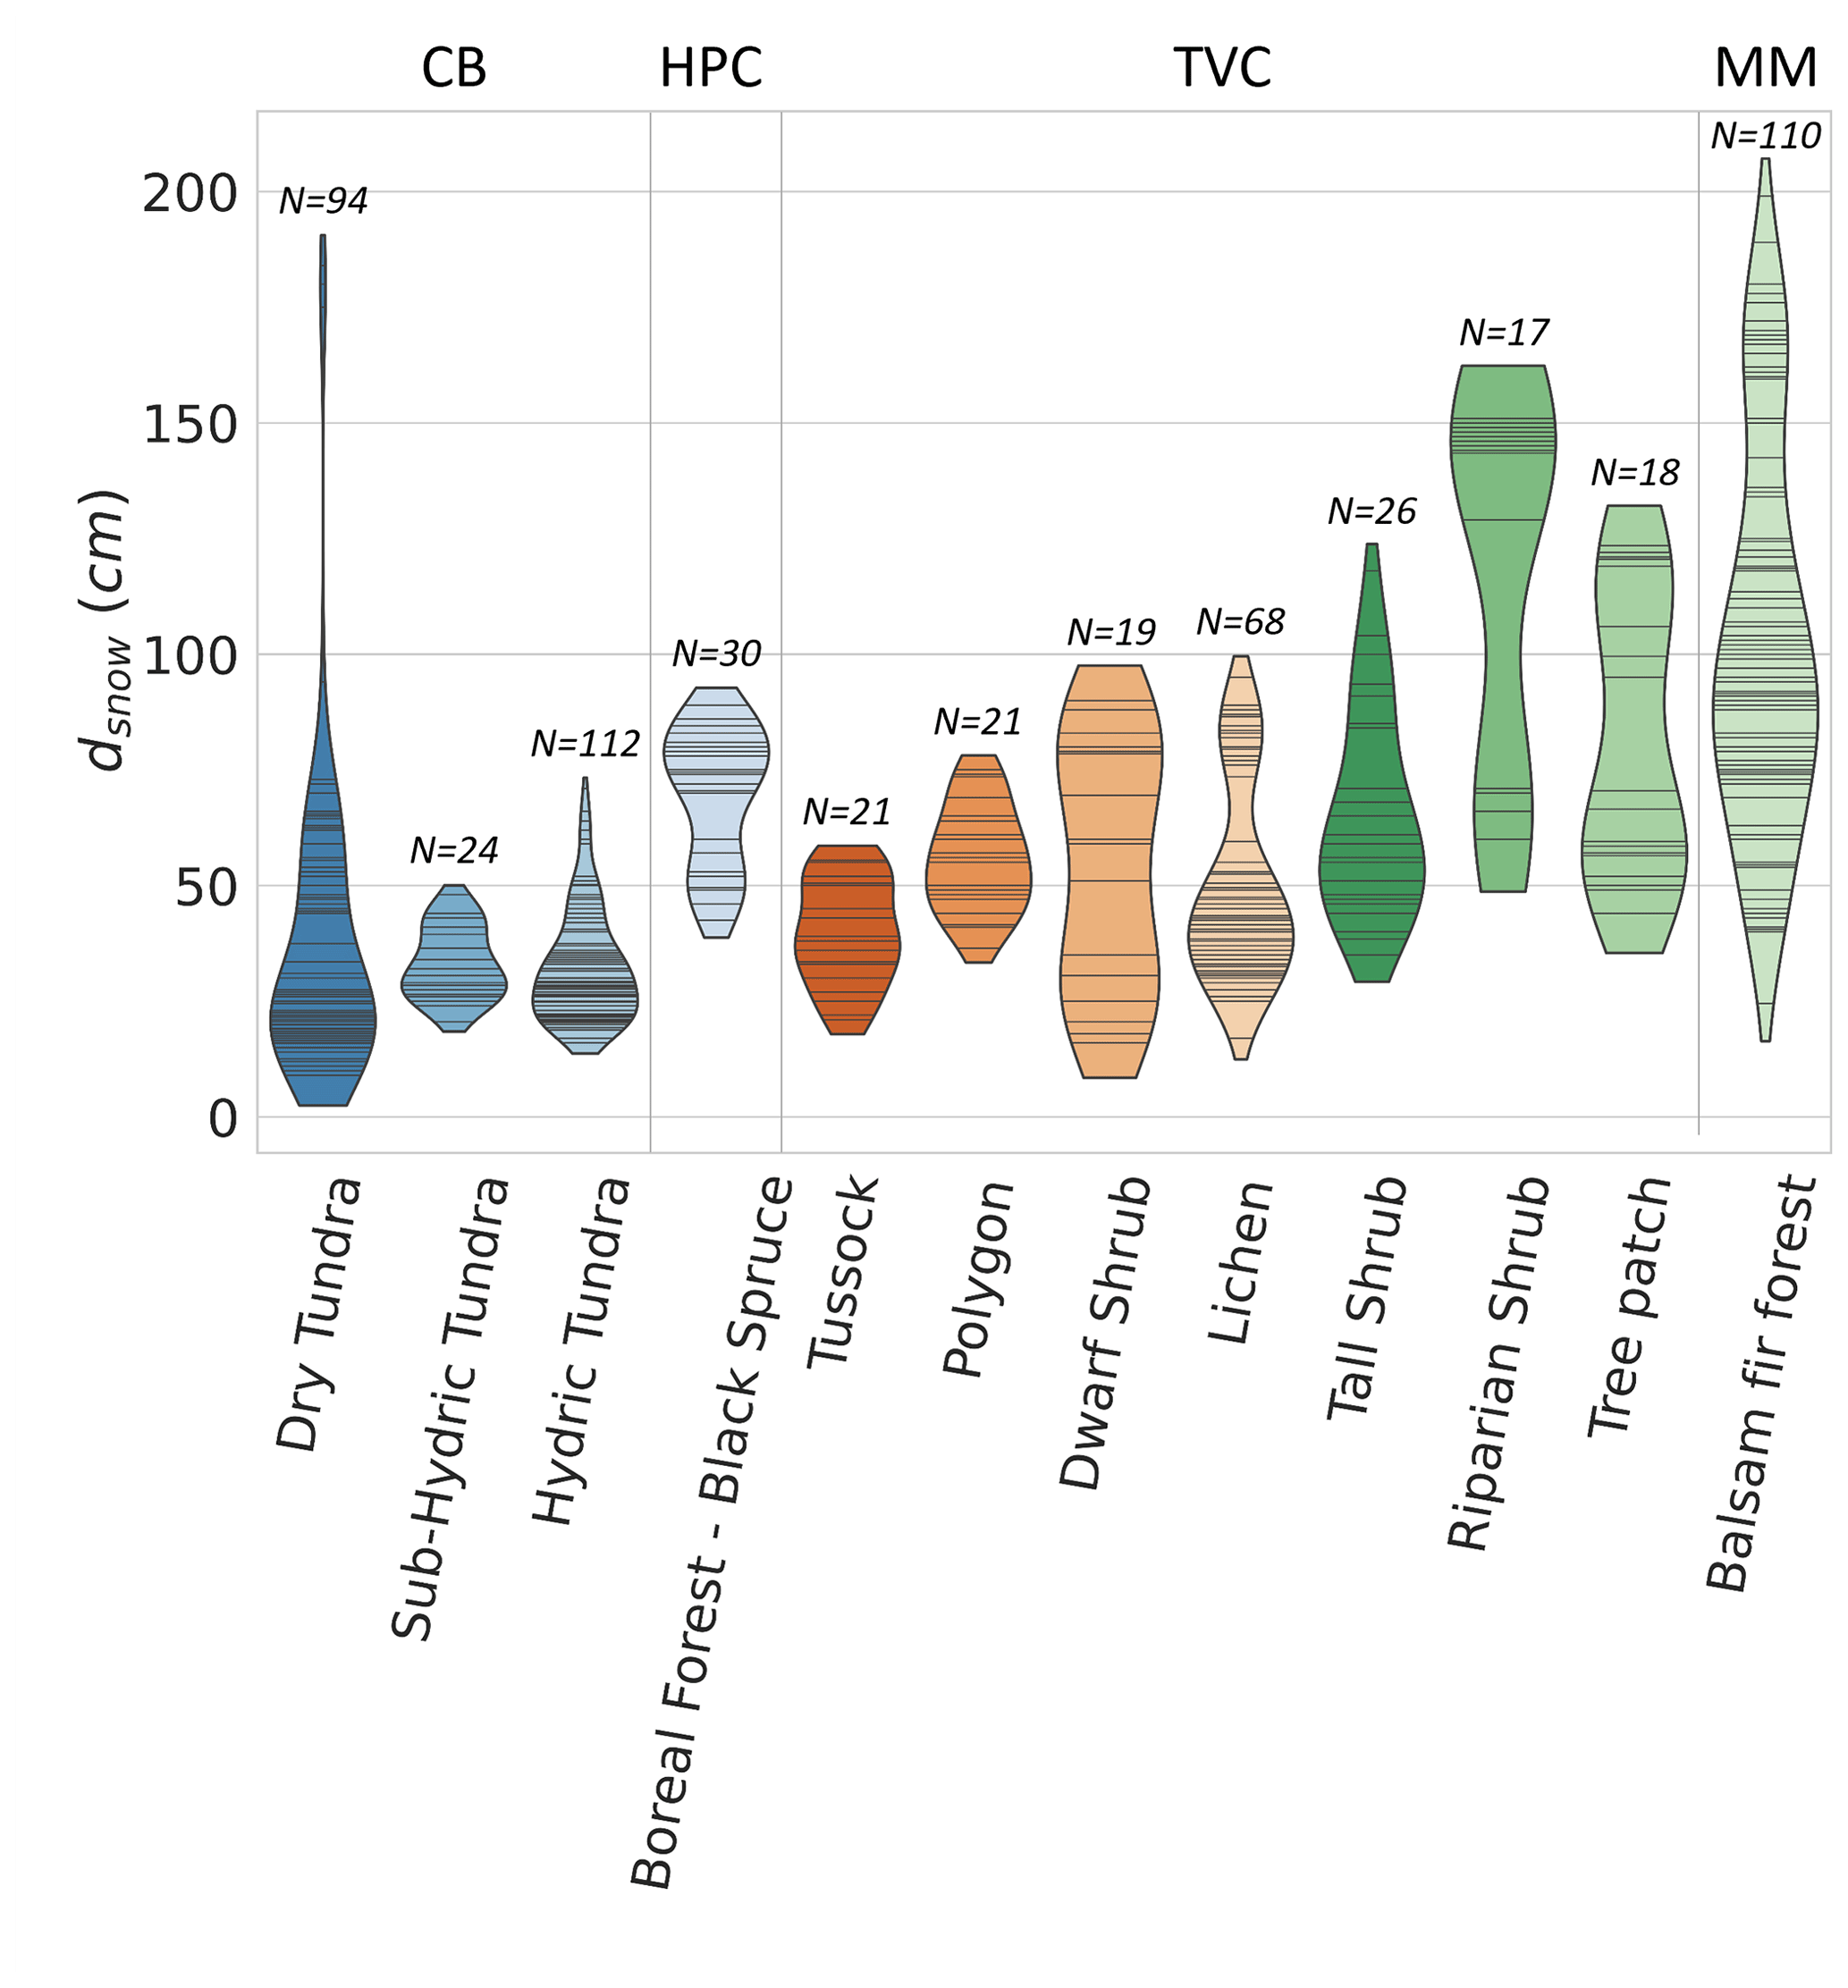
Figure A2Violin plot of the snow depth range of sites where was estimated. The black stripes inside the violins represent data points. The study sites are Cambridge Bay (CB), Havikpak Creek (HPC), Trail Valley Creek (TVC), and Montmorency Forest (MM). CB sites are ordered by increasing hydricity, and TVC sites are ordered by increasing mean soil surface temperature in March 2021 and 2022.
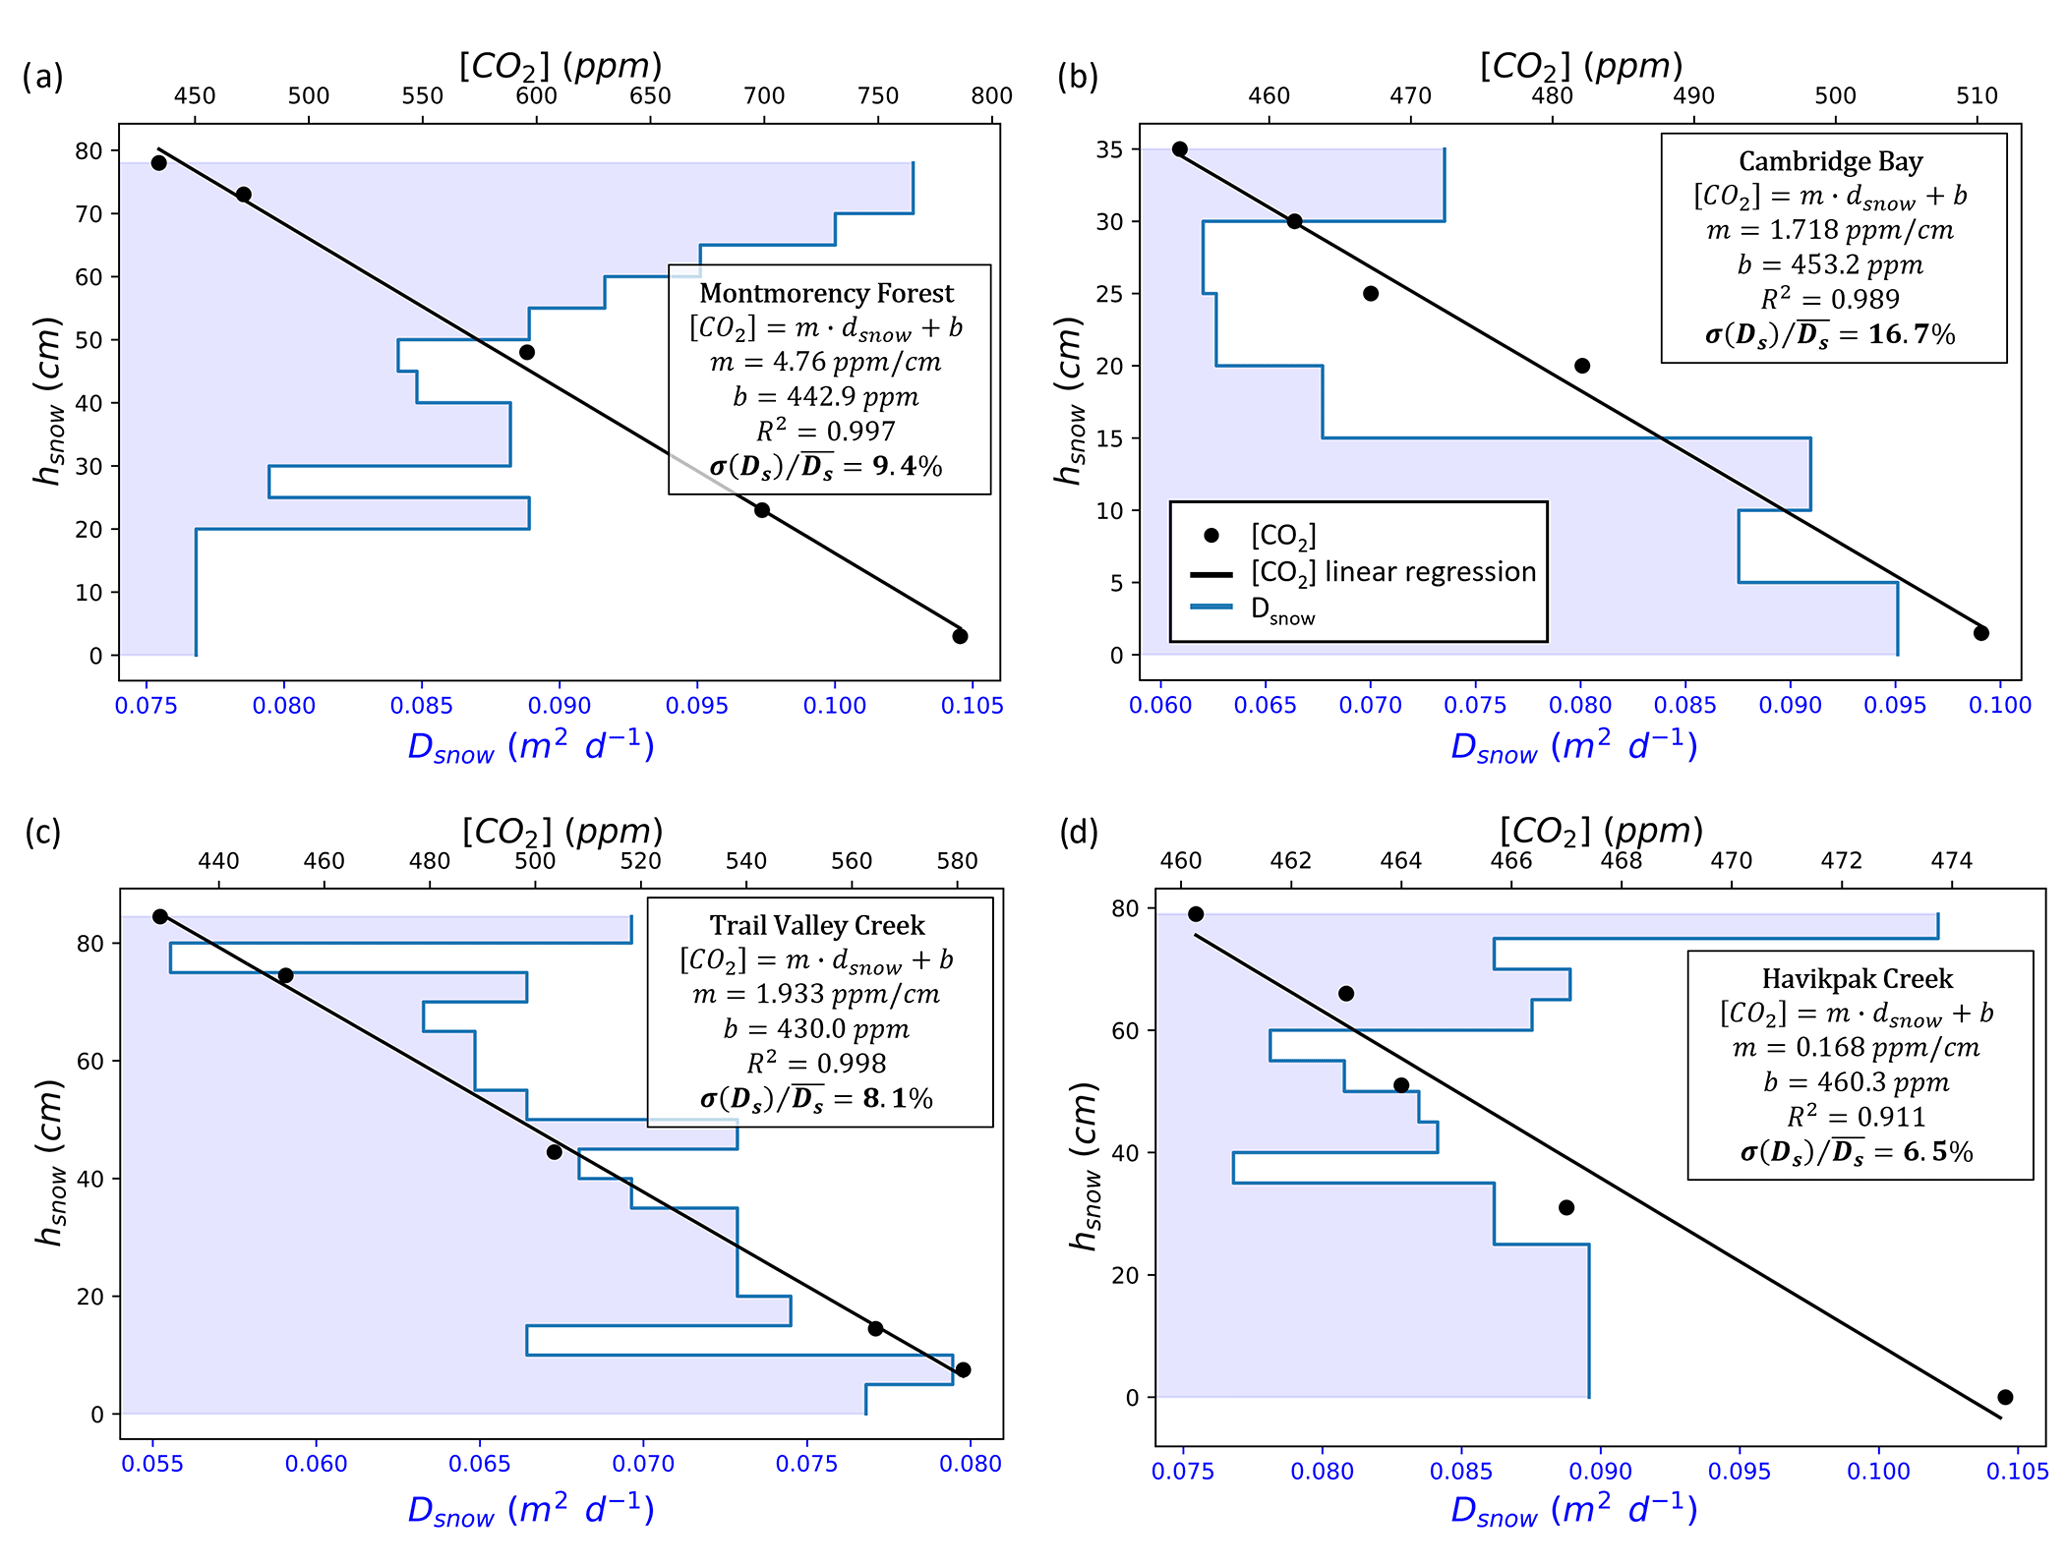
Figure A3Examples of snow diffusion coefficient () vertical stratification and CO2 concentration ([CO2]) gradient measurements as a function of snow height (hsnow) from the ground level. The coefficient of determination (R2), [CO2] gradient (m), and y-axis intercept (b) for the linear regressions on the [CO2] gradient measurements are provided. The ratio between Dsnow standard deviation (σ(Ds)) and average () is provided in percent. The data come from (a) Montmorency Forest balsam fir closed-crown coniferous boreal forest on 26 February 2021, (b) Cambridge Bay prostrate-shrub tundra (hydric tundra: hydric sedge fen) on 15 April 2022, (c) Trail Valley Creek erect-shrub tundra (lichen) on 26 March 2022, and (d) Havikpak Creek black spruce open-crown coniferous boreal forest on 16 March 2022.
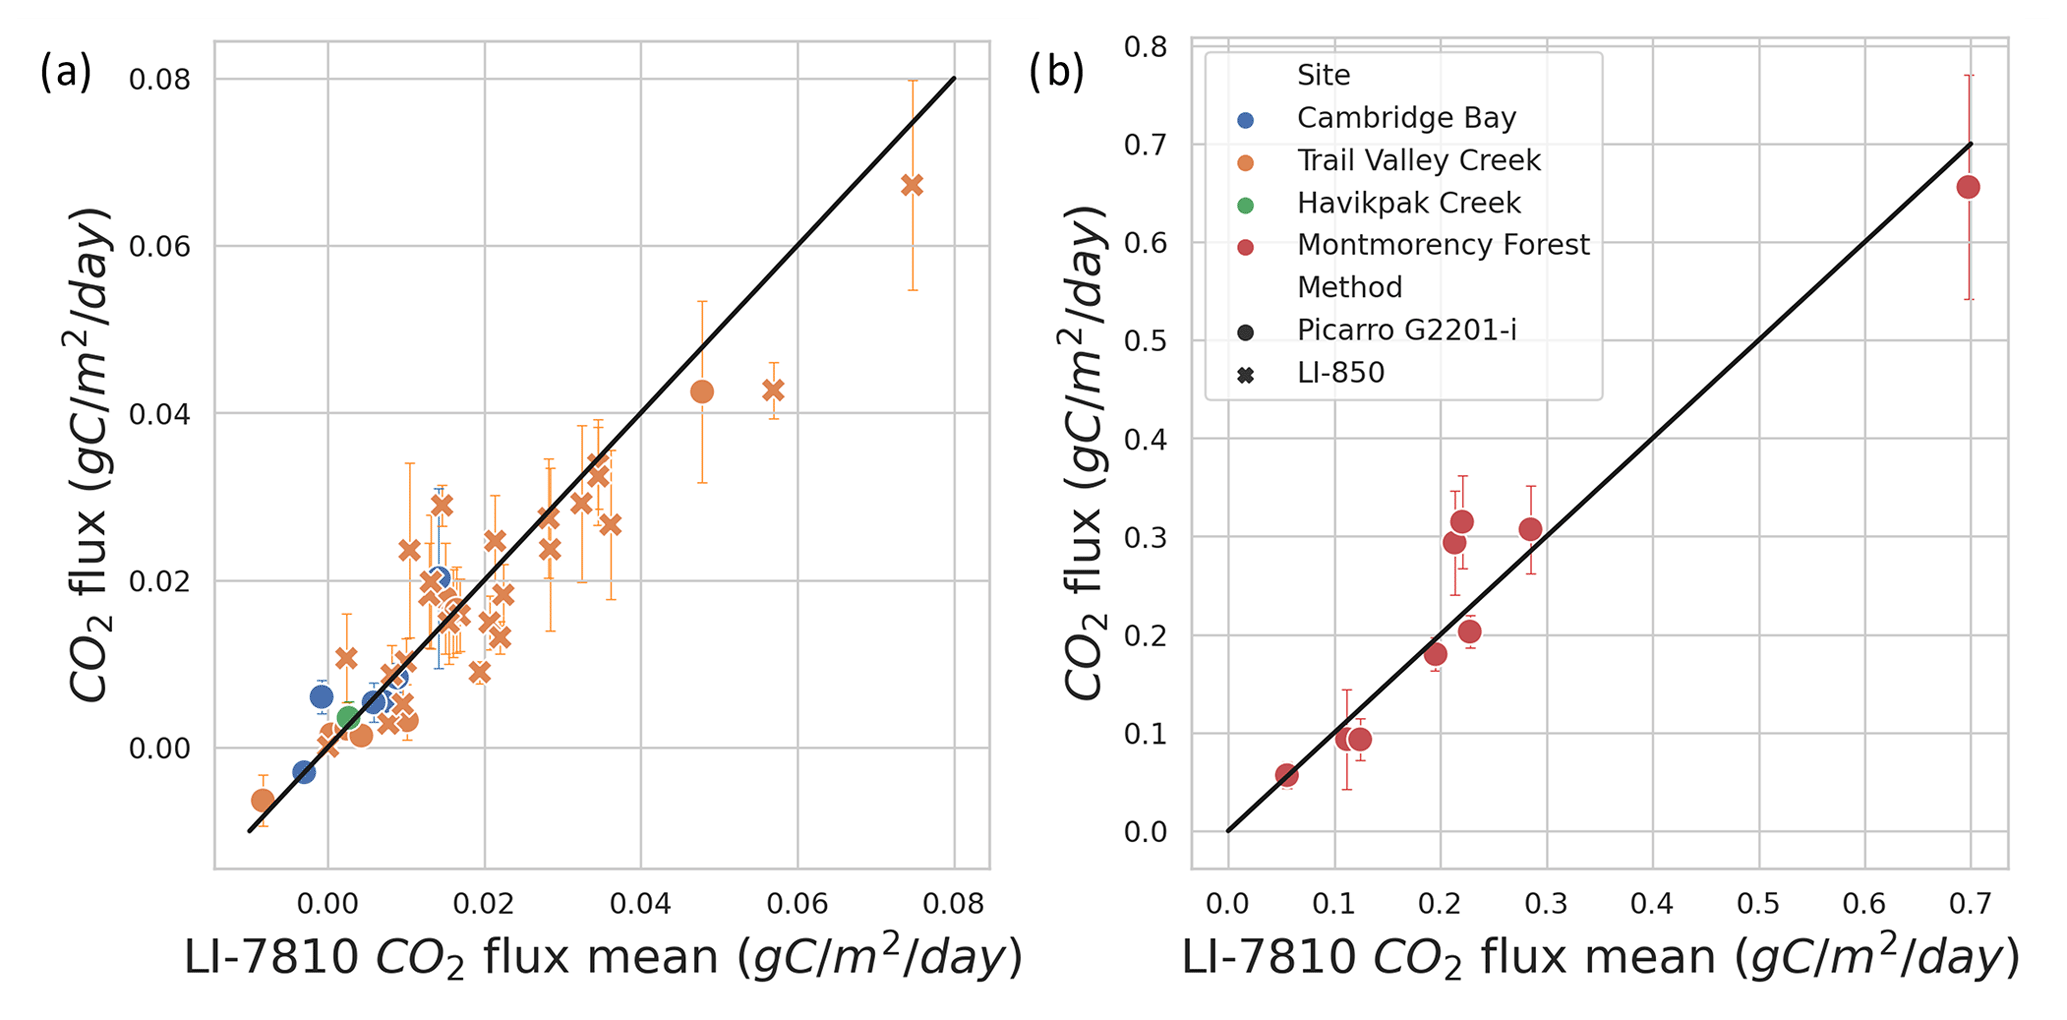
Figure A4Comparison of winter CO2 flux calculated from CO2 concentration estimated with different gas analyzers. The LI-7810 gas analyzer was used as the reference and is compared to a Picarro G2201-i and LI-850. In the Arctic biome (a), the correlation coefficient is 0.924 for the Picarro instrument and 0.821 for the LI-850. In the boreal biome (b), the correlation coefficient is 0.929 for the Picarro instrument.
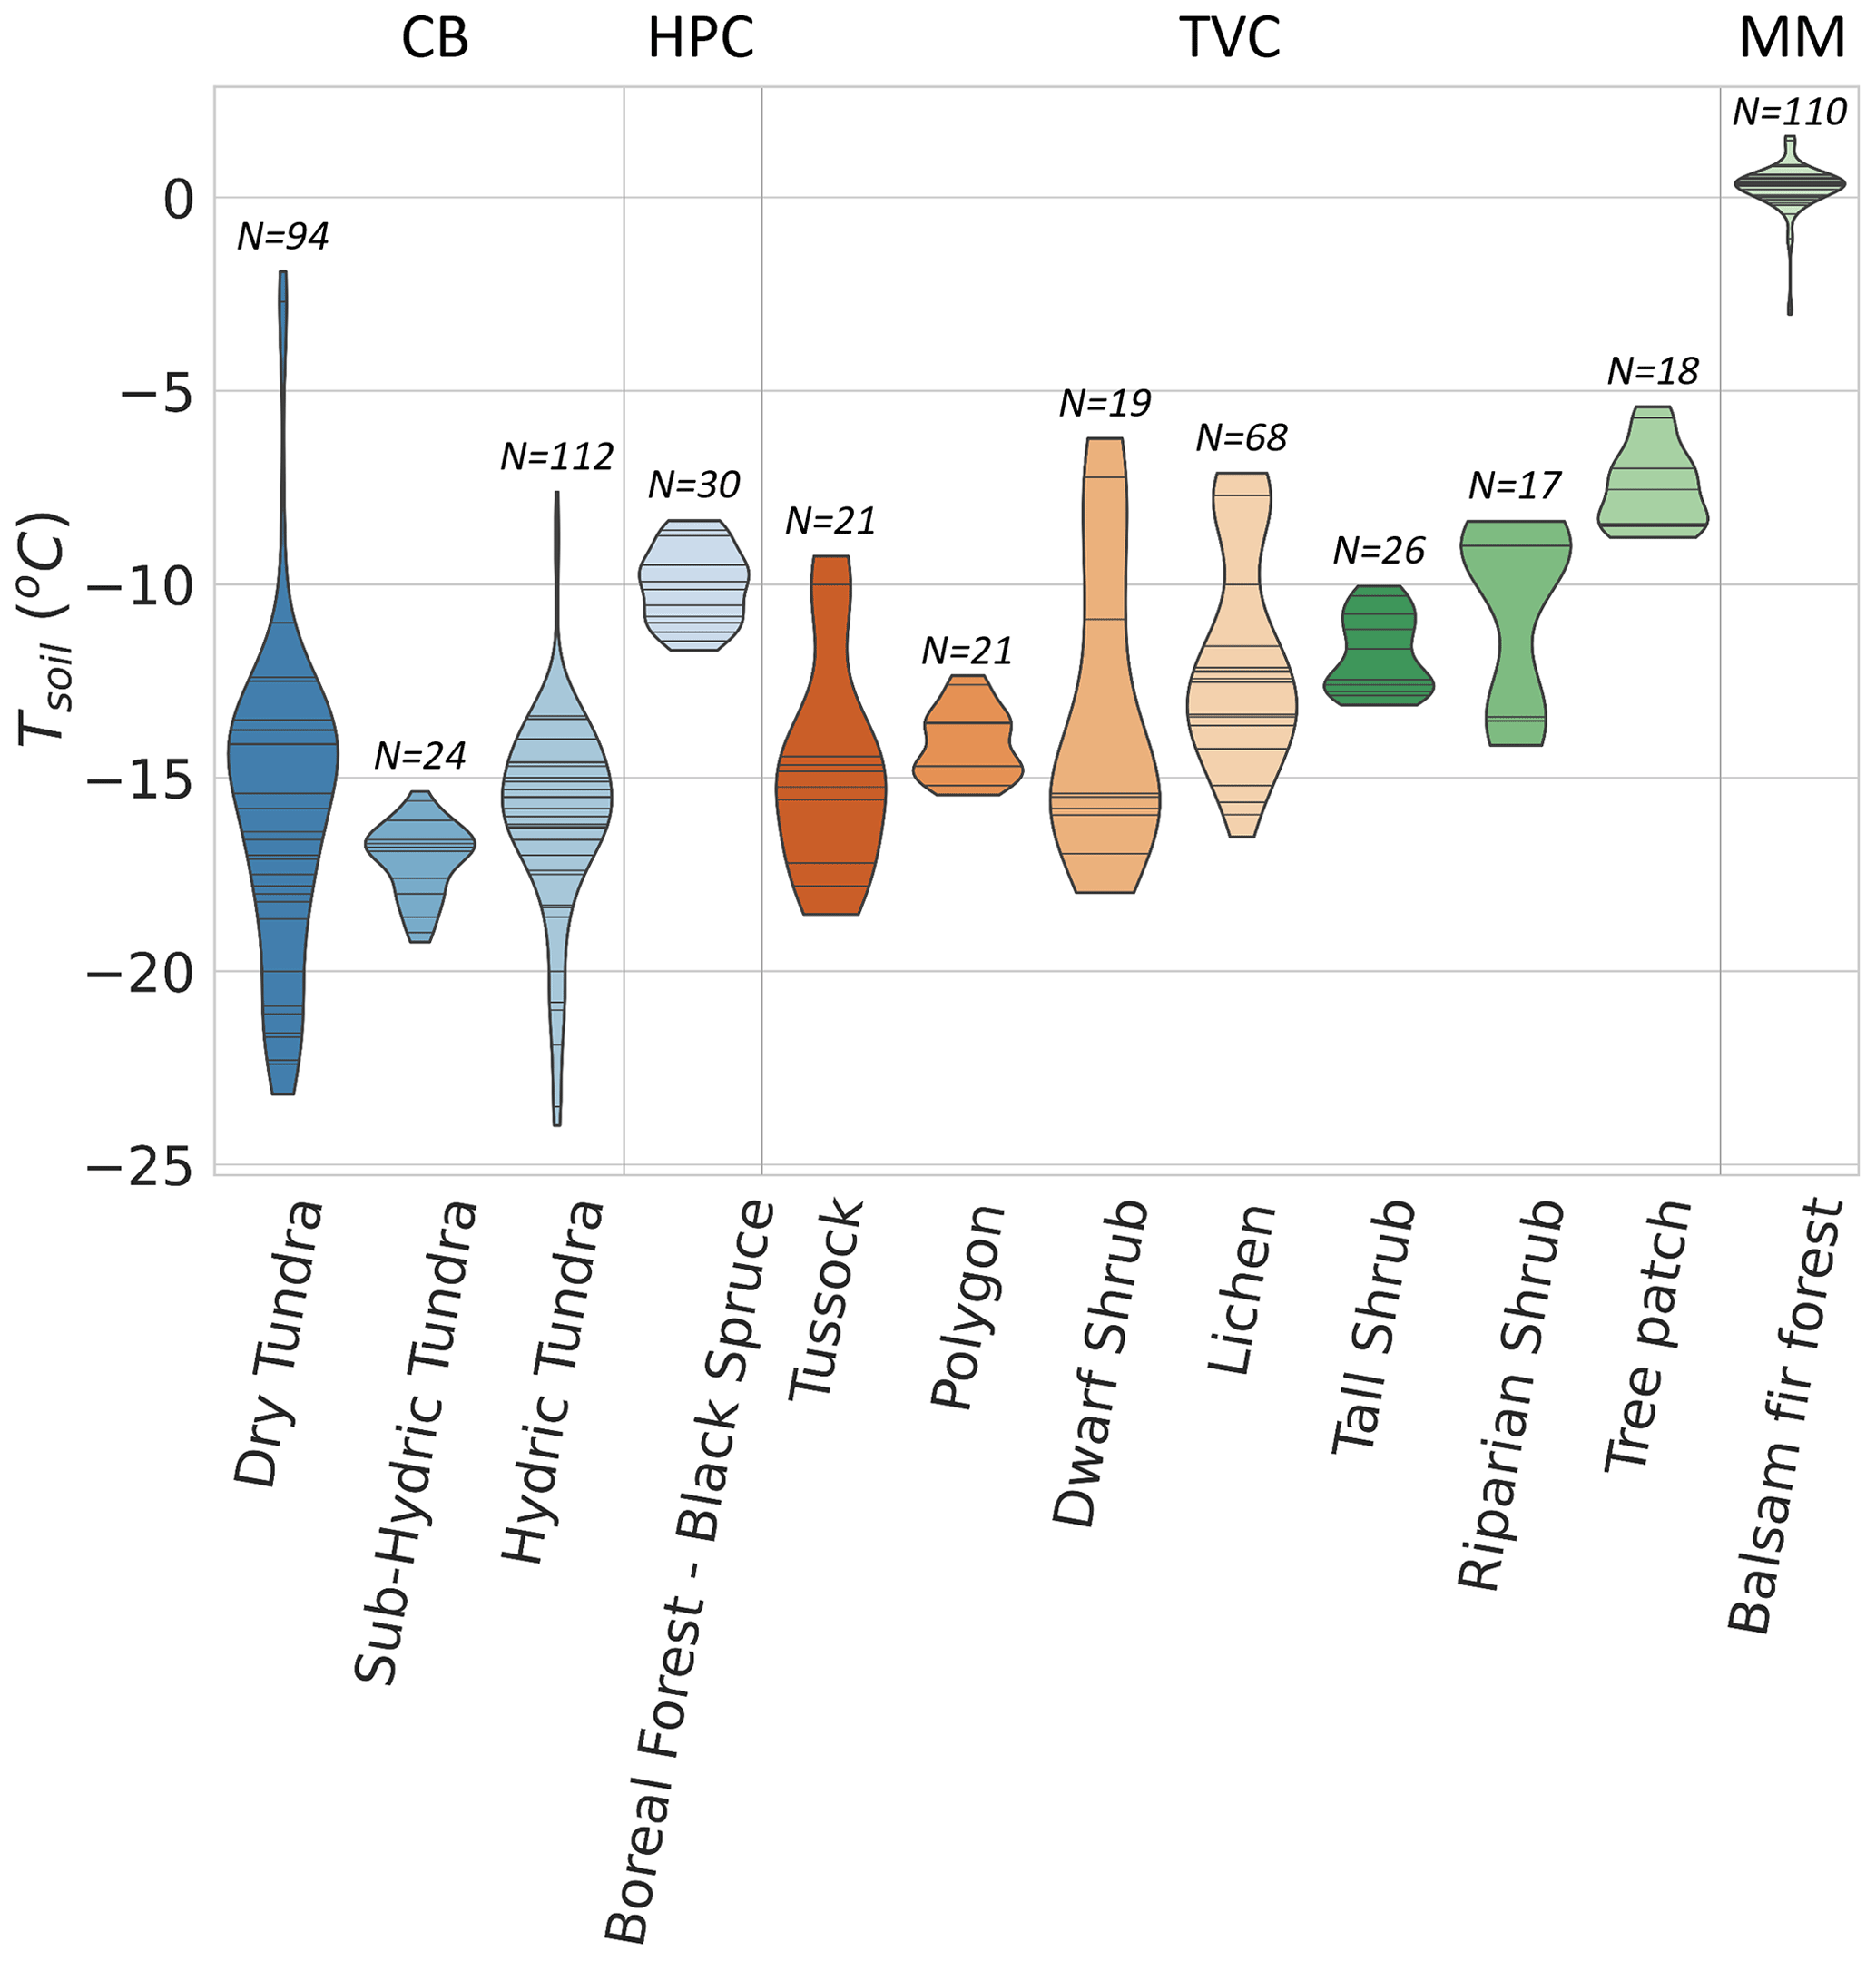
Figure A5Violin plot of the soil temperature (Tsoil) range of sites where was estimated. The black stripes inside the violins represent data points. CB sites are ordered by increasing hydricity, and TVC sites are ordered by increasing soil surface temperature in March 2021 and 2022.
Data are available via Mavrovic et al. (2023, https://doi.org/10.5683/SP3/COWXAZ).
AM, OS, JL, and AR conceived and planned the study. AM, NR, PM, JD, and AR carried out the experiments and sampling collection. AM performed the data processing and analysis. OS, JL, CV, JD, and AR contributed to dataset analysis. AM wrote the manuscript. All authors contributed to editing and reviewing the manuscript.
The contact author has declared that none of the authors has any competing interests.
Publisher's note: Copernicus Publications remains neutral with regard to jurisdictional claims made in the text, published maps, institutional affiliations, or any other geographical representation in this paper. While Copernicus Publications makes every effort to include appropriate place names, the final responsibility lies with the authors.
This work was made possible thanks to the contributions of the Natural Sciences and Engineering Research Council of Canada (NSERC), the Fonds de recherche du Québec – Nature et technologies (FRQNT), and Polar Knowledge Canada (POLAR). A special thanks goes to everybody that contributed to data collection and gas analyzing: Elise Imbeau (Viventem), Gabriel Ferland (Viventem), Aili Pedersen (POLAR), Gabriel Hould Gosselin (Université de Montréal (UdeM) and Wilfrid Laurier University (WLU)), Emma Riley (WLU), Rosy Tutton (WLU), Victoria Dutch (Northumbria University (NU)), Georgina Woolley (NU), Élise Groulx (Université de Sherbrooke (UdeS)), Charlotte Crevier (UdeS), Érika Boisvert (UdeS), Alain Royer (UdeS), Patrick Ménard (UdeS), Vincent Sasseville (UdeS), Célia Trunz (UdeS), Daniel Kramer (UdeS), Estéban Hamel Jomphe (UQTR), Samuel Goulet (UQTR), Alex Gélinas (UQTR), David de Courville (UQTR), Juliette Ortet (UQTR), and Chris Derksen (Environment and Climate Change Canada). We would also like to thank Ian Hogg, Johann Wagner, and Scott Johnson from POLAR for their logistical support.
This research has been supported by the Natural Sciences and Engineering Research Council of Canada, the Fonds de recherche du Québec – Nature et technologies, and Polar Knowledge Canada.
This paper was edited by Andreas Ibrom and reviewed by two anonymous referees.
Baldocchi, D.: Assessing the eddy covariance technique for evaluatingcarbon dioxide exchange rates of ecosystems: past, present and future, Global Change Biol., 9, 479–492, https://doi.org/10.1046/j.1365-2486.2003.00629.x, 2003.
Baldocchi, D., Falge, E., Gu, L., Olson, R., Hollinger, D., Running, S., Anthoni, P., Bernhofer, C., Davis, K., Evans, R., Fuentes, J., Goldstein, A., Katul, G., Law, B., Lee, X., Malhi, Y., Meyers, T., Munger, W., Oechel, W., Paw U, K., Pilegaard, K., Schmid, H., Valentini, R., Verma, S., Vesala, T., Wilson, K., and Wofsy, S.: FLUXNET: A New Tool to Study the Temporal and Spatial Variability of Ecosystem–Scale Carbon Dioxide, Water Vapor, and Energy Flux Densities, B. Am. Meteorol. Soc., 82, 2415–2434, https://doi.org/10.1175/1520-0477(2001)082<2415:fantts>2.3.co;2, 2001.
Barry, R., Plamondon, A. P., and Stein, J.: Hydrologic soil properties and application of a soil moisture model in a balsam fir forest, Can. J. Forest Res., 18, 427–434, https://doi.org/10.1139/x88-063, 1988.
Birch, L., Schwalm, C. R., Natali, S., Lombardozzi, D., Keppel-Aleks, G., Watts, J., Lin, X., Zona, D., Oechel, W., Sachs, T., Black, T. A., and Rogers, B. M.: Addressing biases in Arctic–boreal carbon cycling in the Community Land Model Version 5, Geosci. Model Dev., 14, 3361–3382, https://doi.org/10.5194/gmd-14-3361-2021, 2021.
Björkman, M., Morgner, E., Cooper, E., Elberling, B., Klemedtsson, L., and Björk, R.: Winter carbon dioxide effluxes from Arctic ecosystems: An overview and comparison of methodologies, Global Biogeochem. Cy., 24, GB3010, https://doi.org/10.1029/2009GB003667, 2010.
Bond-Lamberty, B. and Thomson, A.: Temperature-associated increases in the global soil respiration record, Nature, 464, 579–582, https://doi.org/10.1038/nature08930, 2010.
Bouyoucos, G. J.: Hydrometer Method Improved for Making Particle Size Analyses of Soils, Agron. J., 54, 464–465, https://doi.org/10.2134/agronj1962.00021962005400050028x, 1962.
Bowley, A.: The Standard Deviation of the Correlation Coefficient, J. Am. Stat. Assoc., 23, 31–34, https://doi.org/10.2307/2277400, 1928.
Braghiere, R., Fisher, J., Miner, K., Miller, C., Worden, J., Schimel, D., and Frankenberg, C.: Tipping point in North American Arctic-Boreal carbon sink persists in new generation Earth system models despite reduced uncertainty, Environ. Res. Lett., 18, 025008, https://doi.org/10.1088/1748-9326/acb226, 2023.
Breiman, L.: Random forests, Mach. Learn., 45, 5–32, https://doi.org/10.1023/A:1010933404324, 2001.
Brown, J., Ferrians, O., Heginbottom, J., and Melnikov, E.: Circum-Arctic Map of Permafrost and Ground-Ice Conditions, Version 2, Boulder, Colorado USA, NSIDC: National Snow and Ice Data Center, https://doi.org/10.7265/skbg-kf16, 2002.
Bruhwiler, L., Parmentier, F.-J., Crill, P., Leonard, M., and Palmer, P.: The Arctic Carbon Cycle and Its Response to Changing Climate, Curr. Clim. Change Rep., 7, 14–34, https://doi.org/10.1007/s40641-020-00169-5, 2021.
Busseau, B.-C., Royer, A., Roy, A., Langlois, A., and Dominé, F.: Analysis of snow-vegetation interactions in the low Arctic-Subarctic transition zone (northeastern Canada), Phys. Geogr., 38, 159–175, https://doi.org/10.1080/02723646.2017.1283477, 2017.
Callaghan, T., Johansson, M., Brown, R., Groisman, P., Labba, N., Radionov, V., Bradley, R., Blangy, S., Bulygina, O., Christensen, T., Colman, J., Essery, R., Forbes, B., Forchhammer, M., Golubev, V., Honrath, R., Juday, G., Meshcherskaya, A., Phoenix, G., Pomeroy, J., Rautio, A., Robinson, D., Schmidt, N., Serreze, M., Shevchenko, V., Shiklomanov, A., Shmakin, A., Sköld, P., Sturm, M., Woo, M.-k., and Wood, E.: Multiple Effects of Changes in Arctic Snow Cover, Ambio, 40, 32–45, https://doi.org/10.1007/s13280-011-0213-x, 2011a.
Callaghan, T., Tweedie, C., Akerman, J., Andrews, C., Bergstedt, J., Butler, M., Christensen, T., Cooley, D., Dahlberg, U., Danby, R., Daniëls, F., de Molenaar, J., Dick, J., Mortensen, C. E., Ebert-May, D., Emanuelsson, U., Eriksson, H., Hedenås, H., Henry, G., Hik, D., Hobbie, J., Jantze, E., Jaspers, C., Johansson, C., Johansson, M., Johnson, D., Johnstone, J., Jonasson, C., Kennedy, C., Kenney, A., Keuper, F., Koh, S., Krebs, C., Lantuit, H., Lara, M., Lin, D., Lougheed, V., Madsen, J., Matveyeva, N., McEwen, D., Myers-Smith, I., Narozhniy, Y., Olsson, H., Pohjola, V., Price, L., Rigét, F., Rundqvist, S., Sandström, A., Tamstorf, M., Bogaert, R. V., Villarreal, S., Webber, P., and Zemtsov, V.: Multi-Decadal Changes in Tundra Environments and Ecosystems: Synthesis of the International Polar Year-Back to the Future Project (IPY-BTF), Ambio, 40, 705–716, https://doi.org/10.1007/s13280-011-0179-8, 2011b.
Canadian Forest Inventory Committee (CFI): Canada's National Forest Inventory ground sampling guidelines: specifications for ongoing measurement, Pacific Forestry Centre, Victoria, British Columbia, Canada, Catalog ID 29402, ISBN 978-1-100-11329-6, 271 pp., 2008.
Carreiras, J., Quegan, S., Le Toan, T., Ho Tong Minh, D., Saatchi, S., Carvalhais, N., Reichstein, M., and Scipal, K.: Coverage of high biomass forests by the ESA BIOMASS mission under defense restrictions, Remote Sens. Environ., 196, 154–162, https://doi.org/10.1016/j.rse.2017.05.003, 2017.
Christiansen, C., Schmidt, N., and Michelsen, A.: High Arctic dry heath CO2 exchange during the early cold season, Ecosystems, 15, 1083–1092, https://doi.org/10.1007/s10021-012-9569-4, 2012.
Davidson, E. and Janssens, I.: Temperature sensitivity of soil carbon decomposition and feedbacks to climate change, Nature, 440, 165–173, https://doi.org/10.1038/nature04514, 2006.
Derksen, C., Burgess, D., Duguay, C., Howell, S., Mudryk, L., Smith, S., Thackeray, C., and Kirchmeier-Young, M.: Changes in snow, ice, and permafrost across Canada, Canada's Changing Climate Report, Chap. 5, Government of Canada, Ottawa, Ontario, Canada, 194–260, https://changingclimate.ca/CCCR2019/ (last access: 18 December 2023), 2019.
Devoie, É. G., Gruber, S., and McKenzie, J. M.: A repository of measured soil freezing characteristic curves: 1921 to 2021, Earth Syst. Sci. Data, 14, 3365–3377, https://doi.org/10.5194/essd-14-3365-2022, 2022.
Domine, F., Barrere, M., Sarrazin, D., Morin, S., and Arnaud, L.: Automatic monitoring of the effective thermal conductivity of snow in a low-Arctic shrub tundra, The Cryosphere, 9, 1265–1276, https://doi.org/10.5194/tc-9-1265-2015, 2015.
Domine, F., Barrere, M., and Morin, S.: The growth of shrubs on high Arctic tundra at Bylot Island: impact on snow physical properties and permafrost thermal regime, Biogeosciences, 13, 6471–6486, https://doi.org/10.5194/bg-13-6471-2016, 2016a.
Domine, F., Barrere, M., and Sarrazin, D.: Seasonal evolution of the effective thermal conductivity of the snow and the soil in high Arctic herb tundra at Bylot Island, Canada, The Cryosphere, 10, 2573–2588, https://doi.org/10.5194/tc-10-2573-2016, 2016b.
Dominé, F., Fourteau, K., Picard, G., Lackner, G., Sarrazin, D., and Poirier, M.: Permafrost cooled in winter by thermal bridging through snow-covered shrub branches, Nat. Geosci., 15, 554–560, https://doi.org/10.1038/s41561-022-00979-2, 2022.
Du Plessis, P. and Masliyah, J.: Flow through isotropic granular porous media, Transport Porous Med., 6, 207–221, https://doi.org/10.1007/BF00208950, 1991.
Elberling, B.: Annual soil CO2 effluxes in the High Arctic: The role of snow thickness and vegetation type, Soil Biol. Biochem., 39, 646–654, https://doi.org/10.1016/j.soilbio.2006.09.017, 2007.
Fierz, C., Armstrong, R. L., Durand, Y., Etchevers, P., Green, E., McClung, D., Nishimura, K., Satyawali, P., and Sokratov, S.: The International Classification for Seasonal Snow on the Ground, IHP-VII Technical Documents in Hydrology N83, IACS Contribution N1, UNESCO-IHP, Paris, https://www.dora.lib4ri.ch/wsl/islandora/object/wsl:10162 (last access: 18 December 2023), 2009.
Fisher, J., Sikka, M., Block, G., Schwalm, C., Parazoo, N., Kolus, H., Sok, M., Wang, A., Gagne-Landmann, A., Lawal, S., Guillaume, A., Poletti, A., Schaefer, K., El Masri, B., Levy, P., Wei, Y., Dietze, M., and Huntzinger, D.: The Terrestrial Biosphere Model Farm, J. Adv. Model. Earth Sy., 14, e2021MS002676, https://doi.org/10.1029/2021MS002676, 2022.
Fisher, J. B., Sikka, M., Oechel, W. C., Huntzinger, D. N., Melton, J. R., Koven, C. D., Ahlström, A., Arain, M. A., Baker, I., Chen, J. M., Ciais, P., Davidson, C., Dietze, M., El-Masri, B., Hayes, D., Huntingford, C., Jain, A. K., Levy, P. E., Lomas, M. R., Poulter, B., Price, D., Sahoo, A. K., Schaefer, K., Tian, H., Tomelleri, E., Verbeeck, H., Viovy, N., Wania, R., Zeng, N., and Miller, C. E.: Carbon cycle uncertainty in the Alaskan Arctic, Biogeosciences, 11, 4271–4288, https://doi.org/10.5194/bg-11-4271-2014, 2014.
Gauthier, S., Bernier, P., Kuuluvainen, T., Shvidenko, A., and Schepaschenko, D.: Boreal forest health and global change, Science, 349, 819–822, https://doi.org/10.1126/science.aaa9092, 2015.
Gouttevin, I., Menegoz, M., Dominé, F., Krinner, G., Koven, C., Ciais, P., Tarnocai, C., and Boike, J.: How the insulating properties of snow affect soil carbon distribution in the continental pan-Arctic area, J. Geophys. Res.-Biogeo., 117, G02020, https://doi.org/10.1029/2011JG001916, 2012.
Graham, L. and Risk, D.: Explaining CO2 fluctuations observed in snowpacks, Biogeosciences, 15, 847–859, https://doi.org/10.5194/bg-15-847-2018, 2018.
Grünberg, I., Wilcox, E. J., Zwieback, S., Marsh, P., and Boike, J.: Linking tundra vegetation, snow, soil temperature, and permafrost, Biogeosciences, 17, 4261–4279, https://doi.org/10.5194/bg-17-4261-2020, 2020.
Harel, A., Sylvain, J., Drolet, G., Thiffault, E., Thiffault, N., and Tremblay, S.: Fine scale assessment of seasonal, intra-seasonal and spatial dynamics of soil CO2 effluxes over a balsam fir-dominated perhumid boreal landscape, Agr. Forest Meteorol., 335, 109469, https://doi.org/10.1016/j.agrformet.2023.109469, 2023.
Harvey, A., In Haynes, W., Lide, D., and Bruno, T.: CRC Handbook of Chemistry and Physics, 97th edn.: Properties of Ice and Supercooled Water, CRC Press, Boca Raton, Florida, United States, 2666 pp., ISBN 978-1-4987-5429-3, 2017.
Hayes, J., McGuire, A., Kicklighter, D., Gurney, K., Burnside, T., and Melillo, J.: Is the northern high-latitude land-based CO2 sink weakening?, Global Biogeochem. Cy., 25, GB3018, https://doi.org/10.1029/2010GB003813, 2011.
Jentzsch, K., Boike, J., and Foken, T.: Importance of the Webb, Pearman, and Leuning (WPL) correction for the measurement of small CO2 fluxes, Atmos. Meas. Tech., 14, 7291–7296, https://doi.org/10.5194/amt-14-7291-2021, 2021.
Jones, H., Pomeroy, J., Davies, T., Tranter, M., and Marsh, P.: CO2 in Arctic snow cover: landscape form, in-pack gas concentration gradients, and the implications for the estimation of gaseous fluxes, Hydrol. Process., 13–18, 2977–2989, https://doi.org/10.1002/(SICI)1099-1085(19991230)13:18<2977::AID-HYP12>3.0.CO;2-%23, 1999.
Kibtia, H., Abdullah, S., and Bustamam, A.: Comparison of random forest and support vector machine for prediction of cognitive impairment in Parkinson's disease, AIP Conf. Proc., 2296, 020093, https://doi.org/10.1063/5.0030332, 2020.
Kim, Y., Tsunogai, S., and Tanaka, N.: Winter CO2 emission and its production rate in cold temperate soils of northern Japan: 222Rn as a proxy for the validation of CO2 diffusivity, Polar Sci., 22, 100480, https://doi.org/10.1016/j.polar.2019.09.002, 2019.
Kinar, N. and Pomeroy, J.: Measurement of the physical properties of the snowpack, Rev. Geophys., 53, 481–544, https://doi.org/10.1002/2015RG000481, 2015.
Knowles, J., Blanken, P., and Williams, M.: Soil respiration variability across a soil moisture and vegetation community gradient within a snow-scoured alpine meadow, Biogeochemistry, 125, 185–202, https://doi.org/10.1007/s10533-015-0122-3, 2015.
Krogh, S., Pomeroy, J., and Marsh, P.: Diagnosis of the hydrology of a small Arctic basin at the tundra-taiga transition using a physically based hydrological model, J. Hydrol., 550, 685–703, https://doi.org/10.1016/j.jhydrol.2017.05.042, 2017.
Kropp, H., Loranty, M., Rutter, N., Fletcher, C., Derksen, C., Mudryk, L., and Todt, M.: Are vegetation influences on Arctic–boreal snow melt rates detectable across the Northern Hemisphere?, Environ. Res. Lett., 17, 104010, https://doi.org/10.1088/1748-9326/ac8fa7, 2022.
Lawrence, D., Fisher, R., Koven, C., Oleson, K., Swenson, S., Bonan, G., Collier, N., Ghimire, B., Kampenhout, L., Kennedy, D., Kluzek, E., Lawrence, P., Li, F., Li, H., Lombardozzi, D., Riley, W., Sacks, W., Shi, M., Vertenstein, M., Wieder, W., Xu, C., Ali, A., Badger, A., Bisht, G., Broeke, M., Brunke, M., Burns, S., Buzan, J., Clark, M., Craig, A., Dahlin, K., Drewniak, B., Fisher, J., Flanner, M., Fox, A., Gentine, P., Hoffman, F., Keppel-Aleks, G., Knox, R., Kumar, S., Lenaerts, J., Leung, L. R., Lipscomb, W., Lu, Y., Pandey, A., Pelletier, J., Perket, J., Randerson, J., Ricciuto, D., Sanderson, B., Slater, A., Subin, Z., Tang, J., Thomas, R. Q., Val Martin, M., and Zeng, X.: The Community Land Model version 5: Description of new features, benchmarking, and impact of forcing uncertainty, J. Adv. Model. Earth Sy., 11, 4245–4287, https://doi.org/10.1029/2018MS001583, 2019.
Liaw, A. and Wiener, M.: Classification and Regression by Randomforest, R News, 2, 18–22, 2002.
Linn, D. and Doran, J.: Effect of Water Filled Pore Space on Carbon Dioxide and Nitrous Oxide Production in Tilled and Non-Tilled Soils, Soil Sci. Soc. Am. J., 48, 1267–1272, https://doi.org/10.2136/sssaj1984.03615995004800060013x, 1984.
Loranty, M. M., Abbott, B. W., Blok, D., Douglas, T. A., Epstein, H. E., Forbes, B. C., Jones, B. M., Kholodov, A. L., Kropp, H., Malhotra, A., Mamet, S. D., Myers-Smith, I. H., Natali, S. M., O'Donnell, J. A., Phoenix, G. K., Rocha, A. V., Sonnentag, O., Tape, K. D., and Walker, D. A.: Reviews and syntheses: Changing ecosystem influences on soil thermal regimes in northern high-latitude permafrost regions, Biogeosciences, 15, 5287–5313, https://doi.org/10.5194/bg-15-5287-2018, 2018.
Maier, M., Weber, T., Fiedler, J., Fuß, R., Glatzel, S., Huth, V., Jordan, S., Jurasinski, G., Kutzbach, L., Schäfer, K., Weymann, D., and Hagemann, U.: Introduction of a guideline for measurements of greenhouse gas fluxes from soils using non-steady-state chambers, J. Soil Sci. Plant Nut., 185, 447–461, https://doi.org/10.1002/jpln.202200199, 2022.
Marrero, T. and Mason E.: Gaseous diffusion coeffcients, J. Phys. Chem. Ref. Data, 1, 3–117, https://doi.org/10.1063/1.3253094, 1972.
Martin, M., Kumar, P., Sonnentag, O., and Marsh, P.: Thermodynamic basis for the demarcation of Arctic and alpine treelines, Sci. Rep.-UK, 12, 12565, https://doi.org/10.1038/s41598-022-16462-2, 2022.
Massman, W.: A review of the molecular diffusivities of H2O, CO2, CH4, CO, O3, SO2, NH3, N2O, NO, and NO2 in air, O2 and N2 near STP, Atmos. Environ., 32, 1111–1127, https://doi.org/10.1016/S1352-2310(97)00391-9, 1998.
Mast, M. A., Wickland, K., Striegl, R., and Clow, D.: Winter fluxes of CO2 and CH4 from subalpine soils in Rocky Mountain National Park, Colorado, Global Biogeochem. Cy., 12, 607–620, https://doi.org/10.1029/98GB02313, 1998.
Mavrovic, A., Sonnentag, O., Voigt, C., and Roy, A.: Winter CO2 fluxes over arctic and boreal environments, Borealis, [data set], https://doi.org/10.5683/SP3/COWXAZ, 2023.
McDowell, N., Marshall, J., Hooker, T., and Musselman, R.: Estimating CO2 flux from snowpacks at three sites in the Rocky Mountains, Tree Physiol., 20, 745–753, https://doi.org/10.1093/treephys/20.11.745, 2000.
McMahon, S., Parker, G., and Miller, D.: Evidence for a recent increase in forest growth, P. Natl. Acad. Sci. USA, 107, 3611–3615, https://doi.org/10.1073/pnas.0912376107, 2010.
Mellander, P., Löfvenius, M., and Laudon, H.: Climate change impact on snow and soil temperature in boreal Scots pine stands, Climatic Change, 85, 179–193, https://doi.org/10.1007/s10584-007-9254-3, 2007.
Meloche, J., Langlois, A., Rutter, N., McLennan, D., Royer, A., Billecocq, P., and Ponomarenko, S.: High-resolution snow depth prediction using Random Forest algorithm with topographic parameters: A case study in the Greiner watershed, Nunavut, Hydrol. Process., 36, e14546, https://doi.org/10.1002/hyp.14546, 2021.
Melton, J. R., Arora, V. K., Wisernig-Cojoc, E., Seiler, C., Fortier, M., Chan, E., and Teckentrup, L.: CLASSIC v1.0: the open-source community successor to the Canadian Land Surface Scheme (CLASS) and the Canadian Terrestrial Ecosystem Model (CTEM) – Part 1: Model framework and site-level performance, Geosci. Model Dev., 13, 2825–2850, https://doi.org/10.5194/gmd-13-2825-2020, 2020.
Ménard, C., Essery, R., Pomeroy, J., Marsh, P., and Clark, D.: A shrub bending model tocalculate the albedo of shrub-tundra, Hydrol. Process., 28, 341–351, https://doi.org/10.1002/hyp.9582, 2012.
Michaelson, G. J. and Ping, C. L.: Soil organic carbon and CO2 respiration at subzero temperature in soils of Arctic Alaska, J. Geophys. Res.-Atmos. 108, 8164, https://doi.org/10.1029/2001JD000920, 2005.
Millington, R. J.: Gas Diffusion in Porous Media, Science, 130, 100–102, https://doi.org/10.1126/science.130.3367.100.b, 1959.
Miner, K., Turetsky, M., Malina, E., Bartsch, A., Tamminen, J., McGuire, A. D., Fix, A., Sweeney, C., Elder, C., and Miller, C.: Permafrost carbon emissions in a changing Arctic, Nat. Rev. Earth Environ., 3, 55–67, https://doi.org/10.1038/s43017-021-00230-3, 2022.
Monson, R., Lipson, D., Burns, S., Turnipseed, A., Delany, A., Williams, M., and Schmidt, S.: Winter forest soil respiration controlled by climate and microbial community composition, Nature, 439, 711–714, https://doi.org/10.1038/nature04555, 2006.
Myers-Smith, I. H., Kerby, J., Phoenix, G., Bjerke, J., Epstein, H., Assmann, J., John, C., Andreu-Hayles, L., Angers-Blondin, S., Beck, P., Berner, L., Bhatt, U., Björkman, A., Blok, C., Bryn, A., Christiansen, C., Cornelissen, J. H. C., Cunliffe, A., Elmendorf, S., Forbes, B., Goetz, S., Hollister, R., de Jong, R., Loranty, M., Macias-Fauria, M., Maseyk, K., Normand, S., Olofsson, J., Parker, T., Parmentier, F.-J., Post. E., Schaepman-Strub, G., Stordal, F., Sullivan, P., Thomas, H., Tømmervik, H., Treharne, R., Tweedie, C., Walker, D., Wilmking, M., and Wipf, S.: Complexity revealed in the greening of the Arctic, Nat. Clim. Change, 10, 106–117, https://doi.org/10.1038/s41558-019-0688-1, 2020.
Natali, S., Watts, J., Rogers, B., Potter, S., Ludwig, S., Selbmann, A.-K., Sullivan, P., Abbott, B., Arndt, K., Birch, L., Björkman, M., Bloom, A., Celis, G., Christensen, T., Christiansen, C., Commane, R., Cooper, E., Crill, P., Czimczik, C., Davydov, S., Du, J., Egan, J., Elberling, B., Euskirchen, E., Friborg, T., Genet, H., Göckede, M., Goodrich, J., Grogan, P., Helbig, M., Jafarov, E., Jastrow, J., Kalhori, A., Kim, Y., Kimball, J., Kutzbach, L., Lara, M., Larsen, K., Lee, B.-Y., Liu, Z., Loranty, M., Lund, M., Lupascu, M., Madani, N., Malhotra, A., Matamala, R., McFarland, J., McGuire, A., Michelsen, A., Minions, C., Oechel, W., Olefeldt, D., Parmentier, F.-J., Pirk, N., Poulter, B., Quinton, W., Rezanezhad, F., Risk, D., Sachs, T., Schaefer, K., Schmidt, N., Schuur, E., Semenchuk, P., Shaver, G., Sonnentag, O., Starr, G., Treat, C., Waldrop, M., Wang, Y., Welker, J., Wille, C., Xu, X., Zhang, Z., Zhuang, Q., and Zona, D.: Large loss of CO2 in winter observed across the northern permafrost region, Nat. Clim. Change, 9, 852–857, https://doi.org/10.1038/s41558-019-0592-8, 2019.
Natali, S., Holdren, J., Rogers, B., Treharne, R., Duffy, P., Pomerance, R., and MacDonald, E.: Permafrost carbon feedbacks threaten global climate goals, P. Natl. Acad. Sci. USA, 118, e2100163118, https://doi.org/10.1073/pnas.2100163118, 2021.
Outcalt, S., Nelson, F., and Hinkel, K.: The zero-curtain effect: Heat and mass transfer across an isothermal region in freezing soil, Water Resour. Res., 26, 1509–1516, https://doi.org/10.1029/WR026i007p01509, 1990.
Pallandt, M. M. T. A., Kumar, J., Mauritz, M., Schuur, E. A. G., Virkkala, A.-M., Celis, G., Hoffman, F. M., and Göckede, M.: Representativeness assessment of the pan-Arctic eddy covariance site network and optimized future enhancements, Biogeosciences, 19, 559–583, https://doi.org/10.5194/bg-19-559-2022, 2022.
Pastorello, G., Trotta, C., Canfora, E., et al.: The FLUXNET2015 dataset and the ONEFlux processing pipeline for eddy covariance data, Sci. Data, 7, 225, https://doi.org/10.1038/s41597-020-0534-3, 2020.
Pedron, S., Jespersen, R., Xu, X., Khazindar, Y., Welker, J., and Czimczik, C.: More Snow Accelerates Legacy Carbon Emissions From Arctic Permafrost, AGU Adv., 4, e2023AV000942, https://doi.org/10.1029/2023AV000942, 2023.
Pirk, N., Santos, T., Gustafson, C., Johansson, A., Tufvesson, F., Tamstorf, Parmentier, F.-J., Mastepanov, M., and Christensen, T.: Methane emission bursts from permafrost environments during autumn freeze-in: New insights from ground-penetrating radar, Geophys. Res. Lett., 42, 6732–6738, https://doi.org/10.1002/2015GL065034, 2015.
Pirk, N., Tamstorf, M., Lund, M., Mastepanov, M., Pedersen, S., Myllus, M., Parmentier, F.-J., Christiansen, H., and Christensen, T.: Snowpack fluxes of methane and carbon dioxide from high Arctic tundra, Biogeosciences, 121, 2886–2900, https://doi.org/10.1002/2016JG003486, 2016.
Ponomarenko, S., McLennan, D., Pouliot, D., and Wagner, J.: High Resolution Mapping of Tundra Ecosystems on Victoria Island, Nunavut – Application of a Standardized Terrestrial Ecosystem Classification, Can. J. Remote Sens., 45, 551–571, https://doi.org/10.1080/07038992.2019.1682980, 2019.
Potapov, P., Hansen, M., Stehman, S., Loveland, T., and Pittman, K.: Combining MODIS and Landsat imagery to estimate and map boreal forest cover loss, Remote Sens. Environ., 112, 3708–3719, https://doi.org/10.1016/j.rse.2008.05.006, 2008.
Prince, M., Roy, A., Royer, A., and Langlois, A.: Timing and spatial variability of fall soil freezing in boreal forest and its effect on SMAP L-band radiometer measurements, Remote Sens. Environ., 231, 111230, https://doi.org/10.1016/j.rse.2019.111230, 2019.
Proksch, M., Rutter, N., Fierz, C., and Schneebeli, M.: Intercomparison of snow density measurements: bias, precision, and vertical resolution, The Cryosphere, 10, 371–384, https://doi.org/10.5194/tc-10-371-2016, 2016.
Rantanen, M., Karpechko, A. Y., Lipponen, A., Nordling, K., Hyvärinen, O., Ruosteenoja, K., Vihma, T., and Laaksonen, A.: The Arctic has warmed nearly four times faster than the globe since 1979, Commun. Earth Environ., 3, 1–10, https://doi.org/10.1038/s43247-022-00498-3, 2022.
Ravn, N., Elberling, B., and Michelsen, A.: Arctic soil carbon turnover controlled by experimental snow addition, summer warming and shrub removal, Soil Biol. Biochem., 142, 107698, https://doi.org/10.1016/j.soilbio.2019.107698, 2020.
Royer, A., Dominé, F., Roy, A., Langlois, A., Marchand, N., and Davesne, G.: New northern snowpack classification linked to vegetation cover on a latitudinal mega-transect across northeastern Canada, Écoscience, 28, 225–242, https://doi.org/10.1080/11956860.2021.1898775, 2021.
Schuur, E., McGuire, A., Schädel, C., Grosse, G., Harden, J., Hayes, D., Hugelius, G., Koven, C., Kuhry, P., Lawrence, D., Natali, S., Olefeldt, D., Romanovsky, V., Schaefer, K., Turetsky, M., Treat, C., and Vonk, J.: Climate change and the permafrost carbon feedback, Nature, 520, 171–179, https://doi.org/10.1038/nature14338, 2015.
Seiler, C., Melton, J. R., Arora, V. K., and Wang, L.: CLASSIC v1.0: the open-source community successor to the Canadian Land Surface Scheme (CLASS) and the Canadian Terrestrial Ecosystem Model (CTEM) – Part 2: Global benchmarking, Geosci. Model Dev., 14, 2371–2417, https://doi.org/10.5194/gmd-14-2371-2021, 2021.
Seok, B., Helmig, D., Williams, M., Liptzin, D., Chowanski, K., and Hueber, J.: An automated system for continuous measurements of trace gas fluxes through snow: an evaluation of the gas diffusion method at a subalpine forest site, Niwot Ridge, Colorado, Biogeochemistry, 95, 95–113, https://doi.org/10.1007/s10533-009-9302-3, 2009.
Sepaskhah, A., Tabarzad, A., and Fooladmand, H.: Physical and empirical models for estimation of specific surface area of soils, Arch. Agron. Soil Sci., 56, 325–335, https://doi.org/10.1080/03650340903099676, 2010.
Slater, A. G., Lawrence, D. M., and Koven, C. D.: Process-level model evaluation: a snow and heat transfer metric, The Cryosphere, 11, 989–996, https://doi.org/10.5194/tc-11-989-2017, 2017.
Sommerfeld, R., Mosier, A., and Musselman, R.: CO2, CH4 and N2O flux through a Wyoming snowpack and implications for global budgets, Nature, 361, 140–142, https://doi.org/10.1038/361140a0, 1993.
Sommerfeld, R., Massman, W., Musselman, R., and Mosier, A.: Diffusional flux of CO2 through snow: spatial and temporal variability among alpine–subalpine sites, Global Biogeochem. Cy., 10, 473–482, https://doi.org/10.1029/96GB01610, 1996.
Steponavičienė, V., Bogužas, V., Sinkevičienė, A., Skinulienė, L., Vaisvalavičius, R., and Sinkevičius, A.: Soil Water Capacity, Pore Size Distribution, and CO2 Emission in Different Soil Tillage Systems and Straw Retention, Plants, 11, 614, https://doi.org/10.3390/plants11050614, 2022.
Strobl, C., Boulesteix, A.-L., Kneib, T., Augustin, T., and Zeileis, A.: Conditional variable importance for random forests, BMC Bioinformatics, 9, 307, https://doi.org/10.1186/1471-2105-9-307, 2008.
Sturm, M., Schimel, J., Michaelson, G., Welker, J., Oberbauer, S., Liston, G., Fahnestock, J., and Romanovsky, V.: Winter biological processes could help convert arctic tundra to shrubland, Bioscience, 55, 17–26, https://doi.org/10.1641/0006-3568(2005)055[0017:WBPCHC]2.0.CO;2, 2005.
Subke, J., Kutzbach, L., and Risk, D.: Soil Chamber Measurements, in: Springer Handbook of Atmospheric Measurements, Springer Nature Switzerland AG, Cham, Switzerland, 1806 pp., https://doi.org/10.1007/978-3-030-52171-4_60, 2021.
Tao, J., Zhu, Q., Riley, W. J., and Neumann, R. B.: Improved ELMv1-ECA simulations of zero-curtain periods and cold-season CH4 and CO2 emissions at Alaskan Arctic tundra sites, The Cryosphere, 15, 5281–5307, https://doi.org/10.5194/tc-15-5281-2021, 2021.
Tarnocai, C., Canadell, J., Schuur, E., Kuhry, P., Mazhitova, G., and Zimov, S.: Soil organic carbon pools in the northern circumpolar permafrost region, Global Biogeochem. Cy., 23, GB2023, https://doi.org/10.1029/2008GB003327, 2009.
Taylor, J. R.: An Introduction to Error Analysis: The Study of Uncertainties in Physical Measurements, 2nd edn., University Science Books, Sausalito, United States, 343 pp., ISBN-10 093570275X, 1997.
Tei, S. and Sugimoto, A.: Excessive positive response of model-simulated land net primary production to climate changes over circumboreal forests, Plant-Environment Interactions, 1, 102–121, https://doi.org/10.1002/pei3.10025, 2020.
Throop, J., Lewkowicz, A., and Smith, S.: Climate and ground temperature relations at sites across the continuous and discontinuous permafrost zones, northern Canada, Can. J. Earth Sci., 49, 865–876, https://doi.org/10.1139/e11-075, 2012.
van Huissteden, J. and Dolman, A.: Soil carbon in the Arctic and the permafrost carbon feedback, Curr. Opin. Env. Sust., 4, 545–551, https://doi.org/10.1016/j.cosust.2012.09.008, 2012.
Virkkala, A.-M., Aalto, J., Rogers, B., Tagesson, T., Treat, C., Natali, S., Watts, J., Potter, S., Lehtonen, A., Mauritz, M., Schuur, E., Kochendorfer, J., Zona, D., Oechel, W., Kobayashi, H., Humphreys, E., Goeckede, M., Iwata, H., Lafleur, P., Euskirchen, E., Bokhorst, S., Marushchak, M., Martikainen, P., Elberling, B., Voigt, C., Biasi, C., Sonnentag, O., Parmentier, F.-J., Ueyama, M., Celis, G., St.Louis, V., Emmerton, C., Peichl, M., Chi, J., Järveoja, J., Nilsson, M., Oberbauer, S., Torn, M., Park, S.-J., Dolman, H., Mammarella, I., Chae, N., Poyatos, R., López-Blanco, E., Christensen, T., Kwon, M., Sachs, T., Holl, D., and Luoto, M.: Statistical upscaling of ecosystem CO2 fluxes across the terrestrial tundra and boreal domain: Regional patterns and uncertainties, Global Change Biol., 27, 4040–4059, https://doi.org/10.1111/gcb.15659, 2021.
Virkkala, A.-M., Natali, S. M., Rogers, B. M., Watts, J. D., Savage, K., Connon, S. J., Mauritz, M., Schuur, E. A. G., Peter, D., Minions, C., Nojeim, J., Commane, R., Emmerton, C. A., Goeckede, M., Helbig, M., Holl, D., Iwata, H., Kobayashi, H., Kolari, P., López-Blanco, E., Marushchak, M. E., Mastepanov, M., Merbold, L., Parmentier, F.-J. W., Peichl, M., Sachs, T., Sonnentag, O., Ueyama, M., Voigt, C., Aurela, M., Boike, J., Celis, G., Chae, N., Christensen, T. R., Bret-Harte, M. S., Dengel, S., Dolman, H., Edgar, C. W., Elberling, B., Euskirchen, E., Grelle, A., Hatakka, J., Humphreys, E., Järveoja, J., Kotani, A., Kutzbach, L., Laurila, T., Lohila, A., Mammarella, I., Matsuura, Y., Meyer, G., Nilsson, M. B., Oberbauer, S. F., Park, S.-J., Petrov, R., Prokushkin, A. S., Schulze, C., St. Louis, V. L., Tuittila, E.-S., Tuovinen, J.-P., Quinton, W., Varlagin, A., Zona, D., and Zyryanov, V. I.: The ABCflux database: Arctic–boreal CO2 flux observations and ancillary information aggregated to monthly time steps across terrestrial ecosystems, Earth Syst. Sci. Data, 14, 179–208, https://doi.org/10.5194/essd-14-179-2022, 2022.
Virtanen, T. and Ek, M.: The fragmented nature of tundra landscape, Int. J. Appl. Earth Obs., 27, 4–12, https://doi.org/10.1016/j.jag.2013.05.010, 2014.
Wang, T., Ciais, P., Piao, S. L., Ottlé, C., Brender, P., Maignan, F., Arain, A., Cescatti, A., Gianelle, D., Gough, C., Gu, L., Lafleur, P., Laurila, T., Marcolla, B., Margolis, H., Montagnani, L., Moors, E., Saigusa, N., Vesala, T., Wohlfahrt, G., Koven, C., Black, A., Dellwik, E., Don, A., Hollinger, D., Knohl, A., Monson, R., Munger, J., Suyker, A., Varlagin, A., and Verma, S.: Controls on winter ecosystem respiration in temperate and boreal ecosystems, Biogeosciences, 8, 2009–2025, https://doi.org/10.5194/bg-8-2009-2011, 2011.
Wieder, W., Sulman, B., Hartman, M., Koven, C., and Bardford, M.: Arctic Soil Governs Whether Climate Change Drives Global Losses or Gains in Soil Carbon, Geophys. Res. Lett., 46, 14486–14495, https://doi.org/10.1029/2019GL085543, 2019.
Wilcox, E. J., Keim, D., de Jong, T., Walker, B., Sonnentag, O., Sniderhan, A. E., Mann, P., and Marsh, P.: Tundra shrub expansion may amplify permafrost thaw by advancing snowmelt timing, Arct. Sci., 5, 202–217, https://doi.org/10.1139/as-2018-0028, 2019.
Webb, E., Schuur, E., Natali, S., Oken, K., Bracho, R., Krapek, J., Risk, D., and Nickerson, N.: Increased wintertime CO2 loss ass a result of sustained tundra warming, J. Geophys. Res.-Biogeo., 121, 249–265, https://doi.org/10.1002/2014JG002795, 2016.
Yi, Y., Kimball, J. S., Rawlins, M. A., Moghaddam, M., and Euskirchen, E. S.: The role of snow cover affecting boreal-arctic soil freeze–thaw and carbon dynamics, Biogeosciences, 12, 5811–5829, https://doi.org/10.5194/bg-12-5811-2015, 2015.
Yi, Y., Kimball, J. S., Chen, R. H., Moghaddam, M., and Miller, C. E.: Sensitivity of active-layer freezing process to snow cover in Arctic Alaska, The Cryosphere, 13, 197–218, https://doi.org/10.5194/tc-13-197-2019, 2019.
Yli-Halla, M., Lötjönen, T., Kekkonen, J., Virtanen, S., Marttila, H., Liimatainen, M., Saari, M., Mikkola, J., Suomela, R., and Joki-Tokola, E.: Thickness of peat influences the leaching of substances and greenhouse gas emissions from a cultivated organic soil, Sci. Total Environ., 806, 150499, https://doi.org/10.1016/j.scitotenv.2021.150499, 2022.
Zhang, L., Zhao, T., Jiang, L., and Zhao, K.: Estimate of Phase Transition Water Content in Freeze–Thaw Process Using Microwave Radiometer, IEEE T. Geosci. Remote, 48, 4248–4255, https://doi.org/10.1109/TGRS.2010.2051158, 2010.
Zhu, C., Nakayama, M., and Inouey, H. Y.: Continuous measurement of CO2 flux through the snowpack in a dwarf bamboo ecosystem on Rishiri Island, Hokkaido, Japan, Polar Sci., 8, 218–231, https://doi.org/10.1016/j.polar.2014.04.003, 2014.