the Creative Commons Attribution 4.0 License.
the Creative Commons Attribution 4.0 License.
 | 06 Feb 2023
Effect of land-use legacy on the future carbon sink for the conterminous US
Benjamin S. Felzer
Modeling the effects of the terrestrial carbon sink in the future depends upon not just current-day land use and land cover (LULC) but also the legacy of past LULC change (LULCC), which is often not considered. The age distribution of trees in the forest depends upon the history of past disturbances, while the nutrients in the soil depend upon past LULC. Thus, establishing the correct initial state of the vegetation and soil is crucial to model accurately the effect of biogeochemical cycling with environmental change in the future. This study models the effects of LULCC from 1750 to 2014 using the land-use harmonization dataset (LUH2) of land-use transitions with the terrestrial ecosystems model (TEM) for the conterminous US. Modeled LULC include plant functional types (PFTs) of potential vegetation, as well as managed cropland, pastureland, and urban areas. LULCC is treated using a cohort approach, in which a separate cohort occurs every year there is a land-use transition, thereby ensuring proper age structure of forests and regrowth with the correct soil nutrients. From 2000–2014 the modeled net ecosystem productivity (NEP) is 989 TgC yr−1 for the conterminous US but only −15 TgC yr−1 if accounting for carbon lost from land-use transitions and management.
The hypothesis is that the initial state of the vegetation and soils significantly affects the future state of the terrestrial carbon sink. In this study, LULC remains constant in the future, with the NCAR CCSM4 RCP8.5 climate used to force the TEM-Hydro model. The following experiments are run from 2015 to 2100, including (a) restarting from existing cohorts in 2014 (RESTART), (b) reinitializing in 2015 based on condensing the cohorts for each PFT into a single cohort (CONDENSED), and (c) restarting from average cohort conditions for each PFT (AVERAGE). The NEP is too low when using condensed cohorts without reinitializing due to a larger increase in heterotrophic respiration (Rh) resulting from the assumption of mature forests. The carbon stocks are larger than using all the cohorts if condensed cohorts are reinitialized due to the assumption of mature, equilibrated forests. Where nitrogen-limited, forest regrowth is enhanced if regrowth starts from more nutrient-rich conditions. Water fluxes are dominated by environmental factors but can be slightly dependent upon the underlying carbon dynamics. It is therefore necessary to account for past disturbances when modeling future changes in carbon dynamics.
Please read the corrigendum first before continuing.
-
Notice on corrigendum
The requested paper has a corresponding corrigendum published. Please read the corrigendum first before downloading the article.
-
Article
(3145 KB)
- Corrigendum
-
Supplement
(696 KB)
-
The requested paper has a corresponding corrigendum published. Please read the corrigendum first before downloading the article.
- Article
(3145 KB) - Full-text XML
- Corrigendum
-
Supplement
(696 KB) - BibTeX
- EndNote


Globally, during the 21st century, land use and land cover change (LULCC) has accounted for 14 % of the total anthropogenic carbon emissions (Friedlingstein et al., 2020). LULCC has been responsible for the largest losses of carbon from the land in the conterminous US since the 1700s, with growth enhancements from CO2 fertilization and nitrogen deposition only partially countering this loss since the 1950s (Felzer and Jiang, 2018). Reforestation and afforestation have been the primary drivers for this enhanced sink (Kondo et al., 2018), especially growing back with rising CO2 levels (Strassmann et al., 2008). This paper addresses the question of the role of land legacy in the future carbon sink in conterminous US. How inappropriate is it to initialize a model with current-day land use and land cover (LULC) for a 21st century simulation, which avoids the disturbance history and forest recovery from the 20th century and earlier?
Many modeling studies have been conducted to explore the role of LULCC relative to other environmental factors like CO2 fertilization, N deposition, and ozone both historically and into the future. For example, studies have shown LULCC to be the most important cause of reduced carbon inventory in the future due to loss of forest (Mahowald et al., 2017), while CO2 fertilization increases the sink (Tharammal et al., 2019). Reforestation, including regrowth from timber harvest, and avoided deforestation can increase the carbon sink in the future (Arneth et al., 2017; Zhao et al., 2013). Remotely sensed data from 1973–2010 have shown that both reduced forest area and older forest age have contributed to a reduced C sink in the conterminous US (Sleeter et al., 2018). Legacy carbon fluxes from deforestation can be in the form of emissions from dead biomass, soils, and forest products, or uptake in regrowing secondary forests (Houghton et al., 2012).
Only a few models (e.g., Felzer and Jiang, 2018; Shevliakova et al., 2009) have included forest demography to accurately track the effects of disturbance in regrowing forests. Krause et al. (2020) showed that including land legacy effects increases future carbon storage as ecosystems regrow and adapt to higher levels of CO2 and N deposition. Since ecosystems are not in equilibration with current-day land use, there will be continued carbon uptake even if climate change and land use are held constant, due to regrowth from abandoned agriculture and CO2 fertilization (Krause et al., 2019). Pugh et al. (2019) surmised that there will be a large carbon sink from regrowth in the future regardless of environmental change as long as current disturbance rates continue at historical levels. Lu et al. (2015) found that using corrected forest inventory analysis (FIA) data (Pan et al., 2011) applied to a dataset of annual land-use transitions (Hurtt et al., 2011) nearly doubled the carbon sink due to younger forests in the corrected data. Thom et al. (2018) point out that it is important to develop initial conditions to account for past disturbance in order to capture the observed state. This idea is tested in the current study by determining the difference in future carbon sink between initial conditions that do capture disturbance since 1750 and reinitialized initial conditions.
Two factors that determine the carbon sink strength of regrowing forests are the stand age distribution of the trees in the forest and the nutrient levels of the soil. The age distribution depends upon the timing and magnitude of past disturbances. Soil nutrient conditions depend upon the prior history of land use and management. Several studies show that forests regrowing from nutrient-rich fertilized agricultural land exhibit less resilience for climate change but higher growth rates. European beech trees on former agricultural land had lower C:N and higher P, which resulted in less carbon allocation to roots, reducing resilience to drought (Mausolf et al., 2018). Similarly, Von Ohemib et al. (2014) found these same changes led to higher tree ring width due to more litter decomposition and higher N mineralization rates, as well as reduced resiliency. In terms of net ecosystem productivity (NEP), reforestation sites exhibited reduced NEP due to loss of carbon from the forest floor or soils during early recovery (Pan et al., 2011) but enhanced NEP in afforestation sites due to replacement of depleted pools (Post and Kwon, 2000).
This study explores the question of land legacy on the future carbon sink by comparing model simulations with full forest demography with those based on reinitializing initial conditions to the present. The analysis looks at both carbon fluxes and stocks to determine how these vary regionally and integrated over the entire conterminous US. It explores the role of forest stand age and soil nutrients in determining forest regrowth and tests the hypothesis that it is crucial to capture the effects of historical land legacy in order to accurately model the future carbon sink.
This study uses the terrestrial ecosystems model-Hydro version 2 to explore the role of historical land-use legacy (from 1750 to 2014) on future (2014–2099) carbon storage. The recent land-use harmonization (LUH2) version of land-use transitions (Hurtt et al., 2020) is used to reconstruct the full cohort of LULCC since 1750, while LULC is kept constant for the 21st century. Three sets of experiments explore the role of fully accounting for past land legacy, reinitializing initial conditions and not accounting for land legacy at all, and initial conditions based on averaging the final state of the full cohorts in 2014 to determine if corrected initial conditions are sufficient.
2.1 Model description
The terrestrial ecosystems model version Hydro (TEM-Hydro – Felzer, 2012; Felzer et al., 2009, 2011) is a fully prognostic biogeochemical model of carbon, nitrogen, and water dynamics between vegetation and soils. A complete description of the model can be found in Felzer et al. (2009, 2011) and Felzer (2012). The model structure is illustrated in summary figures (Fig. S1a in the Supplement) along with how human disturbance is treated, which is relevant to this paper (Fig. S1b). A cohort approach is developed to convert a dataset of land-use transitions (Hurtt et al., 2011, 2020) to annual cohorts of land use and land cover change (Hayes et al., 2011; Lu et al., 2015), whose purpose is to retain the soil characteristics of the cohort from which disturbance occurred and maintain appropriate growth and stand age of newly developed cohorts (Fig. S2a). This approach involves first using the LUH2 dataset to establish the fractional land cover type at the starting year of 1750. The primary and secondary vegetation are replaced with their potential vegetation values (as described in Raich et al., 1991), while other managed lands include croplands, pasturelands, and urban, with the multiple types of crops and pastures combined into single values for each, respectively. Disturbances (including timber harvest) involve the creation of new cohorts, with the corresponding area adjusted from the original cohort. Therefore, soil nutrients and forest stand age are tracked separately for each disturbance. The outputs are then area-weighted for each of the cohorts. Since this approach tracks each cohort separately, it is possible to end up with thousands of cohorts for a single grid cell by 2014. A complete description of this approach can be found in Felzer and Jiang (2018). New to this study is that the initial vegetation is started in 1750 (consistent with Allan et al. (2021) baseline period), and subsequent transitions were determined until 2014 (Fig. S2b, c, d, e) to align with the temporal range of climate datasets. The result for a single grid cell is usually hundreds of cohorts by the year 2014, accounting for all transitions between primary and secondary vegetation, cropland, pastureland, and urban areas, as well as timber harvest.
The partitioning of disturbance products and fluxes for agriculture and timber harvest and management practices and calibration are described in Felzer and Jiang (2018). In this study both croplands and turf lawn (urban) are fertilized (using the approach taken in Felzer et al. (2018), while no additional fertilization (beyond that provided by livestock) is applied to pasture. A few additional modifications were made for this study. Irrigation was added to arid croplands, because inorganic nitrogen was accumulating due to lack of leaching. The same scheme as used in Felzer (2012) for turf lawn was applied to croplands receiving less than 200 mm of water per month during the growing season. The other change applies to abandoned cropland. Cropland abandoned before there was major chemical fertilization in the 1960s was too nutrient depleted in the model, and the forest regrowth occurred with reduced biomass, so 15 gN m2 per month during the year of disturbance was added following crop abandonment to ensure at least limited forest regrowth.
2.2 Experimental design
Six simulations (Table 1) were designed to determine the effect of land legacy. The HISTORICAL run applies the full cohorts from 1750 to 2014, allowing for the Hurtt et al. (2020) record of LULCC as described in the Methods. The HISTCONST run is the HISTORICAL run but with LULC held constant at 2014 value, so includes other effects related to climate, CO2, N deposition, and ozone. Therefore the difference between HISTORICAL and HISTCONST is the effect of LULCC. The HISTCOND run is a transient run like HISTORICAL except that the plant functional types (PFTs) are condensed to a single cohort for each PFT in a given year. It is essentially the fractional land cover per year, so the difference between HISTORICAL and HISTCONST illustrates the effect of forest demography. Because multiple land-use transitions are incorporated into single cohorts, it is not possible to accurately incorporate the true disturbance, so conversion and product fluxes results from land-use change are not included in this run. The RESTART run uses restart files from the full suite of cohorts in 2014 to run from 2015 to 2099, keeping LULC constant with the 2014 cohorts. This run is essentially just a continuation of the HISTORICAL run. The CONDENSED run reinitializes (i.e., reequilibrates) a condensed version of the cohorts in 2014 to provide initial conditions for the 2015 to 2099 period. In this run, the 2014 cohorts are condensed to a single cohort for each PFT (with primary and secondary of the original PFT tracked separately), with the fractional areas determined based on the 2014 cohorts. These condensed cohorts are then each reequilibrated at the start. The TEMRESTART run uses a restart file for 2014 that is based on the average of the restart conditions for each of the cohorts, and then uses the condensed cohorts for the 2015 to 2099 period. Thus, the TEMRESTART run uses the same number of cohorts as the CONDENSED run but does not reequilibrate at the start. So both the CONDENSED and TEMRESTART runs used the simplified, condensed cohorts, but start with different initial conditions. The motivation for these two condensed-PFT runs is to reduce computational time by eliminating the need to run potentially thousands of land-use legacy cohorts for each grid when starting from present-day conditions. The difference between the RESTART and CONDENSED runs shows the effect of including land legacy on future carbon dynamics. Note that the RESTART run will also incorporate effects of changing climate, CO2, ozone, N deposition, and fertilization, which cannot be captured in the CONDENSED run. The TEMRESTART run shows if it is possible to condense the initial conditions from a full suite of cohorts to produce the same results as the RESTART run.
Table 1Model experiments.
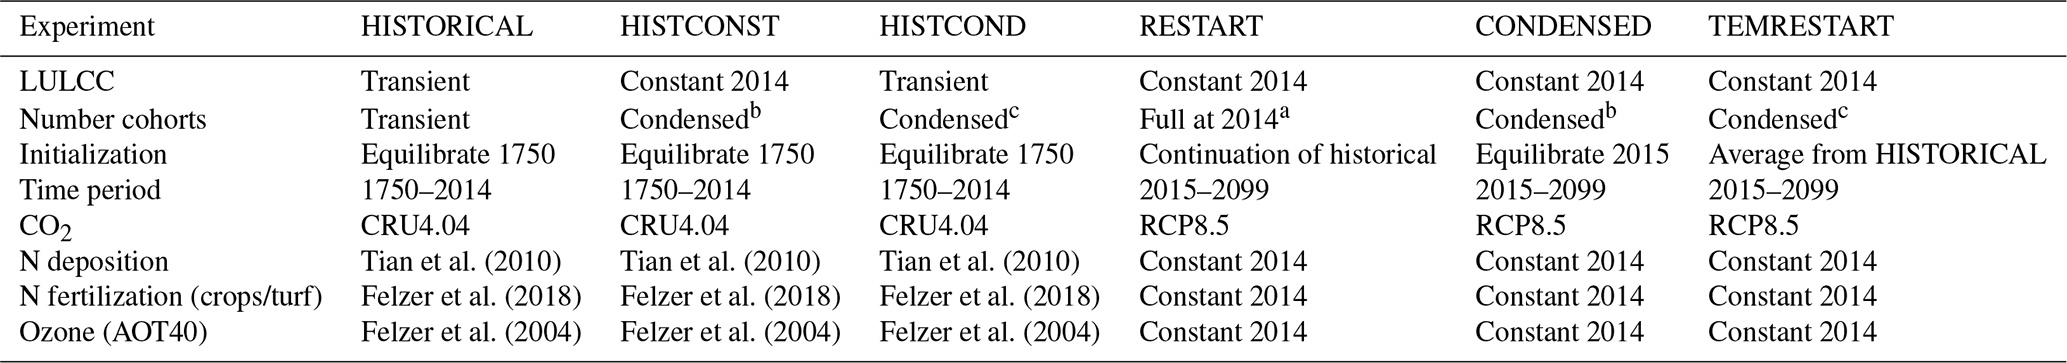
a Maximum cohorts for a grid in 2014 is 1020. b Maximum cohorts for a grid is 7 because primary vegetation is treated separately from secondary. c Maximum cohorts for a grid is 5 (e.g., mixed potential vegetation with two cohorts, cropland, pasture, urban).
The model is run monthly at a spatial resolution of . Input datasets include transient climate (surface air temperature, diurnal temperature range, precipitation, fractional cloud cover to derive net irradiance at the surface and photosynthetically active radiation (PAR), vapor pressure), climatological wind speed (as in Felzer et al., 2011), and annual atmospheric CO2 from 1901–2014 based on CRU4.04 (Harris et al., 2014). Gridded transient climate data are not available prior to 1901, so climate variables from 1750–1849 are taken from the MPI-ESM-P past 1000-year simulation and 1850–1900 from the MPI-ESM-P historical simulation (Schmidt et al., 2014). The downscaling and bias correction is similar as to what was done in Felzer and Jiang (2018), but starting in 1750 instead of 1700, using the CRU4.04 data from 1901–1930. The resultant US mean climate from 1750 is shown in Fig. S3. Surface ozone (Felzer et al., 2004), nitrogen deposition (Tian et al., 2010), and soil texture and elevation datasets are similar to those used in Felzer et al. (2011).
The future climate data (2015–2099) are taken from the multivariate adaptive constructed analogs (MACA) statistically downscaled coupled model intercomparison project 5 (CMIP5) data (Abatzoglou and Brown, 2012), using the National Center for Atmospheric Research (NCAR) community climate system model version 4 (CCSM4) RCP8.5 emissions scenario (r6i1p1 ensemble). The downscaled resolution is at 4 km but has been extrapolated to the half-degree TEM grid for this study by averaging over all the 4 km values within the larger half-degree grid cell. Net irradiance is used instead of clouds for the future data. The TEM cloud scheme was adjusted for the historical cloud data to bias-correct to ensure continuity of net irradiance between the historical and future data. The CRU4.04 data do not include irradiance, which is why it was necessary to use clouds for the historical period, but since net irradiance is more directly used by the model, that was chosen for the future period. The results (Fig. S3) show a continuity for climate during the transition between the historical CRU4.04 and future RCP8.5 in 2014 for all the variables. Future RCP8.5 CO2 data are taken from CMIP5 recommendations (Meinshausen et al., 2011). The ozone and N deposition values are kept at their 2014 levels (which are held constant after 2000 for ozone).
The decision to base climate prior to 1900, prior to the gridded historical data, was made to capture more realistic climate variations during the period from 1750 to 1900, such as the Little Ice Age (LIA), which lasted through the 19th century (Bradley and Jonest, 1993; Mann, 2002). The temperature record from the MPI-ESM-P model does show signs of temperature climbing out of a cold peak after 1818 but remaining cool throughout the rest of the century (Fig. S3), which is consistent with Northern Hemisphere proxy records (Mann et al., 2008). Since this study is for the conterminous US, it does not show as strong an LIA signal as would be expected from records in the North Atlantic. The decision to then use historical CRU4.04 climate rather than modeled climate from 1901–2014 is to more accurately capture the true interannual variability, which would be entirely lost by using output from a climate model. All three datasets have been downscaled and bias corrected to produce a seamless record of climate from 1750–2099.
The model is initially calibrated for specific PFTs without disturbance, though with agricultural and urban management where necessary, to determine coefficients for the flux equations before extrapolation to the entire US. Note that each experiment is not calibrated individually. The HISTORICAL run is first equilibrated based on repeated use of the 1750–1779 climate in order to establish initial conditions of carbon and nitrogen stocks (which are required to numerically solve the fundamental model equations), and then the transient runs are started from 1750 to 2014. The CONDENSED run is first equilibrated based on repeated use of the 1986–2015 climate from the HISTORICAL run, and the transient runs are from 2015 to 2099. Results of NEP or net carbon exchange (NCE) fluxes are reported as TgC yr−1, while cumulative NCE, a measure of net carbon accumulation over some time periods, is reported as PgC. NCE is the NEP plus carbon lost through land-use conversion or by decomposition of agricultural or timber harvest products. Model input, forcing data, and output results are publicly available at https://doi.org/10.18275/2.
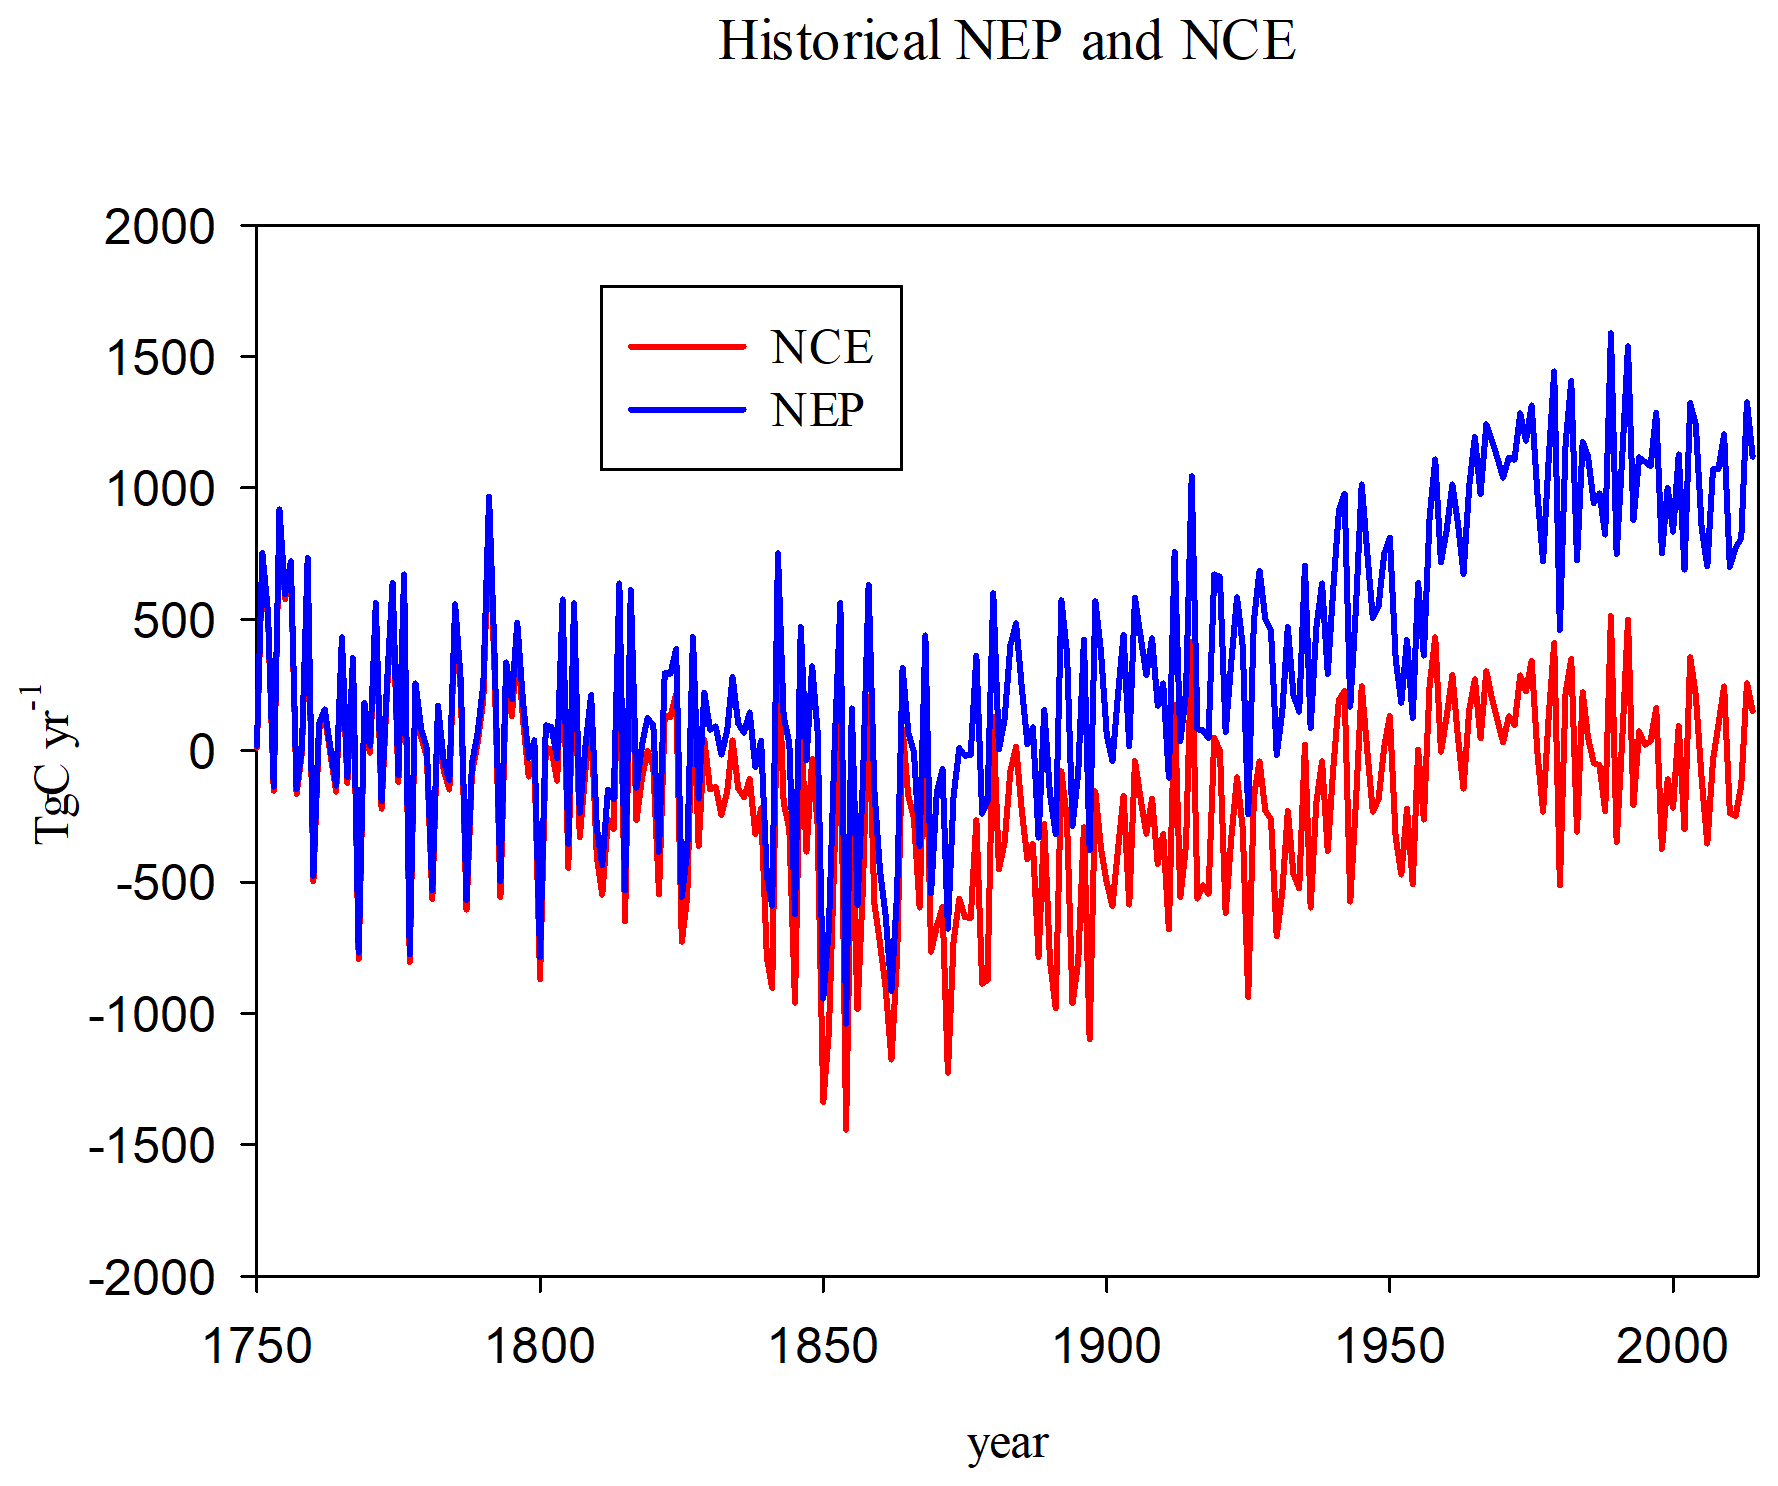
Figure 1Net carbon exchange (NCE) and net ecosystem productivity (NEP) for the HISTORICAL run. NCE includes fluxes from agricultural conversion and abandonment and decomposition of agricultural products.
The historical (1750–2014) NEP (from HISTORICAL) starts to increase in the 1870s (Fig. 1), consistent with the time period when CO2 levels start to increase and there is a slight warming, though there is also a decrease in precipitation during this period (Fig. S3). The separation of NCE from NEP signifies the results of LULCC, which become more pronounced after the 1850s when timber harvest begins and pasture and cropland increase at the expense of forest, pasture, and grassland (Fig. S2a). The cumulative NEP is 87 PgC, while the cumulative NCE is −42 PgC. So climate and CO2 conditions cause the land to be a net carbon sink, but LULCC makes the land a net carbon source.
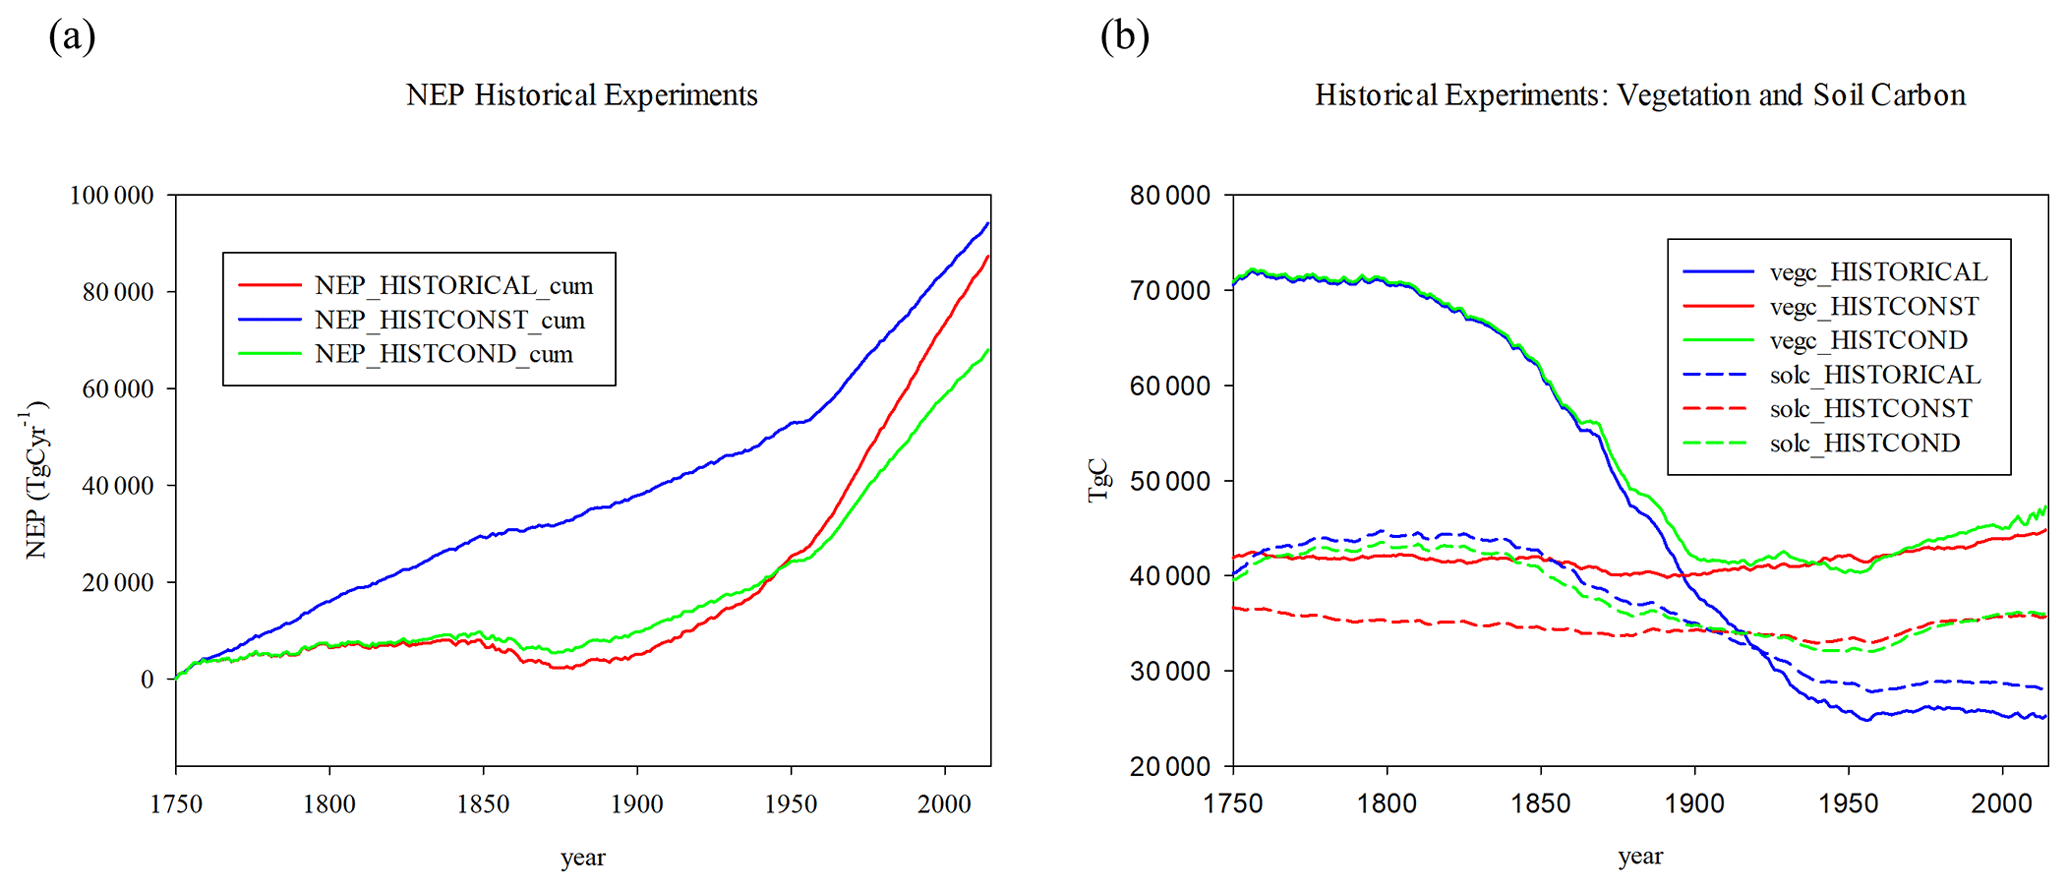
Figure 2Historical experiments (a) cumulative NEP (TgC yr−1), (b) vegetation carbon (vegc), and soil carbon (solc) in TgC. Experiments are HISTORICAL, HISTCONST, and HISTCOND (see text).
The effect of including LULCC is evident in the difference between HISTORICAL and HISTCONST (Fig. 2). While the final cumulative NEP is close by the year 2014, the use of actual land-use transitions lowers the NEP, especially during the early years, consistent with the results of Felzer and Jiang (2018) that the effect of deforestation reduces the NEP, while the larger area of mature forest do not contribute much to positive NEP. The vegetation and soil carbon start out substantially higher in HISTORICAL, while without LULCC they remain relatively constant in HISTCONST, which shows the effects of the other environmental changes like climate, CO2, N deposition, and ozone. The HISTCOND compared to HISTORICAL shows that the inclusion of forest demography does increase the cumulative NEP by 2014 and lowers the vegetation and soil carbon estimates, as changing forest area is incorporated into existing forests rather than separate cohorts to allow for forest regrowth.

Figure 3Comparison of NEP and NEC between the RESTART, CONDENSED, and TEMRESTART runs; (a) NEP, (b) cumulative NEP, (c) NCE, and (d) cumulative NCE; (e) NEP, NCE comparison 2070–2099 means (error bars 1 standard deviation), (f) cumulative NEP, NCE comparison, 2070–2099 means (error bars 95 % confidence interval). ANOVA analysis for (d) and (e) based on P<0.05.
In the future runs, the RESTART run is considered the “actual” to validate the others against, as it is the run that includes effects of all the individual cohorts. The CONDENSED run is the effect of condensing all the cohorts to single PFTs and the TEMRESTART is the result of averaging the initial conditions for each of the cohorts in 2014. The NEP and NCE of the CONDENSED is lower than the RESTART and TEMRESTART, especially at the start of the runs (Fig. 3), because reinitializing each grid is based on the assumption of NEP as close to zero as possible. The cumulative result in 2099 is NEP of 76 PgC in the RESTART run, 80 PgC in the TEMRESTART, and 63 PgC in the CONDENSED. The cumulative NCE of the RESTART and TEMRESTART is close beyond the starting years, resulting in 20 and 18 PgC respectively, while it is lower (9.6 PgC) for the CONDENSED run. NCE still differs from NEP without LULCC because of crop decomposition, animal respiration, and crop residue fluxes. NCE of the RESTART and TEMRESTART runs are much lower than NEP of those runs because of product decomposition left over from the HISTORICAL run. By the end of the century there are no significant differences in the annual carbon fluxes, but the condensed run has significantly lower cumulative NEP and NCE than the other runs (Fig. 3e, f). These results show that averaging the initial conditions is a good way to reduce cohort complexity. The mapped patterns (Fig. 4) show that large positive NEP differences between the CONDENSED and RESTART runs occur in the upper Midwest and central California, which are dominated by cropland (Fig. S2b). This results from the reinitialization process in which the net primary productivity (NPP) of cropland starts out larger than after, accounting for transient conditions. Forested areas in the southeast are lower NEP in the CONDENSED, which would be expected of more mature forests. Differences in the rest of the country are minor. The largest differences in NCE are the negative differences in the southeast corresponding to the NEP differences there. The lower NEP in the CONDENSED run is the result of larger heterotrophic respiration (Rh) more than offsetting slightly larger NPP. Since NEP is the difference between NPP and Rh, the net effect is a negative bias in NEP (Fig. 5).
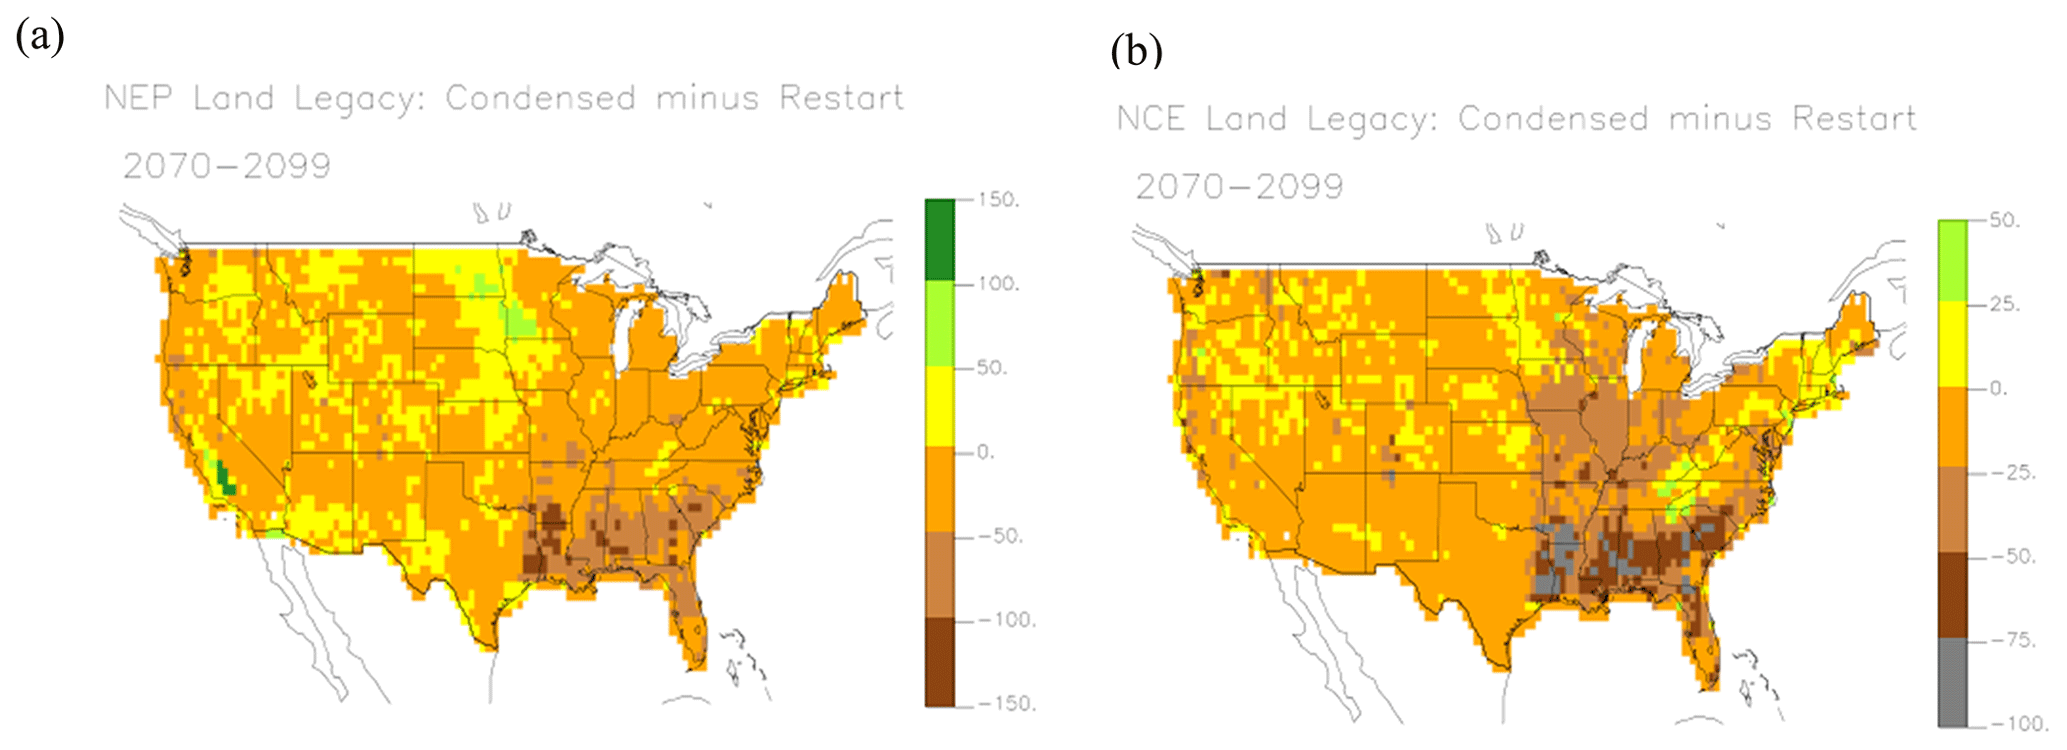
Figure 4Mapped differences in NEP and NCE, illustrating effect of land legacy as difference between the CONDENSED and RESTART runs, (a) NEP (−164 to 198 gC m−2 yr−1), (b) NCE (−164 to 55 gC m−2 yr−1).
While the more mature forests in CONDENSED would be expected to have lower NEP (Besnard et al., 2018; He et al., 2012), they would also have more biomass. By the end of the century regrowing forests in the RESTART run will still be younger than those in CONDENSED run, and 85 years is not enough time to reach full equilibration in the model. The CONDENSED vegetation carbon is 14 % higher than the RESTART value by the year 2099, while the TEMRESTART is only 5 % higher (Fig. 6). The larger values in the CONDENSED run are due to the fact that the larger percentage of mature trees (since all trees are considered mature in the CONDENSED run) result in much more biomass. Starting with averaged initial conditions lowers the vegetation carbon so that it is close to that of using the full cohorts. The soil carbon is 31 % higher in the CONDENSED run, while differences are minimal with the TEMRESTART run (Fig. 6). Note that the absolute differences are larger with vegetation carbon, while the percent differences are more similar since the soil carbon has lower absolute values. The mapped pattern of vegetation carbon differences between the CONDENSED and RESTART runs (Fig. 7a) shows that the large positive bias results almost entirely from the eastern half of the US, especially in the forested eastern portion, while the west exhibits smaller negative biases. The soil carbon differences (Fig. 7b) are more scattered, with largest positive biases along the East Coast and negative biases largest in the southwest US or Great Plains.
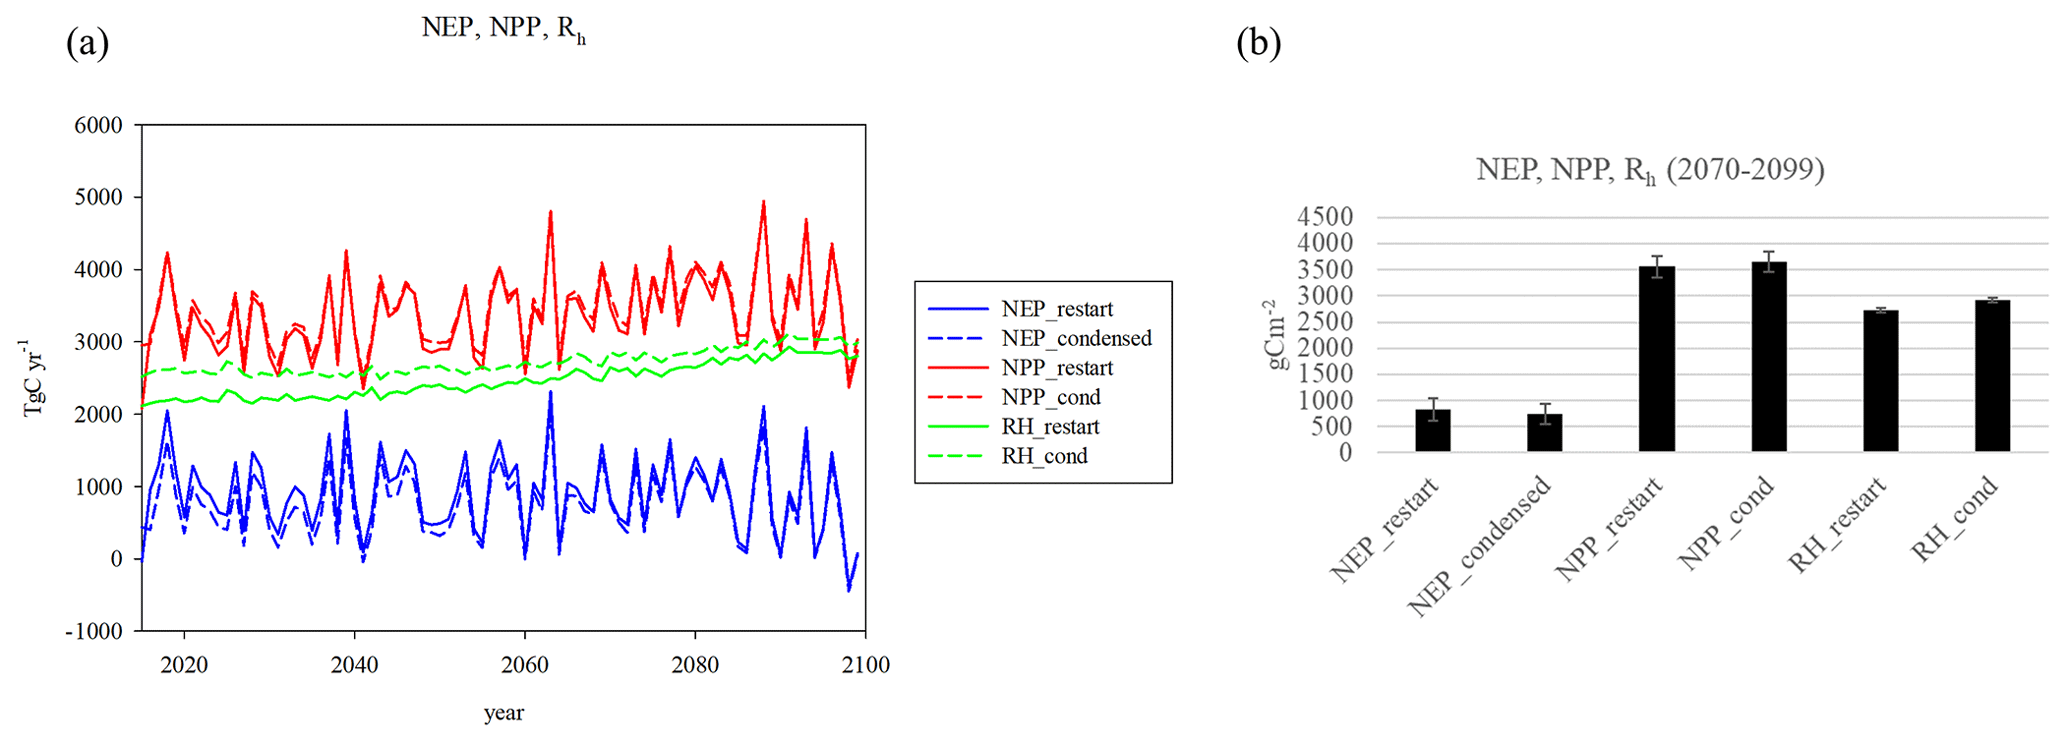
Figure 5(a) Carbon fluxes (NEP, NPP, Rh) for the RESTART and CONDENSED runs, (b) mean differences 2070–2099 (no significant differences for either of the three pairs).
The keys to these differences are the distribution of stand age in the forests and nutrients in the soil during regrowth. Forest stand age in 2014 at the start of the future runs (when there is no further disturbance) shows that while the largest bin of tree area is mature trees (>500 years old), the next largest class is young trees less than 11 years old, with a majority of tree area less than 71 years old, based on the disturbance history of the Hurtt et al. (2020) dataset (Fig. 8a). However, the majority of mature forests are in the western US. Most of the forests in the eastern US are under 30 years old (Figs. 8b, S4). The biomass is generally larger for the more mature categories (Fig. 9a, b). More mature trees are therefore more important to determining biomass than an even relatively large portions of younger trees. While biomass generally increases with stand age, NEP peaks between 11–30 years (Fig. 9c, d). When classifying vegetation carbon by PFT (Fig. 10a), the CONDENSED run values are larger than the RESTART values for boreal forest and temperature coniferous, deciduous, mixed, and broadleaved evergreen forests, as well as savanna (which is a mixture of grassland and trees). The NEP differences between CONDENSED and RESTART runs (Fig. 10b) show that NEP is generally lower in the CONDENSED runs since each cohort has been reinitialized at the start, but the interannual variability (IAV) is much larger than the differences.
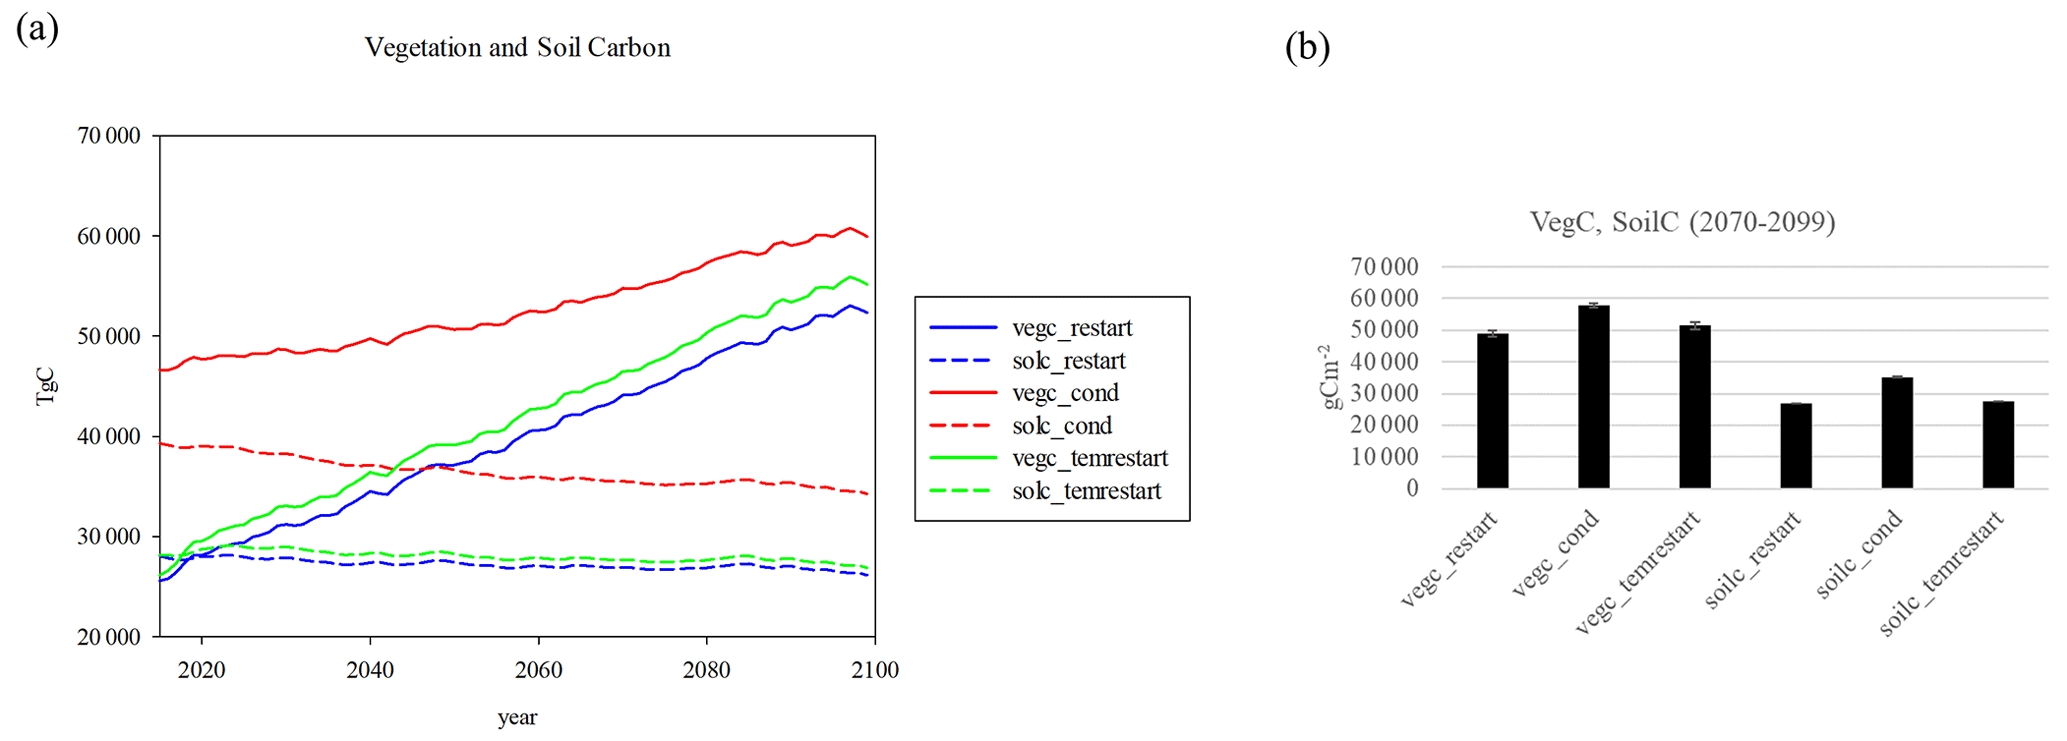
Figure 6(a) Vegetation and soil carbon in the RESTART, CONDENSED, and TEMRESTART experiments, (b) mean differences 2070–2099 (all three vegetation carbons and soil carbons differ significantly from each other).

Figure 7Mapped patterns in (a) vegetation (−14 350 to 13 146 gC m−2) and (b) soil carbon (−2489 to 9339 gC m−2) as differences between the CONDENSED and RESTART experiments.
The inorganic nitrogen in the soil is crucial for regrowth following disturbance. The dependence of available inorganic nitrogen following a disturbance on the final vegetation carbon by the year 2100 is generally a positive slope, but there is a lot of variability due to so many other factors affecting forest regrowth. Larger amounts of initial inorganic nitrogen generally lead to greater forest growth, as long as values are low enough to be limiting. There are also many cohorts that have low growth regardless of initial nitrogen levels, so they are limited by other climate or environmental factors. This is only true for the more mesic forests of the eastern US, where moisture is less limiting. The final amount of available inorganic nitrogen in 2100 will be compensated by the fact that mature forests provide more nutrients because of the greater litter but also use more nutrients due the higher biomass.
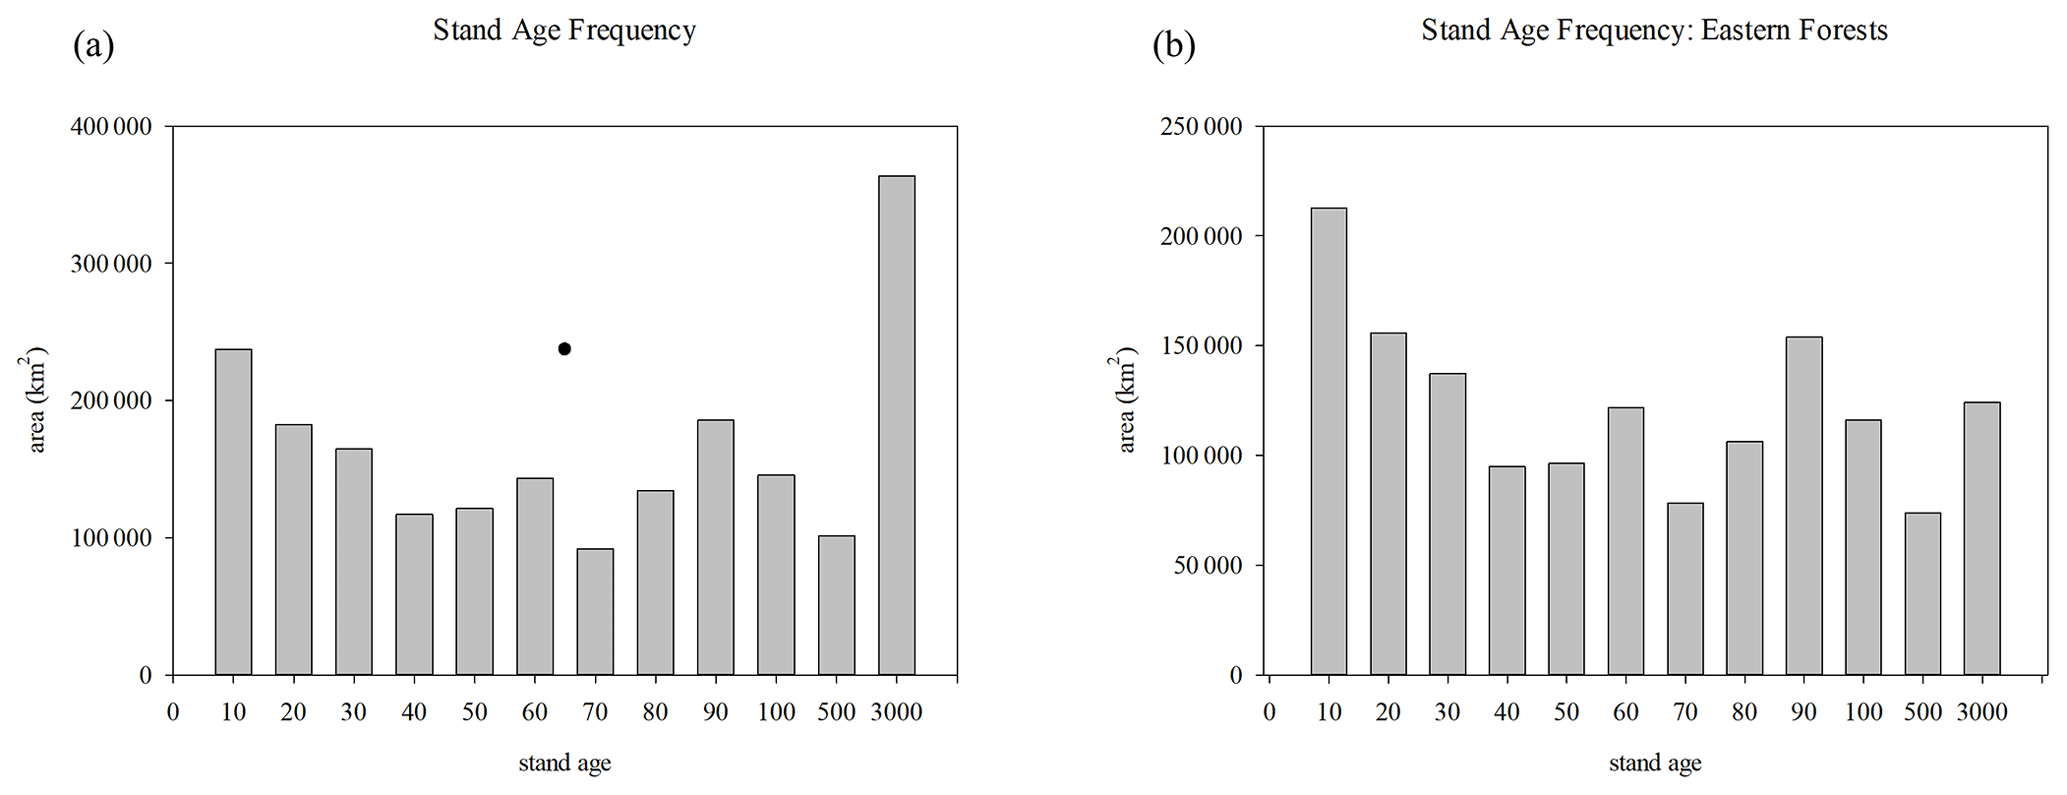
Figure 8(a) Stand-age frequency for US and (b) eastern forests. Bins represent 0–10, 11–20, 21–30, 31–40, 41–50, 51–60, 61–70, 71–80, 81–90, 91–100, 101–500, >500 years.
The soil moisture is based on a bucket model and accounts for the excess of precipitation over evapotranspiration, with runoff resulting if the bucket (whose capacity equals the difference between field capacity and wilting point) is overflowed. The soil moisture of the CONDENSED run over the last 30 years is not statistically different from RESTART, while the TEMRESTART, though higher, is not significantly different during that time period (Fig. 11a, d). The evapotranspiration flux of the CONDENSED run is too low compared to RESTART while it is too high in the TEMRESTART run, but the runoff fluxes are nearly identical between the three runs (Fig. 11b, c, e).
The measured stand age frequency in the US is given in Pan et al. (2011) for different regions of the US. The eastern regions are dominated by younger trees, the Rocky Mountains by more mature trees as well as a peak in very young trees, and the West Coast by more younger and mid-age trees. Lu et al. (2015), using a similar LULCC dataset as used here based on Hurtt et al. (2011) land-use transitions, specifically corrected that dataset to better represent the data from Pan et al. (2011). The resulting correction was younger forest stand ages in the eastern US after 1850, with overall younger stand ages in the conterminous US as a whole. In fact, the stand age distribution for the NE US before the correction (Fig. S2 in Lu et al., 2015) shows most forests as older than 70 years, whereas the Pan et al. (2011) data show that most forests are younger. The more recent land-use dataset developed from Hurtt et al. (2020) actually shows a majority of forests in the eastern US as less than 70 years old (Fig. 8), but for the conterminous US the frequency of mature forests is larger because of forests in the western US.
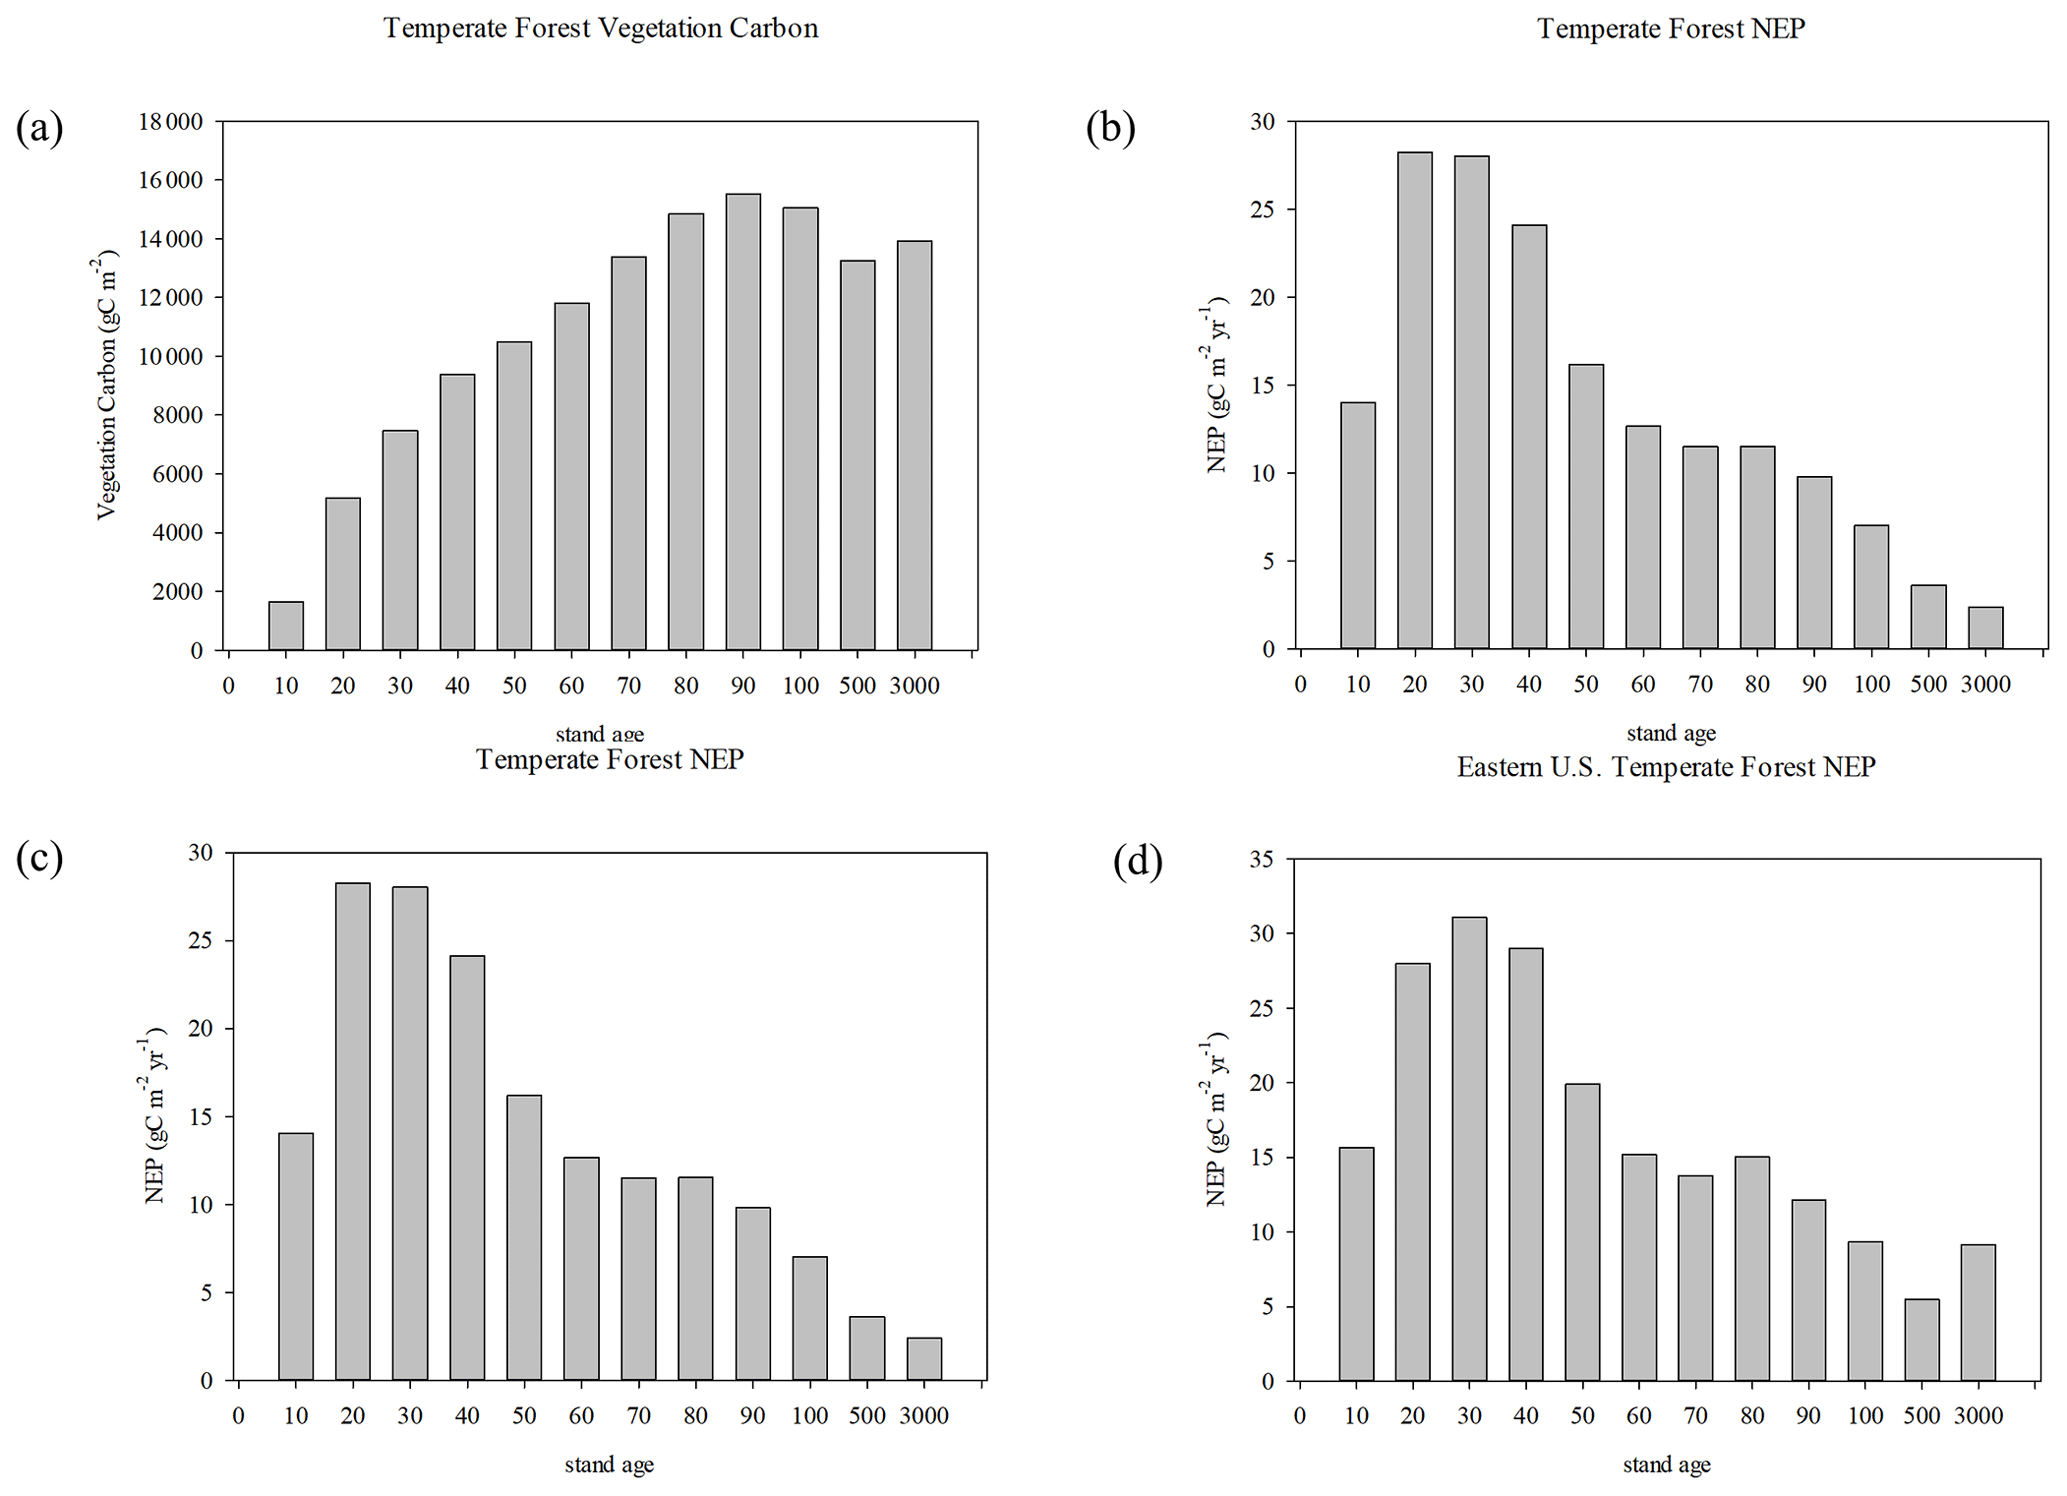
Figure 9Vegetation carbon in the year 2014 for (a) US and (b) eastern forests, and NEP in the year 2014 for (c) US and (d) eastern forests. Most trees are not mature, but the mature trees contain the most biomass so condensing the cohorts overestimate vegetation carbon.
Total biomass increases with age, such that more mature trees have higher amounts of vegetation carbon (Chapin Iii et al., 2011; Pan et al., 2002), consistent with the results presented here (Fig. 9a, b). The slight decrease in biomass for some of the more mature stand age classes can represent the differences between geographic areas in which different classes dominate, as biomass for similar trees will be larger under more favorable climate conditions. For example, more mature trees in intermountain forests in the western US may be expected to have less biomass than less mature trees in the more mesic eastern US. In the eastern US 101–500 year class, for example, the reduction in biomass is due to trees in the northeast (Fig. S5). Note that there is no explicit mortality modeled in TEM-Hydro, so biomass in mature forests is not decreasing because of increased mortality, which is another cause for reduced biomass in old stands (Xu et al., 2012). The mapped differences at the end of the 21st century (Figs. 4, 7) represent the aging of all forests in the experiments, so the age distribution in the RESTART run would be shifted upward by 70 years, so all the forests will be in the upper age categories in both RESTART and CONDENSED runs. Positive biomass differences in the eastern US (Fig 7a) may represent the even more mature status of the forests in the CONDENSED runs in that region. Forests in the CONDENSED run would be expected to have lower NEP since they are more mature, which is generally true of forests, especially in the southeast US (Fig. 4a), but by the end of the century all the forests have matured more in the RESTART run as well, so differences are more muted with time.
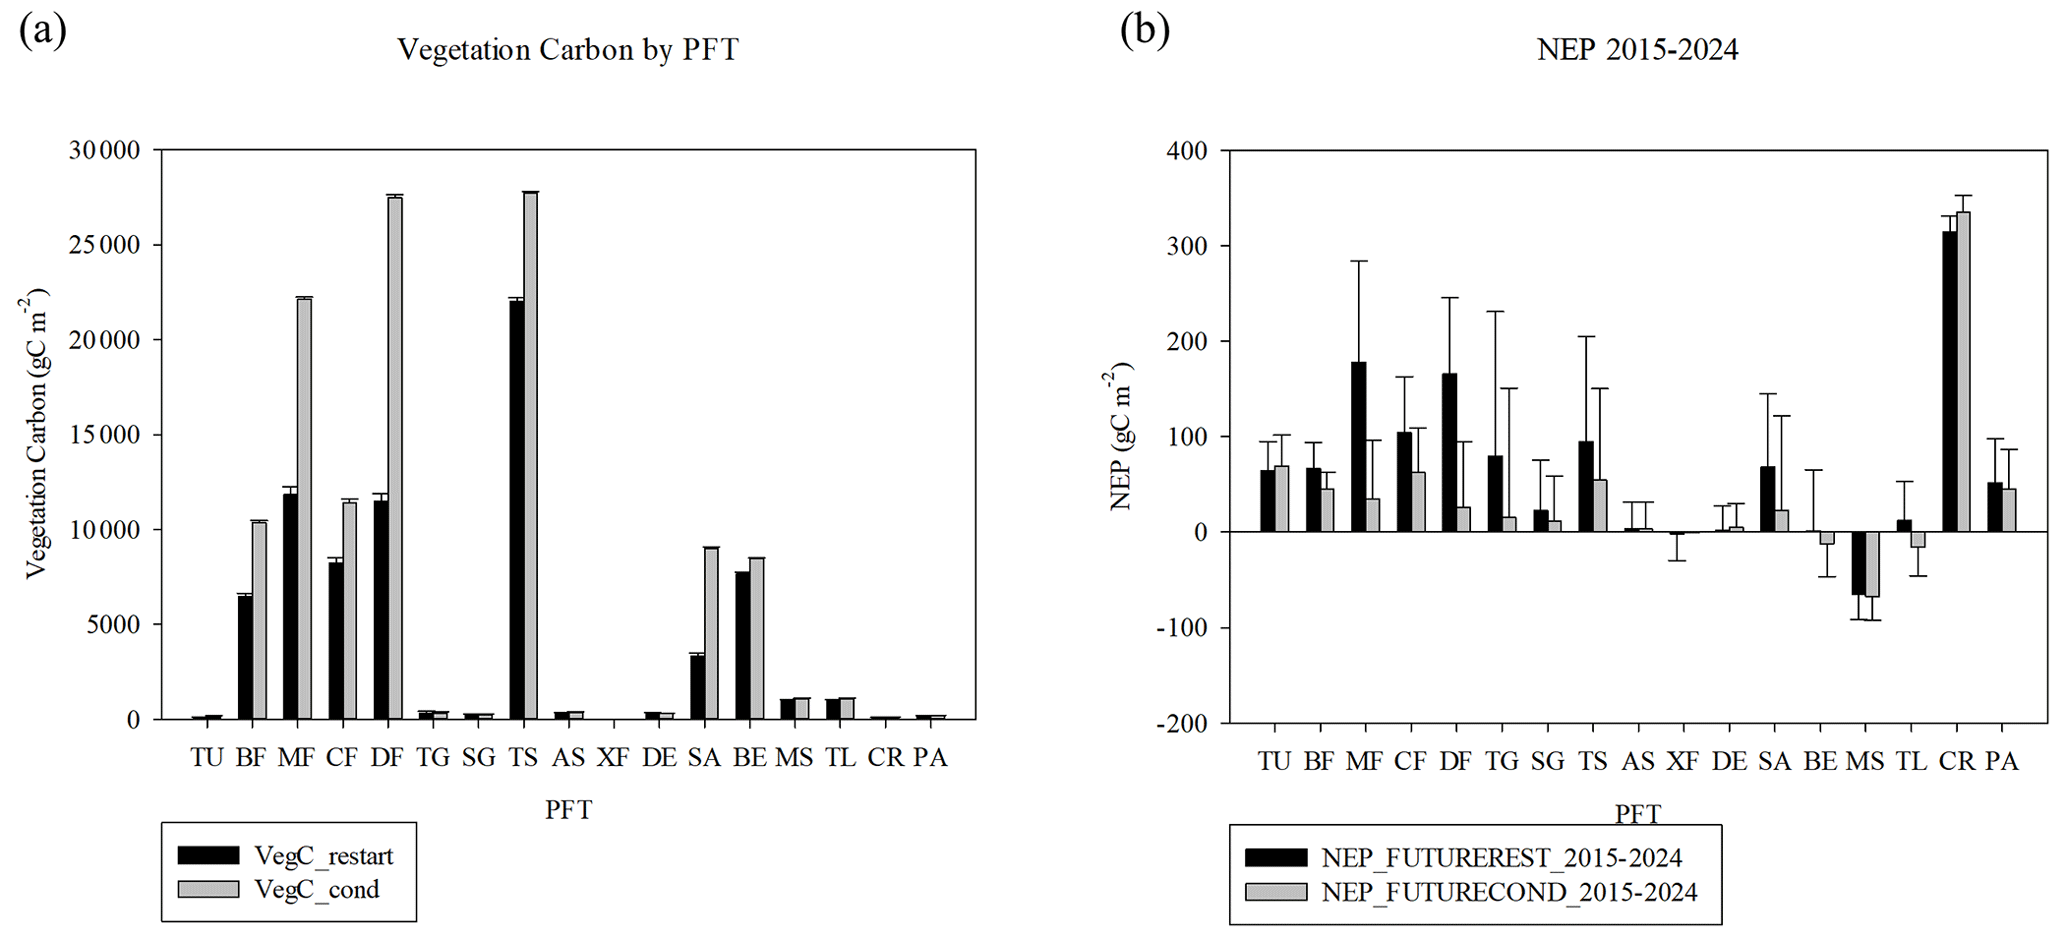
Figure 10(a) Vegetation carbon by plant functional type in 2015 for the RESTART and for the CONDENSED experiments, (b) NEP by PFT averaged 2015–2024. PFTs are as follows: T is tundra, BF is boreal forest, MF is mixed temperate forest, CF is temperate coniferous forest, DF is temperate deciduous forest, TG is tall grasslands, SG is short grasslands, TS is tropical savanna, AS is arid shrublands, XF is xeric forests and woodlands, DE is deserts, SA is temperate savannas, BE is temperate broadleaved evergreen forests, MS is Mediterranean shrublands, TL is turf lawn, PA is pasture, and CR is crops. Error bars are 10-year interannual variability, computed as 95 % confidence interval of year 2015–2024 for each PFT in each of the two runs.
NEP generally peaks between 20 and 30 years stand age, yet remains positive for hundreds of years (Luyssaert et al., 2008). The TEM-Hydro results from the HISTORICAL run show maximum NEP occurring between 11–30 years for temperate forests across the US or up to 40 years in the eastern US (Fig. 9c, d), with NEP generally remaining positive except for very old trees when including the western US. In fact for the conterminous US as a whole, Lu et al. (2015) found that the Pan et al. (2011) corrected data, with much younger stand age distribution, had a cumulative NCE of 323 TgC yr−1 from 2001–2005 vs. 173 TgC yr−1 with the uncorrected data derived from Hurtt et al. (2011). The RESTART and TEMRESTART runs show continued carbon uptake in the future (Fig. 3), consistent with Krause et al. (2020) who point out that regrowth, as well as climate change and elevated CO2, will continue to promote carbon uptake even in the absence of future land-use change. Houghton et al. (2012) also explain that future carbon uptake is dominated by land legacy effects.
The interannual variability of fluxes, like NEP and NCE, is very large (493–579 TgC yr−1 standard deviation, or over 63–75 gC m2 yr−1 for the three runs for NEP), so the differences between the experiments are all within the interannual variability. These values are consistent with other measured values. For a range of 24 eddy covariance sites, standard deviation of annual net ecosystem exchange (NEE) ranged from about 20–280 gC m2 yr−1, accounting for 50 % of annual NEE (Niu et al., 2017). IAV from site-level FLUXNET sites mostly in North America and Europe ranged from 15 to 400 gC m2 yr−1 (with a mean of 130 gC m2 yr−1), with lower values in more northern sites and a lower range of values from global upscaling and inversion models (Marcolla et al., 2017). Climate drivers, particularly temperature and moisture, are considered the primary drivers for this large IAV (Piao et al., 2020). In any case, differences between the experiments in this study (Fig. 3) are all much smaller than the IAV, but the different experiments are well correlated, so the differences represent a shift of the entire time series rather than a change in IAV.
The effect of nutrient loading on abandoned land, such as fertilization on abandoned cropland, can increase the final growth of the forest, but final growth rates are dependent upon many other environmental factors as well, which is why the relationship does not hold true everywhere, and above a certain level of nutrient availability the system is not nitrogen limited, so it does not matter at all. Other studies have confirmed that increased nutrient availability, in the form of lower C:N and C:P or high P, promotes radial stem growth (Mausolf et al., 2018) or tree ring width (Von Oheimb et al., 2014), which is consistent with the biomass results from this study. The greater nutrient availability, by directly increasing gross primary productivity (GPP), would also result in more litter and therefore more litter decomposition and higher rates of net nitrogen mineralization, also consistent with Von Ohemib et al. (2014). However there is also a legacy effect of reduced resiliency to drought, having to do with changes in soil structure, which would not occur in the model development here.
Most other terrestrial ecosystem models do not include the effect of forest demography. The dynamic global vegetation models (DGVMs) included in trends in net land–atmosphere exchange (TRENDY-v2) (Li et al., 2017) mostly include annual changes in PFTs to represent LULCC. They include the conversion and product fluxes resulting from these changes, and often include the effects of mortality and regrowth within existing grids, but do not incorporate the effects of forest regrowth due to LULCC. Two of the models (VISIT and JSBACH) (Kato et al., 2013; Reick et al., 2013) include elaborate methods of applying the LULCC transition matrices to ensure the correct redistribution of PFTs and correct carbon fluxes. Shevliokova et al. (2009) does use a tiling approach to consider forest stand age and reduce the large number of cohorts used here. The HISTCOND run was designed specifically to explore the effects of forest demography by trying to emulate the effect of just redistributing annual land-use fractions, without including the effect of forest demography or keeping track of soil nutrients. As seen in the results, it does substantially overestimate the carbon stocks and underestimate the NEP compared to the run that includes the full effects of forest demography.
Restarting from averaged initial conditions more closely approximates the full cohort approach with a large computation advantage by avoiding the need for reinitializing and enabling the use of condensed cohorts, but with the corrected initial conditions. In the fluxes (Fig. 3), cumulative NEP of TEMRESTART is higher than the RESTART run, but cumulative NCE of the TEMRESTART is nearly the same as the RESTART run in the latter half of the century. The vegetation carbon of TEMRESTART diverges slightly from RESTART, while the soil carbon barely diverges at all (Fig. 6).
To address the issue of discontinuity between using clouds as input for the historical period (1750–2014) and net irradiance for the future (2015–2099), an additional FUTURE run was implemented to use clouds for the future period as well. The reason for using clouds historically is because net irradiance is not available from the CRU4.04 dataset. The model, and actual ecosystems, are affected more directly by net irradiance than clouds. The model code is designed to convert clouds to net irradiance if net irradiance is unavailable (Raich et al., 1991), which means there can be considerable error in the net irradiance values calculated from cloud data. Therefore it is most accurate to correct the historical cloud data to the bias-corrected MACA net irradiance, which is what was done in this study. The additional run involved using total cloud fraction output directly from the same r6i1p1 NCAR CCSM4 RCP8.5 simulation. Note that since these data are not available from MACA, they were bias corrected and downscaled to the corrected cloud data using the period 2006–2014 and a similar method as used to bias correct and downscale the MPI model output to CRU. The results are all statistically insignificant differences in NEP, NCE, cumulative NEP, cumulative NCP, vegetation carbon, and soil carbon.
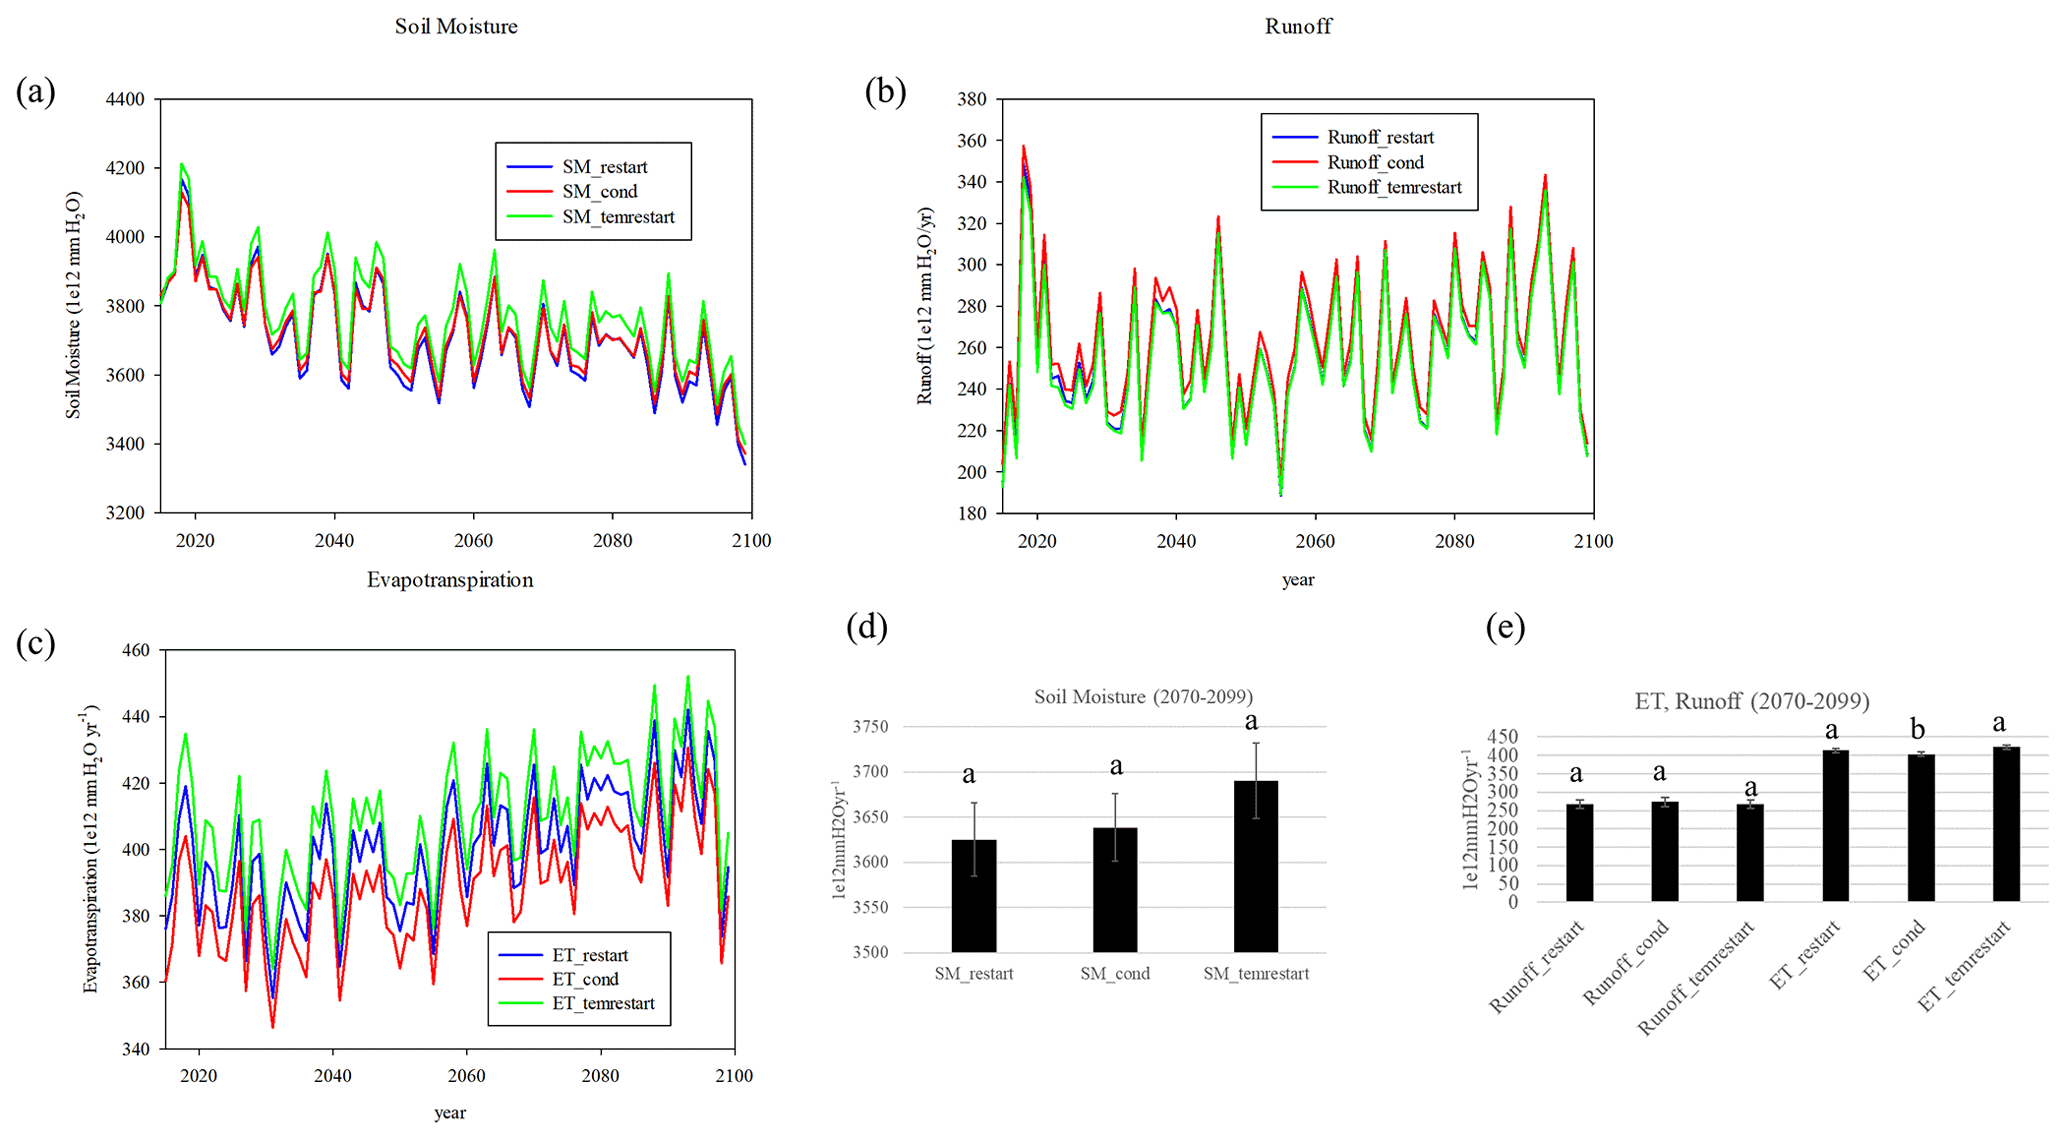
Figure 11(a) Soil moisture, (b) runoff, and (c) evapotranspiration between the RESTART, CONDENSED, and TEMRESTART experiments; (d) mean differences 2070–2099 for soil moisture and (e) mean difference 2070–2099 for runoff and evapotranspiration (letters based on ANOVA analysis with P<0.05).
Water variables depend upon precipitation (which is similar between the runs but can be rain or snowmelt) and evapotranspiration, which ultimately depends upon environmental conditions (i.e., solar radiation, vapor pressure deficit), stomatal conductance, and soil texture (Felzer et al., 2011; Shuttleworth and Wallace, 1985). The CONDENSED run exhibits a lower evapotranspiration than RESTART, which is primarily due to low values in pasture grids (Fig. 11). Pasture in the CONDENSED run has higher leaf area index (LAI) then in the RESTART run, due to reinitializing from equilibrium conditions, and that reduced the net irradiance, which limits the amount of soil evaporation. The effect of LAI on soil evaporation in the Shuttleworth–Wallace or Penman–Monteith approaches takes the form of an exponential decay, resulting in a much sharper drop-off in evaporation with smaller changes in low LAI than large LAI, which is why the effect is predominant in low-height vegetation like pastures. The soil moisture is slightly too large in the TEMRESTART run even though it starts off at the correct value, which also results in a larger evapotranspiration rate, though neither is significantly different from RESTART by the end of the century. The larger biases in the evapotranspiration flux do not lead to larger biases in the soil moisture stock. While evapotranspiration depends upon vapor pressure deficit, net irradiance, stomatal conductance and surface roughness, and its value affects the soil moisture, the amount of soil moisture also affects the amount of water available for evapotranspiration. Increasing vegetation cover has competing effects of reducing soil moisture by shading the ground and increasing evapotranspiration, yet the relative effect of the two depends upon the range of the LAI change.
This study explores the role of past land use and land cover legacy on the future carbon and water dynamics of terrestrial ecosystems in the conterminous US. While most models simulating the future start with current LULCC by reinitializing initial conditions, the actual value of the initial conditions should be different because ecosystems are not in a state of equilibrium but are changing due to past disturbances and climate change. This study determines whether it is nevertheless possible to use a single realization for each PFT if the initial conditions are set correctly based on a past run that includes land use and land cover legacy effects.
NEP, a measure of carbon sequestration, is too low compared to using all the cohorts when reinitializing initial conditions because the assumption of mature forests rebalances the NEP to become more neutral through enhanced heterotrophic decomposition. There are some offsetting geographic differences across the US when accounting for all ecosystems. The NCE differences are somewhat reduced, however, due to continued product decomposition in runs that account for transient changes to LULC in the past. Cumulatively, condensed cohorts have a negative bias in both NEP and NCE, which becomes a positive bias in the case of NEP and is eliminated in the case of NCE by the end of the century when initializing correctly (TEMRESTART). This is evident in the larger values in the biomasses (vegetation and soil carbon) relative to RESTART, which are too large for the CONDENSED cohorts but greatly improved with TEMRESTART. When PFTs are condensed into single cohorts, the forests are all assumed to be mature forests, which leads to an overestimation of the biomass. The NEP of mature forests is generally less than that of younger forests, though the actual biases between the CONDENSED and RESTART runs by the end of the century are more muted as the forests have had a chance to mature more in both. Correcting for initial conditions reduces the bias in vegetation carbon and eliminates the bias in soil carbon. Starting with the correct initial conditions do not have a large impact on the water variables, as they are more dependent on environmental factors, though the vegetation cover does have some minor effects.
In addition to forest stand age, the initial nutrient loading of the soil is also an important factor for future forest regrowth. With low levels of nitrogen, higher starting values often lead to a larger overall biomass as the forest develops, though there are other environmental factors (e.g., climate) that are important. Past agricultural use could deplete the soil of nutrients if cropland was abandoned at a time period before chemical fertilization was frequently used (i.e., before the 1950s), or could enhance the soil nutrients if abandoned from heavily fertilized soil. These effects will be accounted for if the correct initial soil conditions are determined.
This study illustrates the importance of accounting for the correct forest stand age and initial soil nutrient conditions in order to model the future carbon sink. Although starting model runs in the 1700s or earlier is computationally expensive, it is possible to average values from such a run for each PFT to allow a run to start in the present with correct initial condition and achieve a result more consistent with a detailed representation of land-use cohorts. While this research assumed constant LULC for the future, the next step is to use the corrected initial conditions as a basis for future LULCC. A similar approach can be used to start land-use transitions at any particular year based on the complete history of land-use transitions from 850 CE to serve as starting conditions for one of the shared socioeconomic pathway (SSP) scenarios. Modeling groups need to consider this effect of past LULC legacy to accurately estimate future carbon biomass and fluxes.
The C++ code for TEM-Hydro version 2 used in this study, the batch files for each of the model experiments, and Make files for compilation are available at https://doi.org/10.18275/2 (Felzer, 2022a).
All model input data (land use, climate, etc.) and output summary statistic files, mapping files, and final data used to prepare figures are available at https://doi.org/10.18275/2 (Felzer, 2022b).
The supplement related to this article is available online at: https://doi.org/10.5194/bg-20-573-2023-supplement.
The author declares that there is no conflict of interest.
Publisher’s note: Copernicus Publications remains neutral with regard to jurisdictional claims in published maps and institutional affiliations.
I would like to thank Yuning Shi and Dork Sahagian for reviewing this document, as well as my graduate students (Christopher Andrade, Dannielle Waugh, and Jared Kodero) for patiently discussing this research at our weekly research meetings.
This paper was edited by David McLagan and reviewed by two anonymous referees.
Abatzoglou, J. T. and Brown, T. J.: A comparison of statistical downscaling methods suited for wildfire applications, Int. J. Clim., 32, 772–780, 2012.
Allan, R. P., Hawkins, E., Bellouin, N., and Collins, B.: IPCC, 2021: summary for Policymakers, https://doi.org/10.1017/9781009157896.001, 2021.
Arneth, A., Sitch, S., Pongratz, J., Stocker, B. D., Ciais, P., Poulter, B., Bayer, A. D., Bondeau, A., Calle, L., and Chini, L. P.: Historical carbon dioxide emissions caused by land-use changes are possibly larger than assumed, Nat. Geosci., 10, 79–84, 2017.
Besnard, S., Carvalhais, N., Arain, M. A., Black, A., De Bruin, S., Buchmann, N., Cescatti, A., Chen, J., Clevers, J. G., and Desai, A. R.: Quantifying the effect of forest age in annual net forest carbon balance, Environ. Res. Lett., 13, 124018, https://doi.org/10.1088/1748-9326/aaeaeb, 2018.
Bradley, R. S. and Jonest, P. D.: 'Little Ice Age'summer temperature variations: their nature and relevance to recent global warming trends, Holocene, 3, 367–376, 1993.
Chapin III, F. S., Matson, P. A., and Vitousek, P.: Principles of terrestrial ecosystem ecology, Springer Science & Business Media, ISBN 978-1-4419-9504-9, 2011.
Felzer, B. S.: Carbon, nitrogen, and water response to climate and land use changes in Pennsylvania during the 20th and 21st centuries, Ecol. Model., 240, 49–63, 2012.
Felzer, B. S.: TEM-Hydro Version 2 code, [code], https://doi.org/10.18275/2, 2022a.
Felzer, B. S.: Input and output files for TEM-Hydro model, [data set], https://doi.org/10.18275/2, 2022b.
Felzer, B. S. and Jiang, M.: Effect of land use and land cover change in context of growth enhancements in the United States since 1700: net source or sink?, J. Geophys. Res.-Biogeo., 123, 3439–3457, https://doi.org/10.1029/2017JG004378, 2018.
Felzer, B. S., Cronin, T. W., Melillo, J. M., Kicklighter, D. W., and Schlosser, C. A.: Importance of carbon-nitrogen interactions and ozone on ecosystem hydrology during the 21st century, J. Geophys. Res.-Biogeo., 114, https://doi.org/10.1029/2008JG000826, 2009.
Felzer, B. S., Cronin, T. W., Melillo, J. M., Kicklighter, D. W., Schlosser, C. A., and Dangal, S. R. S.: Nitrogen effect on carbon-water coupling in forests, grasslands, and shrublands in the arid Western U.S., J. Geophys. Res., 116, https://doi.org/10.1029/2010JG001621, 2011.
Felzer, B. S. F., Kicklighter, D. W., Melillo, J. M., Wang, C., Zhuang, Q., and Prinn, R. G.: Ozone effects on net primary production and carbon sequestration in the conterminous United States using a biogeochemistry model, Tellus B, 56, 230–248, 2004.
Friedlingstein, P., O'Sullivan, M., Jones, M. W., Andrew, R. M., Hauck, J., Olsen, A., Peters, G. P., Peters, W., Pongratz, J., Sitch, S., Le Quéré, C., Canadell, J. G., Ciais, P., Jackson, R. B., Alin, S., Aragão, L. E. O. C., Arneth, A., Arora, V., Bates, N. R., Becker, M., Benoit-Cattin, A., Bittig, H. C., Bopp, L., Bultan, S., Chandra, N., Chevallier, F., Chini, L. P., Evans, W., Florentie, L., Forster, P. M., Gasser, T., Gehlen, M., Gilfillan, D., Gkritzalis, T., Gregor, L., Gruber, N., Harris, I., Hartung, K., Haverd, V., Houghton, R. A., Ilyina, T., Jain, A. K., Joetzjer, E., Kadono, K., Kato, E., Kitidis, V., Korsbakken, J. I., Landschützer, P., Lefèvre, N., Lenton, A., Lienert, S., Liu, Z., Lombardozzi, D., Marland, G., Metzl, N., Munro, D. R., Nabel, J. E. M. S., Nakaoka, S.-I., Niwa, Y., O'Brien, K., Ono, T., Palmer, P. I., Pierrot, D., Poulter, B., Resplandy, L., Robertson, E., Rödenbeck, C., Schwinger, J., Séférian, R., Skjelvan, I., Smith, A. J. P., Sutton, A. J., Tanhua, T., Tans, P. P., Tian, H., Tilbrook, B., van der Werf, G., Vuichard, N., Walker, A. P., Wanninkhof, R., Watson, A. J., Willis, D., Wiltshire, A. J., Yuan, W., Yue, X., and Zaehle, S.: Global Carbon Budget 2020, Earth Syst. Sci. Data, 12, 3269–3340, https://doi.org/10.5194/essd-12-3269-2020, 2020.
Harris, I., Jones, P. D., Osborn, T. J., and Lister, D. H.: Updated high-resolution grids of monthly climatic observations – The CRU TS3.10 Dataset, Int. J. Clim., 34, 623–642, 2014.
Hayes, D. J., McGuire, A. D., Kicklighter, D. W., Gurney, K. R., Burnside, T. J., and Melillo, J. M.: Is the northern high-latitude land-based CO2 sink weakening?, Global Biogeochem. Cy., 25, https://doi.org/10.1029/2010GB003813, 2011.
He, L., Chen, J. M., Pan, Y., Birdsey, R., and Kattge, J.: Relationships between net primary productivity and forest stand age in US forests, Global Biogeochem. Cy., 26, https://doi.org/10.1029/2010GB003942, 2012.
Houghton, R. A., House, J. I., Pongratz, J., van der Werf, G. R., DeFries, R. S., Hansen, M. C., Le Quéré, C., and Ramankutty, N.: Carbon emissions from land use and land-cover change, Biogeosciences, 9, 5125–5142, https://doi.org/10.5194/bg-9-5125-2012, 2012.
Hurtt, G. C., Chini, L., Sahajpal, R., Frolking, S., Bodirsky, B. L., Calvin, K., Doelman, J. C., Fisk, J., Fujimori, S., Klein Goldewijk, K., Hasegawa, T., Havlik, P., Heinimann, A., Humpenöder, F., Jungclaus, J., Kaplan, J. O., Kennedy, J., Krisztin, T., Lawrence, D., Lawrence, P., Ma, L., Mertz, O., Pongratz, J., Popp, A., Poulter, B., Riahi, K., Shevliakova, E., Stehfest, E., Thornton, P., Tubiello, F. N., van Vuuren, D. P., and Zhang, X.: Harmonization of global land use change and management for the period 850–2100 (LUH2) for CMIP6, Geosci. Model Dev., 13, 5425–5464, https://doi.org/10.5194/gmd-13-5425-2020, 2020.
Hurtt, G. C., Chini, L. P., Frolking, S., Betts, R. A., Feddema, J., Fischer, G., J.P., F., Hibbard, K., Houghton, R. A., Janetos, A., Jones, C. D., Kindermann, G., Kinoshita, T., Goldewijk, K. K., Riahi, K., Shevliakova, E., Smith, S., Stehfest, E., Thomson, A., Thornton, P., van Vuuren, D. P., and Wang, Y. P.: Harmonization of land-use scenarios for the perios 1500–2100: 600 years of global gridded annual land-use transitions, wood harvest, and resulting secondary lands, Clim. Change, 109, 117–161, https://doi.org/10.1007/s10584-011-0153-2, 2011.
Kato, E., Kinoshita, T., Ito, A., Kawamiya, M., and Yamagata, Y.: Evaluation of spatially explicit emission scenario of land-use change and biomass burning using a process-based biogeochemical model, J. Land Use Sci., 8, 104–122, 2013.
Kondo, M., Ichii, K., Patra, P. K., Poulter, B., Calle, L., Koven, C., Pugh, T. A., Kato, E., Harper, A., and Zaehle, S.: Plant regrowth as a driver of recent enhancement of terrestrial CO2 uptake, Geophys. Res. Lett., 45, 4820–4830, 2018.
Krause, A., Arneth, A., Anthoni, P., and Rammig, A.: Legacy Effects from Historical Environmental Changes Dominate Future Terrestrial Carbon Uptake, Earth's Future, 8, e2020EF001674, https://doi.org/10.1029/2020EF001674, 2020.
Krause, A., Haverd, V., Poulter, B., Anthoni, P., Quesada, B., Rammig, A., and Arneth, A.: Multimodel analysis of future land use and climate change impacts on ecosystem functioning, Earth's Future, 7, 833–851, 2019.
Li, W., Ciais, P., Peng, S., Yue, C., Wang, Y., Thurner, M., Saatchi, S. S., Arneth, A., Avitabile, V., Carvalhais, N., Harper, A. B., Kato, E., Koven, C., Liu, Y. Y., Nabel, J. E. M. S., Pan, Y., Pongratz, J., Poulter, B., Pugh, T. A. M., Santoro, M., Sitch, S., Stocker, B. D., Viovy, N., Wiltshire, A., Yousefpour, R., and Zaehle, S.: Land-use and land-cover change carbon emissions between 1901 and 2012 constrained by biomass observations, Biogeosciences, 14, 5053–5067, https://doi.org/10.5194/bg-14-5053-2017, 2017.
Lu, X., Kicklighter, D. W., Melillo, J. M., Reilly, J. M., and Xu, L.: Land
carbon sequestration within the conterminous United States: regional- and
state-level analyses, J. Geophys. Res.-Biogeo., 120, 379–398,
doi10.1002/2014JG002818, 2015.
Luyssaert, S., Schulze, E. D., Borner, A., Knohl, A., Hessenmoller, D., Law, B. E., Ciais, P., and Grace, J.: Old-growth forests as global carbon sinks, Nature, 455, 213–215, 2008.
Mahowald, N. M., Randerson, J. T., Lindsay, K., Munoz, E., Doney, S. C., Lawrence, P., Schlunegger, S., Ward, D. S., Lawrence, D., and Hoffman, F. M.: Interactions between land use change and carbon cycle feedbacks, Global Biogeochem. Cy., 31, 96–113, 2017.
Mann, M. E.: Little ice age, Encyclopedia of global environmental change, 1, e509, ISBN 0-471-97796-9, 2002.
Mann, M. E., Zhang, Z., Hughes, M. K., Bradley, R. S., Miller, S. K., Rutherford, S., and Ni, F.: Proxy-based reconstructions of hemispheric and global surface temperature variations over the past two millennia, P. Natl. Acad. Sci. USA, 105, 13252–13257, 2008.
Marcolla, B., Rödenbeck, C., and Cescatti, A.: Patterns and controls of inter-annual variability in the terrestrial carbon budget, Biogeosciences, 14, 3815–3829, https://doi.org/10.5194/bg-14-3815-2017, 2017.
Mausolf, K., Härdtle, W., Jansen, K., Delory, B. M., Hertel, D., Leuschner, C., Temperton, V. M., von Oheimb, G., and Fichtner, A.: Legacy effects of land-use modulate tree growth responses to climate extremes, Oecologia, 187, 825–837, 2018.
Meinshausen, M., Smith, S. J., Calvin, K., Daniel, J. S., Kainuma, M. L., Lamarque, J.-F., Matsumoto, K., Montzka, S. A., Raper, S. C., and Riahi, K.: The RCP greenhouse gas concentrations and their extensions from 1765 to 2300, Clim. Change, 109, 213–241, 2011.
Niu, S., Fu, Z., Luo, Y., Stoy, P. C., Keenan, T. F., Poulter, B., Zhang, L., Piao, S., Zhou, X., and Zheng, H.: Interannual variability of ecosystem carbon exchange: From observation to prediction, Global Ecol. Biogeogr., 26, 1225–1237, 2017.
Pan, Y., Chen, J. M., Birdsey, R., McCullough, K., He, L., and Deng, F.: Age structure and disturbance legacy of North American forests, Biogeosciences, 8, 715–732, https://doi.org/10.5194/bg-8-715-2011, 2011.
Pan, Y., McGuire, A. D., Melillo, J. M., Kicklighter, D. W., Sitch, S., and Prentice, I. C.: A biogeochemistry-based dynamic vegetation model and its application along a moisture gradient in the continental United States, J. Veg. Sci., 13, 369–382, 2002.
Piao, S., Wang, X., Wang, K., Li, X., Bastos, A., Canadell, J. G., Ciais, P., Friedlingstein, P., and Sitch, S.: Interannual variation of terrestrial carbon cycle: Issues and perspectives, Global Change Biology, 26, 300-318, 2020.
Post, W. M. and Kwon, K. C.: Soil carbon sequestration and land-use change: processes and potential, Global Change Biol., 6, 317–327, 2000.
Pugh, T. A., Lindeskog, M., Smith, B., Poulter, B., Arneth, A., Haverd, V., and Calle, L.: Role of forest regrowth in global carbon sink dynamics, P. Natl. Acad. Sci. USA, 116, 4382–4387, 2019.
Raich, J. W., Rastetter, E. B., Melillo, J. M., Kicklighter, D. W., Steudler, P. A., Peterson, B. J., Grace, A. L., Moore Iii, B., and Vorosmarty, C. J.: Potential net primary productivity in South America: application of a global model, Ecol. Appl., 1, 399–429, 1991.
Reick, C., Raddatz, T., Brovkin, V., and Gayler, V.: Representation of natural and anthropogenic land cover change in MPI-ESM, J. Adv. Model. Earth Sy., 5, 459–482, 2013.
Schmidt, G. A., Annan, J. D., Bartlein, P. J., Cook, B. I., Guilyardi, E., Hargreaves, J. C., Harrison, S. P., Kageyama, M., LeGrande, A. N., Konecky, B., Lovejoy, S., Mann, M. E., Masson-Delmotte, V., Risi, C., Thompson, D., Timmermann, A., Tremblay, L.-B., and Yiou, P.: Using palaeo-climate comparisons to constrain future projections in CMIP5, Clim. Past, 10, 221–250, https://doi.org/10.5194/cp-10-221-2014, 2014.
Shevliakova, E., Pacala, S. W., Malyshev, S., Hurtt, G. C., Milly, P. C. D., Caspersen, J. P., Sentman, L. T., Fisk, J. P., Wirth, C., and Crevoisier, C.: Carbon cycling under 300 years of land use change: importance of the secondary vegetation sink, Global Biogeochem. Cy., 23, https://doi.org/10.1029/2007GB003176, 2009.
Shuttleworth, W. J. and Wallace, J. S.: Evaporation from sparse crops: an energy combination theory, Q. J. Roy. Meteor. Soc., 111, 839–855, 1985.
Sleeter, B. M., Liu, J., Daniel, C., Rayfield, B., Sherba, J., Hawbaker, T. J., Zhu, Z., Selmants, P. C., and Loveland, T. R.: Effects of contemporary land-use and land-cover change on the carbon balance of terrestrial ecosystems in the United States, Environ. Res. Lett., 13, 045006, https://doi.org/10.1088/1748-9326/aab540, 2018.
Strassmann, K., Joos, F., and Fischer, G.: Simulating effects of land use changes on carbon fluxes: past contributions to atmospheric CO2 increases and future commitments due to losses of terrestrial sink capacity, Tellus B, 60, 583–603, 2008.
Tharammal, T., Bala, G., Devaraju, N., and Nemani, R.: A review of the major drivers of the terrestrial carbon uptake: model-based assessments, consensus, and uncertainties, Environ. Res. Lett., 14, 093005, https://doi.org/10.1088/1748-9326/ab3012, 2019.
Thom, D., Rammer, W., Garstenauer, R., and Seidl, R.: Legacies of past land use have a stronger effect on forest carbon exchange than future climate change in a temperate forest landscape, Biogeosciences, 15, 5699–5713, https://doi.org/10.5194/bg-15-5699-2018, 2018.
Tian, H., Xu, X., Liu, M., Ren, W., Zhang, C., Chen, G., and Lu, C.: Spatial and temporal patterns of CH4 and N2O fluxes in terrestrial ecosystems of North America during 1979–2008: application of a global biogeochemistry model, Biogeosciences, 7, 2673–2694, https://doi.org/10.5194/bg-7-2673-2010, 2010.
von Oheimb, G., Härdtle, W., Eckstein, D., Engelke, H.-H., Hehnke, T., Wagner, B., and Fichtner, A.: Does forest continuity enhance the resilience of trees to environmental change?, Plos One, 9, e113507, https://doi.org/10.1371/journal.pone.0113507, 2014.
Xu, C. Y., Turnbull, M. H., Tissue, D. T., Lewis, J. D., Carson, R., Schuster, W. S., Whitehead, D., Walcroft, A. S., Li, J., and Griffin, K. L.: Age-related decline of stand biomass accumulation is primarily due to mortality and not to reduction in NPP associated with individual tree physiology, tree growth or stand structure in a Quercus-dominated forest, J. Ecol., 100, 428–440, 2012.
Zhao, S., Liu, S., Sohl, T., Young, C., and Werner, J.: Land use and carbon dynamics in the southeastern United States from 1992 to 2050, Environ. Res. Lett., 8, 044022, https://doi.org/10.1088/1748-9326/8/4/044022, 2013.
The requested paper has a corresponding corrigendum published. Please read the corrigendum first before downloading the article.
- Article
(3145 KB) - Full-text XML
- Corrigendum
-
Supplement
(696 KB) - BibTeX
- EndNote