the Creative Commons Attribution 4.0 License.
the Creative Commons Attribution 4.0 License.
 | 15 Feb 2023
Temperature sensitivity of soil organic carbon respiration along a forested elevation gradient in the Rwenzori Mountains, Uganda
Marijn Bauters
Hans Verbeeck
Samuel Bodé
John Kasenene
Astrid Françoys
Till Engelhardt
Klaus Butterbach-Bahl
Ralf Kiese
Pascal Boeckx
Tropical montane forests store high amounts of soil organic carbon (SOC). However, global warming may affect these stocks via enhanced soil respiration. Improved insight into the temperature response of SOC respiration can be obtained from in and ex situ warming studies. In situ warming via the translocation of intact soil mesocosms was carried out along an elevation gradient ranging between ca. 1250 m in the Kibale Forest to ca. 3000 m in the Rwenzori Mountains in Uganda. Samples from the same transect were also warmed ex situ. Ex situ results revealed that, following the elevation gradient, which represents a natural climate gradient, specific heterotrophic CO2 respiration decreased linearly by 1.01 ± 0.12 of SOC per 100 m of elevation increase. The coefficient of temperature sensitivity increased from 1.50 ± 0.13 in the lowest- to 2.68 ± 0.25 in the highest-elevation cluster, showing a linear increase of 0.09 ± 0.03 per 100 m of elevation increase. Additionally, respired CO2 was more depleted in 13C in the warmer lower elevations as compared to colder higher elevations, with a linear decrease of 0.23 ‰ ± 0.04 ‰ per 100 m of elevation increase. Furthermore, the microbial community structure indicated a weak trend along the elevation gradient, with higher elevations more dominated by fungi relative to bacteria. The results indicate an increased recalcitrance and decreased mineralisation of SOC, with elevation likely driven by decreasing soil temperature and pH. Subsequently, after 2 years of in situ warming (0.9 to 2.8 ∘C), specific heterotrophic SOC respiration tended to be lower for warmed soil compared to control soil. Furthermore, in warmed soils, δ13C values and SOC content tended to increase and decrease, respectively. Collectively, this points towards the increased mineralisation and depletion of readily available C during 2 years of warming. In conclusion, our results suggest that climate warming may trigger enhanced losses of SOC from tropical montane forests due to a combination of a higher temperature sensitivity of mineralisation and higher SOC content at higher elevations.
- Article
(1701 KB) - Full-text XML
-
Supplement
(1128 KB) - BibTeX
- EndNote


Tropical forests store 55 % of the global forest carbon (C) stocks, of which 56 % is stored in biomass, 32 % in soil, and 12 % in litter and deadwood (Pan et al., 2011). These forests account for more than one-third of primary productivity (Beer et al., 2010; Pan et al., 2011), despite covering only less than 10 % of the global land area (Cuni Sanchez et al., 2021; Erb et al., 2018). Their key role in the global C cycle is further demonstrated by the fact that tropical forests exchange more carbon dioxide (CO2) with the atmosphere than any other ecosystem (Friedlingstein et al., 2020; Lewis et al., 2015; Singh, 2018), in part owing to their high C turnover rates (Sayer et al., 2011). Currently, tropical ecosystems are being subjected to global change, with detrimental consequences for its ecosystem services (Gütlein et al., 2018). The global temperature increase is being driven by global climate warming and local land use change (Friedlingstein et al., 2020; Zhang et al., 2005; IPCC, 2018). For instance, worldwide, the average surface temperature has been rising consistently by 0.95–1.20 ∘C from 1850 to 2020 (IPCC, 2021). In addition to the global climate warming effect, tropical forests are also experiencing local and regional temperature increases driven by land use change, which alters the fluxes of solar and thermal infrared radiation, sensible and latent heat, and ultimately changes the surface albedo (Mahmood et al., 2014; Zeng et al., 2021). As an example, between the years 2000 and 2014, agricultural expansion at the expense of montane forests caused a general increase in the air temperature of 0.05 ± 0.01 ∘C in the Albertine Rift mountains of Africa, and air warming of up to 2 ∘C can occur under extensive deforestation (Zeng et al., 2021). The increase in global and regional temperature has the potential to drastically alter the C cycle in tropical forests (Mohan, 2019; Nottingham et al., 2020; Sayer et al., 2019) and may potentially drive accelerated soil organic C (SOC) losses (Friedlingstein et al., 2020; Kim et al., 2016). However, the response of tropical forest soils to such temperature increases is largely uncertain, especially in mountainous areas (Nottingham et al., 2020; Sayer et al., 2019; Zeng et al., 2021), and generally, data on climate warming from tropical forests in Africa are hardly available.
Key in this ecosystem-level uncertainty is the specific effect of warming on soil respiration rates (Carey et al., 2016; Crowther et al., 2016; Fussmann et al., 2014). Indeed, up to about 40 % of the CO2 emissions from tropical forest ecosystems originate from soil respiration (both autotrophic and heterotrophic respiration; Malhi, 2012), of which approximately 60 % of the CO2 respiration from soil is derived from heterotrophic microbial activity during the mineralisation of organic C (Sayer and Tanner, 2010). Temperature increases in tropical forests can trigger accelerated respiration rates, yet the ecosystems' net primary productivity is already close to its maximum, thereby reducing the net C sink (Carey et al., 2016; Craine et al., 2010; Nottingham et al., 2020). Therefore, given the sheer magnitude of both the C storage and emission capacities of tropical forest soils, precise quantifications and assessments of their response to climate warming are needed to inspire climate-sensitive forest management and to improve parameterisation and predictions of Earth system models (Oertel et al., 2016; Le Quéré et al., 2018).
Several short-term warming studies indicated increased soil microbial respiration with increase in temperature (Karhu et al., 2014; Nazaries et al., 2015). Contrastingly, others reported microbial acclimatisation to warming (Bradford et al., 2008; Luo et al., 2001). Here we present new data from an eastern afrotropical elevation gradient set up in the Kibale Forest and the Rwenzori Mountains in western Uganda. We studied the diffusive flux of CO2 from soil incubations and used it as a close proxy for microbial respiration (hereafter referred to as CO2 respiration). To gain better insight into the drivers of SOC respiration, with the function of elevation and enhanced warming, we investigated (i) soil physicochemical properties and the microbial community compositions based on phospholipid fatty acid analysis (PLFA), (ii) the heterotrophic soil CO2 respiration rate from laboratory incubations at 60 % water-filled pore space (WFPS) and controlled corresponding in situ temperature, (iii) changes in heterotrophic soil CO2 respiration from intact mesocosms translocated in situ along an elevation gradient to simulate a warming of about 2 ∘C, (iv) the activation energies (AEs) and temperature sensitivities (Q10) of heterotrophic soil CO2 respiration rates, and, finally, (v) the seasonal total soil CO2 respiration rate under in situ conditions. In particular, we intend to address the following research questions with respect to a tropical afromontane elevation gradient.
- i.
Does soil organic matter recalcitrance increase with elevation?
- ii.
How does SOC respiration respond to 2 years of in situ soil warming?
2.1 Study area
The study was conducted in the Kibale Forest National Park and the Rwenzori Mountains National Park in Uganda, both protected by the Uganda Wildlife Authority. A total of 20 sampling plots, each measuring 40 m by 40 m, were established between 1250 and 3000 m along an elevation gradient (all elevations refer to above sea level – a.s.l.). The sampling plots were grouped into five elevation clusters, with each cluster consisting of four replicated plots within similar elevations and environmental conditions. From the 20 sampling plots, 4 plots are located in the Kibale Forest National Park at an elevation of 1250–1300 m to form the “premontane” elevation cluster. A total of 16 sample plots are located at four different elevation clusters (1750–1850, 2100–2200, 2500–2600, and 2700–3000 m) on the eastern slope of the Rwenzori Mountains National Park (Fig. 1).
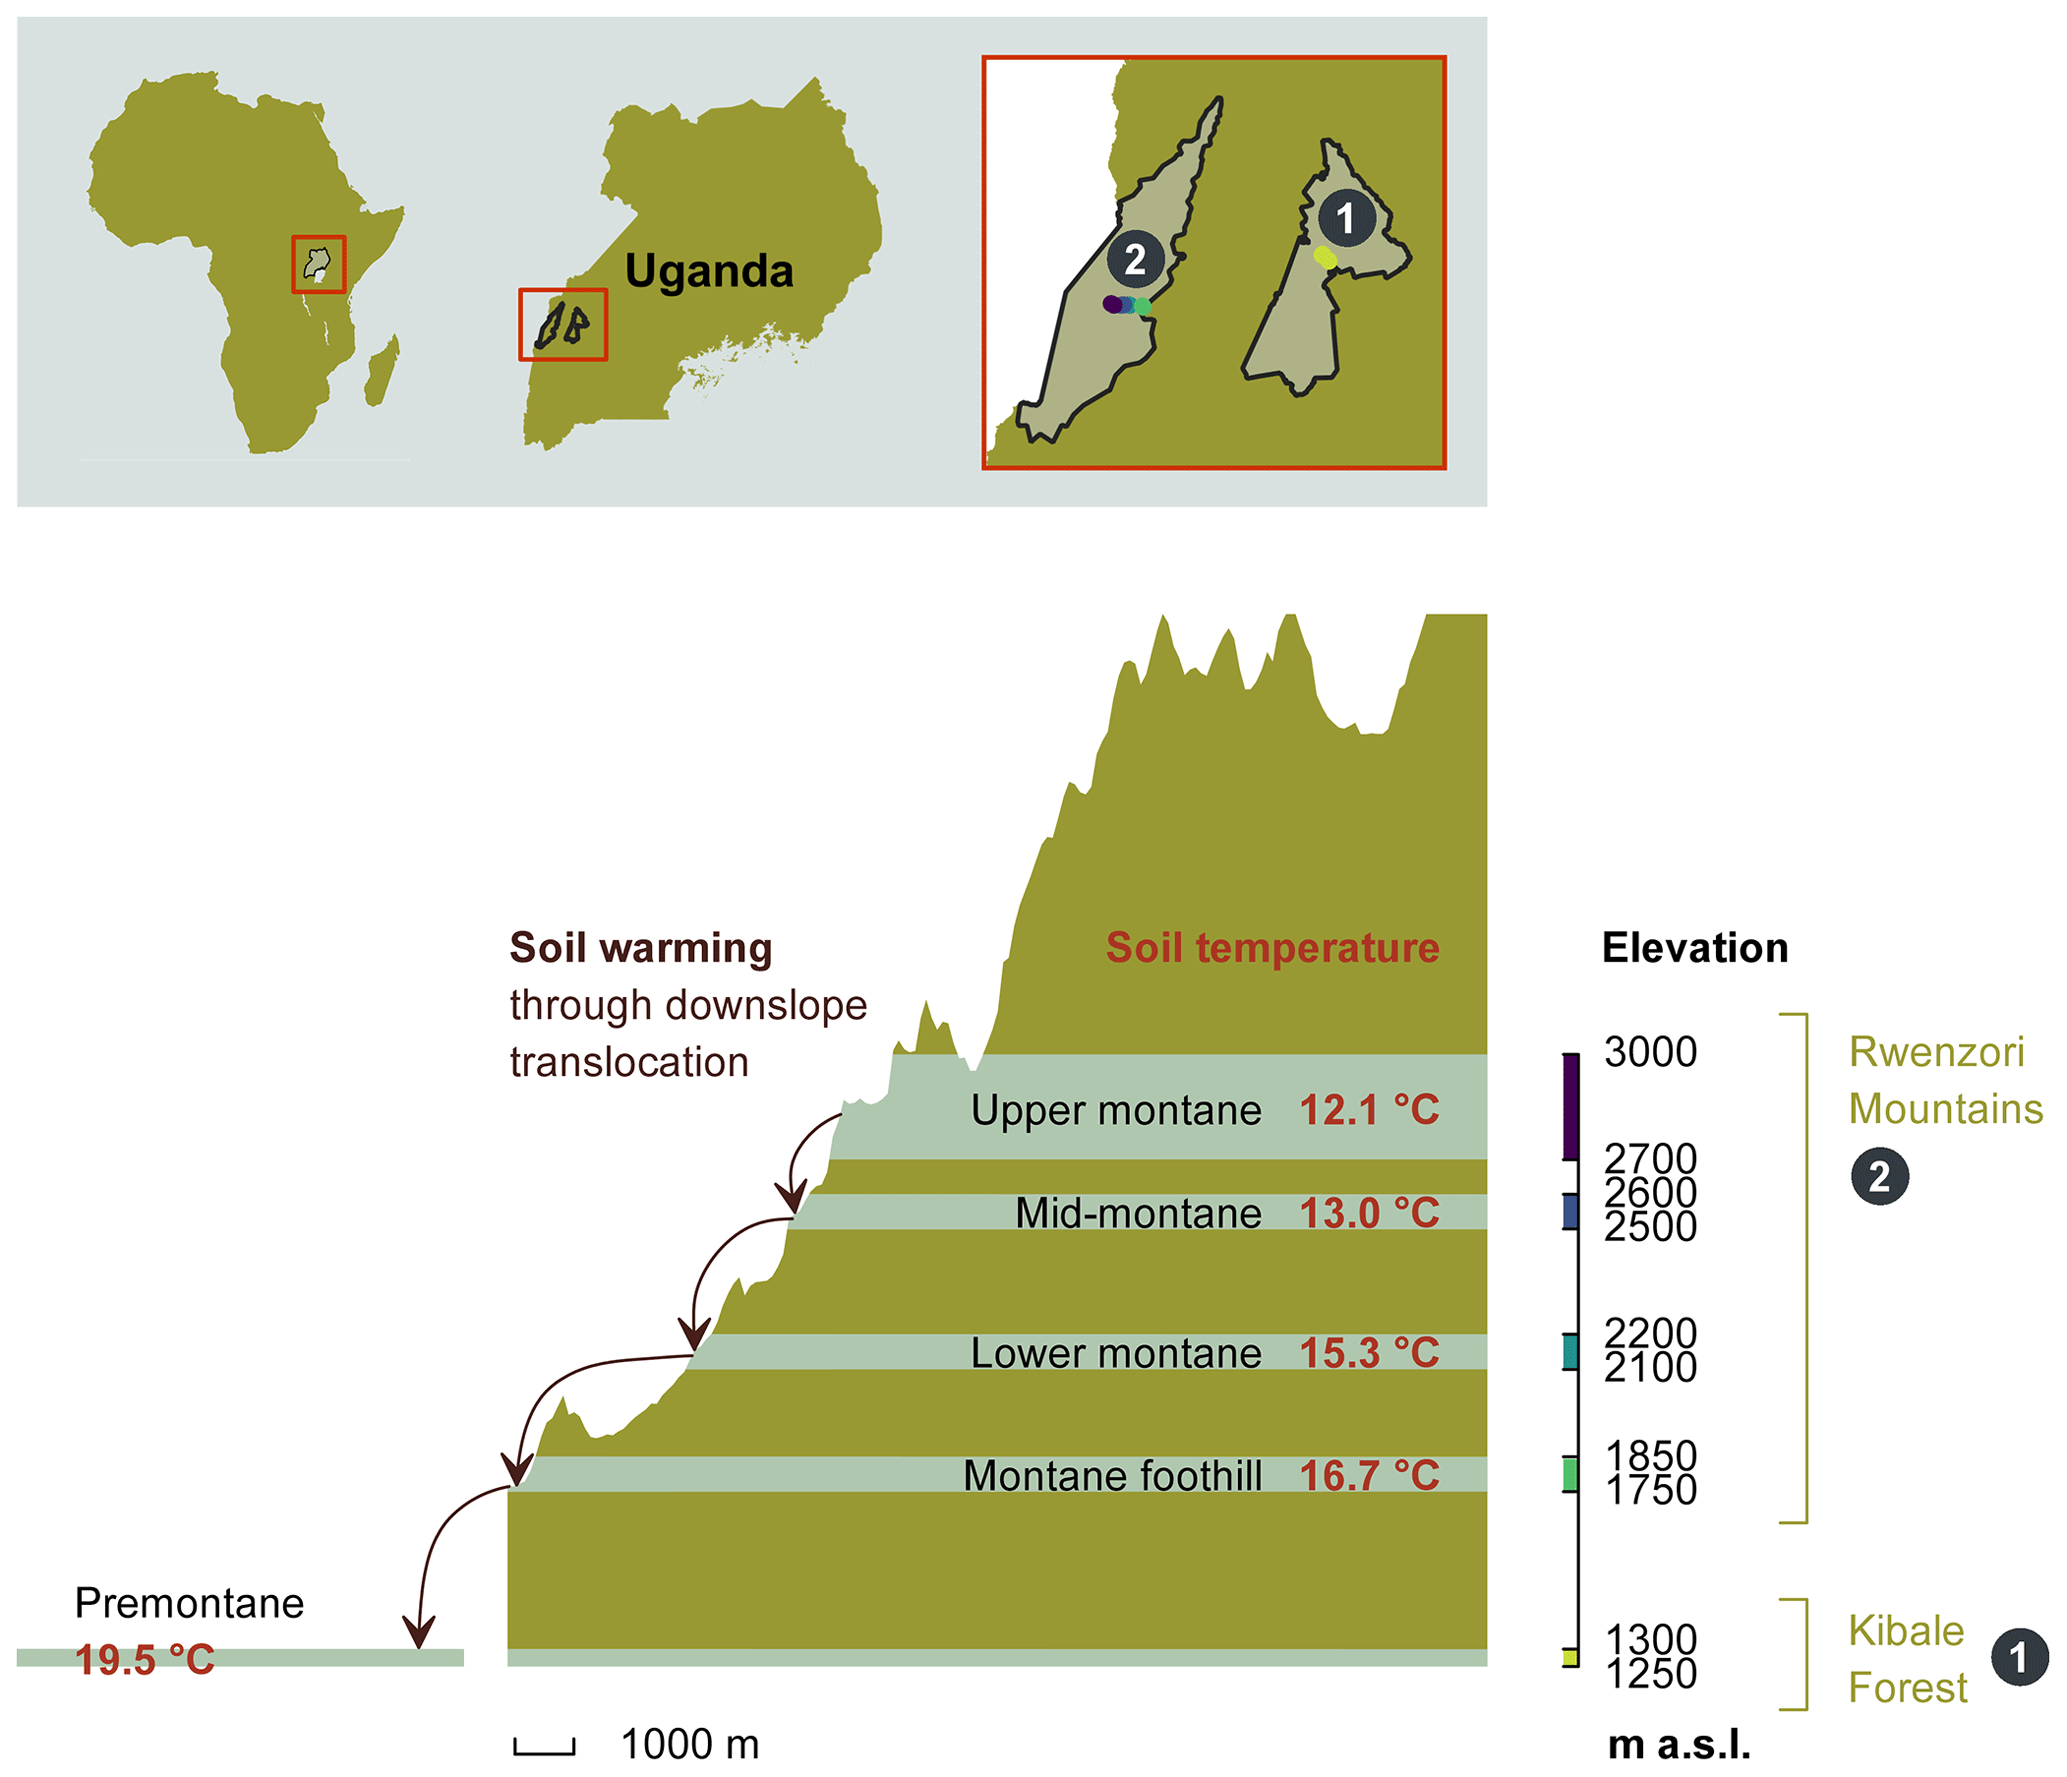
Figure 1The height profile of the Rwenzori elevation gradient, starting from the nearby premontane Kibale Forest National Park (1250–1300 m a.s.l.) and on to the Rwenzori Mountains National Park (1750–3000 m a.s.l.). Mean annual in situ temperatures for each of the five elevation clusters are indicated. The set-up of the in situ warming through the downslope translocation of soil cores to the immediate lower-elevation cluster is illustrated on the left side of the scheme. Different colours on the elevation axis represent the colour code for each elevation cluster throughout the paper.
The Kibale Forest National Park (795 km2; N, E) is located in the Kabarole and Kamwenge districts of western Uganda. The climate is moist tropical, and temperatures stay nearly constant all year round. The average annual rainfall is 1365 ± 53 mm, and the average temperature is 27.8 ± 0.74 ∘C (data 1992–2012; Kyembogo weather station in Kabarole district, 20 km from the park, at an elevation of 1400 m; Ministry of Water and Environment). The dominant soil type, according to the World Reference Base (WRB) classification, is Ferralsol (Jacobs et al., 2016).
The Rwenzori Mountains National Park (998 km2; between S– N and – E) is located at the border between the Democratic Republic of the Congo (DRC) and Uganda. The region experiences a moist, tropical climate, locally affected by altitude and topography. Annual rainfall varies with the elevation and slope aspect, with the highest rainfall amounts on the eastern slope, where our transect was established. Recent rainfall data from the Uganda Wildlife Authority (from 2012 to 2015) showed variations in mean annual rainfall ranging from 1570 ± 334 mm at 1760 m to 1806 ± 322 mm at 4230 m. The mean annual soil temperature of the different elevation clusters is indicated in Fig. 1. The dominant soil type in the Rwenzori Mountains, according to the WRB classification, is Leptosol (Jacobs et al., 2016).
2.2 Soil physicochemical properties and microbial community structure
In each study plot, the soil temperature at 5 cm depth was measured daily (during the measurements of soil respiration) at an interval of 30 min, using Thermocron iButton sensors DS1921G-F5 (iButton; Thermocron, Baulkham Hills, Australia). Similarly, the daily volumetric soil moisture content was measured at 5 cm soil depth using soil moisture sensors (EC-5; METER Group, Inc. USA, Pullman, Washington, USA). Furthermore, soil bulk density was determined using the soil core method (Campbell and Henshall, 2000).
At each of the 20 sampling plots along the elevation gradient, four topsoil samples (0–10 cm) of 385 cm3 by volume were collected (i.e. one sample per 20 m by 20 m subplot within the 40 m by 40 m sample plot) and homogenised to form one composite sample per plot (four replicate composite samples per elevation cluster). The samples were oven-dried at 60 ∘C and sieved through a 2 mm mesh size and ground. Subsequently, C, nitrogen (N) content, and the respective δ13C and δ15N values were determined from the composite soil samples using an elemental analyser (automated nitrogen carbon analyser; ANCA-SL, Sercon Group, Cheshire, UK), coupled to an isotope ratios mass spectrometer (IRMS; 20-22; Sercon Group, Cheshire, UK). The measured C was considered to be SOC because, in the acidic soils of the wet tropics, the presence of carbonates is negligible. The δ13C and δ15N values reported were normalised on the Vienna Pee Dee Belemnite (VPDB) and atmospheric N2 (AIR) scales using USGS90 (United States Geological Survey) millet flour (accepted δ13C and δ15N at −13.75 ‰ ± 0.06 ‰ vs. VPDB and +8.84 ‰ ± 0.17 ‰ vs. AIR, respectively) and USGS91 rice flour (accepted δ13C and δ15N at −28.28 ‰ ± 0.08 ‰ vs. VPDB and +1.78 ‰ ± 0.12 ‰ vs. AIR, respectively). A high organic content soil (−26.27 ‰ ± 0.15 ‰ vs. VPDB and +4.42 ‰ ± 0.29 ‰ vs. AIR, calibrated toward IAEA-CH-6 (International Atomic Energy Agency) and IAEA-N-1 by Elemental Microanalysis Ltd) was used for quality analysis (QA). The standard deviation on the replicate analyses of QA was better than 0.2 ‰ for both 13C and 15N, and the deviation from certified value was better than 0.2 ‰ and 0.3 ‰ for 13C and 15N, respectively. To measure the soil pH, 5 mL of the oven-dried soil (in triplicate) was brought into suspension with 25 mL of 1 M KCl (1:5 ) and shaken end-over-end for 1 h. Subsequently, the suspension was left to settle for 2 h, and then soil pH was measured in the supernatant using a pH glass electrode (model 920A, Orion, Thermo Scientific, UK).
For the determination of the microbial community structure, about 20 g of the homogenised composite sample from each plot was frozen immediately after collection. The microbial community structure was determined using PLFA analysis. The PLFA analysis was done by extracting 5 g of the freeze-dried soil sample in duplicate, following the method described by Bligh and Dyer (1959) and as modified by Findlay et al. (1989). Briefly, the method involves the extraction of all fatty acids, followed by isolation of phospholipids from other soil lipids (using solid-phase extraction) and, finally, the conversion into fatty acid methyl esters. Accordingly, for each gram of soil sample, lipid extraction was done using a combination of 0.1 M phosphate buffer, trichloromethane, and methanol solvents (, ) at 25 ∘C. Subsequently, the volume of the total lipid extracts was reduced by evaporating the solvent from tubes under N gas in a water bath at 30 ∘C. Afterward, the neutral lipids and glycolipids were eluded using trichloromethane and acetone, respectively. Phospholipids were further eluded using methanol and concentrated by evaporation of the solvent under N gas in a water bath at 30 ∘C. Eventually, the phospholipid fatty acids were converted to methyl esters, which were subsequently analysed using gas chromatography (GC; Trace GC; Thermo Fisher Scientific, Bremen, Germany), following the methods described by Denef et al. (2007) and Huygens et al. (2011). We determined the ratios of the peak area of each individual PLFA to that of C16:0, which is a universal PLFA occurring in the membranes of all organisms. PLFA ratios of less than 0.02 were excluded from the data set (Drijber et al., 2000). PLFA was assigned to a fungal group following Zelles (1997) and Chung et al. (2007), while PLFA assignment to a bacterial group and to gram-positive and gram-negative bacteria followed the procedure described by Kroppenstedt (1985) and Frostegård and Bååth (1996).
2.3 Laboratory incubations
To assess soil heterotrophic CO2 respiration rates under controlled laboratory incubations, the homogenised composite samples from each plot were air-dried and sieved (2 mm mesh size) to remove coarse particles and roots. For the incubation experiments, 50 g of each air-dried composite soil sample from each plot (four replicates per elevation cluster) was placed in a gas jar of 1 L, which could be closed in an airtight way with a lid. To each sample, deionised water was added until 60 % WFPS of the respective soil sample was reached (based on total porosity derived from bulk density measurements), representing a moisture content for optimal microbial activity (Aon et al., 2001; Doetterl et al., 2015). The samples were then preincubated for 14 d (at the respective in situ mean annual temperature per elevation cluster, i.e. 20, 17, 15, 13, and 12 ∘C for elevation clusters of 1250–1300, 1750–1850, 2100–2200, 2500–2600, and 2700–3000 m, respectively). These temperatures were controlled by placing the jars in incubators with the respective temperatures. During the preincubation, the gas jars were closed with Parafilm to permit free air circulation while minimising the loss of water.
After 14 d of preincubation, each sample was removed from the incubator and flushed for 10 s with ambient air in the room by means of an air fan. Immediately, one gas sample was taken using a 45 mL syringe, and the ambient CO2 concentrations and δ13C values of ambient CO2 at “open conditions” were analysed using cavity ring-down spectrometer (G2113-I; CRDS CO2 analyser, Picarro, United States). Normalisation toward VPDB scale was done using a dilution in zero air of a 5 % CO2 reference gas, calibrated by Iso-Analytical Limited, toward IA-CO2 −3 ( vs. VPDB; traceable to NBS-19) at the starting condition. The jars were then closed and placed back in the incubators for 24 h (a preliminary trial experiment indicated a continuous linear increase in the headspace CO2 concentrations during 24 h). After 24 h, a 45 mL gas sample was taken with a syringe equipped with a three-way valve and was immediately introduced into the CRDS for the measurement of the CO2 concentration and δ13C values of the respired CO2. After collecting the latter gas samples, the jars were opened, and soil moisture was replenished to 60 % WFPS, after which the jars were covered with Parafilm and placed back in the incubator until the following measurement. The following day, the same procedure was repeated, and this was done for 5 consecutive days to attain five replicated CO2 concentrations that were used to calculate the average respiration rate. To determine the δ13C values of the respired CO2, we used a mass balance approach (Phillips and Gregg, 2001; Eq. 1).
where [CO2]final is the final concentration of CO2 in the headspace. δ13C-CO2,final is the δ13C of CO2 in the headspace, [CO2]initial is the initial concentration of CO2 in the headspace, and δ13C-CO2,initial is the initial δ13C of CO2 in the headspace.
Subsequently, the isotopic fractionation, epsilon (ε), i.e. the extent to which the product of respiration (i.e. CO2) becomes depleted or enriched in 13C during SOC (substrate) respiration, was determined using Eq. (2).
where ε is the isotopic fractionation during respiration of soil organic carbon (SOC), and δ13CSOC is δ13C of the SOC.
2.4 Long-term in situ warming: soil mesocosm translocation along an elevation gradient
In situ climate warming was simulated by translocating intact soil cores (16 cm diameter and 25 cm depth increment) along the altitudinal gradient to the nearest elevation cluster downslope (Fig. 1). These intact soil cores were taken using a metallic soil corer in which a plastic polyvinyl chloride (PVC) tube was inserted to collect an intact soil mesocosm. From each plot, four soil mesocosms were translocated downslope (hereafter referred to as warmed), while four mesocosms were transplanted within the same plot (hereafter referred to as control). Each elevation cluster (except the highest) therefore had a total of 16 warmed and 16 control soil mesocosms. The soil mesocosms that were translocated from higher- to lower-elevation clusters were warmed by about 0.9 to 2.8 ∘C on average for 2 years (Fig. 1).
After 650 d of in situ incubation between November 2017 and September 2019 of both the control and warmed soil cores, the cores were collected. The top 10 cm of the soil cores were collected (i.e. the soil layer with the highest C content and most active in C cycling), homogenised, air-dried, and sieved (2 mm mesh size), for additional laboratory incubation experiments, in order to assess the effect of 2 years of in situ warming on (i) CO2 respiration rates, (ii) the AE and Q10 coefficient, and (iii) SOC content and soil δ13C values.
To assess the above parameters (i–iii), the soil samples from the translocation experiment were subjected to another incubation experiment under optimal soil moisture conditions. First, the control and warmed samples were incubated at the corresponding mean annual soil temperatures at which they were transplanted in situ (Table 1). Additionally, subsamples from the same soil were also incubated at four other temperatures (5, 10, 15, and 30 ∘C, covering the temperature ranges in the entire elevation gradient) to allow for the determination of AE and Q10 through a curve-fitting of the CO2 respiration rates at five different temperatures.
For these experiments, 6–15 g of air-dried soil (where the mass depended on the bulk density) was placed in the gas jar (50 mL by volume) for each temperature treatment and moistened with deionised water to attain 60 % WFPS. The soil was then gently compressed to a predetermined height in correspondence with the bulk density of the undisturbed soil. Subsequently, the jars were weighted, covered with Parafilm, and preincubated for 14 d to allow for the reactivation and stabilisation of microbial activities. During the preincubation, the soil moisture content in each jar was monitored and, when needed, corrected by adding deionised water. After 14 d of preincubation, the collection of air samples for the determination of CO2 respiration rate was initiated by removing the Parafilm, aerating the samples, and closing the lids in an airtight way. The CO2 concentrations at the starting condition and after 24 h were analysed using a gas chromatograph (Finnigan Trace GC Ultra, Thermo Electron S.p.A., Milan, Italy) fitted with a thermal conductivity detector. Eventually, the CO2 respiration rate was determined as the change in headspace CO2 concentrations divided by the incubation time (ca. 24 h).
2.5 In situ total soil CO2 respiration
Along the Rwenzori elevation gradient, we selected one sampling plot in each of the four elevation clusters at 1250–1300, 1750–1850, 2100–2200, and 2700–3000 m for the collection of in situ gas samples. In each study plot, in situ total soil respiration rates were measured following the static chamber method (Collier et al., 2014). Each sampling plot was subdivided into four 20 m by 20 m subplots. In each plot, five positions for static chambers were identified, with one position per 20 m by 20 m subplot and another one in the centre of the 40 m by 40 m permanent sample plot. The collars of the static chambers (to anchor the chamber in the soil) were installed in the soil at least 24 h before the first gas sampling event and were maintained in the field throughout the sample collection periods to minimise the effect of soil disturbance. The depth of the installed collar was noted for the precise volume correction of the headspace. Natural litter cover was left intact, but plants were not included within the measuring chamber. For respiration rate measurements, a static, opaque gas chamber was placed on top of the collar to create a headspace in which CO2 emitted from the soil can accumulate. Both the collars and the chambers are made of PVC material and were painted white to limit heating of the chamber's headspace air. The chamber was equipped with a vent tube to minimise pressure differences and a septum connected to a three-way valve to allow the collection of headspace air samples. The headspace volume of the static gas chamber was 4 L, and the surface area was 0.019 m2. The set-up ensured that the conditions for a non-steady-state closed chamber flux measurements were still respected.
During each sampling event, the five gas chambers were closed for 90 min, during which 15 mL air samples were collected with a syringe from the chamber headspace at 30 min intervals, starting at time 0 min until 90 min (i.e. t1=0, t2=30, t3=60, and t4=90 min). Prior to air sample collection, the gas chamber headspace was flushed three times with its headspace air, using the sampling syringe to homogenise the air in the gas chamber headspace. Headspace air samples of 15 mL each were immediately injected in 12 mL pre-evacuated airtight vials (Labco Limited, Lampeter, Wales, UK) that were closed with a silicone septum (Dow Corning 734). This created a slight over-pressure in the vials. The headspace air samples were collected for 5 consecutive days during the start of the rainy season (August 2019), and the same process was repeated in the mid-rainy season (September 2019) to account for any seasonal variations in environmental conditions. CO2 emission measurements were not done in the dry season because microbial respiration and temperature sensitivity are low when the WFPS is below 30 % (Aon et al., 2001). The collection of headspace air samples was always consistently executed between 11:00 and 13:00 LT in all plots to minimise the effect of diurnal temperature differences (Keane and Ineson, 2017). The linearity of the headspace CO2 concentration increases over the full 90 min were checked and always fulfilled.
2.6 Determination of CO2 respiration rates, AE, and Q10
To convert the measured CO2 concentrations into respiration rates, we fitted a linear regression of the concentrations over time (for in situ measurements) or determined the change in headspace CO2 concentrations divided by incubation time (for laboratory incubation measurements). The derived soil CO2 respiration rates were then expressed in units of grams of C per unit area per hour (for in situ measurements), units of grams of C per unit of soil per hour, or normalised per unit SOC (for laboratory incubations), to obtain the “specific” heterotrophic CO2 respiration rate. This was done using the ideal gas law, as described in Eq. (3), to obtain the net gas respiration rates taking into account the headspace volume of the gas chamber, pressure, temperature, and molar weight of the gas (Collier et al., 2014; Dalal et al., 2008; Kutzbach et al., 2007).
where FC is the resulting gas respiration rate (in ; for in situ respiration rates), ΔC is the change in gas concentrations (parts per million – ppm), Δt is the change in incubation time (h), P is the pressure (atm), V is the volume of the gas chamber headspace (L), R is the molar gas constant (), T is the absolute temperature (K), A is the surface area of the gas chamber (m2), and Mw is the molar weight (g mol−1).
For the laboratory incubation experiments, the parameter A (i.e. the surface area of the gas chamber) was replaced either by the weight of the incubated soil (to express it as of soil) or by the amount of soil SOC (to express it as of SOC).
To determine the activation energy of CO2 respiration rate, we employed Eq. (4) with the respiration rate expressed per unit SOC.
where FC is the specific CO2 respiration rate ( of SOC), b is a pre-exponential factor (i.e. the theoretical reaction rate constant in the absence of activation energy), and AE is the activation energy (in kJ mol−1).
After log transformation, Eq. (4) becomes the following:
Hence, when plotting ln FC against , the AE can be determined as the slope of the linear regression (Fig. S1 in the Supplement).
To determine the coefficient for temperature sensitivity of SOC respiration (Q10), the CO2 respiration at five different incubation temperatures were firstly fitted to an exponential function (e.g. Eq. 6; Fig. S2 in the Supplement).
From the two exponential regression constants a and k, the k value was used to calculate the Q10, using Eq. (7).
2.7 Data analysis
To determine whether there was a difference in the CO2 respiration rates, AE and Q10 among the elevation clusters in the elevation gradient, we employed an analysis of variance (ANOVA) to check differences in means of each variable. Where a significant difference was detected, a post hoc analysis for multiple comparisons was performed using Tukey honest comparison of means to explicitly reveal which elevation clusters differed from each other. We used quantile–quantile and residual plots to check whether the data followed assumptions of ANOVA. To check whether there was a dependency of CO2 respiration rates, AE, and Q10 on elevation, we used the linear mixed-effect model regression package lme4 in R software, for which elevation was used as a fixed effect and the elevation cluster location as a random effect (to control the spatial clustering of the sampling plots). To estimate the P values, we used a type III ANOVA, with Satterthwaite's approximation method in the linear mixed-effect model. In each linear mixed-effect model, both marginal R squared () and conditional R squared () values were obtained, following Nakagawa and Schielzeth (2013). Furthermore, to check for a change in CO2 respiration rates, AE, Q10, SOC content, and δ13C values between control and in situ warmed soil at each elevation cluster, we used a Wilcoxon test. Subsequently, to check the effect of warming along the entire elevation gradient, we fitted a linear mixed effect model for both control and warmed soil, where elevation was used as fixed effect and the elevation clusters as random. Finally, we employed principal component analysis to explore changes in microbial community and soil physicochemical properties along the elevation gradient. All data were analysed using R software (R Core Team, 2021), and a P value of 0.05 was taken as the significance level.
3.1 Physicochemical soil properties and microbial community
The physicochemical soil properties in the Rwenzori elevation gradient are described in Table 1. Along the elevation gradient, the average annual soil temperature, bulk density, and pHKCl decreased linearly. On the other hand, the SOC, soil total N, and carbon-to-nitrogen (C:N) ratio increased linearly with increasing elevation. Furthermore, the δ13C values of the SOC showed no linear trend along the elevation gradient.
Table 1Physicochemical soil properties (0–10 cm) of the elevation gradient on the east-facing slope of the Rwenzori Mountains National Park (1750–3000 m a.s.l.) and the premontane Kibale Forest National Park (1250–1300 m a.s.l.). Indicated are the mean values plus/minus the standard deviations of the average annual soil temperature at 5 cm depth, bulk density (ρb), pH in KCl solution (pHKCl), soil organic carbon (SOC) content, total nitrogen (TN) content, carbon-to-nitrogen ratio (C:N), δ13C values, and δ15N values. The elevation trend from the linear mixed effect regression model estimate per 100 m of elevation increase is also indicated with the standard error (SE), P value, marginal R2 (), and conditional R2 ().
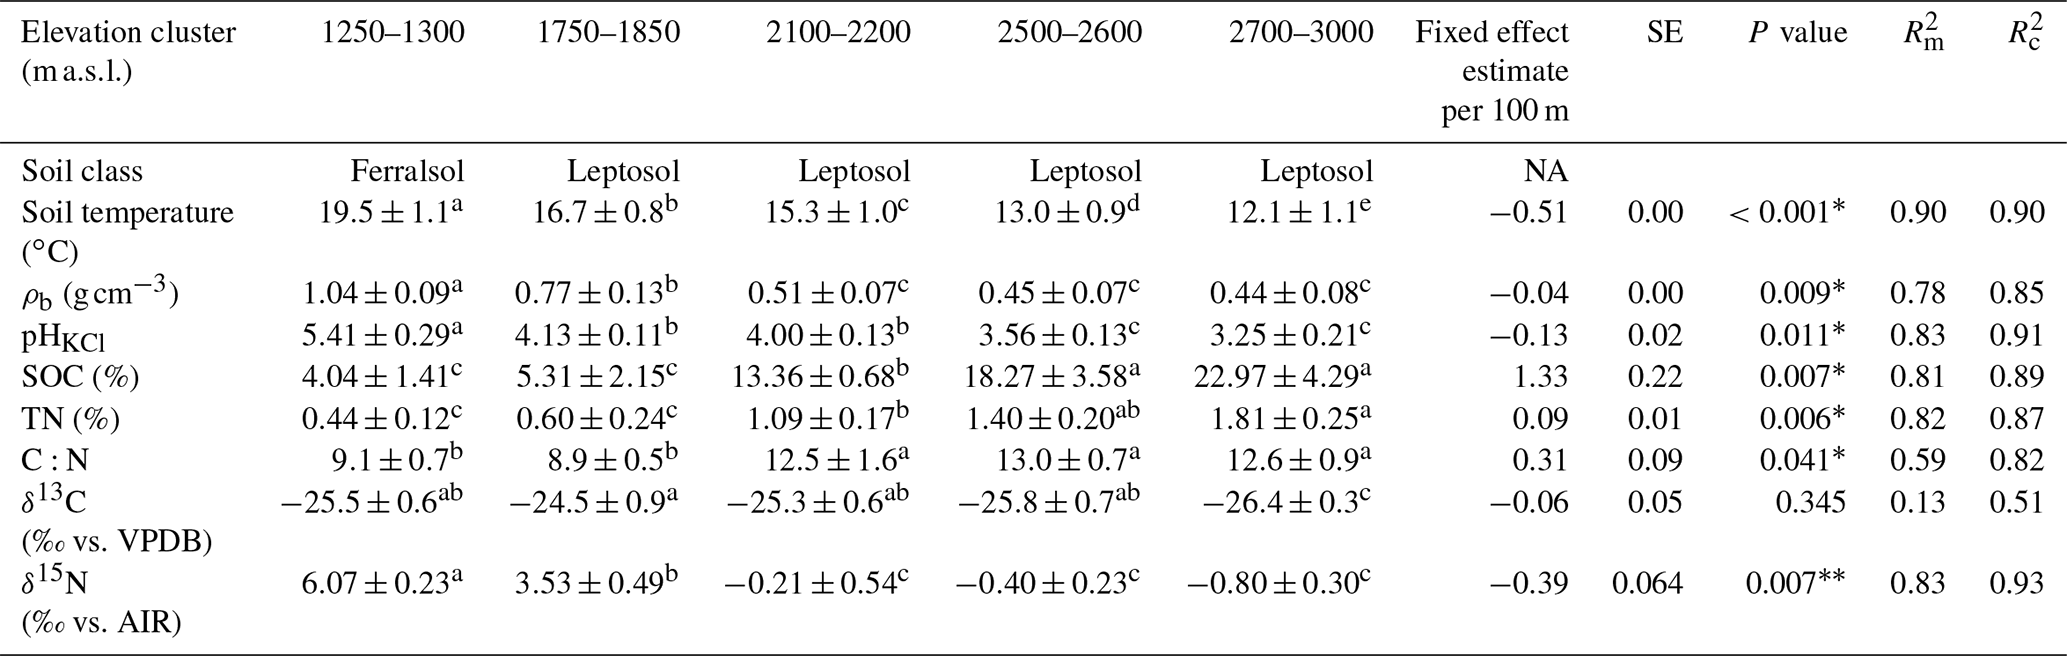
Different lowercase letters in superscript next to the values of each elevation cluster (same row) indicate a significant difference among the sites at P<0.05. The mean values were calculated from four separate composite soil samples per elevation cluster and are expressed per unit of dry soil. The P values for a statistically significant elevation linear trends are marked with an asterisk∗. For the measurement of δ13C values, the standard used was VPDB (Vienna Pee Dee Belemnite), while δ15N values were measured with reference to air.
Furthermore, at the start of the rainy season, the average in situ soil temperature at 5 cm depth decreased from 19.6 ± 0.3 ∘C at 1250–1300 m to 11.9 ± 0.5 ∘C at 2700–3000 m (Table S3 in the Supplement). Generally, along the elevation gradient, the average soil temperature at the start of the rainy season decreased linearly at a rate of 0.50 ± 0.04 ∘C per 100 m of elevation increase (; P=0.006; Fig. S3 in the Supplement). On the other hand, in the mid-rainy season, the average in situ soil temperature decreased from 20.4 ± 0.4 ∘C at 1250–1300 m to 12.3 ± 0.4 ∘C at 2700–3000 m. Similarly, in the mid-rainy season, the soil temperature decreased linearly by 0.52 ± 0.06 ∘C per 100 m of elevation increase (; P=0.014; Fig. S3). Additionally, at each elevation cluster, the average soil temperature at 5 cm depth was significantly higher in the mid-rainy season than at the start of the rainy season (Table S3 and Fig. S3).
In addition, at the start of the rainy season, the average percentage WFPS was 33.1 % ± 1.2 % at 1250–1300 m, 22.2 % ± 2.5 % at 1750–1850 m, 41.7 % ± 2.9 % at 2100–2200 m, and 42.7 % ± 8.7 % at 2700–3000 m (Table S3). Generally, along the elevation gradient, the average WFPS showed no significant elevation trend at the start of the rainy season (Fig. S3). In the mid-rainy season, the average percentage of WFPS was 57.2 % ± 5.8 % at 1250–1300 m, 44.8 % ± 3.8 % at 1750–1850 m, 45.4 % ± 4.8 % at 2100–2200 m, and finally 44.5 % ± 9.0 % at the highest-elevation cluster (2700–3000 m; Table S3). Generally, along the elevation gradient, the average WFPS showed no significant elevation trend in the mid-rainy season (Fig. S3). On the other hand, the soil moisture content was always higher in the mid-rainy season in all elevation clusters, except at 2700–3000 m (no significant difference; Table S3).
Finally, along the elevation gradient, the microbial community composition showed no significant trend (Fig. S4 in the Supplement). The percentage of the variability explained by elevation was low for each microbial group, i.e. gram-positive bacteria (), gram negative bacteria (), fungi (), total PLFA (bacteria plus fungi; ), the ratio of gram-positive to gram-negative bacteria (), and the ratio of bacteria to fungi (; Fig. S4). Subsequently, the principle component analysis (PCA) of soil parameters (including microbial community composition) further confirmed that the ratio of bacteria to fungi depicted a weak negative correlation with elevation. Furthermore, the ratio of gram-positive to gram-negative bacteria revealed a weak positive correlation with elevation (Fig. S4 and Table S2 in the Supplement). The parameters of principle component 1 with correlation scores above 0.5 included the total PLFA (bacteria plus fungi), fungi, gram-positive and gram-negative bacteria, and physicochemical soil properties (soil bulk density, temperature, pH, SOC, total N, and C:N). On the other hand, parameters of principle component 2 included the total PLFA (bacteria plus fungi), fungi, gram-positive and gram-negative bacteria, and the ratio of gram-positive to gram-negative bacteria and soil pH. Generally, the PCA indeed revealed that the five elevation clusters have similar cluster-level soil physicochemical properties. Furthermore, it shows that the microbial community vectors are roughly orthogonal to the vectors of soil physicochemical properties. Up to 57.0 % and 23.3 % of the variability in the parameters were explained by principle components 1 and 2, respectively (Fig. 2 and Table S2).
3.2 Laboratory-based heterotrophic soil CO2 respiration rate, AE, and Q10
The heterotrophic CO2 respiration rates from laboratory incubations at the corresponding mean in situ temperature only showed a significant difference when comparing the elevation cluster at 2100–2200 m (CO2 respiration rate of 0.71 ± 0.27 of soil) with the elevation cluster at 2700–3000 m (CO2 respiration rate of 0.55 ± 0.15 of soil; P=0.025; Table S3). Furthermore, the heterotrophic CO2 respiration rate at the elevation cluster of 1750–1850 m was 0.51 ± 0.20 of soil, which was statistically similar to the respiration rate of 0.55 ± 0.15 of soil at the highest-elevation cluster (2700–3000 m). Similarly, the heterotrophic respiration rate of 0.67 ± 0.22 of soil and of 0.64 ± 0.25 of soil were recorded for the lowest-elevation cluster (1250–1300 m) and the mid-elevation cluster at 2500–2600 m, respectively (Table S3). Consequently, the heterotrophic CO2 respiration rate from laboratory incubations showed a non-significant linear decrease at a rate of 0.004 ± 0.008 of soil per 100 m of elevation increase (; P=0.677; Table 2 and Fig. 3a).
Table 2Fixed effect estimates of elevation (per 100 m elevation increase) on selected soil parameters. The associated standard error (SE), P value, marginal coefficient of determination (), and conditional coefficient of determination () are indicated.
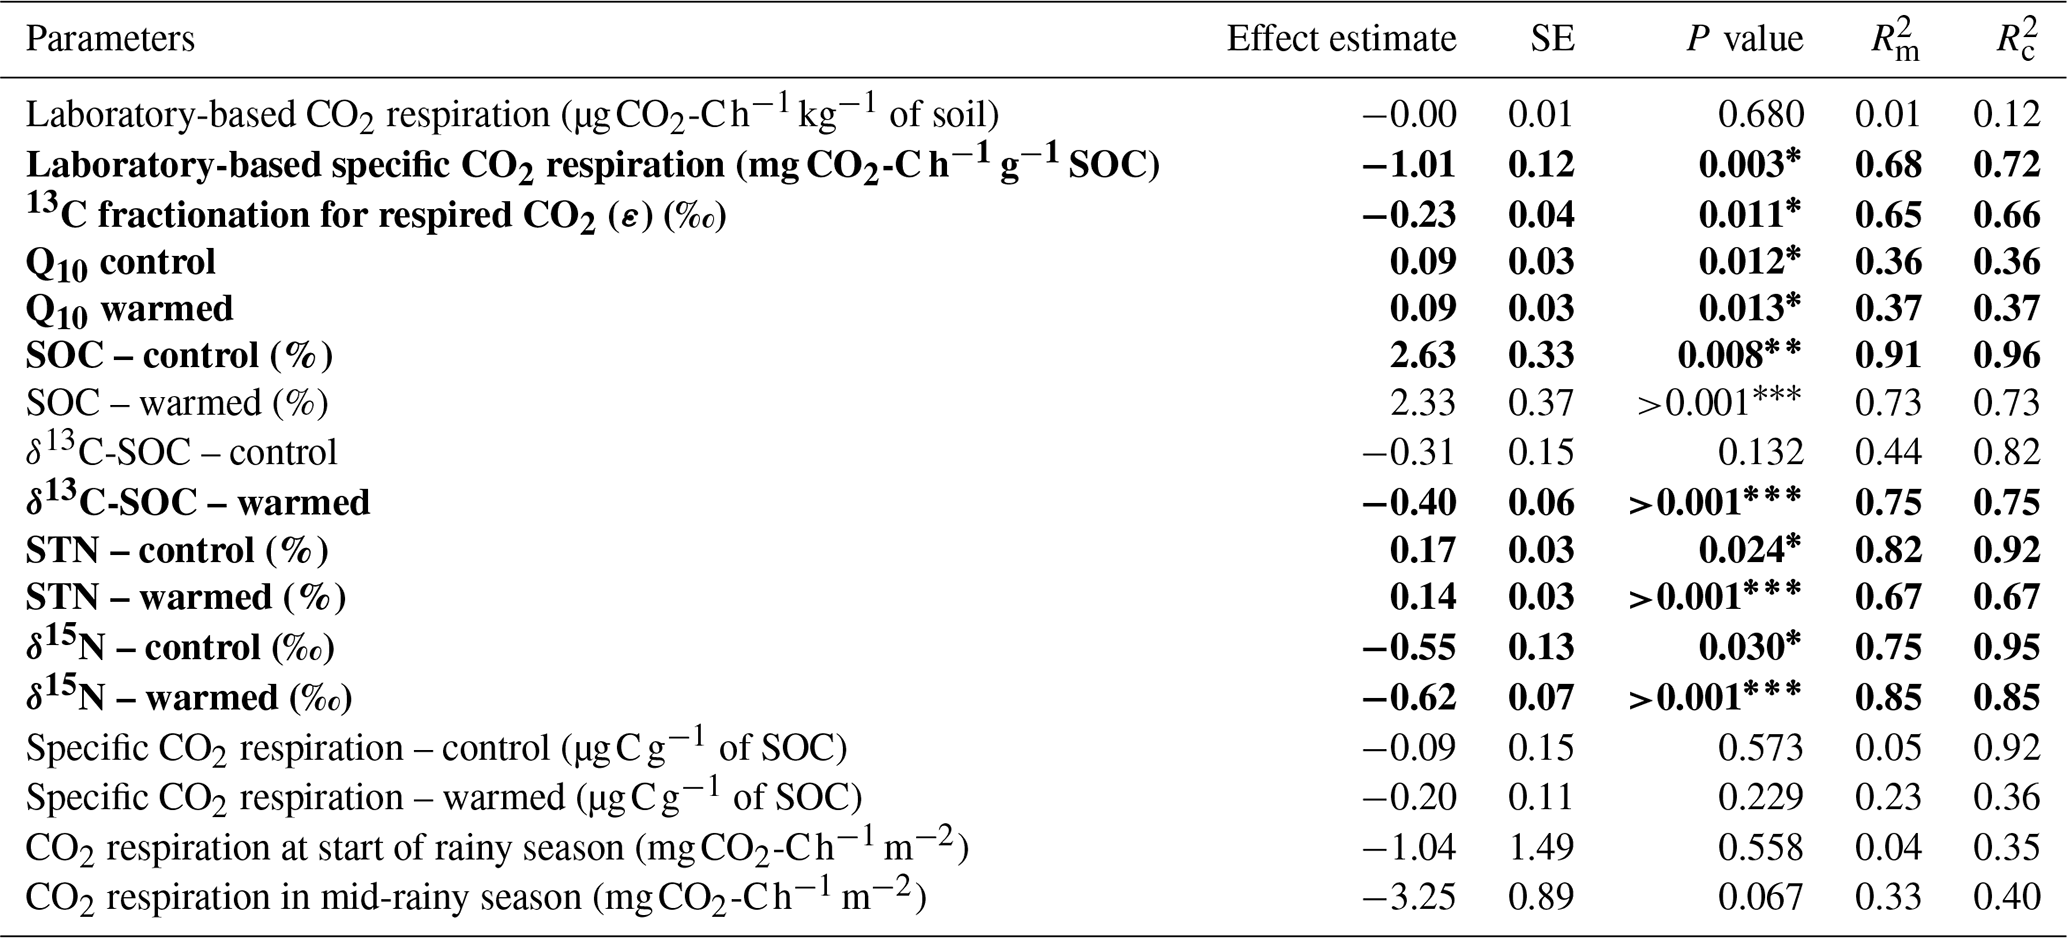
A statistically significant elevation linear trend is given in bold typeface, and the P value is marked with an asterisk∗, with ∗ for P<0.05, for P<0.01, and for P<0.001. is the proportion of the variance in the response variable explained by the fixed effect (elevation), and is the proportion of the variance in the response variable explained by the fixed effect plus random location effects.
In contrast, the specific heterotrophic CO2 respiration rate (normalised per gram of SOC) revealed a significant linear trend along the elevation gradient. The highest CO2 respiration rate of 17.2 ± 5.3 of SOC was detected at the lowest-elevation cluster (1250–1300 m). This decreased to 10.8 ± 4.8 of SOC at 1750–1850 m and to 5.3 ± 2.1 of SOC at 2100–2200 m. Furthermore, lower values of 3.7 ± 1.9 of SOC and 2.4 ± 0.9 of SOC were observed at the highest two elevation clusters of 2500–2600 m and 2700–3000 m, respectively (Table S3). Generally, along the elevation gradient, the specific heterotrophic CO2 respiration rate decreased linearly by 1.01 ± 0.12 of SOC per 100 m of elevation increase (; P=0.003; Table 2 and Fig. 3b).
Furthermore, following the decreasing trend in the specific heterotrophic CO2 respiration rate along the elevation gradient, respired CO2 indeed was more depleted in 13C in warmer, lower elevations compared to colder, higher elevations (Fig. 3c). The 13C isotopic fractionation of the respired δ13C–CO2 relative to δ13C SOC was −3.2 ‰ ± 0.6 ‰ at 1250–1300 m, −2.8 ‰ ± 0.9 ‰ at 1750–1850 m, −1.7 ‰ ± 0.7 ‰ at 2100–2200 m, −1.0 ‰ ± 1.3 ‰ at 2500–2600 m, and 0.3 ‰ ± 0.8 ‰ at 2700–3000 m (Fig. 3c and Table S3). Along the elevation gradient, the 13C isotopic fractionation during heterotrophic CO2 respiration showed a significant linear decrease by 0.23 ‰ ± 0.04 ‰ per 100 m of elevation increase (; P=0.011; Table 2 and Fig. 3c).
On the other hand, along the elevation gradient, AE ranged from 28.5 ± 5.6 kJ mol−1 in the premontane elevation cluster (1250–1300 m) to 70.3 ± 6.9 kJ mol−1 at 2500–2700 m and 69.9 ± 3.0 kJ mol−1 in the highest-elevation cluster (2700–3000 m; Table S3). Generally, along the elevational gradient, the AE showed a significant linear increase of 3.2 ± 0.7 kJ mol−1 per 100 m of elevation increase (; P<0.01). Similarly, along the elevation gradient, Q10 values ranged from 1.50 ± 0.13 in the lowest elevation (1250–1300 m) to 2.68 ± 0.25 in the highest elevation (2700–3000 m; Table S3). Generally, along the elevation gradient, the Q10 showed a linear increase of 0.09 ± 0.03 per 100 m of elevation increase (P=0.012; Table 2 and Fig. 3d).
3.3 Effect of soil warming on CO2 respiration, AE, Q10, SOC, and δ13C values
After about 2 years of in situ soil warming, heterotrophic CO2 respiration rates, AE and Q10 were assessed in a laboratory incubation experiment for control and warmed soil. Additionally, the SOC content and its δ13C values for control and warmed soil were analysed. The results revealed that, at each elevation cluster, there was no significant difference in the studied parameter between control and warmed soil (Table S3). However, along the entire elevation gradient, a consistent trend was observed, such that both the non-specific and specific heterotrophic CO2 respiration rates for controlled soil were relatively higher than those of warmed soil (Fig. 4a and b, respectively; Table S3). Similarly, along the elevation gradient, both the AE and Q10 coefficients for control were relatively higher than those of warmed soil (Fig. 4c and d, respectively). Additionally, after 2 years of in situ soil warming, the SOC contents of warmed soil were relatively lower than those of the control along the elevation gradient (Fig. 4e). Finally, though not statistically significant, the δ13C values of the SOC showed that warmed soil tended to become relatively more enriched in 13C compared to the control soil (Fig. 4f).
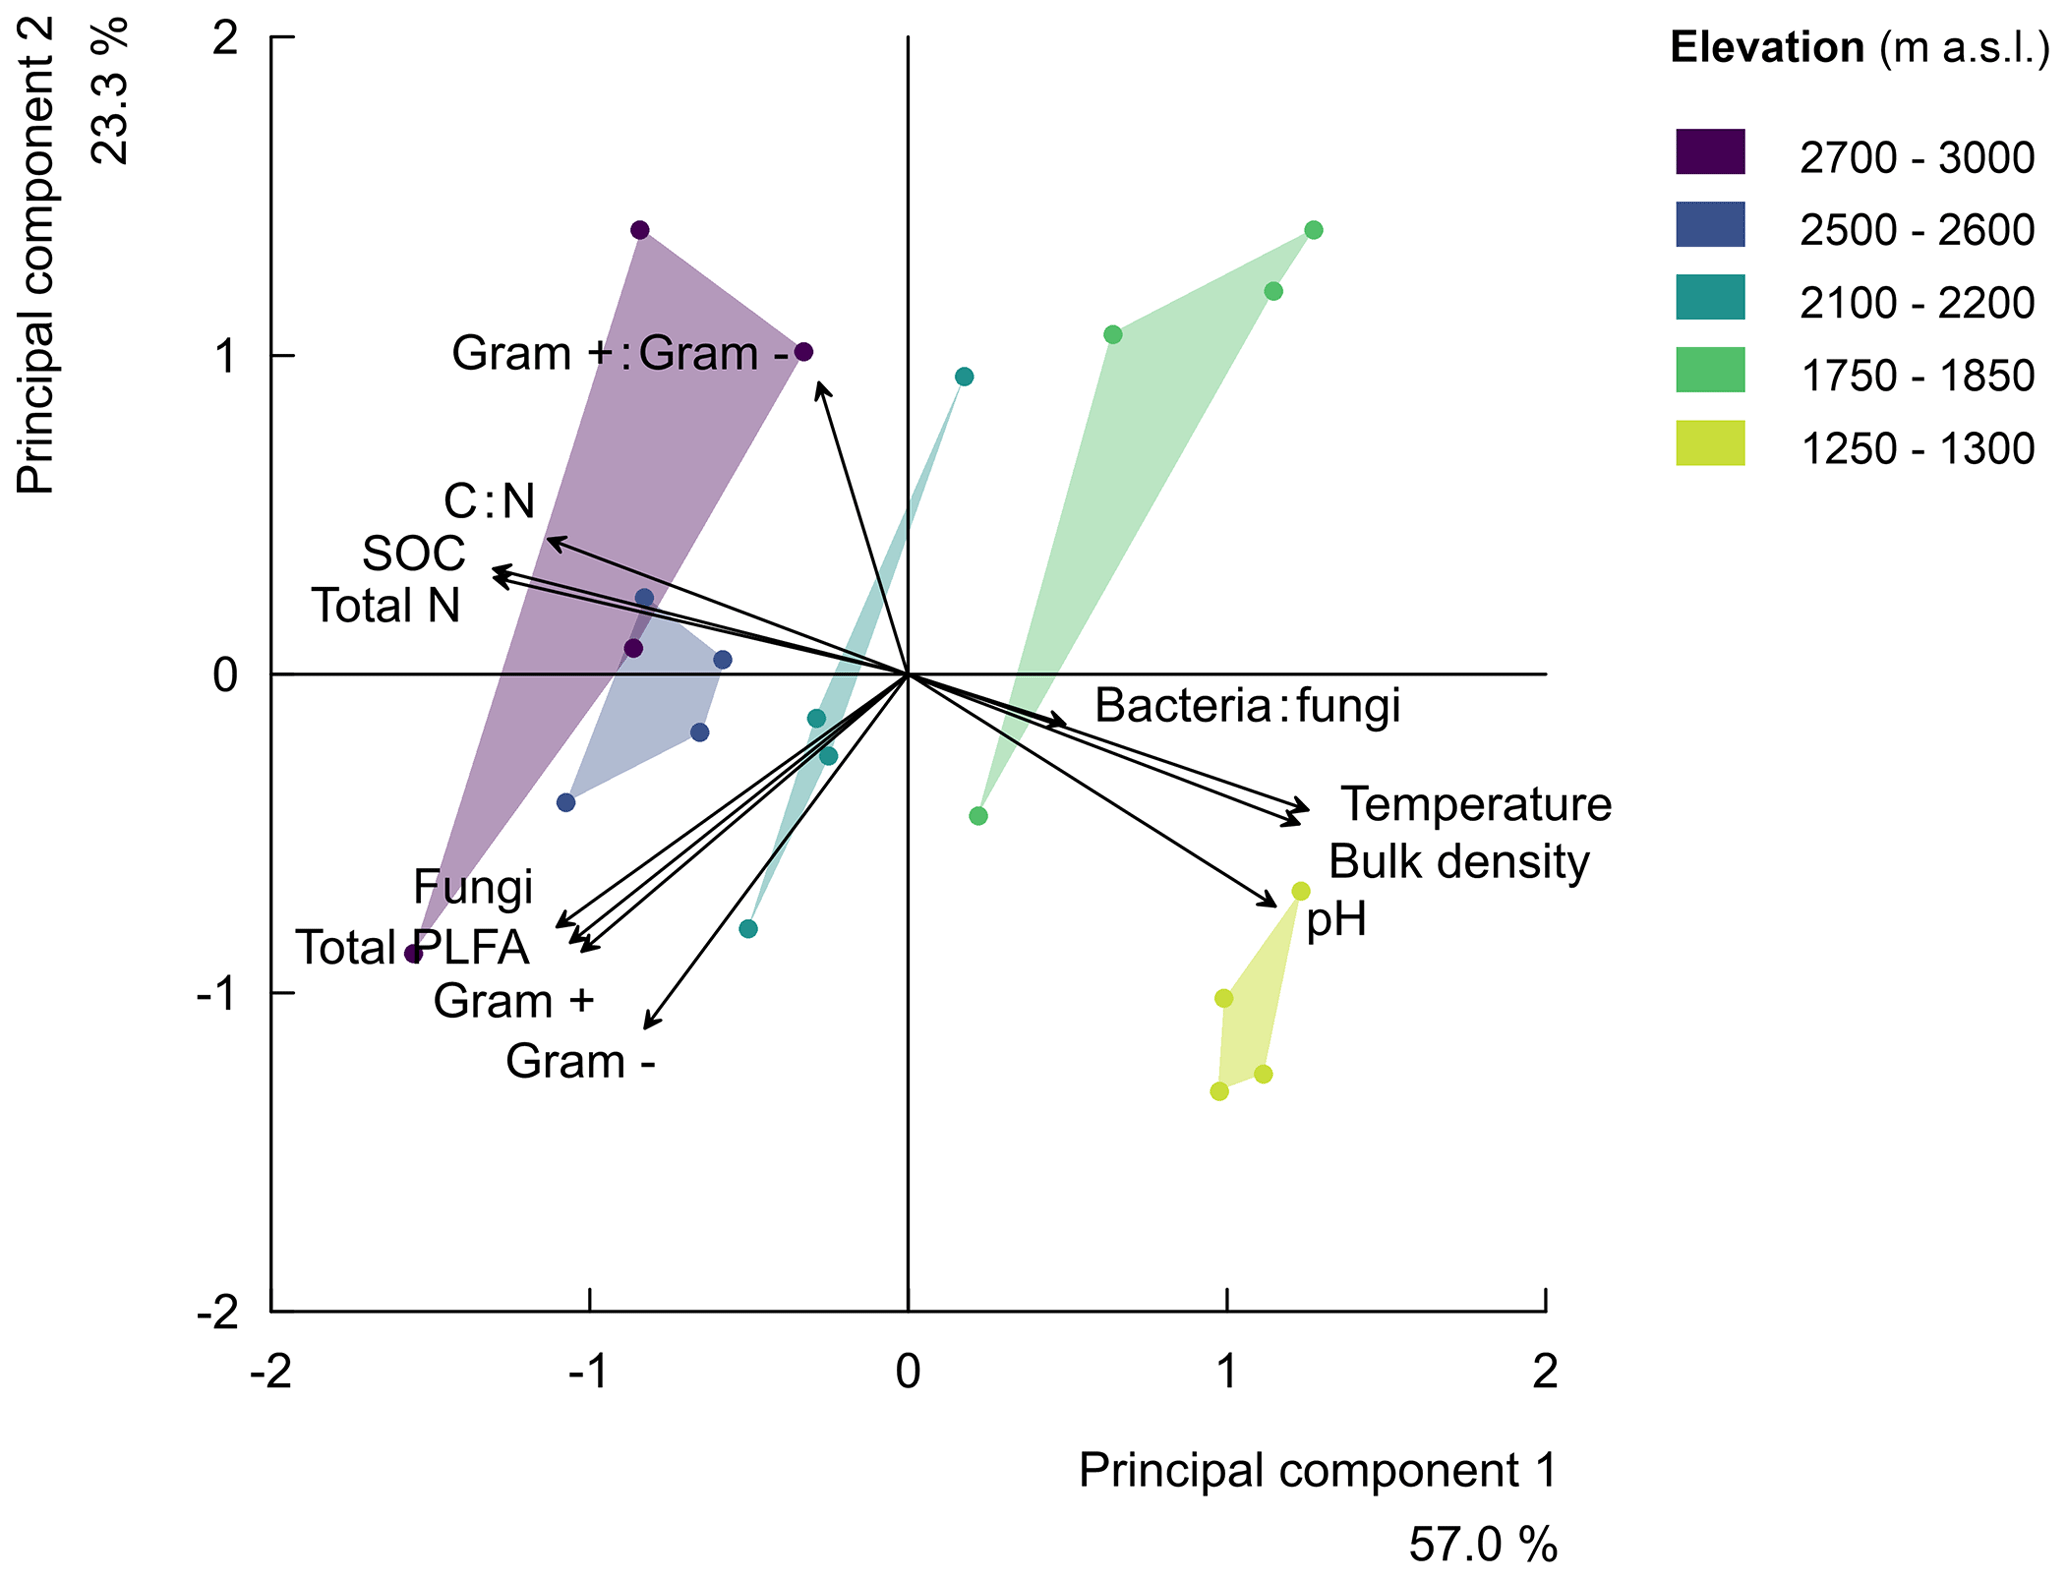
Figure 2Principal component analysis (rescaled) of the relationships along the elevation gradient for soil physicochemical properties (i.e. the soil total nitrogen (total N), soil organic carbon (SOC), carbon-to-nitrogen ratio (C:N), soil pH (pH), soil temperature at 5 cm depth (temperature), and bulk density) and the microbial community compositions (i.e. the bacteria-to-fungi ratio, bacteria:fungi, total PLFA in nmol g−1 of soil, and the ratio of gram-positive-to-gram-negative bacteria, gram+:gram-). The principal component 1 explained 57.0 % of the variability in the studied parameters, while principal component 2 explained 23.3 % of the variability. The symbols of the individual plots on the biplot of the first two principal components are shown in different colours per elevation cluster.
3.4 In situ CO2 respiration under current conditions at the start of the rainy season and mid-rainy season
The in situ total (heterotrophic and autotrophic) CO2 respiration rates along the elevation gradient at the start of the rainy season were only significantly different when comparing the upper montane cluster (2700–3000 m) with the rest of the elevation clusters (1250–2200 m; P=0.027; Table S3). Total CO2 respiration rate ranged from 95.1 ± 34.6 in the lower montane elevation cluster at 2100–2200 m to 59.3 ± 16.7 at 2700–3000 m. The total CO2 respiration rate in the lower three elevations (1250–2200 m) were similar, ranging between 79.2 ± 17.3 and 95.1 ± 34.6 (Table S3). Generally, along the elevation gradient, there was no significant linear trend in the total CO2 respiration rate, though this tended to decrease at a rate of 1.04 ± 1.49 per 100 m of elevation increase at the start of the rainy season (; P=0.558; Table 2 and Fig. S3).
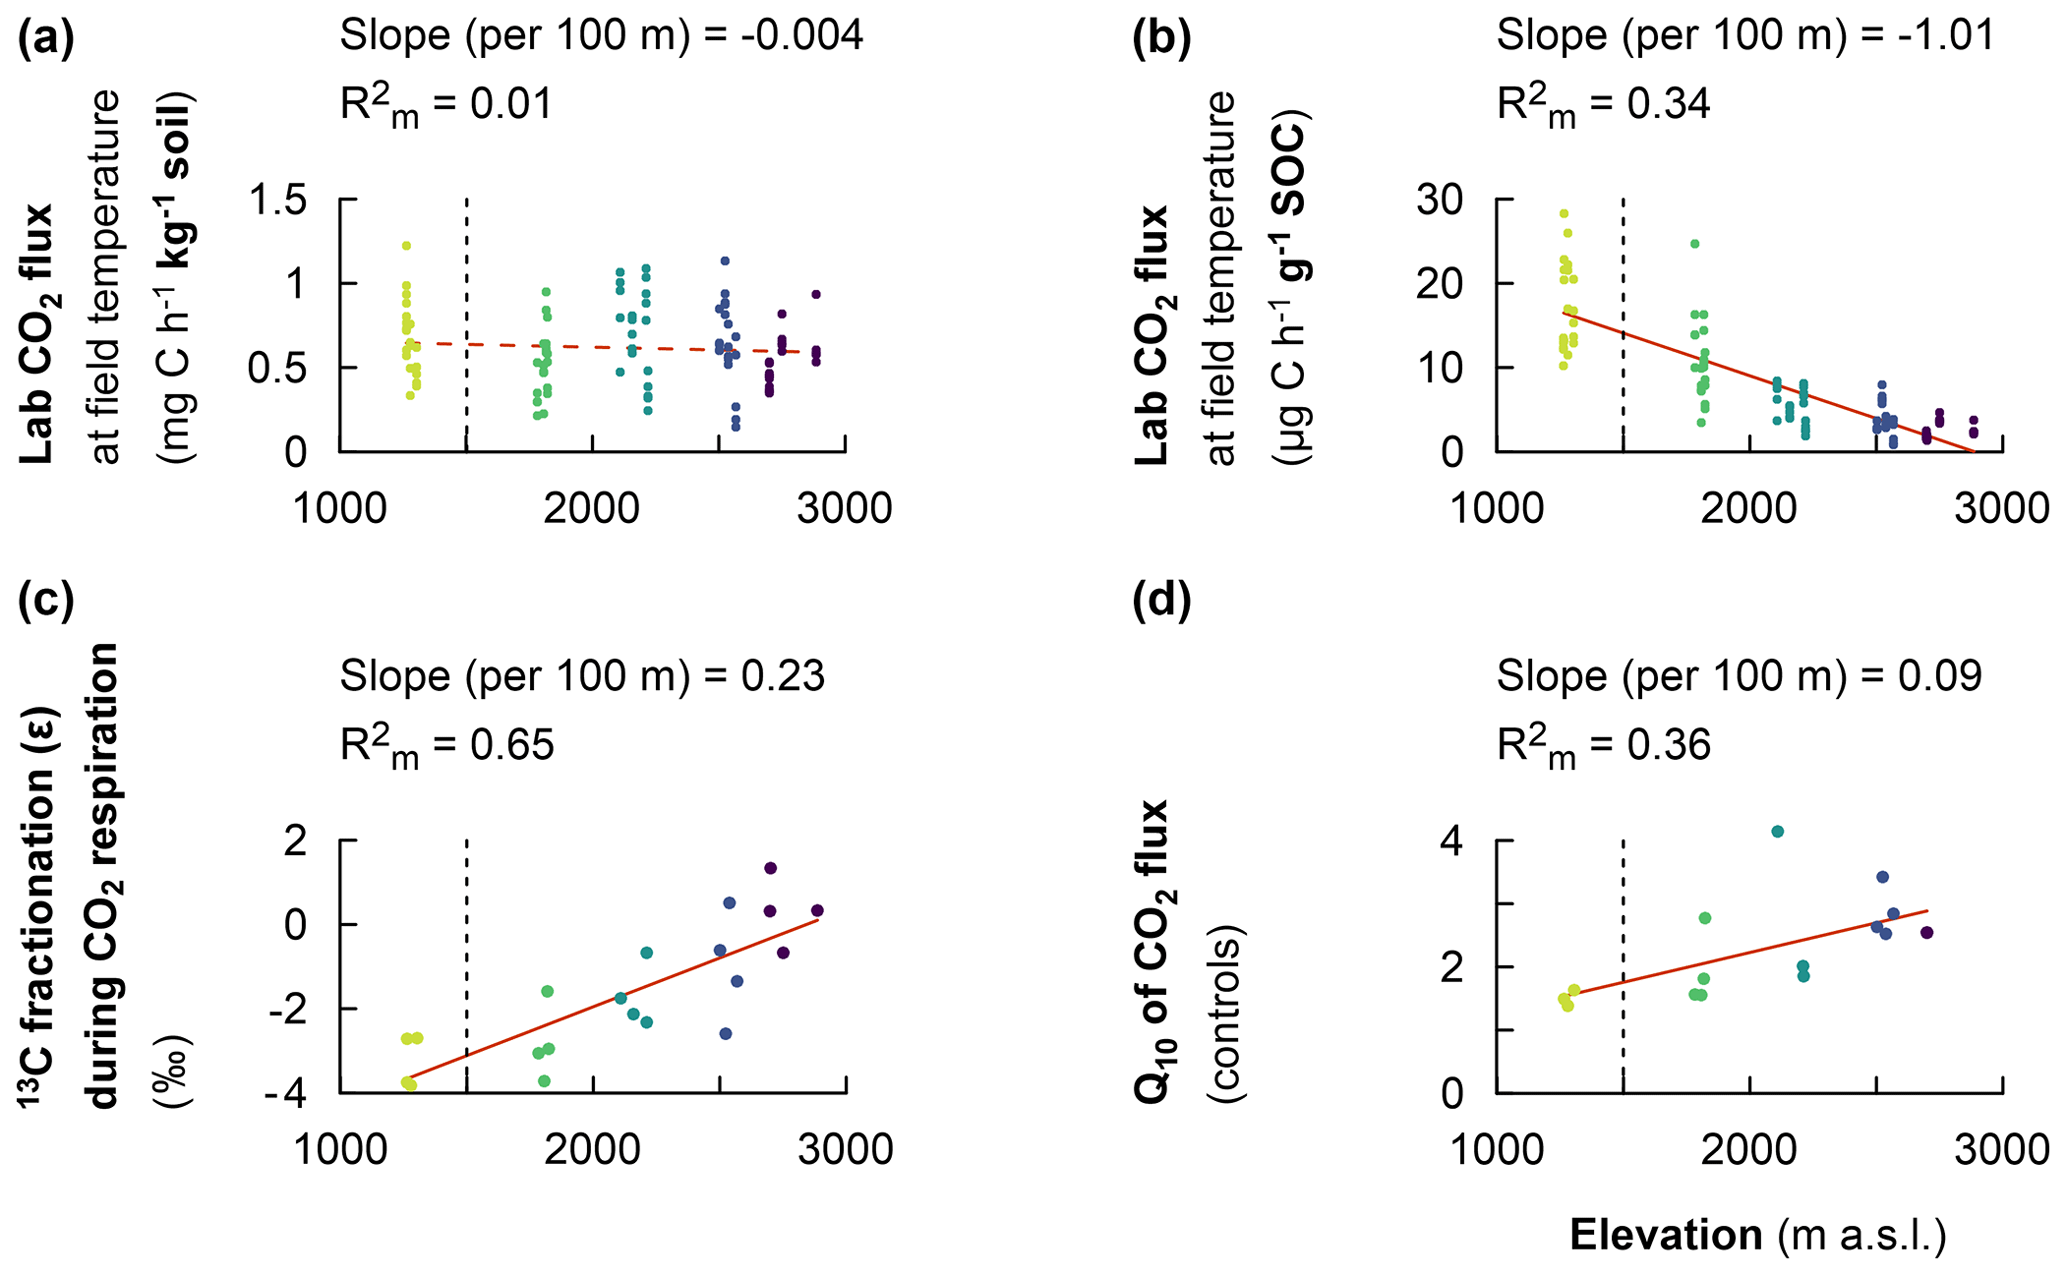
Figure 3Fixed effect estimates of elevation (per 100 m elevation increase) on response parameters. Laboratory-based heterotrophic CO2 respiration rates at the corresponding mean in situ temperature (a). The specific heterotrophic CO2 respiration rates at the corresponding mean in situ temperature (b). The 13C isotopic fractionation during heterotrophic CO2 respiration (c). The temperature sensitivity of heterotrophic CO2 respiration rates (Q10) (d). The slope of the linear mixed effect model estimates per 100 m of elevation increase is indicated (red solid line for a significant effect and red dashed line for no significant effect), as is the marginal R2 (), representing the fraction of the response variable explained by elevation. Plots from montane forest clusters (from 1750–3000 m a.s.l.) were compared with a nearby premontane forest (separated by a vertical dashed line) at an elevation of 1250–1300 m a.s.l.
On the other hand, in the mid-rainy season, there was a much stronger variability in the in situ total CO2 respiration rates among the elevation clusters (P<0.001; Table S3). The total CO2 respiration rate was highest (i.e. 113.2 ± 35.7 ) in the premontane elevation cluster at 1250–1300 m. A statistically similar respiration rate of 112.8 ± 20.3 was found in the montane foothills at 1750–1850 m. There was a significantly lower total CO2 respiration rate (i.e. 89.0 ± 22.3 ) at 2100–2200 m, which further decreased to 67.7 ± 9.6 at 2700–3000 m (Table S3). Overall, along the elevation gradient, there was also no significant linear trend in the total CO2 respiration rate, which tended to decrease at a rate of 3.25 ± 0.89 per 100 m of elevation increase (; P=0.067; Table 2 and Fig. S3).
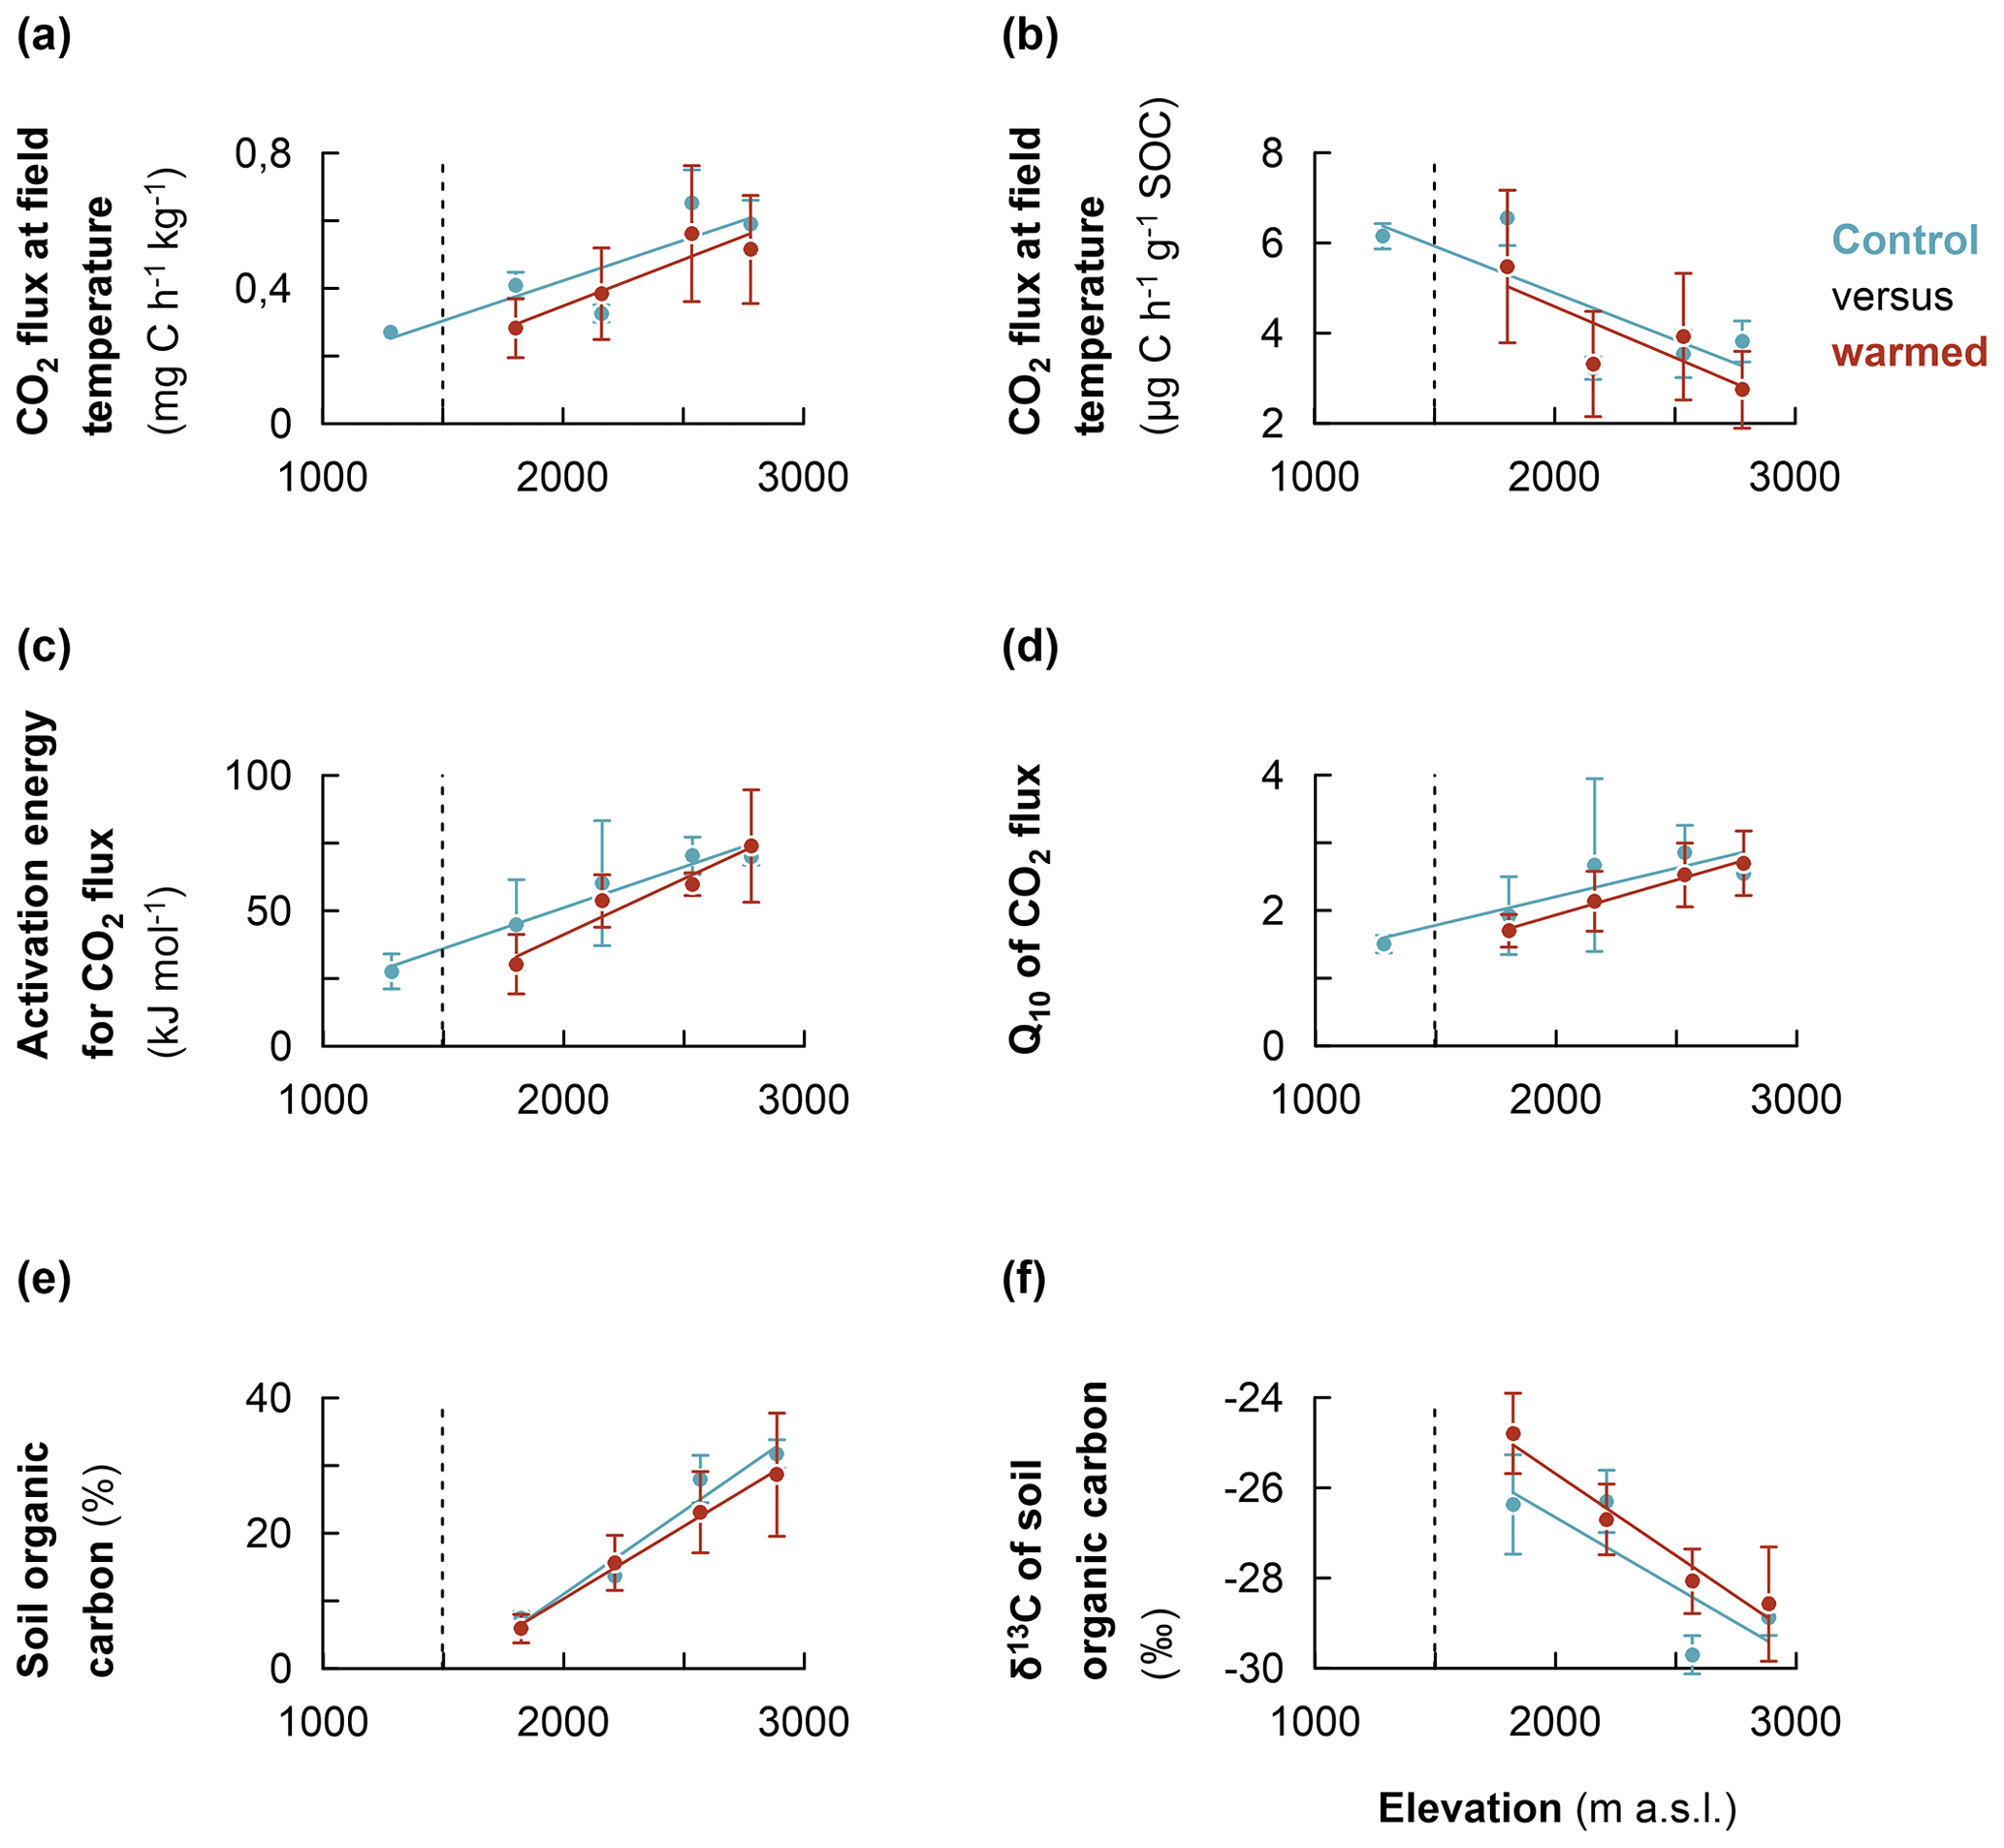
Figure 4Comparison of the warming response of soil organic carbon along the Rwenzori elevation gradient. (a) Heterotrophic CO2 respiration rates of control and warmed soils (measured at the translocated in situ temperature). (b) The same as for the specific CO2 respiration rates. (c) Activation energy for control and warmed soil. (d) Sensitivity of CO2 respiration rates to temperature (Q10) for control and warmed soil. (e) Soil organic carbon content for control and warmed soil. (f) δ13C values of soil organic carbon for control and warmed soil. Mean values were calculated from composite soil samples per elevation cluster (n=4). The error bars indicate the standard deviation from the mean. For the measurement of δ13C values, the standard used was the international VPDB (Vienna Pee Dee Belemnite).
A comparison of seasonal in situ total CO2 respiration rates generally revealed that higher soil moisture contents were associated with higher CO2 respiration rates. Specifically, at 1250–1300 m, the total CO2 respiration rate at the start of the rainy season (80.1 ± 15.8 ) increased significantly to 113.2 ± 9.6 in the mid-rainy season (P<0.001; Table S3). Similarly, the total CO2 respiration rate at 1750–1850 m increased significantly from 79.2 ± 17.3 at the start of the rainy season to 112.8 ± 20.3 in the mid-rainy season (P<0.001). There was no seasonal variation in the total CO2 respiration rate at 2100–2200 m, where the total CO2 respiration rate was between 95.1 ± 34.6 and 89.0 ± 22.3 at the start of the rainy season and in the mid-rainy season, respectively. At 2700–3000 m, the total CO2 respiration rate increased significantly from 59.3 ± 16.7 at the start of the rainy season to 67.7 ± 9.6 in the mid-rainy season (P=0.035; Table S3).
4.1 Elevation trend in CO2 respiration, 13C fractionation of the respired CO2, and Q10
The specific heterotrophic CO2 respiration decreased along the elevation, in part due to the negative effect of low temperature on microbial activity (Zimmermann et al., 2009). In support of the temperature effect on CO2 respiration (Fig. 3b), the apparent 13C fractionation for SOC transformation was also temperature dependent. The emitted CO2 at the warm, lower elevations showed a higher apparent fractionation (and subsequently tended to be relatively more depleted in 13C) than at the cold, higher elevations (Fig. 3c). This observation may result from either a shift in the use of C substrates along the temperature gradient or 13C discrimination during SOC decomposition by micro-organisms (Andrews et al., 2000; Ehleringer et al., 2000; Natelhoffer and Fry, 1988). Indeed, the N stable isotope composition also indicated a decrease in δ15N values with elevation (Table 1). This indicates a more closed N cycling and reduced N transformation with increasing elevation, characterised by low N losses (Amundson et al., 2003; Boeckx et al., 2005). Similarly, the observed higher apparent 13C fractionation indicates differences in the rate of soil organic matter transformation across different elevations. Altogether, these results imply that, at higher elevations, even though SOC contents were high, the microbial decomposition was limited by low temperatures (Zimmermann et al., 2009). In addition, low CO2 respiration at high elevations is likely explained by the inhibitory effect of the low soil pH on microbial respiration (Fig. 3b and Table S1 in the Supplement; Rousk et al., 2009) impairing microbial activity (Walse et al., 1998). Furthermore, low pH is also known to facilitate the stabilisation of organic matter through complexation reactions with iron and aluminium ions, which become soluble at a low pH (Lützow et al., 2006).
Additionally, the observed linear increases in Q10 and AE with elevation (Table 2 and Fig. 3d), indicate an increasing trend in soil organic matter recalcitrance, resulting in lower specific CO2 respiration at high elevations (Davidson and Janssens, 2006). This is corroborated by the decreasing apparent 13C fractionation (Table 2 and Fig. 3c) and lower specific heterotrophic CO2 respiration in higher elevations at a uniform temperature and 60 % WFPS (; P=0.02; Fig. S5 in the Supplement). The linearly increasing elevation trend in AE and Q10 is consistent with the intrinsic principles of microbial respiration kinetics associated with the Arrhenius equation (Craine et al., 2010; Davidson and Janssens, 2006; Schipper et al., 2014). Accordingly, the sensitivity of microbial decomposition to an increment in temperature should increase with the increasing AE and recalcitrance of the substrate (Craine et al., 2010; Luo et al., 2001; Davidson and Janssens, 2006). As such, more complex (i.e. recalcitrant) C compounds, for which the microbial decomposition requires more AE, render a lower specific heterotrophic CO2 respiration (Fig. S5) and a higher Q10 (i.e. their decomposition is enhanced to a higher extent at a certain increase in temperature) than more simple (i.e. labile) C substrates (Craine et al., 2010; Davidson and Janssens, 2006; Nottingham et al., 2019).
4.2 Effect of in situ warming
Generally, after 2 years of in situ warming, δ13C values of SOC revealed a tendency of relative enrichment in 13C in warmed soil compared to the control (Fig. 4f). This trend is consistent with the observation of 13C-depleted C losses during microbial CO2 respiration (Fig. 3c). The trend of relative enrichment in 13C in warmed soil compared to the control is likely due to enhanced mineralisation rates in the warmed soil. Higher mineralisation causes a change in 13C fractionation due to changes in the C substrate (following the depletion of most labile C) and/or microbial discrimination against 13C during C transformation processes (Andrews et al., 2000; Ehleringer et al., 2000; Natelhoffer and Fry, 1988). Altogether, these results (increase in organic matter transformation and likely change in C substrate following the depletion of most labile C) imply that warming has indeed increased the mineralisation of SOC in warmed relative to control soil, owing to the increase in microbial activity at higher temperatures in correspondence with the Arrhenius equation (Craine et al., 2010; Mohan, 2019; Nottingham et al., 2020). Indeed, along the elevation gradient, SOC contents tended to become relatively lower in warmed compared to control soils (Fig. 4e). Subsequently, the CO2 respiration for warmed soils were relatively lower than in the control soils due to the apparent depletion of respiration substrate during the 2 years of warming. The evidence of accelerated mineralisation of SOC upon warming supports the results of several soil warming studies that reported an increment in CO2 respiration upon warming (Eliasson et al., 2005; Luo et al., 2001; Melillo et al., 2002; Rustad et al., 2001). The increased decomposition following a temperature increase has the ability to inherently change the content and quality of the SOC if organic inputs cannot replenish SOC loss at the same rate (Craine et al., 2010; Davidson and Janssens, 2006; Luo et al., 2001). Nonetheless, the lack of significant difference in CO2 respiration rates for warmed and control soil at each elevation cluster after 2 years of warming may also indicate the fact that labile SOC fractions were not depleted after 2 years at a higher temperature (Crowther et al., 2016; Davidson and Janssens, 2006; Melillo et al., 2017).
On the other hand, along the elevation gradient, the AE, and Q10 values of warmed soils were relatively lower than in the control soils (Fig. 4c and d, respectively). This trend is expected as the Arrhenius equation predicts that the Q10 of a certain reaction intrinsically decreases with increasing temperature (Craine et al., 2010; Davidson and Janssens, 2006). As such, SOC substrates would become overall less recalcitrant after 2 years at an elevated temperature. Indeed, while warming increases the mineralisation rate of the most labile C, it also stimulates the decomposition of recalcitrant C fractions to a relatively higher degree than labile fractions because of the higher Q10 of the former (Craine et al., 2010; Davidson and Janssens, 2006). Subsequently, the AE and Q10 of warmed soils tended to become relatively lower than those of the control soils, as reported by several authors (Davidson and Janssens, 2006; Mohan, 2019; Nottingham et al., 2020). Both the decrease in SOC contents and the relatively enhanced activation of recalcitrant organic matter upon warming undermine the climate mitigation function of the soil (Davidson and Janssens, 2006; Nottingham et al., 2020; Walker et al., 2018).
We note that the lack of significant difference in the CO2 flux and associated selected parameters at each elevation cluster may be due to the too short duration of the warming experiment. Additionally, the high spatial variability in soil properties and environmental conditions (e.g. variation in slope and aspect) often precludes powerful statistical tests for small treatment effects (Davidson and Janssens, 2006), as is usually the case in warming experiments. Furthermore, warming may result in a trade-off effect on SOC respiration. For instance, increased mineralisation rates upon warming are expected to reduce SOC (Nottingham et al., 2019). Similarly, higher litter input and turnover at lower elevations (Okello et al., 2022), is expected to increase SOC. As such, the trade-off effect of these processes likely dampened the net effect of (short-term) warming on SOC transformation processes.
4.3 Present-day CO2 respiration along the Rwenzori elevation gradient
Along the Rwenzori Mountains elevation gradient, we observed that the in situ total CO2 respiration rates were significantly lower at the highest elevation cluster of the montane forest at the start of the rainy season and in the mid-rainy season compared to premontane forest. On the other hand, by isolating the effect of moisture in a laboratory incubation (at uniform 60 % WFPS and corresponding in situ measured temperatures per elevation cluster), we found similar heterotrophic CO2 respiration along the elevation gradient (Table S3 and Fig. 3a), and ultimately, we confirmed a significant linearly decreasing trend for the specific heterotrophic CO2 respiration (Fig. 3b). This indicates that, under in situ conditions, low temperatures and low soil moisture contents limited microbial CO2 respiration at high elevations. Indeed, low temperatures at high elevations can have a negative effect on decomposer activities (Finzi et al., 2006; Luo et al., 2006). Meanwhile, an adequate soil moisture content can boost microbial respiration by facilitating both the diffusion of soluble substrates and the transport of oxygen (Liu et al., 2006). Generally, the optimal soil moisture content for microbial respiration is reported to be approximately 60 % WFPS (Aon et al., 2001; Doetterl et al., 2015). Subsequently, in the mid-rainy season (when the soil WFPS increased; Table S3), in correspondence, we detected an increase in the total in situ CO2 respiration rate in all elevation clusters, but at higher elevations between 2100–3000 m, the increase in CO2 respiration rates was not significant owing to only a small increase in WFPS in the mid-rainy season (Table S3).
The microbial community structure indicated that, though the variation in the microbial community (in terms of bacteria and fungi) as a function of elevation is rather limited (Fig. S4), there is some shift. In particular, higher elevations are relatively more dominated by gram-positive bacteria (Table S2) and by fungi relative to bacteria (Fig. S4), which is also a further indictor for higher organic matter recalcitrance (Fanin et al., 2019; Lipson et al., 2002). Based on the principal component analysis and linear mixed effect model analysis of the microbial structure (Figs. 2 and S4), the ratio of total bacteria to fungi slightly decreased with increasing elevation. It is also known that fungi are often relatively more dominant in soils characterised by more complex organic materials (Lipson et al., 2002), as fungi are more specialised in the breakdown of recalcitrant organic matter (Boer et al., 2005; Coleman et al., 2017). Altogether, we showed that microbial CO2 respiration along the elevation gradient was limited by an increasing C recalcitrance, decreasing soil temperature, moisture content, and pH.
Our results indicated that global warming can lead to enhanced losses of SOC in montane forests due to their increasing temperature sensitivity and SOC content with elevation. Therefore, the high concentrations of SOC at higher elevations of montane forests are particularly at stake, since the climate warming exactly undermines the mitigating effect of low microbial decomposition under (i) low temperature and (ii) high organic matter recalcitrance (due to its higher temperature sensitivity). Furthermore, we showed that, along the elevation gradient, in situ warming indeed led to increased SOC mineralisation, and the associated apparent isotopic fractionation resulted in a relative enrichment in 13C in warmed soils compared to the control soils. Ultimately, along the elevation gradient, after 2 years of warming, the SOC in the warmed soils were relatively lower than in the control soils, indicating a depleting trend in SOC owing to the increment in mineralisation during the 2 years at a higher temperature.
The codes used in the preparation of this paper are available from the corresponding author upon request.
Most of the raw data obtained in this study are included in the Supplement. Further inquiries can be directed to the corresponding author.
The supplement related to this article is available online at: https://doi.org/10.5194/bg-20-719-2023-supplement.
JO, MB, HV, SB, JK, and PB designed the experiment, with the input of KBB and RK. JO, AF, and TE conducted the incubation experiments, with support from MB, HV, SB, and PB. JO, AF, TE, and SB did the laboratory analyses, with the support of PB and MB. All authors contributed to the writing of this paper.
The contact author has declared that none of the authors has any competing interests.
Publisher's note: Copernicus Publications remains neutral with regard to jurisdictional claims in published maps and institutional affiliations.
The authors thank the Uganda Wildlife Authority, for granting permission to conduct this study in two protected national parks (permit no. UWA/COD/96/05). We also thank the staff of the Uganda Wildlife Authority at Rwenzori Mountains and Kibale Forest National Parks, for their support. Furthermore, we are grateful to the research assistant, Martin Tuisenge, for his tireless efforts and endurance during the demanding field campaigns in the tremendously physically challenging Rwenzori Mountains.
This research has been supported by the Vlaamse Interuniversitaire Raad (grant no. UG2019IUC027A103).
This paper was edited by Anja Rammig and reviewed by two anonymous referees.
Amundson, R., Austin, A. T., Schuur, E. A., Yoo, K., Matzek, V., Kendall, C., Uebersax, A., Brenner, D., and Baisden, W. T.: Global patterns of the isotopic composition of soil and plant nitrogen, Global Biogeochem. Cy., 17, https://doi.org/10.1029/2002GB001903, 2003.
Andrews, J. A., Matamala, R., Westover, K. M., and Schlesinger, W. H.: Temperature effects on the diversity of soil heterotrophs and the δ13C of soil-respired CO2, Soil Biol. Biochem., 32, 699–706, https://doi.org/10.1016/S0038-0717(99)00206-0, 2000.
Aon, M., Sarena, D., Burgos, J., and Cortassa, S.: Interaction between gas exchange rates, physical and microbiological properties in soils recently subjected to agriculture, Soil Till. Res., 60, 163–171, https://doi.org/10.1016/S0167-1987(01)00191-X, 2001.
Beer, C., Reichstein, M., Tomelleri, E., Ciais, P., Jung, M., Carvalhais, N., Rödenbeck, C., Arain, M. A., Baldocchi, D., and Bonan, G. B.: Terrestrial gross carbon dioxide uptake: global distribution and covariation with climate, Science, 329, 834–838, https://doi.org/10.1126/science.1184984, 2010.
Bligh, E. G. and Dyer, W. J.: A rapid method of total lipid extraction and purification, Can. J. Biochem. Phys., 37, 911–917, https://doi.org/10.1139/o59-099, 1959.
Boeckx, P., Paulino, L., Oyarzún, C., Cleemput, O. V., and Godoy, R.: Soil δ15N patterns in old-growth forests of southern Chile, 2005.
Bradford, M. A., Davies, C. A., Frey, S. D., Maddox, T. R., Melillo, J. M., Mohan, J. E., Reynolds, J. F., Treseder, K. K., and Wallenstein, M. D.: Thermal adaptation of soil microbial respiration to elevated temperature, Ecol. Lett., 11, 1316–1327, https://doi.org/10.1111/j.1461-0248.2008.01251.x, 2008.
Campbell, D. J. and Henshall, J. K.: Bulk density, in: Soil and Environmental Analysis, CRC Press, ISBN 9780429208232, 327–360, 2000.
Carey, J. C., Tang, J., Templer, P. H., Kroeger, K. D., Crowther, T. W., Burton, A. J., Dukes, J. S., Emmett, B., Frey, S. D., and Heskel, M. A.: Temperature response of soil respiration largely unaltered with experimental warming, P. Natl. Acad. Sci. USA, 113, 13797–13802, https://doi.org/10.1073/pnas.1605365113, 2016.
Chung, H., Zak, D. R., Reich, P. B., and Ellsworth, D. S.: Plant species richness, elevated CO2, and atmospheric nitrogen deposition alter soil microbial community composition and function, Global Change Biol., 13, 980–989, https://doi.org/10.1111/j.1365-2486.2007.01313.x, 2007.
Coleman, D. C., Callaham, M. A., and Crossley Jr., D.: Fundamentals of soil ecology, Academic Press, ISBN 978-0-12-805251-8, 2017.
Collier, S. M., Ruark, M. D., Oates, L. G., Jokela, W. E., and Dell, C. J.: Measurement of Greenhouse Gas Flux from Agricultural Soils Using Static Chambers. J. Vis. Exp., 90, e52110, doi:10.3791/52110, 2014.
Craine, J. M., Fierer, N., and McLauchlan, K. K.: Widespread coupling between the rate and temperature sensitivity of organic matter decay, Nat. Geosci., 3, 854–857, https://doi.org/10.1038/ngeo1009, 2010.
Crowther, T. W., Todd-Brown, K. E., Rowe, C. W., Wieder, W. R., Carey, J. C., Machmuller, M. B., Snoek, B., Fang, S., Zhou, G., and Allison, S. D.: Quantifying global soil carbon losses in response to warming, Nature, 540, 104–108, https://doi.org/10.1038/nature20150, 2016.
Cuni Sanchez, A., Sullivan, M., Platts, P. J., Lewis, S. L., Marchant, R., Imani, G., Hubau, W., Abiem, I., Adhikari, H., and Albrecht, T.: High aboveground carbon stock of African tropical montane forests, Nature, 596, 536–542, https://doi.org/10.1038/s41586-021-03728-4, 2021.
Dalal, R., Allen, D., Livesley, S., and Richards, G.: Magnitude and biophysical regulators of methane emission and consumption in the Australian agricultural, forest, and submerged landscapes: a review, Plant Soil, 309, 43–76, https://doi.org/10.1007/s11104-007-9446-7, 2008.
Davidson, E. A. and Janssens, I. A.: Temperature sensitivity of soil carbon decomposition and feedbacks to climate change, Nature, 440, 165–173, https://doi.org/10.1038/nature04514, 2006.
de Boer, W., Folman, L. B., Summerbell, R. C., and Boddy, L.: Living in a fungal world: impact of fungi on soil bacterial niche development, FEMS Microbiol. Rev., 29, 795–811, https://doi.org/10.1016/j.femsre.2004.11.005, 2005.
Denef, K., Bubenheim, H., Lenhart, K., Vermeulen, J., Van Cleemput, O., Boeckx, P., and Müller, C.: Community shifts and carbon translocation within metabolically-active rhizosphere microorganisms in grasslands under elevated CO2, Biogeosciences, 4, 769–779, https://doi.org/10.5194/bg-4-769-2007, 2007.
Doetterl, S., Stevens, A., Six, J., Merckx, R., Van Oost, K., Pinto, M. C., Casanova-Katny, A., Muñoz, C., Boudin, M., and Venegas, E. Z.: Soil carbon storage controlled by interactions between geochemistry and climate, Nat. Geosci., 8, 780–783, https://doi.org/10.1038/ngeo2516, 2015.
Drijber, R. A., Doran, J. W., Parkhurst, A. M., and Lyon, D.: Changes in soil microbial community structure with tillage under long-term wheat-fallow management, Soil Biol. Biochem., 32, 1419–1430, https://doi.org/10.1016/S0038-0717(00)00060-2, 2000.
Ehleringer, J. R., Buchmann, N., and Flanagan, L. B.: Carbon isotope ratios in belowground carbon cycle processes, Ecol. Appl., 10, 412–422, https://doi.org/10.1890/1051-0761(2000)010[0412:CIRIBC]2.0.CO;2, 2000.
Eliasson, P. E., McMurtrie, R. E., Pepper, D. A., Strömgren, M., Linder, S., and Ågren, G. I.: The response of heterotrophic CO2 flux to soil warming, Global Change Biol., 11, 167–181, https://doi.org/10.1111/j.1365-2486.2004.00878.x, 2005.
Erb, K.-H., Kastner, T., Plutzar, C., Bais, A. L. S., Carvalhais, N., Fetzel, T., Gingrich, S., Haberl, H., Lauk, C., and Niedertscheider, M.: Unexpectedly large impact of forest management and grazing on global vegetation biomass, Nature, 553, 73–76, https://doi.org/10.1038/nature25138, 2018.
Fanin, N., Kardol, P., Farrell, M., Nilsson, M.-C., Gundale, M. J., and Wardle, D. A.: The ratio of Gram-positive to Gram-negative bacterial PLFA markers as an indicator of carbon availability in organic soils, Soil Biol. Biochem., 128, 111–114, https://doi.org/10.1016/j.soilbio.2018.10.010, 2019.
Findlay, R. H., King, G. M., and Watling, L.: Efficacy of phospholipid analysis in determining microbial biomass in sediments, Appl. Environ. Microb., 55, 2888–2893, https://doi.org/10.1128/aem.55.11.2888-2893.1989, 1989.
Finzi, A. C., Moore, D. J., DeLucia, E. H., Lichter, J., Hofmockel, K. S., Jackson, R. B., Kim, H.-S., Matamala, R., McCarthy, H. R., and Oren, R.: Progressive nitrogen limitation of ecosystem processes under elevated CO2 in a warm-temperate forest, Ecology, 87, 15–25, https://doi.org/10.1890/04-1748, 2006.
Friedlingstein, P., O'Sullivan, M., Jones, M. W., Andrew, R. M., Hauck, J., Olsen, A., Peters, G. P., Peters, W., Pongratz, J., Sitch, S., Le Quéré, C., Canadell, J. G., Ciais, P., Jackson, R. B., Alin, S., Aragão, L. E. O. C., Arneth, A., Arora, V., Bates, N. R., Becker, M., Benoit-Cattin, A., Bittig, H. C., Bopp, L., Bultan, S., Chandra, N., Chevallier, F., Chini, L. P., Evans, W., Florentie, L., Forster, P. M., Gasser, T., Gehlen, M., Gilfillan, D., Gkritzalis, T., Gregor, L., Gruber, N., Harris, I., Hartung, K., Haverd, V., Houghton, R. A., Ilyina, T., Jain, A. K., Joetzjer, E., Kadono, K., Kato, E., Kitidis, V., Korsbakken, J. I., Landschützer, P., Lefèvre, N., Lenton, A., Lienert, S., Liu, Z., Lombardozzi, D., Marland, G., Metzl, N., Munro, D. R., Nabel, J. E. M. S., Nakaoka, S.-I., Niwa, Y., O'Brien, K., Ono, T., Palmer, P. I., Pierrot, D., Poulter, B., Resplandy, L., Robertson, E., Rödenbeck, C., Schwinger, J., Séférian, R., Skjelvan, I., Smith, A. J. P., Sutton, A. J., Tanhua, T., Tans, P. P., Tian, H., Tilbrook, B., van der Werf, G., Vuichard, N., Walker, A. P., Wanninkhof, R., Watson, A. J., Willis, D., Wiltshire, A. J., Yuan, W., Yue, X., and Zaehle, S.: Global Carbon Budget 2020, Earth Syst. Sci. Data, 12, 3269–3340, https://doi.org/10.5194/essd-12-3269-2020, 2020.
Frostegård, A. and Bååth, E.: The use of phospholipid fatty acid analysis to estimate bacterial and fungal biomass in soil, Biol. Fert. Soils, 22, 59–65, https://doi.org/10.1007/BF00384433, 1996.
Fussmann, K. E., Schwarzmüller, F., Brose, U., Jousset, A., and Rall, B. C.: Ecological stability in response to warming, Nat. Clim. Change, 4, 206–210, https://doi.org/10.1038/nclimate2134, 2014.
Gütlein, A., Gerschlauer, F., Kikoti, I., and Kiese, R.: Impacts of climate and land use on N2O and CH4 fluxes from tropical ecosystems in the Mt. Kilimanjaro region, Tanzania, Global Change Biol., 24, 1239–1255, https://doi.org/10.1111/gcb.13944, 2018.
Huygens, D., Roobroeck, D., Cosyn, L., Salazar, F., Godoy, R., and Boeckx, P.: Microbial nitrogen dynamics in south central Chilean agricultural and forest ecosystems located on an Andisol, Nutr. Cycl. Agroecosys., 89, 175–187, https://doi.org/10.1007/s10705-010-9386-0, 2011.
IPCC, 2018: Global Warming of 1.5 ∘C. An IPCC Special Report on the impacts of global warming of 1.5 ∘C above pre-industrial levels and related global greenhouse gas emission pathways, in the context of strengthening the global response to the threat of climate change, sustainable development, and efforts to eradicate poverty, edited by: Masson-Delmotte, V., Zhai, P., Pörtner, H.-O., Roberts, D., Skea, J., Shukla, P. R., Pirani, A., Moufouma-Okia, W., Péan, C., Pidcock, R., Connors, S., Matthews, J. B. R., Chen, Y., Zhou, X., Gomis, M. I., Lonnoy, E., Maycock, T., Tignor, M., and Waterfield, T., Cambridge University Press, Cambridge, UK and New York, NY, USA, 616 pp. https://doi.org/ 10.1017/9781009157940, 2018.
IPCC, 2021: Climate Change 2021: The Physical Science Basis. Contribution of Working Group I to the Sixth Assessment Report of the Intergovernmental Panel on Climate Change, edited by: Masson-Delmotte, V., Zhai, P., Pirani, A., Connors, S. L., Péan, C., Berger, S., Caud, N., Chen, Y., Goldfarb, L., Gomis, M. I., Huang, M., Leitzell, K., Lonnoy, E., Matthews, J. B. R., Maycock, T. K., Waterfield, T., Yelekçi, O., Yu, R., and Zhou, B., Cambridge University Press, Cambridge, United Kingdom and New York, NY, USA, 2391 pp. doi:10.1017/978100915789, 2021.
Jacobs, L., Dewitte, O., Poesen, J., Delvaux, D., Thiery, W., and Kervyn, M.: The Rwenzori Mountains, a landslide-prone region?, Landslides, 13, 519–536, https://doi.org/10.1007/s10346-015-0582-5, 2016.
Karhu, K., Auffret, M. D., Dungait, J. A., Hopkins, D. W., Prosser, J. I., Singh, B. K., Subke, J.-A., Wookey, P. A., Ågren, G. I., and Sebastia, M.-T.: Temperature sensitivity of soil respiration rates enhanced by microbial community response, Nature, 513, 81–84, https://doi.org/10.1038/nature13604, 2014.
Keane, J. B. and Ineson, P.: Technical note: Differences in the diurnal pattern of soil respiration under adjacent Miscanthus × giganteus and barley crops reveal potential flaws in accepted sampling strategies, Biogeosciences, 14, 1181–1187, https://doi.org/10.5194/bg-14-1181-2017, 2017.
Kim, D.-G., Thomas, A. D., Pelster, D., Rosenstock, T. S., and Sanz-Cobena, A.: Greenhouse gas emissions from natural ecosystems and agricultural lands in sub-Saharan Africa: synthesis of available data and suggestions for further research, Biogeosciences, 13, 4789–4809, https://doi.org/10.5194/bg-13-4789-2016, 2016.
Kroppenstedt, R.: Fatty acid and menaquinone analysis of actinomycetes and related organisms, Chemical methods in bacterial systematics, edited by: Goodfellow, M. and Minnikin, D., Academic Press, 173–199, 1985.
Kutzbach, L., Schneider, J., Sachs, T., Giebels, M., Nykänen, H., Shurpali, N. J., Martikainen, P. J., Alm, J., and Wilmking, M.: CO2 flux determination by closed-chamber methods can be seriously biased by inappropriate application of linear regression, Biogeosciences, 4, 1005–1025, https://doi.org/10.5194/bg-4-1005-2007, 2007.
Le Quéré, C., Andrew, R. M., Friedlingstein, P., Sitch, S., Hauck, J., Pongratz, J., Pickers, P. A., Korsbakken, J. I., Peters, G. P., Canadell, J. G., Arneth, A., Arora, V. K., Barbero, L., Bastos, A., Bopp, L., Chevallier, F., Chini, L. P., Ciais, P., Doney, S. C., Gkritzalis, T., Goll, D. S., Harris, I., Haverd, V., Hoffman, F. M., Hoppema, M., Houghton, R. A., Hurtt, G., Ilyina, T., Jain, A. K., Johannessen, T., Jones, C. D., Kato, E., Keeling, R. F., Goldewijk, K. K., Landschützer, P., Lefèvre, N., Lienert, S., Liu, Z., Lombardozzi, D., Metzl, N., Munro, D. R., Nabel, J. E. M. S., Nakaoka, S., Neill, C., Olsen, A., Ono, T., Patra, P., Peregon, A., Peters, W., Peylin, P., Pfeil, B., Pierrot, D., Poulter, B., Rehder, G., Resplandy, L., Robertson, E., Rocher, M., Rödenbeck, C., Schuster, U., Schwinger, J., Séférian, R., Skjelvan, I., Steinhoff, T., Sutton, A., Tans, P. P., Tian, H., Tilbrook, B., Tubiello, F. N., van der Laan-Luijkx, I. T., van der Werf, G. R., Viovy, N., Walker, A. P., Wiltshire, A. J., Wright, R., Zaehle, S., and Zheng, B.: Global Carbon Budget 2018, Earth Syst. Sci. Data, 10, 2141–2194, https://doi.org/10.5194/essd-10-2141-2018, 2018.
Lewis, S. L., Edwards, D. P., and Galbraith, D.: Increasing human dominance of tropical forests, Science, 349, 827–832, https://doi.org/10.1126/science.aaa9932, 2015.
Lipson, D. A., Schadt, C., and Schmidt, S. K.: Changes in soil microbial community structure and function in an alpine dry meadow following spring snow melt, Microb. Ecol., 43, 307–314, https://doi.org/10.1007/s00248-001-1057-x, 2002.
Liu, H. S., Li, L. H., Han, X. G., Huang, J. H., Sun, J. X., and Wang, H. Y.: Respiratory substrate availability plays a crucial role in the response of soil respiration to environmental factors, Appl. Soil Ecol., 32, 284–292, https://doi.org/10.1016/j.apsoil.2005.08.001, 2006.
Luo, Y., Wan, S., Hui, D., and Wallace, L. L.: Acclimatization of soil respiration to warming in a tall grass prairie, Nature, 413, 622–625, https://doi.org/10.1038/35098065, 2001.
Luo, Y., Field, C. B., and Jackson, R. B.: Does Nitrogen Constrain Carbon Cycling, or Does Carbon Input Stimulate Nitrogen Cycling?, Ecology, 87, 3–4, 2006.
Lützow, M. v., Kögel-Knabner, I., Ekschmitt, K., Matzner, E., Guggenberger, G., Marschner, B., and Flessa, H.: Stabilization of organic matter in temperate soils: mechanisms and their relevance under different soil conditions – a review, Eur. J. Soil Sci., 57, 426–445, https://doi.org/10.1111/j.1365-2389.2006.00809.x, 2006.
Mahmood, R., Pielke Sr., R. A., Hubbard, K. G., Niyogi, D., Dirmeyer, P. A., McAlpine, C., Carleton, A. M., Hale, R., Gameda, S., and Beltrán-Przekurat, A.: Land cover changes and their biogeophysical effects on climate, Int. J. Climatol., 34, 929–953, https://doi.org/10.1002/joc.3736, 2014.
Malhi, Y.: The productivity, metabolism and carbon cycle of tropical forest vegetation, J. Ecol., 100, 65–75, https://doi.org/10.1111/j.1365-2745.2011.01916.x, 2012.
Melillo, J., Steudler, P., Aber, J., Newkirk, K., Lux, H., Bowles, F., Catricala, C., Magill, A., Ahrens, T., and Morrisseau, S.: Soil warming and carbon-cycle feedbacks to the climate system, Science, 298, 2173–2176, https://doi.org/10.1126/science.1074153, 2002.
Melillo, J. M., Frey, S. D., DeAngelis, K. M., Werner, W. J., Bernard, M. J., Bowles, F. P., Pold, G., Knorr, M. A., and Grandy, A. S.: Long-term pattern and magnitude of soil carbon feedback to the climate system in a warming world, Science, 358, 101–105, https://doi.org/10.1126/science.aan2874, 2017.
Mohan, J. E.: Ecosystem Consequences of Soil Warming: Microbes, Vegetation, Fauna and Soil Biogeochemistry, Academic Press, ISBN 978-0-12-813493-12019.
Nakagawa, S. and Schielzeth, H.: A general and simple method for obtaining R2 from generalized linear mixed-effects models, Methods Ecol. Evol., 4, 133–142, https://doi.org/10.1111/j.2041-210x.2012.00261.x, 2013.
Natelhoffer, K. and Fry, B.: Controls on natural nitrogen-15 and carbon-13 abundances in forest soil organic matter, Soil Sci. Soc. Am. J., 52, 1633–1640, https://doi.org/10.2136/sssaj1988.03615995005200060024x, 1988.
Nazaries, L., Tottey, W., Robinson, L., Khachane, A., Al-Soud, W. A., Sørensen, S., and Singh, B. K.: Shifts in the microbial community structure explain the response of soil respiration to land-use change but not to climate warming, Soil Biol. Biochem., 89, 123–134, https://doi.org/10.1016/j.soilbio.2015.06.027, 2015.
Nottingham, A. T., Whitaker, J., Ostle, N. J., Bardgett, R. D., McNamara, N. P., Fierer, N., Salinas, N., Ccahuana, A. J., Turner, B. L., and Meir, P.: Microbial responses to warming enhance soil carbon loss following translocation across a tropical forest elevation gradient, Ecol. Lett., 22, 1889–1899, 2019.
Nottingham, A. T., Meir, P., Velasquez, E., and Turner, B. L.: Soil carbon loss by experimental warming in a tropical forest, Nature, 584, 234–237, https://doi.org/10.1038/s41586-020-2566-4, 2020.
Oertel, C., Matschullat, J., Zurba, K., Zimmermann, F., and Erasmi, S.: Greenhouse gas emissions from soils – A review, Geochemistry, 76, 327–352, https://doi.org/10.1016/j.chemer.2016.04.002, 2016.
Okello, J., Bauters, M., Verbeeck, H., Kasenene, J., and Boeckx, P.: Aboveground carbon stocks, woody and litter productivity along an elevational gradient in the Rwenzori Mountains, Uganda, Biotropica, 54, 906–920, https://doi.org/10.1111/btp.13114, 2022.
Pan, Y., Birdsey, R. A., Fang, J., Houghton, R., Kauppi, P. E., Kurz, W. A., Phillips, O. L., Shvidenko, A., Lewis, S. L., and Canadell, J. G.: A large and persistent carbon sink in the world's forests, Science, 333, 988–993, https://doi.org/10.1126/science.1201609, 2011.
Phillips, D. L. and Gregg, J. W.: Uncertainty in source partitioning using stable isotopes, Oecologia, 127, 171–179, https://doi.org/10.1007/s004420000578, 2001.
R Core Team: R: A language and environment for statistical computing, R Version 4.0. 3, R Foundation for Statistical Computing, Vienna, Austria, 2020, https://www.r-project.org/, 2021.
Rousk, J., Brookes, P. C., and Baath, E.: Contrasting soil pH effects on fungal and bacterial growth suggest functional redundancy in carbon mineralization, Appl. Environ. Microb., 75, 1589–1596, https://doi.org/10.1128/AEM.02775-08, 2009.
Rustad, L., Campbell, J., Marion, G., Norby, R., Mitchell, M., Hartley, A., Cornelissen, J., and Gurevitch, J.: A meta-analysis of the response of soil respiration, net nitrogen mineralization, and aboveground plant growth to experimental ecosystem warming, Oecologia, 126, 543–562, https://doi.org/10.1007/s004420000544, 2001.
Sayer, E. J. and Tanner, E. V.: A new approach to trenching experiments for measuring root–rhizosphere respiration in a lowland tropical forest, Soil Biol. Biochem., 42, 347–352, https://doi.org/10.1016/j.soilbio.2009.11.014, 2010.
Sayer, E. J., Heard, M. S., Grant, H. K., Marthews, T. R., and Tanner, E. V.: Soil carbon release enhanced by increased tropical forest litterfall, Nat. Clim. Change, 1, 304–307, https://doi.org/10.1038/nclimate1190, 2011.
Sayer, E. J., Lopez-Sangil, L., Crawford, J. A., Bréchet, L. M., Birkett, A. J., Baxendale, C., Castro, B., Rodtassana, C., Garnett, M. H., and Weiss, L.: Tropical forest soil carbon stocks do not increase despite 15 years of doubled litter inputs, Sci. Rep.-UK, 9, 1–9, https://doi.org/10.1038/s41598-019-54487-2, 2019.
Schipper, L. A., Hobbs, J. K., Rutledge, S., and Arcus, V. L.: Thermodynamic theory explains the temperature optima of soil microbial processes and high Q10 values at low temperatures, Global Change Biol., 20, 3578–3586, https://doi.org/10.1111/gcb.12596, 2014.
Singh, B.: Soil carbon storage: modulators, mechanisms and modeling, Academic Press, ISBN 9780128127674, 2018.
Walker, T. W., Kaiser, C., Strasser, F., Herbold, C. W., Leblans, N. I., Woebken, D., Janssens, I. A., Sigurdsson, B. D., and Richter, A.: Microbial temperature sensitivity and biomass change explain soil carbon loss with warming, Nat. Clim. Change, 8, 885–889, https://doi.org/10.1038/s41558-018-0259-x, 2018.
Walse, C., Berg, B., and Sverdrup, H.: Review and synthesis of experimental data on organic matter decomposition with respect to the effect of temperature, moisture, and acidity, Environ. Rev., 6, 25–40, https://doi.org/10.1139/a98-001, 1998.
Zelles, L.: Phospholipid fatty acid profiles in selected members of soil microbial communities, Chemosphere, 35, 275–294, https://doi.org/10.1016/S0045-6535(97)00155-0, 1997.
Zeng, Z., Wang, D., Yang, L., Wu, J., Ziegler, A. D., Liu, M., Ciais, P., Searchinger, T. D., Yang, Z.-L., and Chen, D.: Deforestation-induced warming over tropical mountain regions regulated by elevation, Nat. Geosci., 14, 23–29, https://doi.org/10.1038/s41561-020-00666-0, 2021.
Zhang, W., Parker, K., Luo, Y., Wan, S., Wallace, L., and Hu, S.: Soil microbial responses to experimental warming and clipping in a tallgrass prairie, Global Change Biol., 11, 266–277, https://doi.org/10.1111/j.1365-2486.2005.00902.x, 2005.
Zimmermann, M., Meir, P., Bird, M. I., Malhi, Y., and Ccahuana, A.: Climate dependence of heterotrophic soil respiration from a soil-translocation experiment along a 3000 m tropical forest altitudinal gradient, Eur. J. Soil Sci., 60, 895–906, https://doi.org/10.1111/j.1365-2389.2009.01175.x, 2009.