the Creative Commons Attribution 4.0 License.
the Creative Commons Attribution 4.0 License.
 | 15 Feb 2023
Duration of extraction determines CO2 and CH4 emissions from an actively extracted peatland in eastern Quebec, Canada
Laura Clark
Maria Strack
Nigel T. Roulet
Klaus-Holger Knorr
Henning Teickner
Draining and extracting peat alters the conditions that control CO2 and CH4 emissions. Carbon (C) emissions from peatlands undergoing horticultural peat extraction are not well constrained due to a lack of measurements. We determine the effect that production duration (years of extraction) has on the CO2 and CH4 emissions from an actively extracted peatland over 3 years of measurements (2018–2020). We studied five sectors identified by the year when extraction began (1987, 2007, 2010, 2013, 2016). Greater average CO2 and CH4 emissions were measured from the drainage ditches (CO2: 2.05 ± 0.12 g C m−2 d−1; CH4: 72.0 ± 18.0 mg C m−2 d−1) compared to the field surface (CO2: 0.9 ± 0.06 g C m−2 d−1; CH4: 9.2 ± 4.0 mg C m−2 d−1) regardless of sector. For peat fields, CO2 fluxes were highest in the youngest sector, which opened in 2016 (1.5 ± 0.2 g C m−2 d−1). The four older sectors all had similar mean CO2 fluxes (∼ 0.65 g C m−2 d−1) that were statistically different from the mean 2016 CO2 flux. A spatial effect on CO2 fluxes was observed solely within the 2016 sector, where CO2 emissions were highest from the centre of the peat field and declined towards the drainage ditches. These observations occur due to operators contouring surfaces to facilitate drainage. The domed shape and subsequent peat removal resulted in a difference in surface peat age hence different humification and lability. In addition, 14C dating confirmed that the peat contained within the 2016 sector was younger than peat within the 2007 sector and that peat age is younger toward the centre of the field in both sectors. Humification indices derived from mid-infrared spectrometry (MIRS) ( cm−1) indicated that peat humification increases with increasing years of extraction. Laboratory incubation experiments showed that CO2 production potentials of surface peat samples from the 2016 sector increased toward the centre of the field and were greater than for samples taken from the 1987 and 2007 sectors. Our results indicate that peatlands under extraction are a net source of C, where emissions are high in the first few years after opening a field for extraction and then decline to about half the initial value and remain at this level for several decades, and the ditches remain a 2 to 3 times greater source than the fields but represent <3.5 % of the total area of a field.
- Article
(1648 KB) - Full-text XML
-
Supplement
(401 KB) - BibTeX
- EndNote


1.1 CO2 and CH4 production in natural peatlands
Peatlands are important carbon (C)-sequestering ecosystems containing one-third of global soil C stores (Limpens et al., 2008; Yu, 2012). Generally, peatlands are sinks of carbon dioxide (CO2) and sources of methane (CH4), although this can vary interannually and is dependent on environmental conditions (Bubier et al., 1993, 2005; Moore et al., 1990). Carbon is removed from the atmosphere in the form of CO2 by surface vegetation via photosynthesis, which is then stored in peat soils as incompletely decomposed organic matter (Strack et al., 2008). Carbon dioxide is released from peatlands as a byproduct of plant (autotrophic) and soil (heterotrophic) respiration, otherwise known as ecosystem respiration (ER). Respiration is, among other factors, dependent on labile C, soil temperature, and moisture content (Strack et al., 2008).
Organisms in the soil break down complex molecules into low-molecular-weight substances, which are oxidized into CO2 (Killham, 1994). Litter decomposition rates decrease over time because the remaining material becomes increasingly difficult for microbes to break down (Strack et al., 2008). The decomposition rate is influenced by the quantity and quality of peat and environmental conditions, including peat moisture, temperature, acidity, and the availability of alternative electron acceptors for organic matter oxidation (Killham, 1994). Carbon dioxide production rates indicate biogeochemical quality (e.g., nutrient content, humification) because they describe the rate at which microorganisms decompose organic matter. High-quality peat contains large amounts of labile C available to decompose (e.g., carbohydrates, proteins, amino acids), leading to greater rates of CO2 production (Schlesinger and Andrews, 2000; Wardle et al., 2004). Decomposition rates are greatest in the youngest peat and have been found to decrease with peat age (Hogg, 1992).
Controlled by peat water saturation and microbial activity, CH4 emissions from peatlands are spatially and temporally variable (Moore et al., 1990, 1994; Roulet et al., 1997). Methane is produced in the anoxic layers of peatlands via methanogenesis (Lafleur, 2009; Yavitt and Seidmann-Zager, 2006) and can be consumed in the oxic peat layers through a process known as methanotrophy (Turetsky et al., 2014). The greater the oxic layer thickness, the greater the opportunity for CH4 oxidation, typically occurring within 25 cm of the oxic–anoxic boundary (Segers, 1998). Methane produced in the peat is released into the atmosphere through diffusion, ebullition, or plant-mediated transport via root tissue (Holden, 2005; Rosenberry et al., 2003; Whalen, 2005).
1.2 Peatland disturbance
In Canada, 34 000 ha of bog have been harvested, which represents 0.03 % of that country's bog-covered surface. Agriculture is the single largest disturbance, followed by forestry, mining, roads, and peat extraction; the latter represents <3 % of Canadian peatland disturbances (Harris et al., 2022). Globally, there about 460 Mha of peatlands, of which 50 Mha have been disturbed (Leifled and Menichetti, 2018), mostly by agriculture. Peat extraction intrinsically alters the C exchange dynamics of a peatland. In preparation for extraction, a peatland is drained by cutting ditches to lower the water table (WT), and all vegetation is removed. In Canada, when the surface peat is sufficiently dry, vacuum harvesters begin to extract a thin layer of surface peat. The process of harvesting increases the density and decreases the porosity in the top 20 cm on the peat profile (Lai, 2022). Following the end of extraction activities, peatlands disturbed by vacuum harvesting in this manner are often unable to naturally revegetate and regain their original ecosystem functions due to shifts in peat hydrophysical properties (McCarter and Price, 2015) and because the viable seed bank is primarily removed during extraction (Waddington et al., 2009).
If left unrestored, drained peatlands act as large sources of C to the atmosphere (Hirashi et al., 2014; Joosten and Clarke, 2002; McNeil and Waddington, 2003; Rankin et al., 2018; Smith et al., 2014; Waddington et al., 2002). Drainage lowers the WT, creating a thicker oxic layer of peat (Poulin et al., 2005). This results in greater respiration rates and increases the volume within which CH4 oxidation can occur (Abdalla et al., 2016; Holden, 2005; Sundh et al., 2000; Turetsky et al., 2014). Therefore, while CO2 emissions to the atmosphere rise, CH4 emissions are decreased by an average of 84 % (Abdalla et al., 2016). Methane emissions become localized in the former drainage ditches that can become new anoxic zones due to the saturated conditions, warm temperatures, and large amounts of labile C normally found in the ditches (Rankin et al., 2018; Schrier-Uijil et al., 2010; Sundh et al., 2000; Waddington and Day, 2007; Waddington et al., 2009).
Carbon emissions and controls on C exchange from undisturbed peatlands have been well documented and researched (e.g., Bubier et al., 1993, 2005; Koehler et al., 2011; Moore et al., 1990; Nilsson et al., 2008; Pelletier et al., 2007, 2011; Roulet et al., 2007; Strachan et al., 2016; Updegraff et al., 1995). Post-extracted, unrestored peatlands are persistent sources of C to the atmosphere (Rankin et al., 2018); however, restoration can successfully revert disturbed peatlands from net C sources to net C sinks as a result of increased vegetative uptake of CO2 (Nugent et al., 2018; Strack and Zuback, 2013). Until recently, research has focused on understanding the impacts of disturbance on the gas exchange after the disturbance has ended or has been conducted on sites where extraction has been halted (Ahlholm and Silvola, 1990; Aslan-Sungur et al., 2016; Bergman et al., 1998; Nykanen et al., 1995; Oleszczuk et al., 2008; Sundh et al., 2000; Waddington and Price, 2000; Waddington et al., 2002; Wilson et al., 2015). To our knowledge, this is one of the first studies conducted in a drained peatland undergoing active vacuum extraction. Thus, little is currently known about how C emissions from vacuum-harvested peatlands are altered during the active extraction process. This study aims to quantify the CO2 and CH4 emissions from a peatland undergoing active extraction and to link this with peat quality and environmental factors to better understand how C exchange changes over time.
2.1 Site description
In situ fluxes of CO2 and CH4 were measured at an active horticultural peat production site approximately 5 km southeast of Rivière-du-Loup, QC (47∘47′26′′ N, 69∘31′02′′ W). The site was initially a treed ombrotrophic bog system, with depths of peat in excess of 4.5 m (Anrep, 1914). Physical and chemical properties of the peatland are provided in Table S1. The location was prepared for peat extraction in 1985, using standard industry methods resulting in partially drained peat devoid of vegetation. The bare peat is sectioned into individual “fields” 500 m in length and 30 m in width via drainage ditches. These individual fields are combined into “sectors” classified by the year peat extraction began (Fig. 1). Each field is managed in the same manner with harrowing and vacuum harvesting. Similar amounts of peat were removed from each field through the study period. In eastern Canadian peat production sites, each field is domed; the elevation of the middle of the field is highest and slopes down toward the drainage ditches to assist in precipitation drainage. A gravel service road approximately 1 km in length runs down the middle of the site, separating the peatland into two halves. Large piles of loose peat and wood debris removed from the surface of the fields are stored on either side of this main road, between the gravel and the beginning of the individual fields. The storage piles are continuously moved and resized to transport the peat to a handling facility or to form new peat piles to prevent overheating and combustion. The site has been in operation for 36 years and was undergoing active extraction at the time of this study. Large machinery such as tractors and vacuum harvesters frequently drove over the surface of the fields during the measurement period. Measurements were taken from 15 fields, each with an area of 1.5 ha. Peat harvesting normally occurs from June through September when the harrowed peat is dry enough; therefore, it is dependent on the spring temperature and summer rainfall patterns. All measurements were taken over 3 years in August 2018, June through August 2019, and July through September 2020.
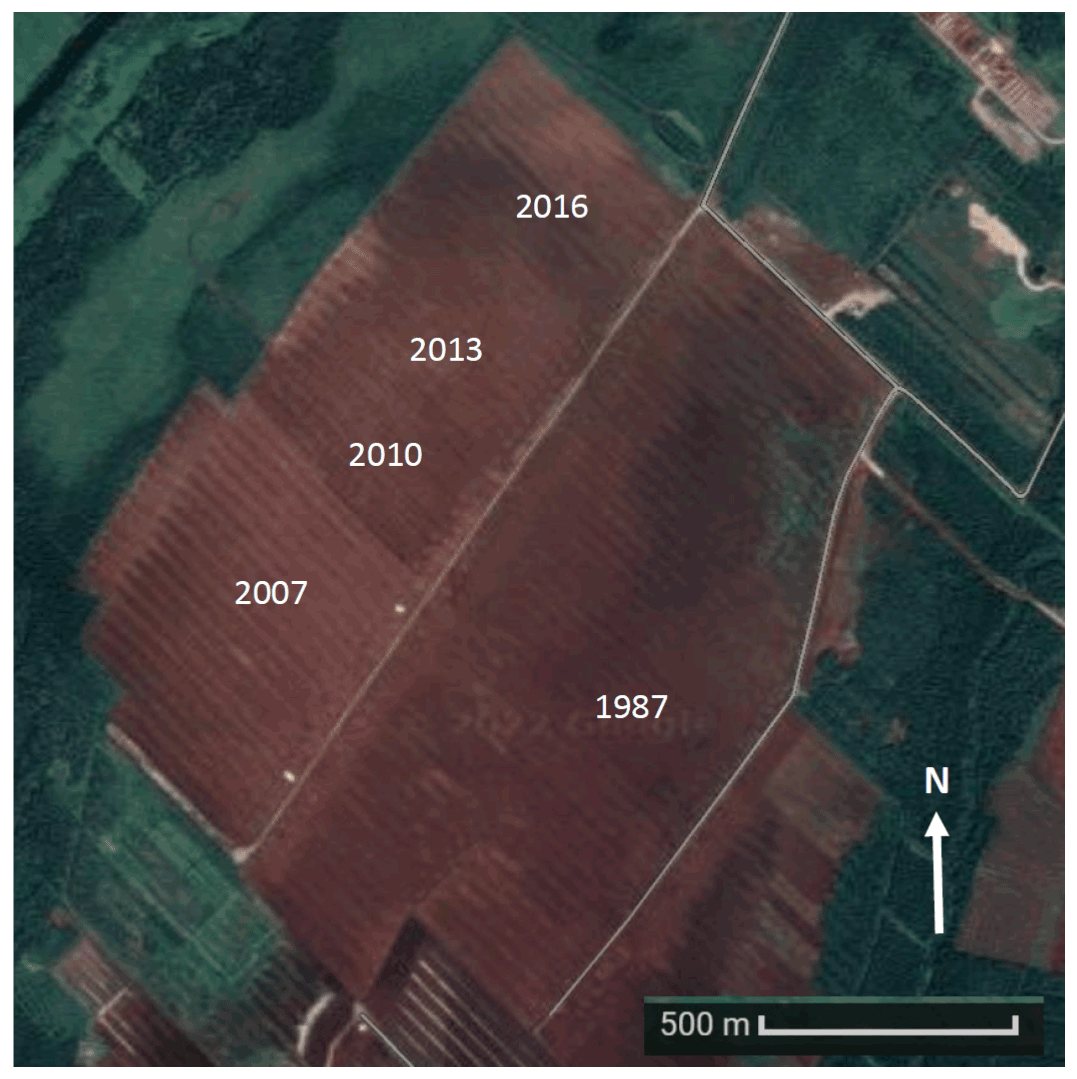
Figure 1Location of measured sectors within the study site. Image modified from Google Maps (Imagery © 2022 CNES/Aribus, Imagery© 2022 CNES/Airbus, Landsat, Copernicus, Maxar Technologies, Map data© 2022) (© Google Earth: https://www.google.ca/maps/@47.7910172,-69.5156644,3144m/data=!3m1!1e3!5m1!1e4), last access: 6 July 2022). The field labels show the year the sectors were opened for peat extraction. As the first C measurements began in 2018, the 2016, 2013, 2010, 2007, and 1987 sectors represent 2, 5, 8, 11, and 31 years, respectively.
The climate of the study area is cool temperate with a mean annual temperature of 3.5 ∘C and mean precipitation of 963.6 mm (1981–2010 averages for St. Arsene, QC, at 47∘57′00′′ N, 69∘23′00′′ W, which is the closest weather station with 30 years of records, Environment and Climate Change Canada, 2021). The mean temperatures for June, July, and August are 14.9, 17.6, and 16.7 ∘C, respectively, and the corresponding mean monthly precipitation totals are 92.6, 95.0, and 94.2 mm, respectively.
The volumetric soil moisture (VSM), water table depth (WTD), and peat temperatures at the 2007 site have been summarized by Lai (2022). The VSM in the top 3 cm harrowed layer was ∼ 10 % but was >70 % below 0.25 m. The WTD was highest in June (0.15 m) and dropped through the summer to 0.7 m in late August and September. The WTD then rose towards the surface in the autumn in response to rain and dropped again over the winter. Peat temperatures followed a typical annual pattern; during most of the summer they were around 20 ∘C at 0.05 m and dropped to 0 ∘C in mid-winter.
2.2 Chamber measurements
The closed chamber method (discussed in detail in Rankin et al., 2018) was used to measure fluxes of CO2 and CH4 from the peat surface. Fluxes of CO2 and CH4 were measured from five different sectors at this site, representing extraction beginning in 1987, 2007, 2010, 2013, and 2016 (Fig. 1). Within these sectors, random measurements were taken from five transects 50 m apart, perpendicular to the lateral drainage ditches, and alternating across three consecutive fields (Fig. 2a). Each transect contained four measurement locations: 0 (representing in the ditch itself) and 2, 5, and 15 m (field centre) away from the drainage ditch, thus capturing spatial variability in the fluxes across the field (Fig. 2b). To optimize coordination of sampling with the field operations, the 1987 (oldest) sector age was under-sampled relative to the other four sectors in 2020 because our previous measurements indicated that this sector had CO2 and CH4 flux values similar to other fields except the most recently open field (2016).
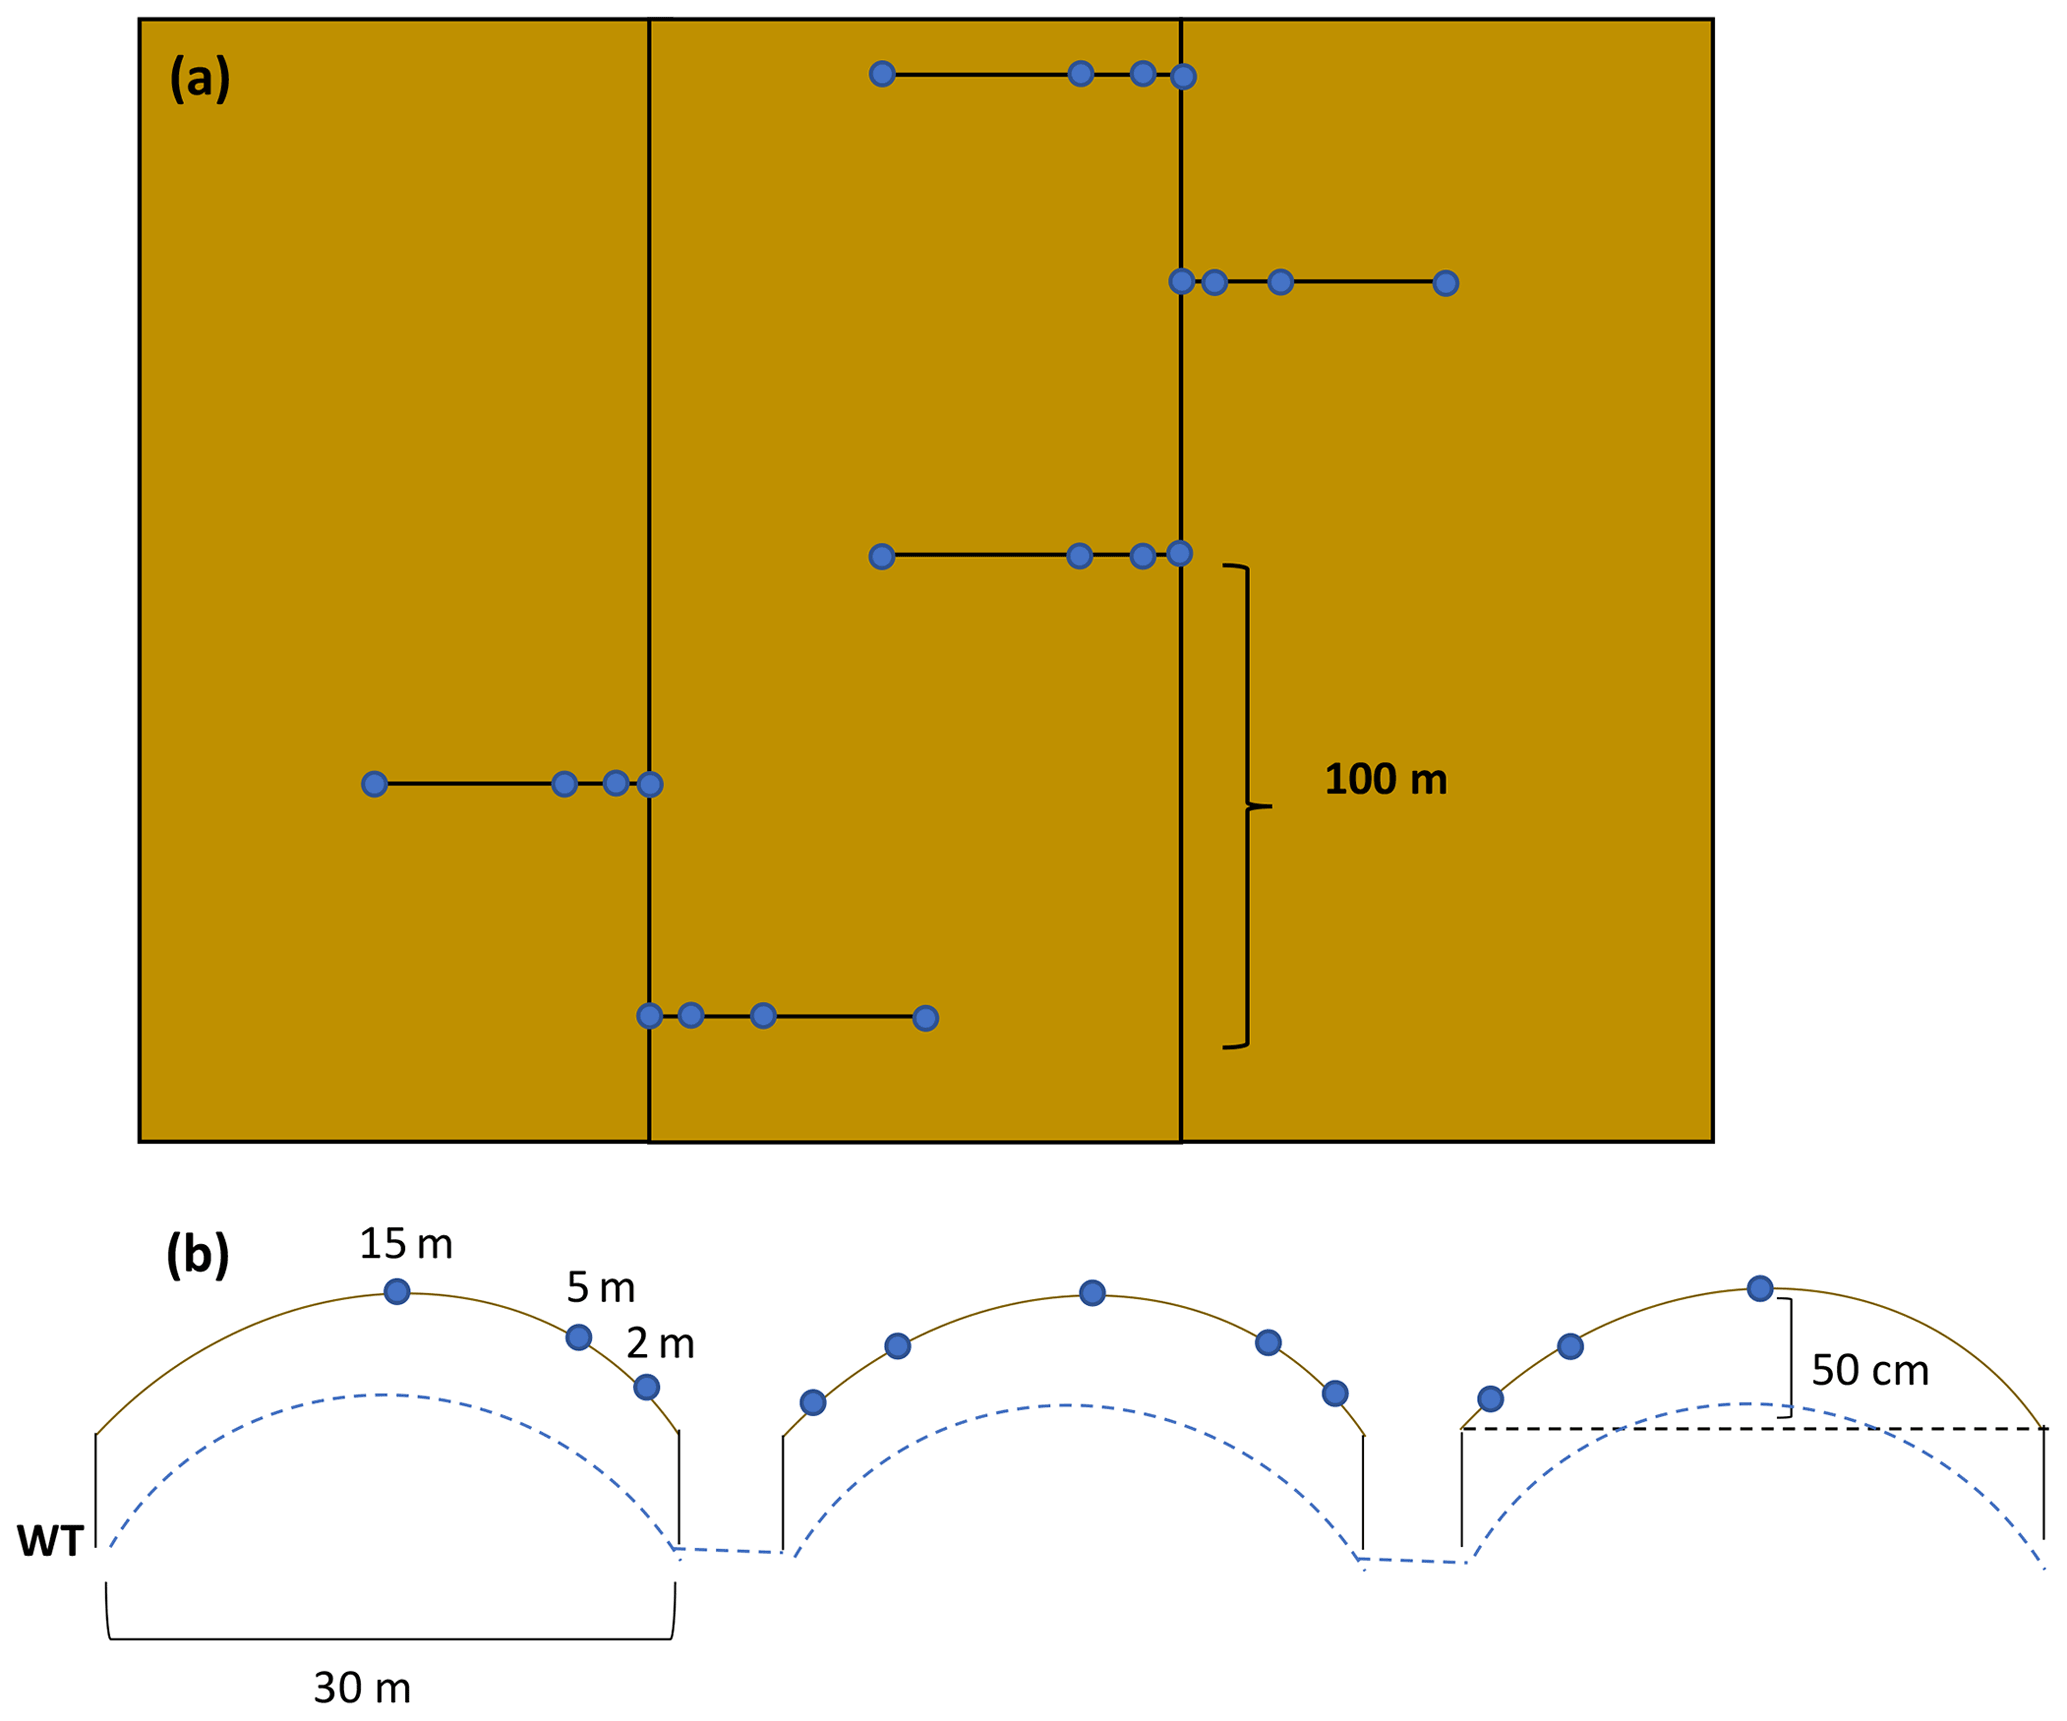
Figure 2(a) Sampling transects and (b) measurement locations within transects with an estimated elevation increase at the field centre. The field contouring results in about 50 cm difference in surface peat elevation between the centre of the field and the edge of the field.
Collars could not be left in place between measurements because we were measuring from active peat extraction fields that had harvest machinery driving on them. Therefore, at each measurement location on the peat field, a few minutes prior to measurement, a metal collar was inserted approximately 5 cm into the surface of the field. An opaque aluminium chamber (64×64 cm) was then placed on top of the collar. Air was cycled between the chamber and a trace gas analyzer. Measurements each summer were made from June through September depending on weather and industry operations (2–15 June 2018; 7–19 June, 4–15 July, 31 July–6 August, 16–21 August, 14–16 September 2019; 21–25 July, 15–27 August, 14–18 September 2020). In 2018, a PP Systems EGM-4 IRGA (precision ∼ 1 ppm) was used for CO2. In June 2019, a Los Gatos Research Ultraportable Greenhouse Gas Analyzer (precision CO2<0.03 ppm; CH4<2 ppb) was used, and in the remainder of 2019 and in 2020 a LI-COR Biosciences LI-7810 Trace Gas Analyzer (precision CO2<0.04 ppm; CH4<0.25 ppb) was used. A one-way ANOVA (α=0.05) was conducted between the fluxes from the different analyzers for the 2016 sector 2 m position and 2007 sector 15 m position. There were no significant differences between the means of the fluxes measured with the three analyzers from the 2016 (p=0.552; ) or 2007 (p=0.06; ) sectors. A measurement lasted 4 min, after which the chamber was lifted for a minimum of 30 s to allow the CO2 and CH4 to return to ambient concentrations. The measurements taken in the drainage ditches required a different chamber because the ditches were too narrow to accommodate the field chamber. The ditch chamber was cylindrical (35 cm in height, 27 cm in diameter) and was composed of translucent plastic covered in opaque reflective tape. The same measurement procedure was followed for the ditch measurements. A battery-powered fan was installed on the interior of each of the field and ditch chambers to ensure adequate air mixing during measurements. The chamber and collar were removed from the field after each measurement was completed and moved between measurement locations.
The interior height of the field chamber above the peat surface, including the collar, was measured at all four corners at each sampling location. The height of the ditch chamber, including the collar, was measured at three different points around the perimeter. Peat volumetric water content (%VWC) was measured at three separate locations at each measurement location using a CSI Hydrosense II soil moisture sensor inserted from 0 to −10 cm. For each measurement, peat temperature was taken at depths of 2, 5, 10, 15, and 20 cm below the surface to attain a temperature profile at each measurement location.
Data analysis and chamber flux calculation
Trace gas flux (F) in mg m−2 d−1 was determined as the change in concentration over time using the equation
where fx is the rate (ppmv min−1), Vc is the chamber volume (m3), R is the ideal gas constant (0.0821 L atm K−1 mol−1), Ta is the air temperature (∘C) inside the chamber, n is the molecular mass of each gas (CO2=0.044 kg mol−1; CH4=0.016 kg mol−1), S is the surface area of the collar (m2), and t is the number of minutes in a day (1440 min). Change in concentration over time for both CO2 and CH4 were plotted for each measurement location, and the flux was kept if a linear increase or decrease was observed to ensure that low values were not disproportionately discarded. In 2018, 80 % of 200 CO2 measurements were retained. In 2019, 77 % of 600 CO2 and 72 % of 600 CH4 measurements were retained. In 2020, 89 % of 738 CO2 and 61 % of 738 CH4 measurements were retained.
All statistical analyses were performed in the R software package (R Core Team, 2021), and figures were produced using the R package ggplot2 (Wickham, 2016). A one-way ANOVA of CO2 and CH4 fluxes between the field surface and drainage ditches was performed, and a two-way ANOVA between sector age and measurement position was performed, excluding drainage ditch measurements, with α=0.05. An interaction test was conducted to determine the relationship between sector age and measurement position and a Tukey post hoc test was conducted to show the specific interactions. Linear regressions were performed between surface VWC, temperature measurements, and flux.
2.3 Peat incubation
2.3.1 Field sampling
In order to investigate differences in peat substrate quality among sectors and field positions, incubations were performed with peat samples taken from the 1987, 2007, and 2016 sectors, spanning continuous extraction of ∼ 3 to 30 years. Samples were taken at the second chamber measurement transect from each of the three sector ages (Fig. 2a). Within each transect, approximately 1 kg of peat was obtained at 2, 5, and 15 m away from the drainage ditches both from the surface and from a depth of 10 cm. Additional samples were taken from a depth of 50 cm at a distance of 2 m from the ditch and from a depth of 80 cm at a distance of 15 m from the ditch (Fig. 3). The 50 and 80 cm positions were estimated to be parallel at depth, based on an elevation difference of approximately 50 cm resulting from the field doming. Samples were kept in sealed plastic bags during transport from the field and frozen upon arrival at the lab. Four samples (Fig. 3) were taken from both the 2007 and 2016 sectors for 14C dating performed by a 3MV accelerator mass spectrometer (AMS) at the AEL AMS Laboratory at the University of Ottawa. After physical and chemical pre-treatments, the samples were combusted, producing CO2 for graphitization (https://ams.uottawa.ca/analytical-methods-radiocarbon-laboratory/, last access: December 2022). Carbon dating was calibrated using the OxCal 4.4 (Bronk Ramsey, 2009) and IntCal 2020 (Reimer et al., 2020) curves.
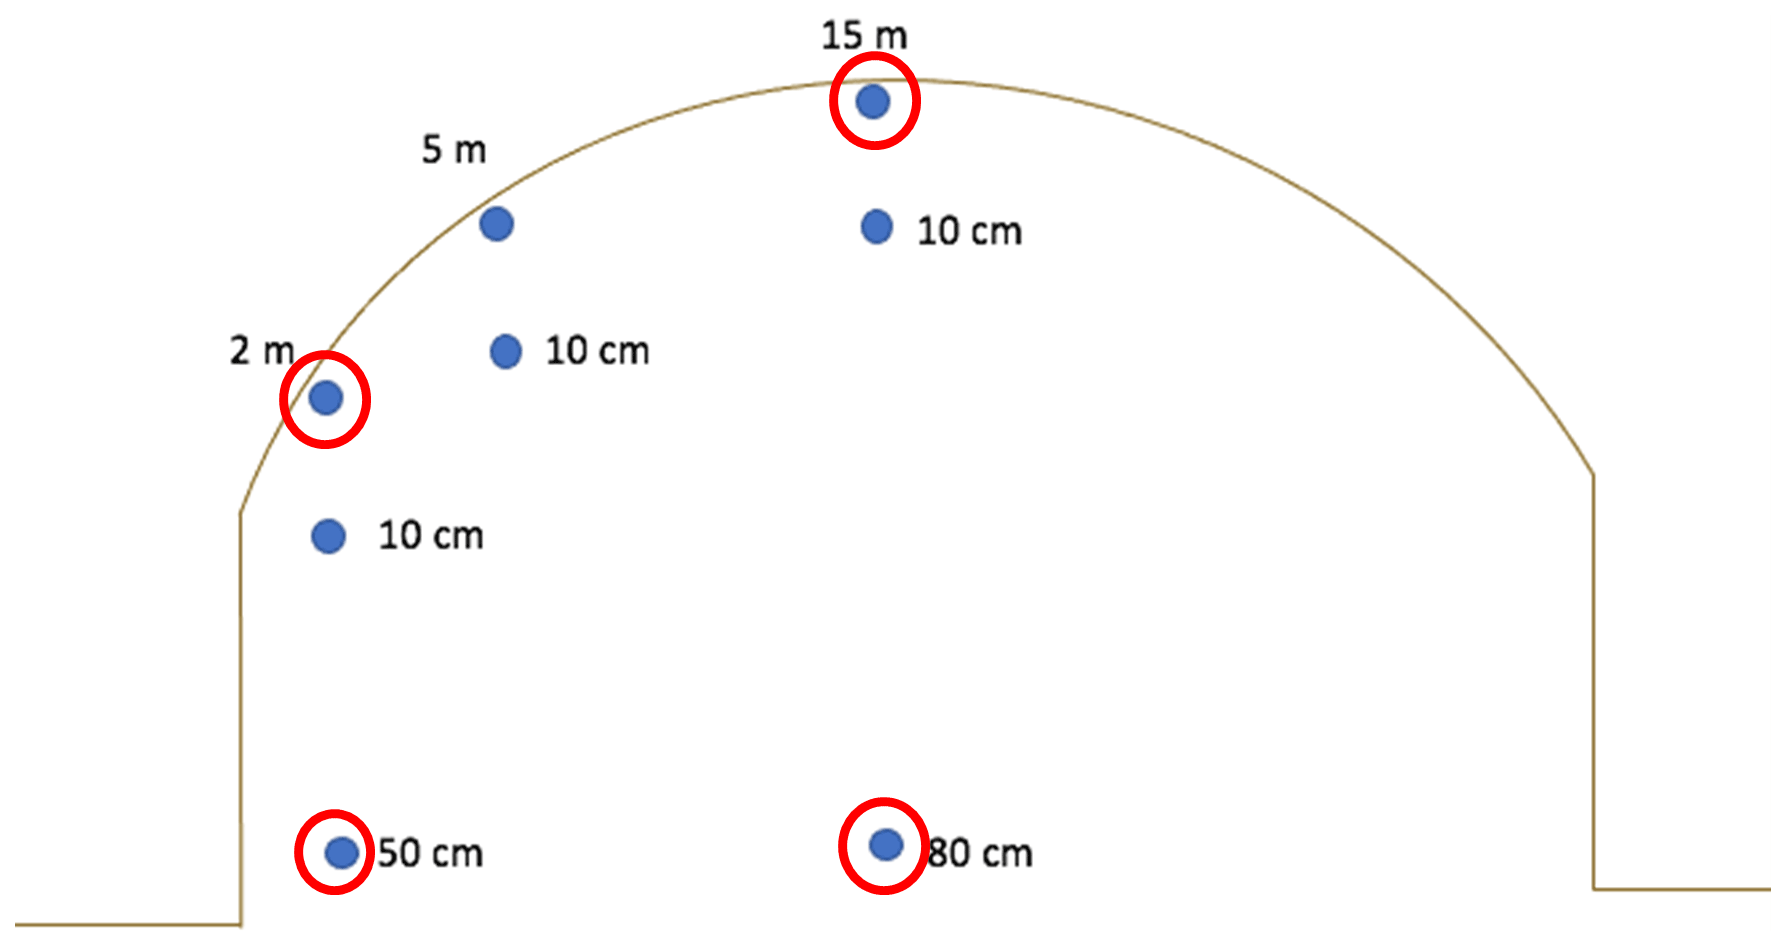
Figure 3Sampling locations (2, 5, and 15 m from ditches) and depths (cm) from the 1987, 2007, and 2016 sectors. Those with red circles were also sampled for 14C dating at the 2007 and 2016 sectors. Horizontal lines indicate approximate ditch surface with peat extending below these points.
2.3.2 Incubation experiment methodology and analysis
Incubations were performed in 250 mL mason jars fit with air-tight lids and a short plastic tube fixed with a stopcock valve and sealed with epoxy. Nine replicates and an additional blank were used for each sampling position. 30 g of peat was weighed and placed into each jar after woody debris were removed. To keep moisture conditions between the samples similar, 30 mL of distilled water was added to the jars and mixed with the peat to create a slurry. This is not meant to represent field conditions but to obtain rates reflecting potential standardized decomposability and respiration rates. The estimated VWC of the slurries was 80 %–90 %. The height and diameter of peat in the jar were recorded to calculate the headspace volume for each sample. Jars were kept at a constant temperature of 23 ∘C.
A total of 5 mL of the headspace from the jars was sampled at 0, 6, 12, 24, 48, and 72 h. After the initial 72 h samples were taken, the lids were removed, the jars were left open for 12 h and then resealed, and sampling was repeated for an additional 72 h. This was done to account for increased respiration rates that may have occurred during the first sampling period from cellular rupture after the samples were thawed; 5 mL of ambient air was backfilled into each jar after each sample was taken.
The concentrations of the gas samples were analyzed using two gas chromatographs (GCs) (Shimadzu 2014 GHG GC and SRI 8610 C GHG GC). The carrier gas was N2, the SRI column temperature was 70 ∘C, and the flame ionization detector (FID) was at 110 ∘C. Three standards of 5000 ppm CO2 and 5 ppm CH4 were run through the GC before injecting the 5 mL gas samples at each sampling interval. Gas samples were analyzed within 6 h of withdrawal from the jars. Samples were consistently run on the same GC throughout the course of the experiment. Gas concentrations from 15 samples of ambient air were run on both GCs and were compared every 72 h throughout the course of the experiment to cross-calibrate between the readings of the two machines. The Shimadzu 2014 GHG GC had an average (±SD) ambient CO2 reading of 609.2 ppm (±152.0), and the SRI 8610 C GHG GC had an average ambient CO2 reading of 589.5 (±132.6) ppm. CO2 and CH4 concentrations were corrected for dilution from backfilling of ambient air and for variation in ambient concentrations of CO2 and CH4 using the blank measurements. CO2 and CH4 production were calculated as a change in concentration over time. A total of 10 % of the data were discarded after quality control, where values with r2<0.8 were rejected. A three-way ANOVA was used to determine the variance of means between sector age, position, and depth.
2.4 Peat quality analysis
Samples were prepared for Fourier transform mid-infrared (FT-MIR) spectrometry corresponding to the sampling locations used in the peat incubations. All samples were oven-dried at 60 ∘C for 48 h and ground into a fine powder using a mortar and pestle, after which they were run through a 50 µm mesh sieve. Once prepared, the samples were analyzed using Fourier transform infrared (FTIR) spectroscopy (Agilent Cary 660 FTIR spectrometer; 32 scans per spectrum, 2 cm−1 resolution). To this end, a mixture of approximately 2 mg sample and 200 mg potassium bromide (KBr) (FTIR grade, Sigma Aldrich, St. Louis, MO, USA) were pressed. A KBr background spectrum was subtracted from the raw absorbance spectra. Finally, the spectra were baseline-corrected (Beleites and Sergo, 2020) using the R package ir (Teickner, 2022: https://doi.org/10.5281/zenodo.5747169, last access: June 2022) and further processed with the R package “irpeat” (Teickner and Hodgkins, 2022: https://doi.org/10.5281/zenodo.7262744, last access: June 2022). A humification index (HI) was computed as ratio of the absorbances at ∼ 1650 cm−1 (indicative of lignins and other aromatics) and ∼ 1090 cm−1 (indicative of polysaccharides representing the labile fraction), as described in detail in Broder et al. (2012). Larger ratios ( cm−1) indicate a greater degree of humification, assuming a residual enrichment of refractory moieties and preferential degradation of more labile fractions (Broder et al., 2012).
3.1 CO2 fluxes
The average (±SD) CO2 flux from all sectors, field locations, and ditches combined was 1.2 (±2.1) g C m−2 d−1 (see also Table S2). The mean CO2 flux from all fields combining all sector ages and excluding the drainage ditch measurements was 0.9 (±1.6) g C m−2 d−1. The mean CO2 flux from the drainage ditches across all sectors was 2.05 (±2.2) g C m−2 d−1. A significant difference was present (; p<0.001) between the CO2 emissions from the drainage ditches and the field surface.
The base of the drainage ditches was closer to the WT than the surface of the fields and, as a result, was frequently saturated. The C cycling dynamics within the ditches are different than those at the surface of the field, and thus the results from the drainage ditches will not be directly compared to those from the field surface.
Measurements of CO2 flux from the sectors ranged from 37.1 to −0.3 g C m−2 d−1. A single value of −36.5 gC m−2 d−1 was deemed to be an outlier and removed from the 1987 sector flux data. A two-way ANOVA between sector age and measurement position was performed and the outcomes for sector age and measurement position, as well as any interactions, will be discussed separately below. The two-way ANOVA showed that the 2016 sector had significantly greater CO2 emissions than all other sectors (; p<0.05) (Fig. 4; Table S2). The 1987, 2007, 2010, and 2013 sectors exhibited similar fluxes over time, with no significant difference between their means, although the 2010 and 2013 sectors were only measured in 2020.
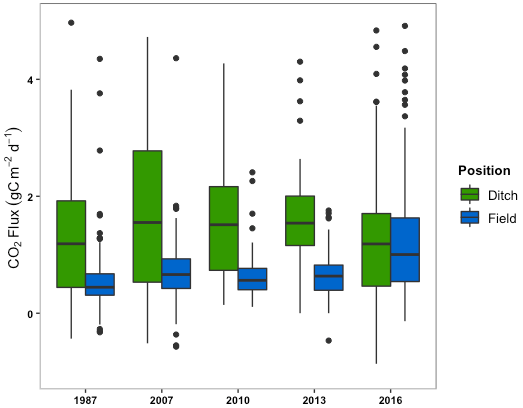
Figure 4The box and whisker plots (median, upper and lower quartiles, and outliers) of CO2 fluxes from the drainage ditch and the three field locations combined (2, 5, and 15 m) by the year a sector was opened.
When measurements are averaged by field position (2, 5, and 15 m away from the drainage ditches) across all five sectors, the mean CO2 fluxes (±SD) were 0.7 (±0.7), 0.9 (±1.0), and 1.2 (±2.4) g C m−2 d−1, respectively (Fig. 5). A statistically significantly different mean CO2 flux from the 15 m position compared to both the 2 m and the 5 m positions (; p<0.05) was found.

Figure 5The box and whisker plots of CO2 flux by sector and measurement location from the edge of the ditches in a field (i.e., 2, 5, and 15 m).
CO2 emissions at different distances from the ditches differed for different age sectors (; p<0.001). The mean CO2 emissions from the 15 m position in the 2016 sector significantly differed from every other sampling position and sector. Within the 2016 sector, the means of the CO2 emissions from the 15 m position were statistically different from those of the 2 m position (; p<0.001). No statistical difference emerged between the means of 15 m 2016 and 5 m 2016 positions. Within the 2016 sector, a difference was only found between the middle and edge of the fields. No differences were noted within or between the other four sectors. Across the whole data set, correlations between VWC (; p<0.001) or soil temperature (r=0.19; p=0.037) and CO2 flux were significant but only described a small amount of the variation.
3.2 CH4 fluxes
Variation in CH4 emissions was much greater than that of CO2 between the field and drainage ditches. The mean CH4 flux (±SD) from the drainage ditches in all sectors was 84.2 (±325.4) mg C m−2 d−1 (see also Table S2). The mean CH4 flux (±SD) from the total field surface was 9.2 (±103.0) mg C m−2 d−1. Drainage ditches were much larger sources of CH4 to the atmosphere than the exposed peat at the field surface (Fig. 6). A high standard error was present in both the field and the drainage ditch measurements, although the drainage ditches showed more variation. The mean CH4 emissions from the drainage ditches were statistically greater than that of the fields (; p<0.001).
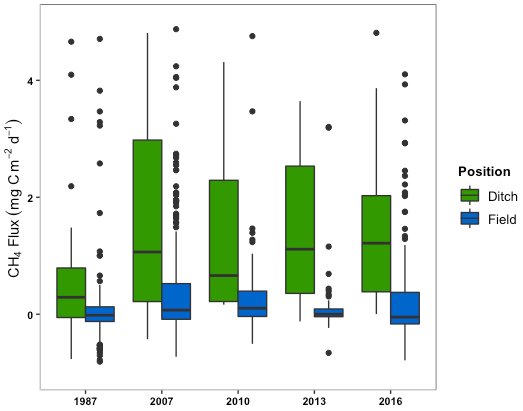
Figure 6The box and whisker plots of the CH4 fluxes from drainage ditches and all locations from the field surface according to the age of the sector.
There were no significant differences in mean CH4 among sectors from fields or from ditches (Table S1). The maximum CH4 flux from the fields and ditches were 2518.5 and 2737.8 mg C m−2 d−1, respectively, and the minimum fluxes were −74.7 and −5.8 mg C m−2 d−1, respectively. A single value of 10 822 mg C m−2 d−1 was deemed an outlier and removed from the 2016 sector drainage ditch flux data.
Combining the sectors and stratifying data by measurement position, the average (±SD) CH4 fluxes from the 2, 5, and 15 m positions on the fields were 13.4 (±167.8), 8.5 (±45.9), and 5.3 (±33.4) mg C m−2 d−1, respectively. Lower CH4 emissions were seen mid-field, but there were no statistically significant differences between the means of the three field measurement positions (Fig. 7). Across the whole data set, relationships between VWC (; p<0.001) or temperature (r=0.084; p=0.033) and CH4 flux were significant but described only a small part of the variation.
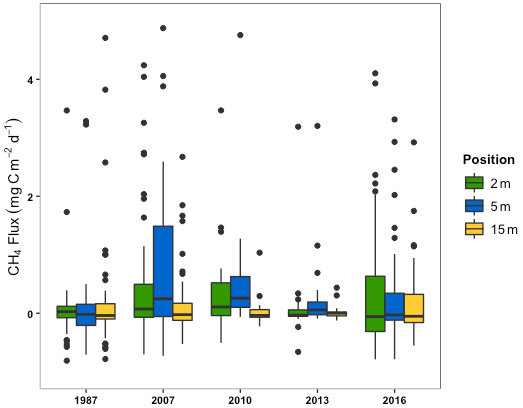
Figure 7Box and whisker plots of the CH4 flux by measurement distance from the ditch within each age sector.
3.3 Peat age and quality
The 14C dating results of peat samples from the 2007 and 2016 sectors revealed distinct differences in peat age across and within sectors (Fig. 8). The elevation difference across the field introduced an age difference between the peat closest to the drainage ditches and the peat at the centre. The results indicated that peat age (Δ14C) decreased toward the centre of the field with elevation in both the 2007 (−163.46 ± 3.27 ‰ and −104.10 ± 3.54 ‰ for 2 and 15 m, respectively) and 2016 (−94.06 ± 3.56 ‰ and 30.03 ± 4.00 ‰ for 2 and 15 m, respectively) sectors. Mid-field, at a depth of 80 cm from the surface, the age difference was also apparent between sectors (−276.62 ± 2.88 ‰ and −154.39 ± 3.29 ‰ from the 2007 and 2016 sectors, respectively) (Fig. 8).
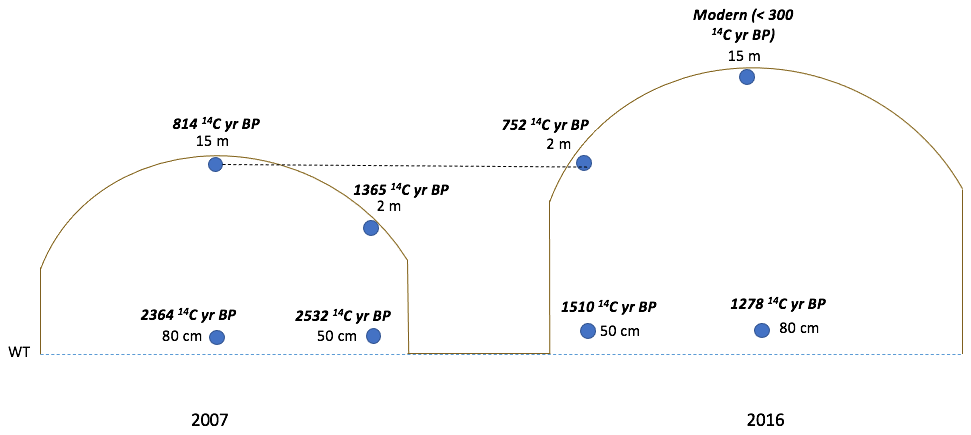
Figure 8Incubation sampling locations with respective 14C ages (all depths approximate). The horizontal line is drawn to show that these elevations are approximately equal.
FT-MIR analysis results indicated that the humification degree increased with years of extraction. Assessing samples from the surface and 10 cm depths, the sector average HIs (±SD) were 1.05 (±0.08), 0.82 (±0.08), and 0.70 (±0.09) from the 1987, 2007, and 2016 sectors, respectively. The 50 and 80 cm samples were excluded from this analysis because the deep samples were older and more humified than the surface peat as a result of their depth in the profile; however, they were included in the 14C dating. A one-way ANOVA demonstrated that there was a significant difference between the average HI from the 1987 and 2007 sectors (; p<0.001) and from the 1987 and 2016 sectors (; p<0.001).
3.4 Production potential
3.4.1 CO2
Carbon dioxide production potentials ranged from 0.50 to 1.39, 0.28 to 0.88, and 0.40 to 1.36 µg CO2 g−1 h−1 from the 1987, 2007, and 2016 sectors, respectively. Carbon dioxide production from the 1987 sector samples did not appear to follow any clear pattern or trend due to the position on the field or depth (Fig. 9a). However, statistically significant differences can be seen among depths of the surface and 10 cm from the 2 and 5 m positions and the 5 and 15 m positions. Carbon dioxide production within the 2007 sector also did not appear to follow a trend or pattern (Fig. 9b). Notable statistically significant differences within the 2007 sector emerged at a depth of 10 cm between the 5 and 15 m positions. The 2016 sector samples, however, exhibited a clear increase in CO2 production with increasing distance from the drainage ditches at the surface and 10 cm depths (Fig. 9c). From these depths, the 2 and 15 m positions and the 5 and 15 m positions were statistically different (; p<0.001). From all three sectors, CO2 production potentials were similar between the 50 and 80 cm depths, although the absolute values varied between the sectors.

Figure 9CO2 production potentials of all samples from the (a) 1987, (b) 2007, and (c) 2016 sectors.
3.4.2 CH4
As expected, given the oxic conditions of the incubations, no incubations showed a consistent increase in CH4 concentration for the experiment, and all CH4 r2 values were <0.8.
The net ecosystem exchange (NEE) of undisturbed peatlands ranges between −10 and −60 g C m−2 yr−1 (Koehler et al., 2010; Roulet et al., 2007; Sagerfors et al., 2008), whereas our study site is a net source of C to the atmosphere, similar to values reported from disturbed and post-extraction, unrestored peatlands. Aslan-Sungur et al. (2016) reported CO2 fluxes of 246, 244, and 663 g C m−2 yr−1 in 2011, 2012, and 2013, respectively, from a peatland site drained for mining and agricultural use. Salm et al. (2012) report net CO2 emissions of 480 g C m−2 yr−1 for extracted peatlands in Estonia. Rankin et al. (2018) reported annual CO2 emissions of 173–259 g C m−2 yr−1 from a 20-year post-extracted, unrestored peatland. For our study site, using the mean daily emission of 0.7 g C m−2 for 6 months and ∼ 0.5 g C m−2 d−1 for the 6 coldest months would yield an estimate of 200–250 g C m−2 yr−1, which is in line with previous results (Alm et al., 2007; Aslan-Sungur et al., 2016; Nykanen et al., 1995; Wilson et al., 2015).
A greater respiration rate from the drainage ditches is consistent with findings from previous studies at post-extraction (Waddington et al., 2010) and unrestored (Rankin et al., 2018) peatland sites. The CO2 emissions from the drainage ditches alone are similar in magnitude to emissions from natural peatlands (∼ 12 ± 21 g C m−2 yr−1, Abdalla et al., 2016).
Our measured CH4 fluxes correspond to published values from other drained peatland sites (Manning et al., 2019; Waddington et al., 1996). Korkiakoski et al. (2020) reported that a drained peatland site in Finland even became a CH4 sink over the growing season, measuring atmospheric emissions following precipitation events. Although our site is not a net sink, some uptake of CH4 by the field surface was measured consistently over all 3 years of study from all sector ages. We likely have under-sampled gas fluxes after rainfall events, which may influence temporal variation in CH4 emissions.
4.1 Environmental variables
Peat fibre content, indicated by visual analysis and industry specification, does not appear to influence respiration rates greatly. According to industry quality classifications, the 1987 sector contains the most fibric peat, while the 2007 through 2016 sectors do not vary significantly in fibre content (P.-O. Jean, Premier Tech, personal communication, 2022). Thus, this physical characteristic of the peat structure does not predict variation in CO2 production within fields or between sectors. Temperature is widely documented to be a driver of CO2 production (Blodau, 2002; Holden, 2005; Moore and Dalva, 1993; Yavitt et al., 1997); however, surface temperature exerts little influence over our measured CO2 flux (r=0.19). It is possible that other drivers, such as substrate quality, may have a larger impact on CO2 emissions. Surface VWC also does not appear to have an influence on CO2 flux (), possibly due to increased respiration rates in the deeper aerated peat that would offset a decline in CO2 production from desiccation (Dimitrov et al., 2010; Marwanto and Agus, 2014; Waddington et al., 2002). Average VWC in the upper 10 cm is lower than values documented from other disturbed peatlands (Manning et al., 2019; Waddington et al., 2002), but values from actively extracted peatland sites are difficult to find in the literature.
4.2 Chamber measurement CO2 fluxes
An expected result was the overarching observation that the most recently opened 2016 sector had greater CO2 emissions than the older sectors. It can be best explained by the relative age and thus the degree of decomposition of the surface peat. Since this sector was most recently opened, aerated peat in the upper profile is younger than sites where peat extraction has occurred for many years, exposing older peat present deeper in the profile. The range of water table depths across a field from beside the ditch to the centre of the field in the summer are 0.2 to 0.5 and 0.3 to 0.8 m, respectively. The peat water content was between 40 % and 50 % at 0.1 m below the surface and >70 % and 80 % below 0.3 m depth (Lai, 2022). Further, the elevation gradient that results from the practice of contouring the field surface exposes older peat deeper in the soil profile to the surface near the ditches, leaving younger peat in the middle of the fields (Fig. 8).
As peat extraction continues, older more humified peat with fewer nutrients become the surface peat (Croft et al., 2001; Glatzel et al., 2004). The decrease in CO2 production could also be a result of an accumulation of inhibitory compounds such as lignins, phenolics, or humic substances that hinder extracellular enzyme activity (Hogg et al., 1992). This is supported by the HI ( cm−1), which shows an increase in humification with time since extraction began. In addition, the reduced water contents due to drainage most likely lead to secondary decomposition of the peat in the top 0.3 to 0.5 m of peat in the field undergoing extraction (Biester et al., 2014). In an incubation study of peat samples from 2- and 7-year post-extraction peatlands, Waddington et al. (2001) concluded that CO2 production did not change from peat below a depth of 35 cm. The authors did not find a significant difference in CO2 production between the young and old cut over sites and argue that peat age more strongly influences CO2 production than gas transport through peat layers (Waddington et al., 2001).
Spatial variation within fields further illustrates the effect of peat age on respiration. The site-average CO2 flux is similar to average values from post-extraction, unrestored sites, while the 2016 sector 15 m position emits more CO2 than is recorded in the literature for post-extraction, unrestored sites (Rankin et al., 2018; Strack and Zuback, 2013). The 2016 sector displays a clear linear increase in CO2 flux with increasing distance from the ditch, but this effect declines and plateaus in the older sectors. Spatial variation in CO2 emissions is not apparent in the older extracted sectors because the surface peat is older, and the respiration rates are correspondingly lower. The peat at the 2 m position in the 2016 sector has a similar 14C age to the middle of the 2007 sector (Fig. 8) and also displays a similar mean CO2 flux to the 2007 15 m position (0.57 and 0.72 g C m−2 d−1 for 2016 and 2007, respectively).
Previous studies have compared trace gas production from natural and cut over peatlands (Croft et al., 2001; Glatzel et al., 2004; Waddington et al., 2001, 2002; Waddington and Price, 2000); however, none have compared the spatial variation in respiration rates between peat age based on depth and production year at an extracted peatland. Our results indicate that in the first few years of peat extraction, the residual labile C contained in the surface peat encourages C mineralization and high levels of CO2 production. This is clearly observed in the high emissions from the centre of the youngest field, opened 2 years prior to our initial measurements. An obvious decline in respiration within the 2016 sector is demonstrated over a horizontal distance of 10 m (Fig. 5), with an estimated 15 cm difference in depth and an age difference of ∼ 450 years, driven by the easily available C consumed by microbes. Over approximately 3 to 4 years, based on measurements from the sector that opened in 2013, respiration rates plateau. Peat quality appears to decline with extraction length, as indicated by the HI ( cm−1). Soil moisture and temperature, typical drivers of CO2 production, have relatively low influence on respiration rate, further indicating peat age (i.e., peat quality due to secondary decomposition) and corresponding lability to be the primary control.
4.3 Peat substrate age and decomposability
The CO2 production potential from the incubation experiments mirrors those observed in our field chamber fluxes, suggesting that peat samples from the field site behave similarly under field conditions when experimentally controlling for moisture and temperature. In high-latitude peatlands, deeper peat has been shown to be more resistant to decomposition than more recently formed peat (Hogg et al., 1992). Supporting our field measurement results, the CO2 production potential of incubated peat from the 2016 sector increases with distance from the ditch and decreasing peat age in the top layers of peat (surface and 10 cm depths; Fig. 9c). Increased CO2 production potential with younger peat supports the conclusion that the 2016 sector contains C in the substrate that is more readily available for decomposition. This is not observed from the older sectors that have undergone extraction for longer durations of time, also in accordance with our field measurements.
Decreased CO2 production potential from older, lower-quality peat is consistent with what has previously been presented in the literature for temperate peatlands. Research has shown that CO2 production potential declines with depth (Bridgham and Richardson, 1992; Waddington et al., 2001), helping to explain the consistent behaviour of the deep peat samples from the 2007 and 2016 sectors. This was an expected outcome as these samples were parallel to each other at depth and had similar (within ∼ 100 years) 14C ages (Fig. 9). Research has shown that intra- and inter-community CO2 production potential from well-humified peat does not vary significantly (Bridgham and Richardson, 1992). McKenzie et al. (1998) reported that CO2 and CH4 production potential declined with depth from different locations at two flooded peatland sites, which they attribute to differences in peat quality as a result of age.
Moreover, previous studies found decreased CO2 production potential from peat in extracted peatlands compared to natural and restored sites (Croft et al., 2001; Glatzel et al., 2004). Glatzel et al. (2004) observed lower rates of respiration from surface peat at a production site compared to natural and restored sites, finding the degree of humification to be an important control on CO2 production. Waddington et al. (2001) also found that CO2 production was lower in block-cut sites compared to a natural peatland and that the most active CO2 production was in the surface layers. Croft et al. (2001) found lower microbial biomass in a vacuum-harvested production site, leading to lower CO2 production, and found that microbial populations increased following restoration.
4.4 Chamber CH4 fluxes
A measured difference in CH4 fluxes between the field surface and drainage ditches was an expected outcome, as this has been demonstrated in many previous studies (Manning et al., 2019; Minkkinen et al., 1997; Minkinnen and Laine, 2006; Rankin et al., 2018; Schrier-Uijl et al., 2010; Strack and Zuback, 2013; Sundh et al., 2000; Waddington and Day, 2007). The drainage ditches act as localized anoxic zones that exhibit ideal moisture and temperature conditions for CH4 production. Greater CH4 fluxes, particularly if standing water is present, from the drainage ditches, could be explained by microbial breakdown of dissolved organic carbon (DOC) or the lateral transport of dissolved CH4 produced in the anoxic peat field layers (Billett and Moore, 2008; Teh et al., 2011; Cory et al., 2014; Logue et al., 2016).
Drainage has been documented to decrease CH4 emissions (Abdalla et al., 2016; Basiliko et al., 2007; Korkiakoski et al., 2020; Waddington and Price, 2000), but soil moisture is widely accepted to have a significant influence on CH4 emissions (e.g., Abdalla et al., 2016; Basiliko et al., 2007; Manning et al., 2019; Moore and Dalva, 1993; Moore and Roulet, 1993). VWC measurements likely do not correlate well with CH4 fluxes as they were taken in the surface peat that is disconnected from the moisture profile as a result of harrowing.
WTD measurements taken from June 2019 through August 2020 by Lai (2022) indicate that during the summer months the WT decreases toward the edge of the field, measuring approximately 0.6 m from the surface at a distance of 1 m from the ditches, due to the drainage of water into the base of the drainage ditches. Between June and October, at a distance of ∼ 13.5 m away from the drainage ditches, the WT remained at ∼ 0.8 m below the surface, except after a few large rain events. The peat water content above the water table in the field centre ranged from ∼ 50 % at 0.1 m depth below the surface to >70 % to 80 % at 0.3 m depth. These measurements indicate little difference in the potential oxidation path length from the field edge to the centre, further supporting our assertion that peat age is the primary control over CO2 production.
Vegetation removal also plays a role in the decline of CH4 transmission to the atmosphere compared to natural or restored sites. The absence of vegetation removes the input of labile C to the anoxic layer usually facilitated by sedge roots in natural peatlands (Joabsson et al., 1999; Dorodnikov et al., 2011) and the transport of CH4 to the surface via vascular plants ceases (Korkiakoski et al., 2020).
Our results indicate that the field surfaces from all sectors are not significant sources of CH4 to the atmosphere. At the same time, the drainage ditches produce almost 7 times more CH4 on average (9.2 and 72.0 mg C m−2 d−1 for the field and drainage ditches, respectively) during the warm seasons; ditches are frozen for 5 to 6 months of the year. Ultimately, no other significant trends or correlating variables were found to explain variation in our measured CH4 fluxes.
We were able to determine that peatlands undergoing active peat extraction are net sources of C to the atmosphere, with average CO2 and CH4 flux values similar to those of post-extraction, unrestored peatland sites. The newly open sectors are a greater source of CO2 to the atmosphere for the first few years, but then the emissions become independent of the duration of extraction. This suggests that two different emission factors might be appropriate, one for newly opened sectors and one for older sectors. The spatial age effect across the domed fields, where CO2 emissions increase with increasing distance from the drainage ditches, also declines and plateaus. CH4 emissions do not appear to exhibit a clear spatial or temporal pattern between sector ages or measurement positions, although lower CH4 fluxes are observed from the centre of the peat fields. The drainage ditches are sources of CH4 to the atmosphere, while the field surfaces have very low CH4 emission. In the fields of this study, the ditch spacing was every 30 m, so the ratio of the ditch to field surface area was ∼ 30:1. The CO2 from the field and ditches was not substantially different, the two surfaces contribute roughly proportional to their area in a sector (e.g., fields and ditches contributed 97 % and 3 %, respectively, to the overall flux from a sector). Conversely, the CH4 was significantly greater from the ditches than the fields, so the ditches emitted disproportionately more CH4 than their relative area (field emitted 79 % and ditches 21 % of the overall CH4 flux from a sector). Laboratory incubations did not show measurable CH4 production from the peat samples, with an estimated 80 %–90 % moisture content. Under constant moisture and temperature conditions, the CO2 production potential of peat from the 1987, 2007, and 2016 sector ages displayed the same behaviour as CO2 emissions under field conditions. CO2 production potential increased with distance from the ditch from the top peat layers in the youngest 2016 sector, but this pattern was not displayed from the older 1987 or 2007 sectors. CO2 production potential of peat samples at depths of 50 and 80 cm was similar between all three sector ages, although a significant amount of variation was observed between the sector ages. Peat age, which appears to be a good indicator of quality difference, was determined to be the primary driver of CO2 production across the field width and sectors.
The quantification of C emissions from these sites allows for more accurate estimates of peat production's overall impact on atmospheric C accumulation. The results of this study provide the industry with scalable numbers of CO2 and CH4 emission to determine potential mitigation tactics and move forward with the continued sustainable and responsible management of this resource.
All software for peat quality analysis is publicly available through https://doi.org/10.5281/zenodo.5747169 (Teickner, 2022) and https://doi.org/10.5281/zenodo.7262744 (Teickner and Hodgkins, 2022).
Data is available through https://doi.org/ 10.5683/SP3/BSRMUS (Roulet, 2023).
The supplement related to this article is available online at: https://doi.org/10.5194/bg-20-737-2023-supplement.
LC was responsible for the collection of the field and laboratory data, analysis, and the initial draft preparation. IBS was the primary supervisor of LC, reviewed and edited the manuscript, and contributed to the methodological design. MS was co-supervisor of LC, reviewed and edited the manuscript, and contributed to the methodological design. NTR reviewed and edited the manuscript, contributed to the methodological design, and is the PI on the project that funded the study. KHK and HT contributed to laboratory analyses and FT-MIR data evaluation and reviewed and edited the manuscript.
The contact author has declared that none of the authors has any competing interests.
Publisher's note: Copernicus Publications remains neutral with regard to jurisdictional claims in published maps and institutional affiliations.
The authors wish to thank the operations staff at Premier Tech Horticulture (PTH) for facilitating access to the field site and Frédéric Caron and Pierre-Olivier Jean of PTH for their scientific discussions. Field and lab assistance was provided by Naomi Weinberg, Madison Meades, Karina Volpato, Maria Gheta, Isabel Strachan, Jan Bahrke, Hedda Lil Müller, and Mike Dalva.
This research was funded through a Collaborative Research and Development grant (CRDJ 525896-18) to Nigel T. Roulet, Ian B. Strachan, and Maria Strack from the Natural Sciences and Engineering Research Council (NSERC) of Canada and by the Canadian Sphagnum Peat Moss Association (CSPMA) and its members.
This paper was edited by Nicolas Brüggemann and reviewed by Anna-Helena Purre and one anonymous referee.
Abdalla, M., Hastings, A., Truu, J., Espenberg, M., Mander, Ü., and Smith, P.: Emissions of methane from northern peatlands: A review of management impacts and implications for future management options, Ecol. Evol., 6, 7080–7102, https://doi.org/10.1002/ece3.2469, 2016.
Ahlholm, U. and Silvola, J.: CO2 release from peat-harvested peatlands and stockpiles, Proceedings of PEAT 90 versatile peat, International Conference on Peat Production and Use, 2, 1990.
Alm, J., Shurpali, N. J., Minkkinen, K., Aro, L., Hytönen, J., Laurila, T., and Mäkiranta, P.: Emission factors and their uncertainty for the exchange of CO2, CH4 and N2O in Finnish managed peatlands, Boreal Environ. Res., 12, 191–209, 2007.
Anrep, A. V.: Investigations of Peat Bogs and Peat Industry of Canada 1911-12, Bulletin No. 9, Department of Mines, Government Printing Bureau, 118 pp., https://doi.org/10.4095/307364, 1914.
Aslan-Sungur, G., Lee, X., Evrendilek, F., and Karakaya, N.: Large interannual variability in net ecosystem carbon dioxide exchange of a disturbed temperate peatland, Sci. Total Environ., 554, 192–202, https://doi.org/10.1016/j.scitotenv.2016.02.153, 2016.
Basiliko, N., Blodau, C., Roehm, C., Bengtson, P., and Moore, T. R.: Regulation of decomposition and methane dynamics across natural, commercially mined, and restored northern peatlands, Ecosys., 10, 1148–1165, https://doi.org/10.1007/s10021-007-9083-2, 2007.
Beleites, C. and Sergo, V.: HyperSpec: A package to handle hyperspectral data sets in R', R package version 0.99-20200527, 2020.
Bergman, I., Svensson, B. H., and Nilsson, M.: Regulation of methane production in a Swedish acid mire by pH, temperature and substrate, Soil Biol. Biochem., 30, 729–741, https://doi.org/10.1016/S0038-0717(97)00181-8, 1998.
Biester, H., Knorr, K.-H., Schellekens, J., Basler, A., and Hermanns, Y.-M.: Comparison of different methods to determine the degree of peat decomposition in peat bogs, Biogeosciences, 11, 2691–2707, https://doi.org/10.5194/bg-11-2691-2014, 2014.
Billett, M., and Moore, T.: Supersaturation and evasion of CO2 and CH4 in surface waters at Mer Bleue peatland, Canada, Hydrol. Processes, 22, 2044–2054, https://doi.org/10.1002/hyp.6805, 2008.
Blodau, C.: Carbon cycling in peatlands A review of processes and controls, Environ. Rev., 10, 111–134, 2002.
Bridgham, S. D. and Richardson, C. J.: Mechanisms controlling soil respiration (CO2 and CH4) in southern peatlands, Soil Biol. Biochem., 24, 1089–1099, https://doi.org/10.1016/0038-0717(92)90058-6, 1992.
Broder, T., Blodau, C., Biester, H., and Knorr, K. H.: Peat decomposition records in three pristine ombrotrophic bogs in southern Patagonia, Biogeosciences, 9, 1479–1491, https://doi.org/10.5194/bg-9-1479-2012, 2012.
Bronk Ramsey, C.: Bayesian analysis of radiocarbon date, Radiocarbon 51, 337–360, 2009.
Bubier, J., Moore, T., and Roulet, N.: Methane emissions from wetlands in the mid-boreal region of northern Ontario, Canada, Ecology, 74, 2240–2254, 1993.
Bubier, J., Moore, T., Savage, K., and Crill, P.: A comparison of methane flux in a boreal landscape between a dry and a wet year, Global Biogeochem. Cy., 19, GB1023, https://doi.org/10.1029/2004GB002351, 2005.
Cory, R. M., Ward, C. P., Crump, B. C., and Kling, G. W.: Sunlight controls water column processing of carbon in arctic fresh waters, Science, 345, 925–928, https://doi.org/10.1126/science.1253119, 2014.
Croft, M., Rochefort, L., and Beauchamp, C. J.: Vacuum-extraction of peatlands disturbs bacterial population and microbial biomass carbon, Appl. Soil Ecol., 18, 1–12, https://doi.org/10.1016/S0929-1393(01)00154-8, 2001.
Dorodnikov, M., Knorr, K.-H., Kuzyakov, Y., and Wilmking, M.: Plant-mediated CH4 transport and contribution of photosynthates to methanogenesis at a boreal mire: a 14C pulse-labeling study, Biogeosciences, 8, 2365–2375, https://doi.org/10.5194/bg-8-2365-2011, 2011.
Dimitrov, D. D., Grant, R. F., Lafleur, P. M., and Humphreys, E. R.: Modeling the effects of hydrology on ecosystem respiration at Mer Bleue bog, J. Geophys. Res.-Biogeosci., 115, G04043, doi.org/10.1029/2010JG001312, 2010.
Environment and Climate Change Canada: Canadian Climate Normals 1981–2010 Station Data, https://climate.weather.gc.ca/climate_normals/results_1981_2010_e.html (last access: June 2022), 2021.
Glatzel, S., Basiliko, N., and Moore, T.: Carbon dioxide and methane production potentials of peats from natural, harvested and restored sites, eastern Québec, Canada, Wetlands, 24, 261–267, 2004.
Harris, L. I., Richardson, K., Bona, K. A., Davidson, S. J., Finkelstein, S. A., Garneau, M., McLaughlin, J., Nwaishi, F., Olefeldt, D., Packalen, M., Roulet, N. T., Southee, F. M., Strack, M., Webster, K. L., Wilkinson, S. L., and Ray, J. C.: The essential carbon service provided by northern peatlands. Front. Ecol. Environ., 20, 222–230, https://doi.org/10.1002/fee.2437, 2022.
Hiraishi, T., Krug, T., Tanabe, K., Srivastava, N., Baasansuren, J., Fukuda, M., and Troxler, T.: 2013 supplement to the 2006 IPCC guidelines for national greenhouse gas inventories: Wetlands, IPCC, Switzerland, https://www.researchgate.net/profile/Mitsuru-Osaki/publication/272170539_2013_Supplement (last access: June 2022), 2014.
Hogg, E. H., Lieffers, V. J., and Wein, R. W.: Potential carbon losses from peat profiles: effects of temperature, drought cycles, and fire, Ecol. Appl., 2, 298–306, 1992.
Holden, J.: Peatland hydrology and carbon release: why small-scale process matters, Philos. T. Roy. Soc. A, 363, 2891–2913, https://doi.org/10.1098/rsta.2005.1671, 2005.
Joabsson, A., Christensen, T. R., and Wallén, B.: Vascular plant controls on methane emissions from northern peat forming wetlands, Trends Ecol. Evol., 14, 385–388, 1999.
Joosten, H. and Clarke, D.: Wise use of mires and peatlands, in: International Mire Conservation Group and International Peat Society, ISBN 951-97744-8-3, 304 pp., 2002.
Killham, K.: Soil Ecology, Cambridge University Press, Cambridge, UK, 242 pp. ISBN 9780521435178, 1994.
Koehler, A. K., Sottocornola, M., and Kiely, G.: How strong is the current carbon sequestration of an Atlantic blanket bog?, Global Change Biol., 17, 309–319, 2011.
Korkiakoski, M., Ojanen, P., Penttilä, T., Minkkinen, K., Sarkkola, S., Rainne, J., and Lohila, A.: Impact of partial harvest on CH4 and N2O balances of a drained boreal peatland forest, Agr. Forest Meteorol., 295, 108168, https://doi.org/10.1016/j.agrformet.2020.108168, 2020.
Lafleur, P. M.: Connecting atmosphere and wetland: trace gas exchange, Geography Compass, 3, 560–585, https://doi.org/10.1111/j.1749-8198.2008.00212.x, 2009.
Lai, O. Y.: Peat Moisture and Thermal Regimes for Peatlands Undergoing Active Extraction, M.Sc. Thesis, Department of Geography, McGill University, 65 pp., 2022.
Leifeld, J. and Menichetti, L.: The underappreciated potential of peatlands in global climate change mitigation strategies, Nat. Commun., 9, 1071, https://doi.org/10.1038/s41467-018-03406-6, 2018.
Limpens, J., Berendse, F., Blodau, C., Canadell, J. G., Freeman, C., Holden, J., Roulet, N., Rydin, H., and Schaepman-Strub, G.: Peatlands and the carbon cycle: from local processes to global implications – a synthesis, Biogeosciences, 5, 1475–1491, https://doi.org/10.5194/bg-5-1475-2008, 2008.
Logue, J. B., Stedmon, C. A., Kellerman, A. M., Nielsen, N. J., Andersson, A. F., Laudon, H., and Kritzberg, E. S.: Experimental insights into the importance of aquatic bacterial community composition to the degradation of dissolved organic matter, ISME J., 10, 533–545, https://doi.org/10.1038/ismej.2015.131, 2016.
Manning, F. C., Kho, L. K., Hill, T. C., Cornulier, T., and Teh, Y. A.: Carbon emissions from oil palm plantations on peat soil, Front. Forest. Glob. Change, 2, 37, https://doi.org/10.3389/ffgc.2019.00037, 2019.
Marwanto, S. and Agus, F.: Is CO2 flux from oil palm plantations on peatland controlled by soil moisture and/or soil and air temperatures?, Mitigation and Adaptation Strategies for Global Change, 19, 809–819, 2014.
McCarter, C. P. R. and Price, J. S.: The hydrology of the Bois-des-Bel peatland restoration: hydrophysical properties limiting connectivity between regenerated Sphagnum and remnant vacuum harvested peat deposit, Ecohydrology, 8, 173–187, 2015.
McKenzie, C., Schiff, S., Aravena, R., Kelly, C., and St. Louis, V.: Effect of temperature on production of CH4 and CO2 from peat in a natural and flooded boreal forest wetland, Clim. Change, 40, 247–266, 1998.
McNeil, P. and Waddington, J.: Moisture controls on Sphagnum growth and CO2 exchange on a cutover bog, J. Appl. Ecol., 40, 354–367, https://doi.org/10.1046/j.1365-2664.2003.00790.x, 2003.
Minkkinen, K. and Laine, J.: Vegetation heterogeneity and ditches create spatial variability in methane fluxes from peatlands drained for forestry, Plant and Soil, 285, 289–304, 2006.
Minkkinen, K., Laine, J., Nykänen, H., and Martikainen, P. J.: Importance of drainage ditches in emissions of methane from mires drained for forestry, Can. J. For. Res., 27, 949–952, 1997.
Moore, T. and Dalva, M.: The influence of temperature and water table position on carbon dioxide and methane emissions from laboratory columns of peatland soils, Eur. J. Soil Sci., 44, 651–664, https://doi.org/10.1111/j.1365-2389.1993.tb02330.x, 1993.
Moore, T. and Roulet, N.: Methane flux: water table relations in northern wetlands, Geophys. Res. Lett., 20, 587–590, https://doi.org/10.1029/93GL00208, 1993.
Moore, T., Roulet, N., and Knowles, R.: Spatial and temporal variations of methane flux from subarctic/northern boreal fens, Global Biogeochem. Cy., 4, 29–46, https://doi.org/10.1029/GB004i001p00029, 1990.
Moore, T., Heyes, A., and Roulet, N. T.: Methane emissions from wetlands, southern Hudson Bay lowland, J. Geophys. Res.-Atmos., 99, 1455–1467, https://doi.org/10.1029/93JD02457, 1994.
Nilsson, M., Sagerfors, J., Buffman, I., Laudon, H., Ericksson, T., Grelle, A., Weslien, P., and Lindroth, A.: Contemporary carbon accumulation in a boreal oligotrophic minerogenic mire – a significant sink after accounting for all C-fluxes, Glob. Change Bio., 14, 2317–2332, https://doi.org/10.1111/j.1365-2486.2008.01654.x, 2008.
Nugent, K. A., Strachan, I. B., Strack, M., Roulet, N. T., and Rochefort, L.: Multi-year net ecosystem carbon balance of a restored peatland reveals a return to carbon sink, Global Change Biol., 24, 5751–5768, 2018.
Nykanen, H., Alm, J., Lang, K., Silvola, J., and Martikainen, P. J.: Emissions of CH4, N2O and CO2 from a virgin fen and a fen drained for grassland in Finland, J. Biogeogr., 22, 351–357, 1995.
Oleszczuk, R., Regina, K., Szajdak, L., Höper, H., and Maryganova, V.: Impacts of Agricultural Utilization of Peat Soils on the Greenhouse Gas Balance, in: Peatlands and Climate Change, edited by: Strack, M., International Peat Society, 70–97, ISBN 978-952-99401-1-0, 2008.
Pelletier, L., Moore, T., Roulet, N., Garneau, M., and Beaulieu-Audy, V.: Methane fluxes from three peatlands in the La Grande Riviere watershed, James Bay lowland, Canada, J. Geophys. Res.-Biogeosci., 112, G01018, https://doi.org/10.1029/2006JG000216, 2007.
Pelletier, L., Garneau, M., and Moore, T.: Variation in CO2 exchange over three summers at microform scale in a boreal bog, Eastmain region, Québec, Canada, J. Geophys. Res.-Biogeosci., 116, G03019, https://doi.org/10.1029/2011JG001657, 2011.
Poulin, M., Rochefort, L., Quinty, F., and Lavoie, C.: Spontaneous revegetation of mined peatlands in eastern Canada, Can. J. Bot., 83, 539–557, https://doi.org/10.1139/b05-025, 2005.
Rankin, T., Strachan, I., and Strack, M.: Carbon dioxide and methane exchange at a post-extraction, unrestored peatland, Ecolog. Eng., 122, 241–251, https://doi.org/10.1016/j.ecoleng.2018.06.021, 2018.
R Core Team: A language and environment for statistical computing, R Foundation for Statistical Computing, Vienna, Austria, 2021.
Reimer, P. J., Austin, W. E. N., Bard, E., Bayliss, A., Blackwell, P. G., Bronk Ramsey, C., Butzin, M., Cheng, H., Edwards, R. L., Friedrich, M., Grootes, P. M., Guilderson, T. P., Hajdas, I., Heaton, T. J., Hogg, A. G., Hughen, K. A., Kromer, B., Manning, S. W., Muscheler, R., Palmer, J. G., Pearson, C., van der Plicht, J., Reimer, R. W., Richards, D. A., Scott, E. M., Southon, J. R., Turney, C. S. M., Wacker, L., Adolphi, F., Büntgen, U., Capano, M., Fahrni, S. M., Fogtmann-Schulz, A., Friedrich, R., Köhler, P., Kudsk, S., Miyake, F., Olsen, J., Reinig, F., Sakamoto, M., Sookdeo, A., and Talamo, S.: The IntCal20 Northern Hemisphere Radiocarbon Age Calibration Curve (0–55 cal kBP), Radiocarbon, 62, 725–757, 2020.
Rosenberry, D. O., Glaser, P. H., Siegel, D. I., and Weeks, E. P.: Use of hydraulic head to estimate volumetric gas content and ebullition flux in northern peatlands, Water Resour. Res., 39, SBH13, https://doi.org/10.1029/2002WR001377, 2003.
Roulet, N. T., Crill, P., Comer, N., Dove, A., and Boubonniere, R.: CO2 and CH4 flux between a boreal beaver pond and the atmosphere, J. Geophys. Res.-Atmos., 102, 29313–29319, https://doi.org/10.1029/97JD01237, 1997.
Roulet, N.: Replication Data for gas flux measurements of drained peatlands in eastern Quebec, Borealis [data set], https://doi.org/10.5683/SP3/BSRMUS, V1, UNF:6:HVAuKDiUMQlmaiNNG1/dDw== [fileUNF], 2023
Roulet, N. T., Lafleur, P. M., Richard, P. J., Moore, T. R., Humphreys, E. R., and Bubier, J.: Contemporary carbon balance and late Holocene carbon accumulation in a northern peatland, Glob. Change Biol., 13, 397–411, 2007.
Sagerfors, J., Lindroth, A., Grelle, A., Klemedtsson, L., Weslien, P., and Nilsson, M.: Annual CO2 exchange between a nutrient-poor, minerotrophic, boreal mire and the atmosphere, J. Geophys. Res.-Biogeosci., 113, G01001, https://doi.org/10.1029/2006JG000306, 2008.
Schlesinger, W. H. and Andrews, J. A.: Soil respiration and the global carbon cycle, Biogeochem., 48, 7–20, 2000.
Schrier-Uijl, A., Kroon, P., Hensen, A., Leffelaar, P., Berendse, F., and Veenendaal, E.: Comparison of chamber and eddy covariance-based CO2 and CH4 emission estimates in a heterogeneous grass ecosystem on peat, Agr. Forest Meteorol., 150, 825–831, https://doi.org/10.1016/j.agrformet.2009.11.007, 2010.
Segers, R.: Methane production and methane consumption: a review of processes underlying wetland methane fluxes, Biogeochem., 41, 23–51, 1998.
Smith, P., Bustamante, M., Ahammad, H., Clark, H., Dong, H., Elsiddig, E. A., Haberl, H., Harper, R., House, J., Jafari, M., Masera, O., Mbow, C., Ravindranath, N. H., Rice, C. W., Robledo Abad, C., Romanovskaya, A., Sperling, F., and Tubiello, F. N: Agriculture, Forestry and Other Land Use (AFOLU), in: Climate Change 2014: Mitigation of Climate Change, Contribution of Working Group III to the Fifth Assessment Report of the Intergovernmental Panel on Climate Change, edited by: Edenhofer, O., Pichs-Madruga, R., Sokona, Y., Minx, J. C., Farahani, E., Kadner, S., Seyboth, K., Adler, A., Baum, I., Brunner, S., Eickemeier, P., Kriemann, B., Savolainen, J., Schlomer, S., von Stechow, C., and Zwickel, T., Cambridge University Press, Cambridge, ISBN 978-1-107-05821-7, United Kingdom and New York, NY, USA, 2014.
Strachan, I. B., Pelletier, L., and Bonneville, M.-C.: Inter-annual variability in water table depth controls net ecosystem carbon dioxide exchange in a boreal bog, Biogeochem., 127, 99–111, https://doi.org/10.1007/s10533-015-0170-8, 2016.
Strack, M. and Zuback, Y. C. A.: Annual carbon balance of a peatland 10 yr following restoration, Biogeosciences, 10, 2885–2896, https://doi.org/10.5194/bg-10-2885-2013, 2013.
Strack, M., Waddington, J., Turetsky, M., Roulet, N., and Byrne, K.: Northern Peatlands, Greenhouse Gas Exchange and Climate Change, in: Peatlands and Climate Change, edited by: Strack, M., 44–69, ISBN 978-952-99401-1-0, International Peatland Society, 2008.
Sundh, I., Nilsson, M., Mikkelä, C., Granberg, G., and Svensson, B. H.: Fluxes of methane and carbon dioxide on peat-mining areas in Sweden, AMBIO, J. Human Environ., 29, 499–503, 2000.
Teh, Y. A., Silver, W. L., Sonnentag, O., Detto, M., Kelly, M., and Baldocchi, D. D.: Large greenhouse gas emissions from a temperate peatland pasture, Ecosystems, 14, 311–325, 2011.
Teickner, H.: ir: Functions to Handle and Preprocess Infrared Spectra, Zenodo [code], https://doi.org/10.5281/zenodo.5747169, last access: June 2022.
Teickner, H. and Hodgkins, S. B.: irpeat: Functions to Analyze Mid Infrared Spectra of Peat Samples, Zenodo [code], https://doi.org/10.5281/zenodo.7262744, last access: June 2022.
Turetsky, M.R., Kotowska, A., Bubier, J., Dise, N. B., Crill, P., Hornibrook, E. R. C., Minkkinen, K., Moore, T. R., Myers-Smith, I. H., Nykänen, H., Olefeldt, D., Rinne, J., Saarnio, S., Shurpali, N., Tuittila, E.-S., Waddington, J. M., White, J. R., Wickland, K. P., and Wilmking, M.: A synthesis of methane emissions from 71 northern, temperate, and subtropical wetlands, Global Change Biol., 20, 2183–2197, https://doi.org/10.1111/gcb.12580, 2014.
Updegraff, K., Pastor, J., Bridgham, S. D., and Johnston, C. A.: Environmental and substrate controls over carbon and nitrogen mineralization in northern wetlands, Ecological Appl., 5, 151–163, https://doi.org/10.2307/1942060, 1995.
Waddington, J. and Day, S.: Methane emissions from a peatland following restoration, J. Geophys. Res.-Biogeosci., 112, G03018, https://doi.org/10.1029/2001GB001398, 2007.
Waddington, J. and Price, J. S.: Effect of peatland drainage, harvesting, and restoration on atmospheric water and carbon exchange, Phys. Geogr., 21, 433–451, https://doi.org/10.1080/02723646.2000.10642719, 2000.
Waddington, J., Roulet, N., and Swanson, R.: Water table control of CH4 emission enhancement by vascular plants in boreal peatlands, J. Geophys. Res.-Atmos., 101, 22775–22785, 1996.
Waddington, J., Rotenberg, P., and Warren, F.: Peat CO2 production in a natural and cutover peatland: implications for restoration, Biogeochem., 54, 115–130, 2001.
Waddington, J., Warner, K., and Kennedy, G.: Cutover peatlands: a persistent source of atmospheric CO2, Global Biogeochem. Cy., 16, 1–7, https://doi.org/10.1029/2001GB001398, 2002.
Waddington, J., Strack, M., and Greenwood, M.: Toward restoring the net carbon sink function of degraded peatlands: Short-term response in CO2 exchange to ecosystem-scale restoration, J. Geophys. Res.-Biogeosci., 115, G01008, https://doi.org/10.1579/0044-7447-38.4.194, 2010.
Waddington, J. M., Plach, J., Cagampan, J. P., Lucchese, M., and Strack, M.: Reducing the carbon footprint of Canadian peat extraction and restoration, AMBIO J. Human Environ., 38, 194–200, https://doi.org/10.1579/0044-7447-38.4.194, 2009.
Wardle, D. A., Bardgett, R. D., Klironomos, J. N., Setälä, H., Van Der Putten, W. H., and Wall, D. H.: Ecological linkages between aboveground and belowground biota, Science, 304, 1629–1633, 2004.
Whalen, S.: Biogeochemistry of methane exchange between natural wetlands and the atmosphere, Environ. Eng. Sci., 22, 73–94, https://doi.org/10.1089/ees.2005.22.73, 2005.
Wickham, H., ggplot2: Elegant Graphics for Data Analysis, Springer-Verlag New York, 259 pp., ISBN 978-3-319-24277-4, https://ggplot2.tidyverse.org (last access: June 2022), 2016.
Wilson, D., Dixon, S. D., Artz, R. R. E., Smith, T. E. L., Evans, C. D., Owen, H. J. F., Archer, E., and Renou-Wilson, F.: Derivation of greenhouse gas emission factors for peatlands managed for extraction in the Republic of Ireland and the United Kingdom, Biogeosciences, 12, 5291–5308, https://doi.org/10.5194/bg-12-5291-2015, 2015.
Yavitt, J. B. and Seidmann-Zager, M.: Methanogenic conditions in northern peat soils, Geomicrobiol. J., 23, 119–127, 2006.
Yavitt, J. B., Williams, C. J., and Wieder, R. K.: Production of methane and carbon dioxide in peatland ecosystems across North America: Effects of temperature, aeration, and organic chemistry of peat, Geomicrobiol. J., 14, 299–316, https://doi.org/10.1080/01490459709378054, 1997.
Yu, Z. C.: Northern peatland carbon stocks and dynamics: a review, Biogeosciences, 9, 4071–4085, https://doi.org/10.5194/bg-9-4071-2012, 2012.