the Creative Commons Attribution 4.0 License.
the Creative Commons Attribution 4.0 License.
 | 20 Feb 2023
Spruce bark beetles (Ips typographus) cause up to 700 times higher bark BVOC emission rates compared to healthy Norway spruce (Picea abies)
Erica Jaakkola
Antje Gärtner
Anna Maria Jönsson
Karl Ljung
Per-Ola Olsson
Thomas Holst
Biogenic volatile organic compound (BVOC) emissions from trees subjected to biotic stress are higher compared to healthy trees, and they may also have a different compound composition. This in turn affects atmospheric chemistry and can lead to either positive or negative feedback to the climate. Climate change favors the abundance of the European spruce bark beetle (Ips typographus) which attacks the bark of Norway spruce (Picea abies) trees, causing induced BVOC emissions from the trees as a response to the insect stress. Here, results are reported from a study analyzing the difference in emission rates between healthy and bark-beetle-infested Norway spruce trees, changes in emission rates over time since the infestation started, and differences in emission rates from bark-beetle-drilled entry and exit holes.
Bark chamber measurements on both healthy and infested trees were performed during the summer of 2019 at Hyltemossa and Norunda research stations in Sweden. The measurements showed that induced BVOC emissions following the bark beetle infestation were dominated by entry hole emissions in the early growing season and exit hole emissions in the later season. The results showed a significant difference in emission rates between healthy and infested trees during both seasons. The seasonal average standardized BVOC emission rate of healthy trees was 32 ± 52 µg m−2 h−1 (mean ± standard deviation), while the average standardized BVOC emission rates of infested trees were 6700 ± 6900 and 2000 ± 1300 µg m−2 h−1 during the early and late season respectively. BVOC emission rates were highest at the start of the infestation and decreased exponentially with time, showing induced emission rates for up to 1 year after which the emission rates were similar to those from healthy bark. Constitutive needle emission rates from healthy trees were found to be 11 times higher than bark emissions from healthy trees. However, when Norway spruce trees were infested, the bark emission rates were instead 6 to 20 times higher than the needle emissions, causing substantial increases in the total tree BVOC emission rate. This could lead to high impacts on atmospheric processes, specifically the formation of secondary organic aerosols, which have a higher yield from some monoterpene compounds, which increased from infested trees.
- Article
(11324 KB) - Full-text XML
-
Supplement
(620 KB) - BibTeX
- EndNote


In Europe, forest damage caused by outbreaks of the European spruce bark beetle (Ips typographus) is the third largest disturbance after storm felling and forest fires (Jönsson et al., 2012; Schelhaas et al., 2003). In Sweden, the drought in the summer of 2018 led to increased bark beetle outbreaks, which in 2020 were estimated to affect about 8 million m3 (standing timber volume) Norway spruce (Picea abies) forest (Wulff and Roberge, 2020). This is the largest forest volume killed by spruce bark beetles in a single year in Sweden. On average, between 1990–2010, around 150 000 m3 of forest in southern Sweden was damaged per year (Wulff and Roberge, 2020). Climate change amplifies the risk of bark beetle outbreaks, as the increased risks of storm felling and drought weaken the trees, making them more vulnerable to bark beetle infestations (Jönsson et al., 2012). Higher temperatures and a longer growing season may also lead to an additional generation of spruce bark beetles per year (Jakoby et al., 2019; Jönsson et al., 2012). A larger bark beetle population, triggered by weather extremes, is associated with an increased risk of attacks on healthy spruce trees and outbreaks that can cause extensive damage to spruce forests (Jakoby et al., 2019; Seidl et al., 2014).
Biogenic volatile organic compounds (BVOCs) emitted from trees have many functions, including a defense system against heat and oxidative stress (Loreto and Schnitzler, 2010). The compounds are highly volatile and chemically reactive and can react directly with oxidizing species or act as membrane stabilizers (Brilli et al., 2009; Kleist et al., 2012; Sharkey et al., 2001). The efficiency of BVOCs to form oxidation products depends on the specific BVOC's molecular structure (Bonn and Moortgat, 2002; Roldin et al., 2019; Thomsen et al., 2021), and oxidized products from emitted BVOCs can be important drivers for the formation of secondary organic aerosols (SOA; Kulmala et al., 2004). Plants normally emit a certain BVOC species composition; however, stress on the plants might affect the composition and change the BVOC's oxidation capacity in the atmosphere, leading to more efficient SOA precursors which stimulate particle growth (Roldin et al., 2019; Thomsen et al., 2021). Boreal forests experiencing abiotic or biotic stress due to large-scale forest disturbances might thus increase the production of BVOC species that are highly efficient precursors of SOA. There are thus high uncertainties regarding the BVOC emission contribution to either negative feedback to the climate (enhancing cloud formation and radiation scattering; Paasonen et al., 2013) or positive feedback (via increasing tropospheric ozone levels; Arneth et al., 2010; Jia et al., 2019).
Constitutive BVOCs are emitted from all parts of Norway spruce, with the bark surface and trunk emissions suggested to contribute a lot more to the whole tree emissions than previously thought, even when not attacked by bark beetles (Greenberg et al., 2012). High amounts of different BVOCs are stored in plant tissues and are used to fight off predators during herbivory (Laothawornkitkul et al., 2009; Li et al., 2019; Rieksta et al., 2020), and conifer trees use BVOCs as a defense mechanism against spruce bark beetles (Celedon and Bohlmann, 2019; Krokene, 2015; Raffa and Berryman, 1982). As the parental bark beetles attack Norway spruce trees by drilling through the bark and excavating egg galleries in the phloem, the spruce tries to prevent this by submerging the parental bark beetles and egg galleries with resin, containing compounds toxic to spruce bark beetles such as myrcene and α-terpinene (Celedon and Bohlmann, 2019; Everaerts et al., 1988; Krokene, 2015). This can potentially kill the beetles or push them out through the entry holes (Raffa, 1991). The resin is the main part of the spruce defense and contains high concentrations of BVOCs that volatilize when the resin flows out of the tree, causing it to harden and close the wound. Studies on conifers attacked by bark beetles found evidence of increased monoterpene (MT) content at the attacked location (Amin et al., 2013; Ghimire et al., 2016; Zhao et al., 2011b), and the occurrence of the oxygenated MT eucalyptol has been found to indicate induced defense and higher survival rates from Norway spruce attacked by spruce bark beetles (Schiebe et al., 2012). If the spruce could not successfully defend itself and larvae develop in the galleries, the new generation of spruce bark beetles will start to leave the tree after about 8 weeks by drilling exit holes through the bark, resulting in decreased tree vitality (Öhrn et al., 2014).
The defense mechanisms of Norway spruce are still not fully known or understood, and only a few studies have analyzed the BVOC trunk emissions induced by an attack by the European spruce bark beetle (Ghimire et al., 2016; Zhao et al., 2011b). This study aimed to (i) investigate the impact of spruce bark beetle infestation on BVOC emissions and the emitted compound composition from Norway spruce trunks, (ii) study the changes in BVOC emission rates and compound composition with the number of holes drilled by the bark beetles, and (iii) track the compound emissions and composition over time. The final aim (iv) was to compare and relate the spruce-bark-beetle-induced BVOC emission rates to needle emissions to see how important bark emissions are in the ecosystem perspective. Based on previous findings, three hypotheses were formulated: (H1) infested trees have higher bark emission rates than healthy trees, and infestation changes the compound composition, (H2) BVOC emission rates are highest at the start of an infestation and decrease over time in response to declining tree vitality and eventual death of the tree, and (H3) BVOC emission rates are affected by the specific bark-beetle-drilled hole type (i.e., entry or exit hole), where the emission rates from entry and exit holes differ because of a difference in defense activity of the spruce.
2.1 Site description
Field work was carried out between the beginning of May and late August 2019 at three plots in managed forests at the Integrated Carbon Observation System, ICOS-Sweden.se (ICOS), research station in Hyltemossa (HTM, 56∘06′ N, 13∘25′ E; Fig. 1a) and at two plots in the managed forest at the ICOS research station in Norunda (NOR, 60∘05′ N, 17∘29′ E; Fig. 1c; Table 1). The field sites were located in southern and central Sweden (Fig. 1b). The forest in HTM was dominated (> 97 % of the species composition) by Norway spruce with a small fraction (< 3 %) of Scots pine (Pinus sylvestris) and deciduous trees. The understory vegetation was sparse, containing mostly mosses (Heliasz et al., 2021b). The forest in NOR was dominated by Norway spruce (54 %) and Scots pine (37 %) with a small fraction (9 %) of deciduous trees and understory vegetation with shrubs of mostly blueberries, cranberries, mosses and flowers (Mölder et al., 2021b). In HTM the trees were around 40 years old with an average height of 19 m in 2019, and NOR had a forest stand of mixed ages around 60–80 years and up to 110 years with a height of around 25 m for the dominating trees in 2019 (Heliasz et al., 2021a; Mölder et al., 2021a).
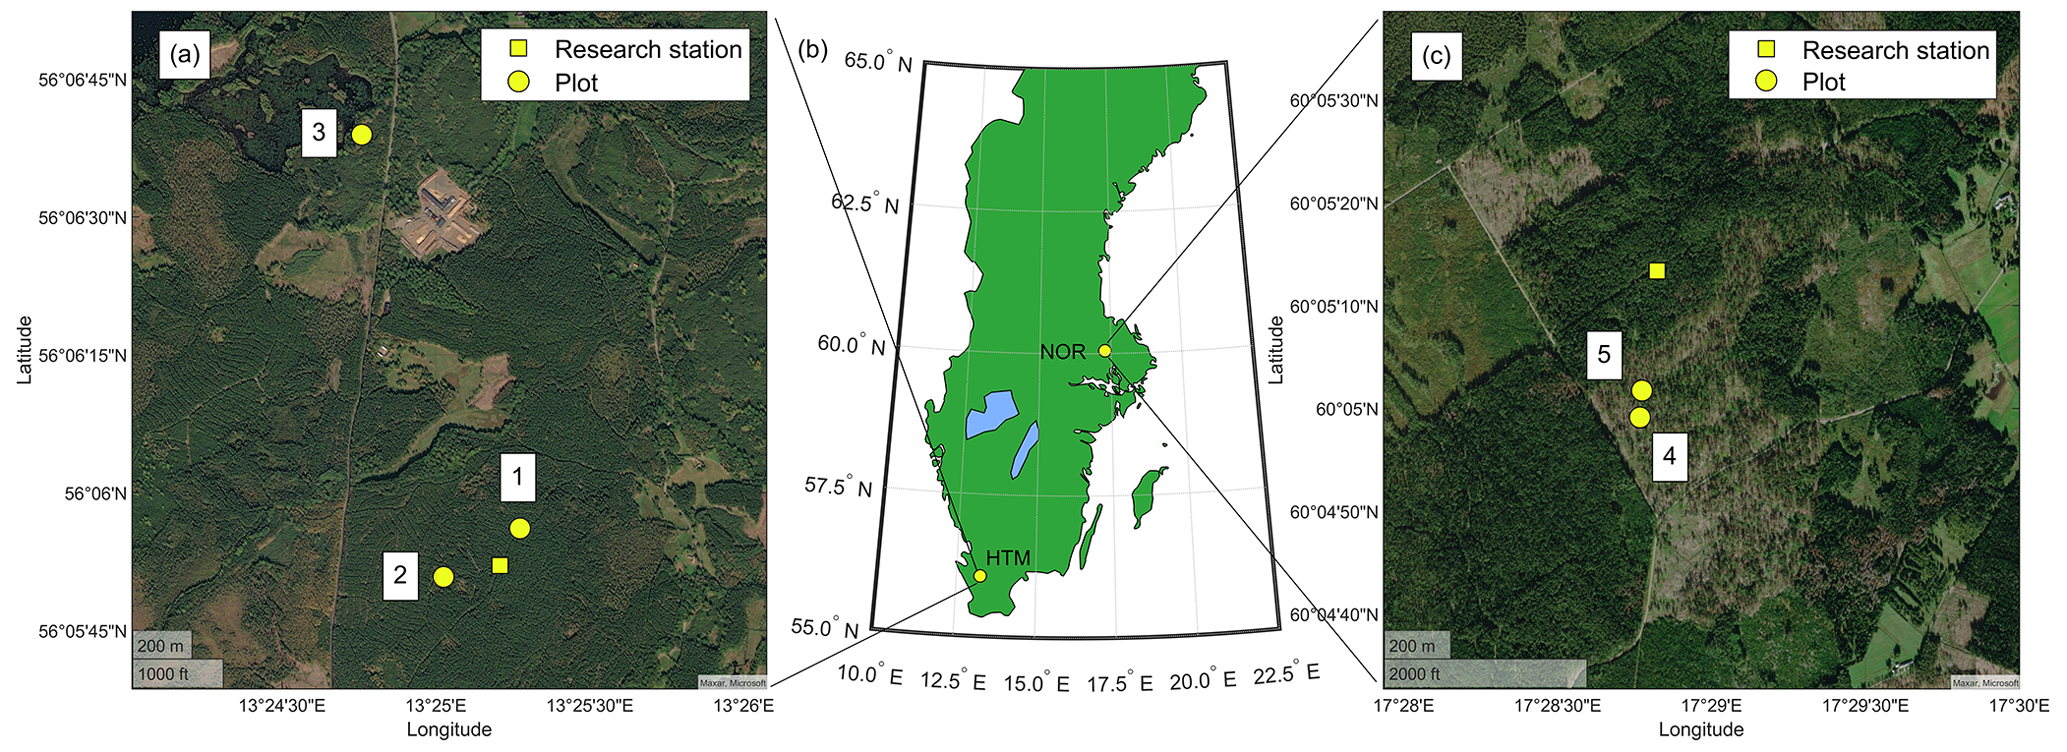
Figure 1The location of the study site Hyltemossa (HTM; a), the location in Sweden (b) and site Norunda (NOR; c). Measurement plots (yellow circle) at HTM (1–3) and NOR (4–5) are shown in the site-specific maps and their location relative to the ICOS station (yellow square). Healthy Norway spruce trees were measured in plots 1–3, and infested spruce trees were measured in plots 1, 3, 4 and 5. The figure was created in MATLAB and Mapping Toolbox release 2021a (MathWorks, Inc., Natick, MA, USA).
Table 1Timetable of the sampling conducted during 2019 at the sites Hyltemossa (HTM) and Norunda (NOR). The number of trees at each plot is indicated by n and sorted in categories (healthy or infested). The samples taken from each tree during the field visits are indicated in the table, and a total of the samples are summed for each field visit and for the entire study. Note that one of the healthy spruce trees at plot 3 was infested in June and thus changed the number of healthy and infested trees at that plot (number in brackets) while the total number remained at 19.

Two plots in HTM were located inside the Norway spruce plantation used by ICOS, while the third plot was located around 1.6 km north of the ICOS station in an older (about 100 years) forest stand. In NOR, the locations were chosen based on the availability of bark-beetle-infested trees inside the forest plantation. At HTM, the three plots were visited five times during the summer, and at NOR the two plots were visited once (Table 1). Five Norway spruce trees were selected at plot 1 in HTM and four trees at plot 2 and 3 in HTM (total n = 13 in HTM) and were measured repeatedly throughout the season. Three trees were selected at each plot in NOR (n = 6) and only measured once. In total 19 trees were measured (Table 1). Healthy trees (n = 11) at HTM were selected by visual examination in close contact with the forest manager employed by the forest owner, Gustafsborgs Säteri AB, in May 2019. Trees that were potentially stressed by forestry machinery or pests were not selected for the study. The infested trees (n = 9) were selected based on signs of spruce bark beetle infestation. Signs of late bark beetle infestation from the previous year, 2018, were found on two trees, one at plot 1 and one at plot 3 (Fig. 1a). These trees were selected for the study to analyze long-term infestation effects. An active spruce bark beetle outbreak was occurring in NOR in 2019, and only infested trees were selected at that site to expand the sample size for the infested trees.
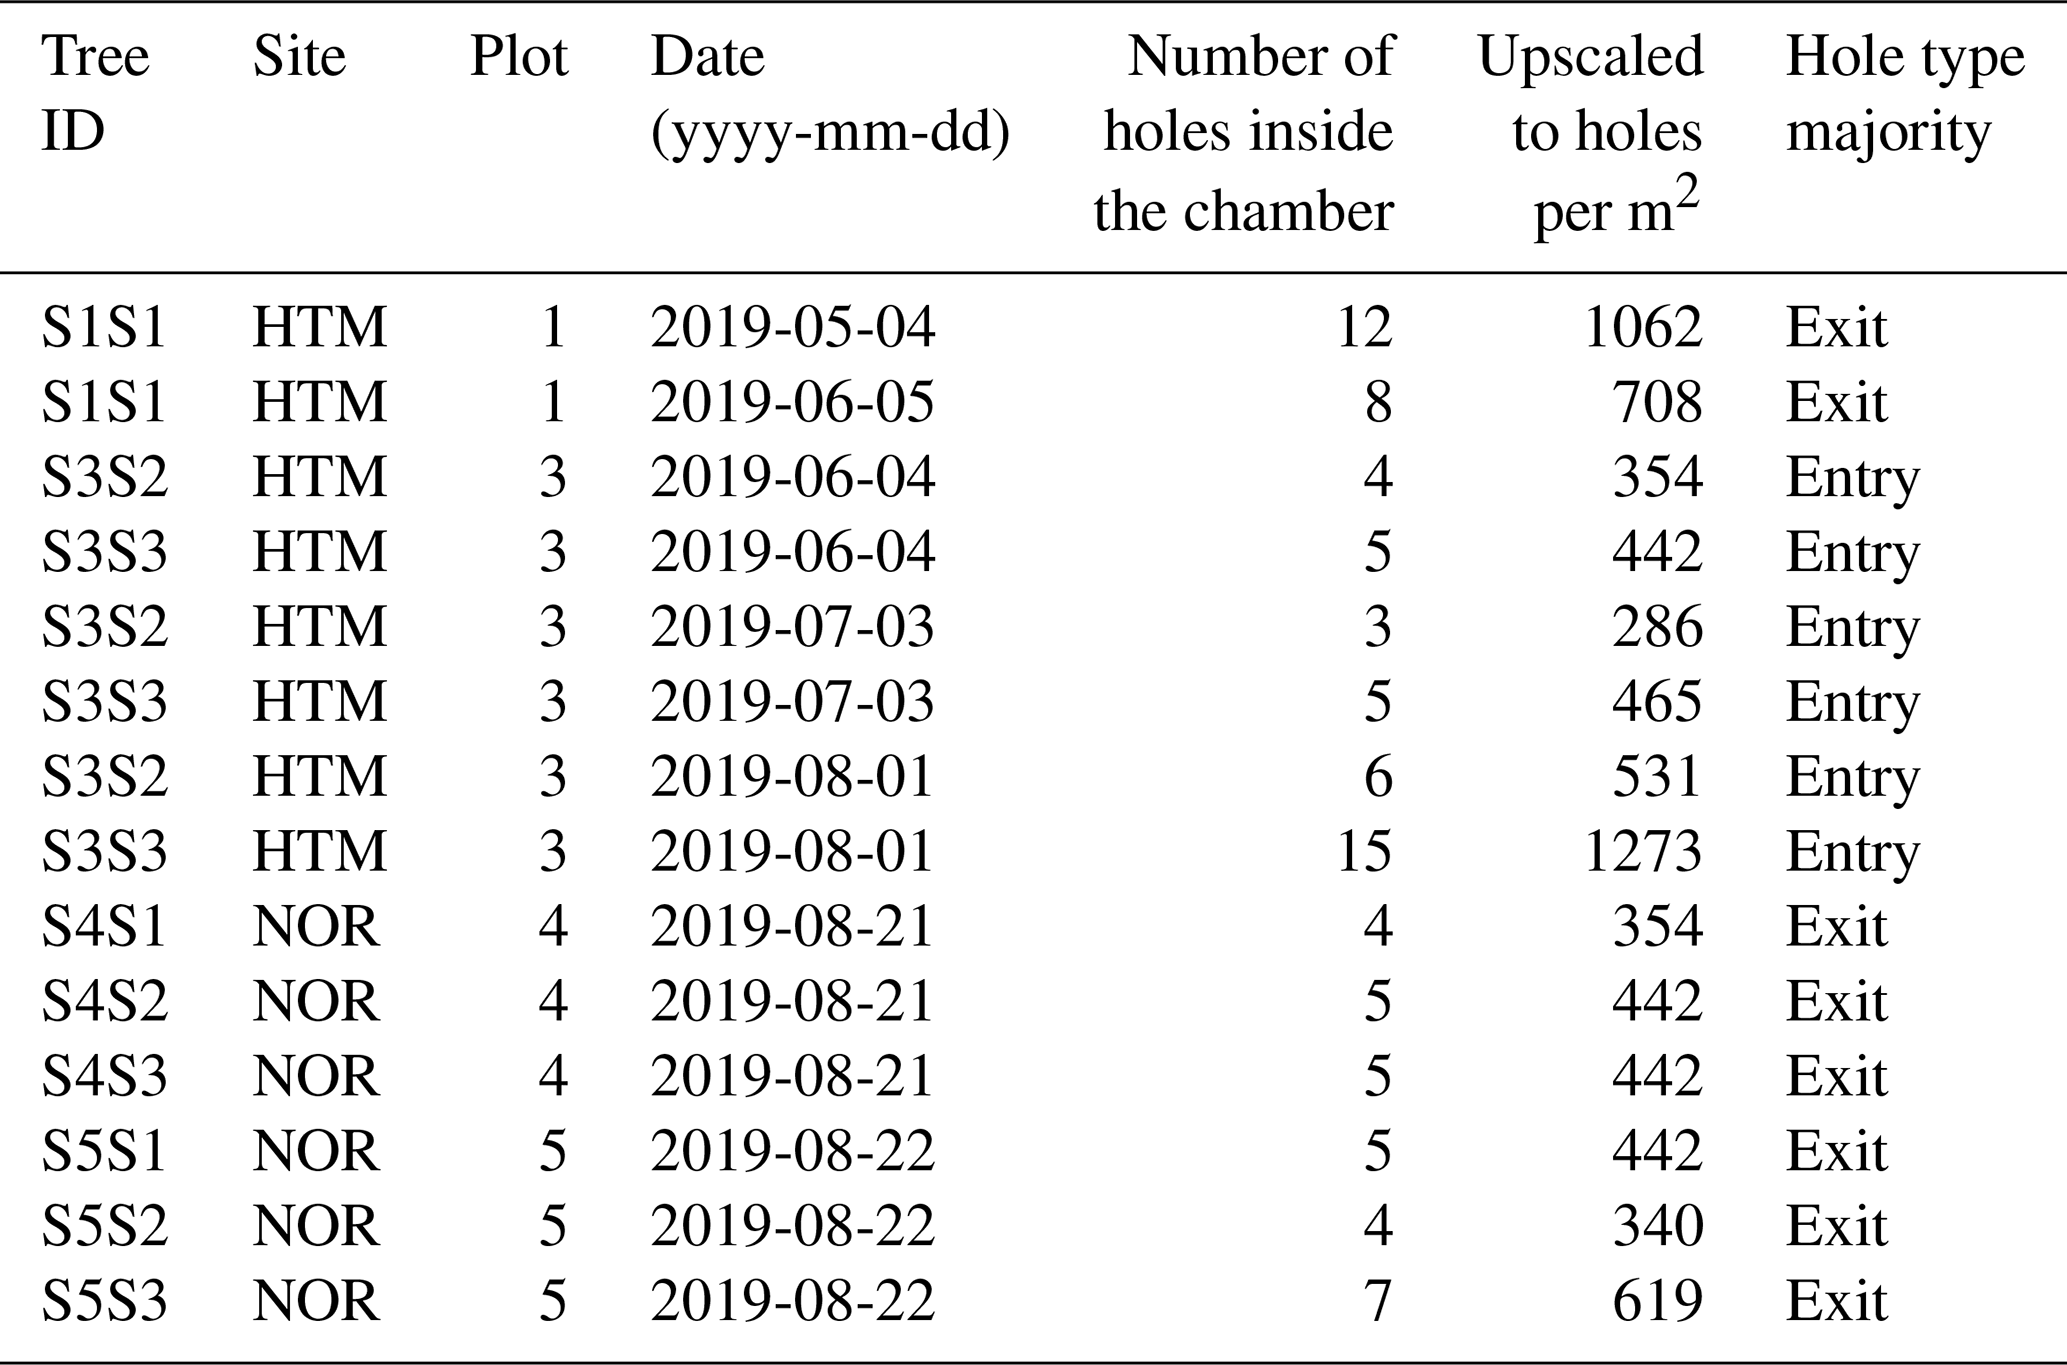
Table 2The infested Norway spruce trees (n = 9) by tree ID, site, plot and the number of holes counted inside the chamber at the given date of the field visit for each tree. The counted holes were upscaled to holes per square meter of bark surface, and the majority of the hole type was defined to be either mostly entry or exit holes. The bark of the Norway spruce with the ID S1S1 was infested during the late season of 2018 and thus already had a majority of exit holes early in 2019.
A bark beetle slit trap with pheromones was installed at plot 3 in HTM as an attempt to attract bark beetles to the plot. The trap was installed between May and June (Table 1) using one bag of biological attractant containing the pheromone 2,3,2-methylbutenol (Typosan P306, Plantskydd AB, Ljungbyhed, Sweden). This resulted in infestation of two trees, one initially healthy tree (ID S3S3, Table 2) and one with signs of late bark beetle infestation from the preceding season (ID S3S2, Table 2), allowing us to monitor the infestation development. The two trees were included in the repeated measurements taken throughout the season and used as a case study, allowing us to monitor the infestation development from the beginning of the infestation until the trees were taken down by the forest owner as a precautionary measure to protect the neighboring stands from infestation.
The weather during the measurement periods varied from cold and humid to warm and dry conditions. The average temperature during the growing season (May–August) was 14.6 ∘C (±4.6 ∘C) at HTM and 14.2 ∘C (±4.2 ∘C) at NOR with the sum of the precipitation over the growing season being 168 mm at HTM and 151 mm at NOR (Fig. 2). The daily average temperatures during the measurement periods ranged from 5 to 22 ∘C for both sites, with a daily total rainfall of up to 3 mm (Fig. 2). In HTM, it was coldest (1 to 11 ∘C) in May and warmest (12 to 28 ∘C) in June.
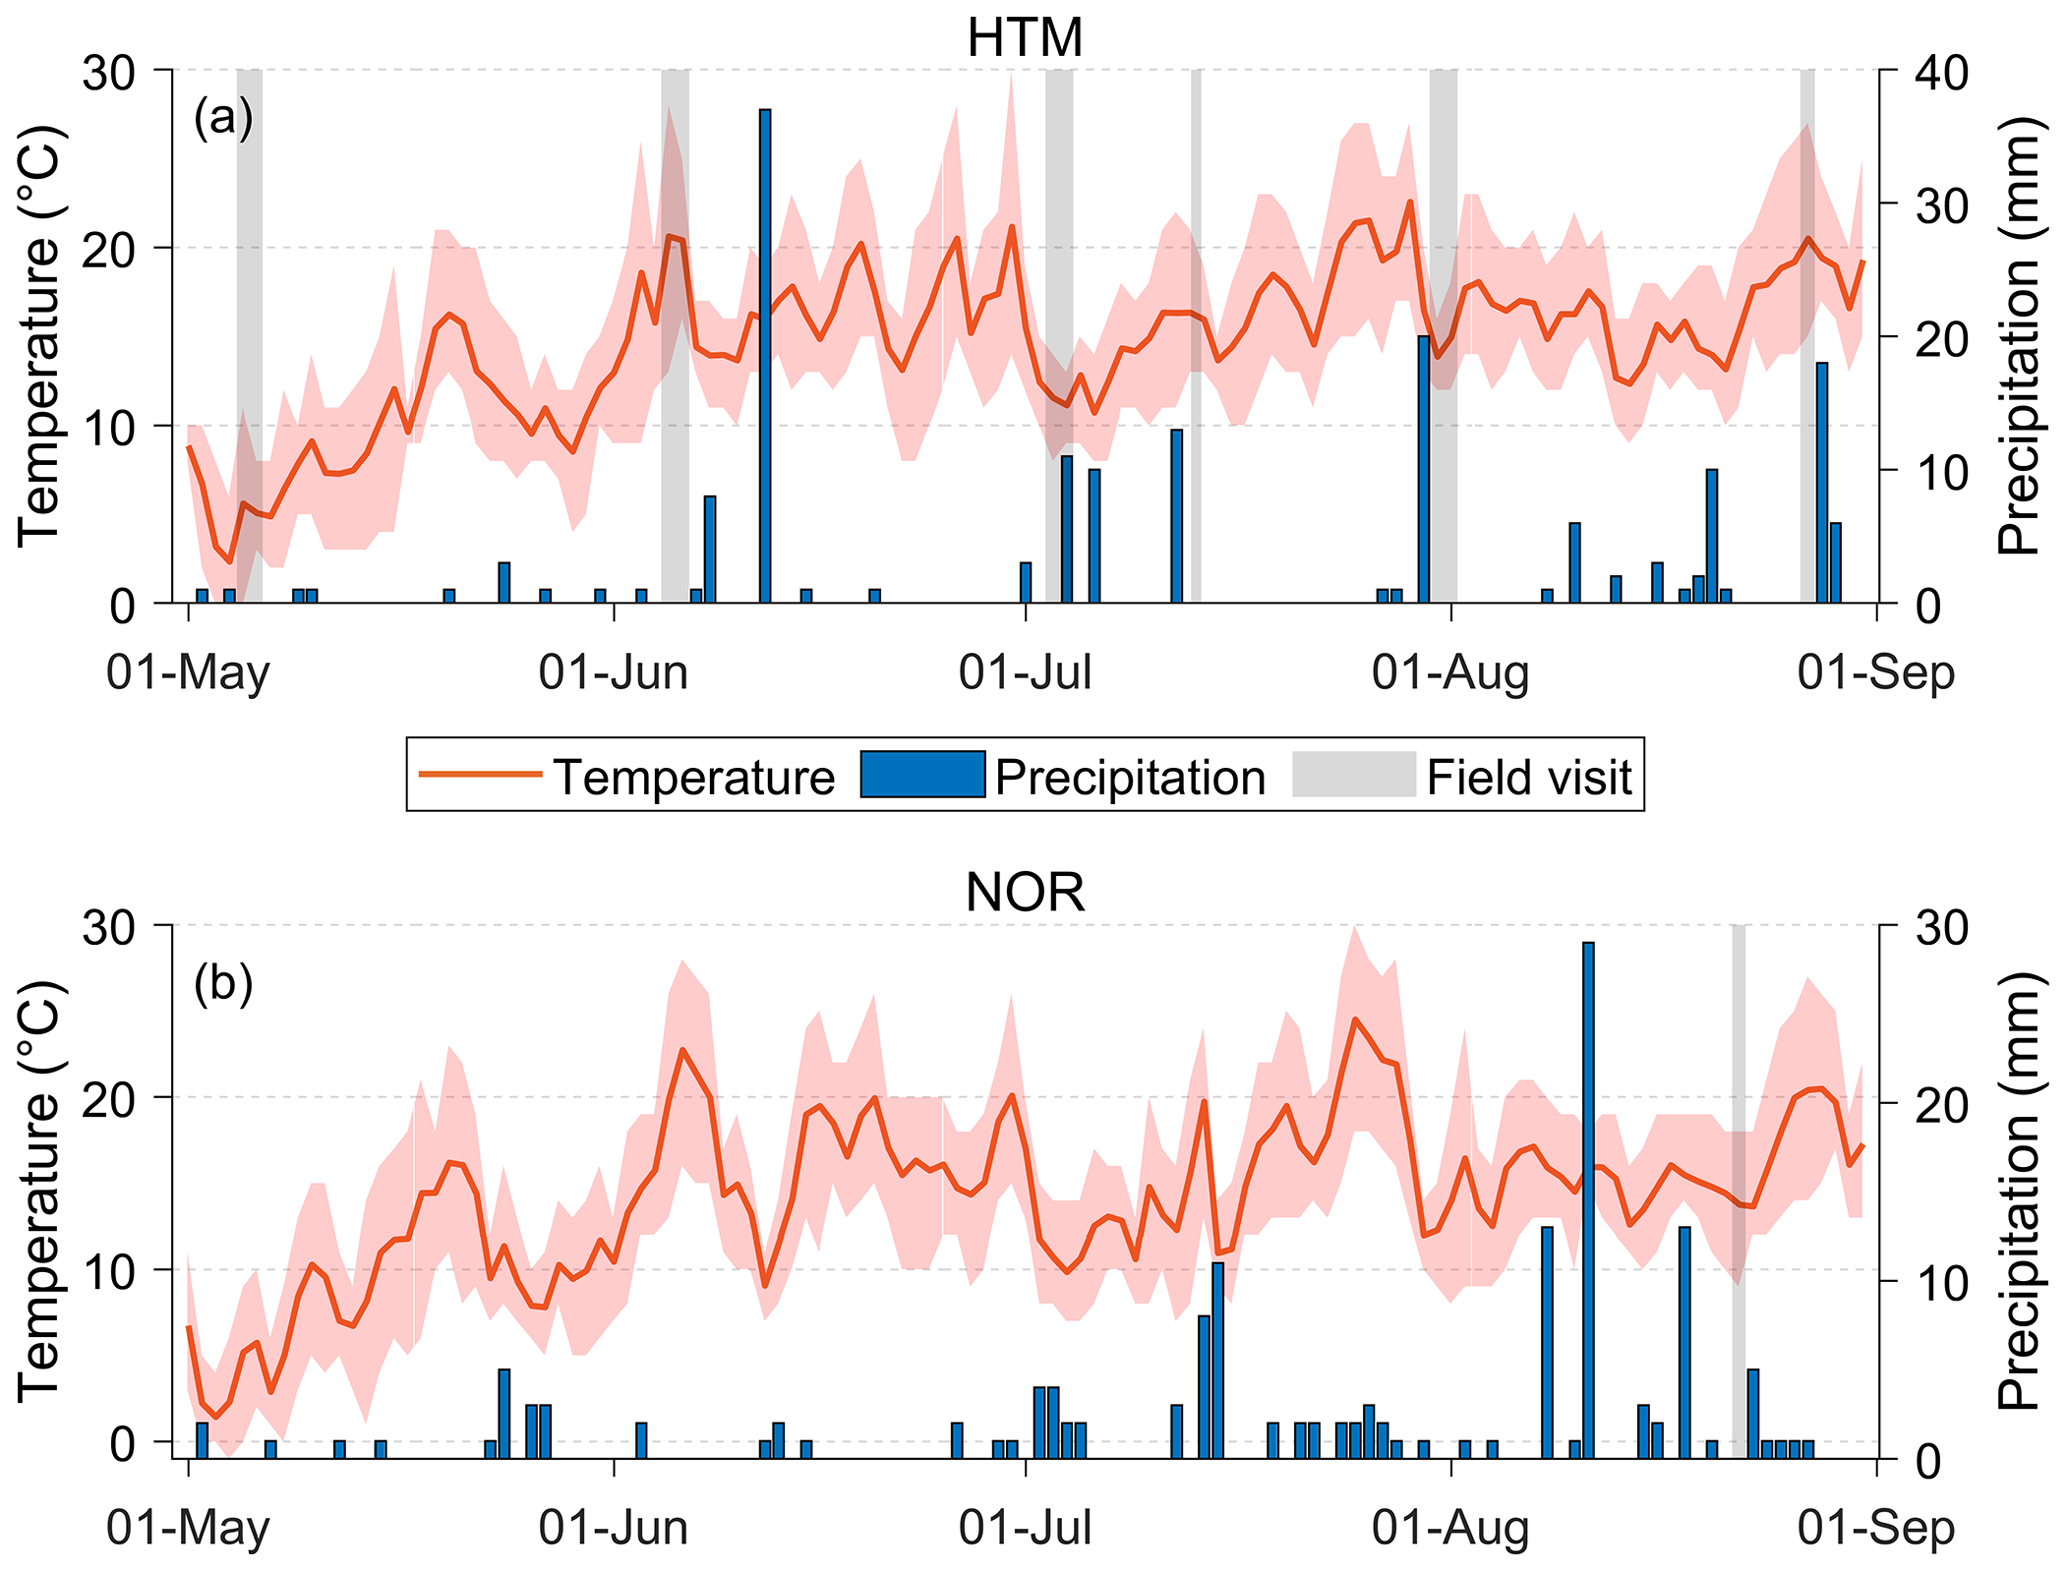
Figure 2The daily average temperature (red line) with daily minimum and maximum temperature (red shade) and total daily precipitation (blue bars) for the study sites in (a) Hyltemossa and (b) Norunda. The field visits are marked in grey. The weather data were acquired from the ICOS research stations at the study sites (Heliasz, 2020; Mölder, 2021).
2.2 Experimental design
The bark emissions from the trees were measured using a tree trunk chamber connected with PTFE tubing (Teflon, Swagelok, Solon, OH, USA) to a pump box system consisting of a diaphragm pump (1420 VPD, Gardner Denver Thomas GmbH, Memmingen, Germany) and a flow meter (GFM mass flow meter, Aalborg Instruments & Controls Inc., Orangeburg, NY, USA). The pump box system was used to purge the trunk chamber of 0.6 to 0.9 L volume with air at a flow rate of 0.7 L min−1 (liters per minute; Fig. 3). A BVOC filter (Hydrocarbon trap, Alltech, Associates Inc., Chicago, IL, USA) containing activated carbon and MnO2-coated copper nets was mounted between the pump box and chamber to scrub the purge air of BVOCs and O3. The chamber itself consisted of a metal frame and a flexible polyethylene foam base and was fastened with straps around the tree trunk. The inside of the chamber had been carefully wrapped with preconditioned (oven-cleaned, 40 ∘C, 3 h) polyamide bags (Toppits, Cofresco Frischhalteprodukte GmbH, Germany) to avoid contamination with BVOCs from the chamber foam base. A metal lid with in- and outgoing PTFE tubing (∅ 6.35 mm) for purge air and sample collection was used to close the chamber during the measurement. Air temperature within the chamber was measured with a temperature probe (HI 145, Hanna Instruments, RI, USA) during BVOC collection.
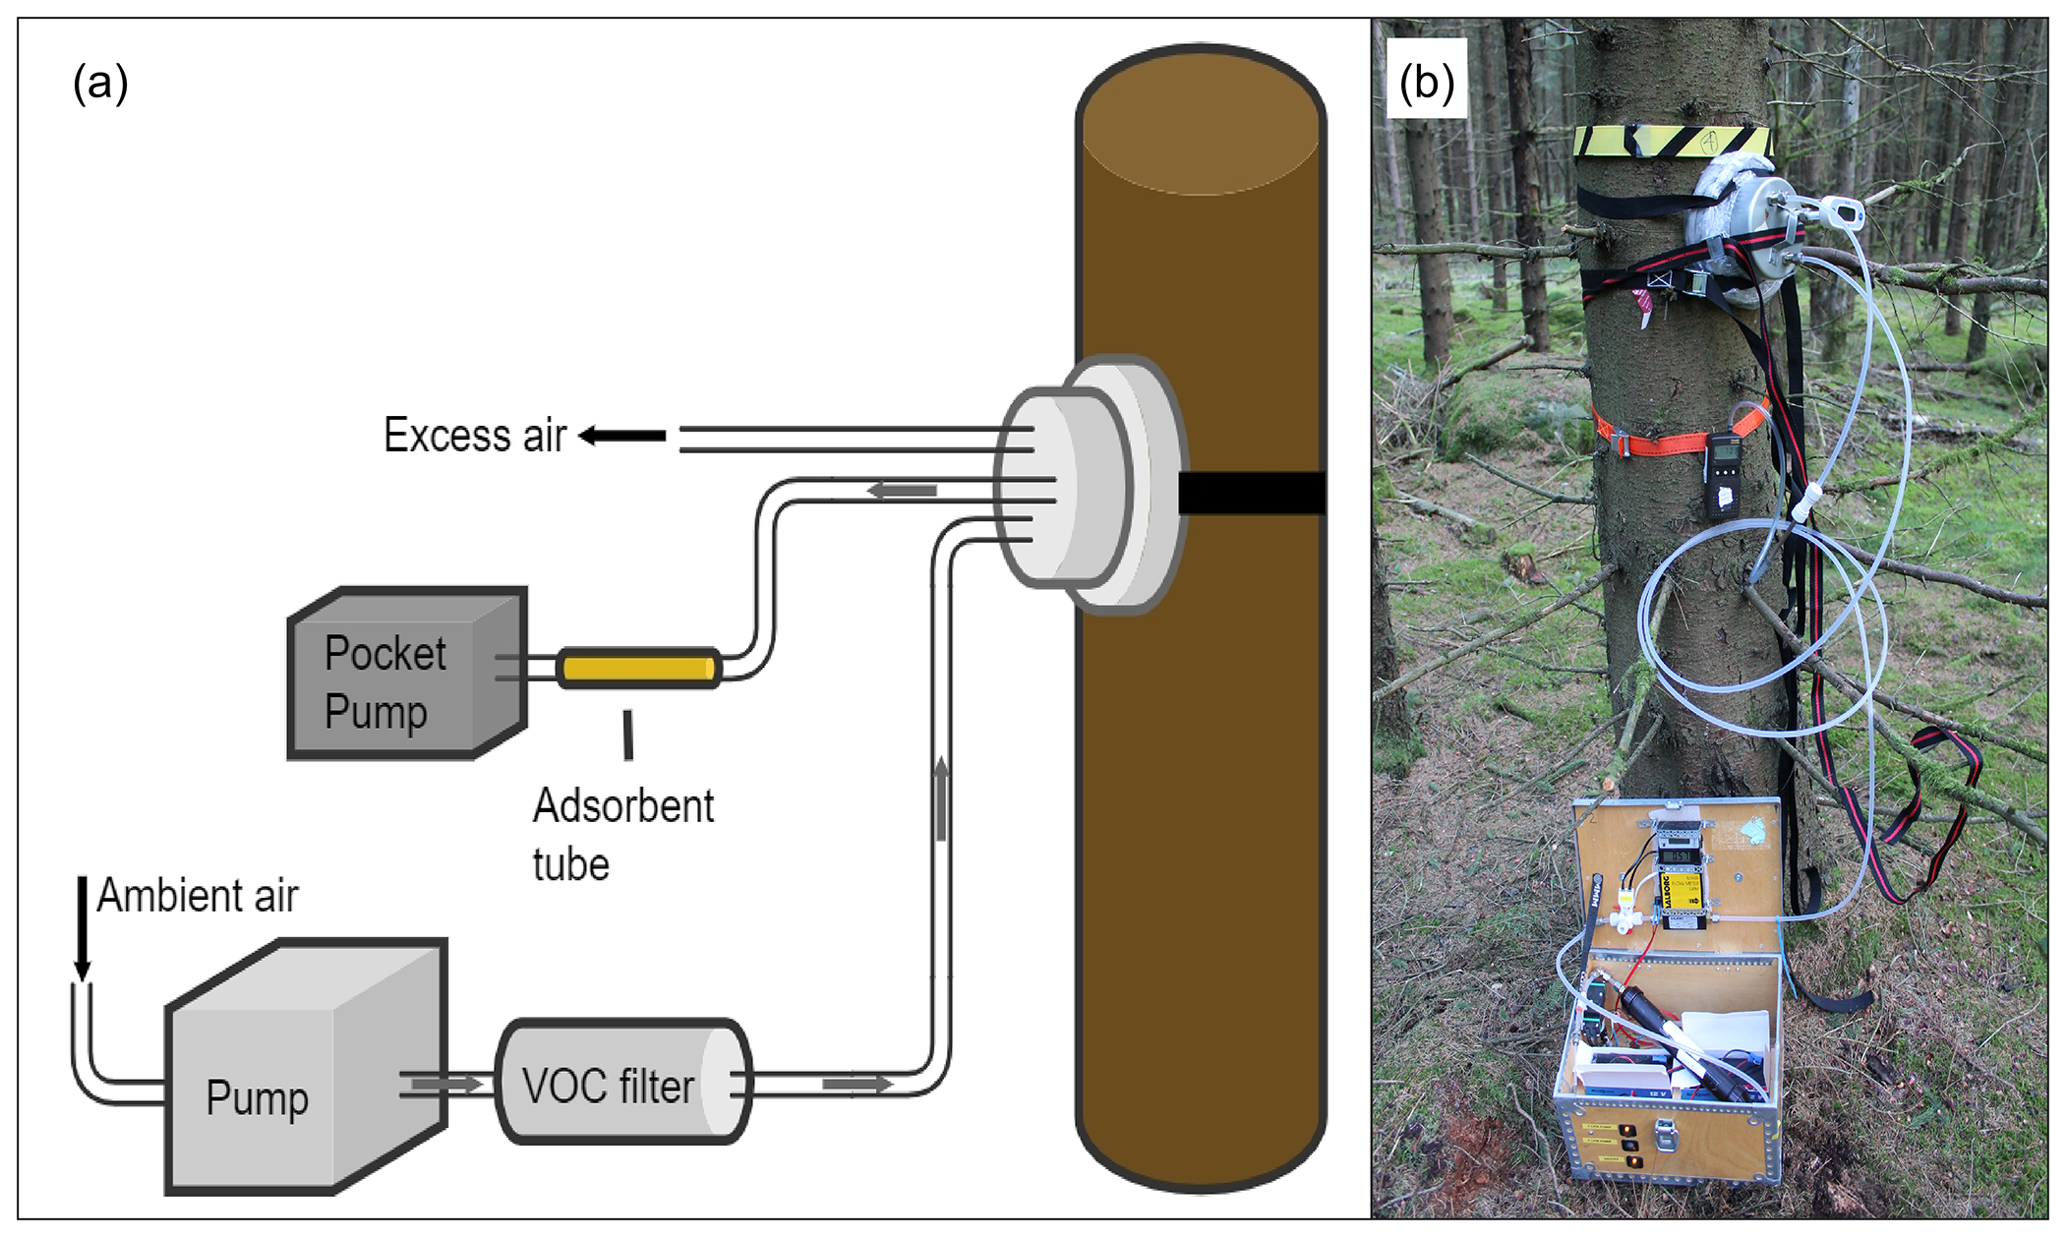
Figure 3The experimental setup (a) and a field photo (b) of the tree trunk chamber mounted on a Norway spruce trunk. The chamber is connected to a pump box used to provide BVOC- and O3-free purge air. The BVOC samples were collected with adsorbent tubes by extracting the air from the chamber using a pocket pump.
During the field visits, trees from one plot were sampled three times per day with BVOC collection starting around 08:00 LT and ending around 19:00 LT, alternating sampling between the trees. The chamber bases were secured in place in the north or east orientation of the trunk every morning. The chambers were left open during the day to avoid the buildup of BVOCs inside the chambers. The bark temperature was measured with an infrared thermometer (IRT260, Biltema, Sweden) at four different points inside the chamber before the sampling, after which the lid was fastened and the chamber was purged with air for 15 min before sampling started. The air temperature inside the chamber was measured at the start and end of the BVOC collection. After sampling, the lid was removed, and the bark temperature was measured again.
The start of the infestation was determined by the beetles' swarming time in relation to when the tree infestation was detected. For plot 3 in HTM, the start of the infestation was observed during the field visit in June (Table 1). For the other plots, the swarming time was retrieved using data from the Swedish Forest Agency's (Skogsstyrelsen) Statistical Database (Skogsstyrelsen, 2022) taken at the plots closest to the measurement sites (Supplement, Tables S1, S2). A late swarm in HTM was detected around week 25–28 for 2018 (Fig. S1), and the main swarm in NOR around week 20–21 for 2019 (Fig. S2).
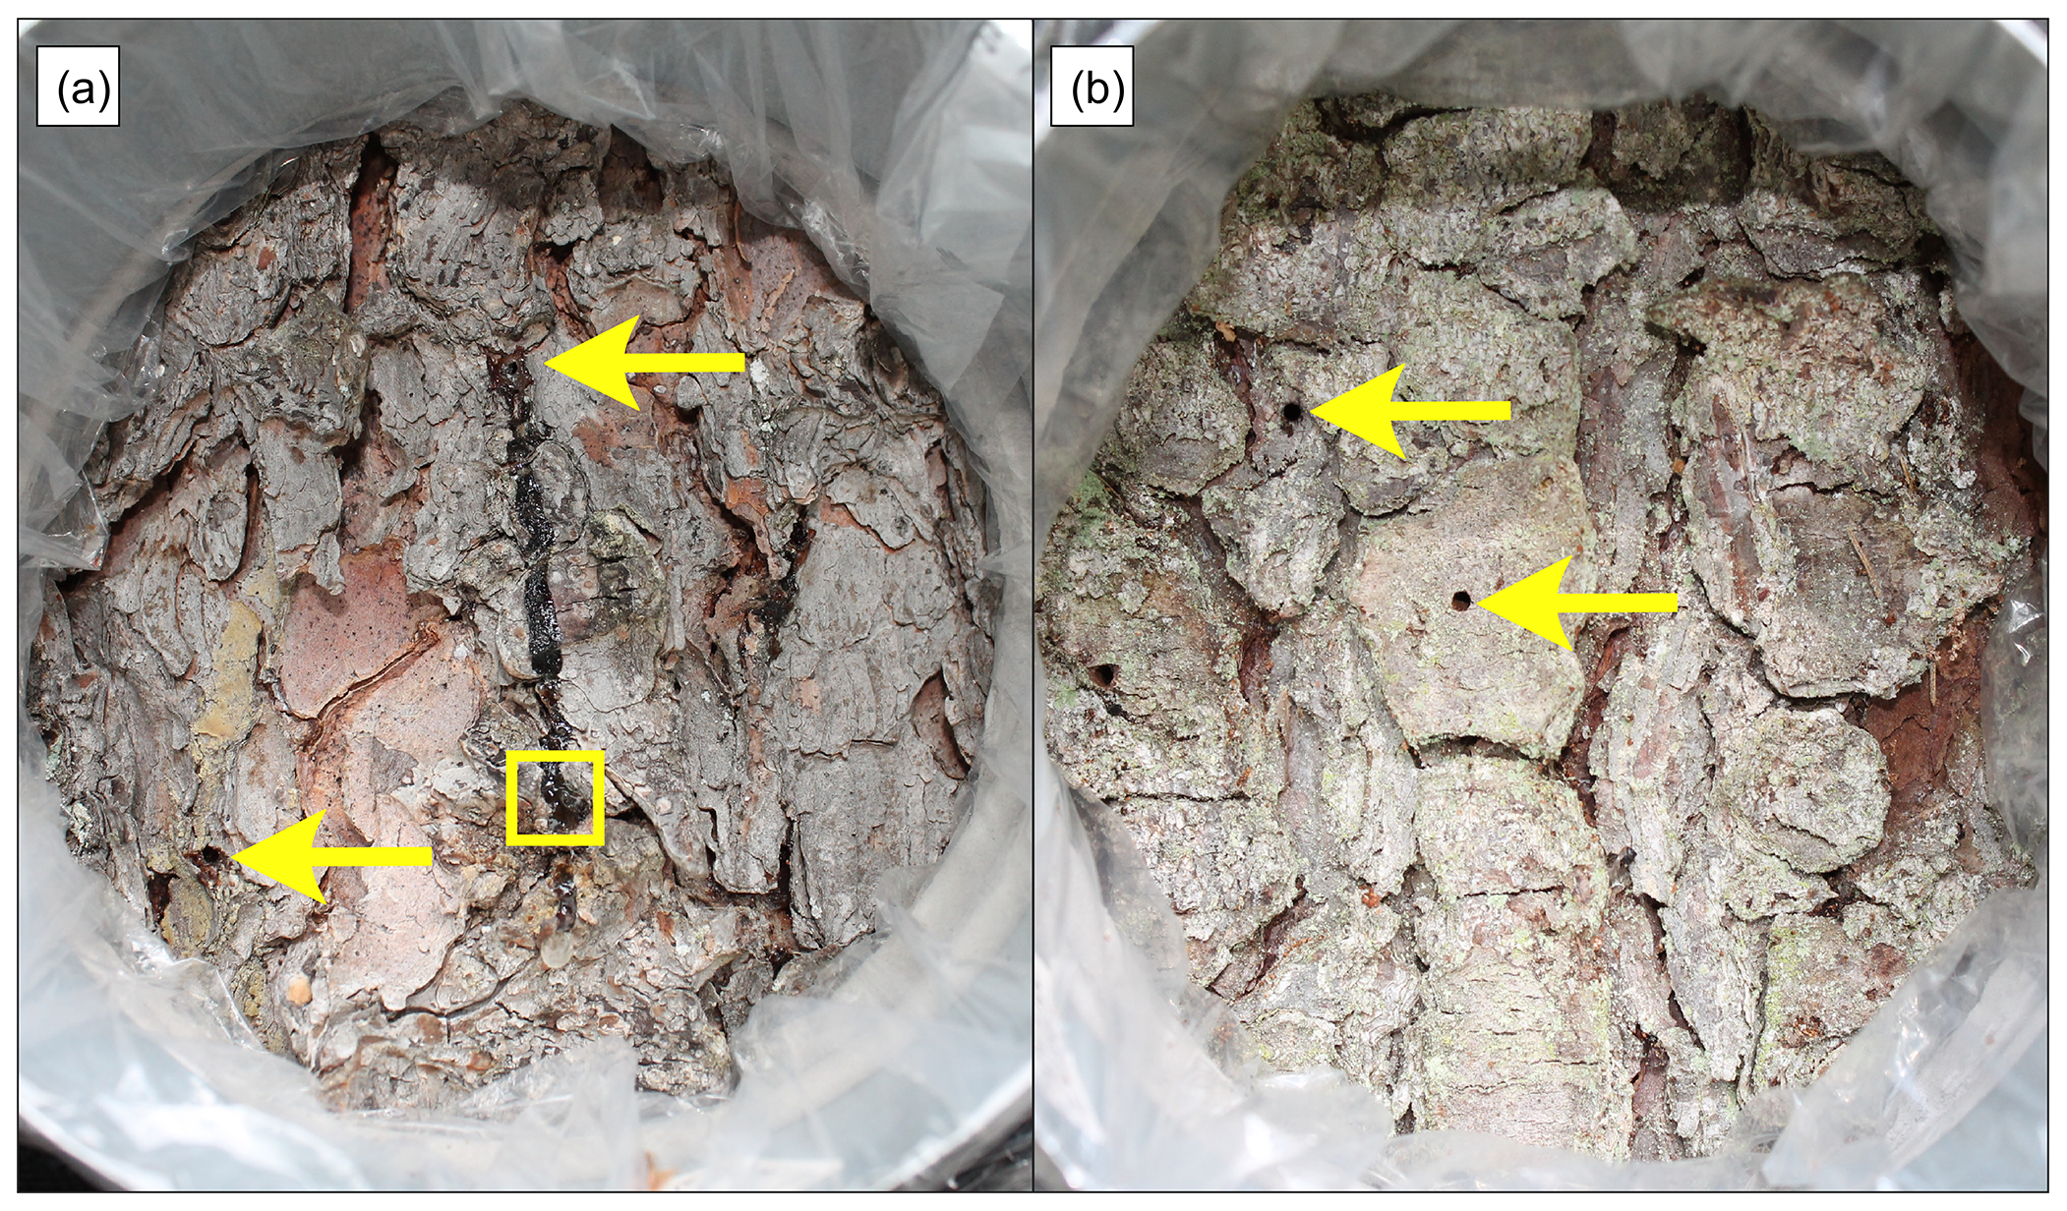
Figure 4Examples of infested Norway spruce trees with (a) entry and (b) exit holes. The arrows indicate examples of bark-beetle-drilled holes, and the square box frames a bark beetle. There are more holes in the pictures than indicated by the arrows.
The number of bark beetle holes (BBHs) inside the chamber was counted before each measurement, and lichen and algal cover was assessed. Entry and exit holes were separated based on photographs of the bark inside the chambers of the infested trees (Fig. 4). The entry and exit hole separation was based on the characteristics of the hole, where entry holes had more resin bleed compared to exit holes, which also had a rounder shape. The number of holes counted inside the chamber area of each infested tree during the field visits is listed in Table 2 along with an extrapolation of the counted holes from the chamber area to 1 m2 of bark area. Entry holes were found for measurements taken up to 100 d after infestation, and exit holes were predominantly found for measurements taken after 100 d of infestation, with the latest measurement occurring 350 d after the estimated start of infestation. As the entry and exit holes consistently occurred before or after 100 d since infestation started, the measurements with mainly entry holes are referred to as the “early season” and the measurements with mainly exit holes as the “late season”.
2.3 BVOC sampling and analysis
A total of 184 samples were taken, where 144 samples were from healthy Norway spruce and 40 were from infested Norway spruce (Table 1). Stainless steel cartridges (Markes International Limited, Llantrisant, UK) packed with adsorbents Tenax TA (a porous organic polymer) and Carbograph 1TD (graphitized carbon black) were used to sample BVOCs from the chambers using flow-controlled pocket pumps (Pocket Pump, SKC Ltd., Dorset, UK) by extracting the air through the steel cartridges at a flow rate of 200 mL min−1 and a sampling time of ca. 30 min. The collected total volume for each sample was between 5 to 6 L. The method was repeated throughout the day until all trees of that plot were measured three times. Blank samples were collected from the chamber inlet air twice per day, once before the first sample and once after the last sample, to capture possible background contamination.
After collecting the BVOC samples, the adsorbent cartridges were capped and stored in a refrigerator (at ∼ 3 ∘C) before being analyzed using a two-stage automated thermal desorption apparatus coupled to a gas chromatograph–mass spectrometer. Desorption was done on a TurboMatrix ATD 650 (PerkinElmer, Waltham, MA, USA), heating the cartridges to 280 ∘C in a flow of purified helium (He, ALPHAGAZ 1, Air Liquide Gas AB, Sweden) for 10 min for the BVOCs to volatilize. After the primary desorption, BVOCs were cryo-focused downstream on a Tenax TA cold trap maintained at −30 ∘C. The cold trap was then flash heated (40 ∘C s−1) to 300 ∘C for 6 min to perform a second desorption. The volatilized BVOCs were passed via a heated transfer line using He as the carrier gas to a gas chromatograph–mass spectrometer system (GC–MS, Shimadzu QP2010 Plus, Shimadzu Corporation, Japan). The BVOCs were separated using a BPX5 capillary column (50 m, i.d. 0.32 mm, film thickness 1.0 µm, Trajan Scientific, Australia), and the oven temperature was initially held at 40 ∘C for 1 min, raised to 210 ∘C at a rate of 5 ∘C min−1 and further increased to 250 ∘C at a rate of 20 ∘C min−1, and lastly held for 2 min. Pure standard solutions of isoprene, α-pinene, β-pinene, p-cymene, eucalyptol, limonene, 3-carene, linalool, α-humulene, β-caryophyllene, longifolene and myrcene were pre-prepared in methanol (Merck KGaA, Darmstadt, Germany) and injected onto adsorbent cartridges in a stream of He and analyzed as samples. When quantifying BVOCs for which no standards were available, α-pinene was used for MTs and α-humulene for sesquiterpenes (SQT). For other BVOCs which did not match any standard, the amount of the compound present in the sample was calculated as a percentage of the total amount on the sample using the chromatogram peak area. The peaks of longifolene and β-caryophyllene were coeluted in the chromatography and are therefore presented together as a sum of two compounds in this study. The chromatogram peaks were identified based on comparison with retention times and mass spectra of standards and the mass spectra in the NIST08 library. LabSolutions GCMS post-run analysis program was used for data processing (Version 4.30, Shimadzu Corporation, Japan). The detection limit was set to 0.4 ng in the analysis software based on the analysis of blank samples.
Outliers in the BVOC samples were found from 12 measurements of Norway spruce trees located at plot 1 and 2 in HTM (Fig. 1a). The bark was examined with bark photos, and it was detected that the chamber in those cases had been placed upon a small emerging branch with some spots of resin, as well as with one single needle stuck on the bark. This was believed to have caused the outliers, and these samples were considered unusable and were excluded from further analysis. All samples from one Norway spruce at plot 2 were also excluded from the analysis after discovering placements on top of a bark hole likely not originating from spruce bark beetles and thus not suitable for this study. Four samples were also lost during analysis and could not be used for the study. A total of 33 samples were removed, resulting in a total of 151 samples used whereof 113 were from healthy trees and 38 from infested.
2.4 Emission rate calculation and standardization
The BVOC concentrations obtained from the sample analysis were converted to emission rate (ER) (µg m−2 h−1) according to Eq. (1), following Ortega and Helmig (2008):
where Cout (µg L−1) is the concentration of each compound within the chamber, Cin (µg L−1) is the concentration of the compound in the filtered inlet air, Q is the flow rate through the chamber (L min−1) and A is the bark surface area (m2) inside the chamber.
The ER per hole was calculated by dividing the ER derived from Eq. (1) for the respective sample with the number of counted holes (m2) (Table 2) according to Eq. (2):
Finally, the ER was extrapolated to 1 m2 of bark surface, ERsqm, based on the number of holes within the chamber and the chamber's bark area according to Eq. (3):
The emission rates of the infested Norway spruce trees were scaled with an average of the holes per square meter found for the measured trees in HTM and NOR (Table 2). By doing this, any variation in emission rate caused by a difference in number of holes was removed, which enabled more accurate comparison between the infested trees.
As the bark surface temperature varied over the season and between the days, the emission rates were standardized using the algorithm for stored, temperature-dependent BVOCs by Guenther et al. (1993; G93) according to Eq. (4):
where M is the emission rate (µg m−2 h−1) at a given bark temperature, T, and β (0.09 K−1) is an empirical coefficient establishing the temperature dependency (Guenther et al., 1993). MS is the emission rate at standard temperature TS of 30 ∘C.
The temperature sensitivity of compound emission rates was calculated using a Q10 relationship (Lloyd and Taylor, 1994) following Seco et al. (2020) where the Q10 coefficient represents the factor by which the compound emission rate increases for every 10 ∘C temperature increase from a reference emission rate, F0. Only compounds appearing in more than three individual samples were selected for further analysis using this method. Log-transformed emission rates were binned into 1 ∘C bins, and the mean emission rate per bin was calculated except for bins with only one value. An orthogonal distance regression was applied to the binned mean emission rates weighed by their standard deviation to determine Q10 and F0 using Eq. (5):
where F0 is the reference emission rate at temperature T0 (30 ∘C), F is the flux rate at bark surface temperature T (∘C) and Q10 is the temperature coefficient.
Based on the Guenther algorithm (G93, Guenther et al., 1993; Eq. 4) and the Q10 temperature dependency calculation (Q10; Lloyd and Taylor, 1994; Eq. 5) an estimation of the total BVOC emission rate from healthy Norway spruce bark and the needle BVOC emission rate throughout the season was calculated. Both algorithms were used to calculate bark BVOC emissions, while only G93 was used to calculate the needle emission, as well as bark SQT emission rate. The calculated emissions for bark were based on the measured tree trunk temperature from the ICOS ecosystem data in HTM (Heliasz, 2020), taken at 3 m height. An average of the trunk temperature measurements taken in the north and east orientation of the trunk was used for this.
The needle emissions for MT and SQT were calculated according to Eq. (4) using the standardized seasonal average emission rate (MS), 1.25 µg g(dw)−1 h−1 for MT and 0.34 µg g(dw)−1 h−1 for SQT, taken from van Meeningen et al. (2017), measured in HTM during 2016. The temperature input was the canopy-level air temperature measured at 24 m a.g.l. taken from the HTM ICOS station (Heliasz, 2020). The output of Eq. (4) was scaled from g(dw) to m2 using a specific leaf area (SLA) of 38.4 cm2 g−1 calculated from Wang et al. (2017).
2.5 Statistical analysis
All samples were tested for normality by creating normal probability curves (normplot, MATLAB R2021a, MathWorks, Inc., MA, USA), which indicated that data were not normally distributed. Statistical analyses of all measurements were thus performed using a Kruskall–Wallis test (MATLAB R2021a, MathWorks, Inc., MA, USA) with a level of significance set to P < 0.05. To assure that no deviation between the plots of the healthy Norway spruce trees in HTM occurred, the difference in emission rates from the healthy trees at plot 1, 2 and 3 in HTM was tested. To evaluate the study hypotheses, we tested the difference in emission rates from healthy and infested trees from all plots and sites (H1), the difference between the calculated Q10 coefficient and F0 for the healthy and infested trees, emission rates from infested Norway spruce and the evolvement over time (H2), and finally, emission rates from infested Norway spruce and the number and type of bark beetle holes (H3).
To test (H2) and (H3), an exponential function (Curve Fitting Toolbox, MATLAB R2021a, MathWorks, Inc., MA, USA) was fitted to the data using (Eq. 6):
where x is the emission rate in µg m−2 h−1.
3.1 Bark BVOC emissions from healthy and infested Norway spruce
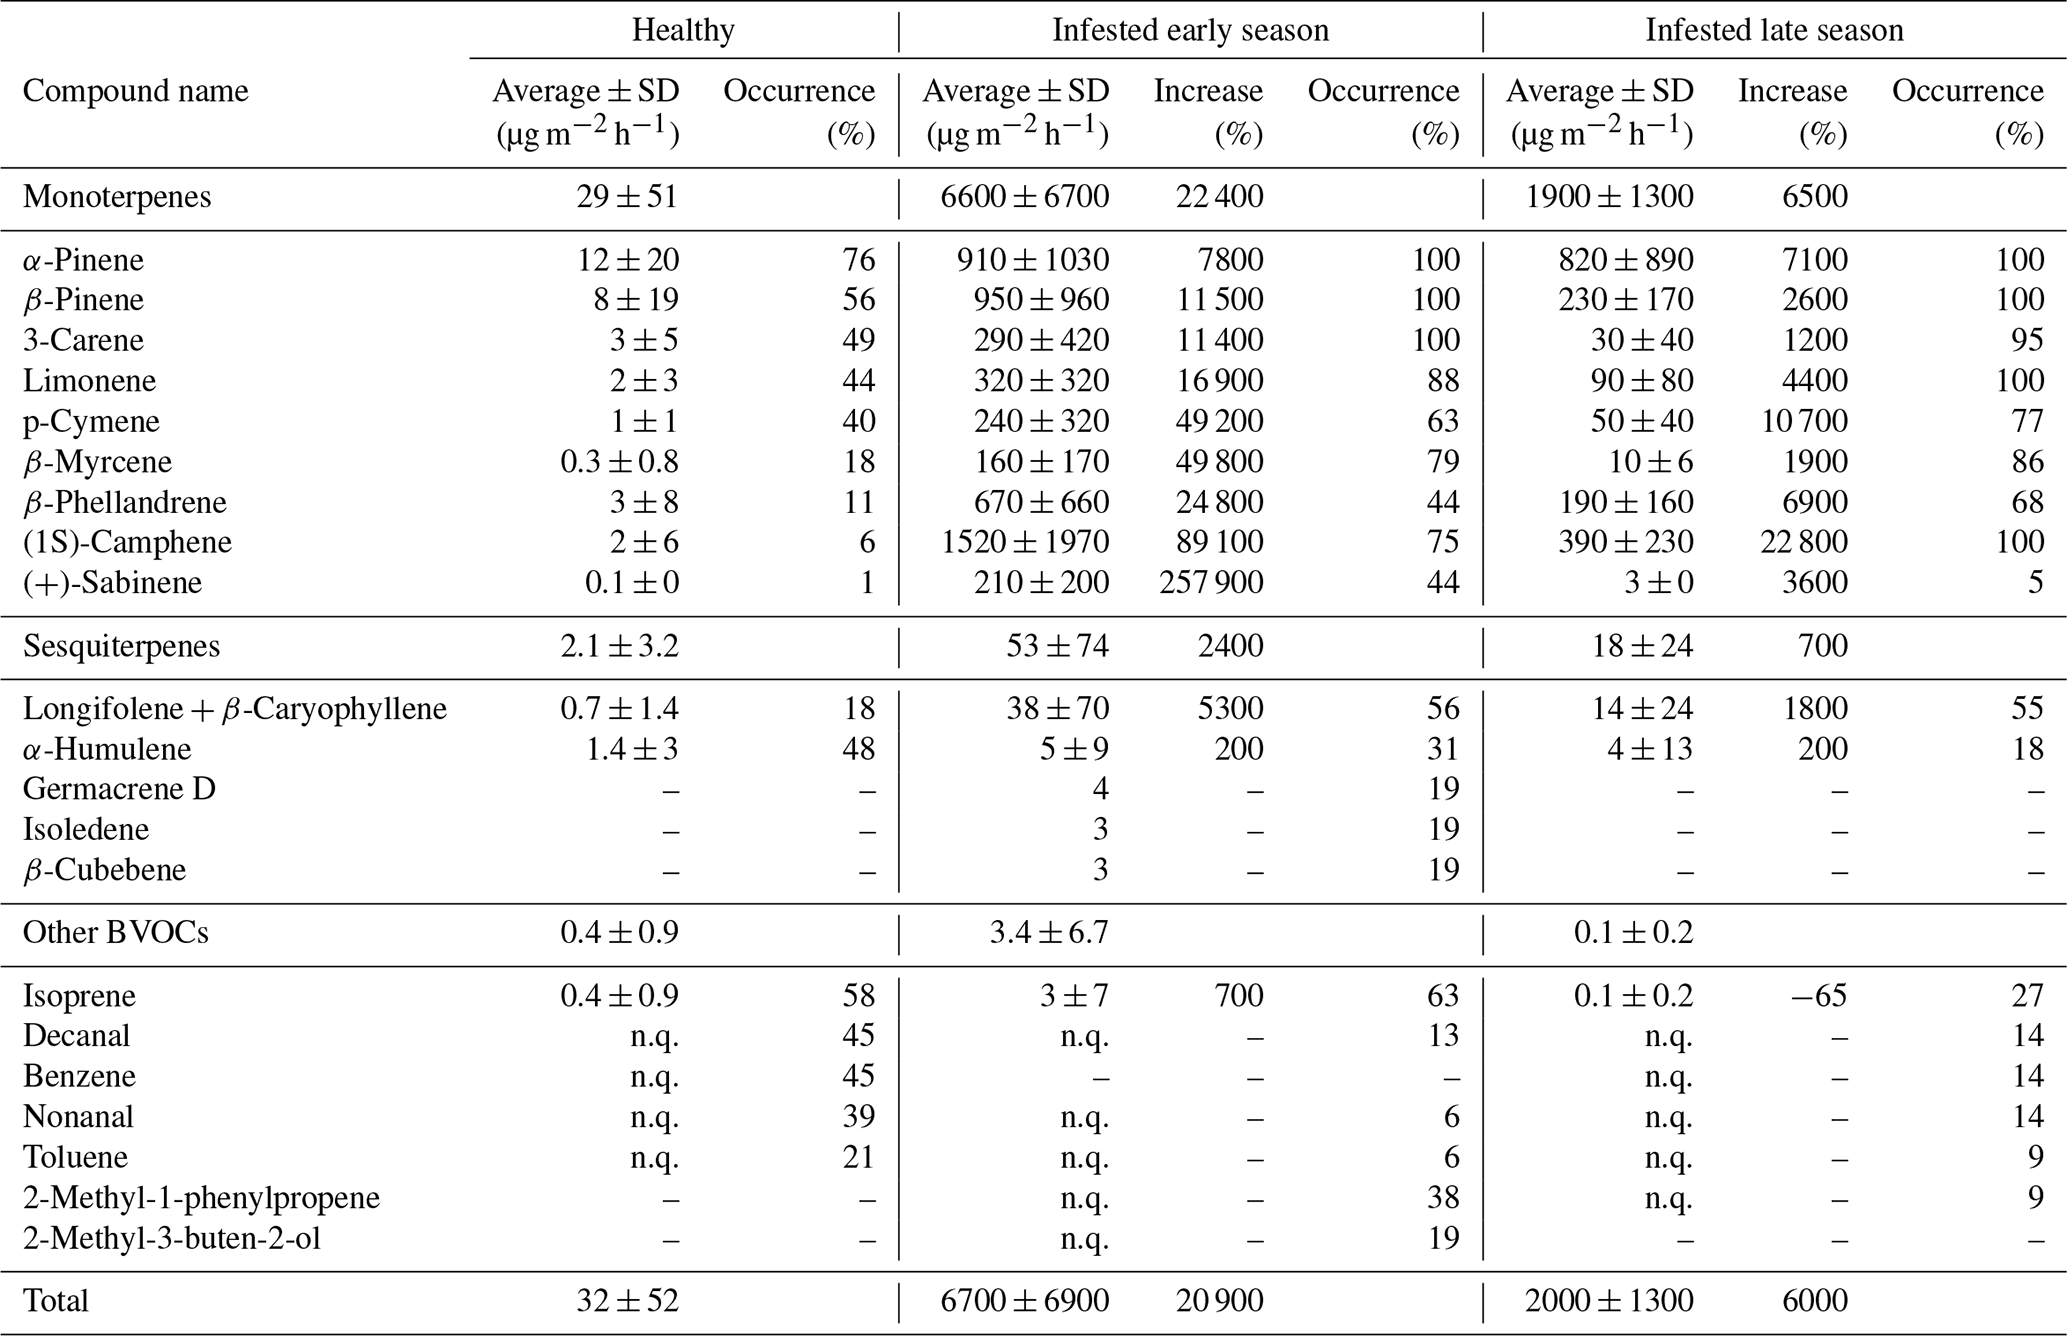
For the healthy Norway spruce trees in HTM, the average temperature standardized (TS) bark BVOC emission rate for all compounds from all samples (n = 113) was 32 ± 52 µg m−2 h−1 (mean ± standard deviation; Table 3). The most dominant BVOC group was MTs (29 ± 51 µg m−2 h−1; Table 3) followed by SQTs (2.1 ± 3.2 µg m−2 h−1; Table 3). Isoprene emissions were detected in 58 % of all samples from the healthy spruce bark with an average emission rate of 0.4 ± 0.9 µg m−2 h−1 (Table 3). When the healthy trees were separated into early and late season, there was no significant difference in their respective emission rates (early season: 29 ± 52 µg m−2 h−1 and late season: 37 ± 44 µg m−2 h−1, P > 0.4, Fig. 6).
Table 3Seasonal average temperature standardized emission rates (µg m−2 h−1 ± 1 standard deviation) from all Norway spruce trees located in Hyltemossa and Norunda. Presented are the frequently occurring compounds, compound groups (monoterpenes, sesquiterpenes and other BVOCs), and total BVOCs emitted from healthy and infested (early and late season) Norway spruce bark. The increase or decrease (%) is presented for the infested trees as a change in emission rate from healthy to infested. The occurrence (%) indicates how often each compound appeared in the samples throughout the growing season. The compounds that were identified but could not be quantified are presented as n.q. (no quantification). A full list of all identified compounds is found in the Appendix (Table A1).
The variability of the emission rates from healthy trees differed little between the plots in HTM. The standardized emission rates ranged from 0–145 µg m−2 h−1 for plot 1, 0–94 µg m−2 h−1 for plot 2 and 1–235 µg m−2 h−1 for plot 3 where the median emission rates were 4, 17 and 8 µg m−2 h−1 respectively (Fig. 5). No statistically significant difference (P > 0.3) was found for the emission rates between the plots, and no clear pattern of diurnal variation was found in the samples.
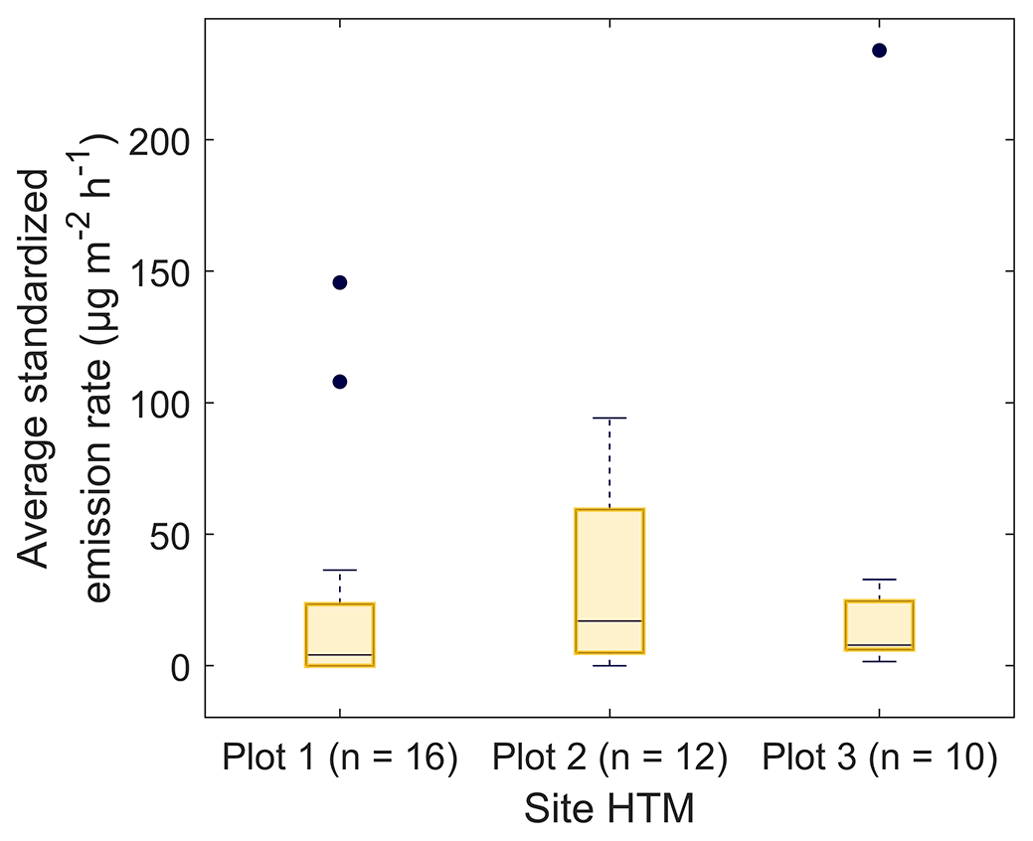
Figure 5Boxplots of the temperature standardized emission rates of the healthy trees for plots 1–3 in Hyltemossa, where plot 3 is located furthest away from the station in an older forest stand. The number of samples taken at each plot is indicated by n; the black dots indicate outliers. The difference in emission rates was tested using a Kruskall–Wallis test (MATLAB R2021a, MathWorks, Inc., MA, USA) and indicated no significant difference for the daily average of the temperature standardized emission rates (P > 0.3).

Figure 6Boxplots of the temperature standardized emission rates of (a) the infested Norway spruce trees (blue) and (b) the healthy Norway spruce trees (yellow) during the early and late season. The healthy trees were measured in Hyltemossa, and infested trees were measured both in Hyltemossa and Norunda. To consider the seasonal pattern of the spruce bark beetle, the infested trees were divided into early and late season, where the early season is dominated by entry holes and the late season by exit holes. The number of daily averages is indicated by n, and the black dots indicate outliers. The difference in emission rates for the infested and healthy trees was tested using a Kruskall–Wallis test (MATLAB R2021a, MathWorks, Inc., MA, USA). The emission rates from infested trees during both seasons were significantly higher compared to the healthy trees (P < 0.001 for both), while there was no significant difference between the early and late season for the healthy trees only (P > 0.4) or the infested trees only (P > 0.1).
For the bark-beetle-infested trees at both sites (HTM and NOR), the average temperature standardized emission rate for all BVOCs was 6700 ± 6900 µg m−2 h−1 (mean ± standard deviation; Table 3) for the early season (n = 6). The average for trees infested in the late season (n = 8) was 2000 ± 1300 µg m−2 h−1 (Table 3). MTs were the most dominant BVOC group throughout the season with an average of 6600 ± 6700 µg m−2 h−1 for the early season and 1900 ± 1300 µg m−2 h−1 for the late season, followed by SQTs (early: 53 ± 74 µg m−2 h−1, late: 18 ± 24 µg m−2 h−1; Table 3). Throughout the season, isoprene was also found in 42 % of the samples with an average emission rate of 3.4 ± 6.7 µg m−2 h−1 during the early season and 0.1 ± 0.2 µg m−2 h−1 for the late season (Table 3).
For all measured Norway spruce trees at both sites, a total of 74 individual BVOCs were found, whereof 32 were MTs, 5 were SQTs and 37 were classified as other BVOCs including isoprene. For the healthy Norway spruce tree samples in HTM (n = 113), 44 individual compounds were found in total, where 12 were MTs, 2 were SQTs and 30 were other BVOCs including isoprene. The infested Norway spruce trees measured at both sites had fewer samples (n = 38) compared to the healthy trees, but a higher number of individual compounds was found with 52 compounds in total. The majority of the compounds were MTs (n = 30, which was more than double the number compared to the healthy trees). There were also more SQTs (n = 5) found in the infested tree samples but fewer other BVOCs including isoprene (n = 17) compared to the healthy tree samples. For the infested trees, there was also a difference in how many compounds were found early in the season compared to later, in total 40 individual compounds were found for the early and 33 compounds for the late season (Table 3). For MTs and SQTs, more individual compounds were found in the early season (27 MTs and 5 SQTs) compared to the late season (17 MTs and 2 SQTs), but for the other BVOCs, more were found in the later season which had 14 individual compounds identified compared to 8 in the early season.
A significant difference was found for the daily average of the standardized bark BVOC emission rate when comparing healthy and infested trees from all plots and sites for both seasons (P < 0.001; Fig. 6). The infested trees had a median emission rate of 6400 and 2100 µg m−2 h−1 during the early and late seasons respectively (Fig. 6). The emission rates for infested trees during the early and late season were around 740- and 240-fold higher compared to the median of the healthy trees (8.6 µg m−2 h−1; Fig. 6).
A difference in the occurrence of compounds was found between the healthy and infested trees at both sites (Table 3). The most common MT compounds among the healthy Norway spruce trees were α-pinene (76 %, relative occurrence in all samples), β-pinene (55 %), 3-carene (48 %) and limonene (44 %). These MT compounds were also the most common in infested Norway spruce trees in both seasons but were present in a higher proportion of samples (88 %–100 %) relative to the healthy trees. Infested trees in the late season also had 100 % occurrence of (1S)-camphene, while that compound only occurred in 75 % of the samples for infested trees in the early season. For SQTs, α-humulene occurred most among the healthy trees (47 %) followed by longifolene + β-caryophyllene (17 %). For the infested trees in the early season the pattern was reversed; the SQTs occurring most were longifolene + β-caryophyllene (56 %) followed by α-humulene (31 %). The late season showed a similar pattern with longifolene + β-caryophyllene occurring most (55 %) followed by α-humulene (18 %) which occurred in fewer samples compared to the early season. The SQTs germacrene D, isoledene and β-cubebene were only emitted from one infested tree during the early season.
Isoprene was the most commonly occurring compound among the other BVOCs for both the healthy (58 %) and infested Norway spruce during the early and late season (63 % and 27 % respectively). After isoprene, decanal (45 %), benzene (45 %), nonanal (38 %) and toluene (21 %) were the most common compounds in the healthy Norway spruce. For the early season infested Norway spruce trees, 2-methyl-1-phenylpropene (38 %) and 2-methyl-3-buten-2-ol (19 %) were the most common compounds (after isoprene); however, for infested trees in the late season, 2-methyl-3-buten-2-ol was not emitted, and 2-methyl-1-phenylpropene occurred in only 9 % of the samples.
The emission rates for all compounds were higher in infested trees relative to healthy trees. The difference in emissions ranged from a 3-fold increase to a 2580-fold increase in infested compared to healthy trees in both seasons (Table 3). The MT group had the highest (230-fold) increase during the early season compared to the SQTs (25-fold increase) and isoprene (8-fold increase). The emission rates during the late season showed a 65-fold increase for the MTs and an 8-fold for the SQTs; however, isoprene was found to have a 0.4-fold decrease from the infested tree emission rates in the late season compared to healthy tree emission rates. The compound (+)-sabinene had the highest increase of all individual compounds (2580-fold higher in infested trees) during the early season (Table A1). The compounds tricyclene, eucalyptol, 4-carene, ζ-fenchene, α-phellandrene, (4E,6E)-alloocimene, norbornane, γ-terpinene, α-fenchene, 2-carene, α-thujene and α-terpinene were only emitted from infested trees and indicate a change in the chemical composition of the emitted BVOCs (full table is found in Appendix Table A1).
Scaling the infested tree bark emissions with number of bark beetle holes
The temperature standardized (TS) emission rates for all BVOC compounds combined from the bark-beetle-infested Norway spruce trees from both sites ranged from 170 to 13 500 µg m−2 h−1 throughout the measurement period (Fig. 7). The daily average TS emission rate per bark beetle hole for infested trees during the early season was 22 ± 29 and 4.4 ± 3.5 µg hole−1 h−1 for the late season. When scaling the TS emission rates with the average number of bark beetle holes (BBH), a comparison with the original TS emission rates showed that the average for all BVOC-combined BBH emission rates were higher (Fig. 7). During the early season the BBH emission rates were 2500 µg m−2 h−1 higher (9200 ± 6200 µg m−2 h−1) compared to TS emission rates (6700 ± 5000 µg m−2 h−1), and for the late season the BBH emission rates were 150 µg m−2 h−1 higher (900 ± 650 µg m−2 h−1) compared to the TS emission rates (750 ± 400 µg m−2 h−1). For the individual trees, the BBH emission rates were higher compared to the TS emission rates for all infested trees but two (S1S1 and S5S3) which had higher TS emission rates of 270 and 95 µg m−2 h−1 respectively compared to BBH emission rates (Fig. 7). The inconsistent variation in emission rate scaled with BBH or TS can be explained by the difference in the number of bark beetle holes found per tree (Table 2). The TS emission rates only consider the bark beetle holes inside the bark chamber, while the BBH emission rates are calculated based on the average number of holes per square meter of bark. By applying a seasonal average derived from the results in Eq. (2), variations in emission rates caused by differences in the number of holes can be disregarded. The results from the infested trees are presented as BBH emission rates from here onwards unless stated otherwise.
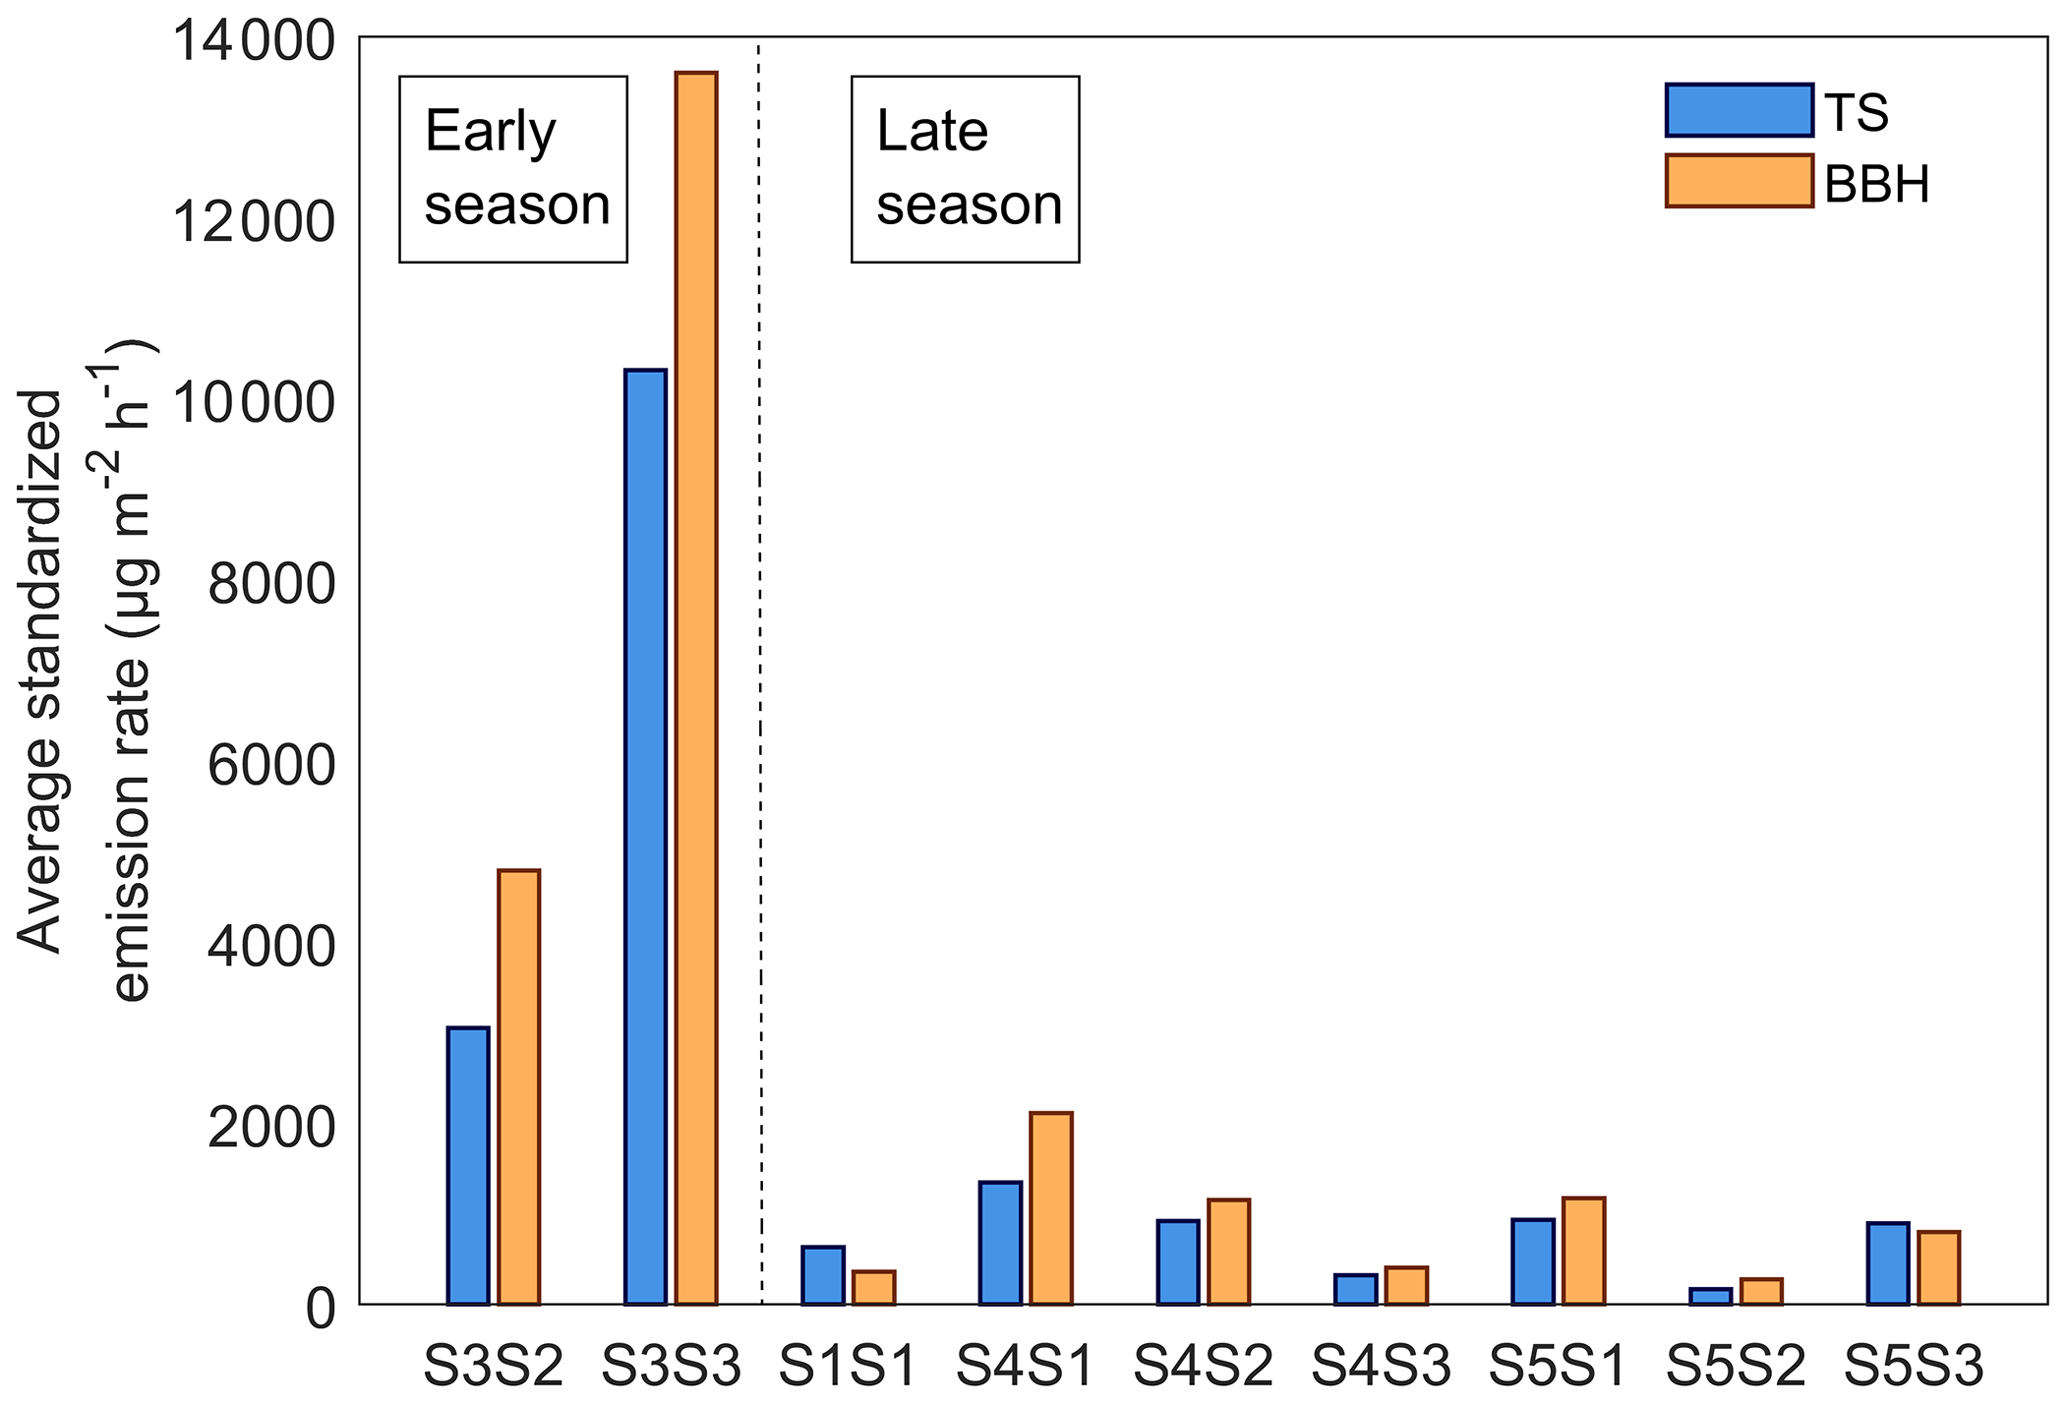
Figure 7The seasonal average temperature standardized emission rate for all BVOCs combined from all infested Norway spruce trees located in Hyltemossa and Norunda. The tree ID is presented on the x axis and is separated into early and late season (< 100 or > 100 d since infestation start respectively). The temperature standardized (TS) emission rates are presented in blue, while the emission rates scaled by the average number of bark beetle holes (BBHs) is presented in orange.
3.2 The influence of time since infestation on emission rate from infested trees
To study how the emission changed with time after Norway spruce trees were infested by spruce bark beetles, measurements were taken at different intervals after the start of infestation at HTM and NOR. The earliest measurements occurred 12 d after infestation and showed an average emission rate for all BVOCs combined of 1850 µg m−2 h−1, when excluding a tree with lowered defense (as presented in Sect. 3.4; Fig. 8a; excluded tree is marked in yellow). An exponential function was fitted to all data points according to Eq. (6). Three compounds were selected for further analysis, β-phellandrene, eucalyptol and β-pinene, using the same exponential function. The emission rates after 12 d were different for the individual compounds compared to the total average; β-phellandrene and β-pinene have emission rates of 3050–3300 and 1900–2500 µg m−2 h−1 respectively (Fig. 8b, d). Eucalyptol was emitted at lower rates of 5 and 25 µg m−2 h−1, where the low emission rates came from the lowered defense tree (Fig. 8c). Some compounds were not emitted from all infested trees: eucalyptol was only observed from four individual trees and β-phellandrene from seven trees, while β-pinene was emitted from all infested trees (n = 9).
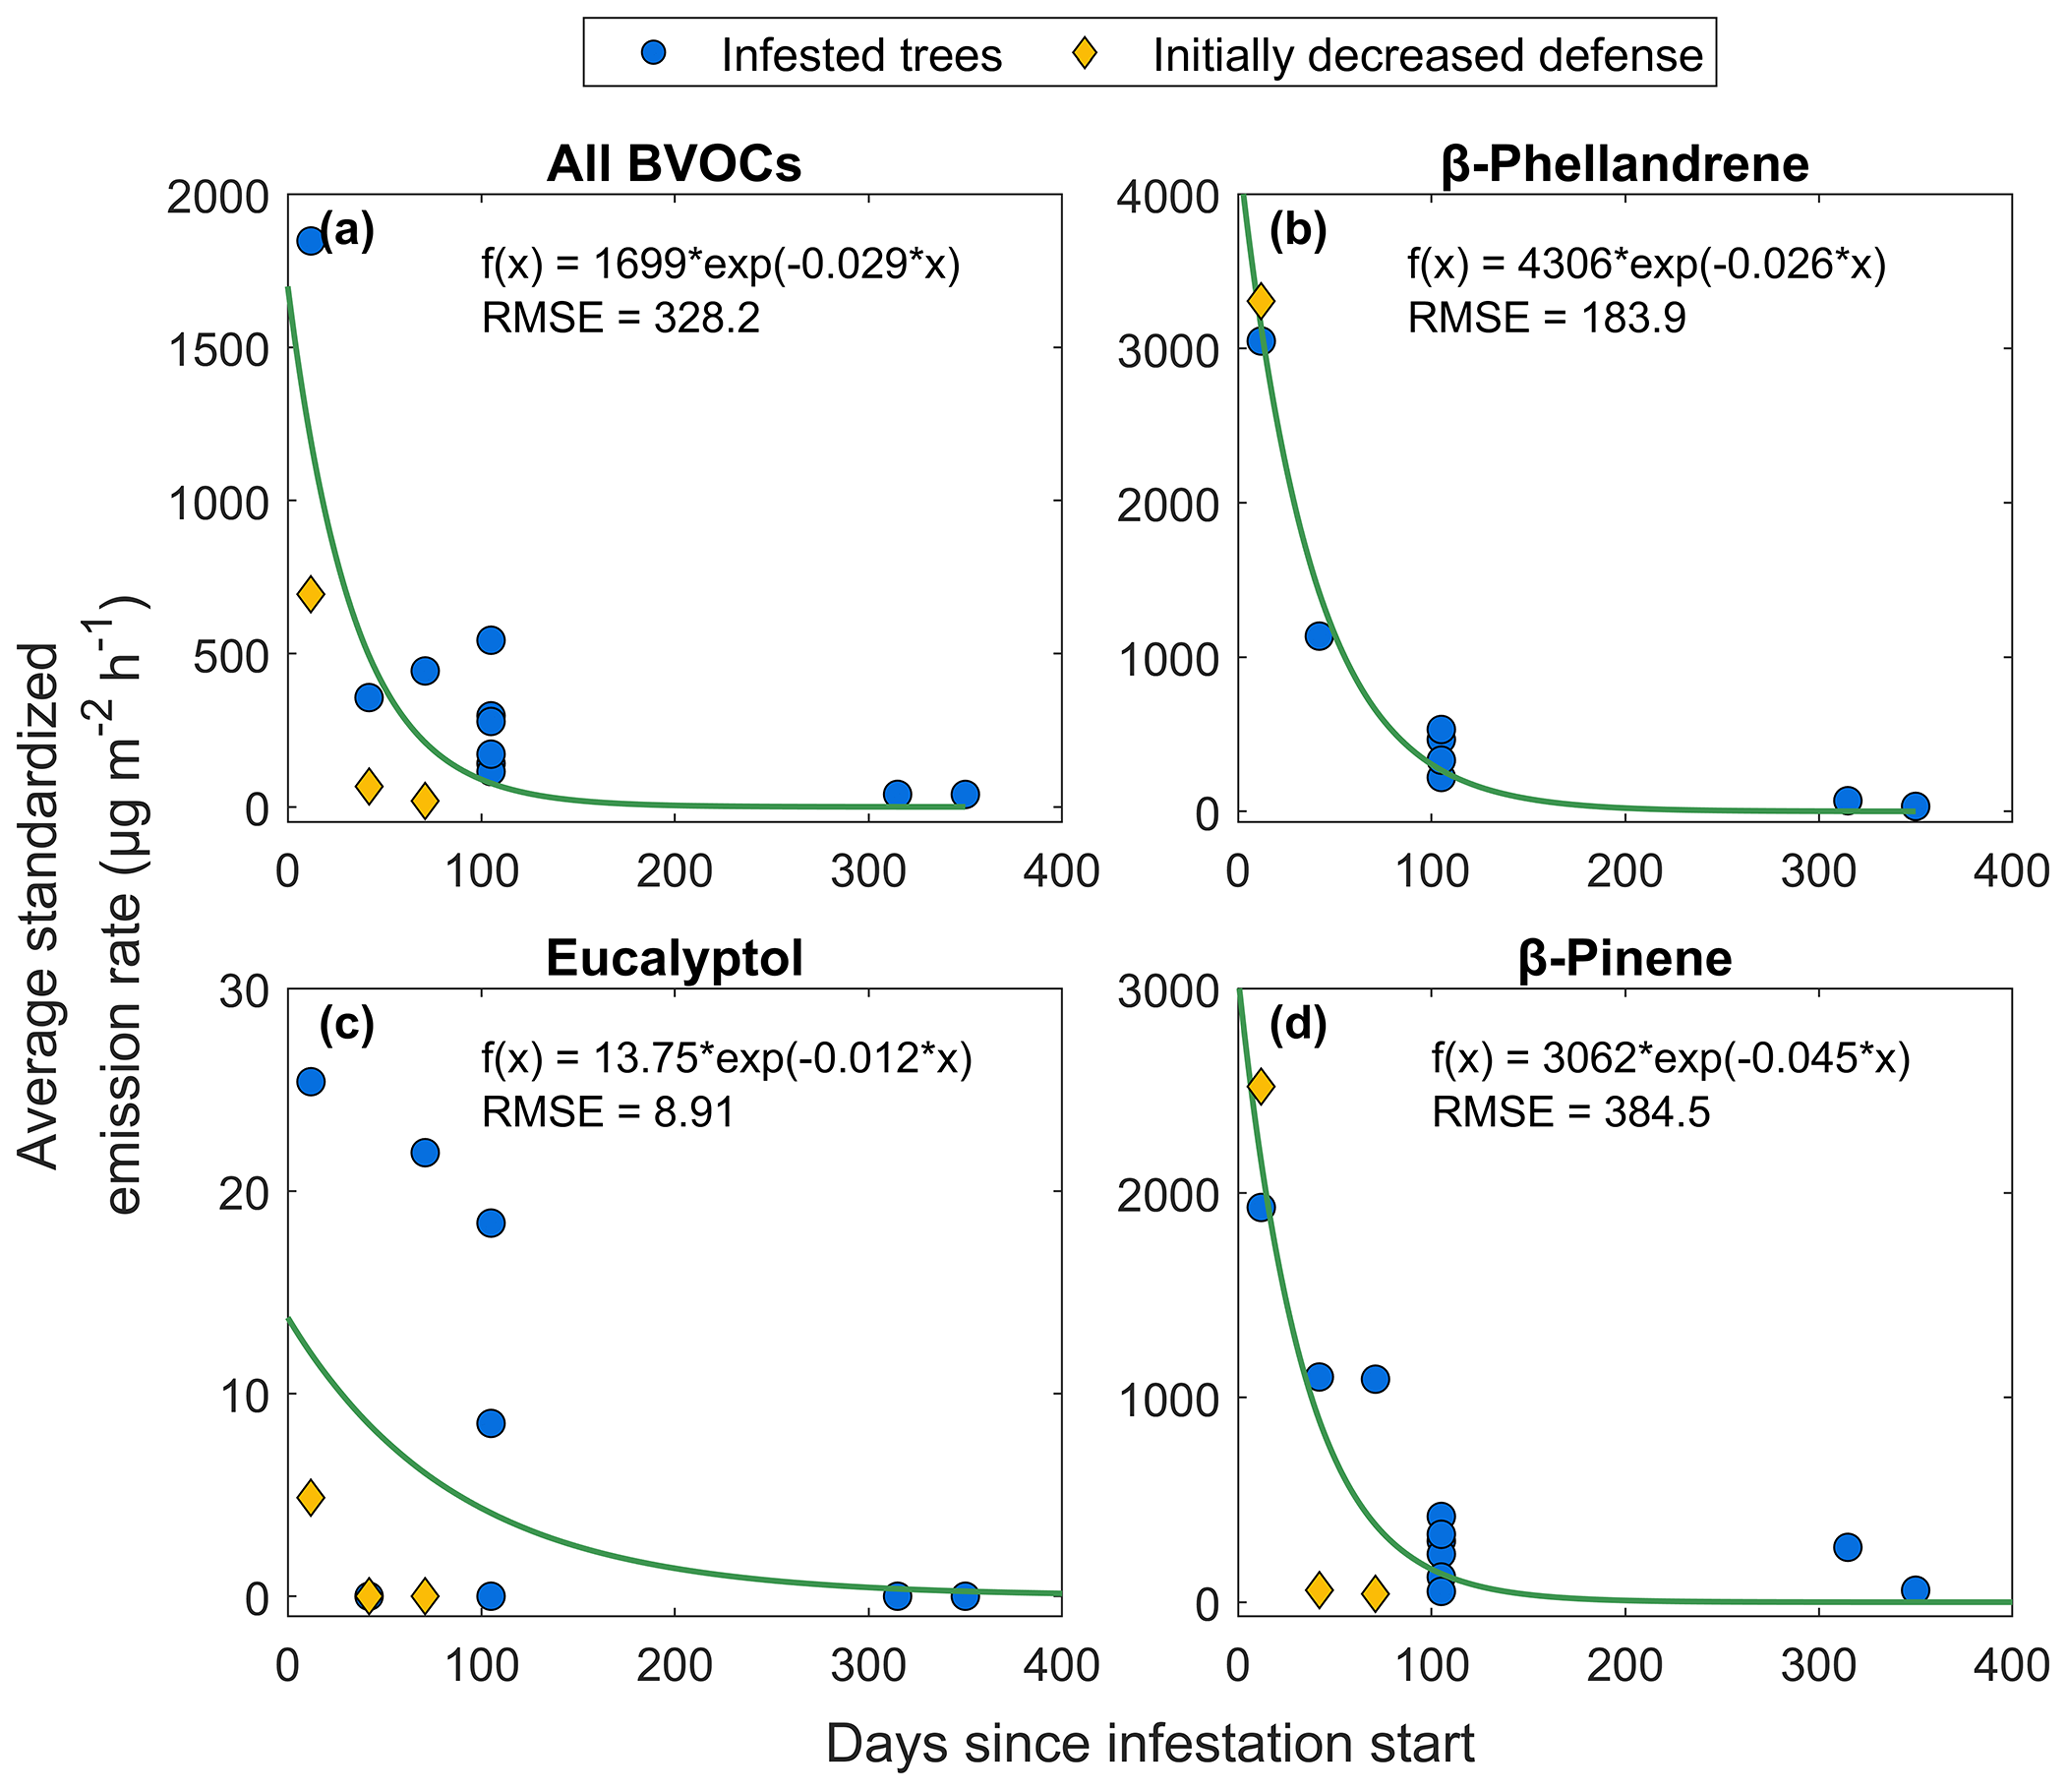
Figure 8The relationship between average temperature standardized emission rate from all infested Norway spruce trees (blue circles) in Hyltemossa and Norunda and the number of days since infestation start for (a) the average of all BVOCs, (b) β-phellandrene, (c) eucalyptol and (d) β-pinene. An exponential curve was fitted to the data according to Eq. (6) (green lines). All trees are included in the exponential fitted curve; however one tree had initially lowered defense and is marked specifically in the figure (yellow diamonds).
After about 100 d since the start of infestation, the trees were showing signs of browning and loss of needles, and emission rates for the average of all BVOCs decreased with 80 % on average, with emissions ranging from 100–500 µg m−2 h−1. The emission rates were still at higher levels than the seasonal emissions from healthy Norway spruce trees in HTM (30 µg m−2 h−1; Fig. 8). Compared to the average emission rate of all BVOCs 100 d since infestation, the emission rates from the compounds β-phellandrene and β-pinene were at about the same level; however, the decrease on average since the start of infestation was higher (89 %). Eucalyptol did not have as distinct a decrease and had only decreased by 10 % on average. When the Norway spruce with ID S1S1 located in plot 1 in HTM was measured after more than 300 d since infestation start, it had lost almost all of its needles and some bark. At that time, the average of all BVOC emission rates from that tree was 40 µg m−2 h−1, which was at the same level as the emissions from healthy trees at the same time (on average 38 µg m−2 h−1; Fig. 8). No emissions of eucalyptol were found after more than 300 d, but the emission rates of β-phellandrene and β-pinene after 315 d post-infestation were 70 and 270 µg m−2 h−1 respectively. However, after 350 d the emission rates went down to 32 and 58 µg m−2 h−1 respectively, also comparable with the emissions from healthy trees at that time (45 µg m−2 h−1).
3.3 The difference in BVOC emission rates from bark beetle entry and exit holes
No clear relationship was found between the total number of holes and emission rates, likely due to a mixed signal from the type of hole (entry or exit) and time since infestation. The temperature standardized BVOC emission rates from all compounds were generally lower from exit holes compared to entry holes when the Norway spruce trees had a similar number of holes (Fig. 9a). The individual compounds emitted from both entry and exit holes were dominated by β-phellandrene, β-pinene, α-pinene and (1S)-camphene (Table 3). The compounds found from entry holes but not from exit holes were 2-carene, 4-carene, α-fenchene, α-phellandrene, α-terpinene, α-thujene, β-cubebene, Υ-terpinene, germacrene D, isoledene and (4E,6E)-alloocimene (Table 3). Generally lower emission rates from exit holes were also seen for the compounds β-phellandrene and β-pinene (Fig. 9b, d). However, for the compound eucalyptol (Fig. 9c) emissions were only found from four individuals, which had similar emission rates regardless of entry or exit holes. The oxygenated monoterpenes myrtenal and bornyl acetate were only found in entry holes but could not be quantified (Table 3).
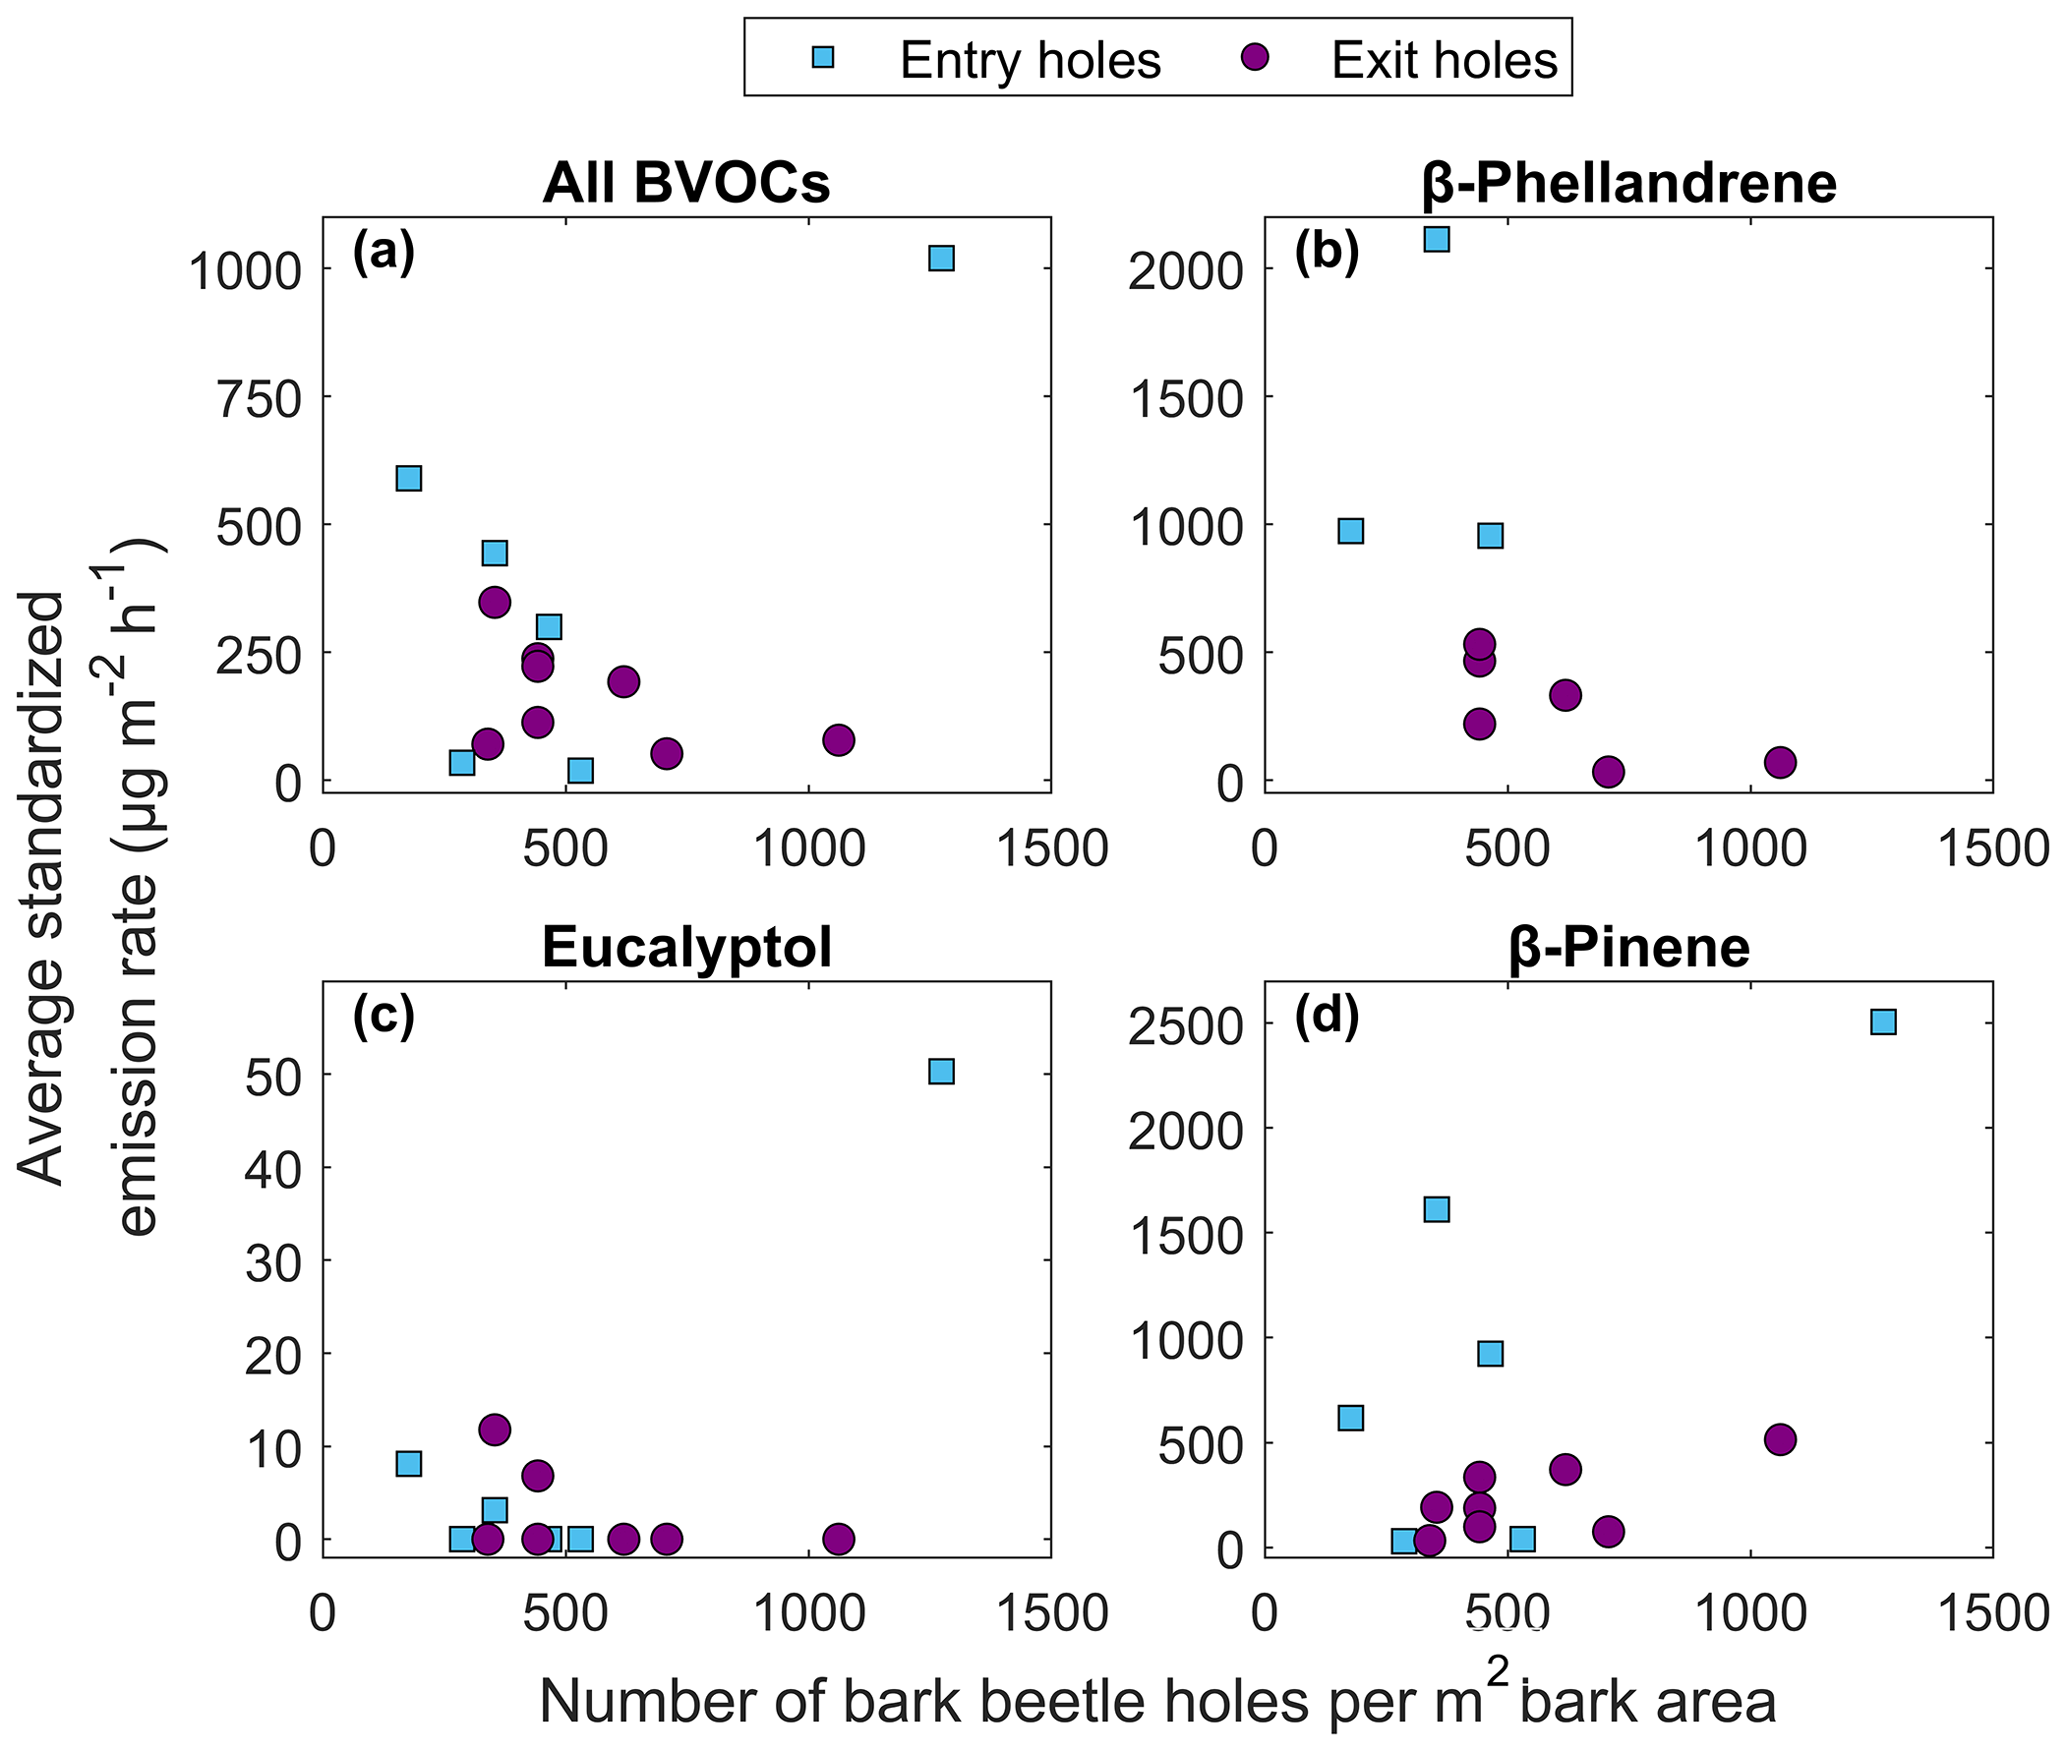
Figure 9The relationship between average temperature standardized emission rate from infested Norway spruce trees in Hyltemossa and Norunda and the number of bark beetle holes per square meter bark area for (a) the average of all BVOCs, (b) β-phellandrene, (c) eucalyptol and (d) β-pinene. The bark beetle holes are separated into entry holes (blue squares) and exit holes (purple circles).
3.4 Bark beetle infestation impact over time from two trees with different initial health status
The result of the comparison between two individual trees is presented in this section. The different initial status of the trees can be identified in Fig. 10a, b when measurements were taken in May before the infestation started. The tree S3S2 had a higher total emission rate of bark BVOCs compared to the healthy Norway spruce (S3S3) and the remaining two Norway spruce trees on plot 3 (healthy). The healthy trees only had four compounds identified in May, longifolene + β-caryophyllene, α-humulene and isoprene, with low emission rates that remained at the same level throughout the measurement period (Fig. 10). When the bark beetle infestation started in June, the emission rates increased for both S3S3 and S3S2, but they showed differences in compound blend (Fig. 10c, d). The tree S3S3 had a higher emission rate from the compound (1S)-camphene and was also emitting ζ-fenchene, (4E,6E)-alloocimene, norbornane and α-thujene which were not emitted from S3S2. The June samples from S3S2 did however contain the bark beetle pheromones germacrene D, isoledene and β-cubebene which were not found in the compound blend from S3S3 (Fig. 10c, d). In July, the emission rates from S3S2 were lower compared to S3S3, which still had high emission rates of β-phellandrene, α-pinene, β-pinene and (1S)-camphene (Fig. 10e, f). A similar difference between the trees was apparent in August as well (Fig. 10g, h), but a new compound was identified from tree S3S3, verbenone, which could not be quantified in the study (Table 3).

Figure 10The daily average temperature standardized BVOC emission rates for all compounds from Norway spruce at plot 3 in Hyltemossa: infested spruce with ID S3S2 (blue), infested spruce with ID S3S3 (orange) and healthy trees (green). Measurements were taken in 2019 during (a, b) May, (c, d) June, (e, f) July and (g, h) August. The graphs are horizontally separated for visibility due to large differences in scale. The healthy trees are included in all graphs, but the emission rates are not visible on the same scale as the infested trees in (c, d) June or (e, f) July. The bark beetle infestation had not started in (a, b) May; however, the spruce S3S2 was already subjected to stress from late bark beetle attacks during the previous season before the bark beetle infestation started again in (c, d) June, leading to higher emission rates already in May.
The individual compound blend was also monitored qualitatively for tree S3S3 and indicated a change in the blend over time from healthy to infested (Fig. A1). Before infestation, in total 10 compounds were identified, dominated by other BVOCs: decanal (28 %), nonanal (20 %), toluene (16 %) and 1,3,5-trifluorobenzene (15 %), where the percentage represents the amount of the compound found in the sample relative to the total amount (Fig. A1). After bark beetle infestation started in June, the number of detected compounds increased to 27 and was dominated by MTs ((1S)-camphene (18 %), 5-vinyl-m-xylene (15 %) and β-phellandrene (9 %); Fig. A1). The emissions during the campaign in July also consisted mainly of MTs with the largest contributions from β-phellandrene (23 %) and β-pinene (22 %) followed by (1S)-camphene (19 %) and α-pinene (16 %; Fig. A1). The compound composition in August was similar to June, with the majority of the blend consisting of MTs dominated by (1S)-camphene, α-pinene and β-pinene (22 %, 13 % and 11 % respectively) and other BVOCs (2-methyl-1-phenylpropene (6 %); Fig. A1).
3.5 Reference emission rate at 30 ∘C and calculated Q10 coefficient
From Eq. (5), the reference emission rate at 30 ∘C (F0) and the increase in emission rate with every 10 ∘C (Q10 coefficient) were calculated for the healthy and infested Norway spruce trees from both sites. The results for emitted compounds show a Q10 coefficient ranging from 0.1 to 57 for healthy trees and 1 to 980 for infested trees where the Q10 coefficient increased for infested trees compared to healthy trees for all compounds but one, p-cymene (Table A2). The F0 value, which indicates the emission rate at 30 ∘C for each specific compound, also showed a difference between the healthy and infested trees. The spread of F0 for healthy trees ranged from 0.01 to 93 µg m−2 h−1 compared to 0.5 to 34 900 µg m−2 h−1 for the infested trees; however, compared to the Q10 coefficient, the F0 value was higher for all compounds from the infested trees compared to the healthy (Table A2). The average Q10 coefficient for all compounds for healthy trees was 13, while it was 96 for infested trees, indicating a 7-fold increase of the Q10 coefficient. The average for F0 was 21 µg m−2 h−1 for healthy trees and 2650 µg m−2 h−1 for infested trees, a 127-fold increase, an increase which is in line with the increased emission rates when standardized according to G93 (Table A1). The highest increase in both Q10 and F0 was seen in the compounds β-pinene and longifolene + β-caryophyllene with Q10 increasing 125-fold and 225-fold respectively and F0 increasing 3160-fold and 2100-fold respectively. The lowest change for Q10 was seen in α-pinene and p-cymene, where α-pinene had a lower than 0.01-fold increase from healthy to infested, and the Q10 coefficient for p-cymene actually had a 34 % reduction for infested trees compared to healthy. Despite the lower Q10 coefficient for p-cymene in infested trees, its F0 value was still higher for the infested trees; however, the 5-fold increase was low compared to the other MT compounds. Isoprene was seen to have the overall lowest increase in F0, increasing with 0.1-fold from healthy to infested. A significant difference was found for the Q10 coefficients for healthy and infested trees (P < 0.03), as well as for F0 (P < 0.01).
There were four compounds for which the requirements for the calculations were only fulfilled for infested trees. Those were eucalyptol, tricyclene, (1R)-camphene and (+)-sabinene, for which an increase or comparison between healthy and infested trees cannot be made, but this might indicate that these compounds could be limited to emissions from infested trees only.
3.6 Calculated seasonal BVOC emissions from healthy Norway spruce bark and needles
The calculated needle emissions for the growing season of 2019 in Hyltemossa were found to vary with an average of 60 to 170 µg m−2 h−1 for needle MT in July and August and an average of 25 to 100 µg m−2 h−1 in May and 50 to 120 µg m−2 h−1 in September (Fig. 11b). Bark emissions were based on measured tree trunk temperature at 3 m a.g.l., averaged from two directions (north and east) and the average standardized emissions (MS), 29 µg m−2 h−1 for MT and 2 µg m−2 h−1 for SQT, and the Q10 approach for healthy trees. The calculated emission rates from bark reached a maximum of 16 µg m−2 h−1 in July, which is 10 times lower than the calculated needle emissions at the same time (Fig. 11c). The healthy bark emission rates remained below 10 µg m−2 h−1 for most of the growing season. The estimated bark emission rates from healthy trees using the Q10 approach were generally 5 µg m−2 h−1 lower than the calculated emission rates using the G93 approach but steeply increased during the warmest days to match the G93 emissions (Fig. 11c).

Figure 11The measured and calculated BVOC emission rates for the group monoterpenes from Norway spruce in Hyltemossa: (a) the actual measured emission rates from infested Norway spruce bark (red dot), (b) calculated needle emission rates (green line) and (c) calculated healthy bark emission. The needle emissions were calculated based on the Guenther algorithm (Guenther et al., 1993), and the measured needle emission rates were taken from van Meeningen et al. (2017); specific needle area (SLA) was taken from Wang et al. (2017), and the air temperature at 24 m was taken from the HTM ICOS station (Heliasz, 2020). The healthy bark emission is calculated based on the tree temperature taken at 3 m height in the north and east orientation, data taken from the HTM ICOS station (Heliasz, 2020). The bark emissions are calculated using the Guenther algorithm (orange) and the Q10 temperature dependency (black) based on measured emission rates in this study. The shaded areas (green, orange and black) represent the standard deviation from the mean for the respective calculation method.
For SQTs, the needle emissions peaked at 30 µg m−2 h−1 in late July at the same time as when MT emissions were high and also showed emissions up to 20 µg m−2 h−1 earlier in June (Fig. A2b). For most of May and September, SQT emissions from needles were calculated to be below 5 µg m−2 h−1. Bark emissions of SQTs for healthy trees estimated with G93 were well below 1 µg m−2 h−1 throughout the season (maximum 0.75 µg m−2 h−1 in late July) and below 0.3 µg m−2 h−1 most of the time (Fig. A2c).
However, when comparing estimated bark emissions from healthy trees with actual measurements of infested trees, bark emissions from infested trees were much higher (Fig. 11a). The measured bark MT emission rate from the infested tree reached up to 17 800 µg m−2 h−1, making the total MT emission rate (including needle emissions) increase by almost 100-fold when the tree was infested. The lowest measured infested tree emission rate (3900 µg m−2 h−1) for MT was found during the July campaign; however, despite it being the lowest, it was still considerably higher than the MT emission rate from healthy trees of that day (70 µg m−2 h−1 including both needle and bark; Fig. 11). Bark MT emission rates from infested trees were at least 55 times higher than the total MT emission rate from both needles and bark of a healthy tree.
For the SQT emission rates, the difference was not as distinct. The SQT emission rate reached a maximum of 0.75 µg m−2 h−1 for bark emissions (Fig. A2b) and 30 µg m−2 h−1 for needle emissions (Fig. A2a), while the measured bark emission rate from the infested tree peaked at 40 µg m−2 h−1, indicating a 1.3-fold increase when a tree is infested. The lowest measured infested tree emission rate was also in July for the SQTs, at 1.4 µg m−2 h−1, which was still higher than the calculated healthy bark emission rate at 0.2 µg m−2 h−1, but lower than the needle emission rate of 5 µg m−2 h−1.
4.1 Bark BVOC emissions from healthy and infested Norway spruce
Both emission rates and compound compositions of bark BVOCs from Norway spruce were found to change when trees were infested by spruce bark beetles, which is in line with previous studies on bark beetle infestation of conifers (Amin et al., 2013; Birgersson and Bergström, 1989; Ghimire et al., 2016; Heijari et al., 2011). In this study, 29 compounds unique to infested trees were identified from which the majority were MTs (n = 19; Table A1). Several of the identified compounds were only emitted from infested trees which is consistent with the findings of Ghimire et al. (2016), for example eucalyptol, isoledene, (+)-camphor, tricyclene and α-phellandrene (Table A1). The findings in this study also show isoprene emission from both healthy and infested tree bark which initially was believed to originate from lichen cover, as a study by Zhang-Turpeinen et al. (2021) found a positive correlation between isoprene and lichen cover. However, when visually evaluating bark photos for algae and lichen coverage, there was no clear indication that higher coverage coincided with isoprene emissions, making the origin of the isoprene emissions uncertain. Ghimire et al. (2016) also assessed lichen coverage and isoprene emission, and their results are consistent with this study: they did not find any statistically significant relationship between isoprene emission from bark and lichen or algal cover.
Bäck et al. (2012) previously showed that BVOC emissions between trees are likely to differ in their chemical composition, even between trees from the same forest stand. The Norway spruce trees measured in this study were from two different sites, HTM and NOR, which do not have genetically identical trees. However, the potential influence of genetics on the emission rates from Norway spruce trees between HTM and NOR sites was addressed in a study by van Meeningen et al. (2017) in which no significant differences were found for any compounds but isoprene. In this study, the majority of the compounds identified were MTs, and the main difference detected was between healthy and infested trees with similar results for both sites.
The results of this study indicate much greater increases in BVOC emission rates from healthy and infested conifer trees compared to previous findings (Amin et al., 2013; Ghimire et al., 2016; Heijari et al., 2011). In this study, the total BVOC emission rates for all compounds combined from infested Norway spruce bark were found to be 63- to 215-fold higher compared to healthy trees, in the early and late season respectively (Fig. 6). Previous findings reported increases in emission rates of up to 3-fold in Engelmann spruce (Picea engelmannii) infested by spruce beetles (Dendroctonus rufipennis; Amin et al., 2013), up to 10-fold in Scots pine (Pinus sylvestris) infested by weevils (Hylobius abietis; Heijari et al., 2011) and up to 15-fold higher emission rates of total BVOCs when comparing healthy Norway spruce trees with trees infested by the spruce bark beetle (Ghimire et al., 2016). The measured emission rates in this study are still 3 to 9 times higher than the emission rates in the study by Ghimire et al. (2016). As the emission rates in the study by Ghimire et al. (2016) were standardized according to G93, a temperature effect on emission rates cannot explain this large difference when comparing the increase in emission rates between healthy and infested Norway spruce trees with the results in this study. A possible reason might however be the time since infestation start in relation to when the measurements were conducted. The emission rates decreased exponentially with time after infestation (Fig. 8), suggesting that if sampling occurred early during the infestation, the emission rates would be higher. However, the emission rates from exit holes (measured after 100 d) in this study are still higher than what Ghimire et al. (2016) found in June. Direct comparison with the emission rates reported by Ghimire et al. (2016) and our data is complicated by the lack of information of the time since infestation in their data, and it is possible that emissions observed in their June measurement could have originated from older infestations. In this study, measurements were taken throughout the growing season, from the same spruce, starting before the bark beetle infestations and from the very early infestation to later stages, something that, to our knowledge, has not been done before. Birgersson and Bergström (1989) did measure volatiles emitted from entry holes in bark-beetle-infested Norway spruce during the first week of infestation but not longer.
The results from this study show that emission rates from infested Norway spruce bark decrease with time, similarly to what Eller et al. (2013) found when piercing holes in needles from Ponderosa pine (Pinus ponderosa). They found MT emission rates to increase by 4 orders of magnitude when the needle was pierced compared to undamaged needles, and as the exposed resin hardened, the emission rates decreased exponentially until they reached similar levels as undamaged needles after 30 d. However, in this study induced emission rates from infested Norway spruce bark were seen to last up to 300 d before reaching similar levels as healthy bark, indicating the death of the tree (Fig. 8). The long period of induced emission rates would suggest that the increased emission rates and their exponential decay over time were not only due to the exposure of resin which hardens over time but also because of the active defense of the tree which decreased over time as the bark beetle infestation proceeded. The different hole types provide an indication of the bark beetle infestation development, where entry holes are found early during the infestation and exit holes later when the defense is lower. There was no distinct pattern when comparing the total number of holes to emission rates for the individual Norway spruce trees (Fig. 9). However, when the holes were separated into entry and exit, it was apparent that entry holes generally have higher emission rates compared to exit holes, supporting the claim that the exponential decay is not only due to hardening resin, since the difference in emission rates from the hole types would not be as apparent in that case (Fig. 9). This is also supported by the result indicating higher emission rates at the start of an infestation (Fig. 8) when there is a majority of entry holes (Table 2). For the total BVOCs there is a large spread in emission rates; the second highest emission rate came from an individual tree (ID S3S2) at plot 3 in HTM that had less than 300 holes per square meter (Table 2) and mainly entry holes (Fig. 9). Some of the lowest emission rates came from an individual (tree ID S1S1) with more than 1000 holes per square meter with mainly exit holes (Table 2), and the same is true for the compounds β-phellandrene, eucalyptol and β-pinene (Fig. 9). This result supports the conclusion that emission rates are linked to the time since infestation start, which might be explained by the tree defense being most active in the beginning of an attack and declining over time.
The number of identified BVOC compounds emitted from entry holes was higher compared to exit holes (Table 3), which further supports the assumption that the emission rates are due to the ecological impacts of the spruce bark beetles and not only due to exposed resin. This is consistent with Birgersson and Bergström (1989) who looked at volatiles emitted from entry holes in bark-beetle-infested Norway spruce. Although they did not look at exit holes, their findings show that during the early stage of an attack, the MT emissions are high, and the concentration of the collected MTs during the first day is consistent with what was found in this study 12 d after infestation. Two oxygenated MTs were found only from the entry holes which is consistent with the findings of Birgersson and Bergström (1989) and indicates emissions from the phloem. The bark beetle pheromones germacrene D, isoledene, β-cubebene and 2-methyl-3-buten-2-ol (MB, not quantified) were also only emitted from entry holes in this study – however, only from one tree (tree ID S3S2) and only during measurements in June (Fig. 10d). The presence of MB could be indicative of beetles in the galleries during the measurements of that individual tree (Birgersson et al., 1988; Zhao et al., 2011a). The high increase in emission rates could also be a result of bark-beetle-associated blue-stain fungus (E. polonica), as a study by Mageroy et al. (2020) found that inoculation with the fungus in Norway spruce bark was shown to increase the concentration of total terpenes 91-fold after 35 d compared to the concentration in healthy bark. Although they did not measure the emission rates from the bark as done in this study, their finding of high terpene concentration coincides with the high emission rates from infested Norway spruce bark found in this study.
Indications of differences in emissions from healthy or stressed trees during infestation
As two trees with different health statuses were infested by bark beetles at plot 3 in HTM, we were able to conduct a small case study with measurements of the BVOC emissions throughout an infestation, both from a fully healthy (ID S3S3) tree and from a tree attacked by bark beetles the preceding season (ID S3S2). The initial results of this case study indicate differences in emission rates and compound blend from trees with different health statuses. However, as these results are based on a small sample size they should be followed up in future studies.
Prior to the infestation, we found that the emission rate of the healthy tree (ID S3S3) was lower compared to the seemingly stressed tree (ID S3S2; Fig. 10a,b). High emission rates may indicate stress, supporting the claim that tree S3S2 was already stressed (Loreto and Schnitzler, 2010). This was also visible from old resin flow on the bark, indicating that the high emission rates were caused by a late summer attack from spruce bark beetles from the previous year. As both trees were infested in June, their emission rates increased, but they had a slightly different compound blend which might have been caused by their initial health status. Bark beetle pheromones were found in the June samples from tree S3S2, something that could indicate that there was ongoing blue-stain fungi infection caused from the old infestation or that the new bark beetles had already been established in the tree again (Birgersson et al., 1988; Zhao et al., 2011a). Over time, the emission rates decreased for tree S3S2, while they remained at higher levels for tree S3S3, which could be an indication of the lower vitality of spruce S3S2 and the higher resistance from the initially healthy spruce S3S3. The defense from spruce S3S3 seemed to be ongoing up until the trees were cut down in August; however, the last measurement in August did reveal the occurrence of verbenone, a compound that is emitted after successful fungal establishment and repels bark beetles (Bakke, 2009; Cale et al., 2019). This could indicate that the bark beetles had successfully overtaken the Norway spruce S3S3 in August; however this could not be confirmed, because the trees were cut down, preventing us from taking further measurements.
As bark beetle outbreaks increase, there might be an increase in the number of healthy trees being attacked and killed in addition to the typical attacks on already stressed trees (Jakoby et al., 2019). This further highlights the need for follow-up studies on the initial results of our case study, because healthy trees might contribute to higher emission rates upon infestation compared to already weakened trees. The results from this study revealed different blends of compounds when a tree was already stressed from a previous infestation and attacked again compared to when the tree was healthy before the attack. Another important note from the case study is that emission rates after bark beetle infestation can remain high for up to a year but still be further increased after a new infestation. This is evident from the previously attacked tree (S3S2) which had induced emission rates until the start of the next season (measurements in May Fig. 10a, b), during which the tree was infested again with further induced emissions. These results indicate that the second generation of spruce bark beetles, normally attacking late during the growing season, might lead to induced emission rates continuing until the next year. The initiation of a second generation of spruce bark beetles might thus have a larger impact compared to only attacks from one generation on the total bark BVOC emission rates from Norway spruce, because the emission rates are then induced for longer.
4.2 Bark-beetle-induced BVOC emissions in relation to SOA, other stresses, needle emissions and modeling
High BVOC emission rates from infested trees do not only affect the trees themselves but also impact atmospheric processes. Induced emission rates of BVOCs due to insect herbivory can potentially increase SOA yields in a modeling study (Bergström et al., 2014). Taking not only the quantitative aspects of bark-beetle-induced emission rates into account but also the qualitative effects, the SQTs α-humulene, longifolene and β-caryophyllene and MT α-pinene have the highest SOA yield (Lee et al., 2006). This study found increased emission rates from longifolene + β-caryophyllene (quantified together) of around 54- and 20-fold from infested trees in the early and late season compared to healthy trees (Table 3). The MTs limonene and myrcene were slightly below the SQTs in ranking of SOA yield, and according to the findings in this study, they were seen to increase with an average of 50- to 170-fold and 30- to 530-fold respectively depending on the season, where the highest increase was in the early season. Therefore, the observed changes in BVOC compound composition due to bark beetle infestation found in this study could potentially lead to large impacts on SOA yield and highlights the importance of measuring and accounting for bark BVOC emissions.
An increase of attacks on healthy trees might further affect the atmospheric processes, specifically production of SOA. In the case study with the initially stressed tree (S3S2) and the initially healthy tree (S3S3), both trees had similar emission rates, but they emitted different compound compositions. Higher emissions of limonene and myrcene were measured from S3S3 early during the infestation which might indicate that increased attacks on healthy trees can affect the production of SOA more than attacks on already weakened trees. The high emission rates also continued until the trees were cut down in August, implying that potential increases in SOA yield might continue for longer compared to emissions from already weakened trees.
Significant increases of the temperature standardized BVOC emissions of Norway spruce bark were seen when trees were infested by bark beetles early in the season. Around a 230-fold increase in emission rate was seen for the MTs group. This high increase in emission rate from insect stress for Norway spruce has not previously been observed according to a review by Yu et al. (2021), in which the highest recorded increase was around 20-fold, including previous studies on spruce bark beetles. Heat stress was also identified as a stressor, but it did not increase BVOC emissions as much as stress from bark beetles (Yu et al., 2021). A study on Norway spruce with air temperatures of 40 ∘C found that BVOCs increased 1.8-fold compared to emission rates at an air temperature of 30 ∘C (Esposito et al., 2016). This is much lower than the increase in emission rates from bark beetle infestation found in this study. However, the impact of combined stresses from temperature and insect attacks might further increase the BVOC emissions. This is illustrated by the increase of reference emission rates after infestation across all BVOCs (F0, Table A2) which are standardized at a reference temperature, and therefore the difference between F0 from healthy to infested trees could be interpreted as the change in stress-induced BVOC emissions due to bark beetle attacks without the temperature effect. The temperature sensitivity as expressed by the Q10 coefficient was also found to increase for all compounds but one (of 15, namely p-cymene, Table A2) when trees became infested, indicating that the emission rates were accelerated by both a higher reference emission rate and an accelerated temperature response compared to healthy trees. Taking this into account, and the fact that bark beetle infestations increased bark BVOC emissions more than any other comparable stress, there might be high influences of BVOC emissions from combined stress, making it important to account for combined stress when modeling the emissions and to include it in follow-up studies.
The increase of bark emission rates seen in this study is high enough to considerably add to the emission rates of a full tree when comparing with emission rates from needles – which is considered the part of the tree with the highest emission rates. When modeling the emission rates, two approaches were used for the bark MT emissions, the G93 algorithm and the Q10 approach. The results showed similarities in pattern, but the Q10 approach had larger increases in emission rates with higher temperature increase, something that was expected. The G93 modeled emission rates were constantly higher than the Q10, and had less variability, which might be explained by the empirical coefficients used in the G93 compared to fitting F0 and Q10 for each compound separately. For the needle emission rates, only G93 was used because of the light-dependent nature of some BVOCs emitted from the needles that could not be explained by temperature in the Q10 approach only. The seasonal average emission rates from Norway spruce needles were measured during 2016 in Hyltemossa in a study by van Meeningen et al. (2017). As the study was conducted at the same site, their results were applied to this study as a comparison of bark BVOC emission to needle emission. It was clear that MT emissions from healthy bark do not compare to the needle emission (Fig. 11), where the seasonal average of the MT emissions were 11 times higher from needles than bark. However, when comparing seasonal average bark MT emission from infested trees with needle emissions it was the other way around: the bark emissions from infested trees were 6 to 20 times higher than the needle emissions depending on the time during the season. The bark MT emission from healthy Norway spruce trees accounted for 8 % of the total emission rates from bark and needles. However, if there was an ongoing infestation from bark beetles, the bark emission rates would account for 95 % of the total emission rates during the early season and 85 % during the late season. When comparing with the seasonal average of the emission rates from healthy trees, spruce bark beetle infestation could lead to a 6- to 20-fold increase in total emission rates from bark and needles depending on the time during the season.
When a tree is infested, the emission rates increase significantly, which can cause large local effects both for tree health and SOA production. The BVOC emission increase can also cause more widespread effects, and if the outbreaks are sustained at high levels, there would be large impacts regionally. During 2020 in Sweden, 8 million m3 forest was affected by spruce bark beetles (Wulff and Roberge, 2020). This represents about 0.7 % of the total volume of Norway spruce trees with a diameter larger than 15 cm in Sweden (Skogsstyrelsen, 2022). Using the seasonal average from the early and late season of the bark-beetle-infested emission rates of MT found in this study and the needle emission rates from van Meeningen et al. (2017), the infested trees during 2020 would contribute to an increase of about 4 % to 13 % of MT emission rate from Norway spruce trees in all of Sweden, including emissions from canopy and stem. The effects from insect herbivory and specifically spruce bark beetles might thus be underestimated both in emission and vegetation models (MEGAN, LPJ-GUESS; Guenther et al., 2006; Schurgers et al., 2009) and atmospheric chemistry models estimating BVOC impacts on oxidation capacity and SOA formation (ADCHEM; Roldin et al., 2011). As evidenced by the difference in emission rates during the early or late season, it is also important to consider the influence of time after infestation when modeling emission rates of BVOCs from infested Norway spruce to get a correct estimation of the spruce bark beetle impact.
Norway spruce trees emit BVOCs from their bark as a stress response to spruce bark beetles, and as the number of spruce bark beetle outbreaks is expected to increase in a warmer climate, it will impact the total emission of BVOCs. The aim of this study was to examine how spruce bark beetles affect the BVOC emission rates from Norway spruce bark by looking at the difference between healthy and infested trees and how emission rates develop over time after infestation and to analyze the difference in emissions from different bark-beetle-drilled holes. During the study, an opportunity arose, allowing us to investigate how the BVOC emissions change from non-infested to infested and throughout the infestation.
The results show that there is a significant difference in BVOC emission rates from healthy and infested Norway spruce bark but also a relationship between BVOC emissions from infested trees and the time after infestation start, which can be supported by results indicating a difference in emissions from bark-beetle-drilled entry and exit holes. The initiation of a second generation of bark beetles, which can lead to late summer attacks, can potentially have prolonged impacts on the BVOC emissions, as emission rates were found to be induced until the start of the next season. When a tree was infested a second time the following season, the already increased emission rates were further increased to reach the same levels as induced emissions from a tree infested for the first time. As the infestation proceeded, there was a difference in the emission rate and compound composition when comparing the initially stressed tree with the initially healthy tree, where the emission rates were induced to high levels until August for the initially healthy tree but not for the initially stressed tree.
Further studies are needed to support the findings from this study on the change in emission rates and compound composition when healthy trees are infested compared to weakened trees, as well as the potential increased impact from combined stresses. There is also a need for further studies to analyze the entire impact of spruce bark beetles over long periods and from all parts of Norway spruce trees. The importance of further studies is supported by the findings that the bark-beetle-induced BVOC emission rates can be considerably higher than previously thought and could potentially lead to a 1.1-fold increase of total MT emissions from Norway spruce in Sweden. A potential link between temperature stress and bark beetle stress was identified in this study, where trees seem to become more sensitive to temperature, leading to potentially higher emission rates when temperatures increase in conjunction with bark beetle infestations. Based on the findings of this study, bark beetle infestations are believed to have higher impacts on the atmosphere and climate change than previously thought, and samples from more trees and more frequently throughout the season are needed in order to fully understand their impact.
Table A1Seasonal average temperature standardized emission rate (µg m−2 h−1 ± 1 standard deviation) from all Norway spruce trees located in Hyltemossa and Norunda. Presented are all the identified compounds, compound groups (monoterpenes, sesquiterpenes and other BVOCs), and total emission emitted from healthy and infested (early and late season) Norway spruce bark. The increase or decrease (%) is presented for the infested trees as a change in emission rate from healthy to infested. The occurrence (%) indicates how often each compound appeared in the samples. The compounds that were identified but unable to be quantified are presented as n.q. (no quantification).
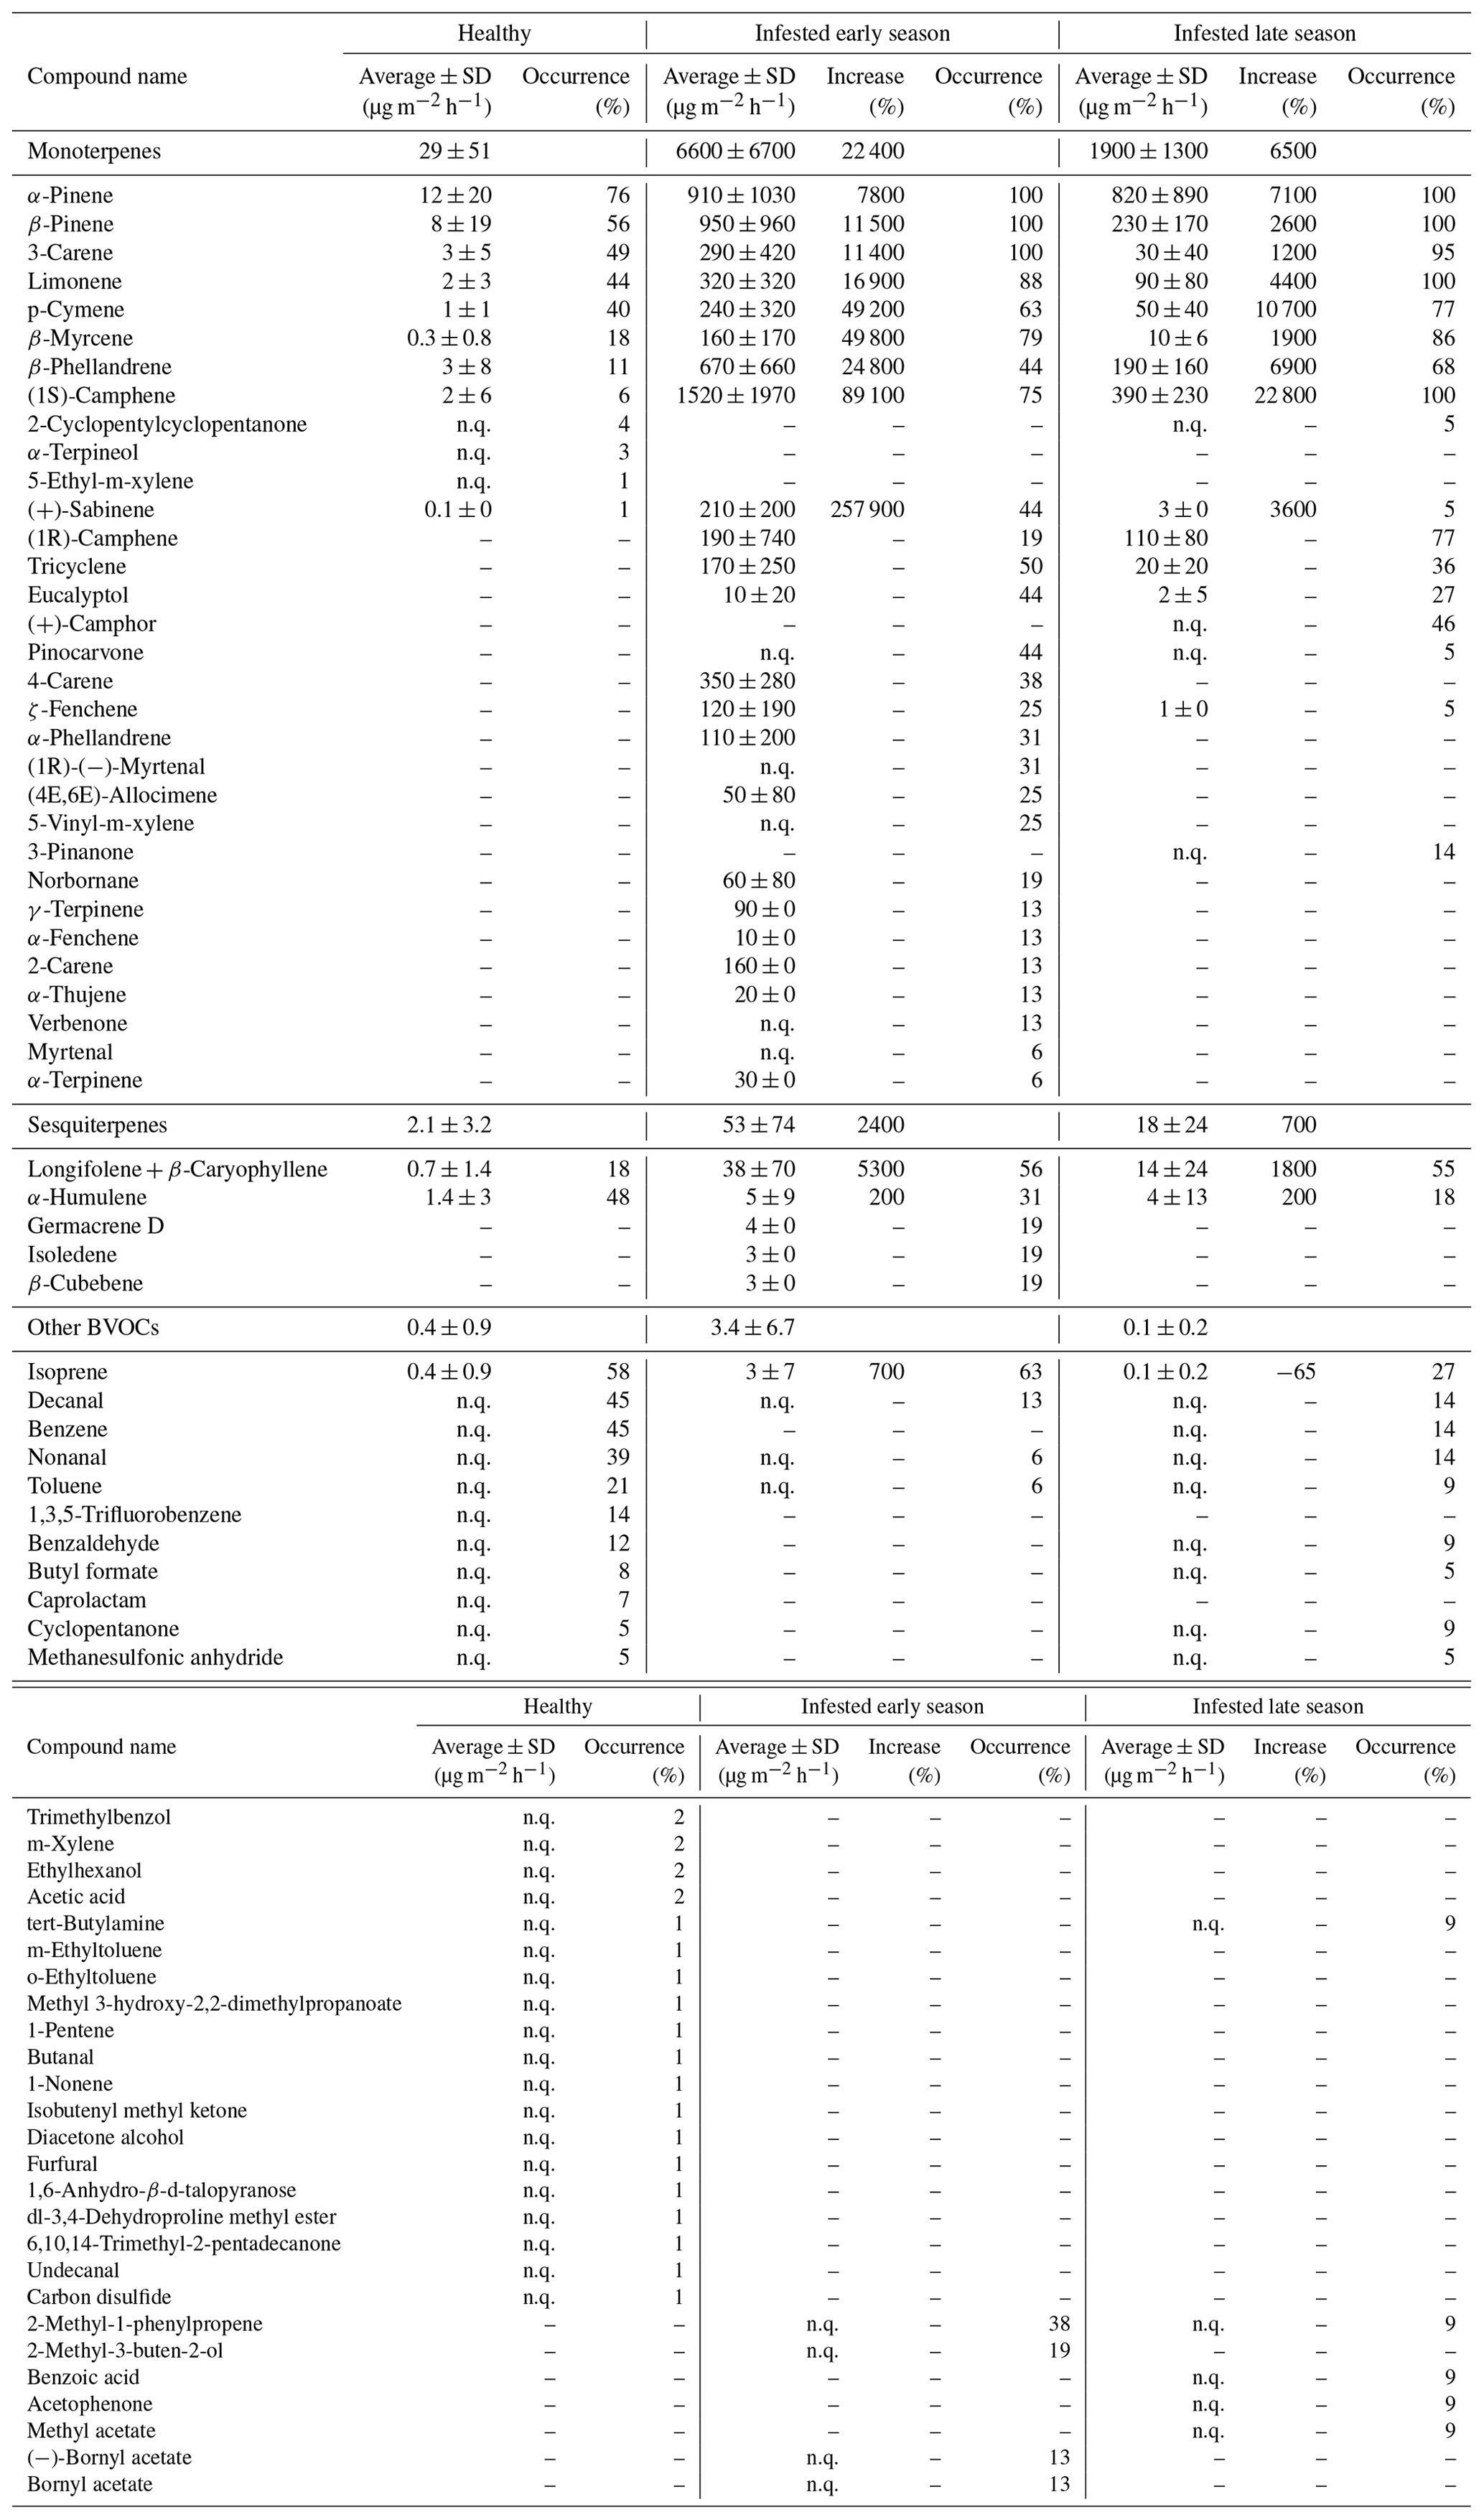
Table A2The difference between healthy and infested trees when applying the calculations for the Q10 temperature dependency. F0 is the reference emission rate standardized at 30 ∘C. The Q10 coefficient indicates the emission rate change for every 10 ∘C temperature difference and is therefore a measure of temperature sensitivity.

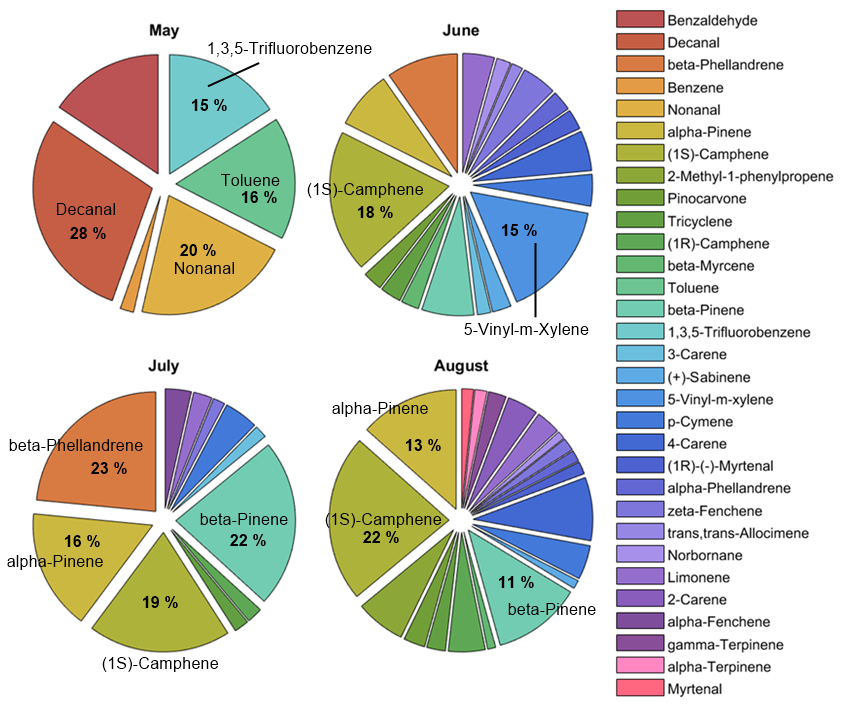
Figure A1The daily average blend from the Norway spruce S3S3 and percentage contribution in mass throughout the summer (May, June, July and August), showing only compounds with a mass contribution of at least 1 %.
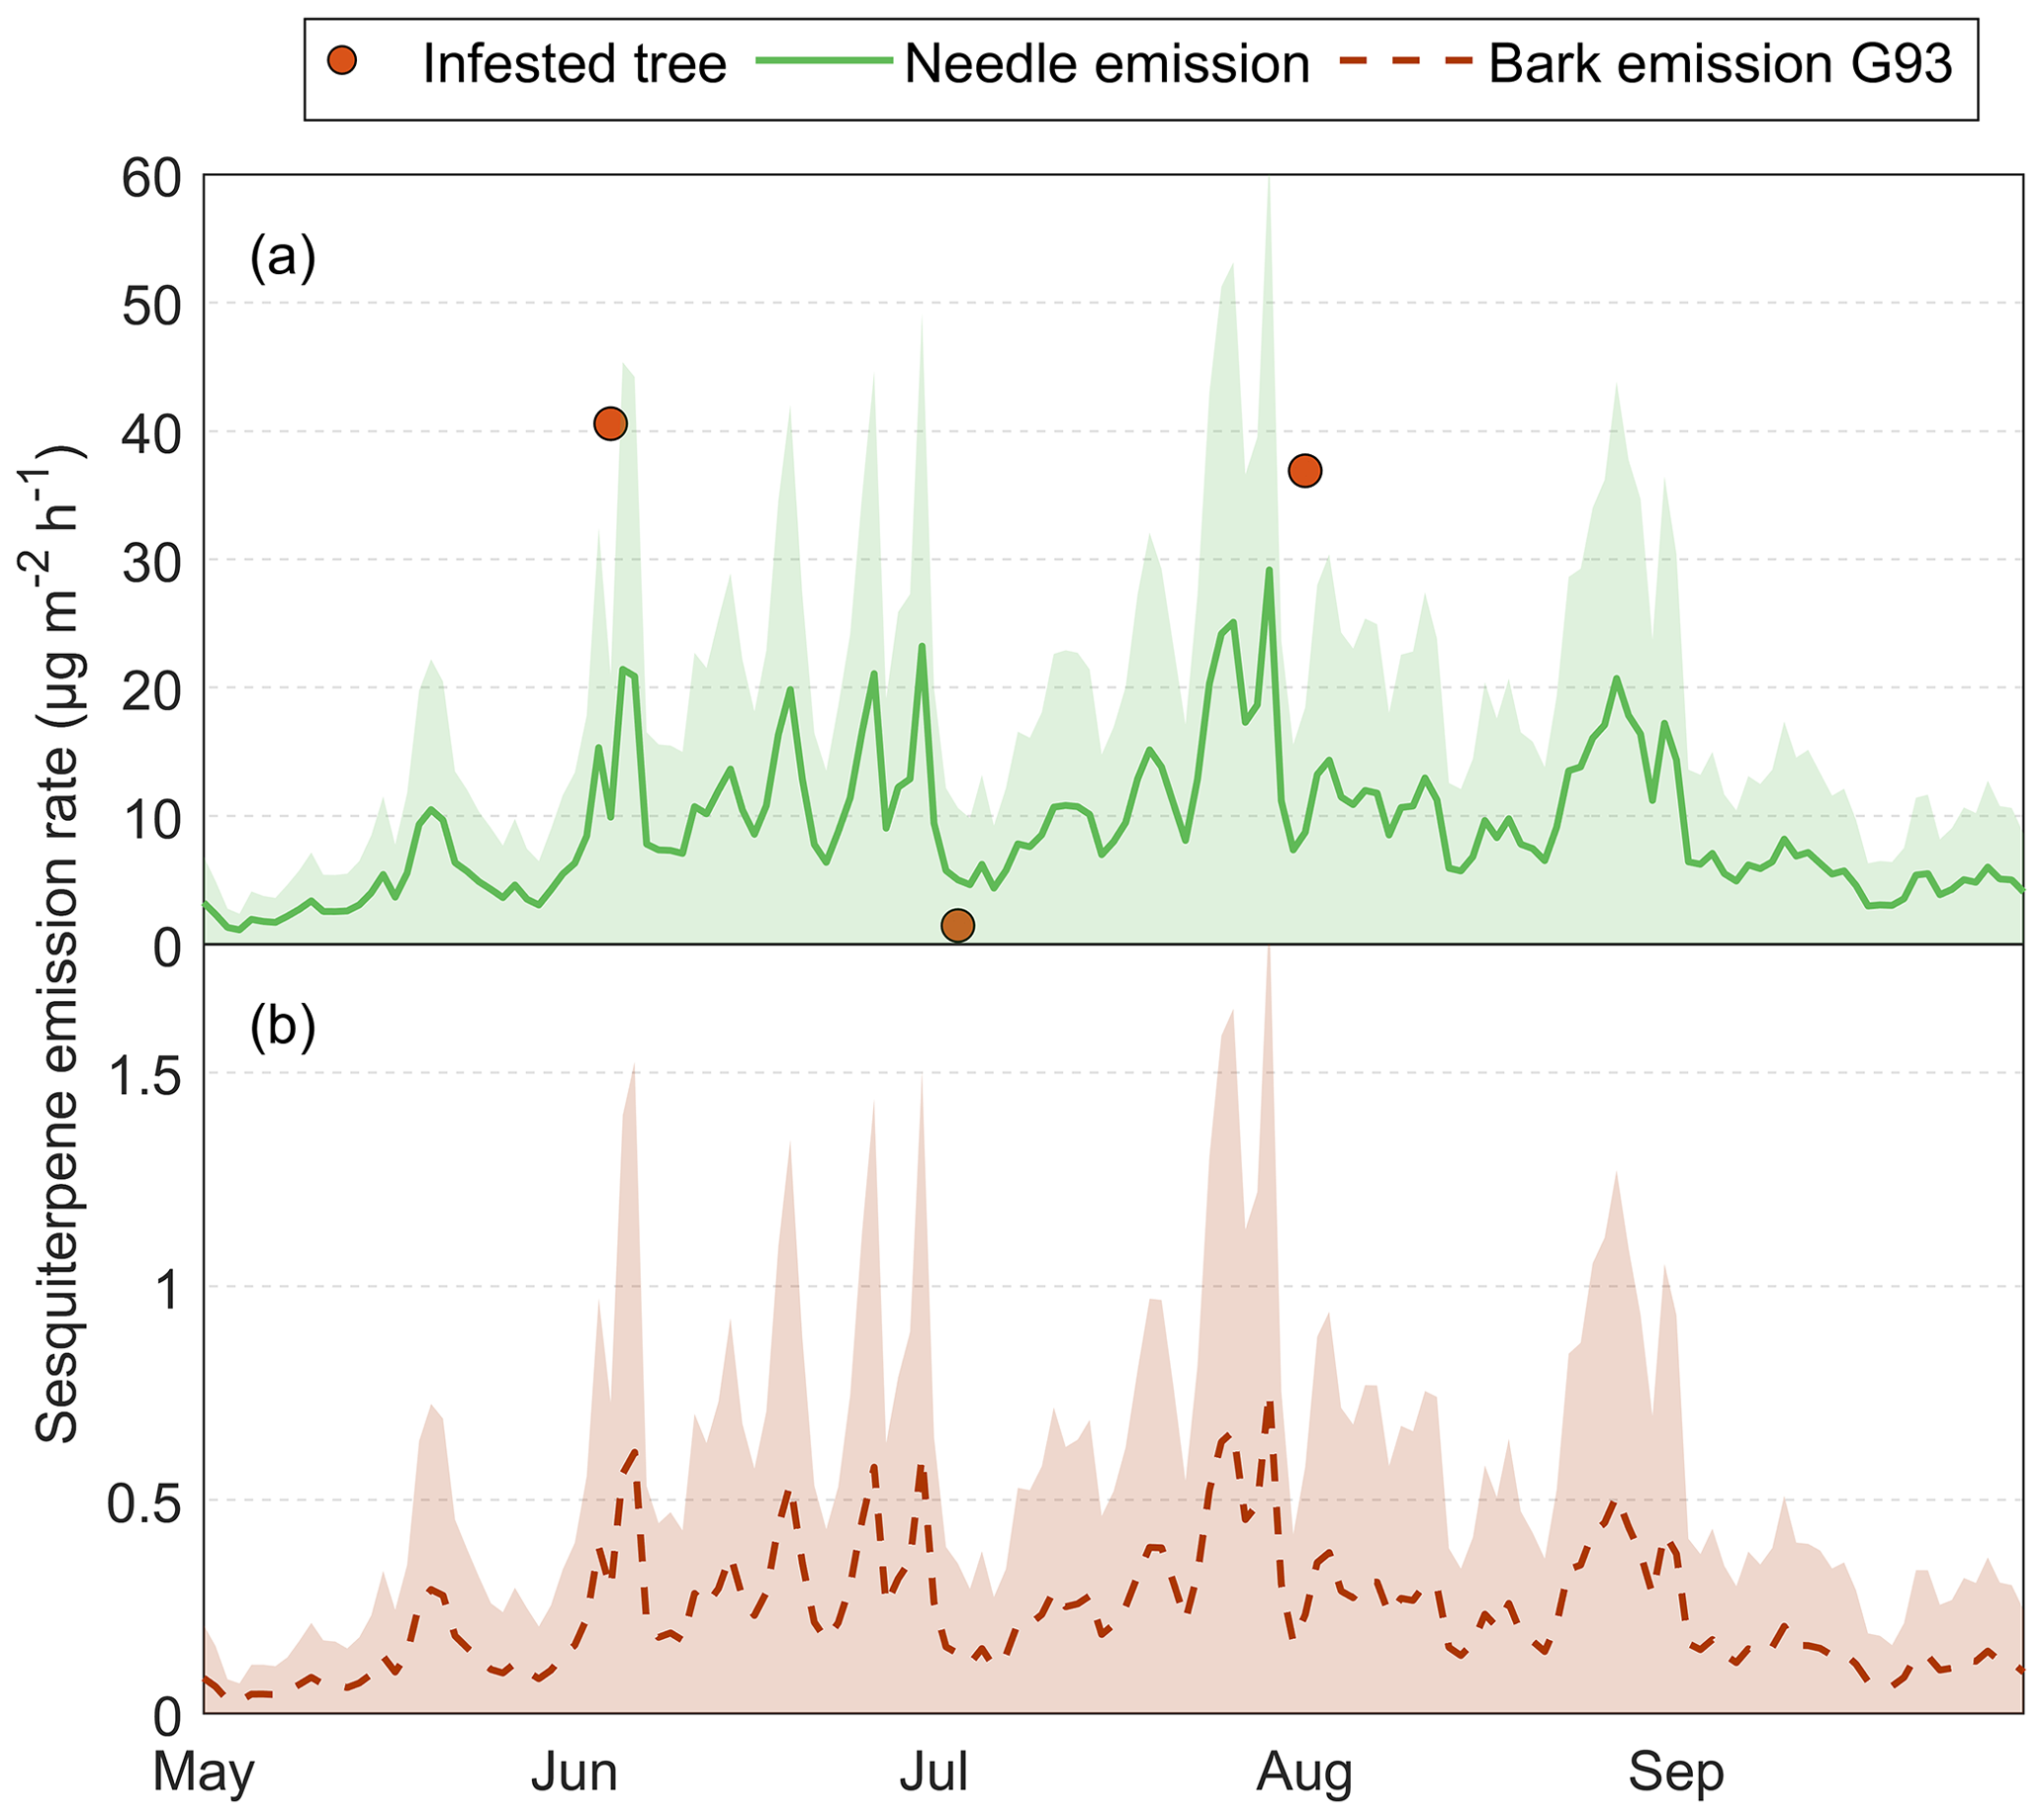
Figure A2The measured and calculated BVOC emission rates for the group sesquiterpenes from Norway spruce in Hyltemossa: (a) the actual measured emission rates from infested Norway spruce bark (red dot) and calculated needle emission rates (green line) and (b) calculated healthy bark emission. The needle emissions are calculated based on the Guenther algorithm (Guenther et al., 1993), and the measured emission rates are taken from van Meeningen et al. (2017), and specific needle area (SLA) was taken from Wang et al. (2017), using the air temperature at 24 m taken from the HTM ICOS station (Heliasz, 2020). The healthy bark emission is calculated with the Guenther algorithm (orange) based on the tree temperature taken at 3 m height in the north and east orientation using data taken from the HTM ICOS station (Heliasz, 2020). The shaded areas (green, orange and black) represent the standard deviation from the mean for the respective calculation method.
The code and data used in this study are available from the corresponding author upon reasonable request.
The supplement related to this article is available online at: https://doi.org/10.5194/bg-20-803-2023-supplement.
EJ and TH designed and planned the campaigns. EJ performed the measurements. EJ performed the data analysis with contributions from KL, AMJ, AG and POO. Funding was acquired by TH. EJ prepared the manuscript draft with contributions from all co-authors.
The contact author has declared that none of the authors has any competing interests.
Publisher’s note: Copernicus Publications remains neutral with regard to jurisdictional claims in published maps and institutional affiliations.
The authors would like to thank the ICOS Hyltemossa and Norunda staff for logistical support and Gustafsborg Säteri AB and Mats de Val for support with forest sites and tree selection. We would also like to thank Julia Iwan, Marieke Scheel, Tanja Sellick and Emily Ballon for assistance with field measurements and Cleo Davie-Martin for valuable discussions on sample analysis. The research presented in this paper is a contribution to the Strategic Research Area Biodiversity and Ecosystem Services in a Changing Climate, BECC (BECC.LU.SE), funded by the Swedish government.
This research has been supported by the Department of Physical Geography and Ecosystem Science, Lund University.
This paper was edited by Nicolas Brüggemann and reviewed by two anonymous referees.
Amin, H. S., Russo, R. S., Sive, B., Richard Hoebeke, E., Dodson, C., McCubbin, I. B., Gannet Hallar, A., and Huff Hartz, K. E.: Monoterpene emissions from bark beetle infested Engelmann spruce trees, Atmos. Environ., 72, 130–133, https://doi.org/10.1016/j.atmosenv.2013.02.025, 2013.
Arneth, A., Harrison, S. P., Zaehle, S., Tsigaridis, K., Menon, S., Bartlein, P. J., Feichter, J., Korhola, A., Kulmala, M., O'Donnell, D., Schurgers, G., Sorvari, S., and Vesala, T.: Terrestrial biogeochemical feedbacks in the climate system, Nat. Geosci., 3, 525–532, https://doi.org/10.1038/ngeo905, 2010.
Bäck, J., Aalto, J., Henriksson, M., Hakola, H., He, Q., and Boy, M.: Chemodiversity of a Scots pine stand and implications for terpene air concentrations, Biogeosciences, 9, 689–702, https://doi.org/10.5194/bg-9-689-2012, 2012.
Bakke, A.: Inhibition of the response in Ips typographus to the aggregation pheromone; field evaluation of verbenone and ipsenol, Z. Angew. Entomol., 92, 172–177, https://doi.org/10.1111/j.1439-0418.1981.tb01666.x, 2009.
Bergström, R., Hallquist, M., Simpson, D., Wildt, J., and Mentel, T. F.: Biotic stress: a significant contributor to organic aerosol in Europe?, Atmos. Chem. Phys., 14, 13643–13660, https://doi.org/10.5194/acp-14-13643-2014, 2014.
Birgersson, G. and Bergström, G.: Volatiles released from individual spruce bark beetle entrance holes Quantitative variations during the first week of attack, J. Chem. Ecol., 15, 2465–2483, https://doi.org/10.1007/BF01020377, 1989.
Birgersson, G., Schlyter, F., Bergström, G., and Löfqvist, J.: Individual Variation In Aggregation Phermomone Content Of The Bark Beetlem Ips typographus, J. Chem. Ecol., 14, 1737–1761, 1988.
Bonn, B. and Moorgat, G. K.: New particle formation during a- and b-pinene oxidation by O3, OH and NO3, and the influence of water vapour: particle size distribution studies, Atmos. Chem. Phys., 2, 183–196, https://doi.org/10.5194/acp-2-183-2002, 2002.
Brilli, F., Ciccioli, P., Frattoni, M., Prestininzi, M., Spanedda, A. F., and Loreto, F.: Constitutive and herbivore-induced monoterpenes emitted by Populus × euroamericana leaves are key volatiles that orient Chrysomela populi beetles, Plant Cell Environ., 32, 542–552, https://doi.org/10.1111/j.1365-3040.2009.01948.x, 2009.
Cale, J. A., Ding, R., Wang, F., Rajabzadeh, R., and Erbilgin, N.: Ophiostomatoid fungi can emit the bark beetle pheromone verbenone and other semiochemicals in media amended with various pine chemicals and beetle-released compounds, Fungal Ecol., 39, 285–295, https://doi.org/10.1016/J.FUNECO.2019.01.003, 2019.
Celedon, J. M. and Bohlmann, J.: Oleoresin defenses in conifers: chemical diversity, terpene synthases and limitations of oleoresin defense under climate change, New Phytol., 224, 1444–1463, https://doi.org/10.1111/NPH.15984, 2019.
Eller, A. S. D., Harley, P., and Monson, R. K.: Potential contribution of exposed resin to ecosystem emissions of monoterpenes, Atmos. Environ., 77, 440–444, https://doi.org/10.1016/j.atmosenv.2013.05.028, 2013.
Esposito, R., Lusini, I., VeèeøOvá, K., Holi, P., Pallozzi, E., Guidolotti, G., Urban, O., and Calfapietra, C.: Shoot-level terpenoids emission in Norway spruce (Picea abies) under natural field and manipulated laboratory conditions, Plant Physiol. Biochem., 108, 530–538, https://doi.org/10.1016/J.PLAPHY.2016.08.019, 2016.
Everaerts, C., Grégoire, J.-C., and Merlin, J.: The Toxicity of Norway Spruce Monoterpenes to Two Bark Beetle Species and Their Associates, in Mechanisms of Woody Plant Defenses Against Insects, Springer New York, New York, NY, USA, 335–344, https://doi.org/10.1007/978-1-4612-3828-7_23, 1988.
Ghimire, R. P., Kivimäenpää, M., Blomqvist, M., Holopainen, T., Lyytikäinen-Saarenmaa, P., and Holopainen, J. K.: Effect of bark beetle (Ips typographus L.) attack on bark VOC emissions of Norway spruce (Picea abies Karst.) trees, Atmos. Environ., 126, 145–152, https://doi.org/10.1016/j.atmosenv.2015.11.049, 2016.
Greenberg, J. P., Asensio, D., Turnipseed, A., Guenther, A. B., Karl, T., and Gochis, D.: Contribution of leaf and needle litter to whole ecosystem BVOC fluxes, Atmos. Environ., 59, 302–311, https://doi.org/10.1016/J.ATMOSENV.2012.04.038, 2012.
Guenther, A., Karl, T., Harley, P., Wiedinmyer, C., Palmer, P. I., and Geron, C.: Estimates of global terrestrial isoprene emissions using MEGAN (Model of Emissions of Gases and Aerosols from Nature), Atmos. Chem. Phys., 6, 3181–3210, https://doi.org/10.5194/acp-6-3181-2006, 2006.
Guenther, A. B., Zimmerman, P. R., Harley, P. C., Monson, R. K., and Fall, R.: Isoprene and monoterpene emission rate variability: model evaluations and sensitivity analyses, J. Geophys. Res., 98, 12609–12617, https://doi.org/10.1029/93jd00527, 1993.
Heijari, J., Blande, J. D., and Holopainen, J. K.: Feeding of large pine weevil on Scots pine stem triggers localised bark and systemic shoot emission of volatile organic compounds, Environ. Exp. Bot., 71, 390–398, https://doi.org/10.1016/j.envexpbot.2011.02.008, 2011.
Heliasz, M.: Ecosystem eco time series (ICOS Sweden), Hyltemossa, 2018-12-31–2019-12-31, ICOS RI [data set], https://hdl.handle.net/11676/UMnMNGTWtxqjsw9AcOTx_92c (last access: 17 August 2021), 2020.
Heliasz, M., Biermann, T., Holst, J., Rinne, J., Holst, T., Linderson, M., and Mölder, M.: ETC L2 ARCHIVE, Hyltemossa, 2017-12-31–2021-08-31, ICOS RI [data set], https://hdl.handle.net/11676/4du0339yr3mPuyyRf7LybFjQ (last access: 17 August 2021), 2021a.
Heliasz, M., Biermann, T., and Kljun, N.: Hyltemossa, ICOS Sweden, https://www.icos-sweden.se/hyltemossa, last access: 17 August 2021b.
Jakoby, O., Lischke, H., and Wermelinger, B.: Climate change alters elevational phenology patterns of the European spruce bark beetle (Ips typographus), Glob. Chang. Biol., 25, 4048–4063, https://doi.org/10.1111/gcb.14766, 2019.
Jia, G., Shevliakova, E., Artaxo, P., De Noblet-Ducoudré, N., Houghton, R., House, J., Kitajima, K., Lennard, C., Popp, A., Sirin, A. R., and Sukumar, L. V.: Land–climate interactions, in Climate Change and Land: an IPCC special report on climate change, desertification, land degradation, sustainable land management, food security, and greenhouse gas fluxes in terrestrial ecosystems, edited by: Shukla, P. R., Skea, J., Calvo Buendia, E., Masson-Delmotte, V., Pörtner, H.-O., Roberts, D. C., Zhai, P., Slade, R., Connors, S., van Diemen, R., Ferrat, M., Haughey, E., Luz, S., Neogi, S., Pathak, M., Petzold, J., Portugal Pereira, J., Vyas, P., Huntley, E., Kissick, K., Belkacemi, M., and Malley, J., 131–247, https://www.ipcc.ch/site/assets/uploads/2019/11/05_Chapter-2.pdf (last access: 25 August 2021), 2019.
Jönsson, A. M., Schroeder, L. M., Lagergren, F., Anderbrant, O., and Smith, B.: Guess the impact of Ips typographus – An ecosystem modelling approach for simulating bark beetle outbreaks, Agr. Forest Meteorol., 166–167, 188–200, https://doi.org/10.1016/J.AGRFORMET.2012.07.012, 2012.
Kleist, E., Mentel, T. F., Andres, S., Bohne, A., Folkers, A., Kiendler-Scharr, A., Rudich, Y., Springer, M., Tillmann, R., and Wildt, J.: Irreversible impacts of heat on the emissions of monoterpenes, sesquiterpenes, phenolic BVOC and green leaf volatiles from several tree species, Biogeosciences, 9, 5111–5123, https://doi.org/10.5194/bg-9-5111-2012, 2012.
Krokene, P.: Conifer Defense and Resistance to Bark Beetles, Bark Beetles Biol. Ecol. Nativ. Invasive Species, 177–207, https://doi.org/10.1016/B978-0-12-417156-5.00005-8, 2015.
Kulmala, M., Suni, T., Lehtinen, K. E. J., Dal Maso, M., Boy, M., Reissell, A., Rannik, Ü., Aalto, P., Keronen, P., Hakola, H., Bäck, J., Hoffmann, T., Vesala, T., and Hari, P.: A new feedback mechanism linking forests, aerosols, and climate, Atmos. Chem. Phys., 4, 557–562, https://doi.org/10.5194/acp-4-557-2004, 2004.
Laothawornkitkul, J., Taylor, J. E., Paul, N. D., and Hewitt, C. N.: Biogenic volatile organic compounds in the Earth system, New Phytol., 183, 27–51, https://doi.org/10.1111/j.1469-8137.2009.02859.x, 2009.
Lee, A., Goldstein, A. H., Kroll, J. H., Ng, N. L., Varutbangkul, V., Flagan, R. C., and Seinfeld, J. H.: Gas-phase products and secondary aerosol yields from the photooxidation of 16 different terpenes, J. Geophys. Res.-Atmos., 111, D17305, https://doi.org/10.1029/2006JD007050, 2006.
Li, T., Holst, T., Michelsen, A., and Rinnan, R.: Amplification of plant volatile defence against insect herbivory in a warming Arctic tundra, Nat. Plants, 5, 568–574, https://doi.org/10.1038/s41477-019-0439-3, 2019.
Lloyd, J. and Taylor, J. A.: On the Temperature Dependence of Soil Respiration, Ecology, 8, 315–323, https://www.jstor.org/stable/2389824 (last access: 10 November 2021), 1994.
Loreto, F. and Schnitzler, J. P.: Abiotic stresses and induced BVOCs, Trends Plant Sci., 15, 154–166, https://doi.org/10.1016/j.tplants.2009.12.006, 2010.
Mageroy, M. H., Christiansen, E., Långström, B., Borg-Karlson, A. K., Solheim, H., Björklund, N., Zhao, T., Schmidt, A., Fossdal, C. G., and Krokene, P.: Priming of inducible defenses protects Norway spruce against tree-killing bark beetles, Plant Cell Environ., 43, 420–430, https://doi.org/10.1111/pce.13661, 2020.
Mölder, M.: Ecosystem meteo time series (ICOS Sweden), Norunda, 2018-12-31–2019-12-31, ICOS RI [data set], https://hdl.handle.net/11676/rMNwV-Xr8imkwqKhriV9Rr7B (last access: 17 August 2021), 2021.
Mölder, M., Kljun, N., Lehner, I., Båth, A., Holst, J., and Linderson, M.: ETC L2 ARCHIVE, Norunda, 2017-12-31–2021-08-31, ICOS RI [data set], https://hdl.handle.net/11676/RIZv3k8DDrTi7Qed21dkTrEY (last access: 17 August 2021), 2021a.
Mölder, M., Lehner, I., and Kljun, N.: Norunda, ICOS Sweden, https://www.icos-sweden.se/norunda, last access: 17 August 2021b.
Öhrn, P., Långström, B., Lindelöw, Å., and Björklund, N.: Seasonal flight patterns of Ips typographus in southern Sweden and thermal sums required for emergence, Agr. Forest Entomol., 16, 147–157, https://doi.org/10.1111/afe.12044, 2014.
Ortega, J. and Helmig, D.: Approaches for quantifying reactive and low-volatility biogenic organic compound emissions by vegetation enclosure techniques – Part A, Chemosphere, 72, 343–364, https://doi.org/10.1016/j.chemosphere.2007.11.020, 2008.
Paasonen, P., Asmi, A., Petäjä, T., Kajos, M. K., Äijälä, M., Junninen, H., Holst, T., Abbatt, J. P. D., Arneth, A., Birmili, W., Van Der Gon, H. D., Hamed, A., Hoffer, A., Laakso, L., Laaksonen, A., Richard Leaitch, W., Plass-Dülmer, C., Pryor, S. C., Räisänen, P., Swietlicki, E., Wiedensohler, A., Worsnop, D. R., Kerminen, V. M., and Kulmala, M.: Warming-induced increase in aerosol number concentration likely to moderate climate change, Nat. Geosci., 6, 438–442, https://doi.org/10.1038/ngeo1800, 2013.
Raffa, K. F.: Induced defensive reactions in conifer-bark beetle systems, in Phytochemical induction by herbivores, chap. 11, edited by: Tallamy, D. W. and Raupp, M. J., Wiley-Interscience, 245–276, ISBN-10: 0471632414, 1991.
Raffa, K. F. and Berryman, A. A.: Physiological Differences Between Lodgepole Pines Resistant and Susceptible to the Mountain Pine Beetle 1 and Associated Microorganisms 2, Environ. Entomol., 11, 486–492, https://doi.org/10.1093/ee/11.2.486, 1982.
Rieksta, J., Li, T., Junker, R. R., Jepsen, J. U., Ryde, I., and Rinnan, R.: Insect Herbivory Strongly Modifies Mountain Birch Volatile Emissions, Front. Plant Sci., 11, 558979, https://doi.org/10.3389/fpls.2020.558979, 2020.
Roldin, P., Swietlicki, E., Schurgers, G., Arneth, A., Lehtinen, K. E. J., Boy, M., and Kulmala, M.: Development and evaluation of the aerosol dynamics and gas phase chemistry model ADCHEM, Atmos. Chem. Phys., 11, 5867–5896, https://doi.org/10.5194/acp-11-5867-2011, 2011.
Roldin, P., Ehn, M., Kurtén, T., Olenius, T., Rissanen, M. P., Sarnela, N., Elm, J., Rantala, P., Hao, L., Hyttinen, N., Heikkinen, L., Worsnop, D. R., Pichelstorfer, L., Xavier, C., Clusius, P., Öström, E., Petäjä, T., Kulmala, M., Vehkamäki, H., Virtanen, A., Riipinen, I., and Boy, M.: The role of highly oxygenated organic molecules in the Boreal aerosol-cloud-climate system, Nat. Commun., 10, 4370, https://doi.org/10.1038/s41467-019-12338-8, 2019.
Schelhaas, M. J., Nabuurs, G. J., and Schuck, A.: Natural disturbances in the European forests in the 19th and 20th centuries, Glob. Chang. Biol., 9, 1620–1633, https://doi.org/10.1046/J.1365-2486.2003.00684.X, 2003.
Schiebe, C., Hammerbacher, A., Birgersson, G., Witzell, J., Brodelius, P. E., Gershenzon, J., Hansson, B. S., Krokene, P., and Schlyter, F.: Inducibility of chemical defenses in Norway spruce bark is correlated with unsuccessful mass attacks by the spruce bark beetle, Oecologia, 170, 183–198, https://doi.org/10.1007/s00442-012-2298-8, 2012.
Schurgers, G., Hickler, T., Miller, P. A., and Arneth, A.: European emissions of isoprene and monoterpenes from the Last Glacial Maximum to present, Biogeosciences, 6, 2779–2797, https://doi.org/10.5194/bg-6-2779-2009, 2009.
Seco, R., Holst, T., Matzen, M. S., Westergaard-Nielsen, A., Li, T., Simin, T., Jansen, J., Crill, P., Friborg, T., Rinne, J., and Rinnan, R.: Volatile organic compound fluxes in a subarctic peatland and lake, Atmos. Chem. Phys., 20, 13399–13416, https://doi.org/10.5194/acp-20-13399-2020, 2020.
Seidl, R., Schelhaas, M. J., Rammer, W., and Verkerk, P. J.: Increasing forest disturbances in Europe and their impact on carbon storage, Nat. Clim. Chang., 4, 806–810, https://doi.org/10.1038/nclimate2318, 2014.
Sharkey, T. D., Chen, X., and Yeh, S.: Isoprene increases thermotolerance of fosmidomycin-fed leaves, Plant Physiol., 125, 2001–2006, https://doi.org/10.1104/pp.125.4.2001, 2001.
Skogsstyrelsen: Genomsnittligt antal granbarkborrar per fälla efter Fällornas plats, År och Vecka, PxWeb [data set], http://pxweb.skogsstyrelsen.se/pxweb/sv/Skogsstyrelsens statistikdatabas/Skogsstyrelsens statistikdatabas__Granbarkborresvarmning/01_antal_granbarkborrar samtliga_fallor.px/, last access: 25 May 2022.
Thomsen, D., Elm, J., Rosati, B., Skønager, J. T., Bilde, M., and Glasius, M.: Large Discrepancy in the Formation of Secondary Organic Aerosols from Structurally Similar Monoterpenes, ACS Earth Sp. Chem., 5, 632–644, https://doi.org/10.1021/acsearthspacechem.0c00332, 2021.
van Meeningen, Y., Wang, M., Karlsson, T., Seifert, A., Schurgers, G., Rinnan, R., and Holst, T.: Isoprenoid emission variation of Norway spruce across a European latitudinal transect, Atmos. Environ., 170, 45–57, https://doi.org/10.1016/j.atmosenv.2017.09.045, 2017.
Wang, M., Schurgers, G., Arneth, A., Ekberg, A., and Holst, T.: Seasonal variation in biogenic volatile organic compound (BVOC) emissions from Norway spruce in a Swedish boreal forest, Boreal Environ. Res., 22, 353–367, 2017.
Wulff, S. and Roberge, C.: Nationell Riktad Skogsskadeinventering (NRS) – Inventering av granbarkborreangrepp i Götaland och Svealand 2020 [Inventory of spruce bark beetle infestation in Götaland and Svealand 2020], In Swedish, Umeå, https://pub.epsilon.slu.se/21827/1/wulff_s_et_al_210201.pdf (last access: 15 August 2021), 2020.
Yu, H., Holopainen, J. K., Kivimäenpää, M., Virtanen, A., and Blande, J. D.: Potential of climate change and herbivory to affect the release and atmospheric reactions of bvocs from boreal and subarctic forests, Molecules, 26, 1–24, https://doi.org/10.3390/molecules26082283, 2021.
Zhang-Turpeinen, H., Kivimäenpää, M., Berninger, F., Köster, K., Zhao, P., Zhou, X., and Pumpanen, J.: Age-related response of forest floor biogenic volatile organic compound fluxes to boreal forest succession after wildfires, Agr. Forest Meteorol., 308–309, 108584, https://doi.org/10.1016/J.AGRFORMET.2021.108584, 2021.
Zhao, T., Borg-Karlson, A. K., Erbilgin, N., and Krokene, P.: Host resistance elicited by methyl jasmonate reduces emission of aggregation pheromones by the spruce bark beetle, Ips typographus, Oecologia, 167, 691–699, https://doi.org/10.1007/s00442-011-2017-x, 2011a.
Zhao, T., Krokene, P., Hu, J., Christiansen, E., Björklund, N., Långström, B., Solheim, H., and Borg-Karlson, A. K.: Induced terpene accumulation in Norway spruce inhibits bark beetle colonization in a dose-dependent manner, PLoS One, 6, e26649, https://doi.org/10.1371/journal.pone.0026649, 2011b.