the Creative Commons Attribution 4.0 License.
the Creative Commons Attribution 4.0 License.
 | 09 Jan 2023
Riverine impact on future projections of marine primary production and carbon uptake
Jörg Schwinger
Jerry Tjiputra
Ingo Bethke
Jens Hartmann
Emilio Mayorga
Christoph Heinze
Riverine transport of nutrients and carbon from inland waters to the coastal and finally the open ocean alters marine primary production (PP) and carbon (C) uptake regionally and globally. So far, this process has not been fully represented and evaluated in the state-of-the-art Earth system models. Here we assess changes in marine PP and C uptake projected under the Representative Concentration Pathway 4.5 climate scenario using the Norwegian Earth system model, with four riverine transport configurations for nutrients (nitrogen, phosphorus, silicon, and iron), carbon, and total alkalinity: deactivated, fixed at a recent-past level, coupled to simulated freshwater runoff, and following four plausible future scenarios. The inclusion of riverine nutrients and carbon at the 1970 level improves the simulated contemporary spatial distribution of annual mean PP and air–sea CO2 fluxes relative to observations, especially on the continental margins (5.4 % reduction in root mean square error (RMSE) for PP) and in the North Atlantic region (7.4 % reduction in RMSE for C uptake). While the riverine nutrients and C input is kept constant, its impact on projected PP and C uptake is expressed differently in the future period from the historical period. Riverine nutrient inputs lessen nutrient limitation under future warmer conditions as stratification increases and thus lessen the projected decline in PP by up to 0.66 ± 0.02 Pg C yr−1 (29.5 %) globally, when comparing the 1950–1999 with the 2050–2099 period. The riverine impact on projected C uptake depends on the balance between the net effect of riverine-nutrient-induced C uptake and riverine-C-induced CO2 outgassing. In the two idealized riverine configurations the riverine inputs result in a weak net C sink of 0.03–0.04 ± 0.01 Pg C yr−1, while in the more plausible riverine configurations the riverine inputs cause a net C source of 0.11 ± 0.03 Pg C yr−1. It implies that the effect of increased riverine C may be larger than the effect of nutrient inputs in the future on the projections of ocean C uptake, while in the historical period increased nutrient inputs are considered the largest driver. The results are subject to model limitations related to resolution and process representations that potentially cause underestimation of impacts. High-resolution global or regional models with an adequate representation of physical and biogeochemical shelf processes should be used to assess the impact of future riverine scenarios more accurately.
- Article
(14852 KB) - Full-text XML
- BibTeX
- EndNote


At global scale, the major sources of both dissolved and particulate materials to the oceans are river runoff, atmospheric deposition, and hydrothermal inputs; of these three, river runoff plays an essential role in transporting nutrients into the ocean which stimulate biological primary production (PP) in the ocean (Meybeck, 1982; Smith et al., 2003; Chester, 2012). For some substances riverine transport even acts as the absolutely dominant source, such as total phosphorus (∼90 %) and total silicon (>70 %) (Chester, 2012). River transport of carbon into the ocean influences the air–sea CO2 exchange, local oxygen balance, and acidification level, thus further affecting marine ecosystem health (Meybeck and Vörösmarty, 1999; Liu et al., 2021). Despite our limited understanding on the riverine carbon fluxes, they could play an important role in closing the global carbon budget (Friedlingstein et al., 2022). A recent study on the global carbon cycle has emphasized the importance of the carbon transport through the land-to-ocean aquatic continuum (Regnier et al., 2022).
With an increasing world population and a perturbed hydrological cycle under climate change, riverine transport of nutrients and carbon from land to oceans has a potentially growing impact on the marine biogeochemistry and ecosystem (Seitzinger et al., 2010; van der Struijk and Kroeze, 2010). Furthermore, the impacts of anthropogenic activity, particularly agriculture (Bouwman et al., 2009; Garnier et al., 2021), wastewater discharges (Van Drecht et al., 2009), and extensive damming (Eiriksdottir et al., 2017; Zhang et al., 2022), have greatly perturbed the riverine transport of nitrogen (N), phosphorus (P), and silicon (Si) to the oceans. Seitzinger et al. (2010) estimated that there was an increase in global riverine fluxes of dissolved inorganic nitrogen (DIN) and phosphorus (DIP) by 35 % and 29 %, respectively, between 1970 and 2000, as well as a further possible change of −2 % to +29 % in DIN and +37 % to +57 % in DIP between 2000 and 2050, depending on the future scenarios used in their study. Beusen et al. (2016) estimated that river nutrient transport to the ocean increased from 19 to 37 Tg N yr−1 and from 2 to 4 Tg P yr−1 over the 20th century, taking into account both increased nutrient input to rivers and intensified retention/removal of nutrients in freshwater systems. The riverine carbon input is highly influenced by the magnitude of continental runoff (Liu et al., 2020; Frigstad et al., 2020), permafrost melting, and leaching of post-glacial peat deposits (Wild et al., 2019; Pokrovsky et al., 2020; Mann et al., 2022), all of which are sensitive to climate change. In addition, anthropogenic change, such as land-use and land-cover changes, lake and reservoir eutrophication, and sewage emissions of organic material into rivers, may become an important factor in the future (Meybeck and Vörösmarty, 1999).
Some regions such as the Arctic Ocean and large river estuaries may receive a higher impact from changes in riverine inputs than other regions. The Arctic Ocean accounts for only 4 % of the global ocean area (Jakobsson, 2002) but takes 11 % of the global river discharge (McClelland et al., 2012), and it is estimated that about one-third of its net PP is sustained by nutrients originating from rivers and coastal erosion (Terhaar et al., 2021). Therefore, one can expect that Arctic PP will be affected by altered riverine transport of nutrients and carbon under future climate changes. Previous studies have shown that enhanced riverine nutrient input increases PP in the Arctic Ocean (Letscher et al., 2013; Le Fouest et al., 2013, 2015, 2018; Terhaar et al., 2019), while large riverine dissolved organic carbon (DOC) delivery reduces CO2 uptake in Siberian shelf seas (Anderson et al., 2009; Manizza et al., 2011). Considering large river estuaries, van der Struijk and Kroeze (2010) have demonstrated potentially higher eutrophication or hypoxia risk in the coastal waters of South America by 2050, where increasing trends in DIN and DIP are detected. Yan et al. (2010) have reported that anthropogenically enhanced N inputs will continue to dominate river DIN yields in the future and impose a challenge of N eutrophication in the Changjiang river basin.
The latest generation of Earth system models (ESMs) have implemented some forms of riverine inputs in their ocean biogeochemistry modules (Séférian et al., 2020). The models that include riverine inputs use different implementations, from constant contemporary fluxes (e.g., IPSL-SM6A-LR and NorESM2; Aumont et al., 2015; Tjiputra et al., 2020), to temporally varying fluxes (CESM2; Danabasoglu et al., 2020), and to interactive with terrestrial nutrient leaching transported by dynamical river routing (e.g., CNRM-ESM2-1 and MIROC-ES2L; Séférian et al., 2019; Hajima et al., 2020), and they typically use the Redfield ratio to convert from one chemical compound to the others. For instance, in the latest version of the IPSL model (IPSL-SM6A-LR; Aumont et al., 2015) riverine nutrients (DIN, DIP, Si), dissolved organic nitrogen (DON), dissolved organic phosphorus (DOP), dissolved inorganic carbon (DIC), and total alkalinity (TA) are implemented as constant contemporary fluxes based on datasets from Global NEWS 2 (NEWS 2; Mayorga et al., 2010) and the Global Erosion Model of Ludwig et al. (1996). Further, in the CESM2 (Danabasoglu et al., 2020) DIN and DIP are taken from the Integrated Model to Assess the Global Environment–Global Nutrient Model (IMAGE-GNM; Beusen et al., 2015, 2016) and vary from 1900 to 2005, which is more sophisticated than using constant fluxes. The other riverine nutrients, DIC, and TA are held constant using data from NEWS 2 (Mayorga et al., 2010). Some ESMs have implemented interactive riverine nutrient input from terrestrial processes; e.g., in the CNRM-ESM2-1 the riverine DOC is calculated actively from litter and soil carbon leaching in the land model, and the supply of the other nutrients, DIC, and TA has been parameterized using the global average ratios to DOC from Mayorga et al. (2010) and Ludwig et al. (1996). In the MIROC-ES2L model (Hajima et al., 2020), the N cycle is coupled between the ocean and land ecosystems; therefore, the inorganic N leached from the soil is transported by rivers and subsequently as an input to the ocean ecosystem. The riverine P is calculated from N using the Redfield ratio, but riverine carbon input is not implemented. Existing models with interactive riverine inputs typically do not consider biogeochemical processes in the freshwater system such as sedimentation.
A few modeling studies have assessed the impact of riverine nutrients and carbon on marine biogeochemistry. For example, Bernard et al. (2011) and Aumont et al. (2001) evaluated the riverine impact on marine Si and carbon cycle, respectively. Lacroix et al. (2020) estimated and implemented preindustrial riverine loads of nutrients and carbon in a global ocean biogeochemistry model, and they concluded that the riverine (mainly inorganic and organic) carbon inputs lead to a net global oceanic CO2 outgassing of 231 Tg C yr−1 and an opposing response of an uptake of 80 Tg C yr−1 due to riverine nutrient inputs. Additionally, the riverine inputs at preindustrial levels lead to a strong PP increase in some regions, e.g., +377 %, +166 %, and +71 % in Bay of Bengal, tropical west Atlantic, and the East China Sea, respectively (Lacroix et al., 2020). Tivig et al. (2021), on the other hand, found that riverine N supply alone has a limited impact on global marine PP ( %) due to the negative feedback of reduced N2 fixation and increased denitrification. This negative feedback could also overcompensate the N addition by river supply locally, e.g., in Bay of Bengal where PP decreased due to riverine N input (Tivig et al., 2021). A couple of modeling studies have also assessed the impact of changing riverine inputs on marine PP and CO2 fluxes. Cotrim da Cunha et al. (2007) assessed riverine impact using a coarse-resolution ocean biogeochemistry model, with single or combined nutrients from zero input to a high input corresponding to a world population of 12 billion people and reported changes in PP from −5 % to +5 % for the open ocean and from −16 % to +5 % for the coastal ocean compared to the present-day simulation. Liu et al. (2021) demonstrated an increase in global coastal net PP of +4.6 % in response to a half-century (1961–2010) increase in river N loads. In a recent study by Lacroix et al. (2021b) the impact of changing riverine N and P in a historical period (1905–2010) on marine net PP and air–sea CO2 fluxes was investigated by applying an eddy-permitting fine-resolution (∼0.4∘) ocean biogeochemistry model. Their result revealed an enhancement of 2.15 Pg C yr−1 of the global marine PP, corresponding to a relative increase of +5 % over the studied period, induced by increased terrigenous nutrient inputs. The PP increase in the coastal ocean averaged to 14 % with regional increases exceeding 100 %, and the global coastal ocean CO2 uptake increased by 0.02 Pg C yr−1 due to the increased riverine nutrient inputs (Lacroix et al., 2021b). In the Arctic, doubling riverine nutrient delivery increased PP by 11 % on average and by up to 35 % locally, while the riverine DOC input-induced CO2 outgassing resulted in a 25 % reduction in C uptake in the Arctic Ocean (Terhaar et al., 2019).
Although the historical and contemporary impacts of riverine nutrients and carbon have been considered increasingly, their impacts on future projections of marine biogeochemistry have not been sufficiently addressed. Taking advantage of the latest improvement in global river nutrient and carbon export datasets, e.g., NEWS 2 (https://marine.rutgers.edu/globalnews/datasets.htm, last access: 5 January 2023) and GLORICH (https://doi.org/10.1594/PANGAEA.902360), and responding to the demand of development of ESMs with increasing model resolution, the assessment of the impact of riverine nutrients and carbon on projections of marine biogeochemistry becomes feasible and desirable.
In this study, we aim to assess the impact of riverine nutrients and carbon on the projected changes in regional and global marine PP and air–sea CO2 exchange by addressing the following questions.
-
How does the presence of riverine fluxes of nutrients and carbon affect the contemporary representation of marine PP and C uptake in our model?
-
How does the presence of riverine fluxes of nutrients and carbon affect the projections of marine PP and C uptake?
-
How important is the consideration of transient changes in riverine fluxes of nutrients and carbon on the projections?
We explore these questions by performing a series of transient historical and 21st century climate simulations under the Representative Concentration Pathway (RCP) 4.5 (middle-of-the-road) scenario with the fully coupled Norwegian Earth system model (NorESM) under four different riverine input configurations. Another objective of the study is to explore the best practical way of implementing riverine inputs into future versions of NorESM. Because of the coarse resolution of the version used here, a series of processes in the coastal zone cannot be represented in our study such as the high accumulation of organic sediment in shallow waters and respective remineralization rates of previously deposited material (Arndt et al., 2013; Regnier et al., 2013). These processes can only be presented in models of much higher spatial resolution, which are at present too costly to be integrated long enough to simulate the large-scale water masses adequately and project long-term-scale climatic change. Given missing contributions from unresolved processes, our results are to be interpreted as lower bound estimates.
2.1 Model description
All simulations in this study have been performed with the Norwegian Earth system model version 1 (NorESM1-ME, hereafter NorESM) (Bentsen et al., 2013), a climate model that provided input to the Fifth Coupled Model Intercomparison Project (CMIP5) (Taylor et al., 2011). The model is based on the Community Earth System Model version 1 (CESM1) (Hurrell et al., 2013). The atmospheric, land, and sea ice components are the Community Atmosphere Model (CAM4) (Neale et al., 2013), the Community Land Model (CLM4) (Oleson et al., 2010; Lawrence et al., 2011), and the Los Alamos National Laboratory sea ice model (CICE4) (Holland et al., 2011), respectively. An interactive aerosol–cloud–chemistry module has been added to the atmospheric component (Kirkevåg et al., 2013). The physical ocean component – the Bergen Layered Ocean Model (BLOM, formerly called NorESM-O) (Bentsen et al., 2013) – is an updated version of the Miami Isopycnic Coordinate Ocean Model (MICOM) (Bleck and Smith, 1990; Bleck et al., 1992) and features a stack of 51 isopycnic layers (potential densities ranging from 1028.2 to 1037.8 kg m−3 referenced to 2000 dbar) with a two-layer bulk mixed layer on top. The depth of the bulk mixed layer varies in time, and the thickness of the topmost layer is limited to 10 m in order to allow for a faster air–sea flux exchange. The ocean and sea ice components are implemented on a dipolar curvilinear horizontal grid with a 1∘ nominal resolution that is enhanced at the Equator and towards the poles, and its northern grid pole singularity is rotated over Greenland. The atmosphere and land components are configured on a regular horizontal grid.
The ocean biogeochemistry component of NorESM is based on the Hamburg Ocean Carbon Cycle Model version 5 (HAMOCC5) (Maier-Reimer et al., 2005). The component has been tightly coupled to NorESM-O such that both components share the same horizontal grid and vertical layers and that all tracers are transported by the physical component at the model time step (Assmann et al., 2010). Tuning choices and further improvements to the biogeochemistry component are detailed in Tjiputra et al. (2013). Here we only summarize features of particular importance to this study and refer to the HAMOCC version used here as HAMOCCNorESM1. The partial pressure of CO2 (pCO2) in seawater is calculated as a function of surface temperature, salinity, pressure, dissolved inorganic carbon (DIC), and total alkalinity (TA). Dissolved iron is released to the surface ocean with a constant fraction (3.5 %) of the climatological monthly aerial dust deposition (Mahowald et al., 2005), but only 1 % of this is assumed to be bio-available. Nitrogen fixation by cyanobacteria occurs when nitrate in the surface water is depleted relative to phosphate according to the Redfield ratio (Redfield and Daniel, 1934). Phytoplankton growth in the model depends on temperature, availability of light, and on the most limiting nutrient among phosphate, nitrate, and iron. Constant stoichiometric ratios for the biological fixation of C, N, P, and ΔO2 () are prescribed in HAMOCCNorESM1 and are extended by fixed Si:P (25:1) and Fe:P () stoichiometric ratios. HAMOCCNorESM1 prognostically simulates export production of particulate organic carbon (POC). It is assumed that a fraction of POC production is associated with diatom silica production, and the remaining fraction is associated with calcium carbonate production by coccolithophorids. The fraction of diatom-associated production is calculated from silicate availability, effectively assuming that diatoms are able to out-compete other phytoplankton growth under favorable (high surface silicate concentration) growth conditions. Particles, including POC, biogenic silica, calcium carbonate, and dust, are advected by ocean circulation in the model. Those particles sink through the water column with constant sinking speeds and are remineralized at constant rates. HAMOCCNorESM1 includes an interactive sediment module with 12 biogeochemically active vertical layers. The permanent burial of particles from deepest sediment layer represents a net loss of POC, calcium carbonate, and silica from the ocean–sediment system and is compensated for by atmospheric and riverine inputs on a timescale of several thousand model years. More detailed model description and parameters are documented in previous publications (Bentsen et al., 2013; Tjiputra et al., 2013).
2.2 Model evaluation
The overall performance of the physical and biogeochemical ocean components has been evaluated elsewhere (Bentsen et al., 2013; Tjiputra et al., 2013). For example, simulated alkalinity, phosphate, nitrate, and silicic acid have been evaluated in previous works (Tjiputra et al., 2013, 2020). Here we only briefly review the model performance of the mostly relevant variables for this study, namely PP and air–sea CO2 fluxes.
The simulated global annual mean PP is 40.1 Pg C yr−1 during 2003–2012, which is lower than the satellite-based model estimates, ranging from 55 to 61 Pg C yr−1 (Behrenfeld and Falkowski, 1997; Westberry et al., 2008). However, the distribution of annual mean surface PP is generally consistent with the remote-sensing-based estimates from Behrenfeld and Falkowski (1997), with the largest model–data deviation in the eastern equatorial Pacific and parts of the Southern Ocean (known as high-nutrient–low-chlorophyll regions), where the model overestimates PP (the Arctic Ocean was not assessed in that study; Tjiputra et al., 2013). Along the continental margins, the simulated PP is generally underestimated compared to the remote-sensing-based estimates (Tjiputra et al., 2013), which may relate to the lack of riverine inputs and/or unresolved shelf processes due to coarse model resolution. Additionally, our model simulates a comparable magnitude of projected decrease in PP by the end of the 21th century compared to the historical period with other global models (see detailed discussion in Sect. 4.1).
In the Arctic Ocean, the simulated PP in our model is biased towards lower values. In the study by Skogen et al. (2018), the NorESM model is compared with a regional model that comprises part of the Arctic region, and it shows that the NorESM simulates a bloom period that is later and shorter than that in the regional model; hence the annual integrated PP is too low. In a multi-model study (Lee et al., 2016) that assesses the relative skills of 21 regional and global biogeochemical models in reproducing the observed contemporary Arctic PP, the NorESM is shown to have a negative bias of −0.49 but is well within the multi-model mean bias of −0.31 ± 0.39. Many coarse-/intermediate-resolution global models also show considerably lower net PP in the Arctic (Terhaar et al., 2019). Such common shortcomings in global-scale marine biogeochemical models can partly be attributed to the simplified ecosystem parameterization which is not regionally adapted and which can be improved through data assimilation (Tjiputra et al., 2007; Gharamti et al., 2017). Additionally, the lack of adequate representation of riverine input in some ESMs can also lead to underestimates of PP, since around one-third of current Arctic marine PP is sustained by terrigenous nutrient input (Terhaar el al., 2021). Despite the biased-low PP under the contemporary climate, the projected absolute change of 70 Tg C yr−1 by the end of the 21th century is well within the range estimated from other ESMs (Vancoppenolle et al., 2013).
Tjiputra et al. (2013) also evaluated the simulated mean annual air–sea CO2 fluxes for the 1996–2005 period against observation-based estimates by Takahashi et al. (2009) and concluded that the model broadly agrees with the observations in term of spatial variation, although in the equatorial Indian Ocean and in the polar Southern Ocean (south of 60∘ S) the model underestimates outgassing and overestimates C uptake, respectively.
2.3 Riverine data
The influx of carbon and nutrients from over 6000 rivers to the coastal oceans has been implemented in HAMOCCNorESM1 based on previous work of Bernard et al. (2011) but with modifications that are outlined in the following paragraphs.
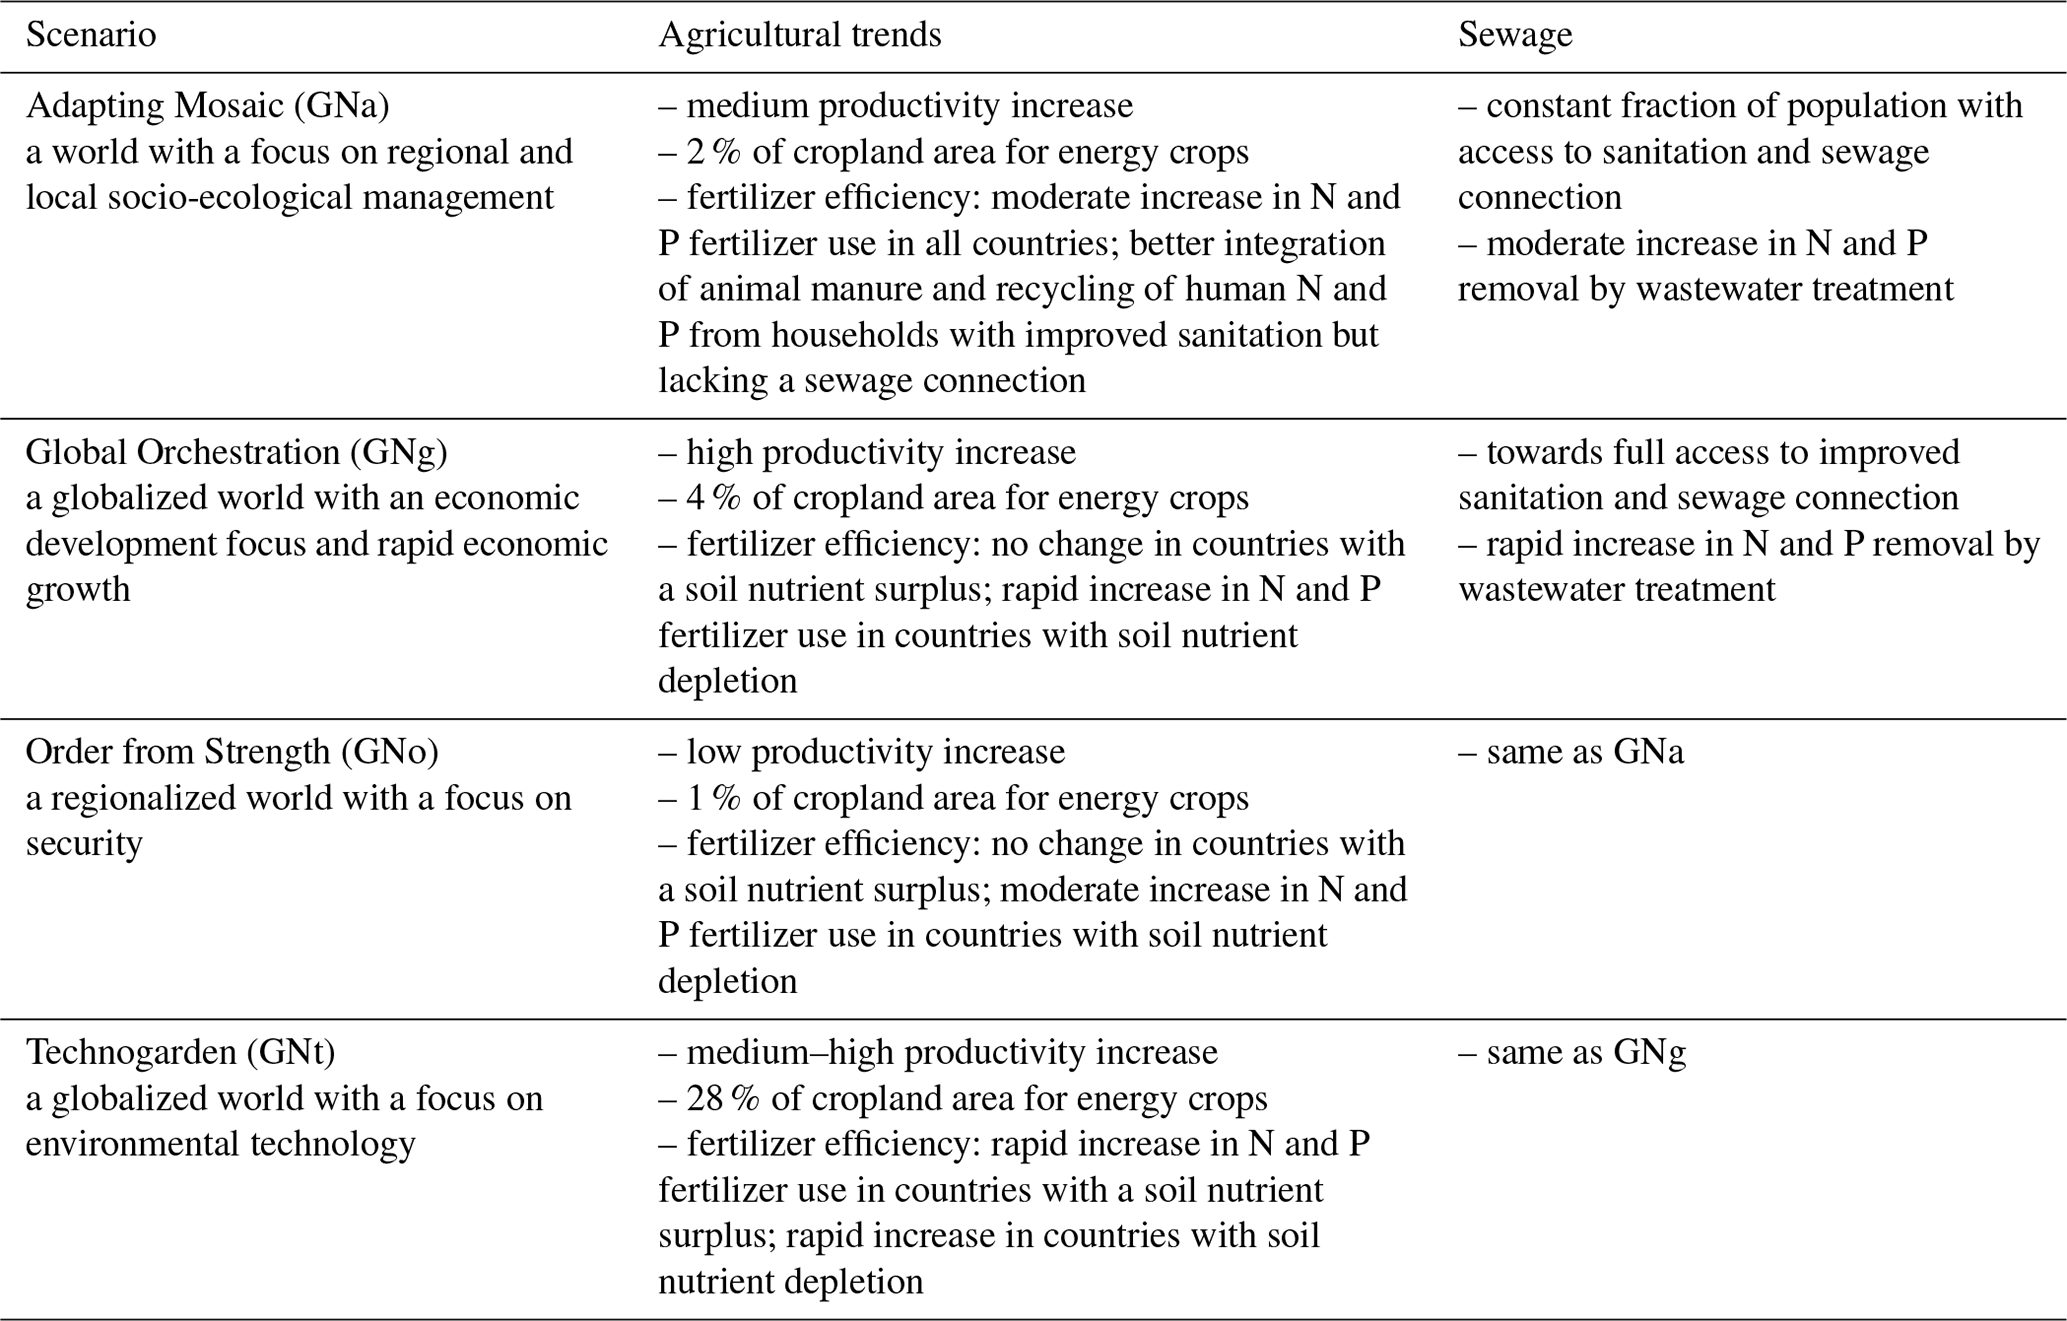
The riverine influx includes carbon, nitrogen, and phosphorus, each in dissolved inorganic, dissolved organic, and particulate forms, as well as TA, dissolved silicon, and iron (Fe). Except for DIC, TA, and Fe, all data are provided by the NEWS 2 model (Mayorga et al., 2010), which is a hybrid of empirical, statistical, and mechanistic model components that simulate steady-state annual riverine fluxes as a function of natural processes and anthropogenic influences. The NEWS 2 data product contains historical (years 1970 and 2000) and future (years 2030 and 2050) estimates of riverine fluxes of carbon and nutrients. The future products are developed based on four Millennium Ecosystem Assessment scenarios (Alcamo et al., 2006): Global Orchestration (GNg), Order from Strength (GNo), Technogarden (GNt), and Adapting Mosaic (GNa). These scenarios represent different focuses of future society on, e.g., globalization or regionalization, reactive or proactive environmental management and their respective influences on the efficiency of nutrient use in agriculture, nutrient release from sewage, and total crop and livestock production along with others (see Table 1 for a brief summary; Seitzinger et al., 2010). The NEWS 2 riverine dataset has been calibrated and assessed against measured yields (Mayorga et al., 2010) and has been widely used and evaluated for different river estuaries (van der Struijk and Kroeze, 2010; Terhaar et al., 2019; Tivig et al., 2021). For example, van der Struijk and Kroeze (2010) compared the NEWS 2 nutrient yields to observed values for South American rivers and indicated that the NEWS 2 models in general perform reasonably well for South American rivers with the variations in yields among rivers described well, although the model performs better for some rivers such as the Amazon than for others. We have compared DIN and dissolved organic nitrogen (DON) from NEWS 2 with measured data from PARTNERS Project (Holmes et al., 2012) for the six largest Arctic rivers around the year 2000 (Table C1). The NEWS 2 dataset compares fairly well with the measured data, especially for the Eurasian Arctic rivers with 3.5 %–28.6 % deviation in DIN and 7.3 %–34.8 % in DON, while the discrepancy is larger in the Canadian–Alaska Arctic rivers (i.e., Yukon and Mackenzie rivers) with up to 80.8 % and 100 % deviation in DIN and DON, respectively.
Table 1Brief introduction to future scenarios for river nutrient export used in Global NEWS 2 (Seitzinger et al., 2010).
The DIC and TA fluxes, provided by Hartmann (2009), are produced from a high-resolution model for global CO2 consumption by chemical weathering and are aggregated within catchment basins defined by the NEWS 2 study for each river. The riverine Fe flux is calculated as a proportion of a global total input of 1.45 Tg yr−1 (Chester, 1990), weighted by the water runoff of each river. Only 1 % of the riverine Fe is added to the oceanic dissolved Fe, under the assumption that up to 99 % of the gross fluvial dissolved Fe is removed during estuarine mixing (Boyle et al., 1977; Figuères et al., 1978; Sholkovitz and Copland, 1981; Shiller and Boyle, 1991).
At the river mouths, all fluxes are interpolated to the ocean grid in the same way as the freshwater runoff, which is distributed as a function of river mouth distance with an e-folding length scale of 1000 km and cutoff of 300 km.
In HAMOCCNorESM1, there is one dissolved organic pool (DOM) and one particulate organic pool (DET, detritus). First, we calculate the riverine organic ratios for both dissolved and particulate forms and then add the least abundant species (scaled by the Redfield ratio) to the DOM and DET pools, respectively (see equations below).
POP and PON denote particulate organic phosphorus and particulate organic nitrogen, respectively. The excess budget from the remaining two species both in dissolved and in particulate forms is assumed to be directly remineralized into the inorganic form and added to the corresponding dissolved inorganic pools (i.e., DIP, DIN, and DIC) in the ocean.
2.4 Experimental design
The fully coupled NorESM model is spun up for 900 years with external forcings fixed at preindustrial, year 1850 levels prior to our experiments (Tjiputra et al., 2013). The atmospheric CO2 mixing ratio is set to 284.7 ppm during the spin-up. Nutrients and oxygen concentrations in the ocean are initialized with the World Ocean Atlas dataset (Garcia et al., 2013a, b). Initial DIC and TA fields are taken from the Global Data Analysis Project (Key et al., 2004). After 900 years, the ocean physical and biogeochemical tracer distributions reach quasi-equilibrium states. We extended the spin-up for another 200 years with riverine input for each experiment (except for the reference run) and then performed a set of transient climate simulations for the industrial era and the 21st century (1850–2100). The simulations use external climate forcings that follow the CMIP5 protocol (Taylor et al., 2011). For the historical period (1850–2005), observed time-varying solar radiation, atmospheric greenhouse gas concentrations (including CO2), and natural and anthropogenic aerosols are prescribed. For the future period (2006–2100), RCP 4.5 (van Vuuren et al., 2011) is applied. Here, we consider RCP 4.5 as the representative future scenario following the CO2 emission rate based on the submitted Intended Nationally Determined Contributions, which projects a median warming of 2.6–3.1∘C by 2100 (Rogelj et al., 2016). The riverine input configurations employed in this study are summarized in Fig. 1. The evolution of global total fluxes of each nutrient and carbon species is shown in Fig. 2. The experiment configurations are described as follows.
-
REF: reference run. Riverine nutrient and carbon supply is deactivated.
-
FIX and FIXnoc: fixed at recent-past level. FIX uses the constant riverine nutrient and carbon supply, representative of the year 1970 as provided by NEWS 2, that is applied to the model throughout the whole experiment duration. FIXnoc is like FIX but only with nutrient supply – all carbon (DIC, DOC, POC) and TA fluxes are deactivated.
-
RUN: coupled to simulated freshwater runoff. Riverine nutrient and carbon supply representative of the year 1970 is linearly scaled with the online simulated freshwater runoff divided by the climatological mean runoff over 1960–1979 of the model. Thus, the inputs follow the seasonality and long-term trend of the simulated runoff. We assume that the nutrient and carbon concentrations in the rivers are constant at the level of 1970, but the fluxes fluctuate with freshwater runoff.
-
GNS: four different transient inputs following future projections of NEWS 2. A constant riverine nutrient and carbon supply representative of the year 1970 has been applied from the year 1850 to 1970. Between years 1970, 2000, 2030, and 2050 the annual riverine supply is linearly interpolated. From the year 2050 to 2100 the annual riverine supply is linearly extrapolated. From the year 2000, riverine supplies of the four NEWS 2 future scenarios (GNa, GNg, GNo, and GNt) are applied.
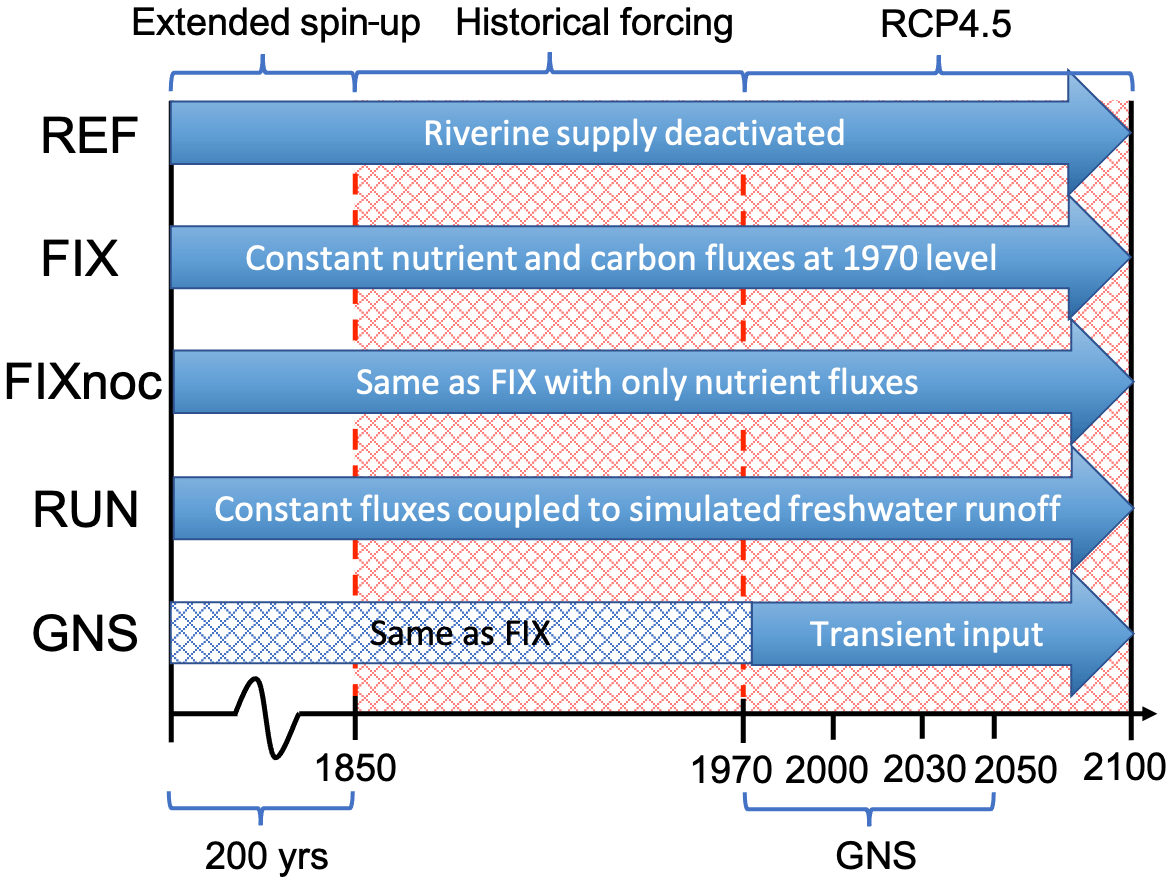
Figure 1Schematic illustration of the spin-up and integration procedure following the experimental design described in Sect. 2.4.
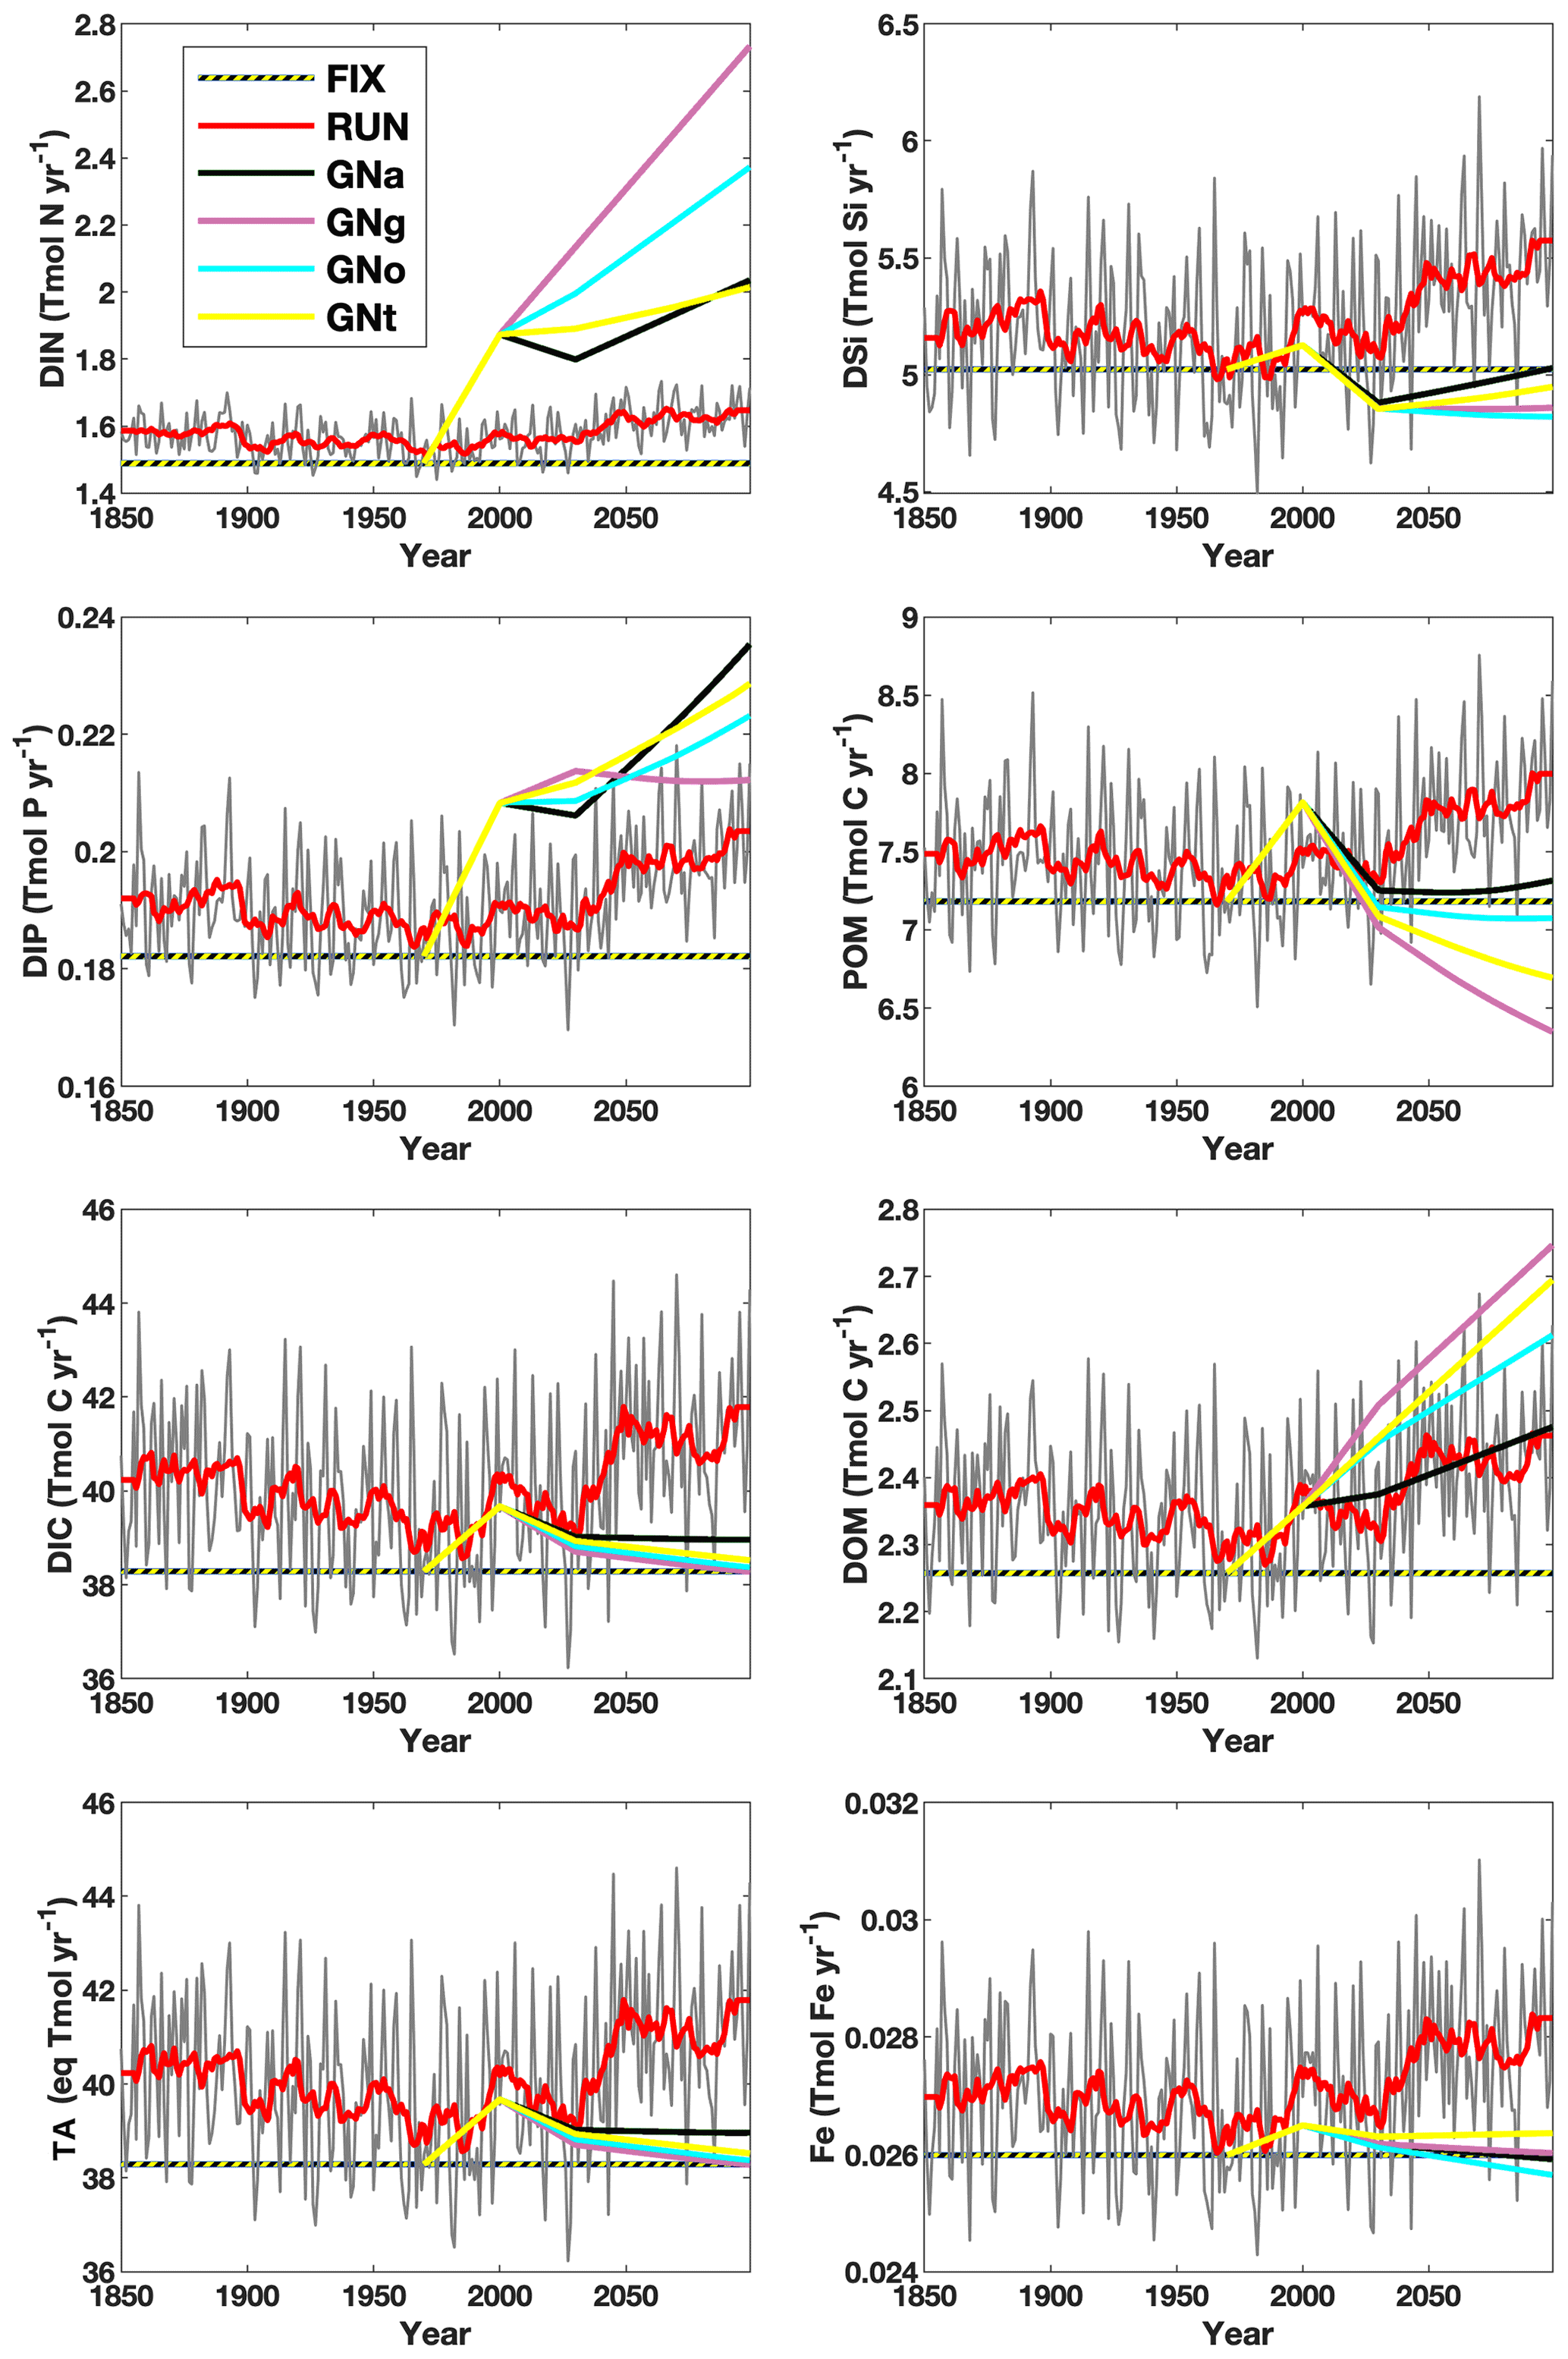
Figure 2Time series of global riverine fluxes of nutrients and carbon to the ocean according to the configuration of six model experiments (FIX, RUN, GNa, GNg, GNo, and GNt). The thin grey and thick red curves are the annual and 11-year running mean fluxes, respectively, in RUN. DIN: dissolved inorganic nitrogen; DIP: dissolved inorganic phosphorus; DIC: dissolved inorganic carbon; TA: alkalinity; DSi: dissolved silicon; POM: particulate organic matter; DOM: dissolved organic matter; Fe: dissolved iron.
By comparing FIX versus REF, we assess how the presence of riverine inputs affect the contemporary marine PP and C uptake representation and also the projected changes. By comparing RUN versus FIX, we assess the potential effects of riverine nutrient and carbon long-term trends associated with an intensifying global hydrological cycle on marine PP and C uptake. RUN represents a first step towards coupling riverine nutrient and carbon fluxes to the simulated hydrological cycle. By comparing the GNS configurations versus FIX, we assess how plausible, realistic future evolutions in riverine nutrient and carbon fluxes may impact marine PP and C uptake projections. We span the uncertainty in future riverine nutrient and carbon fluxes by considering multiple NEWS 2 scenarios.
3.1 Effect of including riverine inputs on contemporary marine PP and C uptake
We start with assessing how the inclusion of riverine nutrients and carbon affects the contemporary representation of the global marine PP and C uptake in our model by comparing the annual mean output over the years 2003–2012 between the REF and FIX experiments. We also compare it with satellite- and observation-based estimates to see if the inclusion of riverine nutrients and carbon improves the marine PP and C uptake representation in our model. The spatially integrated values presented in this and the following sections are summarized and supplemented with statistical robustness information in Tables B1 and B2 in Appendix B.
The annual net primary production (PP) is 40.1 and 43.0 Pg C yr−1 in the REF and FIX experiments, respectively. The increase in PP in FIX occurs along continental margins (where the seafloor is shallower than 300 m) and also in the North Atlantic region (0–65∘ N, 0–90∘ W), accounting for 15.4 % and 24.9 % of the global total increase, respectively (Fig. 3c). The simulated global total PP in both REF and FIX is lower than the satellite-based model estimates, including the Vertically Generalized Production Model (VGPM), the Eppley VGPM, and the Carbon-based Production Model (CbPM) over the same time period (data source: http://www.science.oregonstate.edu/ocean.productivity, last access: 5 January 2023), ranging from 55 to 61 Pg C yr−1 (Behrenfeld and Falkowski, 1997; Westberry et al., 2008). Although the total PP in FIX is still considerably lower than the satellite-based estimates, the inclusion of riverine nutrients and carbon does slightly improve the distribution of PP especially on continental margins (Fig. 3), according to our area-weighted root mean square error (RMSE) analysis. The RMSE of REF relative to mean observational estimates (mentioned above) averages 10.7 globally, while the value of FIX is 10.3 , which is reduced by 3.7 %. For the continental margins, the RMSE is reduced by 5.5 % from 29.0 in REF to 27.4 in FIX.
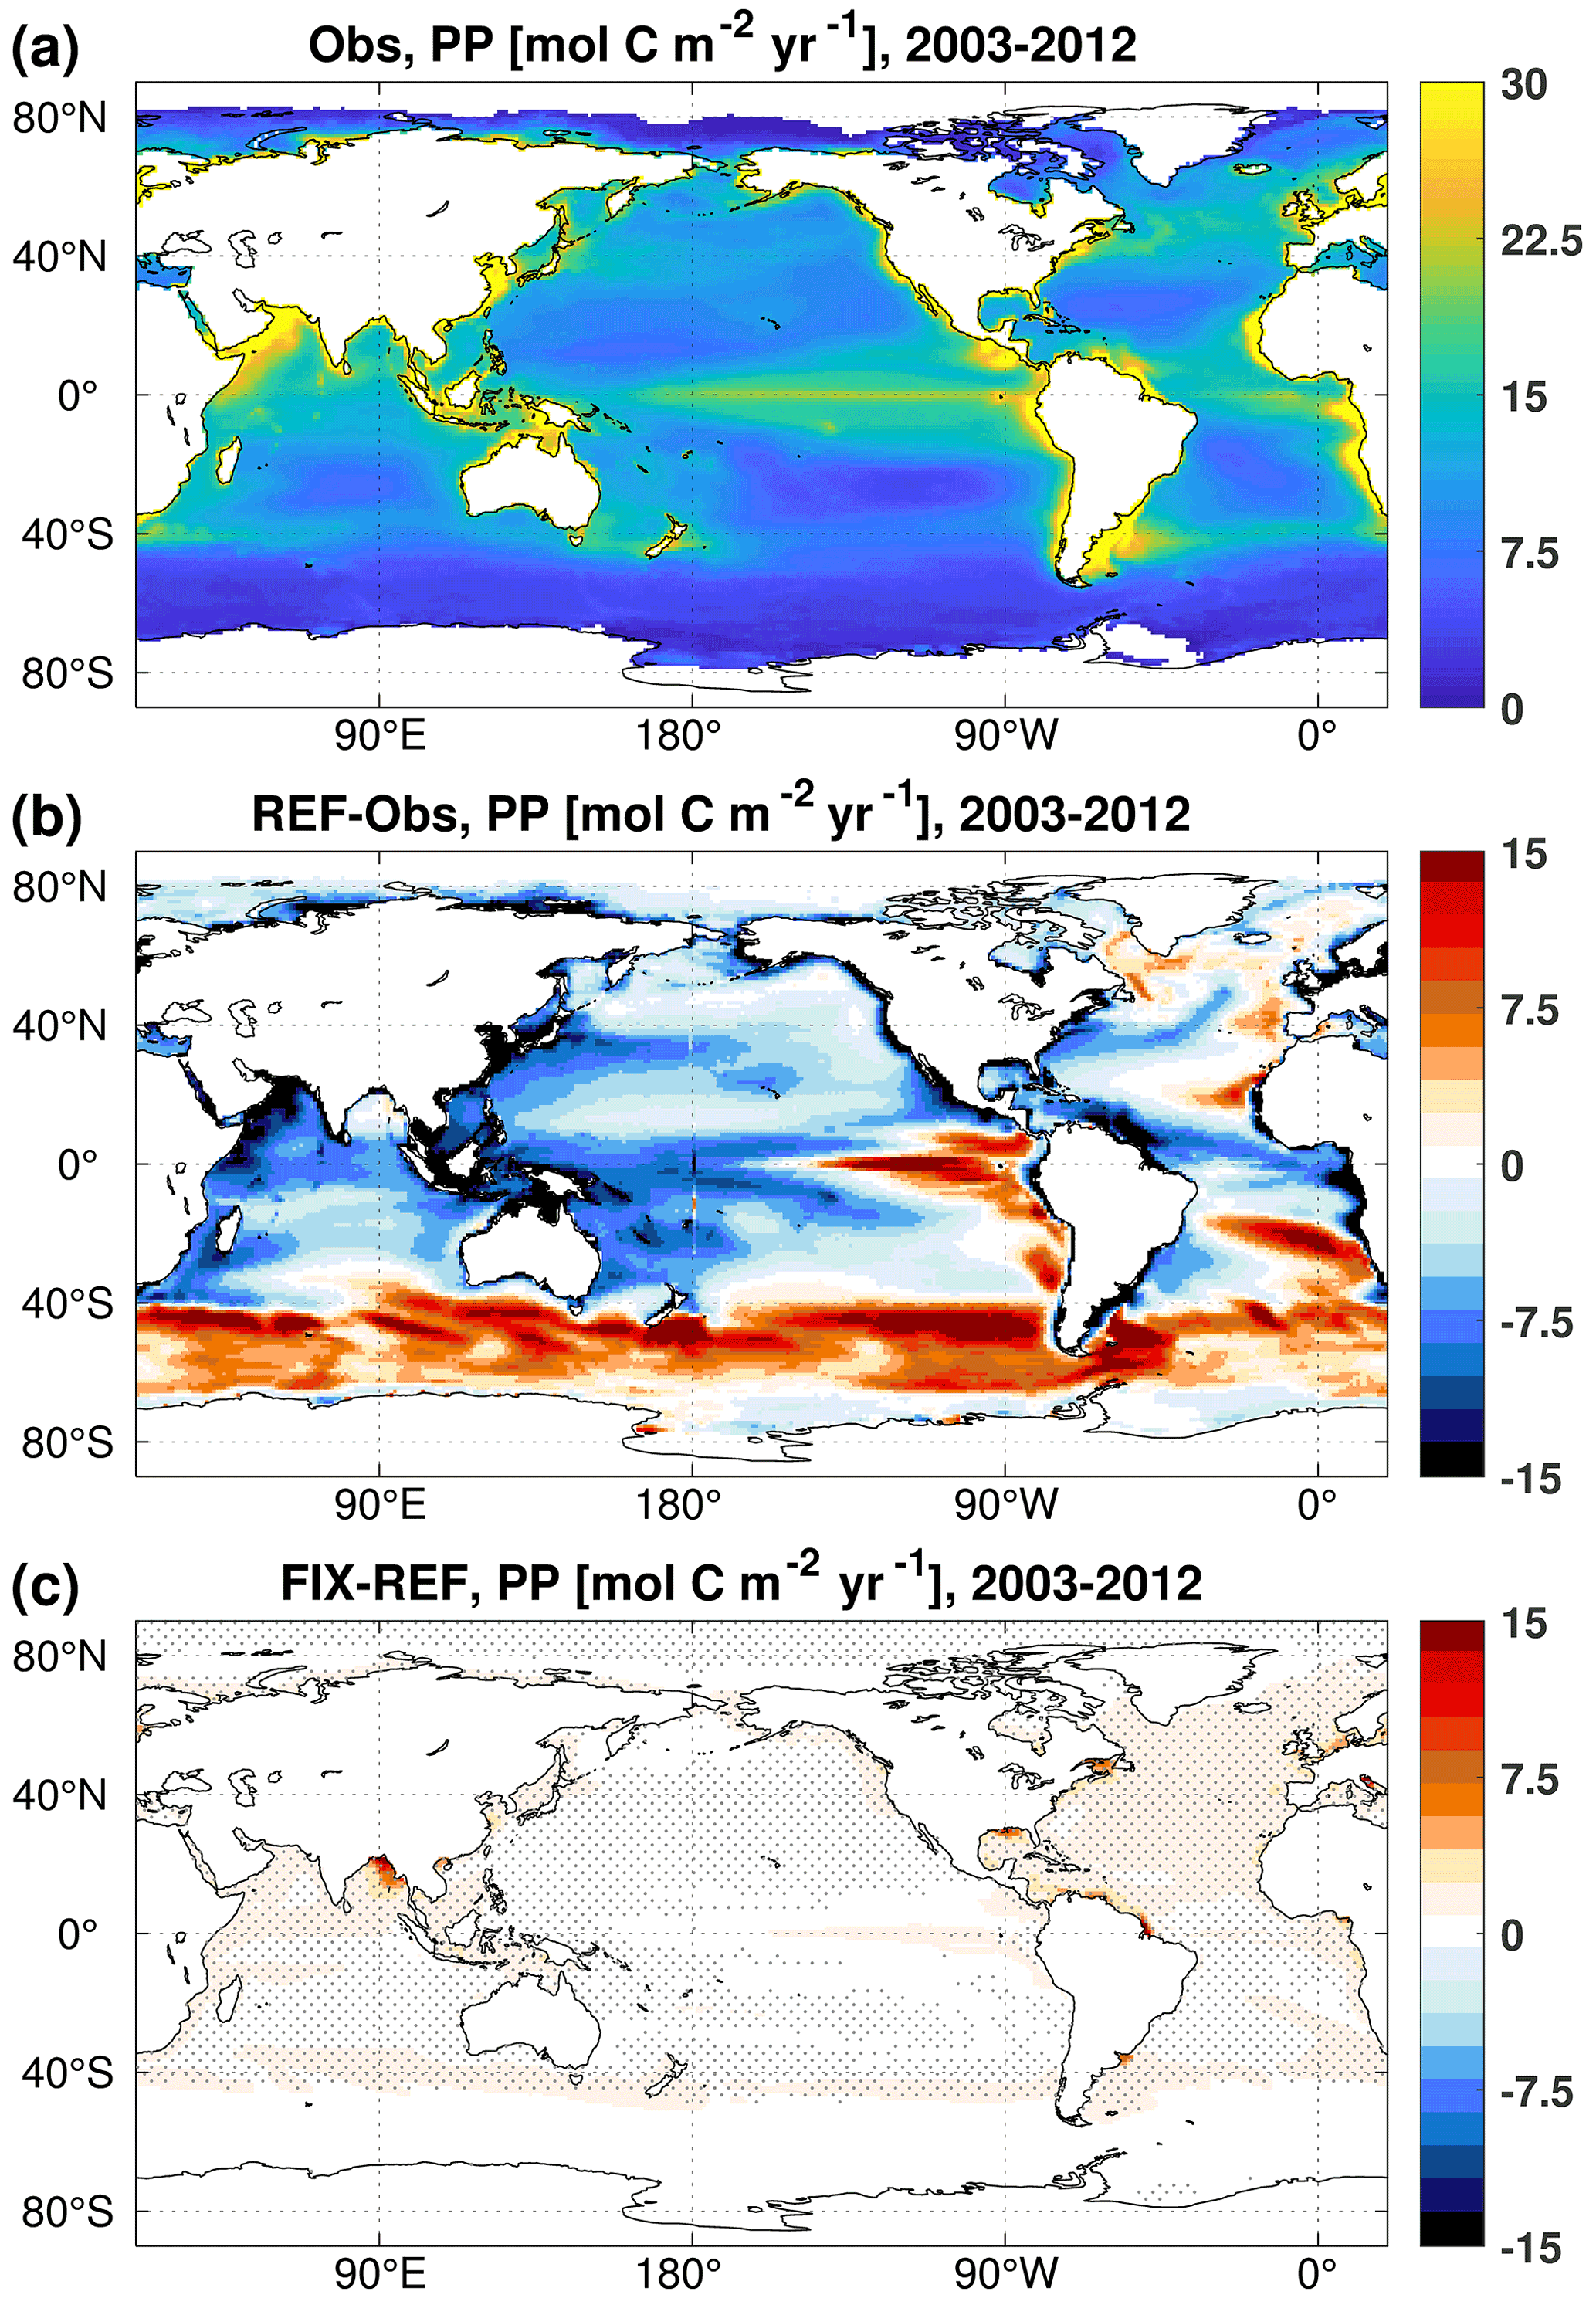
Figure 3Vertically integrated primary production averaged over the 2003–2012 period of (a) the mean of three satellite-based climatologies derived from MODIS retrievals, (b) the difference between REF and satellite-based estimates, and (c) the difference between FIX and REF. In panel (c), only significant differences are plotted, and dots denote areas where the signal is larger than the standard deviation of the absolute field (see details in Appendix B).
The ocean annual net uptake of CO2 is 2.8 and 2.9 Pg C yr−1 in REF and FIX, respectively, with a FIX−REF difference of 0.1 Pg C yr−1 equivalent to a 3.1 % relative change, which is statistically significant (see Table B2). In FIX the ocean carbon uptake is generally enhanced everywhere except for the upwelling regions of the Southern Ocean and in the subpolar North Atlantic between approximately 50–65∘ N and 60–10∘ W (Fig. 4c). To isolate the impact of riverine nutrient input from carbon input, an additional experiment (FIXnoc) was conducted, in which the nutrient fluxes are implemented the same as in FIX, while all carbon (DIC, DOC, POC) and TA fluxes are eliminated. As shown in Fig. 4d, the nutrient input results in more CO2 uptake not only at large river estuaries but also in the subtropical gyres due to enhanced primary production. In the subpolar North Atlantic and in the Southern Ocean upwelling region, the addition of riverine nutrients leads to enhanced outgassing. The riverine carbon input, on the other hand, leads to CO2 outgassing mainly at river estuaries (Fig. 4e) but also in a band along the gulf stream extending into the North Atlantic, where it accounts for 18.1 % of the CO2 outgassing in the subpolar region (50–65∘ N, 60–10∘ W). Along the continental margins the nutrient input increases the CO2 uptake, while the carbon input has an opposite effect which induces more outgassing. The net effect of both nutrient and carbon inputs shows that the uptake of CO2 dominates over the outgassing along the continental margins and in subtropical gyres (Fig. 4c). Compared to the observation-based estimates of Landschützer et al. (2017) (Fig. 4a) and according to our RMSE analysis, the inclusion of riverine nutrients and carbon does not improve the simulated air–sea CO2 fluxes globally. The RMSE of FIX relative to observational estimates averages to 0.83 globally, which does not differ much from the value of REF (0.84 ). However, there is a distinguishable improvement in the distribution of air–sea CO2 fluxes in the subpolar North Atlantic (RMSE is reduced by 8.2 %, from 0.73 in REF to 0.67 in FIX), with slight degradations in some other regions (Fig. 4c).

Figure 4Annual mean air–sea CO2 fluxes over the 2003–2012 period of (a) the observation-based estimates of Landschützer et al. (2017), (b) REF, (c) the difference between FIX and REF, (d) the difference between FIXnoc and REF, and (e) the difference between FIX and FIXnoc. Contour lines in (c) are the differences between REF and Obs, purple lines (0.6 ) indicate where REF overestimates C uptake compared to Obs, and grey lines (−0.6 ) indicate the opposite. In panels (c–e), only significant differences are plotted, and dots denote areas where the signal is larger than the standard deviation of the absolute field (see details in Appendix B).
3.2 Effect of including contemporary riverine inputs on projections of marine PP and C uptake
We now address how the inclusion of riverine nutrient and carbon fluxes affects projections of marine PP and C uptake by comparing the average output between a future period (2050–2099) and a historical period (1950–1999) of FIX versus REF.
In both experiments the projections of global PP averaged over the years 2050–2099 are lower than their corresponding 1950–1999 averages (Fig. 5a). However, when the riverine input of nutrients and carbon is included, the projected decrease in global PP is mitigated from −2.2 Pg C yr−1 in REF to −1.9 Pg C yr−1 in FIX (by 13.6 %). Spatially, the decrease in PP in REF occurs largely in upwelling regions such as the tropical eastern Pacific and tropical Atlantic, as well as along a latitude band around 40∘ S (Fig. 6a). The riverine inputs alleviate the projected PP decrease in those regions (see further discussion in Sect. 4.2) and reinforce the projected PP increase in high latitudes (Fig. 6b and c). The projections of PP in the Arctic Ocean show significant increases in both REF and FIX. Climate change alone (REF, without riverine inputs) almost doubles the simulated PP in the Arctic from 0.08 Pg C yr−1 during 1950–1999 to 0.15 Pg C yr−1 in 2050–2099 (Fig. 5b), likely as a consequence of sea ice retreat. FIX, which includes riverine inputs, exhibits a slightly larger (but significant; see Table B1) absolute Arctic PP increase (from 0.10 to 0.18 Pg C yr−1) in its future projection than REF.
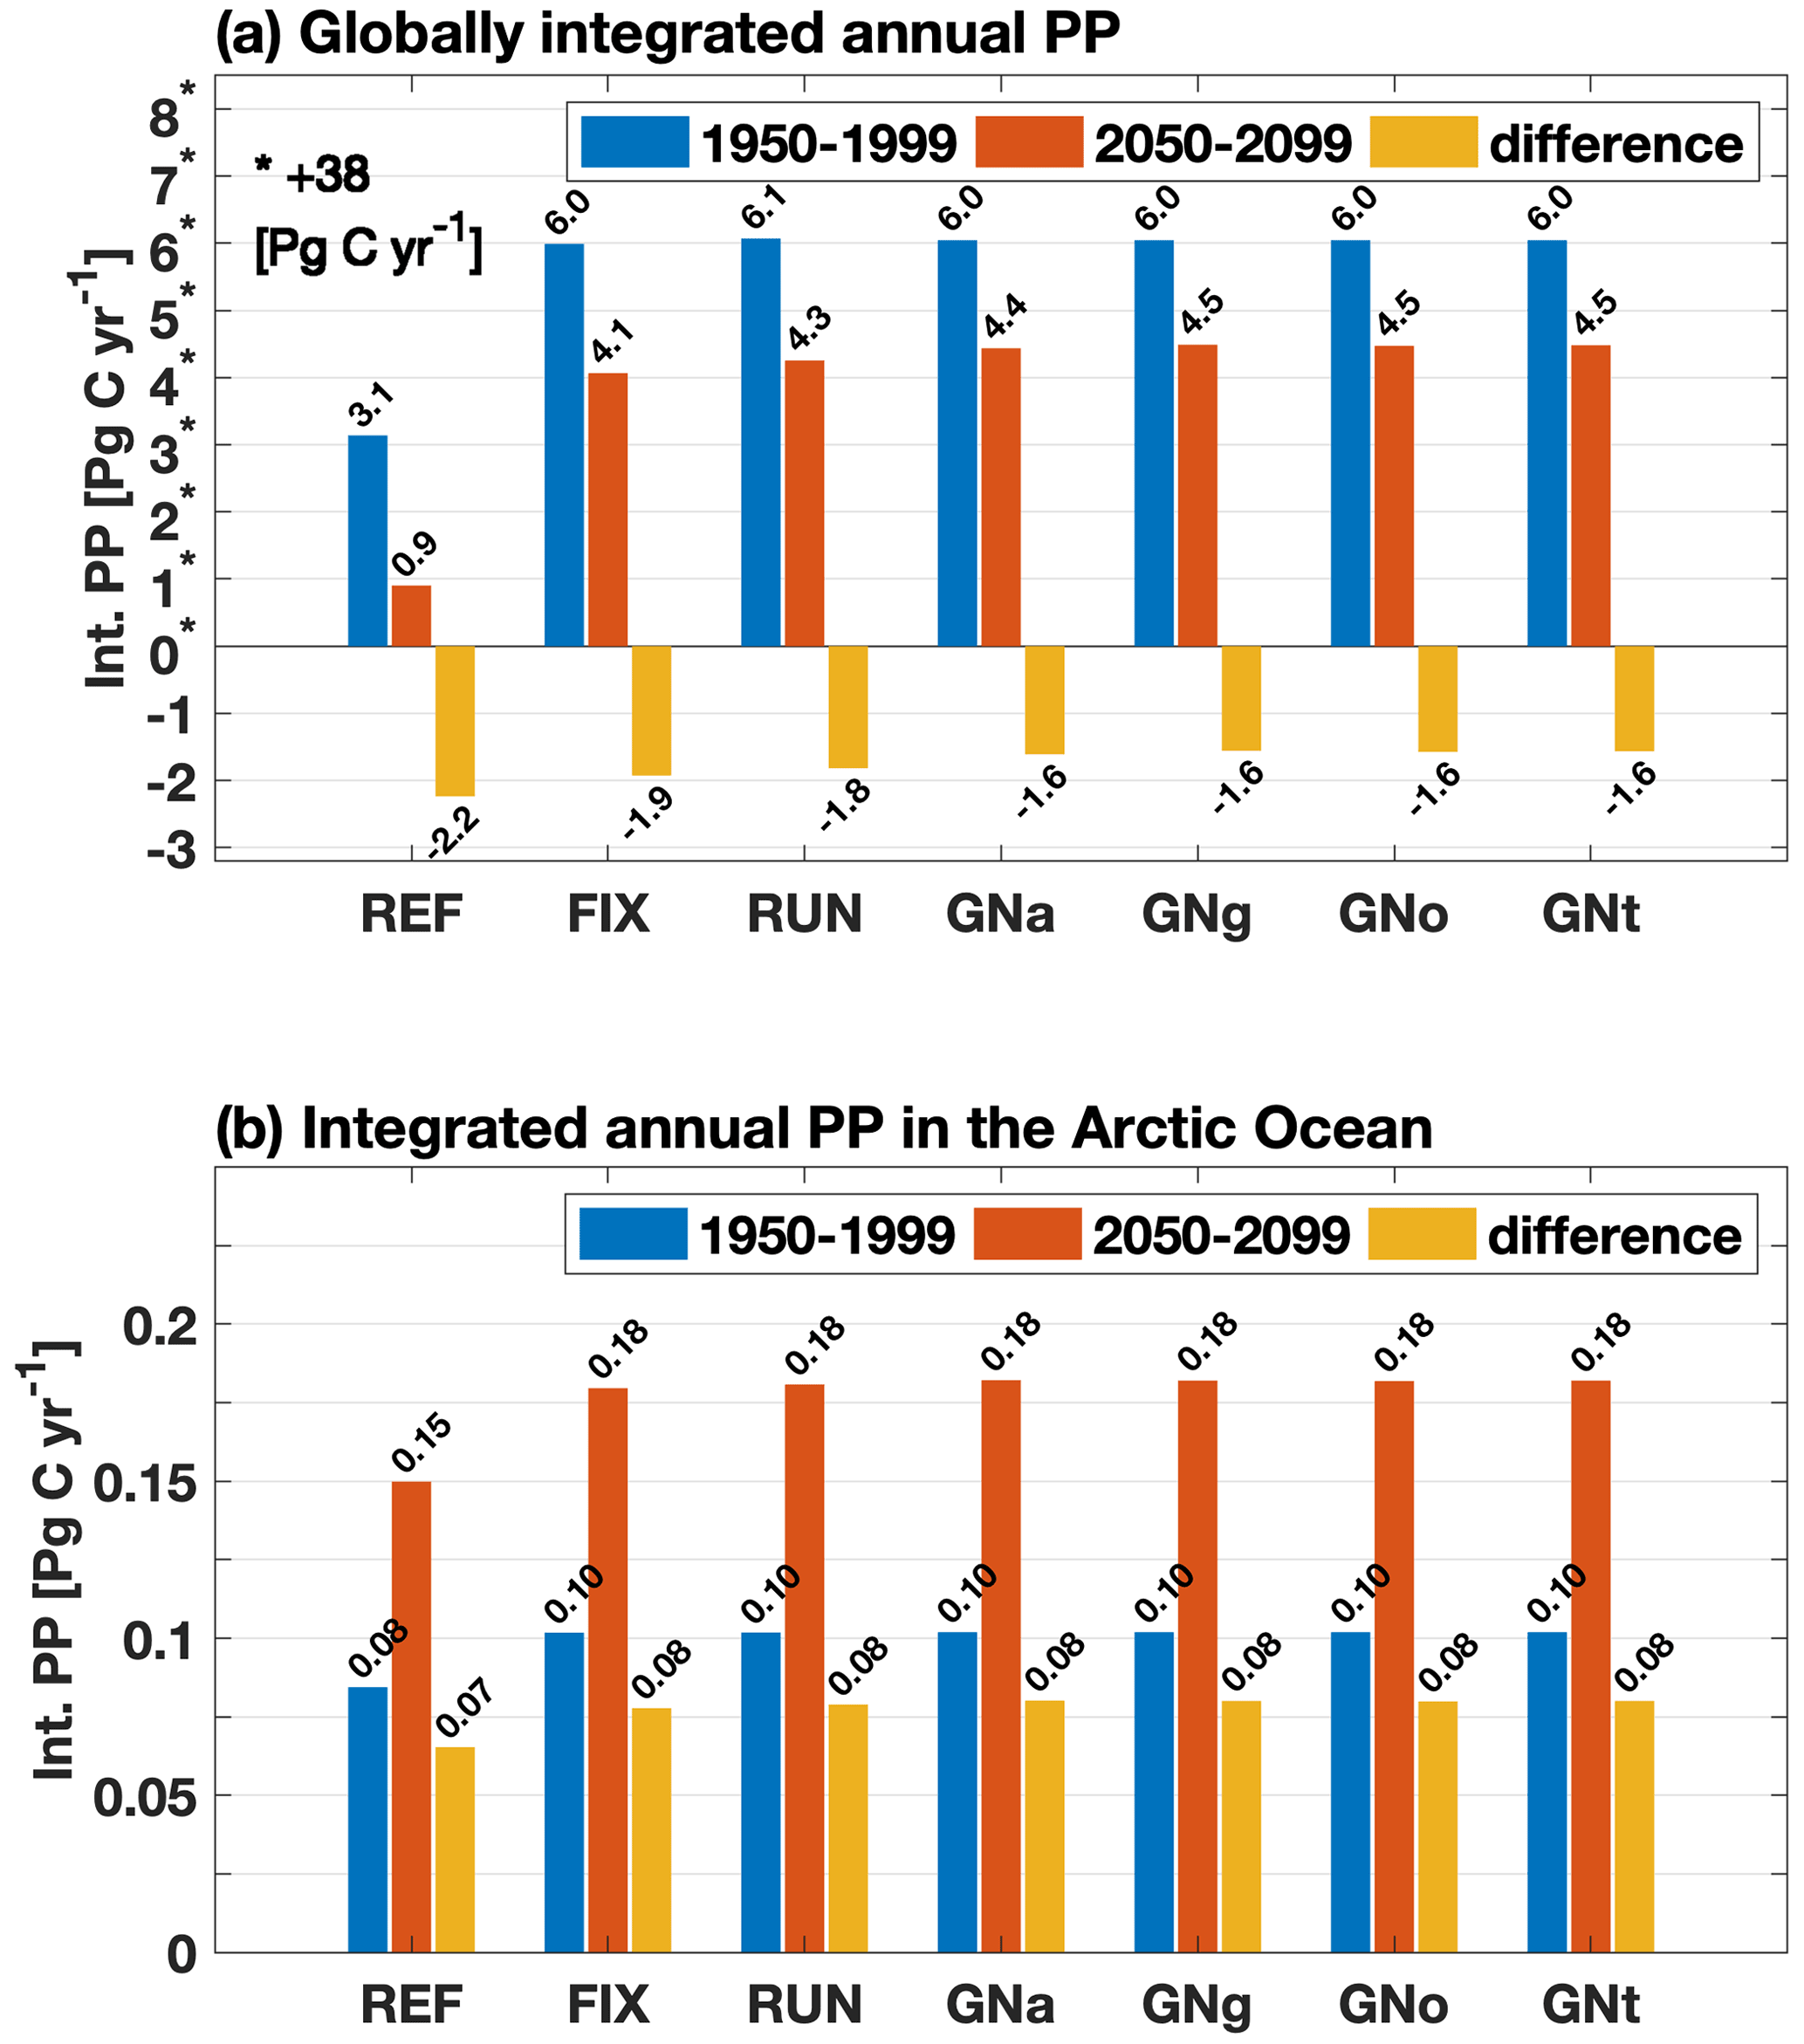
Figure 5(a) Globally integrated annual mean primary production over 1950–1999 (blue) and over 2050–2099 (red) and the differences between these two time periods (yellow) for all experiments; note that the positive numbers on the y axis (marked with stars) are scaled by minus 38 Pg C yr−1 so that the negative numbers are visible; (b) same as (a) but for the Arctic Ocean (ocean area north of the Bering Strait on the Pacific side and north of 70∘ N on the Atlantic side) for the same time periods as in (a).
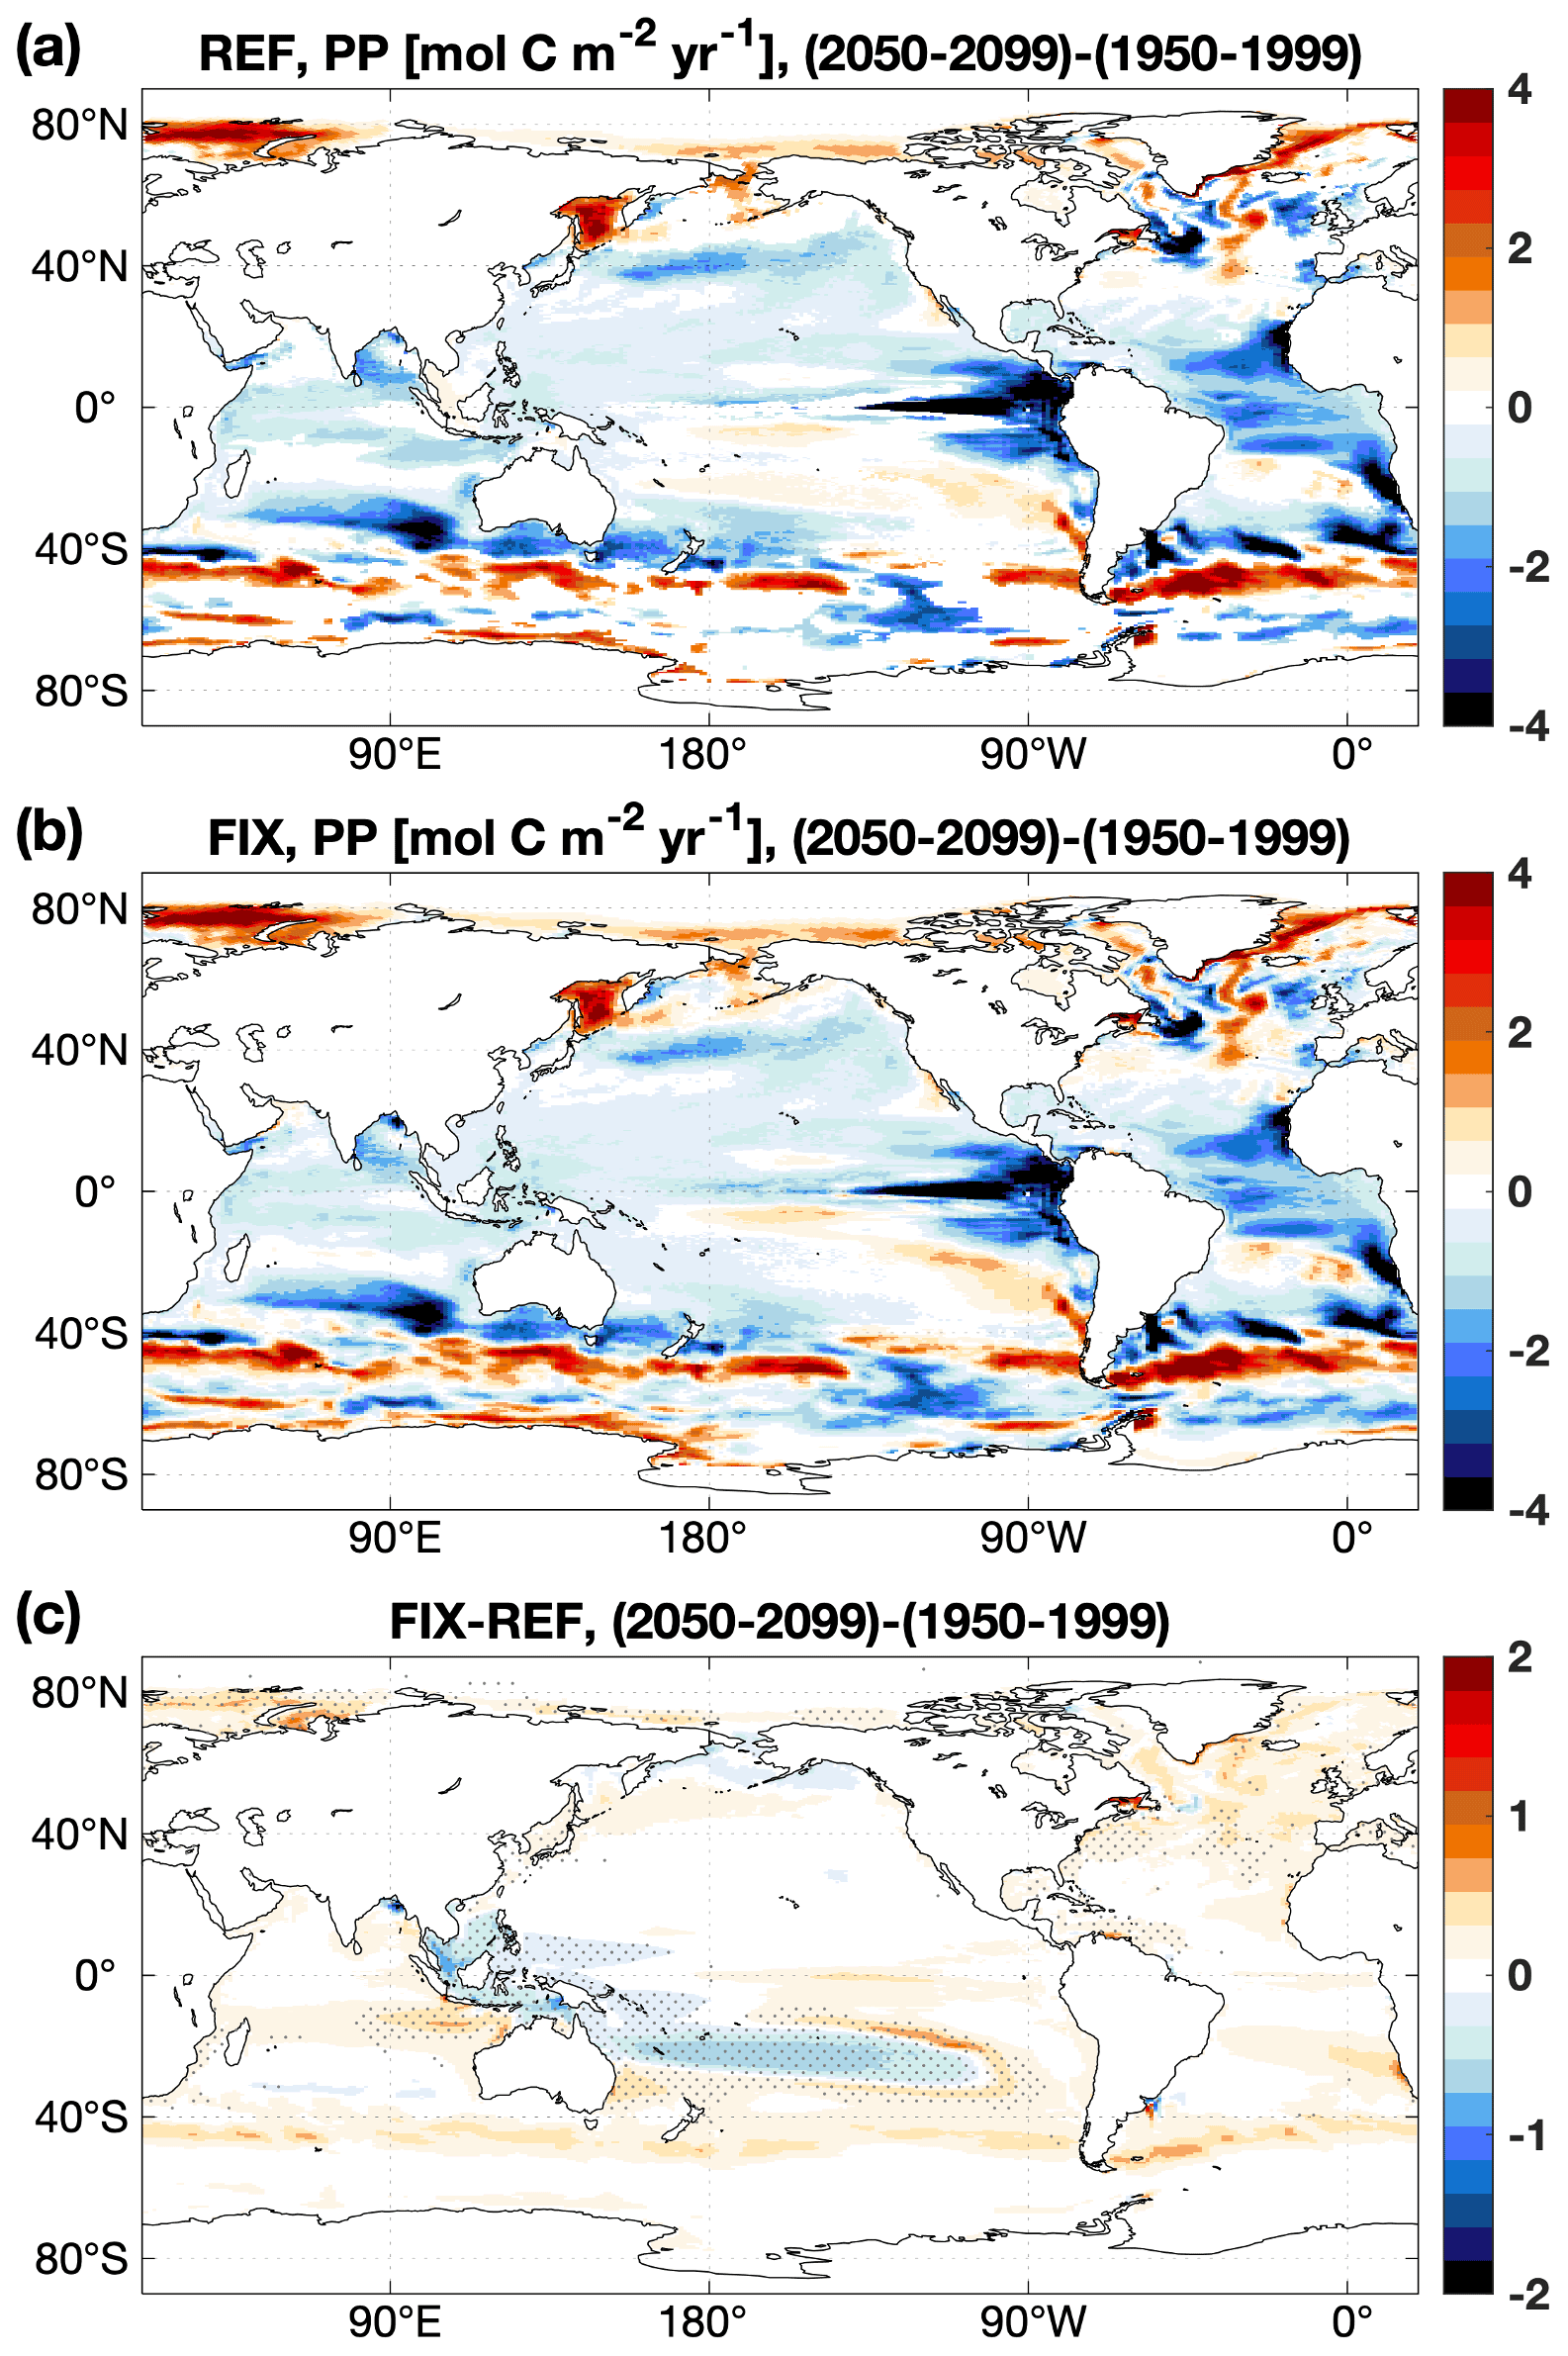
Figure 6The difference in vertically integrated primary production between 2050–2099 and 1950–1999 time periods in (a) REF, (b) FIX, and (c) the difference between (b) and (a). In panel (c), only significant differences are plotted, and dots denote areas where the signal is larger than the standard deviation of the absolute field (see details in Appendix B).
For the global net uptake rate of CO2, both experiments (REF and FIX) project a significant increase under RCP 4.5 (Fig. 7a). The inclusion of riverine inputs leads to a slightly higher (but significant; see Table B2) (2.4 %) projected increase of 1.28 Pg C yr−1 in FIX compared to 1.25 Pg C yr−1 in REF. The increase rate of CO2 uptake in the Arctic closely follows the global trend (Fig. 7b). Spatially, there is a widespread simulated increase in ocean uptake of CO2 under future climate change except in the subtropical gyres (Fig. 8a). Riverine nutrient input slightly increases the projected carbon uptake at large river estuaries, while it decreases the projected uptake in the subpolar North Atlantic (Fig. 8d).
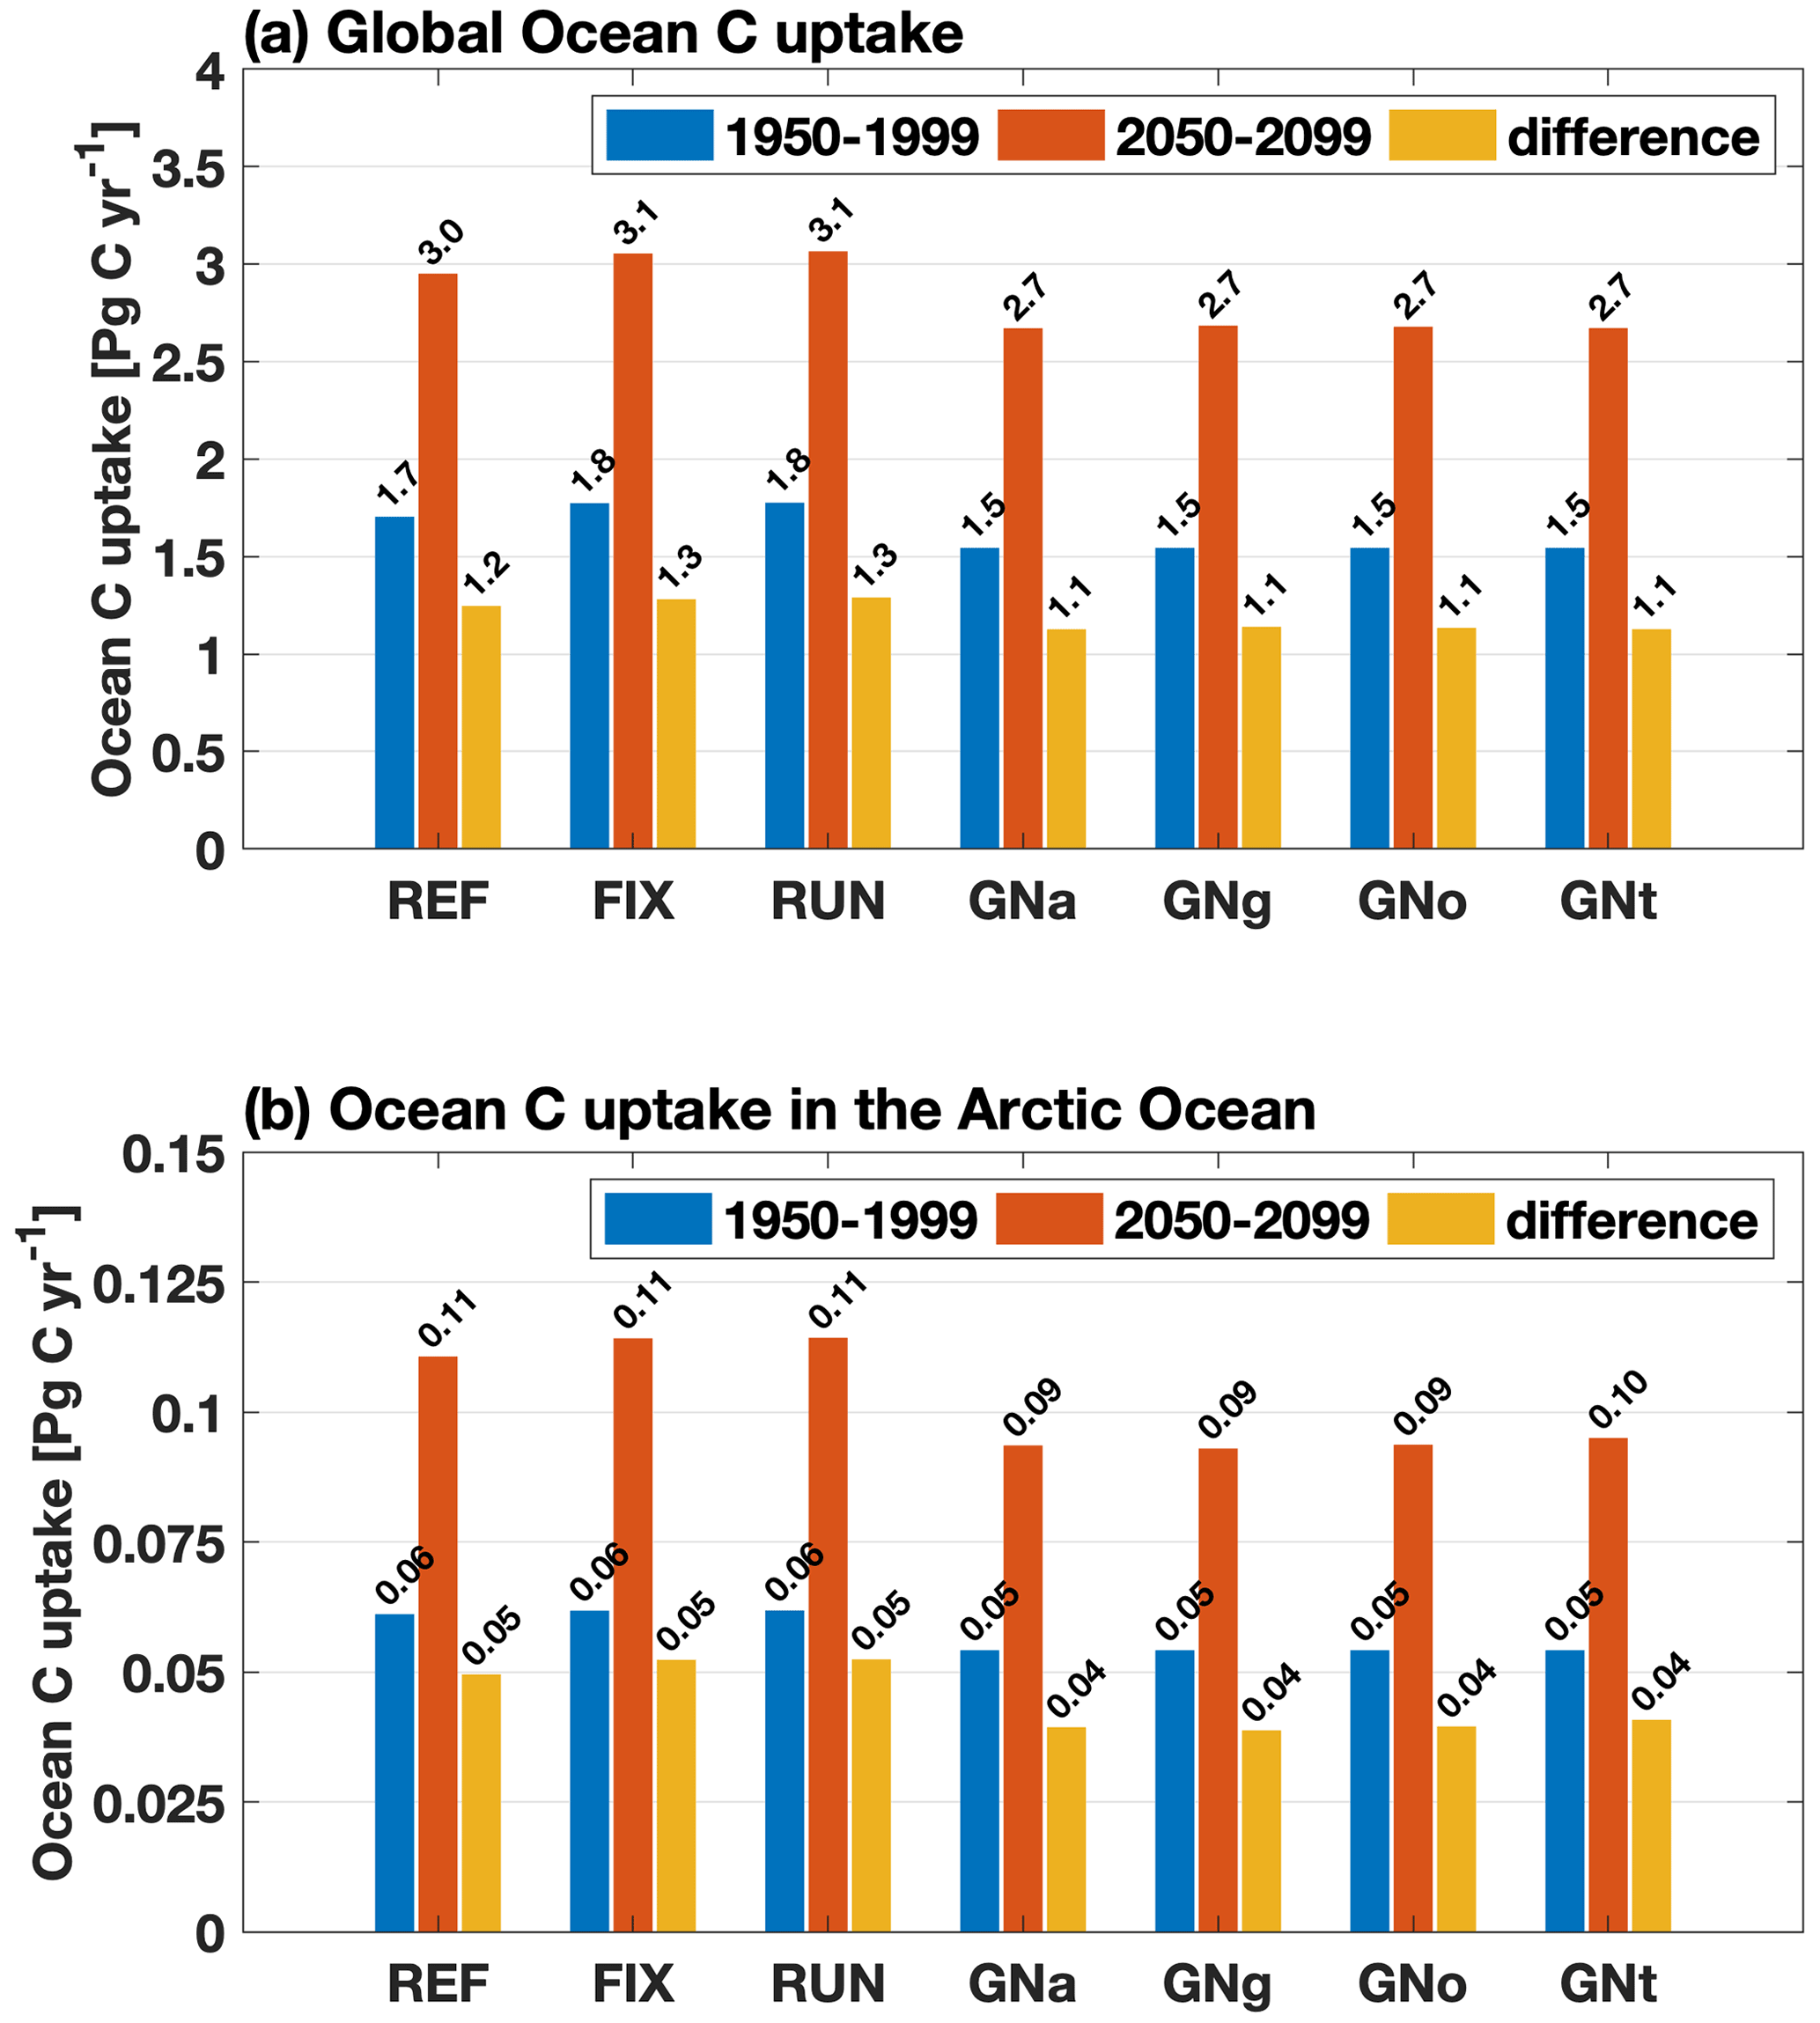
Figure 7(a) Globally integrated annual mean ocean carbon uptake over 1950–1999 (blue) and over 2050–2099 (red) and the differences between these two time periods (yellow) for all experiments; (b) same as (a) but for the Arctic Ocean (ocean area north of the Bering Strait on the Pacific side and north of 70∘ N on the Atlantic side) for the same time periods as in (a).
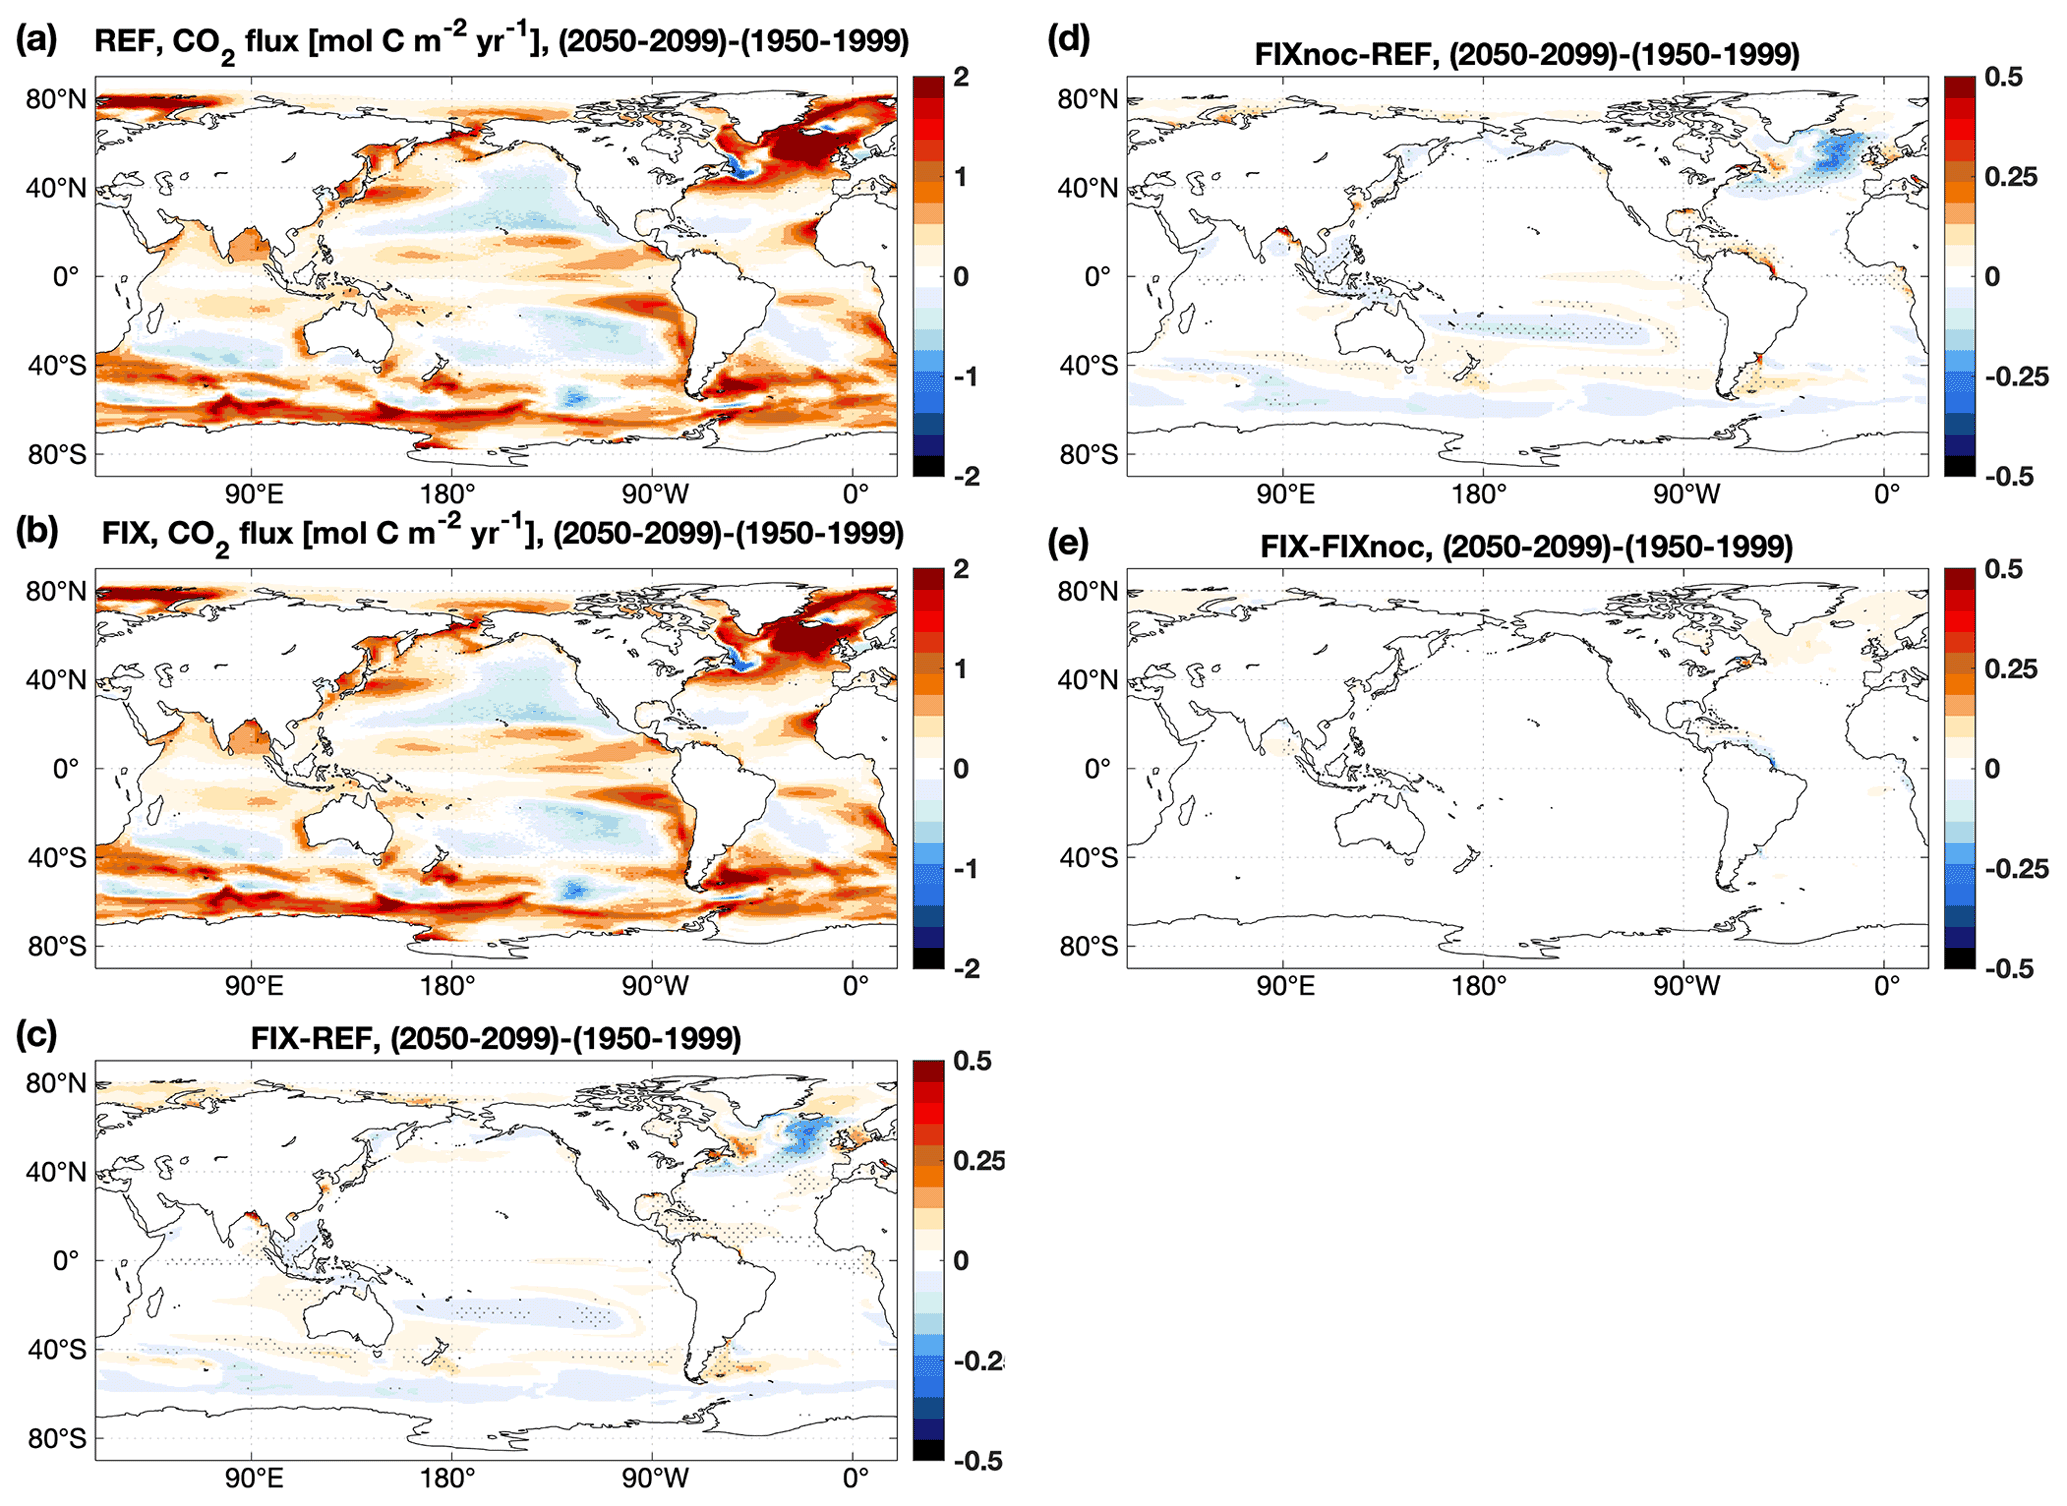
Figure 8Differences in annual mean air–sea CO2 fluxes () between the 2050–2099 and the 1950–1999 periods in (a) REF and (b) FIX, (c) the difference between FIX and REF, (d) the difference between FIXnoc and REF, and (e) the difference between FIX and FIXnoc. In panels (c–e), only significant differences are plotted, and dots denote areas where the signal is larger than the standard deviation of the absolute field (see details in Appendix B).
3.3 Effect of future changes in riverine inputs on marine PP and C uptake projections
Finally, we address how future changes in riverine fluxes of nutrients and carbon affect marine PP and C uptake by comparing the projected changes for the time period 2050–2099 relative to 1950–1999 among FIX, RUN, and the four GNS experiments.
The future projected decrease in PP in the four GNS experiments averages to −1.6 Pg C yr−1, which is less in magnitude compared to FIX (−1.9 Pg C yr−1) and RUN (−1.8 Pg C yr−1) (Fig. 5a). Spatial distributions of projected PP changes in GNS and their respective differences relative to FIX are shown in Fig. 9. The latter occur predominantly on the continental shelf in Southeast Asia, where the future projected increase in riverine nutrient load is the largest in the world in GNS (Seitzinger et al., 2010). Interestingly, the projected increase in PP in Southeast Asia, induced by riverine nutrient inputs in GNS, is of the same order of magnitude as the projected decrease in PP due to future climate change in REF. Thus, in GNS the PP is projected to slightly increase on the continental shelf of Southeast Asia (Fig. 9a–d). The riverine-nutrient-induced PP increase in FIX or RUN is not large enough to compensate for the PP decline due to climate change, since the projected changes in riverine nutrient inputs are not taken into account in FIX or locally underestimated in RUN.

Figure 9(a–d) Projected changes in vertically integrated primary production () in four GNS experiments between the 2050–2099 and the 1950–1999 periods. (e–h) The difference in projected changes in vertically integrated primary production () between each GNS experiment and FIX. In panels (e–h), only significant differences are plotted, and dots denote areas where the signal is larger than the standard deviation of the absolute field (see details in Appendix B).
On the other hand, the future projected global uptake of CO2 in GNS (1.13 Pg C yr−1 in average) is reduced compared to REF (1.25 Pg C yr−1), which shows an opposite change from FIX (1.28 Pg C yr−1) and RUN (1.29 Pg C yr−1). The changes in riverine inputs in GNS emerge along continental margins, especially around large river estuaries (Fig. 10e–h) where the dissolved organic matter (DOM) that is projected to increase in GNS enters the ocean and releases CO2 to the atmosphere (Seitzinger et al., 2010).

Figure 10(a–d) Projected changes in annual mean air–sea CO2 fluxes () in four GNS experiments between the 2050–2099 and the 1950–1999 periods. (e–h) The difference in projected changes in annual mean air–sea CO2 fluxes () between each GNS experiment and FIX. In panels (e–h), only significant differences are plotted, and dots denote areas where the signal is larger than the standard deviation of the absolute field (see details in Appendix B).
Despite the regional differences, there is no significant difference in the projected changes in either globally integrated PP or CO2 uptake among the four GNS experiments in our model (Figs. 5 and 7; see further discussion in Sect. 4.3).
4.1 Projected marine PP and C uptake under climate change
In our model, PP is roughly linearly related to the concentrations of the most limiting nutrient (Nut), light intensity (I), temperature (T), and the available phytoplankton concentration (Phy), i.e., . It is shown in Fig. 6a that under climate change the projected decrease in PP occurs mainly in low and mid-latitudes. Nitrate is the limiting nutrient (in REF) almost everywhere except in the central Indo-Pacific region, in the South Pacific subtropical gyre, and in the Bering Sea and part of the Arctic, where Fe is limiting (Fig. A1). A projected reduction in surface nitrate concentrations (Fig. A2b), which is tightly linked to the upper-ocean warming and increased vertical stratification (Bopp et al., 2001; Behrenfeld et al., 2006; Steinacher et al., 2010; Cabré et al., 2015), contributes to the projected decrease in PP in our model. The simulated global mean PP over 2050–2099 is 38.9 Pg C yr−1 in REF, which is 2.24 Pg C yr−1 lower than the value over 1950–1999. This −5.4 % projected change in PP is comparable with the multi-model mean estimate of projected change of −3.6 % ± 5.7 % in the 2090s relative to the 1990s for RCP 4.5 (Bopp et al., 2013) and sits in the range of 2 %–13 % decrease projected by four ESMs over the 21st century under the Special Report on Emissions Scenarios (SRES) A2 scenario (Steinacher et al., 2010). It is also still within the range of the multi-model mean projected PP change of −1.13 % ± 5.81 % under the CMIP6 Shared Socioeconomic Pathways (SSP) 2-4.5 when comparing mean values in 2080–2099 relative to 1870–1899 (Kwiatkowski et al., 2020), given that the inter-model uncertainties in projected PP have increased in CMIP6 compared to CMIP5 (Tagliabue et al., 2021). In contrast to the global PP, there are considerable increases in the future projected PP in the Arctic in REF (Fig. 5b). In polar regions light and temperature are the primary limiting factors for phytoplankton growth; therefore, PP increases when light and temperature become more favorable owing to sea ice melting under warmer conditions (Sarmiento et al., 2004; Bopp et al., 2005; Doney, 2006; Steinacher et al., 2010). On the other hand, the fresher and warmer surface water increases stratification, prohibiting nutrient upwelling (Vancoppenolle et al., 2013; Fig. A2b), which counteracts the increase in PP.
The ocean annual net uptake of CO2 increases significantly during 2050–2099 compared with the uptake during 1950–1999 in REF (Fig. 7a), which is mainly driven by an increasing difference in air–sea partial pressure of CO2.
4.2 Changes in projected marine PP and C uptake due to riverine input
When riverine nutrient fluxes are added into coastal surface waters in FIX, the PP is higher in both historical and future periods compared to REF (Fig. 5a) due to alleviated nutrient limitation. Interestingly, the effect of riverine inputs on PP for the historical and future time periods is not the same, suggesting a different nutrient depletion level (Fig. A2b). The projected decrease in PP is lessened from −5.4 % in REF to −4.4 % in FIX. It implies that during 1950–1999 the riverine nutrients are not depleted by primary producers, while during 2050–2099 the riverine nutrients are utilized to a greater extent due to the exacerbated nutrient limitation (Fig. A2b) and potentially to a higher phytoplankton growth rate in warmer climate. Figure 12 illustrates this in a schematic diagram that shows the impact of riverine nutrients on projected PP in low and mid-latitudes. Moreover, the inclusion of constant riverine inputs (FIX) can potentially explain 1 / 10 of the ∼10 % (2 %–13 %; Steinacher et al., 2010) inter-model spread. In RUN and GNS, the projected decline in PP is further alleviated to −4.1 % and −3.6 % (averaged over four GN scenarios), respectively, compared to −4.4 % in FIX, owing to the varying (mostly increase) nutrient input. In the Arctic, when riverine nutrient input is present in the model, it helps to sustain the projected PP increase against the stronger stratification under future climate warming, although this effect is only minor (Fig. 5b).
The riverine inputs have a twofold effect on the ocean C uptake. It is the competition between the riverine (inorganic and organic) nutrient-input-induced CO2 uptake and the riverine C-input-induced CO2 outgassing, which determines whether the shelf is a C sink or a C source. However, the composition of the riverine organic matter (i.e., carbon to nutrient ratio) and the degradation timescales which are the key factors have been debated over the last 3 decades (Ittekkot, 1988; Hedges et al., 1997; Cai, 2010; Bianchi, 2011; Blair and Aller, 2011; Lalonde et al., 2014; Galy et al., 2015). It is generally agreed that the riverine organic carbon to nutrient ratio is high (e.g., C:P weight ratio larger than 700; Seitzinger et al., 2010), and the degradation and resuspension rates in shallow shelf seas/sediment are higher than the open ocean (Krumins et al., 2013). It suggests that at shallow and near-shore areas the riverine carbon input usually results in a CO2 source to the atmosphere, while at deeper outer-shelf areas the riverine nutrient input causes PP to increase and a CO2 sink to form, and the magnitudes of the C source and sink on the continental shelves almost compensate for each other. This phenomenon has been discussed by both measurement-based studies (Borges et al., 2005; Chen and Borges, 2009) and modeling studies (e.g., Lacroix et al., 2020). However, the spatial resolution in our model is not fine enough to differentiate the near-shore and outer-shelf processes. This partly contributes to comparable CO2 outgassing near shore (due to riverine C) and CO2 ingassing on outer shelves (due to riverine inorganic and organic nutrient input), leading to a globally weak integrated C sink on the continental margins in FIX and RUN experiments for both historical and future time periods. Although the riverine input of nutrients and C is constant for both time periods in FIX, the riverine-induced C uptake is slightly (but significantly) bigger (0.03 Pg C yr−1) during 2055–2099 compared to 1950–1999, which indicates that the riverine nutrient input is slightly dominant over riverine C input in FIX, and the riverine nutrients are utilized more in the future period. A recent modeling study (Lacroix et al., 2021b) with improved shelf processes has also reported a 0.03 Pg C yr−1 increase in global C uptake induced by temporally varying terrestrial nutrient input during 1905–2010. They conclude that due to large historical perturbation, the increased nutrient inputs are the largest driver of change for the CO2 uptake at the regional scale. In GNS, on the other hand, the riverine inputs reduce globally integrated C uptake for both historical and future time periods but not equally (Fig. 7a). It reduces more in the future period (2050–2099) than the historical period (1950–1999), which implies that the effect of riverine C input in the future scenarios are more dominant over nutrient input. Simulations with high-resolution global or regional models with a more realistic representation of shelf processes are required to accurately assess the impact of riverine inputs on carbon cycling in the coastal ocean.
4.3 Sensitivity of projected marine PP and C uptake to riverine configuration
By exploring different riverine configurations (FIX, RUN, GNS) we investigate how uncertainties in future riverine fluxes translate into uncertainties in projected PP and C uptake changes. In RUN we assume constant concentrations (at the 1970 level) of riverine nutrients and carbon over time and couple them to the simulated freshwater runoff. Thus, the annual global total fluxes of nutrients and carbon vary with time following the variability in runoff (Fig. 2) in contrast to the constant fluxes in FIX. The global total simulated runoff, under RCP 4.5 in our model, is on average higher during 2050–2099 than the runoff during 1950–1999, indicating an intensified hydrological cycle under future climate change. Hence, the global riverine fluxes of nutrients and carbon during 2050–2099 are higher than those during 1950–1999 in RUN. However, the temporal changes in global riverine fluxes in RUN are relatively small compared with the absolute flux values in FIX, which explains the slightly larger projected changes in global PP and ocean carbon uptake in RUN compared to FIX. It is noteworthy that the large interannual variability in the riverine fluxes of nutrients and carbon in RUN does not increase the interannual variability in simulated PP and ocean carbon uptake either globally or on the continental margins (Fig. 11), something that warrants further investigation. The approach of RUN serves as a trial to introduce seasonal and interannual variability in riverine nutrient and C inputs that is linked to hydrological variability. It should be explored in future works if RUN and GNS can be integrated to produce more realistic long-term trends in riverine nutrient and C inputs, as well as short-term variability. Although the RUN approach is more sophisticated when compared to FIX, it employs a linear relationship between the future riverine nutrient and C fluxes and the simulated hydrological cycle, which is a highly simplified assumption (see discussion in Sect. 4.4).
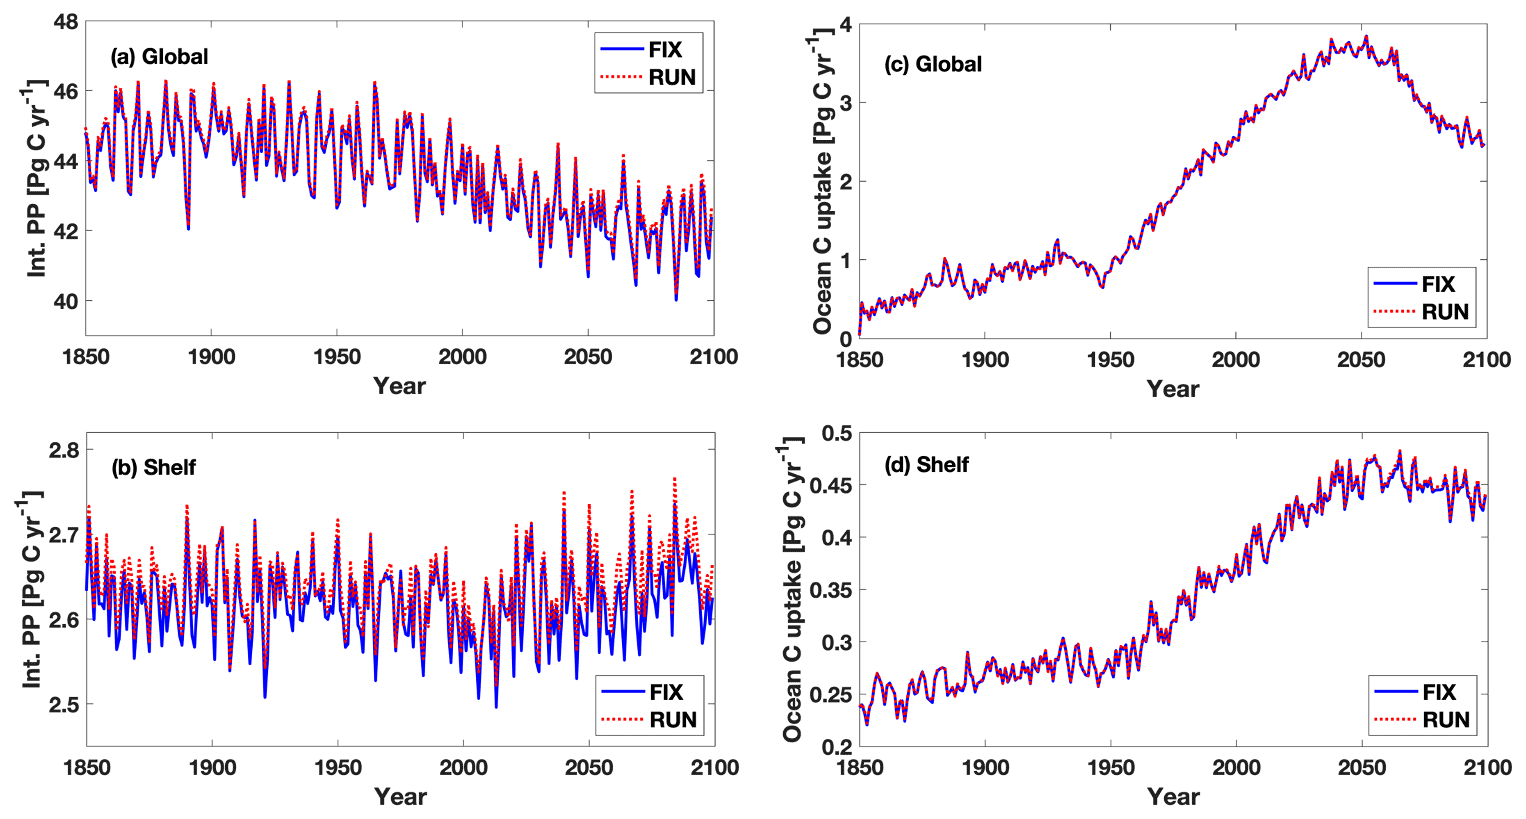
Figure 11Time series of integrated annual primary production and ocean carbon uptake during 1850–2099 in FIX and RUN (a, c) globally and (b, d) on continental shelves.
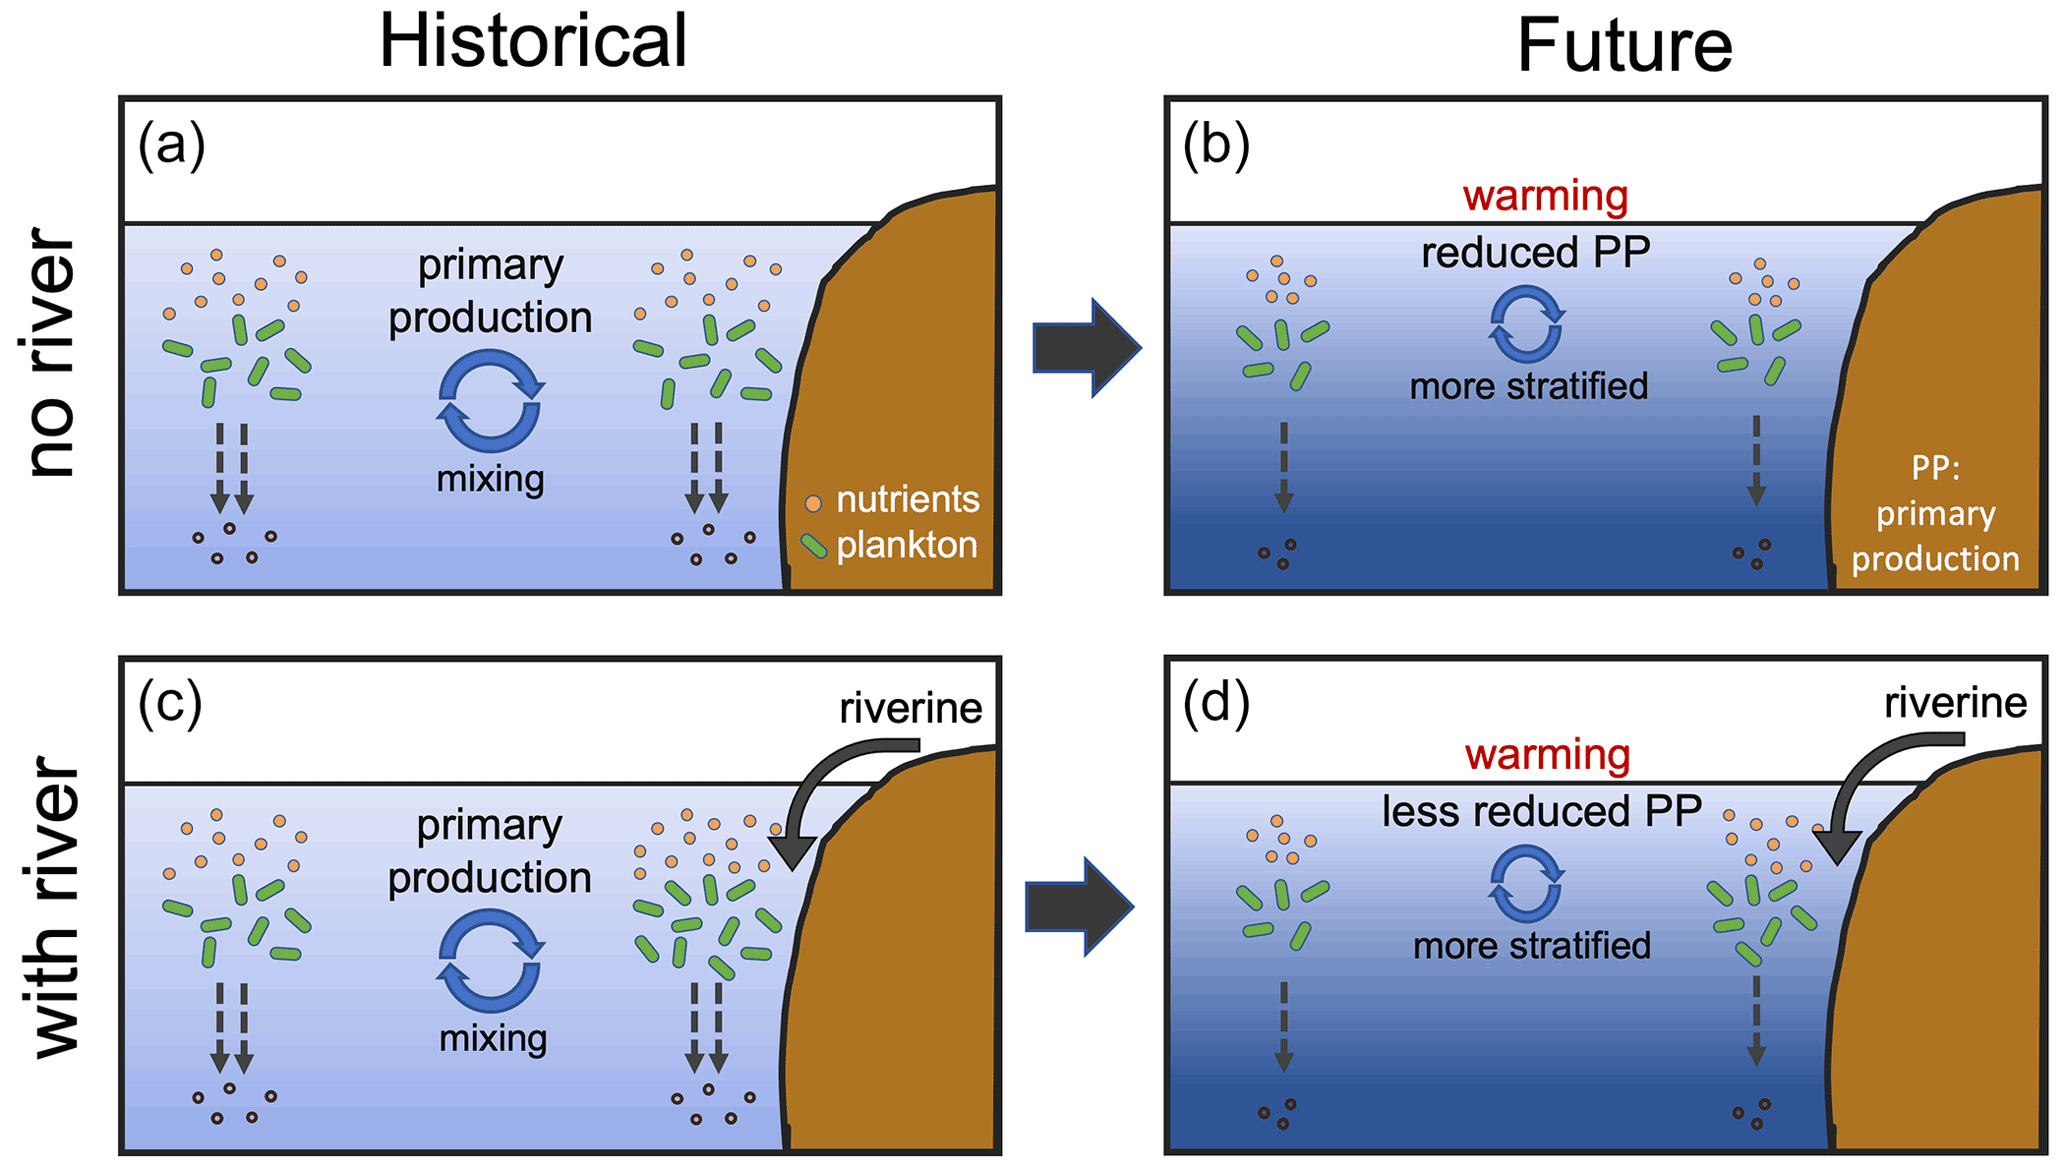
Figure 12Schematic drawing of impact of riverine nutrient input on future projections of marine primary production. (a, b) Decline in nutrient supply into subtropical surface waters due to the upper-ocean warming and increased vertical stratification, which is projected by models to reduce primary production over the 21st century. (c, d) Riverine nutrient input into surface coastal waters alleviates the nutrient limitation and lessens the projected future decline in primary production.
Figure 2 shows that the inputs of DIN and DIP are considerably lower, while the dissolved silicon (DSi) and particulate organic matter (POM) are higher in the future period in RUN compared to GNS. This is because many anthropogenic processes that are important for determining the future riverine fluxes are not considered in RUN but are considered in the NEWS 2 model system, from which the GNS' future scenarios are simulated. For example, the nutrient management in agriculture, the sewage treatment and phosphorus detergent use, and the increased reservoirs from global dam construction in river systems (Seitzinger et al., 2010; Beusen et al., 2009) are the key factors affecting future riverine fluxes of DIN, DIP, and DSi and POM, respectively. Therefore, it is worth exploring the merits of using GNS in future projections of marine biogeochemistry. The four future scenarios provide a range of potential outcomes resulting from different choices tending toward either globalization or regional orientation and either a reactive or proactive approach to environmental threats (see Table 1). A large range of the riverine inputs in GNS, e.g., temporal changes in DIN fluxes across scenarios ranging from 24.8 % to 63.0 % of the annual flux in FIX, do not transfer to large uncertainties in future projections of global marine PP in our model, which can primarily be attributed to unresolved shelf processes due to coarse model resolution. However, the scenario differences might be of importance in regional projections, such as in seas surrounded by highly populated nations and near river estuaries. Simulations with high-resolution global or regional models with a good representation of shelf processes are required to accurately assess the local impact of riverine inputs.
4.4 Limitations and uncertainties
We acknowledge several limitations of our study, particularly related to the resolution and complexity of our model. Firstly, coarse-resolution models tend to underestimate PP along the coast. Such well-known model issues may offset the impact induced by riverine inputs. Secondly, shelf processes, which are not well represented in our model due to coarse resolution, modify a large fraction of some riverine species; e.g., the conversion of organic carbon to CO2 occurs rapidly via remineralization in estuaries before they are transported to the open ocean. Further, some simplified processes of the model may introduce bias in the results, e.g., how the model deals with the riverine dissolved organic and particulate matter. In our model, there is only one dissolved organic pool (DOM) and one particulate organic pool (DET), and the Redfield ratio () needs to be kept. Therefore, the ratios of riverine input for both dissolved organic matter (including DON, DOP, and DOC) and particulate (inorganic and organic) matter (including particulate nitrogen, particulate phosphorus, and POC) are calculated, and then the least abundant species (scaled by the Redfield ratio) are added to their respective DOM and DET pools. The excess budget from the remaining two species (of P, N, or C) are assumed to be directly remineralized into an inorganic form and added to the corresponding dissolved inorganic pools (i.e., DIP, DIN, or DIC) in the ocean. This simplification may result in an overestimation of riverine dissolved inorganic nutrients and thereby riverine-induced PP enhancement. Especially in the NEWS 2 dataset particulate P is typically dominated by inorganic forms (Mayorga et al., 2010), which means that it is likely not directly bio-available. Therefore, we have assessed the bias due to the direct remineralization of the riverine dissolved organic and particulate matter. We calculated firstly the proportion of directly remineralized matter from the total riverine dissolved organic matter (DOM) and particulate (inorganic and organic) matter (PM) by using the following equation, i.e., [ %] (X is the directly remineralized dissolved organic and particulate matter). The directly remineralized part on average accounts for 64.8 %, 27.8 %, and 62.8 % of the total riverine organic and particulate matter of P, N, and C, respectively. In a recent study by Lacroix et al. (2021a), who used an enhanced version of HAMOCC (horizontal resolution of ∼0.4∘) with improved representation of riverine inputs and organic matter dynamics in the coastal ocean, they quantified that around 50 % of the riverine DOM and 75 % of the POM are mineralized in global shelf waters. Therefore, our model assumption is on track with the finer-resolution-model estimates, and this direct remineralization compensates to some extent for the under-represented organic matter degradation rate on the ocean shelf. This bias in riverine dissolved nutrient input may further lead to bias in the enhanced PP. We calculated the contribution of the directly remineralized part on the enhanced PP by comparing X with the corresponding total riverine dissolved nutrient additions as [ %] (DIXriv denotes the corresponding riverine dissolved nutrient additions), which accounts for 80.5 %, 33.3 %, and 41.1 % of P, N, and C, respectively. Assuming that all coastal regions are nutrient limited, this direct remineralization could be theoretically responsible for 33.3 %–80.5 % of the enhanced PP, depending on which nutrient species is limiting the PP. In our model, phosphate is rarely limiting (Fig. A1); therefore, the impact of this direct remineralization on PP is likely on the lower end of this range (33.3 %–80.5 %). Given that the proportion of the direct remineralized organic N (27.8 %; see the calculation above) in our model is comparable to or lower than the reported values by field studies (∼38.8 % of DON decomposed during transition from Arctic rivers to coastal ocean; Kattner et al., 1999; Lobbes et al., 2000; Dittmar et al., 2001), which indicates that the bias on enhanced PP is likely less than 33.3 %.
Some approximation and assumption in the experimental setup may also induce uncertainties in our results. Our spin-up experiment uses riverine nutrient and carbon inputs fixed at 1970 levels, as provided by NEWS 2. As a caveat, our post-1970 simulated changes in marine PP and CO2 fluxes miss any legacy effects from riverine input changes that occurred before 1970. The fixed inputs likely overestimate the accumulated inputs prior to 1970, causing potential underestimation of the projected change impacts. However, Beusen et al. (2016) found that changes in riverine N and P are relatively small before 1970 compared to changes after 1970. Therefore, we expect the impact due to missing legacy effects to be minor. Moreover, in FIX we applied riverine inputs at the 1970 level over available inputs at the 2000 level because the former are more representative of the 1950–1999 baseline period. However, the use of the 1970 level input is suboptimal when evaluating simulated PP and CO2 fluxes against observations obtained after 2000. Beusen et al. (2016) have shown that the riverine N and P has increased by ∼40.0 % and 28.6 %, respectively, from 1970 to 2000. Therefore, the riverine impact may be underestimated when comparing with the observations during 2003–2012. In RUN, we assume constant concentrations of riverine nutrients and carbon over time, and the fluxes vary with freshwater runoff. This may be applicable for some nutrients such as DIN or within a certain limit of runoff change such as for dissolved Si (Fig. A3). However, this may not be appropriate for all nutrient and carbon species. Furthermore, the variability in runoff is subject to interannual to decadal climate variability, which partially masks the centennial trend. This caveat can be overcome through performing multi-realization ensemble simulations.
Lastly, riverine Fe flux is weighted by the water runoff of each river and integrated globally as a total input of 1.45 Tg yr−1 (Chester, 1990). To the best of our knowledge, the available global riverine iron dataset is rare. Previous studies have used various approximation approaches, e.g., constant Fe to dissolved inorganic carbon (DIC) ratio (Aumont et al., 2015) and Fe to phosphorus ratio (Lacroix et al., 2020). In the study by Aumont et al. (2015), the Fe : DIC ratio is determined so that the total Fe supply also equals 1.45 Tg Fe yr−1 as estimated by Chester (1990). We are aware that our approximation likely has bias on regional scales, especially in Fe-limiting regions like the Arctic. However, it has likely a minor impact on the projected PP, since light rather than riverine nutrient input is the primary control of the projected Arctic PP in our model. Also, we have conducted all simulations only under one Intergovernmental Panel on Climate Change (IPCC) representative concentration pathway scenario (the intermediate RCP 4.5), which may lead to a narrower possible range of the riverine-flux-induced impact on the projected marine PP and C uptake.
In this study, we apply a fully coupled Earth system model to assess the impact of riverine nutrients and carbon delivery to the ocean on the contemporary and future marine PP and carbon uptake. We also quantify the effects of uncertainty in future riverine fluxes on the projected changes, using several riverine input configurations.
Compared to satellite- and observation-based estimates, the inclusion of riverine nutrients and carbon improves the contemporary spatial distribution only slightly for PP (3.6 % reduction in RMSE) and insignificantly for ocean carbon uptake (0.1 % reduction in RMSE) on a global scale, with larger improvements on the continental margins (5.4 % reduction in RMSE for PP) and the North Atlantic region (7.4 % reduction in RMSE for carbon uptake).
Concerning future projected changes, a decline in nutrient supply in tropical and subtropical surface waters, due to upper-ocean warming and increased vertical stratification, is projected by our model to reduce PP over the 21st century. Riverine nutrient inputs into surface coastal waters alleviate the nutrient limitation and considerably lessen the projected future decline in PP from −5.4 % without riverine inputs to −4.4 %, −4.1 %, and −3.6 % in FIX, RUN, and GNS (averaged over GNa, GNg, GNo, and GNt), respectively. Different from the global value, the projected PP in the Arctic increases considerably because light and temperature – the primary limiting factors for phytoplankton growth in polar regions – become more favorable due to sea ice melting under warmer future conditions. When riverine nutrient inputs are presented in the model, they further enhance the projected increase in PP in the Arctic, counteracting the nutrient decline effect due to stronger stratification in the fresher and warmer surface water.
Depending on the riverine scenarios, where the riverine nutrient input dominates over the C input, the projected net uptake of CO2 is further enhanced along continental margins via the photosynthesis process. Conversely, where the riverine C input is dominant over the nutrient input, the projected net uptake of CO2 is reduced, especially at large river estuaries due to higher CO2 outgassing.
We have explored a range of riverine input configurations from temporally constant fluxes (FIX), to idealized time-varying fluxes following variations in a simulated hydrological cycle (RUN), and to plausible future scenarios (GNS) from a set of global assumptions. The large range of the uncertainty of the riverine input does not transfer to large uncertainty of the projected global PP and ocean C uptake in our simulations likely due to model limitations related to resolution and shelf process representations. Our study suggests that applying transient riverine inputs in the ESMs with coarse or intermediate model resolution (∼1∘) does not significantly reduce the uncertainty in global marine PP and C uptake projections, but it may be of importance for regional studies such as in the North Atlantic and along the continental margins.
Future modeling studies that include riverine input to the ocean can benefit from using high or at least adequate model resolution so that shelf processes, such as a realistic remineralization rate for riverine organic matter in the coastal water and shelf sediment, as well as lateral transport, can be better resolved. Better constraints on riverine C to nutrient ratios are needed to accurately assess the net riverine impact on ocean C uptake. Further exploration of various future scenarios of riverine input is clearly warranted in order to better assess projected changes in ocean PP and C uptake, especially on regional scales.
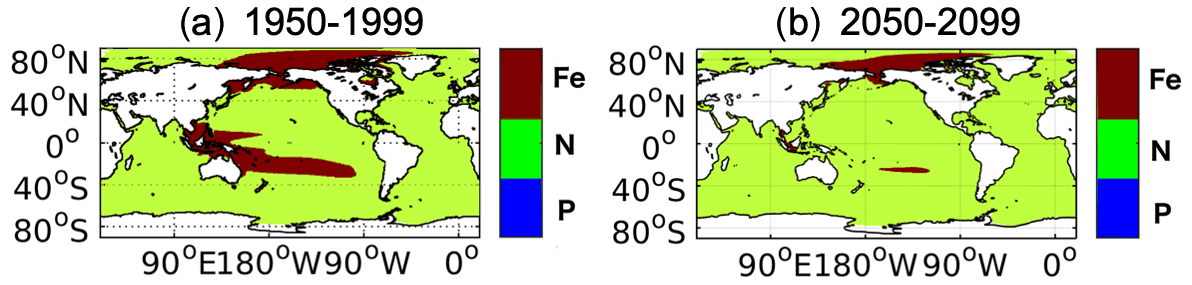
Figure A1The limiting nutrient among iron, nitrate, and phosphate in REF during (a) 1950–1999 and (b) 2050–2099.
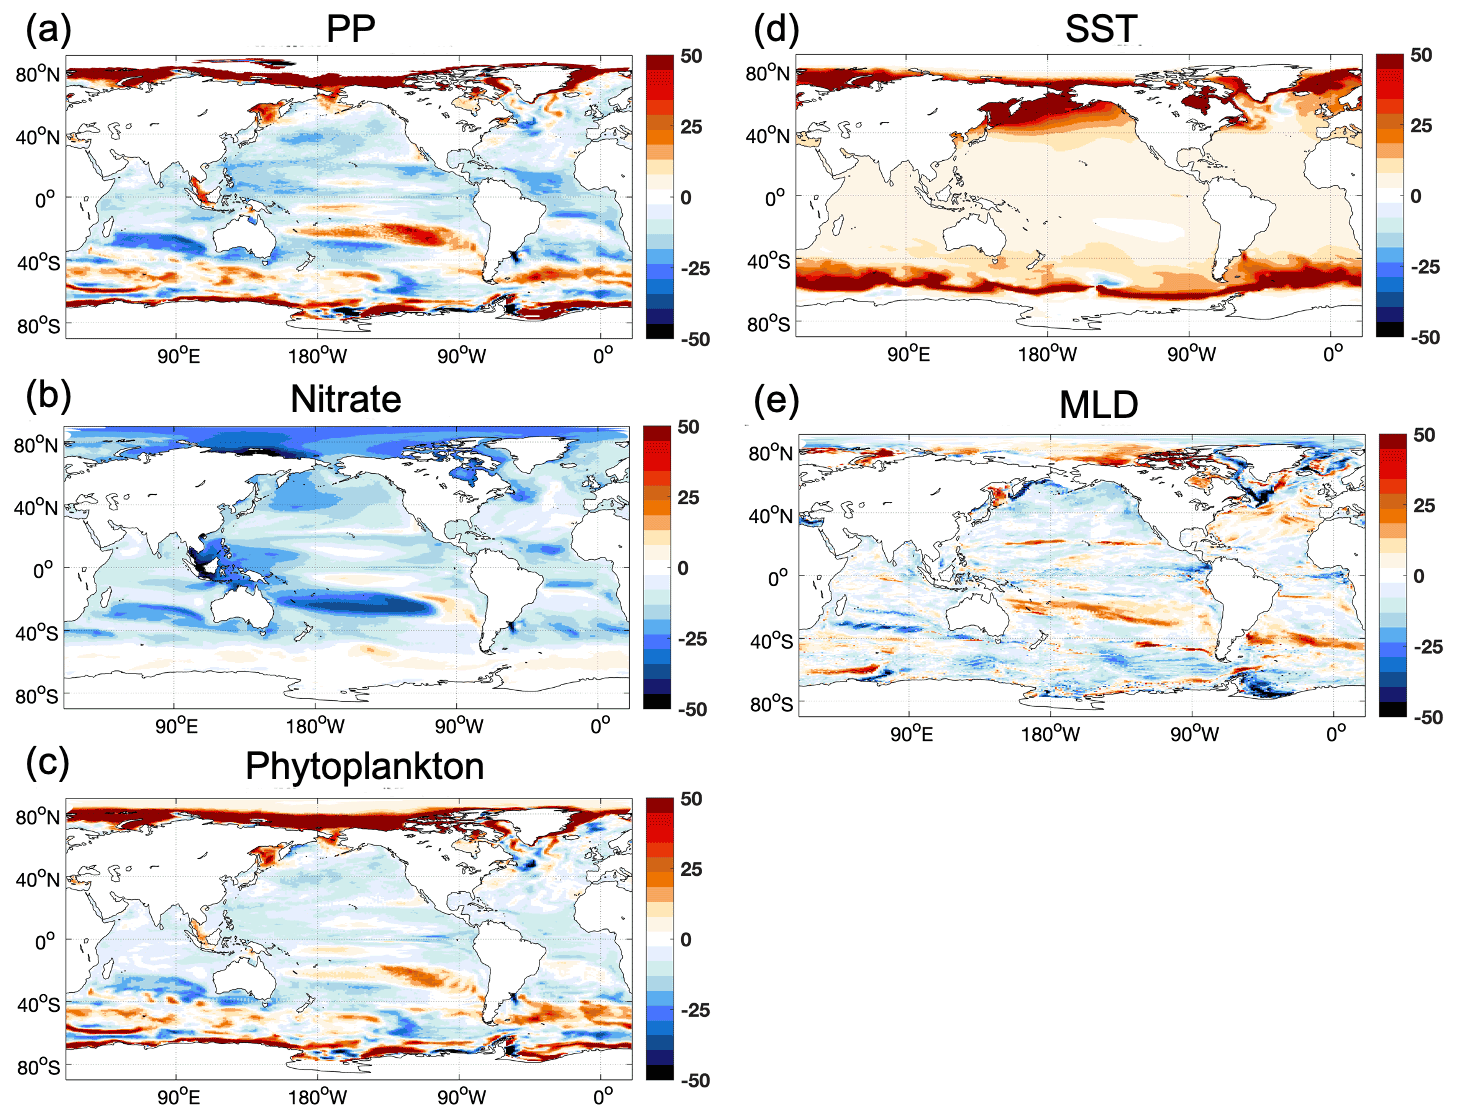
Figure A2The relative changes in projected (a) primary production, (b) nitrate concentration, (c) phytoplankton concentration, (d) sea surface temperature, and (e) annual mean maximum mixed layer depth in REF (2050–2099 compared to 1950–1999).

Figure A3The relationship between relative changes in freshwater runoff and relative changes in nutrient fluxes (dissolved inorganic nitrogen, phosphorus, and silicon) in 2050 according to the Adapting Mosaic future scenario in NEWS 2 dataset.
Time-averaged quantities and their differences – like the ones considered in this study – are subject to temporal sampling uncertainty arising from the presence of internal climate variability and associated biogeochemistry variability. We evaluated the statistical robustness of our results with respect to temporal sampling uncertainty as outlined in the following.
We assessed statistical significance of time-averaged differences using Student's t test. We performed the test on annual data with α set to 0.05 and N set to the number of years in the respective average period, assuming the internal climate variability exhibits the most power on interannual and shorter timescales. We removed the main part of the externally forced signal by subtracting the linear trend of the annual time series prior to performing the t test if the time series contained more than 20 years. For shorter time series, we therefore did not remove the linear trend as it potentially has a large internal variability component.
All differences presented in the main text, summarized in Tables B1 and B2, were found to be statistically significant, and the plots feature only differences for which the t test locally rejected the null hypothesis. We found even small inter-simulation differences to be statistically significant because these differences were less affected by internal variability. In our model setup, the marine biogeochemistry does not feed back on the physical climate. Consequently, the climate variability and climate trends are the same in all experiments, and the interannual variability in the biogeochemical parameters – which is predominantly driven by the physical climate variability – is also virtually the same. As illustrated in Fig. B1, any uncertainty related to internal climate variability is effectively removed in the computation of the inter-experiment differences. In this manner, we were able to obtain statistically robust results for short time slices without having to perform multi-member simulation ensembles for each experiment.
Detectability of inter-simulation differences does not, however, guarantee that the differences are large enough to be competitive with real-world internal variability to have real-world implications. Therefore, we additionally compared the inter-simulation differences against the internal variability in the absolute field (i.e., not the difference field). We estimated the joint internal variability in the absolute field for N-year time averages as
where σA and σB are the interannual standard deviations for experiments A and B, respectively. As for the t test, we removed the externally forced signal by subtracting the linear trend of the annual time series prior to computing standard deviations if N>20. On all difference plots we marked the areas where inter-simulation differences exceed and thus are large enough to have real-world implications.
Table B1Global and regional statistics of simulated primary production. Shown are the time mean μ and twice its standard deviation σμ (rounded up to two decimals) derived from annual values. The this and tfut denote the time periods 1950–1999 and 2050–2099, respectively.
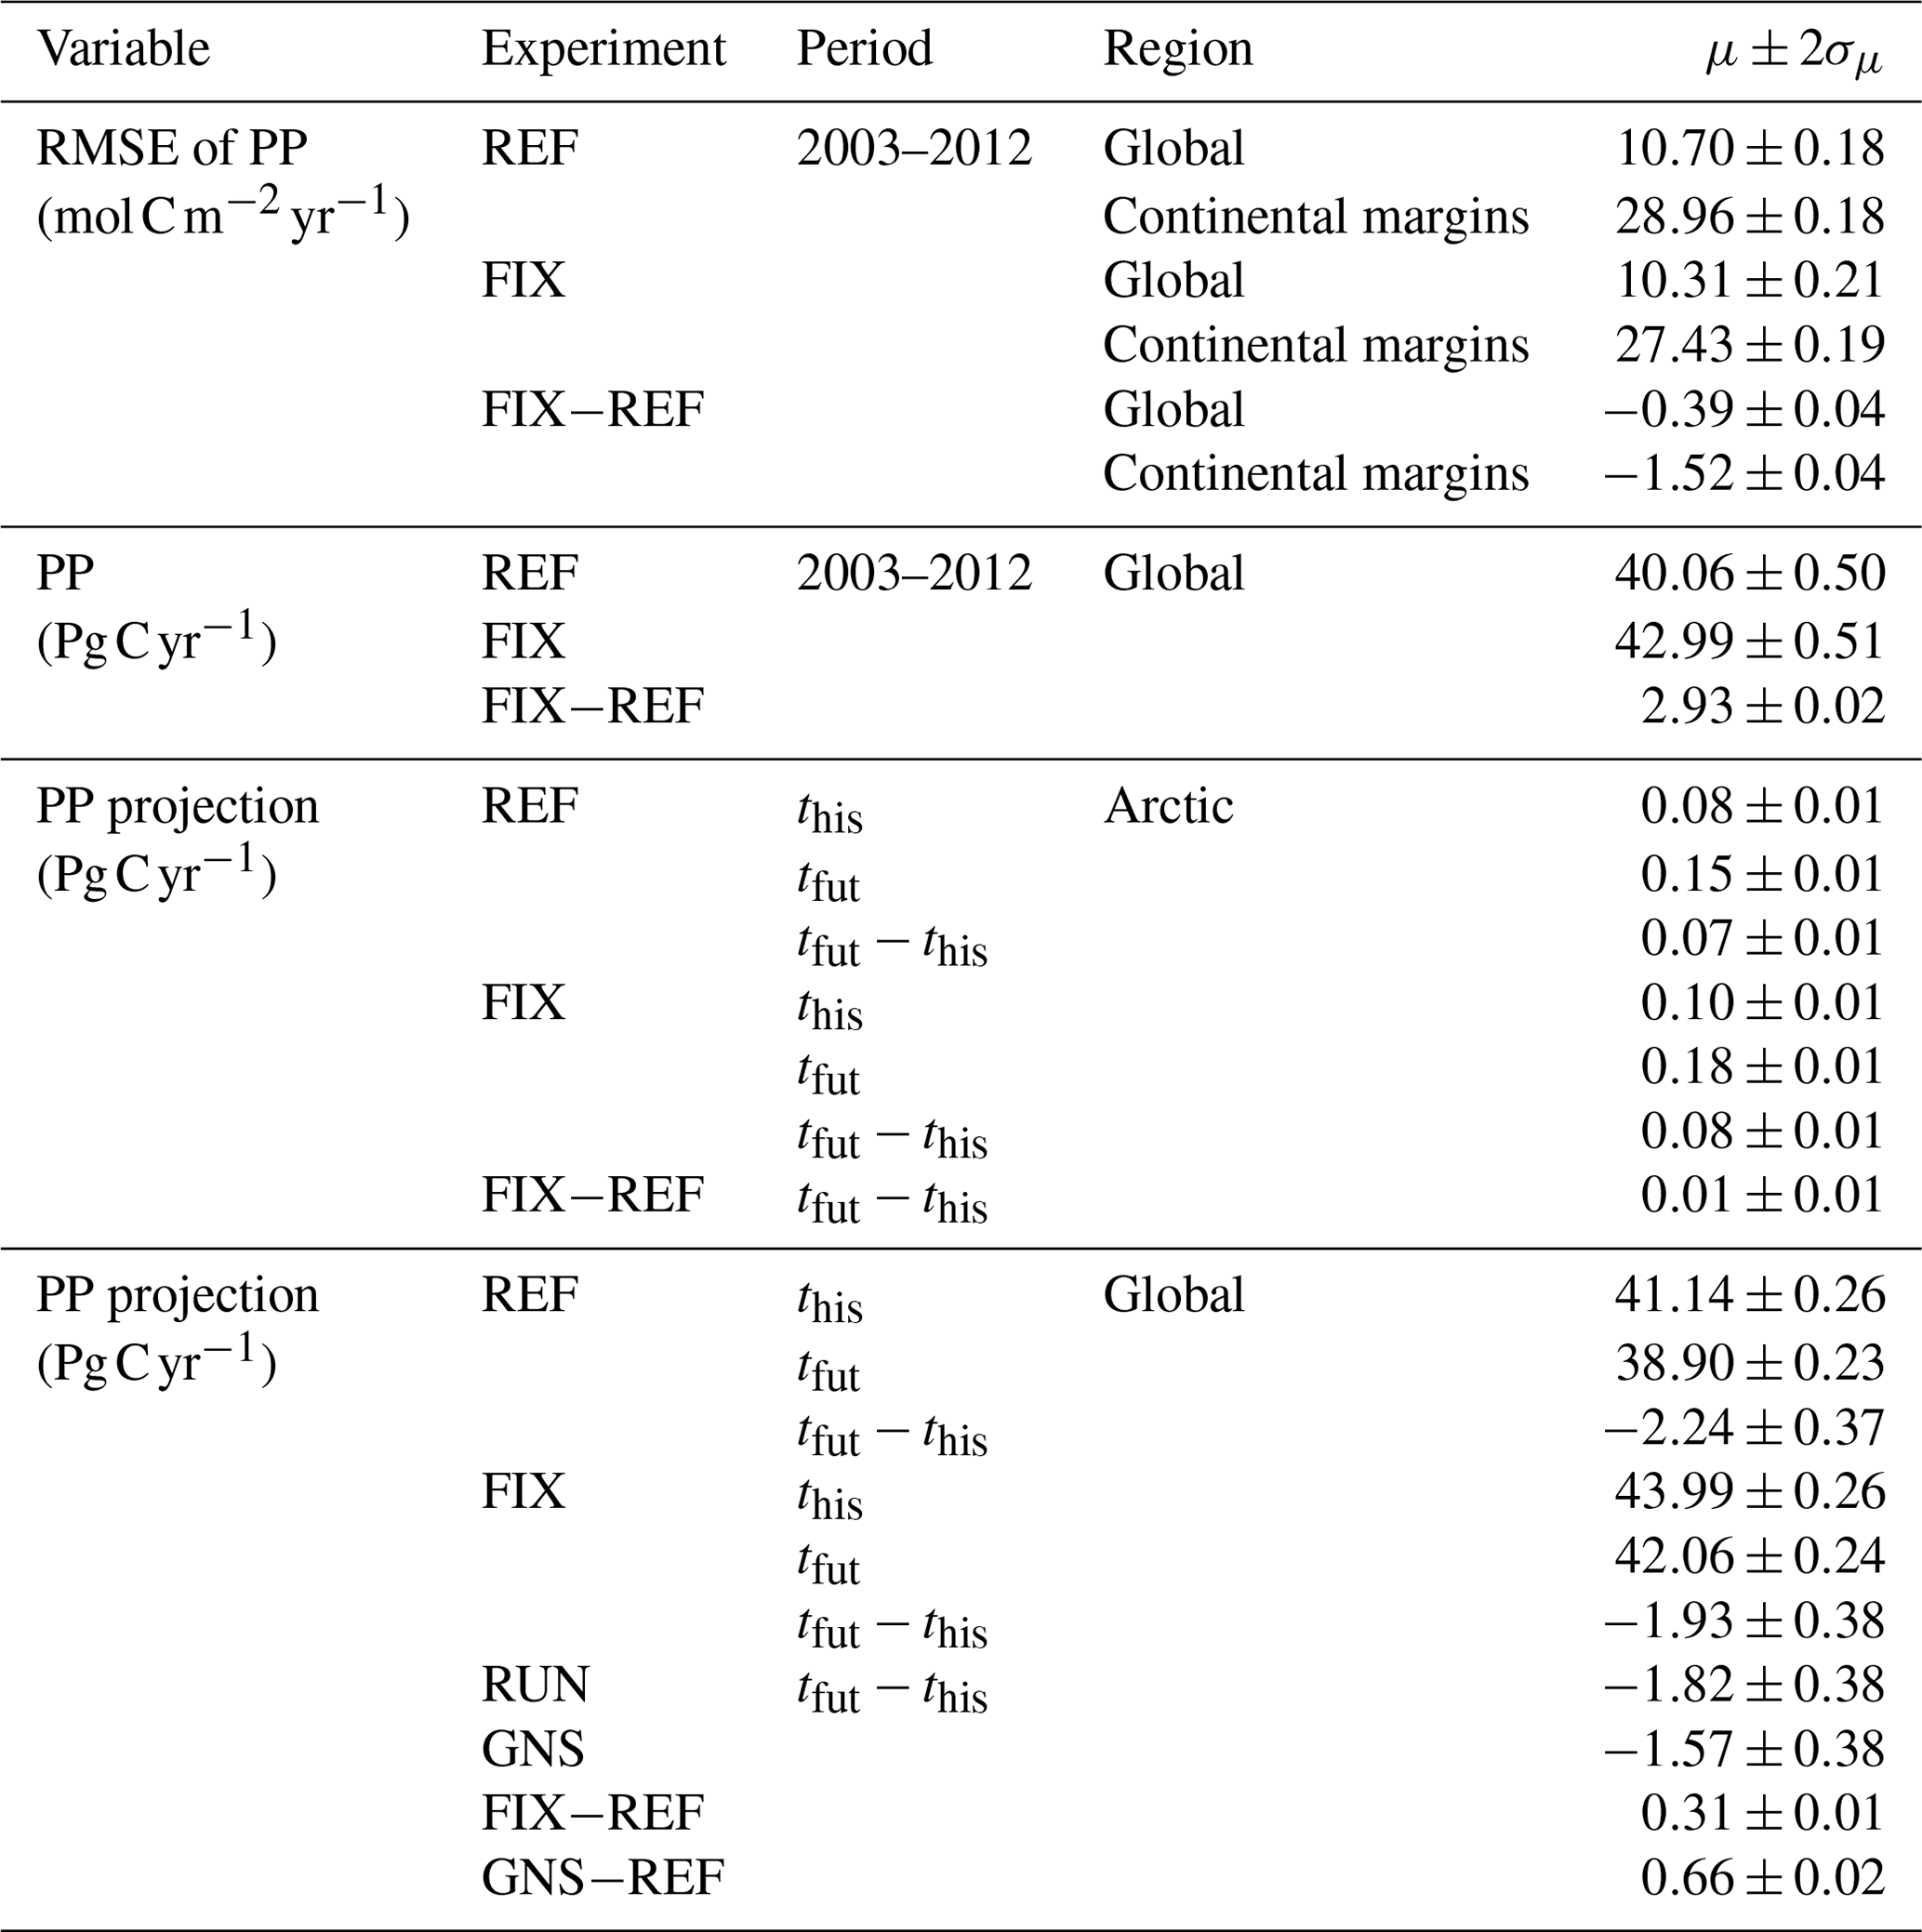
Table B2Global and regional statistics of simulated ocean carbon uptake. Shown are the time mean μ and twice its standard deviation σμ (rounded up to two decimals) derived from annual values. The this and tfut denote the time periods 1950–1999 and 2050–2099, respectively. Values in brackets denote relative changes in percentage.
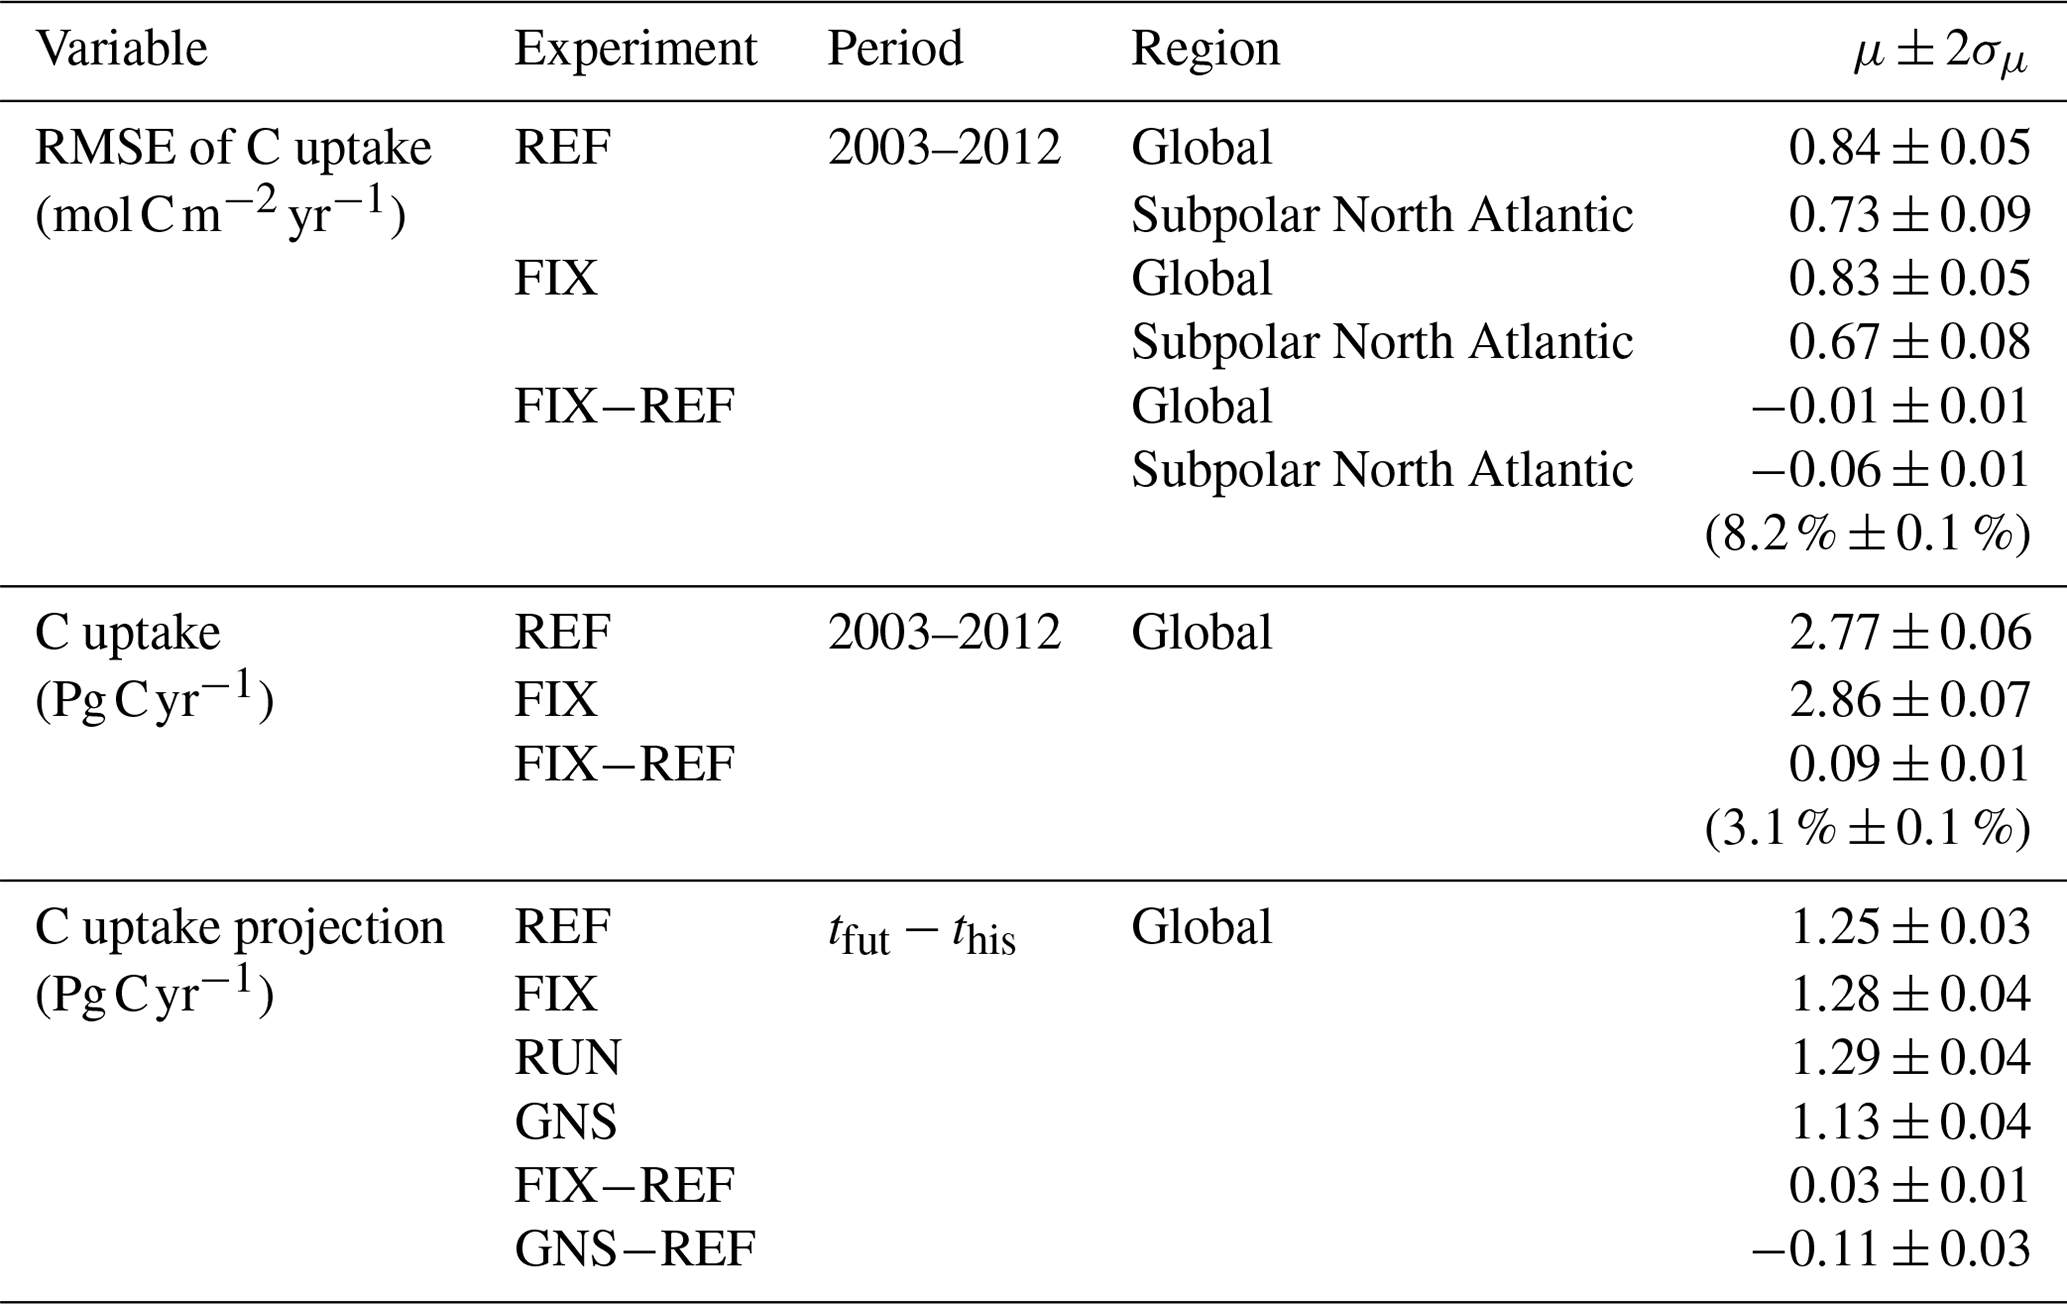
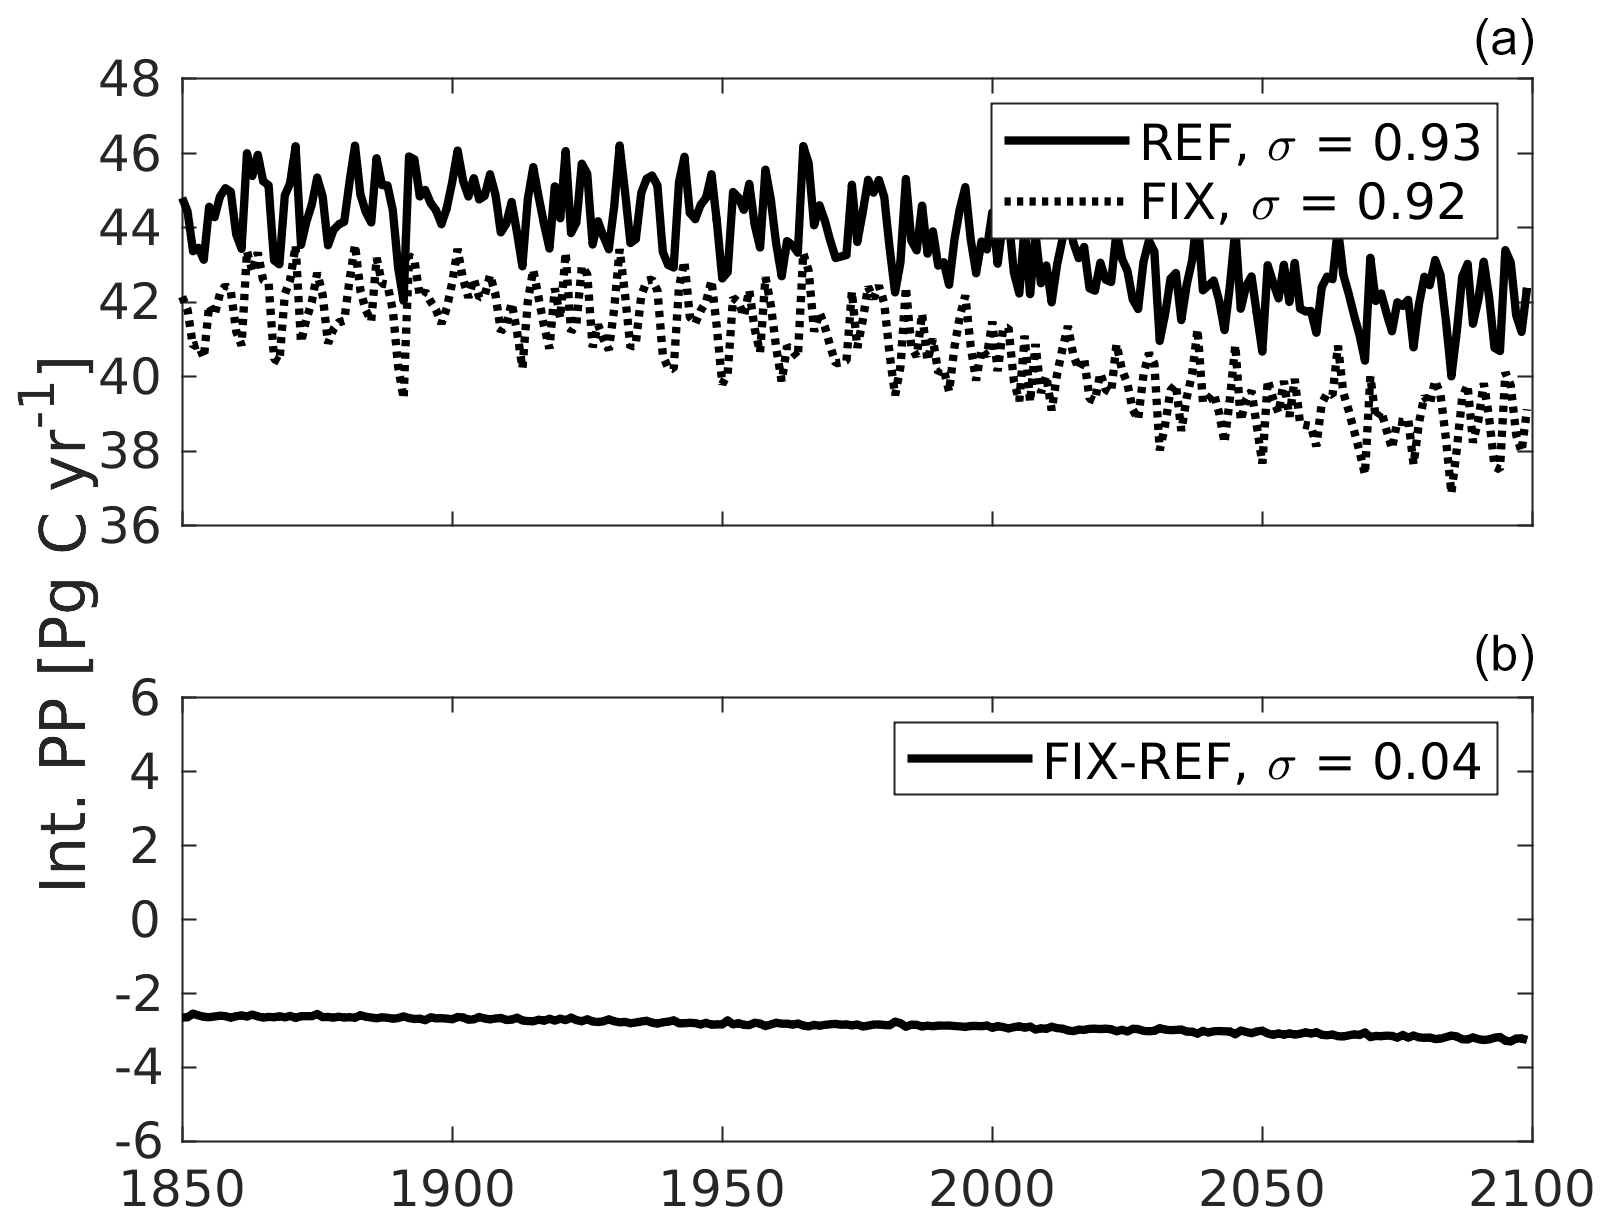
Figure B1Global integrated primary production (PP) time series from single experiments (a) versus the difference between two experiments (b). The PP variability in REF and FIX closely follow each other because the simulations feature the exact same physical variability. As a result, the interannual variability largely cancels out in the computation of FIX−REF differences, and the FIX−REF difference time series exhibits a standard deviation that is an order of magnitude smaller than the standard deviations of REF and FIX.
Table C1Comparison between NEWS 2 dataset (Mayorga et al., 2010) and measurement-based (provided by PARTNERS Project; Holmes et al., 2012) riverine dissolved inorganic nitrogen (DIN) and dissolved organic nitrogen (DON) in the six largest Arctic rivers around the year 2000.
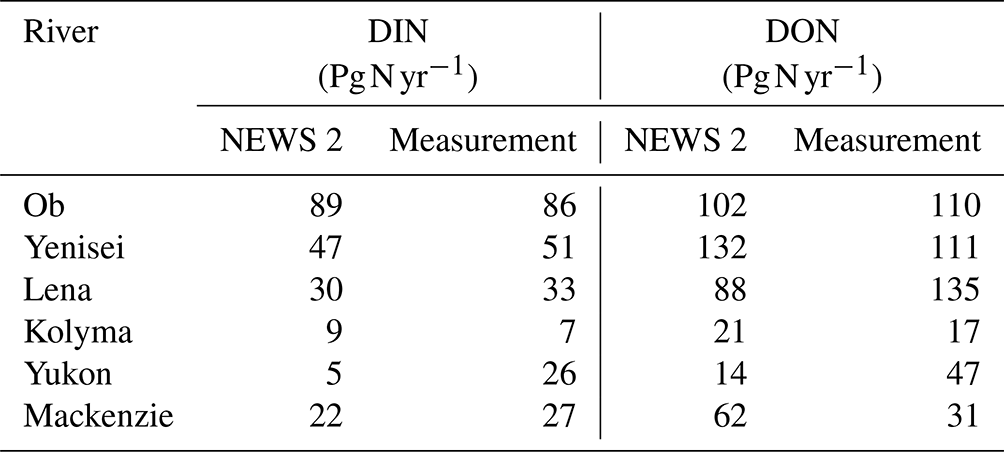
Note that the data from NEWS 2 are for the year 2000, while measured data from PARTNERS Project are calculated over 1999–2008 (missing discharge data restricted the Yukon estimates to 2001–2008).
The model code, input data, output data, and scripts used for producing the results and figures in the study are available at the NIRD Research Data Archive via https://doi.org/10.11582/2022.00072 with CC BY 4.0 license (Gao, 2022).
SG and IB designed the model experiments, and SG developed the model code and performed the simulations with help from IB. JS and JT contributed to the interpretation and analyzation of the results. JS, JT, IB, and CH contributed to editing the manuscript. CH supervised the project work. JH and EM provided riverine data and consultation. SG prepared the manuscript with contributions from all co-authors.
The contact author has declared that none of the authors has any competing interests.
This article reflects only the authors' view – the funding agencies as well
as their executive agencies are not responsible for any use that may be made
of the information that the article contains.
Publisher's note: Copernicus Publications remains neutral with regard to jurisdictional claims in published maps and institutional affiliations.
Computing and storage resources have been provided by UNINETT Sigma2 (nn2345k, nn2980k, ns2345k, ns2980k). Jerry Tjiputra acknowledges the Research-Council-of-Norway-funded project Downscaling Climate and Ocean Change to Services (CE2COAST; 318477) and the EU-funded project OceanICU (101083922). Ingo Bethke received funding from the Trond Mohn Foundation through the Bjerknes Climate Prediction Unit (BFS2018TMT01) and NFR Climate Futures (309562). Jens Hartmann benefited from financial support from the Deutsche Forschungsgemeinschaft (DFG, German Research Foundation) under Germany's Excellence Strategy – EXC 2037 “Climate, Climatic Change, and Society” – project no. 390683824, a contribution to the Center for Earth System Research and Sustainability (CEN) of Universität Hamburg. We gratefully acknowledge that the schematic diagram of Fig. 12 was prepared by Jadelynn Fong. We thank Fabrice Lacroix and one anonymous reviewer for their constructive comments which improved the manuscript greatly.
This research has been supported by the Horizon 2020 (CRESCENDO (grant no.641816)).
This paper was edited by Caroline P. Slomp and reviewed by Fabrice Lacroix and one anonymous referee.
Alcamo, J., van Vuuren, D., Rosegrant, M., Alder, J., Bennett, E., Lodge, D., Masui, T., Morita, T., Ringler, C., Sala, O., Schulze, K., Zurek, M., Eickhout, B., Maerker, M., and Kok, K.: Changes in ecosystem services and their drivers across the scenarios, in: Ecosystems and Human Well-being: Scenarios, edited by: Carpenter, S. R., Pingali, P. L., Bennett, E. M., and Zurek, M. B., Island Press, Washington, 279–354, 2006.
Anderson, L. G., Jutterström, S., Hjalmarsson, S., Wåhlström, I., and Semiletov, I. P.: Out-gassing of CO2 from Siberian Shelf seas by terrestrial organic matter decomposition, Geophys. Res. Lett., 36, L20601, https://doi.org/10.1029/2009GL040046, 2009.
Arndt, S., Jørgensen, B. B., LaRowe, D. E., Middelburg, J. J., Pancost, R. D., and Regnier, P.: Quantifying the degradation of organic matter in marine sediments: A review and synthesis, Earth-Sci. Rev., 123, 53–86, https://doi.org/10.1016/j.earscirev.2013.02.008, 2013.
Assmann, K. M., Bentsen, M., Segschneider, J., and Heinze, C.: An isopycnic ocean carbon cycle model, Geosci. Model Dev., 3, 143–167, https://doi.org/10.5194/gmd-3-143-2010, 2010.
Aumont, O., Orr, J. C., Monfray, P., Ludwig, W., Amiotte-Suchet, P., and Probst, J.-L.: Riverine-driven interhemispheric transport of carbon, Global Biogeochem. Cy., 15, 393–405, https://doi.org/10.1029/1999GB001238, 2001.
Aumont, O., Ethé, C., Tagliabue, A., Bopp, L., and Gehlen, M.: PISCES-v2: an ocean biogeochemical model for carbon and ecosystem studies, Geosci. Model Dev., 8, 2465–2513, https://doi.org/10.5194/gmd-8-2465-2015, 2015.
Behrenfeld, M. J. and Falkowski, P. G.: Photosynthetic rates derived from satellite-based chlorophyll concentration, Limnol. Oceanogr., 42, 1–20, https://doi.org/10.4319/lo.1997.42.1.0001, 1997.
Behrenfeld, M. J., O'Malley, R. T., Siegel, D. A., McClain, C. R., Sarmiento, J. L., Feldman, G. C., Milligan, A. J., Falkowski, P. G., Letelier, R. M., and Boss, E. S.: Climate-driven trends in contemporary ocean productivity, Nature, 444, 752–755, https://doi.org/10.1038/nature05317, 2006.
Bentsen, M., Bethke, I., Debernard, J. B., Iversen, T., Kirkevåg, A., Seland, Ø., Drange, H., Roelandt, C., Seierstad, I. A., Hoose, C., and Kristjánsson, J. E.: The Norwegian Earth System Model, NorESM1-M – Part 1: Description and basic evaluation of the physical climate, Geosci. Model Dev., 6, 687–720, https://doi.org/10.5194/gmd-6-687-2013, 2013.
Bernard, C. Y., Dürr, H. H., Heinze, C., Segschneider, J., and Maier-Reimer, E.: Contribution of riverine nutrients to the silicon biogeochemistry of the global ocean – a model study, Biogeosciences, 8, 551–564, https://doi.org/10.5194/bg-8-551-2011, 2011.
Beusen, A. H. W., Bouwman, A. F., Dürr, H. H., Dekkers, A. L. M., and Hartmann, J.: Global patterns of dissolved silica export to the coastal zone: Results from a spatially explicit global model, Global Biogeochem. Cy., 23, GB0A02, https://doi.org/10.1029/2008GB003281, 2009.
Beusen, A. H. W., Van Beek, L. P. H., Bouwman, A. F., Mogollón, J. M., and Middelburg, J. J.: Coupling global models for hydrology and nutrient loading to simulate nitrogen and phosphorus retention in surface water – description of IMAGE–GNM and analysis of performance, Geosci. Model Dev., 8, 4045–4067, https://doi.org/10.5194/gmd-8-4045-2015, 2015.
Beusen, A. H. W., Bouwman, A. F., Van Beek, L. P. H., Mogollón, J. M., and Middelburg, J. J.: Global riverine N and P transport to ocean increased during the 20th century despite increased retention along the aquatic continuum, Biogeosciences, 13, 2441–2451, https://doi.org/10.5194/bg-13-2441-2016, 2016.
Bianchi, T. S.: The role of terrestrially derived organic carbon in the coastal ocean: A changing paradigm and the priming effect, P. Natl. Acad. Sci. USA, 108, 19473–19481, https://doi.org/10.1073/pnas.1017982108, 2011.
Blair, N. E. and Aller, R. C.: The Fate of Terrestrial Organic Carbon in the Marine Environment, Annu. Rev. Mar. Sci., 4, 401–423, https://doi.org/10.1146/annurev-marine-120709-142717, 2011.
Bleck, R. and Smith, L. T.: A wind-driven isopycnic coordinate model of the north and equatorial Atlantic Ocean: 1. Model development and supporting experiments, J. Geophys. Res.-Oceans, 95, 3273–3285, https://doi.org/10.1029/JC095iC03p03273, 1990.
Bleck, R., Rooth, C., Hu, D., and Smith, L. T.: Salinity-driven Thermocline Transients in a Wind- and Thermohaline-forced Isopycnic Coordinate Model of the North Atlantic, J. Phys. Oceanogr., 22, 1486–1505, https://doi.org/10.1175/1520-0485(1992)022<1486:SDTTIA>2.0.CO;2, 1992.
Bopp, L., Monfray, P., Aumont, O., Dufresne, J.-L., Le Treut, H., Madec, G., Terray, L., and Orr, J. C.: Potential impact of climate change on marine export production, Global Biogeochem. Cy., 15, 81–99, https://doi.org/10.1029/1999GB001256, 2001.
Bopp, L., Aumont, O., Cadule, P., Alvain, S., and Gehlen, M.: Response of diatoms distribution to global warming and potential implications: A global model study, Geophys. Res. Lett., 32, L19606, https://doi.org/10.1029/2005GL023653, 2005.
Bopp, L., Resplandy, L., Orr, J. C., Doney, S. C., Dunne, J. P., Gehlen, M., Halloran, P., Heinze, C., Ilyina, T., Séférian, R., Tjiputra, J., and Vichi, M.: Multiple stressors of ocean ecosystems in the 21st century: projections with CMIP5 models, Biogeosciences, 10, 6225–6245, https://doi.org/10.5194/bg-10-6225-2013, 2013.
Borges, A. V., Delille, B., and Frankignoulle, M.: Budgeting sinks and sources of CO2 in the coastal ocean: Diversity of ecosystems counts, Geophys. Res. Lett., 32, L14601, https://doi.org/10.1029/2005GL023053, 2005.
Bouwman, A. F., Beusen, A. H. W., and Billen, G.: Human alteration of the global nitrogen and phosphorus soil balances for the period 1970–2050, Global Biogeochem. Cy., 23, GB0A04, https://doi.org/10.1029/2009GB003576, 2009.
Boyle, E. A., Edmond, J. M., and Sholkovitz, E. R.: The mechanism of iron removal in estuaries, Geochim. Cosmochim. Ac., 41, 1313–1324, https://doi.org/10.1016/0016-7037(77)90075-8, 1977.
Cabré, A., Marinov, I., and Leung, S.: Consistent global responses of marine ecosystems to future climate change across the IPCC AR5 earth system models, Clim. Dynam., 45, 1253–1280, https://doi.org/10.1007/s00382-014-2374-3, 2015.
Cai, W.-J.: Estuarine and Coastal Ocean Carbon Paradox: CO2 Sinks or Sites of Terrestrial Carbon Incineration?, Annu. Rev. Mar. Sci., 3, 123–145, https://doi.org/10.1146/annurev-marine-120709-142723, 2010.
Chen, C.-T. A. and Borges, A. V.: Reconciling opposing views on carbon cycling in the coastal ocean: Continental shelves as sinks and near-shore ecosystems as sources of atmospheric CO2, Deep-Sea Res. Pt. II, 56, 578–590, https://doi.org/10.1016/j.dsr2.2009.01.001, 2009.
Chester, R.: The transport of material to the oceans: the river pathway, in: Marine Geochemistry, Springer, Dordrecht, https://doi.org/10.1007/978-94-010-9488-7_3, 1990.
Chester, R.: The Input of Material to the Ocean Reservoir, in: Marine Geochemistry, Wiley Online Books, 7–10, https://doi.org/10.1002/9781118349083.ch2, 2012.
Cotrim da Cunha, L., Buitenhuis, E. T., Le Quéré, C., Giraud, X., and Ludwig, W.: Potential impact of changes in river nutrient supply on global ocean biogeochemistry, Global Biogeochem. Cy., 21, GB4007, https://doi.org/10.1029/2006GB002718, 2007.
Danabasoglu, G., Lamarque, J. F., Bacmeister, J., Bailey, D. A., DuVivier, A. K., Edwards, J., Emmons, L. K., Fasullo, J., Garcia, R., Gettelman, A., Hannay, C., Holland, M. M., Large, W. G., Lauritzen, P. H., Lawrence, D. M., Lenaerts, J. T. M., Lindsay, K., Lipscomb, W. H., Mills, M. J., Neale, R., Oleson, K. W., Otto-Bliesner, B., Phillips, A. S., Sacks, W., Tilmes, S., van Kampenhout, L., Vertenstein, M., Bertini, A., Dennis, J., Deser, C., Fischer, C., Fox-Kemper, B., Kay, J. E., Kinnison, D., Kushner, P. J., Larson, V. E., Long, M. C., Mickelson, S., Moore, J. K., Nienhouse, E., Polvani, L., Rasch, P. J., and Strand, W. G.: The Community Earth System Model Version 2 (CESM2), J. Adv. Model. Earth Sy., 12, e2019MS001916, https://doi.org/10.1029/2019MS001916, 2020.
Dittmar, T., Fitznar, H. P., and Kattner, G.: Origin and biogeochemical cycling of organic nitrogen in the eastern Arctic Ocean as evident from D- and L-amino acids, Geochim. Cosmochim. Ac., 65, 4103–4114, https://doi.org/10.1016/S0016-7037(01)00688-3, 2001.
Doney, S. C.: Plankton in a warmer world, Nature, 444, 695–696, https://doi.org/10.1038/444695a, 2006.
Eiriksdottir, E., Oelkers, E., Hardardóttir, J., and Gislason, S.: The impact of damming on riverine fluxes to the ocean: A case study from Eastern Iceland, Water Res., 113, 124–138, https://doi.org/10.1016/j.watres.2016.12.029, 2016.
Figuères, G., Martin, J. M., and Meybeck, M.: Iron behaviour in the Zaire estuary, Neth. J. Sea Res., 12, 329–337, https://doi.org/10.1016/0077-7579(78)90035-2, 1978.
Friedlingstein, P., Jones, M. W., O'Sullivan, M., Andrew, R. M., Bakker, D. C. E., Hauck, J., Le Quéré, C., Peters, G. P., Peters, W., Pongratz, J., Sitch, S., Canadell, J. G., Ciais, P., Jackson, R. B., Alin, S. R., Anthoni, P., Bates, N. R., Becker, M., Bellouin, N., Bopp, L., Chau, T. T. T., Chevallier, F., Chini, L. P., Cronin, M., Currie, K. I., Decharme, B., Djeutchouang, L. M., Dou, X., Evans, W., Feely, R. A., Feng, L., Gasser, T., Gilfillan, D., Gkritzalis, T., Grassi, G., Gregor, L., Gruber, N., Gürses, Ö., Harris, I., Houghton, R. A., Hurtt, G. C., Iida, Y., Ilyina, T., Luijkx, I. T., Jain, A., Jones, S. D., Kato, E., Kennedy, D., Klein Goldewijk, K., Knauer, J., Korsbakken, J. I., Körtzinger, A., Landschützer, P., Lauvset, S. K., Lefèvre, N., Lienert, S., Liu, J., Marland, G., McGuire, P. C., Melton, J. R., Munro, D. R., Nabel, J. E. M. S., Nakaoka, S.-I., Niwa, Y., Ono, T., Pierrot, D., Poulter, B., Rehder, G., Resplandy, L., Robertson, E., Rödenbeck, C., Rosan, T. M., Schwinger, J., Schwingshackl, C., Séférian, R., Sutton, A. J., Sweeney, C., Tanhua, T., Tans, P. P., Tian, H., Tilbrook, B., Tubiello, F., van der Werf, G. R., Vuichard, N., Wada, C., Wanninkhof, R., Watson, A. J., Willis, D., Wiltshire, A. J., Yuan, W., Yue, C., Yue, X., Zaehle, S., and Zeng, J.: Global Carbon Budget 2021, Earth Syst. Sci. Data, 14, 1917–2005, https://doi.org/10.5194/essd-14-1917-2022, 2022.
Frigstad, H., Kaste, Ø., Deininger, A., Kvalsund, K., Christensen, G., Bellerby, R. G. J., Sørensen, K., Norli, M., and King, A. L.: Influence of Riverine Input on Norwegian Coastal Systems, Frontiers in Marine Science, 7, 332, https://doi.org/10.3389/fmars.2020.00332, 2020.
Galy, V., Peucker-Ehrenbrink, B., and Eglinton, T.: Global carbon export from the terrestrial biosphere controlled by erosion, Nature, 521, 204–207, https://doi.org/10.1038/nature14400, 2015.
Gao, S.: Supporting material for NorESM study on impact of riverine nutrient and carbon fluxes on future climate projections, NIRD Research Data Archive [data set], https://doi.org/10.11582/2022.00072, 2022.
Garcia, H. E., Locarnini, R. A., Boyer, T. P., Antonov, J. I., Baranova, O. K., Zweng, M. M., Reagan, J. R., and Johnson, D. R.: World Ocean Atlas 2013. Vol. 4: Dissolved Inorganic Nutrients (phosphate, nitrate, silicate), NOAA Atlas NESDIS 76, 25 pp., https://doi.org/10.7289/V5J67DWD, 2013a.
Garcia, H. E., Locarnini, R. A., Boyer, T. P., Antonov, J. I., Mishonov, A. V., Baranova, O. K., Zweng, M. M., Reagan, J. R., and Johnson, D. R.: World Ocean Atlas 2013. Vol. 3: Dissolved Oxygen, Apparent Oxygen Utilization, and Oxygen Saturation, NOAA Atlas NESDIS 75, 27 pp., https://doi.org/10.7289/V5XG9P2W, 2013b.
Garnier, J., Billen, G., Lassaletta, L., Vigiak, O., Nikolaidis, N. P., and Grizzetti, B.: Hydromorphology of coastal zone and structure of watershed agro-food system are main determinants of coastal eutrophication, Environ. Res. Lett., 16, 023005, https://doi.org/10.1088/1748-9326/abc777, 2021.
Gharamti, M. E., Tjiputra, J., Bethke, I., Samuelsen, A., Skjelvan, I., Bentsen, M., and Bertino, L.: Ensemble data assimilation for ocean biogeochemical state and parameter estimation at different sites, Ocean Model., 112, 65–89, https://doi.org/10.1016/j.ocemod.2017.02.006, 2017.
Hajima, T., Watanabe, M., Yamamoto, A., Tatebe, H., Noguchi, M. A., Abe, M., Ohgaito, R., Ito, A., Yamazaki, D., Okajima, H., Ito, A., Takata, K., Ogochi, K., Watanabe, S., and Kawamiya, M.: Development of the MIROC-ES2L Earth system model and the evaluation of biogeochemical processes and feedbacks, Geosci. Model Dev., 13, 2197–2244, https://doi.org/10.5194/gmd-13-2197-2020, 2020.
Hartmann, J.: Bicarbonate-fluxes and CO2-consumption by chemical weathering on the Japanese Archipelago – Application of a multi-lithological model framework, Chem. Geol., 265, 237–271, https://doi.org/10.1016/j.chemgeo.2009.03.024, 2009.
Hedges, J. I., Keil, R. G., and Benner, R.: What happens to terrestrial organic matter in the ocean?, Org. Geochem., 27, 195–212, https://doi.org/10.1016/S0146-6380(97)00066-1, 1997.
Holland, M. M., Bailey, D. A., Briegleb, B. P., Light, B., and Hunke, E.: Improved Sea Ice Shortwave Radiation Physics in CCSM4: The Impact of Melt Ponds and Aerosols on Arctic Sea Ice, J. Climate, 25, 1413–1430, https://doi.org/10.1175/JCLI-D-11-00078.1, 2011.
Holmes, R. M., McClelland, J. W., Peterson, B. J., Tank, S. E., Bulygina, E., Eglinton, T. I., Gordeev, V. V., Gurtovaya, T. Y., Raymond, P. A., Repeta, D. J., Staples, R., Striegl, R. G., Zhulidov, A. V., and Zimov, S. A.: Seasonal and Annual Fluxes of Nutrients and Organic Matter from Large Rivers to the Arctic Ocean and Surrounding Seas, Estuar. Coast., 35, 369–382, https://doi.org/10.1007/s12237-011-9386-6, 2012.
Hurrell, J. W., Holland, M. M., Gent, P. R., Ghan, S., Kay, J. E., Kushner, P. J., Lamarque, J. F., Large, W. G., Lawrence, D., Lindsay, K., Lipscomb, W. H., Long, M. C., Mahowald, N., Marsh, D. R., Neale, R. B., Rasch, P., Vavrus, S., Vertenstein, M., Bader, D., Collins, W. D., Hack, J. J., Kiehl, J., and Marshall, S.: The Community Earth System Model: A Framework for Collaborative Research, B. Am. Meteorol. Soc., 94, 1339–1360, https://doi.org/10.1175/BAMS-D-12-00121.1, 2013.
Ittekkot, V.: Global trends in the nature of organic matter in river suspensions, Nature, 332, 436–438, https://doi.org/10.1038/332436a0, 1988.
Jakobsson, M.: Hypsometry and volume of the Arctic Ocean and its constituent seas, Geochem. Geophy. Geosy., 3, 1–18, https://doi.org/10.1029/2001GC000302, 2002.
Kattner, G., Lobbes, J., Fitznar, H., Engbrodt, R., Nöthig, E.-M., and Lara, R.: Tracing dissolved organic substances and nutrients from the Lena River through Laptev Sea (Arctic), Mar. Chem., 65, 25–39, 1999.
Key, R. M., Kozyr, A., Sabine, C. L., Lee, K., Wanninkhof, R., Bullister, J. L., Feely, R. A., Millero, F. J., Mordy, C., and Peng, T. H.: A global ocean carbon climatology: Results from Global Data Analysis Project (GLODAP), Global Biogeochem. Cy., 18, GB4031, https://doi.org/10.1029/2004GB002247, 2004.
Kirkevåg, A., Iversen, T., Seland, Ø., Hoose, C., Kristjánsson, J. E., Struthers, H., Ekman, A. M. L., Ghan, S., Griesfeller, J., Nilsson, E. D., and Schulz, M.: Aerosol–climate interactions in the Norwegian Earth System Model – NorESM1-M, Geosci. Model Dev., 6, 207–244, https://doi.org/10.5194/gmd-6-207-2013, 2013.
Krumins, V., Gehlen, M., Arndt, S., Van Cappellen, P., and Regnier, P.: Dissolved inorganic carbon and alkalinity fluxes from coastal marine sediments: model estimates for different shelf environments and sensitivity to global change, Biogeosciences, 10, 371–398, https://doi.org/10.5194/bg-10-371-2013, 2013.
Kwiatkowski, L., Torres, O., Bopp, L., Aumont, O., Chamberlain, M., Christian, J. R., Dunne, J. P., Gehlen, M., Ilyina, T., John, J. G., Lenton, A., Li, H., Lovenduski, N. S., Orr, J. C., Palmieri, J., Santana-Falcón, Y., Schwinger, J., Séférian, R., Stock, C. A., Tagliabue, A., Takano, Y., Tjiputra, J., Toyama, K., Tsujino, H., Watanabe, M., Yamamoto, A., Yool, A., and Ziehn, T.: Twenty-first century ocean warming, acidification, deoxygenation, and upper-ocean nutrient and primary production decline from CMIP6 model projections, Biogeosciences, 17, 3439–3470, https://doi.org/10.5194/bg-17-3439-2020, 2020.
Lacroix, F., Ilyina, T., and Hartmann, J.: Oceanic CO2 outgassing and biological production hotspots induced by pre-industrial river loads of nutrients and carbon in a global modeling approach, Biogeosciences, 17, 55–88, https://doi.org/10.5194/bg-17-55-2020, 2020.
Lacroix, F., Ilyina, T., Laruelle, G. G., and Regnier, P.: Reconstructing the Preindustrial Coastal Carbon Cycle Through a Global Ocean Circulation Model: Was the Global Continental Shelf Already Both Autotrophic and a CO2 Sink?, Global Biogeochem. Cy., 35, e2020GB006603, https://doi.org/10.1029/2020GB006603, 2021a.
Lacroix, F., Ilyina, T., Mathis, M., Laruelle, G. G., and Regnier, P.: Historical increases in land-derived nutrient inputs may alleviate effects of a changing physical climate on the oceanic carbon cycle, Glob. Change Biol., 27, 5491–5513, https://doi.org/10.1111/gcb.15822, 2021b.
Lalonde, K., Vähätalo, A. V., and Gélinas, Y.: Revisiting the disappearance of terrestrial dissolved organic matter in the ocean: a δ13C study, Biogeosciences, 11, 3707–3719, https://doi.org/10.5194/bg-11-3707-2014, 2014.
Landschützer, P., Gruber, N., and Bakker, D.: An updated observation-based global monthly gridded sea surface pCO2 and air-sea CO2 flux product from 1982 through 2015 and its monthly climatology, https://www.nodc.noaa.gov/ocads/oceans/SPCO2_1982_2015_ETH_SOM_FFN.html (last access: 5 January 2023), 2017.
Lawrence, D. M., Oleson, K. W., Flanner, M. G., Thornton, P. E., Swenson, S. C., Lawrence, P. J., Zeng, X., Yang, Z.-L., Levis, S., Sakaguchi, K., Bonan, G. B., and Slater, A. G.: Parameterization improvements and functional and structural advances in Version 4 of the Community Land Model, J. Adv. Model. Earth Sy., 3, M03001, https://doi.org/10.1029/2011MS00045, 2011.
Lee, Y. J., Matrai, P. A., Friedrichs, M. A. M., Saba, V. S., Aumont, O., Babin, M., Buitenhuis, E. T., Chevallier, M., de Mora, L., Dessert, M., Dunne, J. P., Ellingsen, I. H., Feldman, D., Frouin, R., Gehlen, M., Gorgues, T., Ilyina, T., Jin, M., John, J. G., Lawrence, J., Manizza, M., Menkes, C. E., Perruche, C., Le Fouest, V., Popova, E. E., Romanou, A., Samuelsen, A., Schwinger, J., Séférian, R., Stock, C. A., Tjiputra, J., Tremblay, L. B., Ueyoshi, K., Vichi, M., Yool, A., and Zhang, J.: Net primary productivity estimates and environmental variables in the Arctic Ocean: An assessment of coupled physical-biogeochemical models, J. Geophys. Res.-Oceans, 121, 8635–8669, https://doi.org/10.1002/2016JC011993, 2016.
Le Fouest, V., Babin, M., and Tremblay, J.-É.: The fate of riverine nutrients on Arctic shelves, Biogeosciences, 10, 3661–3677, https://doi.org/10.5194/bg-10-3661-2013, 2013.
Le Fouest, V., Manizza, M., Tremblay, B., and Babin, M.: Modelling the impact of riverine DON removal by marine bacterioplankton on primary production in the Arctic Ocean, Biogeosciences, 12, 3385–3402, https://doi.org/10.5194/bg-12-3385-2015, 2015.
Le Fouest, V., Matsuoka, A., Manizza, M., Shernetsky, M., Tremblay, B., and Babin, M.: Towards an assessment of riverine dissolved organic carbon in surface waters of the western Arctic Ocean based on remote sensing and biogeochemical modeling, Biogeosciences, 15, 1335–1346, https://doi.org/10.5194/bg-15-1335-2018, 2018.
Letscher, R. T., Hansell, D. A., Kadko, D., and Bates, N. R.: Dissolved organic nitrogen dynamics in the Arctic Ocean, Mar. Chem., 148, 1–9, https://doi.org/10.1016/j.marchem.2012.10.002, 2013.
Liu, D., Bai, Y., He, X., Chen, C.-T. A., Huang, T.-H., Pan, D., Chen, X., Wang, D., and Zhang, L.: Changes in riverine organic carbon input to the ocean from mainland China over the past 60 years, Environ. Int., 134, 105258, https://doi.org/10.1016/j.envint.2019.105258, 2020.
Liu, X., Stock, C. A., Dunne, J. P., Lee, M., Shevliakova, E., Malyshev, S., and Milly, P. C. D.: Simulated Global Coastal Ecosystem Responses to a Half-Century Increase in River Nitrogen Loads, Geophys. Res. Lett., 48, e2021GL094367, https://doi.org/10.1029/2021GL094367, 2021.
Lobbes, J. M., Fitznar, H. P., and Kattner, G.: Biogeochemical characteristics of dissolved and particulate organic matter in Russian rivers entering the Arctic Ocean, Geochim. Cosmochim. Ac., 64, 2973–2983, 2000.
Ludwig, W., Probst, J.-L., and Kempe, S.: Predicting the oceanic input of organic carbon by continental erosion, Global Biogeochem. Cy., 10, 23–41, https://doi.org/10.1029/95GB02925, 1996.
Mahowald, N. M., Baker, A. R., Bergametti, G., Brooks, N., Duce, R. A., Jickells, T. D., Kubilay, N., Prospero, J. M., and Tegen, I.: Atmospheric global dust cycle and iron inputs to the ocean, Global Biogeochem. Cy., 19, GB4025, https://doi.org/10.1029/2004GB002402, 2005.
Maier-Reimer, E., Kriest, I., Segschneider, J., and Wetzel, P.: The Hamburg oceanic carbon cycle circulation model HAMOCC5.1 – Technical Description Release 1.1, Tech. Rep. 14, Reports on Earth System Science, Max Planck Institute for Meteorology, Hamburg, Germany, 2005.
Manizza, M., Follows, M. J., Dutkiewicz, S., Menemenlis, D., McClelland, J. W., Hill, C. N., Peterson, B. J., and Key, R. M.: A model of the Arctic Ocean carbon cycle, J. Geophys. Res.-Oceans, 116, C12020, https://doi.org/10.1029/2011JC006998, 2011.
Mann, P. J., Strauss, J., Palmtag, J., Dowdy, K., Ogneva, O., Fuchs, M., Bedington, M., Torres, R., Polimene, L., Overduin, P., Mollenhauer, G., Grosse, G., Rachold, V., Sobczak, W. V., Spencer, R. G. M., and Juhls, B.: Degrading permafrost river catchments and their impact on Arctic Ocean nearshore processes, Ambio, 51, 439–455, https://doi.org/10.1007/s13280-021-01666-z, 2022.
Mayorga, E., Seitzinger, S. P., Harrison, J. A., Dumont, E., Beusen, A. H. W., Bouwman, A. F., Fekete, B. M., Kroeze, C., and Van Drecht, G.: Global Nutrient Export from WaterSheds 2 (NEWS 2): Model development and implementation, Environ. Modell. Softw., 25, 837–853, https://doi.org/10.1016/j.envsoft.2010.01.007, 2010.
McClelland, J. W., Holmes, R. M., Dunton, K. H., and Macdonald, R. W.: The Arctic Ocean Estuary, Estuar. Coast., 35, 353–368, https://doi.org/10.1007/s12237-010-9357-3, 2012.
Meybeck, M.: Carbon, nitrogen, and phosphorus transport by world rivers, Am. J. Sci., 282, 401, https://doi.org/10.2475/ajs.282.4.401, 1982.
Meybeck, M. and Vörösmarty, C.: Global transfer of carbon by rivers, Global Change Newsletter, 37, 18–19, 1999.
Neale, R. B., Richter, J., Park, S., Lauritzen, P. H., Vavrus, S. J., Rasch, P. J., and Zhang, M.: The Mean Climate of the Community Atmosphere Model (CAM4) in Forced SST and Fully Coupled Experiments, J. Climate, 26, 5150–5168, https://doi.org/10.1175/JCLI-D-12-00236.1, 2013.
Oleson, K. W., Lawrence, D. M., Bonan, G. B., Flanner, M. G., Kluzek, E., Lawrence, P. J., Levis, S., Swenson, S. C., Thornton, P. E., Dai, A., Decker, M., Dickinson, R., Feddema, J., Heald, C. L., Hoffman, F., Lamarque, J.-F., Mahowald, N., Niu, G.-Y., Qian, T., Randerson, J., Running, S., Sakaguchi, K., Slater, A., Stockli, R., Wang, A., Yang, Z.-L., Zeng, X., and Zeng, X.: Technical Description of version 4.0 of the Community Land Model (CLM) (No. NCAR/TN-478+STR), University Corporation for Atmospheric Research, https://doi.org/10.5065/D6FB50WZ, 2010.
Pokrovsky, O. S., Manasypov, R. M., Kopysov, S. G., Krickov, I. V., Shirokova, L. S., Loiko, S. V., Lim, A. G., Kolesnichenko, L. G., Vorobyev, S. N., and Kirpotin, S. N.: Impact of Permafrost Thaw and Climate Warming on Riverine Export Fluxes of Carbon, Nutrients and Metals in Western Siberia, Water, 12, 1817, https://doi.org/10.3390/w12061817, 2020.
Redfield, A. and Daniel, R. J.: On the proportions of organic derivations in sea water and their relation to the composition of plankton, in: James Johnstone Memorial Volume, University Press of Liverpool, 177–192, 1934.
Regnier, P., Friedlingstein, P., Ciais, P., Mackenzie, F. T., Gruber, N., Janssens, I. A., Laruelle, G. G., Lauerwald, R., Luyssaert, S., Andersson, A. J., Arndt, S., Arnosti, C., Borges, A. V., Dale, A. W., Gallego-Sala, A., Goddéris, Y., Goossens, N., Hartmann, J., Heinze, C., Ilyina, T., Joos, F., LaRowe, D. E., Leifeld, J., Meysman, F. J. R., Munhoven, G., Raymond, P. A., Spahni, R., Suntharalingam, P., and Thullner, M.: Anthropogenic perturbation of the carbon fluxes from land to ocean, Nat. Geosci., 6, 597–607, https://doi.org/10.1038/ngeo1830, 2013.
Regnier, P., Resplandy, L., Najjar, R. G., and Ciais, P.: The land-to-ocean loops of the global carbon cycle, Nature, 603, 401–410, https://doi.org/10.1038/s41586-021-04339-9, 2022.
Rogelj, J., den Elzen, M., Höhne, N., Fransen, T., Fekete, H., Winkler, H., Schaeffer, R., Sha, F., Riahi, K., and Meinshausen, M.: Paris Agreement climate proposals need a boost to keep warming well below 2 ∘C, Nature, 534, 631–639, https://doi.org/10.1038/nature18307, 2016.
Sarmiento, J. L., Gruber, N., Brzezinski, M. A., and Dunne, J. P.: High-latitude controls of thermocline nutrients and low latitude biological productivity, Nature, 427, 56–60, 2004.
Séférian, R., Nabat, P., Michou, M., Saint-Martin, D., Voldoire, A., Colin, J., Decharme, B., Delire, C., Berthet, S., Chevallier, M., Sénési, S., Franchisteguy, L., Vial, J., Mallet, M., Joetzjer, E., Geoffroy, O., Guérémy, J.-F., Moine, M.-P., Msadek, R., Ribes, A., Rocher, M., Roehrig, R., Salas-y-Mélia, D., Sanchez, E., Terray, L., Valcke, S., Waldman, R., Aumont, O., Bopp, L., Deshayes, J., Éthé, C., and Madec, G.: Evaluation of CNRM Earth System Model, CNRM-ESM2-1: Role of Earth System Processes in Present-Day and Future Climate, J. Adv. Model. Earth Sy., 11, 4182–4227, https://doi.org/10.1029/2019MS001791, 2019.
Séférian, R., Berthet, S., Yool, A., Palmiéri, J., Bopp, L., Tagliabue, A., Kwiatkowski, L., Aumont, O., Christian, J., Dunne, J., Gehlen, M., Ilyina, T., John, J. G., Li, H., Long, M. C., Luo, J. Y., Nakano, H., Romanou, A., Schwinger, J., Stock, C., Santana-Falcón, Y., Takano, Y., Tjiputra, J., Tsujino, H., Watanabe, M., Wu, T., Wu, F., and Yamamoto, A.: Tracking Improvement in Simulated Marine Biogeochemistry Between CMIP5 and CMIP6, Current Climate Change Reports, 6, 95–119, https://doi.org/10.1007/s40641-020-00160-0, 2020.
Seitzinger, S. P., Mayorga, E., Bouwman, A. F., Kroeze, C., Beusen, A. H. W., Billen, G., Van Drecht, G., Dumont, E., Fekete, B. M., Garnier, J., and Harrison, J. A.: Global river nutrient export: A scenario analysis of past and future trends, Global Biogeochem. Cy., 24, GB0A08, https://doi.org/10.1029/2009GB003587, 2010.
Shiller, A. M. and Boyle, E. A.: Trace elements in the Mississippi River Delta outflow region: Behavior at high discharge, Geochim. Cosmochim. Ac., 55, 3241–3251, https://doi.org/10.1016/0016-7037(91)90486-O, 1991.
Sholkovitz, E. R. and Copland, D.: The coagulation, solubility and adsorption properties of Fe, Mn, Cu, Ni, Cd, Co and humic acids in a river water, Geochim. Cosmochim. Ac., 45, 181–189, https://doi.org/10.1016/0016-7037(81)90161-7, 1981.
Skogen, M. D., Hjøllo, S. S., Sandø, A. B., and Tjiputra, J.: Future ecosystem changes in the Northeast Atlantic: a comparison between a global and a regional model system, ICES J. Mar. Sci., 75, 2355–2369, https://doi.org/10.1093/icesjms/fsy088, 2018.
Smith, S. V., Swaney, D. P., Talaue-Mcmanus, L., Bartley, J. D., Sandhei, P. T., McLaughlin, C. J., Dupra, V. C., Crossland, C. J., Buddemeier, R. W., Maxwell, B. A., and Wulff, F.: Humans, Hydrology, and the Distribution of Inorganic Nutrient Loading to the Ocean, BioScience, 53, 235–245, https://doi.org/10.1641/0006-3568(2003)053[0235:HHATDO]2.0.CO;2, 2003.
Steinacher, M., Joos, F., Frölicher, T. L., Bopp, L., Cadule, P., Cocco, V., Doney, S. C., Gehlen, M., Lindsay, K., Moore, J. K., Schneider, B., and Segschneider, J.: Projected 21st century decrease in marine productivity: a multi-model analysis, Biogeosciences, 7, 979–1005, https://doi.org/10.5194/bg-7-979-2010, 2010.
Tagliabue, A., Kwiatkowski, L., Bopp, L., Butenschön, M., Cheung, W., Lengaigne, M., and Vialard, J.: Persistent Uncertainties in Ocean Net Primary Production Climate Change Projections at Regional Scales Raise Challenges for Assessing Impacts on Ecosystem Services, Front. Clim., 3, 738224, https://doi.org/10.3389/fclim.2021.738224, 2021.
Takahashi, T., Sutherland, S. C., Wanninkhof, R., Sweeney, C., Feely, R. A., Chipman, D. W., Hales, B., Friederich, G., Chavez, F., Sabine, C., Watson, A., Bakker, D. C. E., Schuster, U., Metzl, N., Yoshikawa-Inoue, H., Ishii, M., Midorikawa, T., Nojiri, Y., Körtzinger, A., Steinhoff, T., Hoppema, M., Olafsson, J., Arnarson, T. S., Tilbrook, B., Johannessen, T., Olsen, A., Bellerby, R., Wong, C. S., Delille, B., Bates, N. R., and de Baar, H. J. W.: Climatological mean and decadal change in surface ocean pCO2, and net sea–air CO2 flux over the global oceans, Deep-Sea Res. Pt. II, 56, 554–577, https://doi.org/10.1016/j.dsr2.2008.12.009, 2009.
Taylor, K. E., Stouffer, R. J., and Meehl, G. A.: An Overview of CMIP5 and the Experiment Design, B. Am. Meteorol. Soc., 93, 485–498, https://doi.org/10.1175/BAMS-D-11-00094.1, 2011.
Terhaar, J., Orr, J. C., Ethé, C., Regnier, P., and Bopp, L.: Simulated Arctic Ocean Response to Doubling of Riverine Carbon and Nutrient Delivery, Global Biogeochem. Cy., 33, 1048–1070, https://doi.org/10.1029/2019GB006200, 2019.
Terhaar, J., Lauerwald, R., Regnier, P., Gruber, N., and Bopp, L.: Around one third of current Arctic Ocean primary production sustained by rivers and coastal erosion, Nat. Commun., 12, 169, https://doi.org/10.1038/s41467-020-20470-z, 2021.
Tivig, M., Keller, D. P., and Oschlies, A.: Riverine nitrogen supply to the global ocean and its limited impact on global marine primary production: a feedback study using an Earth system model, Biogeosciences, 18, 5327–5350, https://doi.org/10.5194/bg-18-5327-2021, 2021.
Tjiputra, J. F., Polzin, D., and Winguth, A. M. E.: Assimilation of seasonal chlorophyll and nutrient data into an adjoint three-dimensional ocean carbon cycle model: Sensitivity analysis and ecosystem parameter optimization, Global Biogeochem. Cy., 21, GB1001, https://doi.org/10.1029/2006GB002745, 2007.
Tjiputra, J. F., Roelandt, C., Bentsen, M., Lawrence, D. M., Lorentzen, T., Schwinger, J., Seland, Ø., and Heinze, C.: Evaluation of the carbon cycle components in the Norwegian Earth System Model (NorESM), Geosci. Model Dev., 6, 301–325, https://doi.org/10.5194/gmd-6-301-2013, 2013.
Tjiputra, J. F., Schwinger, J., Bentsen, M., Morée, A. L., Gao, S., Bethke, I., Heinze, C., Goris, N., Gupta, A., He, Y.-C., Olivié, D., Seland, Ø., and Schulz, M.: Ocean biogeochemistry in the Norwegian Earth System Model version 2 (NorESM2), Geosci. Model Dev., 13, 2393–2431, https://doi.org/10.5194/gmd-13-2393-2020, 2020.
Vancoppenolle, M., Bopp, L., Madec, G., Dunne, J., Ilyina, T., Halloran, P. R., and Steiner, N.: Future Arctic Ocean primary productivity from CMIP5 simulations: Uncertain outcome, but consistent mechanisms, Global Biogeochem. Cy., 27, 605–619, https://doi.org/10.1002/gbc.20055, 2013.
van der Struijk, L. F. and Kroeze, C.: Future trends in nutrient export to the coastal waters of South America: Implications for occurrence of eutrophication, Global Biogeochem. Cy., 24, GB0A09, https://doi.org/10.1029/2009GB003572, 2010.
Van Drecht, G., Bouwman, A. F., Harrison, J., and Knoop, J. M.: Global nitrogen and phosphate in urban wastewater for the period 1970 to 2050, Global Biogeochem. Cy., 23, GB0A03, https://doi.org/10.1029/2009GB003458, 2009.
van Vuuren, D. P., Edmonds, J., Kainuma, M., Riahi, K., Thomson, A., Hibbard, K., Hurtt, G. C., Kram, T., Krey, V., Lamarque, J.-F., Masui, T., Meinshausen, M., Nakicenovic, N., Smith, S. J., and Rose, S. K.: The representative concentration pathways: an overview, Climatic Change, 109, 5, https://doi.org/10.1007/s10584-011-0148-z, 2011.
Westberry, T., Behrenfeld, M. J., Siegel, D. A., and Boss, E.: Carbon-based primary productivity modeling with vertically resolved photoacclimation, Global Biogeochem. Cy., 22, GB2024, https://doi.org/10.1029/2007GB003078, 2008.
Wild, B., Andersson, A., Bröder, L., Vonk, J., Hugelius, G., McClelland, J. W., Song, W., Raymond, P. A., and Gustafsson, Ö.: Rivers across the Siberian Arctic unearth the patterns of carbon release from thawing permafrost, P. Natl. Acad. Sci. USA, 116, 10280–10285, 2019.
Yan, W., Mayorga, E., Li, X., Seitzinger, S. P., and Bouwman, A. F.: Increasing anthropogenic nitrogen inputs and riverine DIN exports from the Changjiang River basin under changing human pressures, Global Biogeochem. Cy., 24, GB0A06, https://doi.org/10.1029/2009GB003575, 2010.
Zhang, X., Fang, C., Wang, Y., Lou, X., Su, Y., and Huang, D.: Review of Effects of Dam Construction on the Ecosystems of River Estuary and Nearby Marine Areas, Sustainability, 14, 5974, https://doi.org/10.3390/su14105974, 2022.
- Abstract
- Introduction
- Methods
- Results
- Discussion
- Conclusions
- Appendix A
- Appendix B: Robustness of results to sampling error
- Appendix C: Comparison between NEWS 2 dataset and measurement-based riverine data
- Code and data availability
- Author contributions
- Competing interests
- Disclaimer
- Acknowledgement
- Financial support
- Review statement
- References