the Creative Commons Attribution 4.0 License.
the Creative Commons Attribution 4.0 License.
 | 09 Mar 2023
Atmospheric deposition of reactive nitrogen to a deciduous forest in the southern Appalachian Mountains
John T. Walker
Xi Chen
Zhiyong Wu
Donna Schwede
Ryan Daly
Aleksandra Djurkovic
A. Christopher Oishi
Eric Edgerton
Jesse Bash
Jennifer Knoepp
Melissa Puchalski
John Iiames
Chelcy F. Miniat
Assessing nutrient critical load exceedances requires complete and accurate atmospheric deposition budgets for reactive nitrogen (Nr). The exceedance is the total amount of Nr deposited to the ecosystem in excess of the critical load, which is the amount of Nr input below which harmful effects do not occur. Total deposition includes all forms of Nr (i.e., organic and inorganic) deposited to the ecosystem by wet and dry pathways. Here we present results from the Southern Appalachian Nitrogen Deposition Study (SANDS), in which a combination of measurements and field-scale modeling was used to develop a complete annual Nr deposition budget for a deciduous forest at the Coweeta Hydrologic Laboratory. Wet deposition of ammonium, nitrate, nitrite, and bulk organic N were measured directly. The dry deposited Nr fraction was estimated using a bidirectional resistance-based model driven with speciated measurements of Nr air concentrations (e.g., ammonia, ammonium aerosol, nitric acid, nitrate aerosol, bulk organic N in aerosol, total alkyl nitrates, and total peroxy nitrates), micrometeorology, canopy structure, and biogeochemistry. Total annual deposition was ∼ 6.7 kg N ha−1 yr−1, which is on the upper end of Nr critical load estimates recently developed for similar ecosystems in the nearby Great Smoky Mountains National Park. Of the total (wet + dry) budget, 51.1 % was contributed by reduced forms of Nr (NHx = ammonia + ammonium), with oxidized and organic forms contributing ∼ 41.3 % and 7.6 %, respectively. Our results indicate that reductions in NHx deposition would be needed to achieve the lowest estimates (∼ 3.0 kg N ha−1 yr−1) of Nr critical loads in southern Appalachian forests.
- Article
(4825 KB) - Full-text XML
-
Supplement
(1420 KB) - BibTeX
- EndNote


Prior to the Industrial Revolution, Earth's ecosystems received reactive nitrogen (Nr) deposition rates of ∼ 0.5 kg ha−1 yr−1 (Holland et al., 1999). Since the 19th century, anthropogenic activities, both industrial and agricultural, have resulted in unprecedented quantities of Nr being released into the atmosphere, subsequently altering biogeochemical cycles (Neff et al., 2002a, b; Ollinger et al., 2002; Bragazza et al., 2006; Doney et al., 2007; Galloway et al., 2008; Boonstra et al., 2017). Excessive atmospheric deposition of Nr to terrestrial ecosystems may lead to soil and aquatic acidification, nutrient imbalance and enrichment, plant damage, and microbial community changes, as well as loss of biodiversity (Bobbink et al., 1998; Lohse et al., 2008; Simkin et al., 2016). Nitrogen deposition rates in many areas, including North America, Europe, and Asia, exceed 10 kg ha−1 yr−1 and may double by the year 2050 in some regions (Galloway et al., 2008).
The amount of Nr deposition below which significant harmful effects do not occur is known as the critical load (Nilsson and Grennfelt, 1988). Critical loads can be quantified using empirical relationships between ecosystem N input and ecosystem response (Pardo et al., 2011; Root et al., 2015), or mass-balance-type biogeochemical models (Lynch et al., 2017; McNulty et al., 2007). For the southern Appalachian Mountains, simple mass balance approaches yield critical loads similar to those derived from empirical approaches for forest health and biogeochemical responses. In a recent study employing a mass balance model for the Great Smoky Mountains National Park, Pardo et al. (2018) quantified critical loads for spruce–fir, beech, and mixed deciduous forests in the range of 2.8 to 7 kg N ha−1 yr−1, with the highest value corresponding to a high-elevation spruce–fir site experiencing disturbance-induced regrowth. Accurate and complete deposition budgets (i.e., including all forms of N) are required to quantify the amount of N input to ecosystems in excess of the critical load (i.e., the critical load exceedance).
Estimates of N deposition for critical load assessments can be derived from gridded chemical transport models (CTMs) (Ellis et al., 2013; Lee et al., 2016; Simkin et al., 2016; Clark et al., 2018; Makar et al., 2018), measurement–model fusion (MMF) techniques that combine measurements with CTM output (Schwede and Lear, 2014; Nanus et al., 2017; McDonnell et al., 2018; U.S. EPA, 2019), or inferential modeling with site-specific measurements (Flechard et al., 2011; Li et al., 2016). While these approaches reflect the state of the science and are widely used, they collectively suffer from incompleteness of the N deposition budget (and are therefore biased low) (Walker et al., 2019a). Monitoring networks for wet deposition (NADP/NTN) and air concentrations of Nr (CASTNET) focus only on inorganic species, excluding organic forms of N, which account for ∼ 25 % of total N in wet deposition on average (Jickels et al., 2013). Due to difficulties in sampling (Walker et al., 2012) and the inability to fully speciate the wide range of constituents (Neff et al., 2002a; Altieri et al., 2012, 2018; Cape et al., 2011; Samy et al., 2013; Chen et al., 2018), organic N is not routinely monitored. Hence, deposition of organic N remains uncertain, and thus N deposition budgets developed from network monitoring data and CTMs remain incomplete.
Current N deposition estimates also have a relatively high degree of uncertainty in the estimation of dry deposition. While wet deposition is routinely measured, direct measurements of dry Nr deposition (i.e., flux measurements) in North America are relatively few (Walker et al., 2020). Estimates of dry deposition for ecosystem assessments are therefore derived from models (Schwede and Lear, 2014; Li et al., 2016; Lee et al., 2016). Of the inorganic N species, NH3 is the most important contributor to dry deposition in many areas (Walker et al., 2019b) but also the most uncertain (Flechard et al., 2011) due to the bidirectionality of surface–atmosphere exchange. A paucity of flux measurements (Walker et al., 2020) precludes bias correction of dry deposition in CTMs and MMF techniques, making dry deposition much more uncertain relative to wet deposition.
The Coweeta study site represents southern Appalachian Mountain forests, which are highly diverse and productive ecosystems that provide a variety of ecosystem services, including a source of surface drinking water (Caldwell et al., 2014). While deposition of oxidized N to forests in the southeastern US has declined in response to the Clean Air Act, montane ecosystems continue to receive high rates of deposition due to elevation-induced precipitation gradients (Weathers et al., 2006; Knoepp et al., 2008). Southern Appalachian forests continue to show signs of sensitivity to N deposition. For example, litterfall N fluxes and foliar N concentrations at Coweeta have steadily increased over the past 2 decades (Knoepp et al., 2018). Highly spatially variable meteorological patterns typical of complex terrain are difficult to model (Lehner and Rotach, 2018), leading to uncertainties in precipitation amounts and wet deposition (Zhang et al., 2018) as well as the micrometeorological processes that govern dry deposition (Cowan et al., 2022). Estimates of deposition from gridded CTMs in mountainous terrain therefore contain a higher degree of uncertainty relative to low-elevation ecosystems. For these reasons, a better understanding of total N deposition in southern Appalachian forests is needed.
This study investigates the N deposition budget in a remote montane forest in the southeastern US. We combine long-term (1978–2020) and seasonal intensive (2015–2016) measurements of wet deposition, speciated air concentrations of Nr, micrometeorology, biogeochemistry, and forest canopy structure with in situ inferential dry deposition modeling to develop an annual, speciated, total N deposition budget, including net and component NH3 fluxes as well as dry and wet organic N deposition. Seasonal and annual total N deposition fluxes are presented in the context of long-term trends in air concentrations and wet deposition of inorganic N species. Spatial representativeness is characterized using measurements of air concentrations of the primary inorganic N species and previous wet deposition measurements along an elevation gradient across the topographically complex forested basin.
2.1 Site description
The study was conducted at the USDA Forest Service Coweeta Hydrologic Laboratory, a 2185 ha experimental forest in southwestern North Carolina, USA (35.0605∘ N, 83.4305∘ W), near the southern end of the Appalachian Mountain chain. Topography is complex, with elevations ranging from 681 to 1594 m within the Coweeta Basin. Mean annual temperature and precipitation are 12.9 ∘C and 1795 mm, respectively. Dominant overstory species are Liriodendron tulipifera, Quercus alba, Betula lenta, and Acer rubrum, which comprise 24 %, 18 %, 11 %, and 8 % of the basal area, respectively, in the low-elevation forests where the study was conducted (Oishi et al., 2018). The dominant understory woody shrub species is Rhododendron maximum (evergreen),which comprises 15 % of the basal area (Oishi et al., 2018). Species composition in the vicinity of the eddy flux tower (EFT), further described below, is detailed in Table S1 in the Supplement. Canopy height surrounding the EFT is ∼ 30 m.
The Coweeta Basin has been a long-term monitoring site for atmospheric chemistry and deposition since the late 1970s. Weekly wet deposition of ammonium (NH) and nitrate (NO), along with sulfate (SO), chloride, and base cations, has been measured as part of the NADP/NTN (Site NC25, https://nadp.slh.wisc.edu/networks/national-trends-network/, last access: 1 November 2022) since 1978. Weekly integrated air concentrations of particulate NH, NO, SO, chloride, and base cations, as well as nitric acid (HNO3) and sulfur dioxide (SO2), have been measured by CASTNET (Site COW137, https://www.epa.gov/castnet, last access: 1 November 2022) since 1987. Since 2011, biweekly integrated air concentrations of ammonia (NH3) have been measured by the NADP Ammonia Monitoring Network (AMoN Site NC25, https://nadp.slh.wisc.edu/networks/ammonia-monitoring-network/, last access: 2 November 2022). Here we use these datasets to place our study results into historical context, to supplement the more intensive atmospheric chemistry measurements described below, and to use as inputs for inferential modeling of dry deposition. The long-term NADP and CASTNET measurements are collected in the lower part of the basin, indicated as NC25/COW137 in Fig. 1.

Figure 1Elevation map of Coweeta Basin with sampling sites in Table 1 indicated.
2.2 Southern Appalachian Nitrogen Deposition Study
Building on the long-term NADP and CASTNET measurements described above, the Southern Appalachian Nitrogen Deposition Study (SANDS) was conducted in 2015 and 2016 to better understand the atmospheric chemistry and deposition of reactive nitrogen at Coweeta. Intensive measurement campaigns were conducted from 21 May–9 June 2015, 6–25 August 2015, 9–26 September 2015, 19 April–11 May 2016, and 13 July–3 August 2016. A subset of measurements was conducted continuously between February 2015 and August 2016. As described below, time-resolved and time-integrated measurement techniques were used to characterize organic N in the gas phase, in particulate matter, and in wet deposition; the temporal variability of air concentrations of gas-phase oxidized and reduced forms of N; and the spatial variability of atmospheric N concentrations across the Coweeta Basin. Vertical profiles of air concentrations were measured within the forest canopy to examine source–sink processes, and measurements of soil and vegetation chemistry were conducted to characterize NH3 emission potentials. Measurements were combined with NADP and CASTNET data to develop seasonal and annual total N deposition budgets employing inferential modeling for the dry deposition component. Vertical concentration profile and biogeochemical measurements were used to inform the parameterization of NH3 bidirectional exchange. Sampling locations are described in Fig. 1 and Table 1. Measurement details are summarized in Table 2.
Table 1Sampling locations and type of sampler deployed.
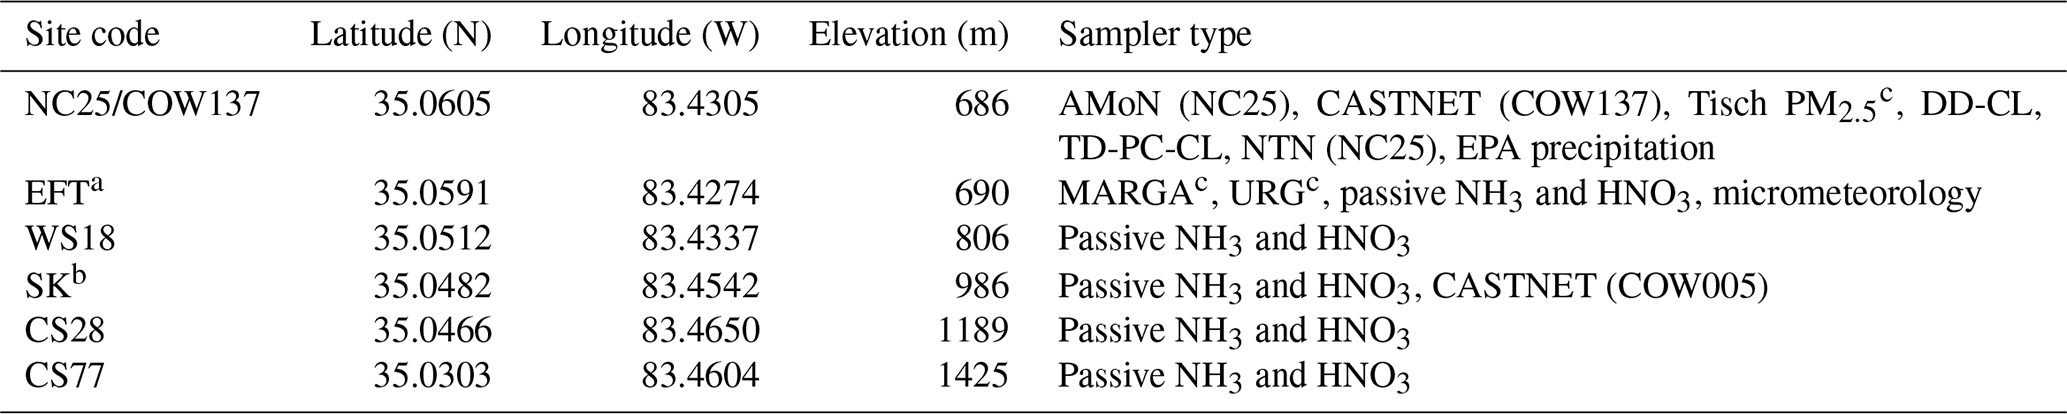
a Eddy flux tower. b Screwdriver Knob. c Tisch PM2.5, MARGA, and URG denuder and filter pack samplers were deployed only during intensive sampling periods.
Table 2Details of intensive and long-term atmospheric measurements at Coweeta.
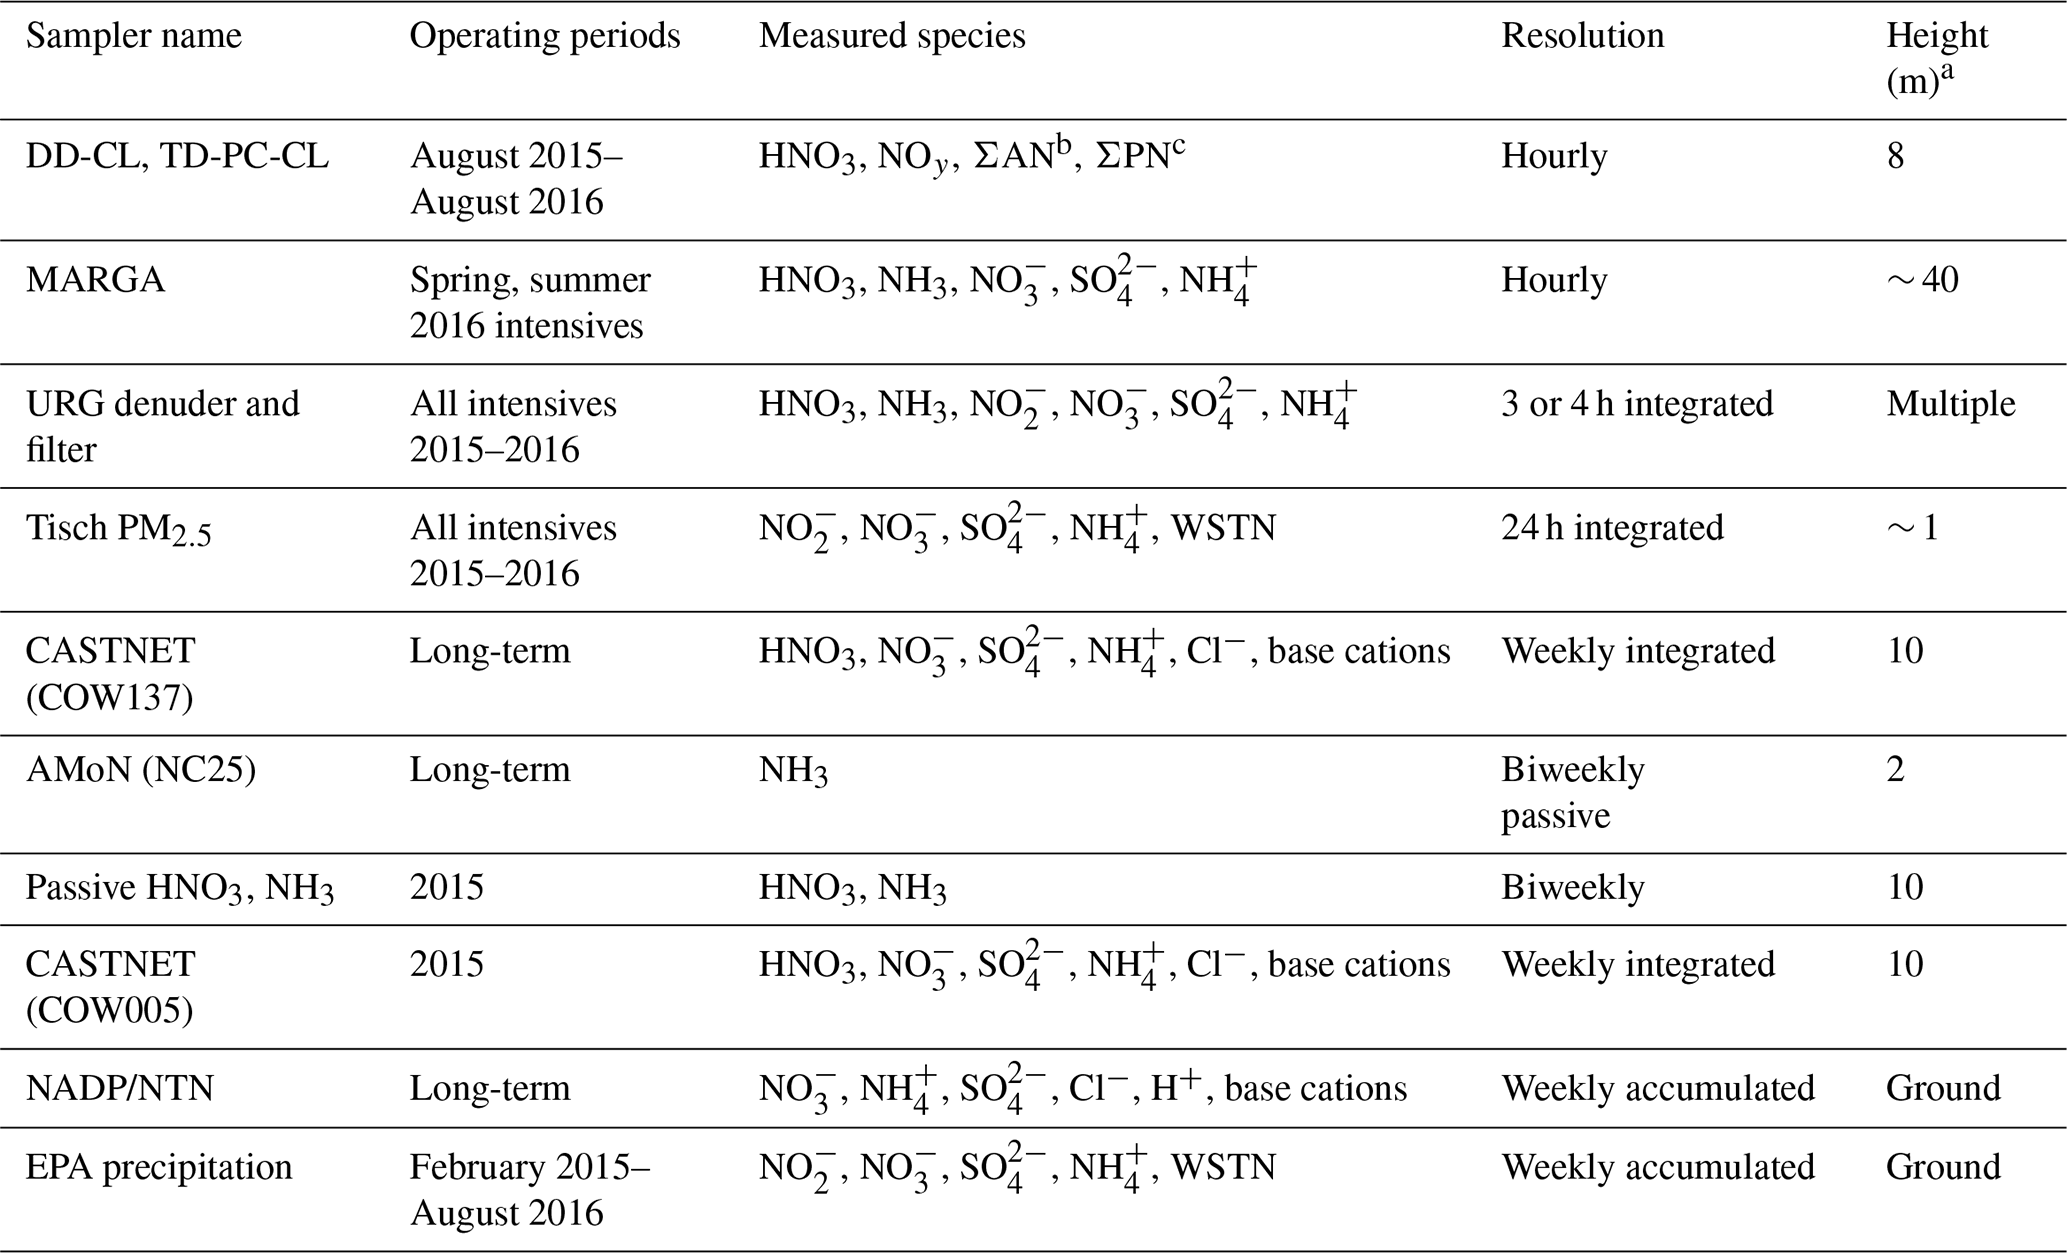
a Above ground. b Total alkylnitrates. c Total peroxynitrates
2.2.1 Wet deposition
Additional wet deposition measurements were conducted adjacent to the NTN NC25 sampler to quantify the contribution of bulk water-soluble organic N (WSON) to water-soluble total nitrogen (WSTN) in precipitation. Weekly precipitation samples were collected in a modified wet-only sampler with a borosilicate glass funnel and amber glass bottle (Walker et al., 2012), shielded from sunlight, and maintained in the field under continuous refrigeration to maintain the stability of ON until retrieval (Walker et al., 2012). Samples were sent to the NADP Central Analytical Laboratory on ice for analysis of NH, NO, NO, and WSTN as described by Walker et al. (2012). WSON concentration was calculated as
The method detection limit for WSON is 10 µg N L−1 (Walker et al., 2012). These measurements were collected continuously from February 2015 to August 2016.
During the spring of 2015, thymol was added to the precipitation collection bottle as a biocide to inhibit organic nitrogen loss in the sample should the refrigerated collector malfunction or lose power. Thymol negatively affected the precision of the total nitrogen measurement, and its use was discontinued in fall of 2015. Ultimately, there were no issues with the refrigerated collector, and the thymol-containing samples were excluded from the analysis presented herein. However, this data loss resulted in a gap from August 2015 to mid-October 2015 of the 12-month period for which the total deposition budget is developed. The data gap comprised eight weekly periods in which precipitation occurred. For this period, the NH and NO concentrations from the collocated NADP/NTN NC25 sampler were used. Based on the SANDS measurements, the ON concentration during this period was estimated by assuming that NH + NO contributes 89 % of total nitrogen in rainfall, with WSON representing the balance (11 %). For the annual budget, weekly concentrations were combined with measured precipitation depth to calculate weekly deposition (kg N ha−1). Comparison between SANDS and NTN concentrations of NH and NO showed very good agreement (Sect. S1 in the Supplement, Fig. S1).
2.2.2 Air concentrations
Hourly concentrations of NOy, HNO3, total gas-phase peroxy nitrates (ΣPN), and total gas-phase alkyl nitrates (ΣAN) were measured continuously from August 2015 to August 2016 at the height of 8 m adjacent to the COW137 CASTNET tower (Fig. 1, Tables 1 and 2). NOy and HNO3 were measured using a modified model 42S NO–NO2–NOx analyzer; the NOy technique is described in detail by Williams et al. (1998). Briefly, total oxidized reactive nitrogen (NOy) is converted to NO using a molybdenum catalyst heated to 325 ∘C. On a second channel, a metal denuder coated with potassium chloride (KCl) is used to remove HNO3 before passing through a second molybdenum converter heated to 325 ∘C. The difference between the total NOy measurement and the HNO3-scrubbed NOy measurement is interpreted as HNO3. Here we refer to the method as denuder difference chemiluminescence (DD-CL).
Total peroxynitrates (ΣPNs) and total alkylnitrates (ΣANs) were measured using a modification of the technique described by Day et al. (2002), in which PNs and ANs are thermally decomposed to NO2 followed by measurement of the incremental NO2 above ambient background for each decomposition step. Day et al. (2002) quantified NO2 via laser-induced fluorescence, while photolytic conversion to NO and quantification of the resulting NO by NO-O3 chemiluminescence is used in the current study. Here we refer to the method as thermal-decomposition photolytic-conversion chemiluminescence (TD-PC-CL). A single chemiluminescence analyzer was used for NOy, HNO3, ΣPN, and ΣAN measurements. Additional detail on the instrument and associated QA/QC procedures is included in Sect. S2.
Hourly concentrations of NH3 and HNO3 were measured on the eddy flux tower (EFT, Fig. 1, Tables 1 and 2) at two heights above the canopy (34 and 37.5 m a.g., above ground, during spring 2016; 34 and 43.5 m a.g. during summer 2016) using the Monitor for Aerosols and Gases in Ambient Air (MARGA, Metrohm Applikon B.V., the Netherlands). Details and principles of the MARGA system have been previously described (Rumsey and Walker, 2016; Chen et al., 2017). Briefly, the MARGA 2S consisted of two sampler boxes positioned on the tower and a detector box located in a climate-controlled enclosure at the base of the tower. Sample boxes comprised an inlet of 1.27 cm outer diameter 30 cm long perfluoroalkoxy Teflon tubing with no particle size selection, through which airflow was mass-controlled at ∼ 16.7 L min−1, a wet rotating denuder (WRD) for collection of soluble gases, and a steam jet aerosol collector (SJAC). Liquid sample from the WRD and SJAC is continuously drawn from the sample boxes down the tower to the analytical box for analysis by ion chromatography (IC) on an hourly basis at the detector unit located in a climate-controlled enclosure at the base of the tower. At the beginning and end of the measurement intensive, multi-level liquid NO and NH standards were introduced at the WRD and SJAC, with airflow turned off, to assess the analytical accuracy of the NH3 and HNO3 measurement. MARGA measurements were conducted during the spring and summer 2016 intensives. Comparisons of continuous and time-integrated methods for HNO3 and NH3 are summarized in Sect. S1 (Figs. S2 and S3).
Concentrations of NH3, HNO3, SO2, NH, NO, and SO in air were measured concurrently on the EFT at 10 heights from just above the forest floor (0.5 m a.g.) to several meters above the canopy (upper height of 37 m a.g. during spring 2016, 43.5 m a.g. during summer 2016) using a glass annular denuder and filter pack (URG Corporation, Chapel Hill, NC) system. The sampling assembly included a 1 % Na2CO3-coated denuder for collection of acid gases followed by a 1 % H3PO3-coated denuder for collection of NH3, a filter pack containing a primary Teflon filter for collection of aerosol, and a backup Nylon filter (47 mm, Pall Corp, Port Washington, NY) to collect HNO3 liberated by dissociation of NH4NO3 on the primary filter. Inlets were Teflon-coated glass impactors with a nominal 2.5 µm aerodynamic diameter cut point (URG Corporation, Chapel Hill, NC). Sample durations were typically 3 or 4 h at a flow rate of ∼ 16.7 L min−1. Flow rates were controlled by critical orifice and were verified before and after each sampling period with a NIST-traceable primary standard flowmeter (Bios DryCal DC-Lite flowmeter, Mesa Laboratories, Inc., Lakewood, CO).
Denuders and filters were extracted with 10 mL of deionized water and analyzed by ion chromatography (IC, Dionex model ICS-2100, Thermo Scientific, Waltham, MA). Extracts were analyzed for cations using Dionex IonPac 2 mm CG12 guard and CS12 analytical columns; separations were conducted using 20 mM methanesulfonic acid (MSA) as eluent at a flow rate of 0.25 mL min−1. Anions were analyzed (IonPac 2 mm AG23 guard column, AS23 analytical columns) using an isocratic eluent mix of carbonate–bicarbonate (4.5 : 0.8 mM) at a flow rate of 0.25 mL min−1. Multi-point (≥ 5) calibrations were conducted using a mixture prepared from individual inorganic standards (Inorganic Ventures, Christiansburg, VA). A midlevel accuracy check standard was prepared from certified standards mix (AccuStandard, New Haven, CT) for quality assurance and quality control. Profile measurements were conducted during each of the five SANDS intensives.
Bulk organic nitrogen in aerosols was measured using a high-volume (Hi-Vol) Tisch TE-1000 (Tisch Environmental, Cleves, OH) dual cyclone PM2.5 sampler operated at a flow rate of 230 L min−1. The unit was deployed at ground level adjacent to the COW137 CASTNET tower and collected 24 h (started at 07:00 local time) integrated samples on pre-baked (550 ∘C for 12 h) quartz-fiber (QF) filters (90 mm, Pall Corp, Port Washington, NY). Field blanks were collected the same way except being loaded in the sampler without the pump switched on. A QF punch (1.5 cm2) from each sample was extracted with deionized water (18.2 MΩ cm, Milli-Q reference system, Millipore, Burlington, MA) in an ultrasonic bath for 45 min. The sample extract was filtered through a 0.2 µm pore size polytetrafluoroethylene membrane syringe filter (Iso-disc, Sigma Aldrich, St. Louis, MO) before subsequent analyses.
Water-soluble total N (WSTN) concentrations were measured using a high-temperature catalytic combustion and chemiluminescence method that included a total organic carbon analyzer (TOC-VCSH) combined with a total nitrogen module (TNM-1) (Shimadzu Scientific Instruments, Columbia, MD). Briefly, the TN module converts all nitrogen compounds to NO at 720 ∘C in a combustion chamber, and NO is quantified by NO2 chemiluminescence through reaction with ozone. A five-point calibration was conducted with KNO3 standard solution for each batch of samples. Before and after each batch of samples was analyzed, quality assurance checks and analyses, including lab deionized and accuracy check standards, were conducted to ensure accuracy and precision. Inorganic species (NH, NO, NO) were analyzed by IC as described above, and WSON was calculated according to Eq. (1). Comparisons of Hi-Vol and CASTNET PM measurements are summarized in Sect. S1 (Fig. S4).
To evaluate the spatial distribution of gaseous N across the Coweeta Basin, additional passive sampling of HNO3 and NH3 was conducted across an elevation gradient for the full year of 2015 (Fig. 1, Tables 1 and 2). Samplers were deployed for 2-week periods at the height of 10 m a.g. on an aluminum tilt-down tower. NH3 measurements followed AMoN methods. HNO3 was collected on 47 mm Nylon filters (Nylasorb, Pall Corp, Port Washington, NY) as described by Bytnerowicz et al. (2005). NH3 and HNO3 sampler preparation and analysis was performed by the NADP Central Analytical Laboratory and CASTNET laboratories, respectively. Field calibration of the passive HNO3 measurements (Fig. S5) was based on comparison with a collocated CASTNET sampler at the Screwdriver Knob site (Fig. 1, Tables 1 and 2), which also operated for the full year of 2015.
2.2.3 Micrometeorology
Site characteristics of micrometeorology and ecosystem fluxes of water and carbon dioxide have been previously described (Novick et al., 2013, 2014; Oishi et al., 2018). Three-dimensional wind components were measured by a sonic anemometer (model 81000, R.M. Young Company, Traverse City, MI) above the forest canopy on the EFT. Momentum and kinematic heat fluxes were determined by eddy covariance (EC) from sonic data. For EC calculations, raw 10 Hz sonic data were processed into hourly averages after block average detrending and 2D coordinate rotation (Novick et al., 2013). Air temperature and relative humidity (RH) were measured at the top of the tower (EC155, Campbell Scientific, Logan, UT) and canopy height (HMP-45, Vaisala, Helsinki, Finland). Photosynthetically active radiation (PAR; LI-190, LI-COR Biosciences, Lincoln, NE) as well as upward and downward shortwave and longwave radiation (CNR 4, Kipp & Zonen, Delft, the Netherlands) were measured at the top of the tower. Surface wetness was measured in the canopy crown, in the understory, and at the ground using leaf wetness sensors (model 237, Campbell Scientific). Soil volumetric water content (VWC) averaged over 0–30 cm depth was measured in four locations around the tower using water content reflectometers (CS616, Campbell Scientific). Soil temperature was measured at four depths (5, 20, 35, and 55 cm) in two locations near the tower using thermistors. For missing data, linear interpolation was used to fill short gaps (1–4 h). Longer gaps were filled by substitution using the average hourly diel profile calculated for each month. Micrometeorological data were used for inferential dry deposition modeling as described below.
2.2.4 Biogeochemistry
Ammonia emission potentials (Γ) and compensation points for live vegetation, leaf litter on the forest floor, and soil were estimated from measurements of NH and pH in the leaf and litter tissue and soil pore water (Massad et al., 2010). Green leaves were collected from 18 species (Table S1) within the flux footprint of the tower and other locations in the Coweeta Basin. Leaf litter was collected along transects extending ∼ 100 m to the northeast and southwest (i.e., predominant wind directions) of the flux tower. Litter included a composite of intact leaves and leaf fragments and excluded the more decomposed material at the top of the organic soil layer. Approximately 5 g of leaf tissue was ground in liquid nitrogen using a mortar and pestle and small coffee grinder, then extracted with 20 mL of deionized water. pH was determined directly on the extracts (Oakton pH 2100 m, Mettler Toledo InLab Micro electrode). The [NH] in the extracts, which reflects the bulk tissue concentration, was determined by ion chromatography as described above for denuder measurements either directly or, for samples with high organic content, after separation of the NH from the solution as NH3 using headspace equilibration. For the headspace method, 5 mL of tissue extract was added to a 250 mL high-density polyethylene jar containing two ALPHA passive samplers (Center for Ecology and Hydrology; Tang et al., 2001), without the diffusion barrier, affixed to the interior of the lid. The jar was sealed, and 5 mL of 0.3 N NaOH was added to the extract via a septum. The NH3 liberated from the liquid extract into the headspace was collected by the passive diffusion samplers over a period of 48 h, after which the passive sampler was extracted with 10 mL of deionized water. Extracts were then analyzed by ion chromatography as described above.
Emission potentials of the vegetation (Γs) and litter (Γl) were estimated from measured concentrations of [H+] (M) and [NH] (µg g−1 tissue fresh weight) in the bulk tissue as
where LD is leaf density (kg L−1 fresh tissue, equivalent to g cm−3 fresh tissue). In this case, LD values for woody deciduous and woody evergreen species are 0.37 and 0.42 kg L−1, respectively (Poorter et al., 2009). Emission potentials for litter, which consisted of a mix of intact or partial leaves and needles, assume an average density of 0.4 kg L−1. The factor of in Eq. (2) is necessary to convert [NH] from µg NH g−1 tissue to mol NH kg−1 tissue.
Soil chemistry was measured in 20 m × 20 m plots located in the vicinity of the tower. During 2010, soil NH was determined on soil samples collected with polyvinyl chloride cores (5 cm diameter and 10 cm deep) in four locations (replicates) within each of four plots. Samples were collected bimonthly during the growing season. NH was extracted within 2 h of collection using 5 g of sieved (<5 mm) soil in 20 mL of 2 M potassium chloride followed by colorimetric analysis (Astoria2 autoanalyzer, Astoria-Pacific International; Coweeta Hydrologic Laboratory, 2016). Soil pH was measured on 0–10 cm samples collected in three plots in winter of 2013 (each sample representing a composite of 20–25 2.5 cm diameter soil cores). Soil pH was determined directly after mixing 5 g soil with 10 mL 0.01 M calcium chloride (Coweeta Hydrologic Laboratory, 2016). Soil emission potential (Γsoil) (unitless) was estimated directly from measured molar concentrations of [H+] and [NH] as
2.2.5 Above-canopy flux measurements
Above-canopy fluxes of NH3 and HNO3 were quantified from measurements of vertical concentration gradients conducted during the final (summer 2016) intensive when the tower was at maximum height and the greatest vertical separation of concentration measurements was achieved. Fluxes were determined using the modified Bowen ratio (MBR) method (Meyers et al., 1996) as
where Kc and are the eddy diffusivity and vertical concentration gradient of the chemical species of interest. The value of Kc for trace gases was assumed to be equivalent to the eddy diffusivity of heat (Kt), calculated as
where is the kinematic surface heat flux measured by eddy covariance above the canopy (43.5 m a.g.), Δt is the air temperature difference between the levels at 43 and 35 m a.g.l., and Δz is the height interval of air temperature measurements. Air temperature was measured using aspirated thermocouples, and Δt was corrected for a small bias between the sensors determined by collocated comparison. Concentration gradients were determined from URG annular denuder measurements at 34.6 and 43 m a.g.l., as described above in Sect. 2.2.2. Given the complexity of the topography, no attempt was made to correct for potential roughness sublayer effects on either the eddy diffusivity or concentration gradients, which should be acknowledged as a source of uncertainty in the calculated HNO3 and NH3 fluxes. Additional detail on the gradient measurements is included in Sect. S3.
2.2.6 Seasonal and annual deposition budget
Speciated seasonal and annual total nitrogen deposition budgets were developed for the period August 2015 to August 2016. The wet-deposited components, including NH, NO, and total WSON, were directly measured. Speciated dry deposition was estimated by combining measured air concentrations, micrometeorology, biogeochemistry, and canopy physical characteristics within a box version of the Surface Tiled Aerosol and Gaseous Exchange (STAGE) model, which is an option in the Community Multiscale Air Quality Model (CMAQ) version 5.3 (Appel et al., 2021).
The STAGE model treats the deposition of gases and particles separately. The air–surface exchange of gases is parameterized as a gradient process and is used for both bidirectional exchange and dry deposition following the widely used resistance model of Nemitz et al. (2001) and Massad et al. (2010):
where F is the net flux above the canopy (a negative value represents a net deposition flux and a positive value represents a net emission flux), which is the sum of the component cuticular (Fcut), stomatal (Fs), and ground (Fg) fluxes. The quantity χa(z) is the ambient concentration at a reference height (z), χz0 is the concentration at height d (displacement height) +z0 (roughness length), χg is the ground layer compensation point, Ra is the aerodynamic resistance between z and d+z0, Rg is the total ground resistance including in-canopy aerodynamic resistance (Rinc), ground boundary layer resistance (Rbg), and soil resistance (Rsoil) (), and fveg is the vegetation coverage fraction. The ground is fully covered by vegetation at our forested site, and fveg is therefore set to 1.
The quantity χz0 is related to the canopy (χc) and ground compensation points (χg) according to
where Rbl is the leaf boundary layer resistance. χc follows Nemitz et al. (2001) but is modified to account for a cuticular compensation point (χcut):
where χs is the leaf stomatal compensation point, and Rs and Rcut are the stomatal and cuticular resistances, respectively.
The stomatal, cuticular, and ground compensation points (χs, χcut, χg) are described according to Nemitz et al. (2000a) as a function of temperature (T) and the emission potentials (Γ):
Γcut is set to 0 in this study, and thus there is only deposition to leaf cuticles. For unidirectional exchange of gases other than NH3, Γs and Γg are also set to 0. In the case of NH3, the foliage and ground layers may act as a source or sink depending on the ratio of the ambient concentration to the respective compartment compensation point (Husted and Schjoerring, 1995). Here values of Γ for NH3 are derived from measurements of live vegetation, litter, and soil chemistry as described above. Values used in the base model simulation are described in Sect. 3.6, and the sensitivity of modeled NH3 fluxes to Γ is discussed in Sect. S5.
Formulas for each resistance component are summarized in Table S2. The resistances are largely estimated following Massad et al. (2010) with the following exceptions. The value of Rs is based on the Noah (Chen and Dudhia, 2001) or P-X land surface scheme (Pleim and Xiu, 1995) in the Weather Research and Forecasting (WRF) model, and in this study, the P-X scheme is used. Deposition to wetted cuticular and ground surfaces considers the bulk accommodation coefficient, following Fahey et al. (2017), and can be a limiting factor for highly soluble compounds. The parameterization of Rinc follows Shuttleworth and Wallace (1985) as do Massad et al. (2010) but here uses the canopy momentum attenuation parameterization from Yi (2008) and in-canopy eddy diffusivity following Harman and Finnigan (2007). This parameterization is similar to Bash et al. (2010), and detailed descriptions of model resistances can be found in the references mentioned above.
Dry deposition (F) of aerosol nitrogen (NH and NO) is estimated as the product of the measured concentration (C) and the STAGE-modeled dry deposition velocity (Vd):
Aerosol dry deposition processes include gravitational settling, Brownian diffusion, surface impaction, and rebound. Similar to gases, STAGE calculates the averaged Vd for particles by summing the Vd over vegetative or non-vegetative surfaces, weighted by vegetation cover fraction, which is 1 (full coverage) at Coweeta. Vd for a particle with aerodynamic diameter Dp is calculated as
where Rbp is the boundary layer resistance for particles, and the gravitational settling velocity (Vg) is calculated as
where ρ is the density of the aerosol, g is the acceleration of gravity, μ is the air dynamic viscosity, and Cc is the Cunningham slip correction factor. The turbulent transport processes are considered to be similar for gas and aerosol, and Ra can be formulated based on the similarity theory relationships. Unlike deposition of gases, the boundary layer resistance usually dominates the aerosol deposition process as Brownian diffusion is much slower for particles than molecular diffusion is for gases (Pleim and Ran, 2011). Thus, Rbp depends on the collection efficiency of the surface and can be determined following Shu et al. (2022):
where u∗ is the friction velocity, and Sc is the Schmidt number for particles. The quantity Eim represents the collection efficiency by impaction and follows Slinn (1982) for vegetative canopies and Giorgi (1986) for smooth (non-vegetative) surfaces. The quantity Ff is an empirical correction factor to account for increased deposition during convective conditions, parameterized as
where Vfac is an empirical constant representing the enhanced effects over vegetation canopies. For vegetative canopies, Vfac is equal to the one-sided leaf area index (LAI) with a minimum value of 1, and for non-vegetative surface, a value of 1 is used. The quantity w∗ is the convective velocity scale (Deardorff velocity), defined as
where Tv is virtual air temperature, zi is average depth of the mixed layer, and is the measured kinematic surface heat flux.
A bulk Vd for PM2.5 is obtained by integrating size-resolved Vd according to the particle size distribution. The size distribution profiles for NH and NO are from measurements at eight Canadian rural forest sites (Zhang et al., 2008), and the size distribution for particulate organic nitrogen is estimated as an average of that for NH and NO. Model sensitivities of particle nitrogen fluxes to assumed size distributions are discussed in Sect. S5.
The STAGE model is extracted from CMAQ v5.3 and executed in a one-dimensional mode. The prescribed surface parameters (e.g., z0, d) were modified according to the site conditions. Continuous LAI data were extracted from the MODerate resolution Imaging Spectroradiometer (MODIS) global LAI product (MCD15A2H), which is generated daily at a 500 m spatial resolution, and each data point covers an 8 d period. The MODIS LAI (Fig. S6) was adjusted using in situ canopy measurements as described in Sect. S4. Hourly meteorological measurements, including air temperature, relative humidity, u∗, atmospheric pressure, precipitation rate, global radiation, and soil temperature and moisture, were used to drive STAGE. The Obukhov length, which is defined as
where k is the von Karman constant, was also calculated from micrometeorological measurements.
2.2.7 Air concentrations for dry deposition modeling
Air concentration data used for dry deposition modeling are summarized in Table 3. Hourly measurements of HNO3 by DD_CL as well as ΣAN and ΣPN by TD-PC-CL were conducted for a full year and were therefore used directly for modeling. Over the 12-month sampling period, 18 %, 22 %, and 22 % of hourly HNO3, ΣAN, and ΣPN concentrations were missing or invalid, respectively. Missing data were replaced with the corresponding hour from the median diel profile comprised of days with >75 % completeness. Surrogate formulas of nitrooxy-butanol (C4H9NO4) and PAN (C2H3NO5) were assumed for ΣAN and ΣPN, respectively.
Table 3Summary of air concentration data sources for STAGE dry deposition modeling.
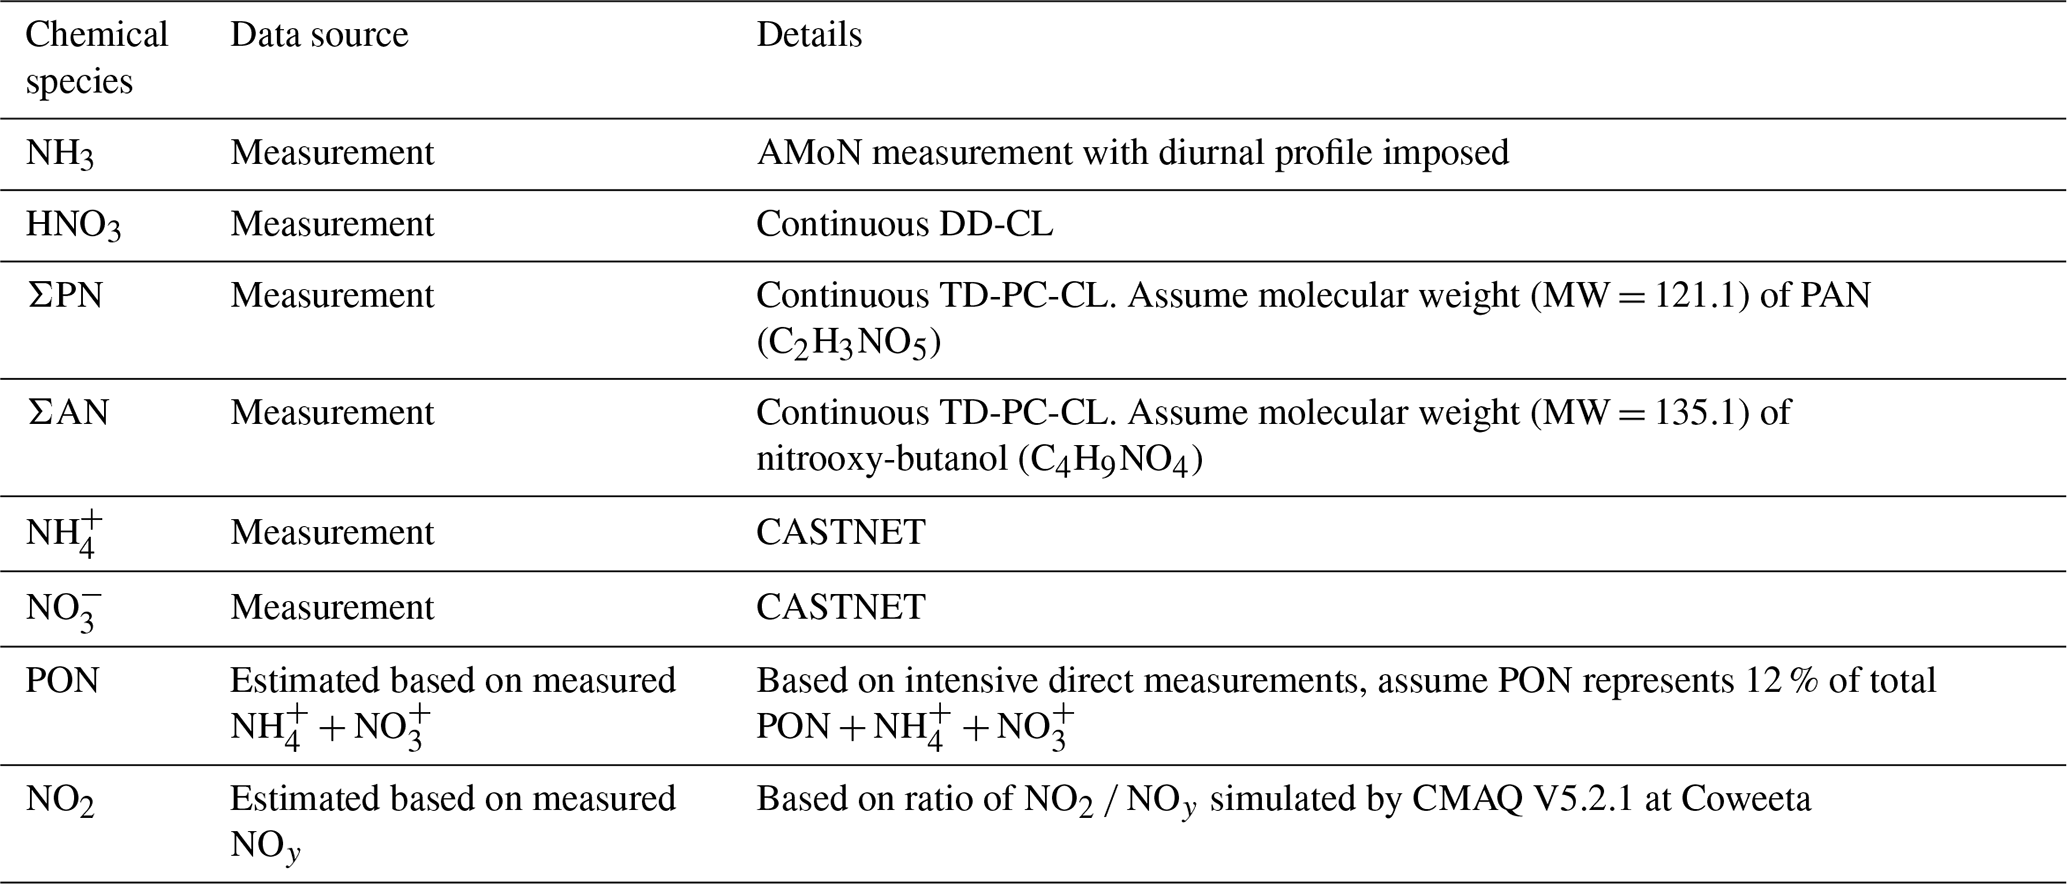
Continuous NH3 concentrations were only measured during the last two intensives. Biweekly AMoN NH3 measurements, with corrections for travel blanks, were used to establish a continuous 12-month time series of air concentration for annual deposition modeling. Ammonia concentrations are known to exhibit pronounced diel patterns, even in remote areas (Wentworth et al., 2016). Variability in air concentration interacts with diel cycles in surface wetness, turbulence, and other factors to influence diel patterns in air–surface exchange rates. To incorporate this interaction, the diel concentration pattern determined during spring and summer 2016 by MARGA NH3 measurements (Fig. S7) was imposed on the biweekly AMoN NH3 concentration. The hourly profile of NH3 concentrations was normalized by the corresponding overall mean concentration to produce a normalized mean diel concentration profile. This profile was then applied to each biweekly AMoN air concentration, temporally scaling the NH3 concentration by time of day while maintaining the measured biweekly AMoN concentration. Gap filling of AMoN data was not required. Comparisons of NH3 measurements are briefly discussed in Sect. S1, Fig. S2.
Hi-Vol measurements of speciated particulate N were only conducted during intensive periods to assess the relative contributions of inorganic and organic fractions to total water-soluble N. The CASTNET particulate NH and NO were used to provide a continuous 12-month time series of air concentration for annual deposition modeling. Concentrations of Hi-Vol and CASTNET measurements were shown to be comparable (Sect. S1, Fig. S4). For the annual time series, particulate organic nitrogen (PON) concentration was estimated based on speciated measurements during intensives, which showed that inorganic N accounts for ∼ 88 % of WSTN on average. Weekly average PON concentration was estimated from the weekly CASTNET measurements assuming that NH + NO represents 88 % of total particulate nitrogen and PON represents the balance (12 %). Weekly concentrations were then expressed at the hourly timescale for modeling. Gap filling of CASTNET data was not required.
Components of the atmospheric reactive N budget that are not routinely measured at Coweeta and were not directly measured during SANDS include NO, NO2, HONO, and N2O5. At the continental scale, regional model simulations suggest that NO, HONO, and N2O5 make minor contributions to the total dry deposition of reactive N (∼ 2 %), though the contribution of NO2 is larger (∼ 6 %) (Walker et al., 2020). While NO, HONO, and N2O5 have been excluded from our modeling analysis, we have included an estimate of NO2 concentration, from which dry deposition is estimated. The “other” fraction of NOy (i.e., NOy–HNO3–ΣPN–ΣAN) measured at Coweeta represents between 47 % (summer) and 76 % (winter) of total NOy on a seasonal basis. This “other” fraction includes NO, NO2, HONO, N2O5, and some NO but is likely dominated by NO2. The measured diel profile of “other” NOy (Fig. S8) concentration shows the typical pattern indicative of morning and evening modes related to mobile NOx emissions. Winds at Coweeta are from the east-northeast during the morning, which is the direction of local residences, the town of Otto, NC, and US Highway 23. Winds are from the west-southwest during the evening, which is the direction of the Nantahala National Forest. Consistent with the diel profile of “other” NOy, a much larger morning peak in NO2 is therefore expected. To estimate the concentration of NO2 from the measured “other” NOy, we examined the ratio of NO2 to the quantity NOy–HNO3–PANS–NTR (e.g., “other” NOy) simulated by CMAQ (V5.2.1) for the Coweeta site over the year 2015; “PANS” represents total peroxy nitrates, and NTR represents other organic nitrates. Relative to the measured NOy species, PANS and NTR are assumed to represent ΣPN and ΣAN, respectively. The ratio of CMAQ-estimated NO2 to “other” NOy ranges from 0.51 during summer to 0.60 during winter. These seasonal factors were applied to the measured “other” NOy to estimate the hourly NO2 concentration. Gap filling procedures for hourly “other” NOy follow those for HNO3, ΣPN, and ΣAN described above. Details of CMAQ V5.2.1 can be found in Table S3.
Regarding the use of measurements from different towers (Table 3) for inferential modeling, we acknowledge that differences in tower position on the landscape (i.e., within the forest –EFT – versus adjacent clearing – COW137) and the height of the measurement above the surface will be sources of variability in air concentrations. Given the complexity of the topography, no attempt was made to correct air concentrations for differences in measurement heights.
3.1 Long-term trends in atmospheric N at Coweeta
Emissions of oxidized nitrogen (NOx) and sulfur (SOx) have declined significantly in the eastern US in response to the 1990 Clean Air Act Amendments. Trend data from the US EPA's National Emissions Inventory (NEI) indicate a nationwide decline of 74 % and 46 % for SOx and NOx emissions from the early 1990s to 2010s, respectively, comparing 1990–1994 to 2010–2014 annual averages (U.S. EPA, 2014). By contrast, NH3 emissions have been reported as relatively unchanged or slightly increasing for the same periods (Ellis et al., 2013; Paulot and Jacob, 2014; Xing et al., 2013), depending on the location and region of the US. Declining NOx and SOx emissions resulted in decreasing trends in air concentrations of HNO3 and SO2 at Coweeta between the 1990s and 2010s (Fig. 2). Concentrations noticeably began to decline in 2008, the timeline of which likely indicates the effect of full implementation of the 2006 Tier 2 Gasoline Sulfur Program, as well as the enactment of the Clean Air Interstate Rule (CAIR), both of which aimed to further reduce NOx and SOx emissions (Sickles and Shadwick, 2015; LaCount et al., 2021). Compared to other species, NH3 concentrations have only been measured at Coweeta for a relatively short period of time.
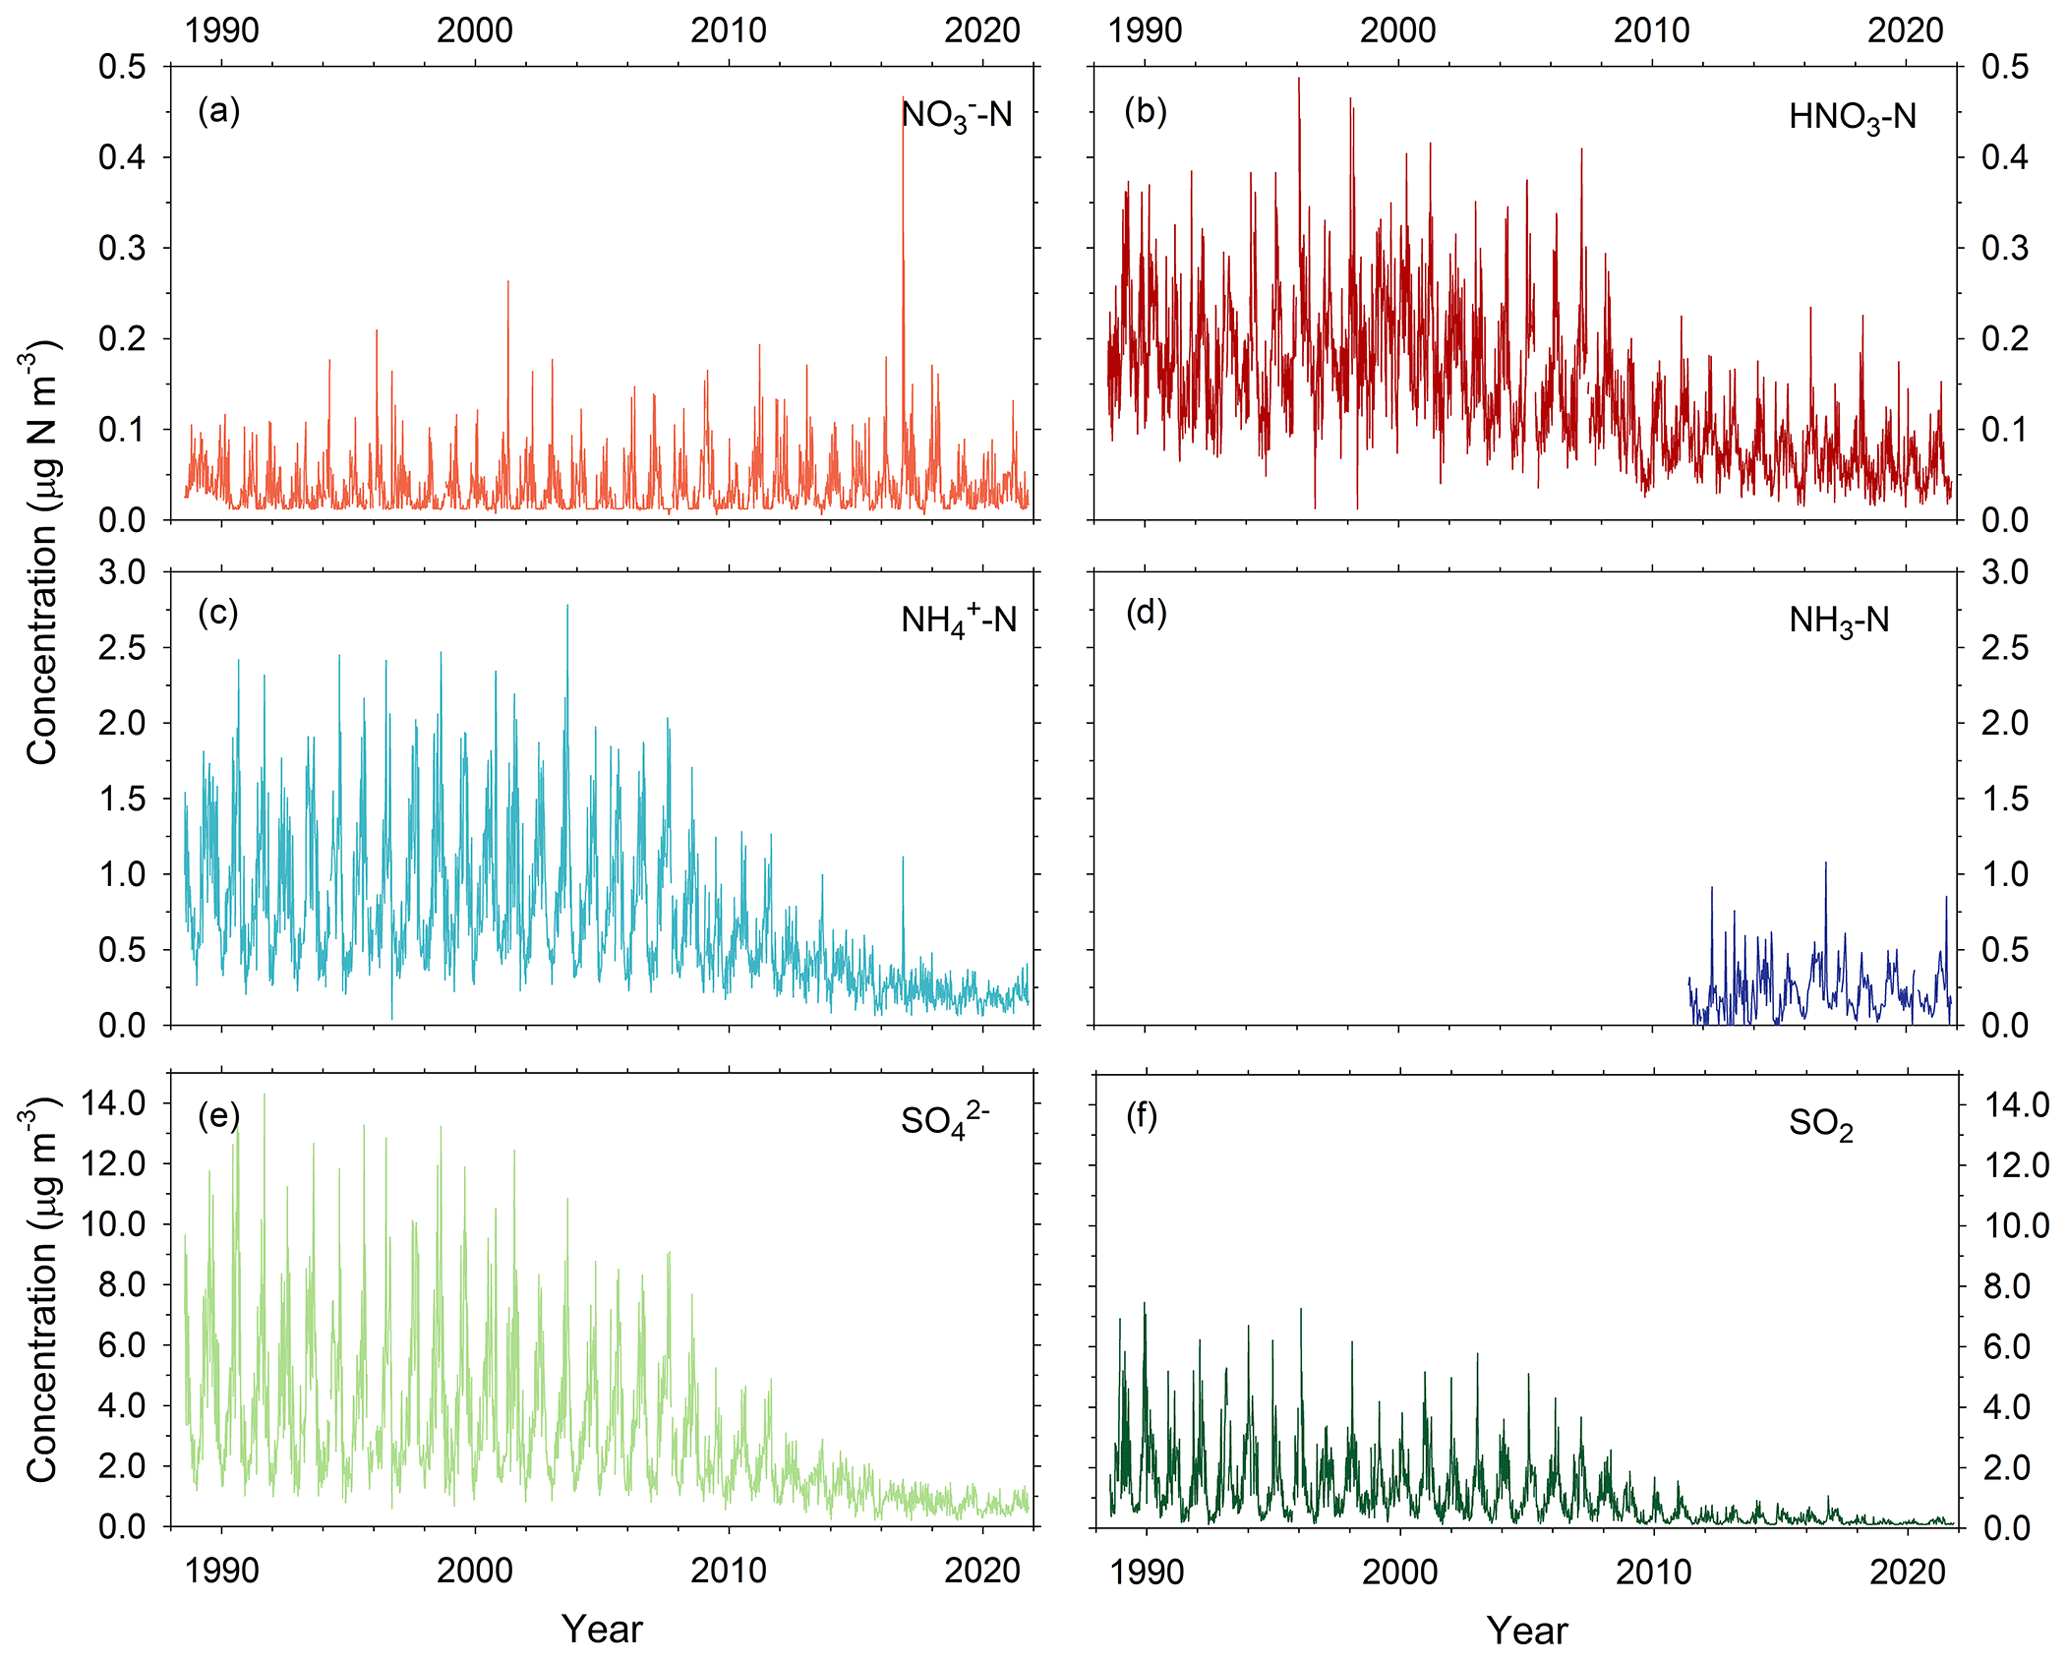
Figure 2Long-term CASTNET (weekly, site COW137) and AMoN (biweekly, site NC25) air concentrations (as N) of NO (a), HNO3 (b), NH (c), NH3 (d), SO (e), and SO2 (f).
Atmospheric NH3 reacts with acidic sulfate to form ammonium sulfate ((NH4)2SO4) or bisulfate ((NH4)HSO4) aerosol. Under favorable thermodynamic conditions (low temperature and high RH), NH3 in excess of acidic sulfate will react with HNO3 to form ammonium nitrate aerosol (NH4NO3). Concentrations of SO at Coweeta have tracked SO2, and subsequently NH concentrations have declined substantially relative to early 1990s levels (Fig. 2). However, concentrations of NO aerosol, which are relatively low at Coweeta, have not followed trends in SO and NH (Fig. 2). Previous studies at other US sites have also reported non-proportional changes in PM2.5 mass in response to SO2 and NOx control strategies (Blanchard and Hidy, 2005; Sickles and Shadwick, 2015). Nonlinear reductions or increases in particulate NO with coincident SO2 and NOx emission reductions relate to the thermodynamic equilibrium of the SO–NO–NH–HNO3–NH3 aerosol system. As ambient SO concentrations decline, the capacity for NH formation (i.e., neutralization) also decreases, leaving additional NH3 in the gas phase. Amounts of NH3 in excess of acidic SO can subsequently react with HNO3 to form NH4NO3, confounding the relationship between NOx emission reductions and atmospheric NO concentrations.
The long-term trend in NO wet deposition at Coweeta (Fig. 3) has tracked the downward trend in ambient HNO3 concentration. Wet deposition of NH, however, shows no apparent trend, in contrast to the decline in NH aerosol concentration. This pattern may relate to the combined effects of changes in regional NH3 emissions, aerosol chemistry, and dry deposition rates on the long-term trend in atmospheric NH3 concentrations. As noted above, declines in SO2 emissions and SO aerosol result in less conversion of NH3 to NH aerosol, leaving more NH3 in the gas phase. Furthermore, reduced air concentrations of acidic species such as SO2 and HNO3 result in lower dry deposition rates and subsequently less acidic deposition surfaces, which in turn reduces the deposition velocity (i.e., increases the atmospheric lifetime) of NH3 (Sutton et al., 2003). In addition to changes in emissions, these two processes are thought to be at least partly responsible for the increases in NH3 air concentrations that have been observed in some locations across the US (Butler et al., 2016; Yu et al., 2018; Yao and Zhang, 2019). While there is no discernable trend in NH3 air concentrations over the relatively short period of record at Coweeta, a decline in wet deposition of NH aerosol may have been offset to some extent by increased wet deposition of NH3 gas (Asman, 1995), which is highly soluble, resulting in an overall lack of trend in NH wet deposition at Coweeta over time. Similar to other areas in the US (Li et al., 2016), the downward trend in NO wet deposition has led to an increase in the relative contribution of reduced forms of N (i.e., NHx = NH3 + NH) to inorganic wet N deposition at Coweeta (NH : NO, Fig. 3).
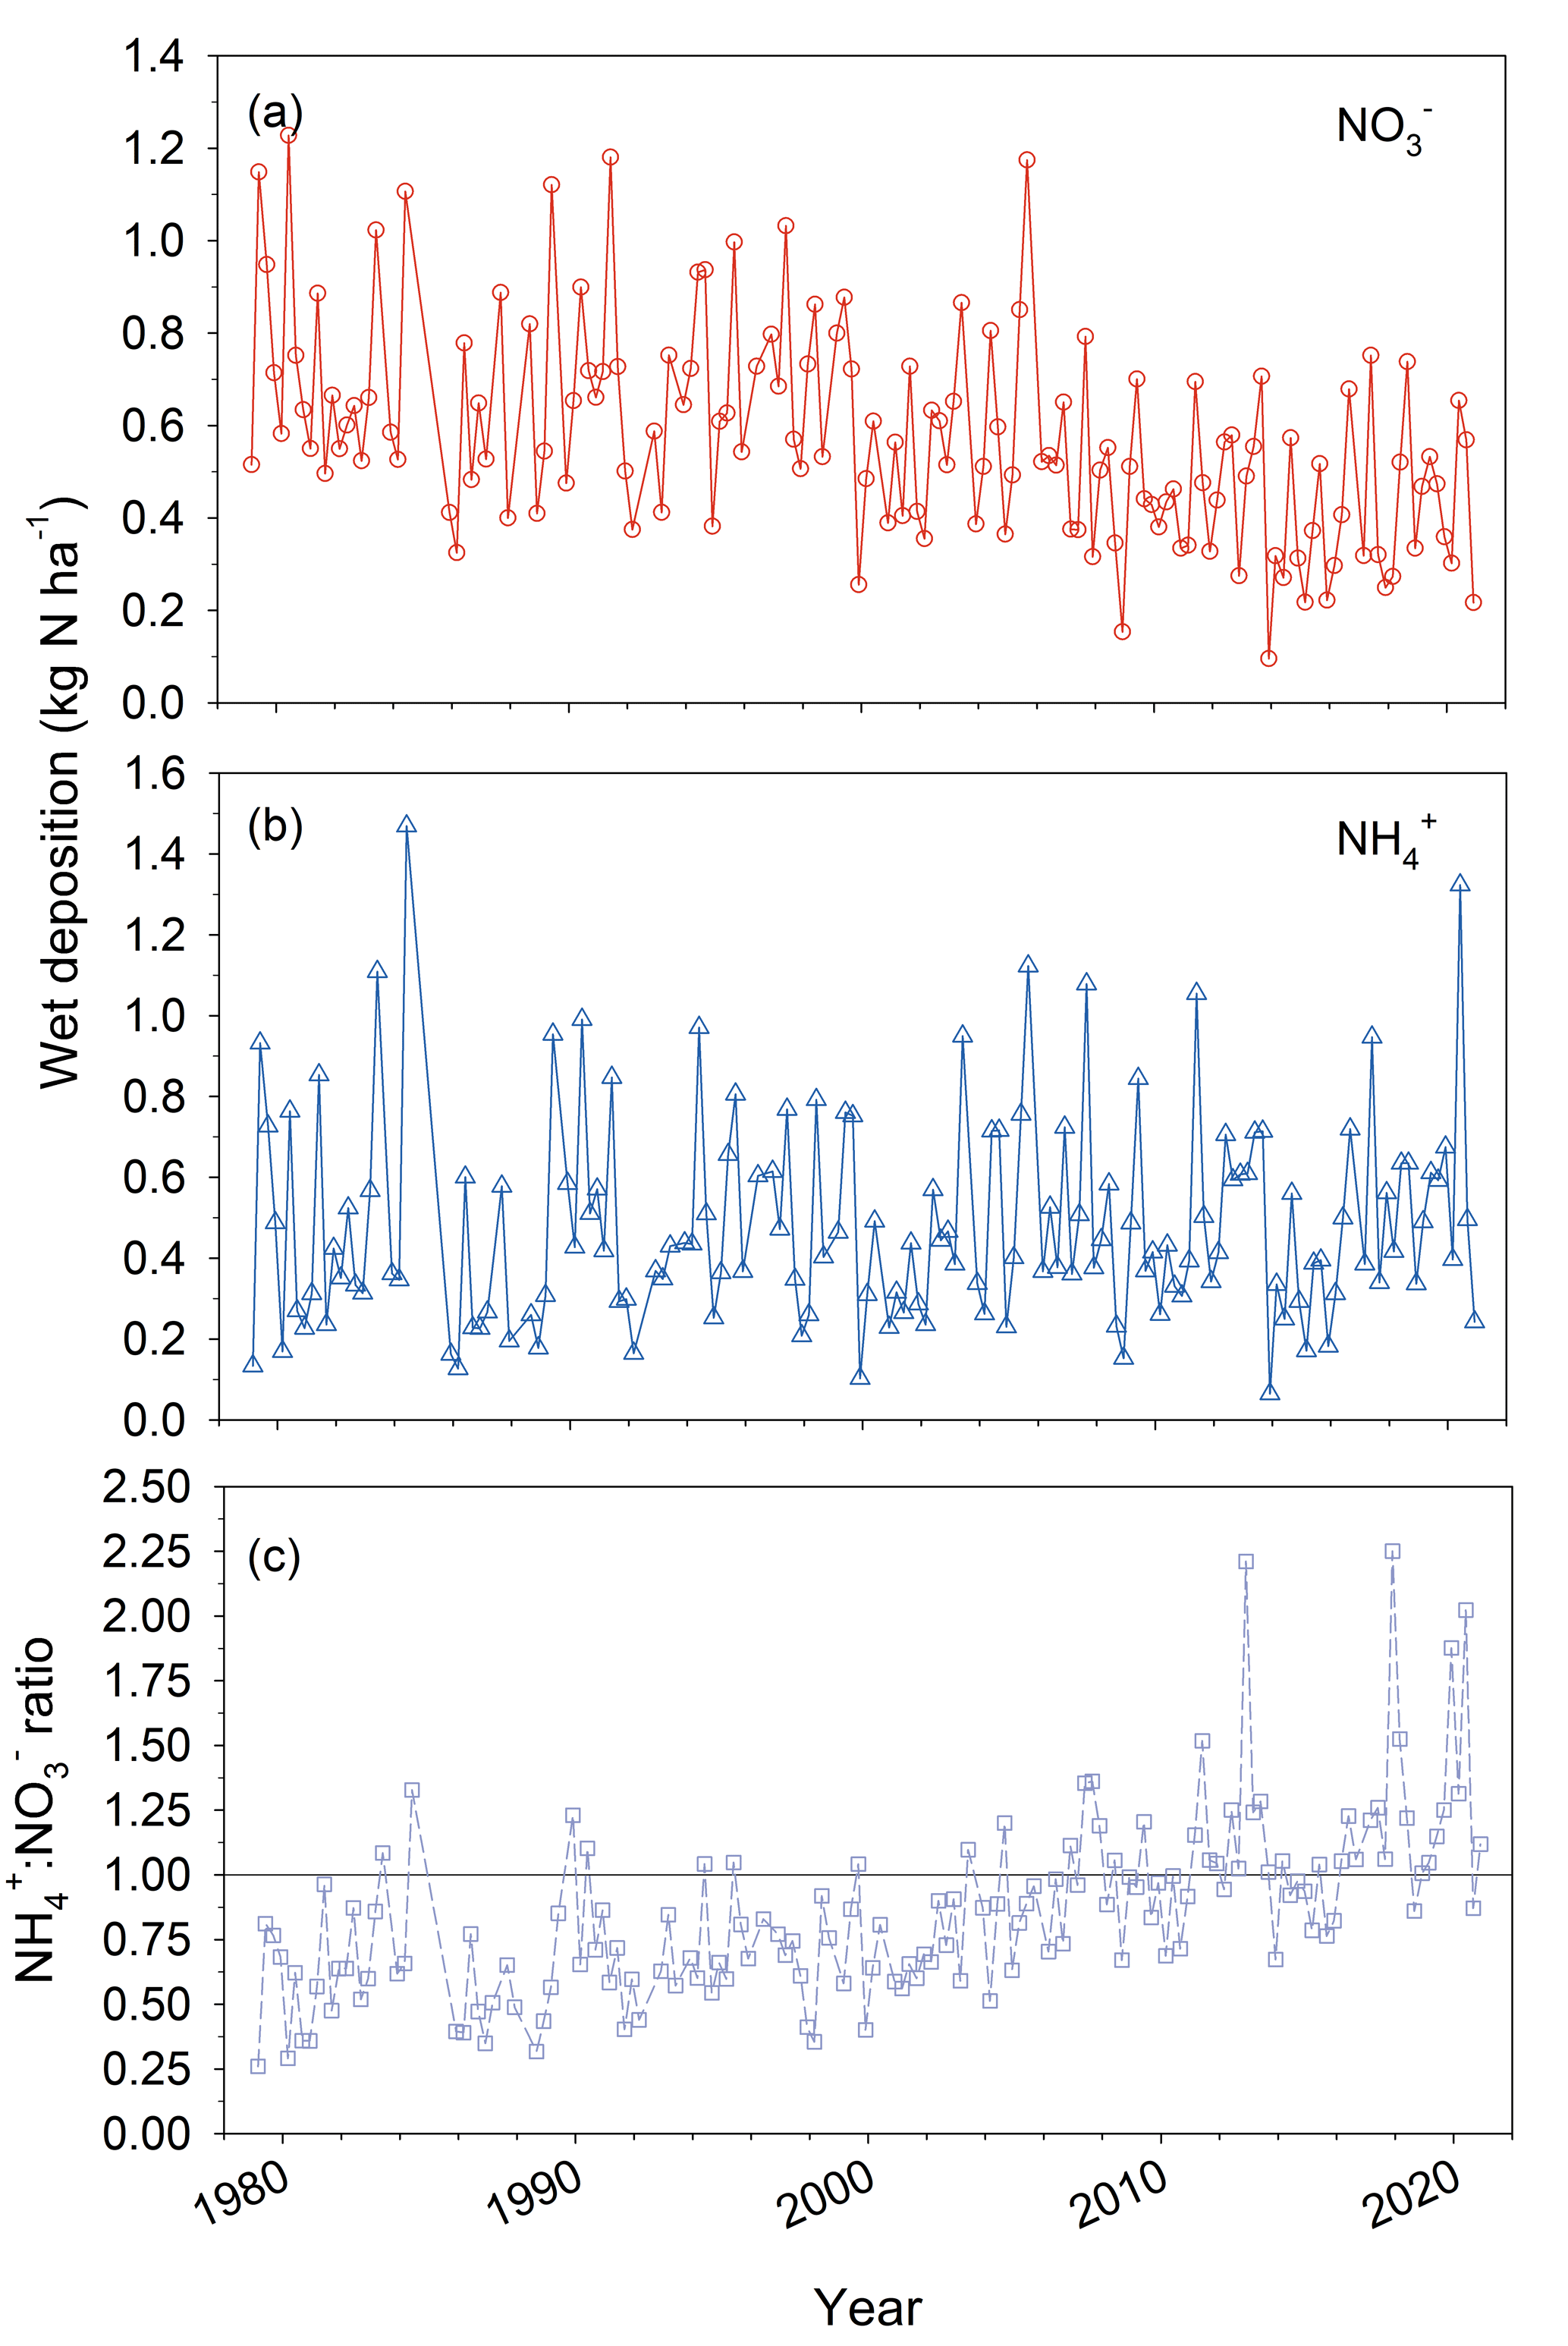
Figure 3Long-term NTN NC25 measurements of seasonal NH (a) and NO (b) wet deposition along with the ratio of NH to NO as nitrogen and a 1 : 1 reference line (c).
3.2 Wet deposition
Of the various forms of N in precipitation, ammonium was the most abundant inorganic species, contributing 47.0 % of WSTN in weekly samples (N=52) on average, followed by NO (41.7 %, Fig. 4, Table S4). The contribution of NO was negligible. Organic compounds (WSON) contributed 11 % of WSTN on average, which is within the range of values (3 % to 33 %) reported for other locations in the US (Scudlark et al., 1998; Whitall and Paerl, 2001; Keene et al., 2002; Beem et al., 2010; Walker et al., 2012; Benedict et al., 2013). While concentrations of N compounds were generally higher during warm months, a seasonal pattern in the percent contribution of WSON to WSTN was not apparent. In a previous study at Coweeta (1994–1996), Knoepp et al. (2008) found that organic nitrogen contributed 21 % of total nitrogen in bulk (wet + dry) deposition samples. Differences between Knoepp et al. (2008) and SANDS results may be related to interannual variability or trends in rainfall composition over the intervening 2 decades (e.g., Fig. 3), differences in collection method (wet only versus bulk deposition), or analytical techniques used for total N analysis (persulfate–UV digestion, Walker et al., 2012, versus total Kjeldahl N, Knoepp et al., 2008).
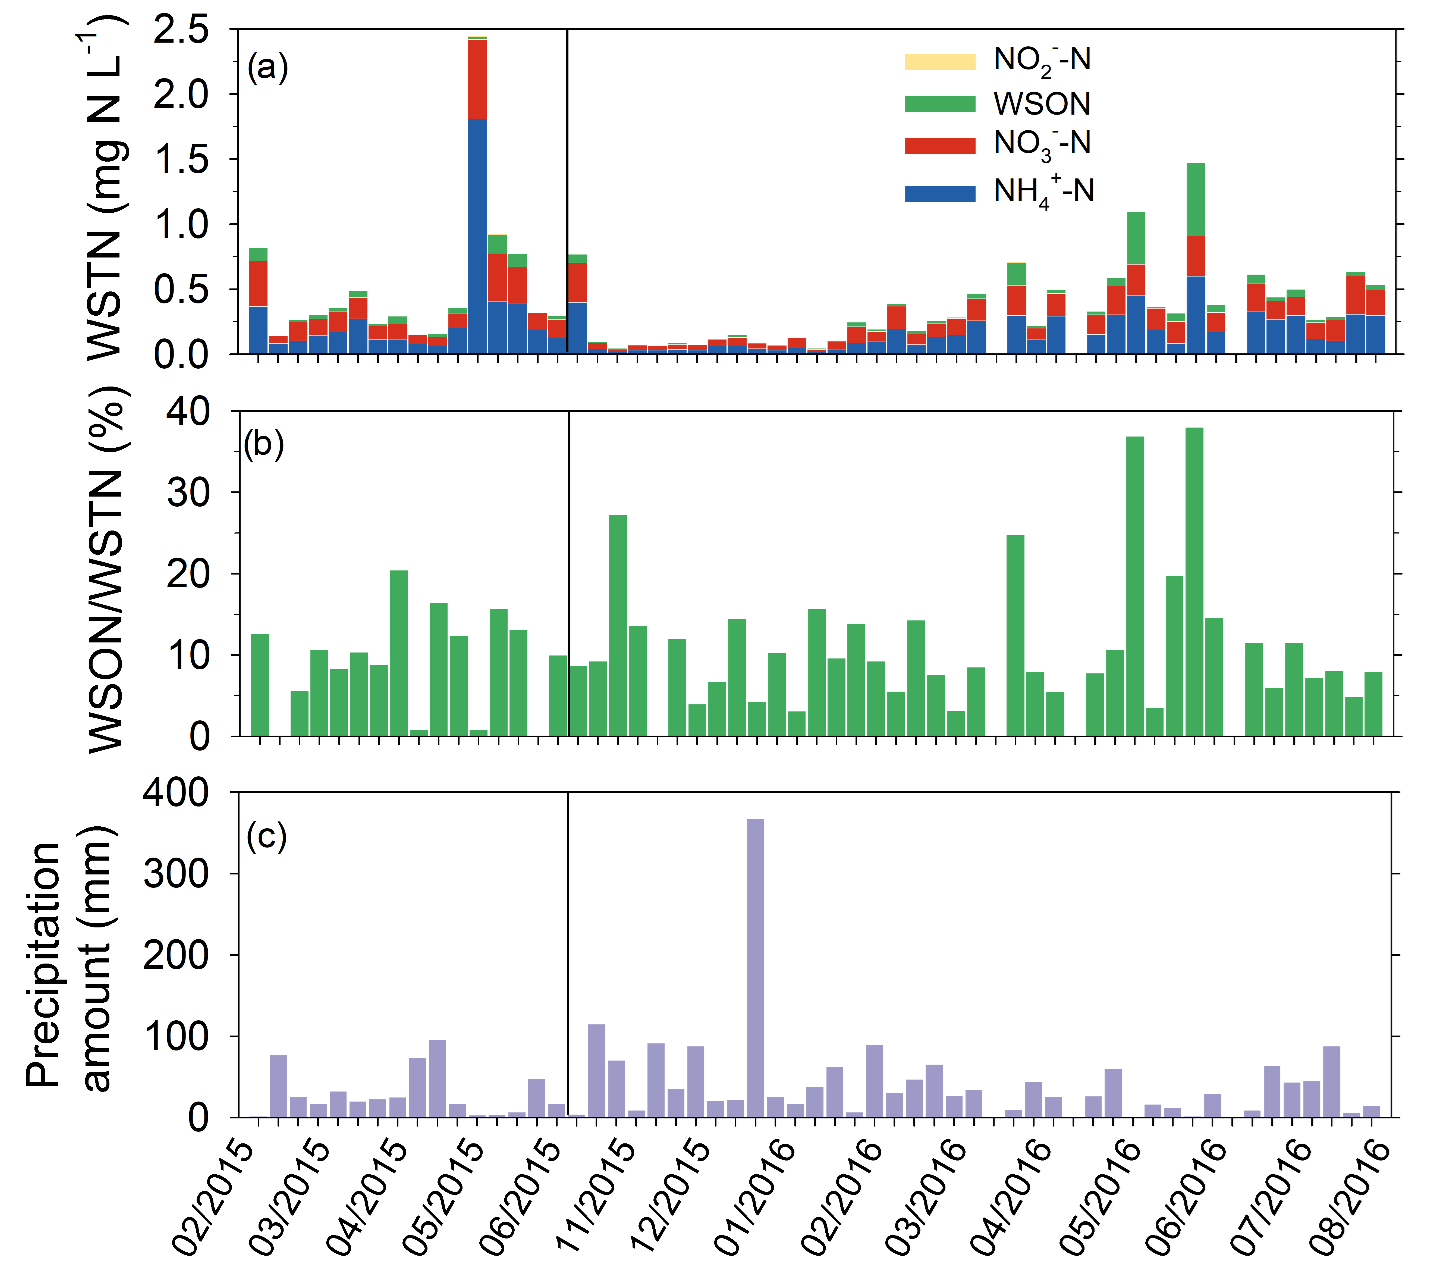
Figure 4Concentrations of nitrogen species in weekly precipitation samples (a), percentage contribution of WSON to WSTN in precipitation (b), and precipitation amount (c). The vertical line marks discontinuity due to missing data from 1 June to 19 October 2015.
3.3 Air concentrations of oxidized N
The oxidized fraction of reactive nitrogen (NOy) comprises a mixture of gaseous and particulate inorganic (NO, NO2, N2O5, HONO, HNO3, NO) as well as organic compounds. Owing to its large deposition velocity and typical atmospheric concentration, HNO3 is the primary contributor to dry deposition of inorganic oxidized N (Walker et al., 2020). Much less is known about the dry deposition of oxidized organic nitrogen compounds (Walker et al., 2020). Peroxy nitrates (PNs) and alkyl and multifunctional nitrates (ANs) are formed during the photochemical oxidation of volatile organic compounds (VOCs) in the presence of NOx (NOx = NO + NO2). While PNs exist in the gas phase, ANs can exist in the gas or particle phase and can be the dominant chemical sink for NOx in high-BVOC (biogenic VOC), low-NOx environments (Farmer and Cohen, 2008; Browne and Cohen, 2012; Paulot et al., 2012; Browne et al., 2013). Unlike PNs, ANs can also form at night via nitrate radical-induced oxidation of VOCs. Further, PNs and ANs have been shown to contribute significantly to the total NOy budget in geographically diverse rural and forested environments (e.g., Trainer et al., 1993; Nouaime et al., 1998; Farmer et al., 2008; Browne et al., 2013; Toma et al., 2019). Flux measurements at Blodgett Forest, CA, showed that PN dry deposition contributed 4 %–19 % of total N deposition at the site (Wolfe et al., 2009). Chemical transport modeling with current representation of the atmospheric oxidized nitrogen system suggests that PNs and ANs together contribute ∼ 7 % of total N deposition and ∼ 11 % of dry N deposition at the US continental scale compared to ∼ 21 % and 34 % for HNO3 and ∼ 6 % and 9 % for particulate NO (Walker et al., 2020).
The annual average concentration of NOy was 1.00 ppb (0.55 µg N m−3), with the highest seasonal average concentration in the winter (1.32 ppb, 0.75 µg N m−3) and lowest in the summer (0.64 ppb, 0.34 µg N m−3) (Fig. 5, Table S5). The nearest rural NOy monitoring site is 85 km to the northwest at Look Rock in the Great Smoky Mountains National Park, where the annual concentration was 1.5 ppb over the same period (NPS, 2020). Similar to Coweeta, NOy concentrations at Look Rock are typically lowest during summer and highest in winter, though the seasonal cycle exhibits some interannual variability. The annual mean concentrations of HNO3, ΣPN, and ΣAN determined by TD-PC-CL were 0.14 (0.08), 0.1 (0.06), and 0.09 (0.05) ppb (µg N m−3), respectively (Fig. 5, Table S5). HNO3 and ΣPN concentrations peaked in spring, coincident with the seasonal peak in O3 concentration, while concentrations of ΣAN were similar in spring and summer. Diel patterns of HNO3, ΣPN, and ΣAN peaked during the day as expected for photochemical products. However, of the organic compounds, the ratio of peak daytime to minimum nighttime concentrations (Fig. 5) was much smaller for ΣAN (2.3) compared to ΣPN (3.9), possibly indicative of the additional nighttime formation of AN.
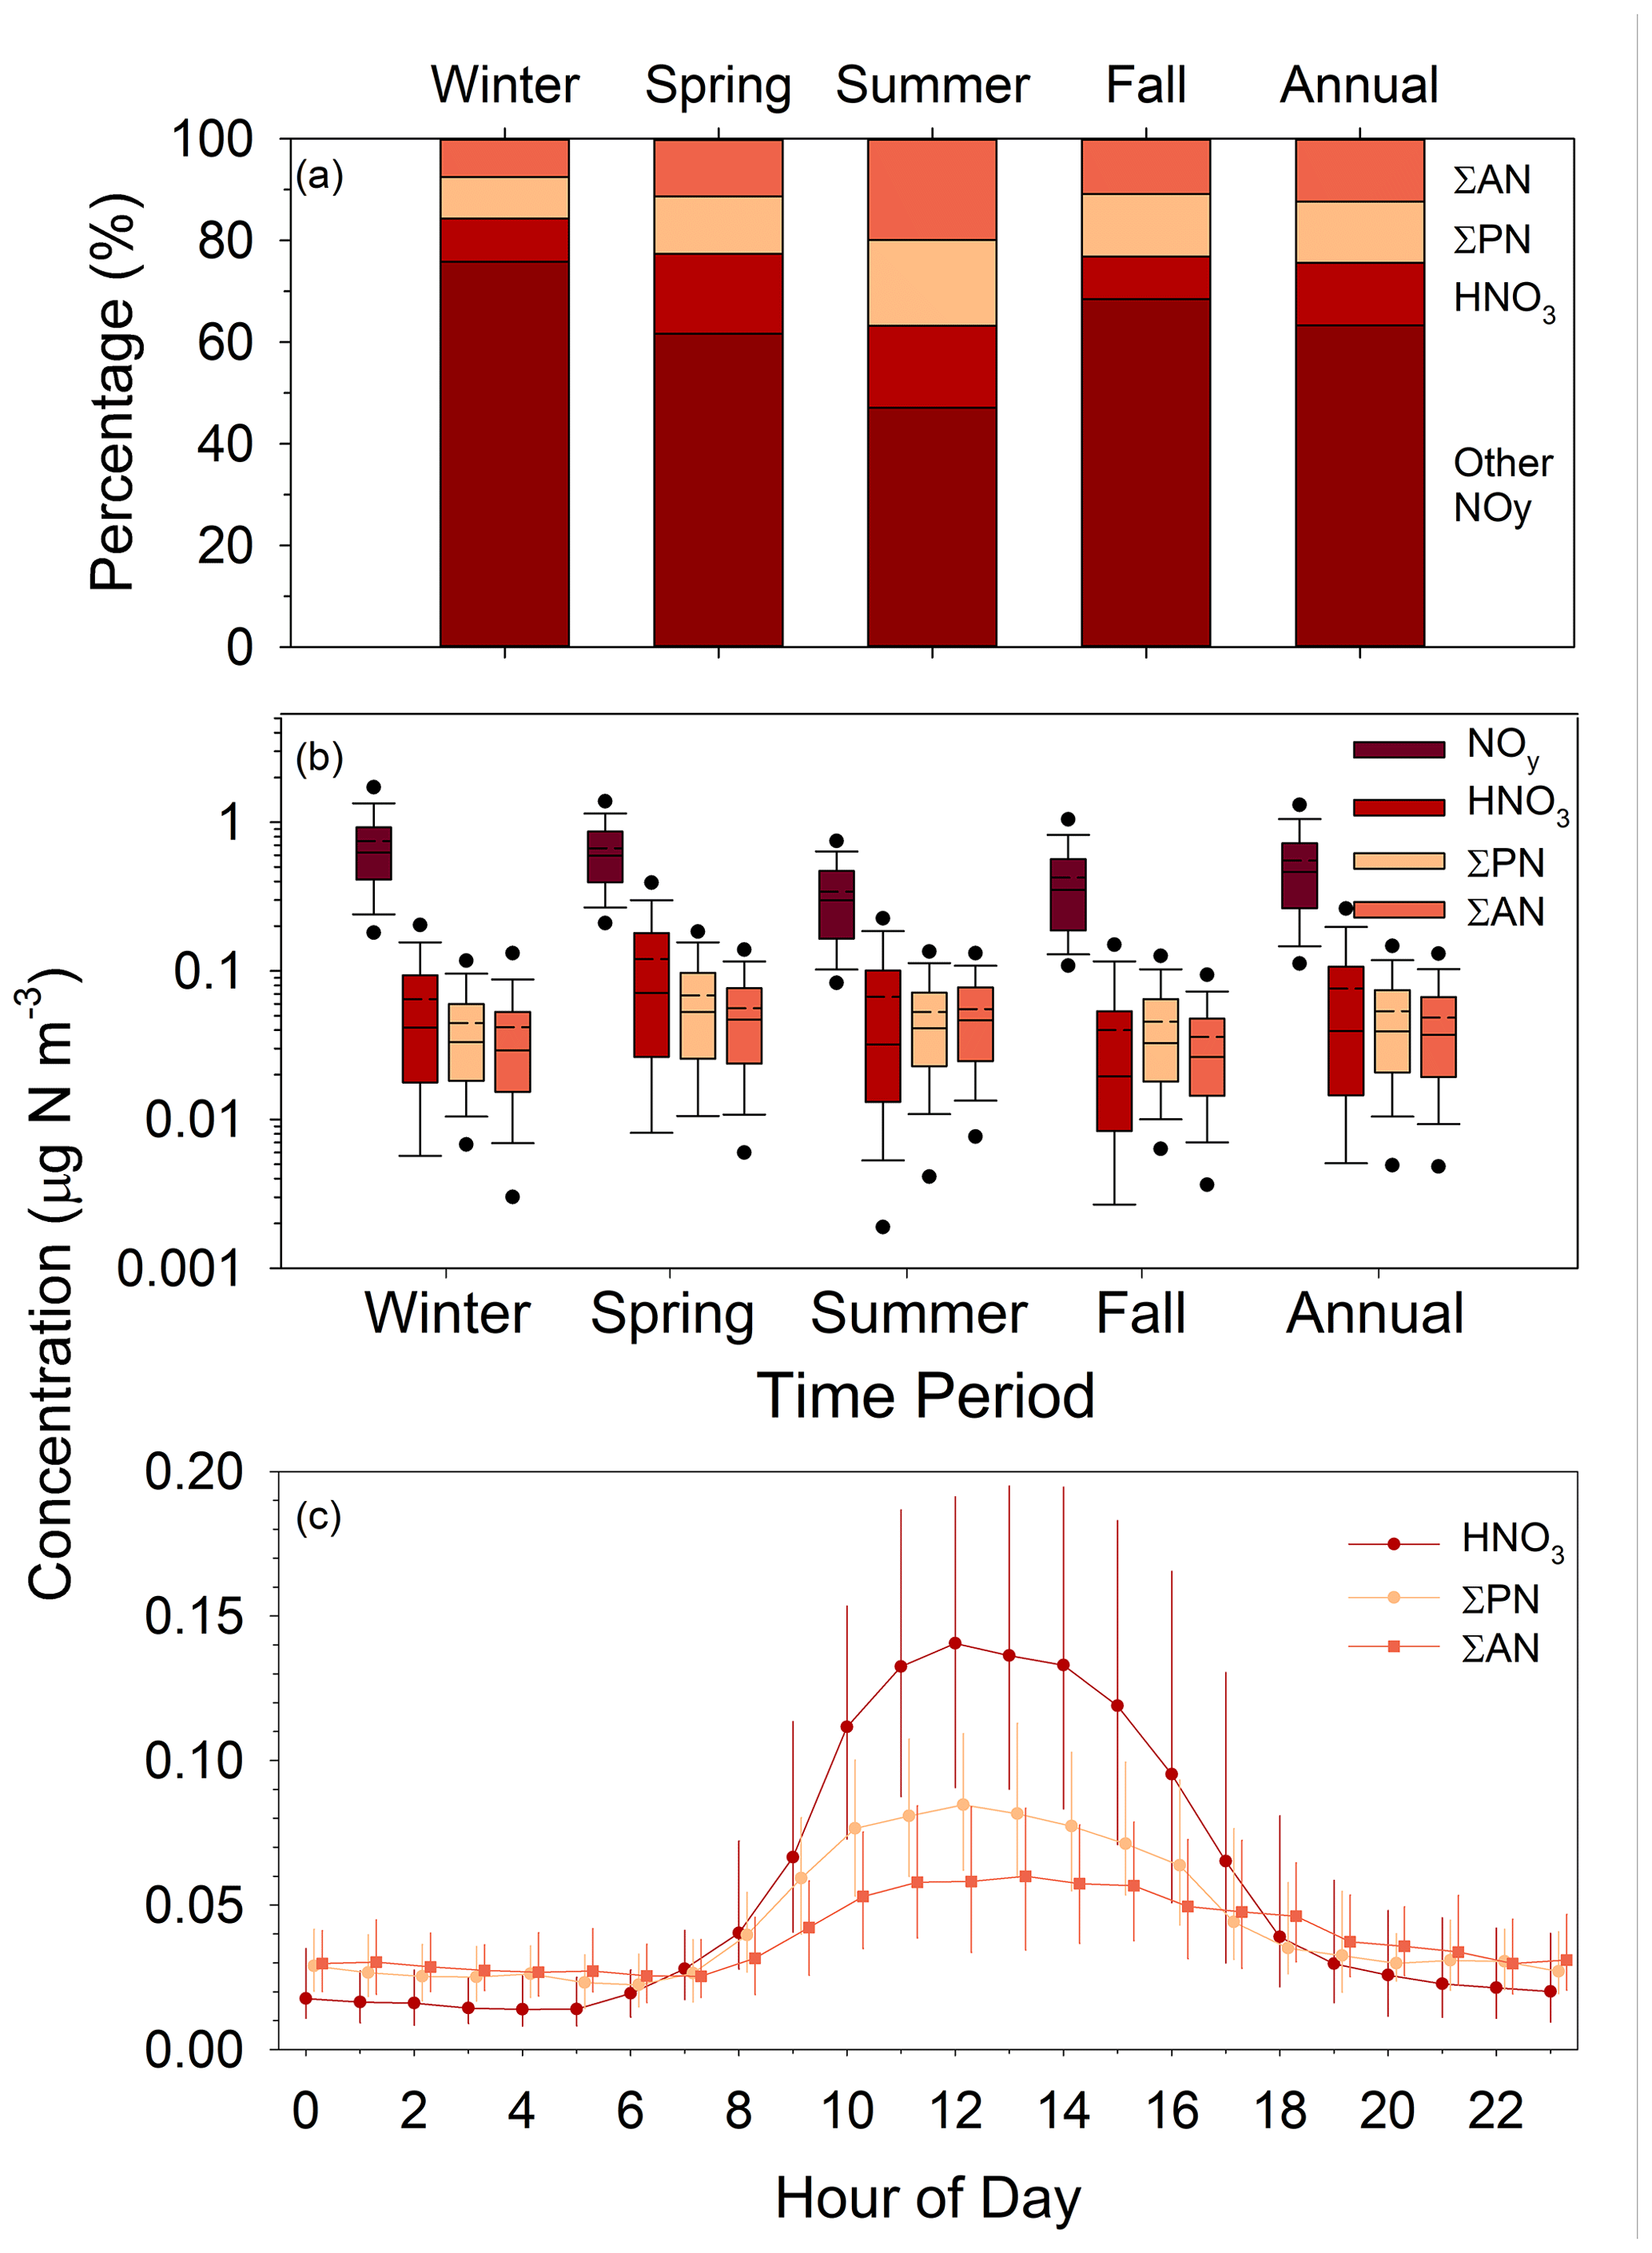
Figure 5Seasonal and annual percent contribution of HNO3, ΣPN, ΣAN, and other compounds to total NOy (a); seasonal and annual box plots of NOy, HNO3, ΣPN, and ΣAN – solid and dashed lines inside the box represent the median and mean, respectively; the top and bottom of the box represent 75th and 25th percentiles; whiskers represent 10th and 90th percentiles, and dots represent 5th and 95th percentiles. (b) Diurnal profiles of HNO3, ΣPN, and ΣAN – observations represent median hourly concentration, and bars represent interquartile range (c). “Other NOy” is calculated as NOy–HNO3–ΣPN–ΣAN, which, while primarily comprised of NOx, includes N2O5, HONO, NO, and possibly other organics.
Annually, HNO3 (12.8 %), ΣPN (12.2 %), and ΣAN (12.7 %) contributed approximately the same proportions of the atmospheric NOy load (Fig. 5, Table S6). Their collective contribution (NOz = HNO3 + ΣPN + ΣAN) to total NOy peaked during the summer (52.9 %) and reached a minimum during winter (24.2 %). The contributions of ΣPN (16.7 %) and ΣAN (20.0 %) exceeded HNO3 (16.2 %) during summer when total NOy concentrations were lowest. Our results fall within the range of NOy budgets reported for other rural forested sites, in which ΣPN and ΣAN contribute ∼ 8 %–40 % (Nouaime et al., 1998; Farmer et al., 2008; Browne et al., 2013; Toma et al., 2019) and 10 %–22 % (Day et al., 2003; Farmer et al., 2008; Browne et al., 2013) of NOy, respectively.
To put the SANDS period into context with longer-term variability of oxidized N concentrations at Coweeta, CASTNET HNO3 and NO measurements for the period 2015–2020 are summarized in Fig. 6 along with the SANDS period. We note here that NH4NO3 volatility on the CASTNET Teflon filter can result in positive and negative biases in HNO3 and NO, respectively, with larger biases expected under warmer conditions (Lavery et al., 2009). Studies have shown total NO (TNO3 = HNO3 and NO) to be conserved, though some portion of the NO collected by the CASTNET open-faced filter may be contributed by coarse particles. The partitioning of TNO3 between gas and particulate phases is important, given the much larger deposition velocity of HNO3 compared to NO. The CASTNET measurements reflect relatively low concentrations of both HNO3 and NO, with HNO3 exceeding NO during all seasons. Particulate NO concentrations are highest during cooler months, as expected, and negligible during the summer, a pattern that is consistent with observations from other networks across the southeast (Kim et al., 2015). Additionally, TNO3 is primarily in the gas phase even during winter. Seasonal mean concentrations during the SANDS period fall within the interquartile range (IQR) of the 6-year period between 2015 and 2020, with SANDS annual and 6-year averages being very similar (Fig. 6). Seasonal and annual mean HNO3 concentrations agreed closely with the CASTNET measurements (Fig. 6 and Sect. S1).
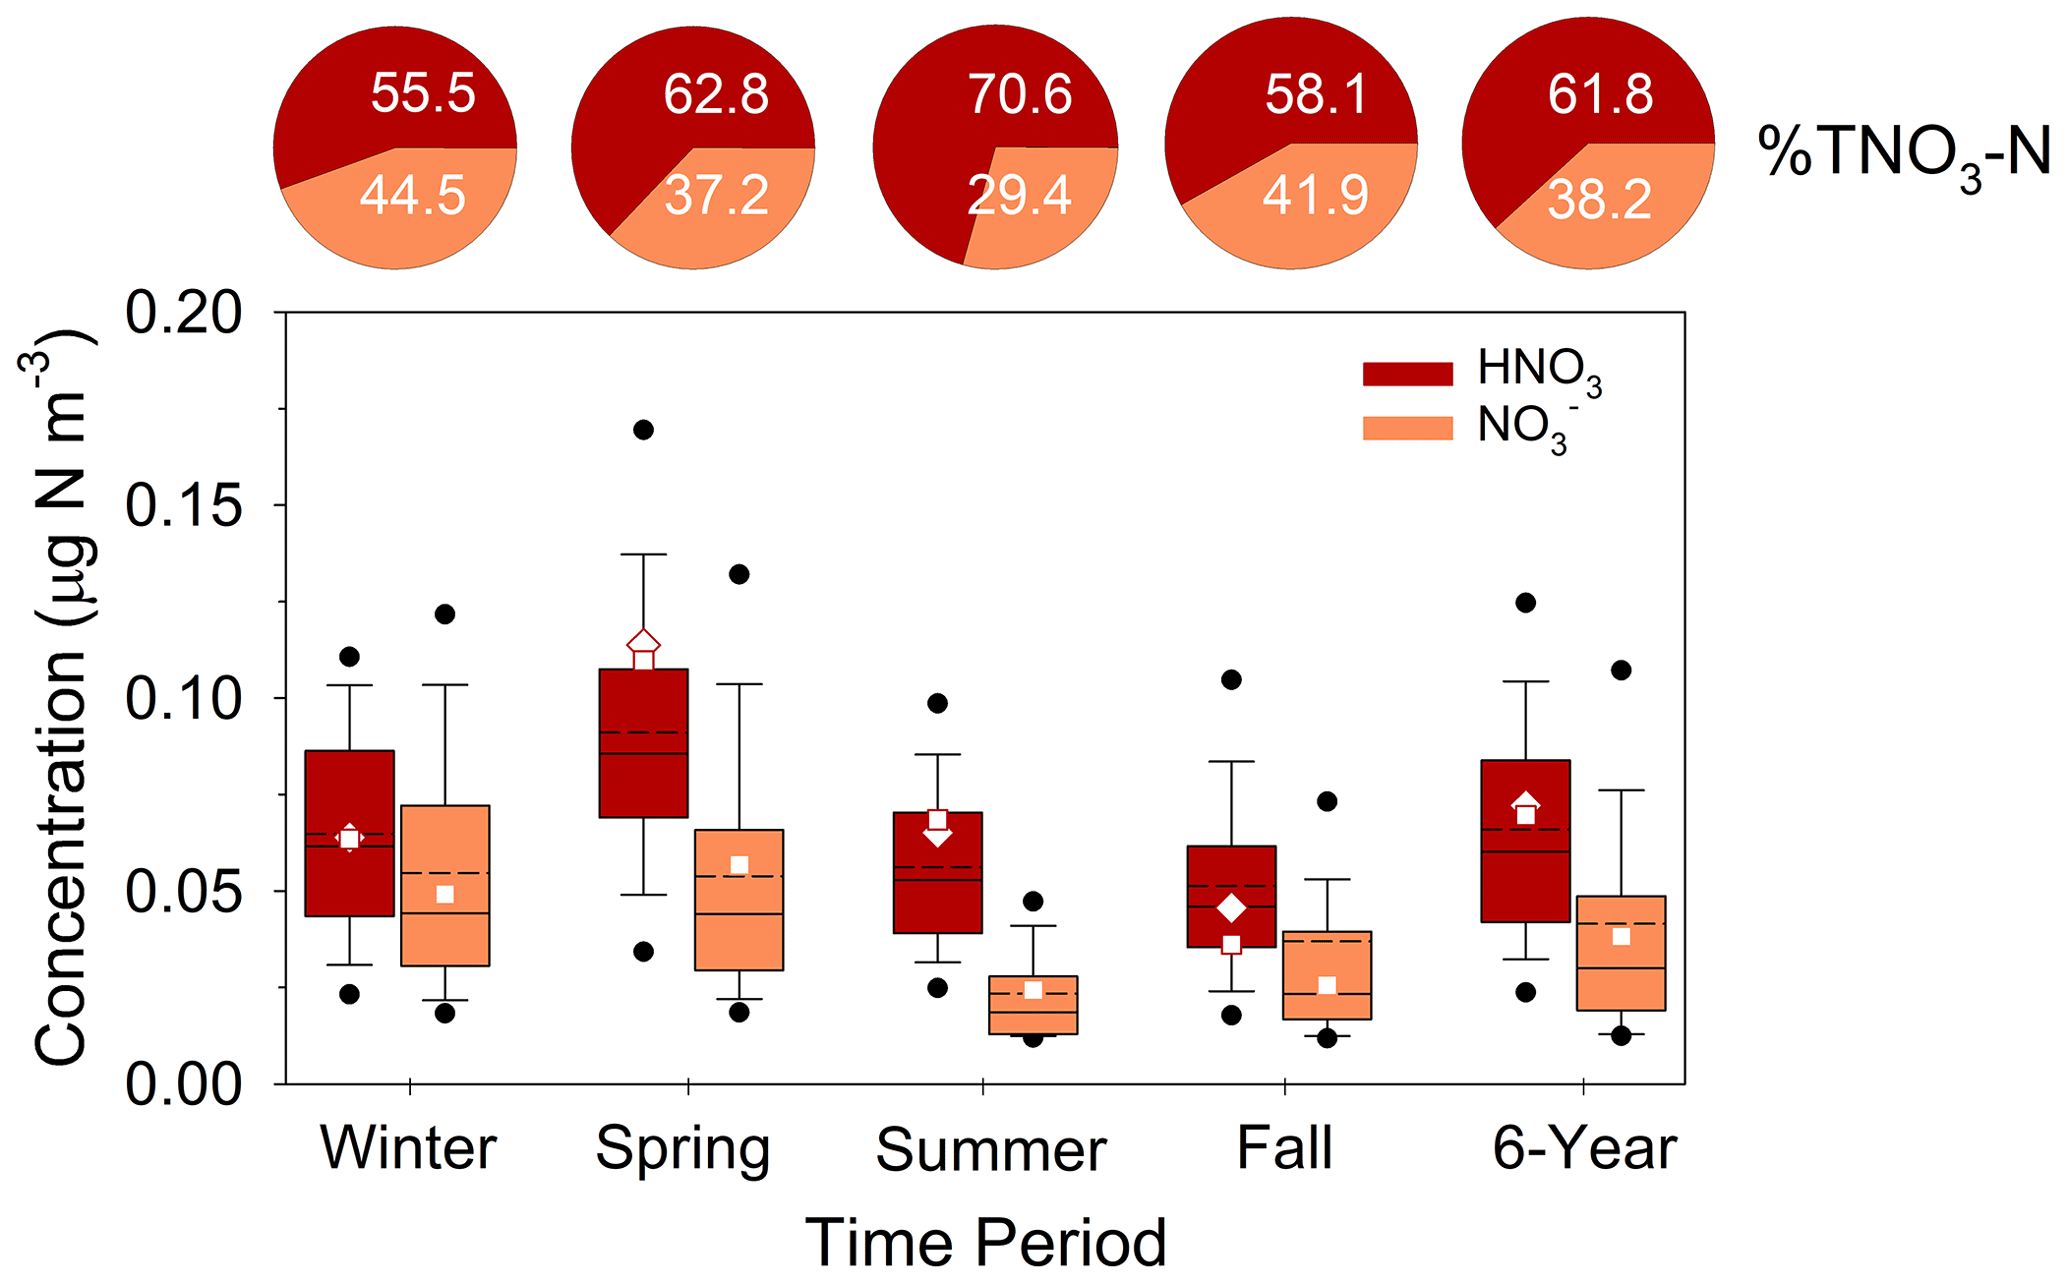
Figure 6Summary of CASTNET HNO3 and NO concentrations (as N) from 2015–2020 during winter, spring, summer, and fall. Solid and dashed lines inside the box represent the median and mean, respectively. The top and bottom of the box represent 75th and 25th percentiles. Whiskers represent 10th and 90th percentiles, and dots represent 5th and 95th percentiles. “6-year” represents the statistics for the entire 6-year period. Squares and diamonds represent the seasonal and annual mean CASTNET (HNO3 and NO and continuous DD-CL HNO3 for the August 2015–August 2016 modeling period, respectively. Pie charts represent the average percent contribution of HNO3 and NO to total NO (HNO3 + NO) expressed as nitrogen.
3.4 Air concentrations of reduced N
Reduced forms of nitrogen (NHx) represent another important component of the inorganic dry N deposition budget. At the continental scale, NH3 dry deposition contributes ∼ 20 % of total N deposition and ∼ 32 % of dry N deposition, whereas the contributions from NH aerosol are ∼ 4 % and ∼ 6 %, respectively (Walker et al., 2020). Similar to oxidized forms of N, the partitioning of mass between the gas (NH3) and particulate (NH) phases affects the dry deposition rate of NHx, given the larger deposition velocity of NH3 relative to NH.
During 2015–2020, with 2020 being the most recent full year of AMoN data, average concentrations of NH3 and NH were similar (Fig. 7). Both species displayed a seasonal pattern of lowest concentrations in the winter and higher concentrations during warm months. NH3 concentrations peaked in summer, reflecting the temperature dependence of regional agricultural and biogenic emissions. NH concentrations followed the seasonal cycle in SO concentrations, which were also similar in spring and summer and minimum in winter at Coweeta. The seasonal cycle of NH3–NH partitioning was driven more by NH3 than NH, with the former exhibiting more seasonal variability. Hourly measurements conducted during spring and summer 2016 showed that NH3 also displayed significant diel variability (Fig. S7), reaching a maximum around midday and a minimum overnight. Seasonal mean concentrations during the SANDS period fall within the IQR of the 6-year period between 2015 and 2020, with SANDS annual and 6-year averages being very similar. Concentrations of NHx were higher relative to TNO3 during SANDS and over the longer term at Coweeta (Figs. 6 and 7).
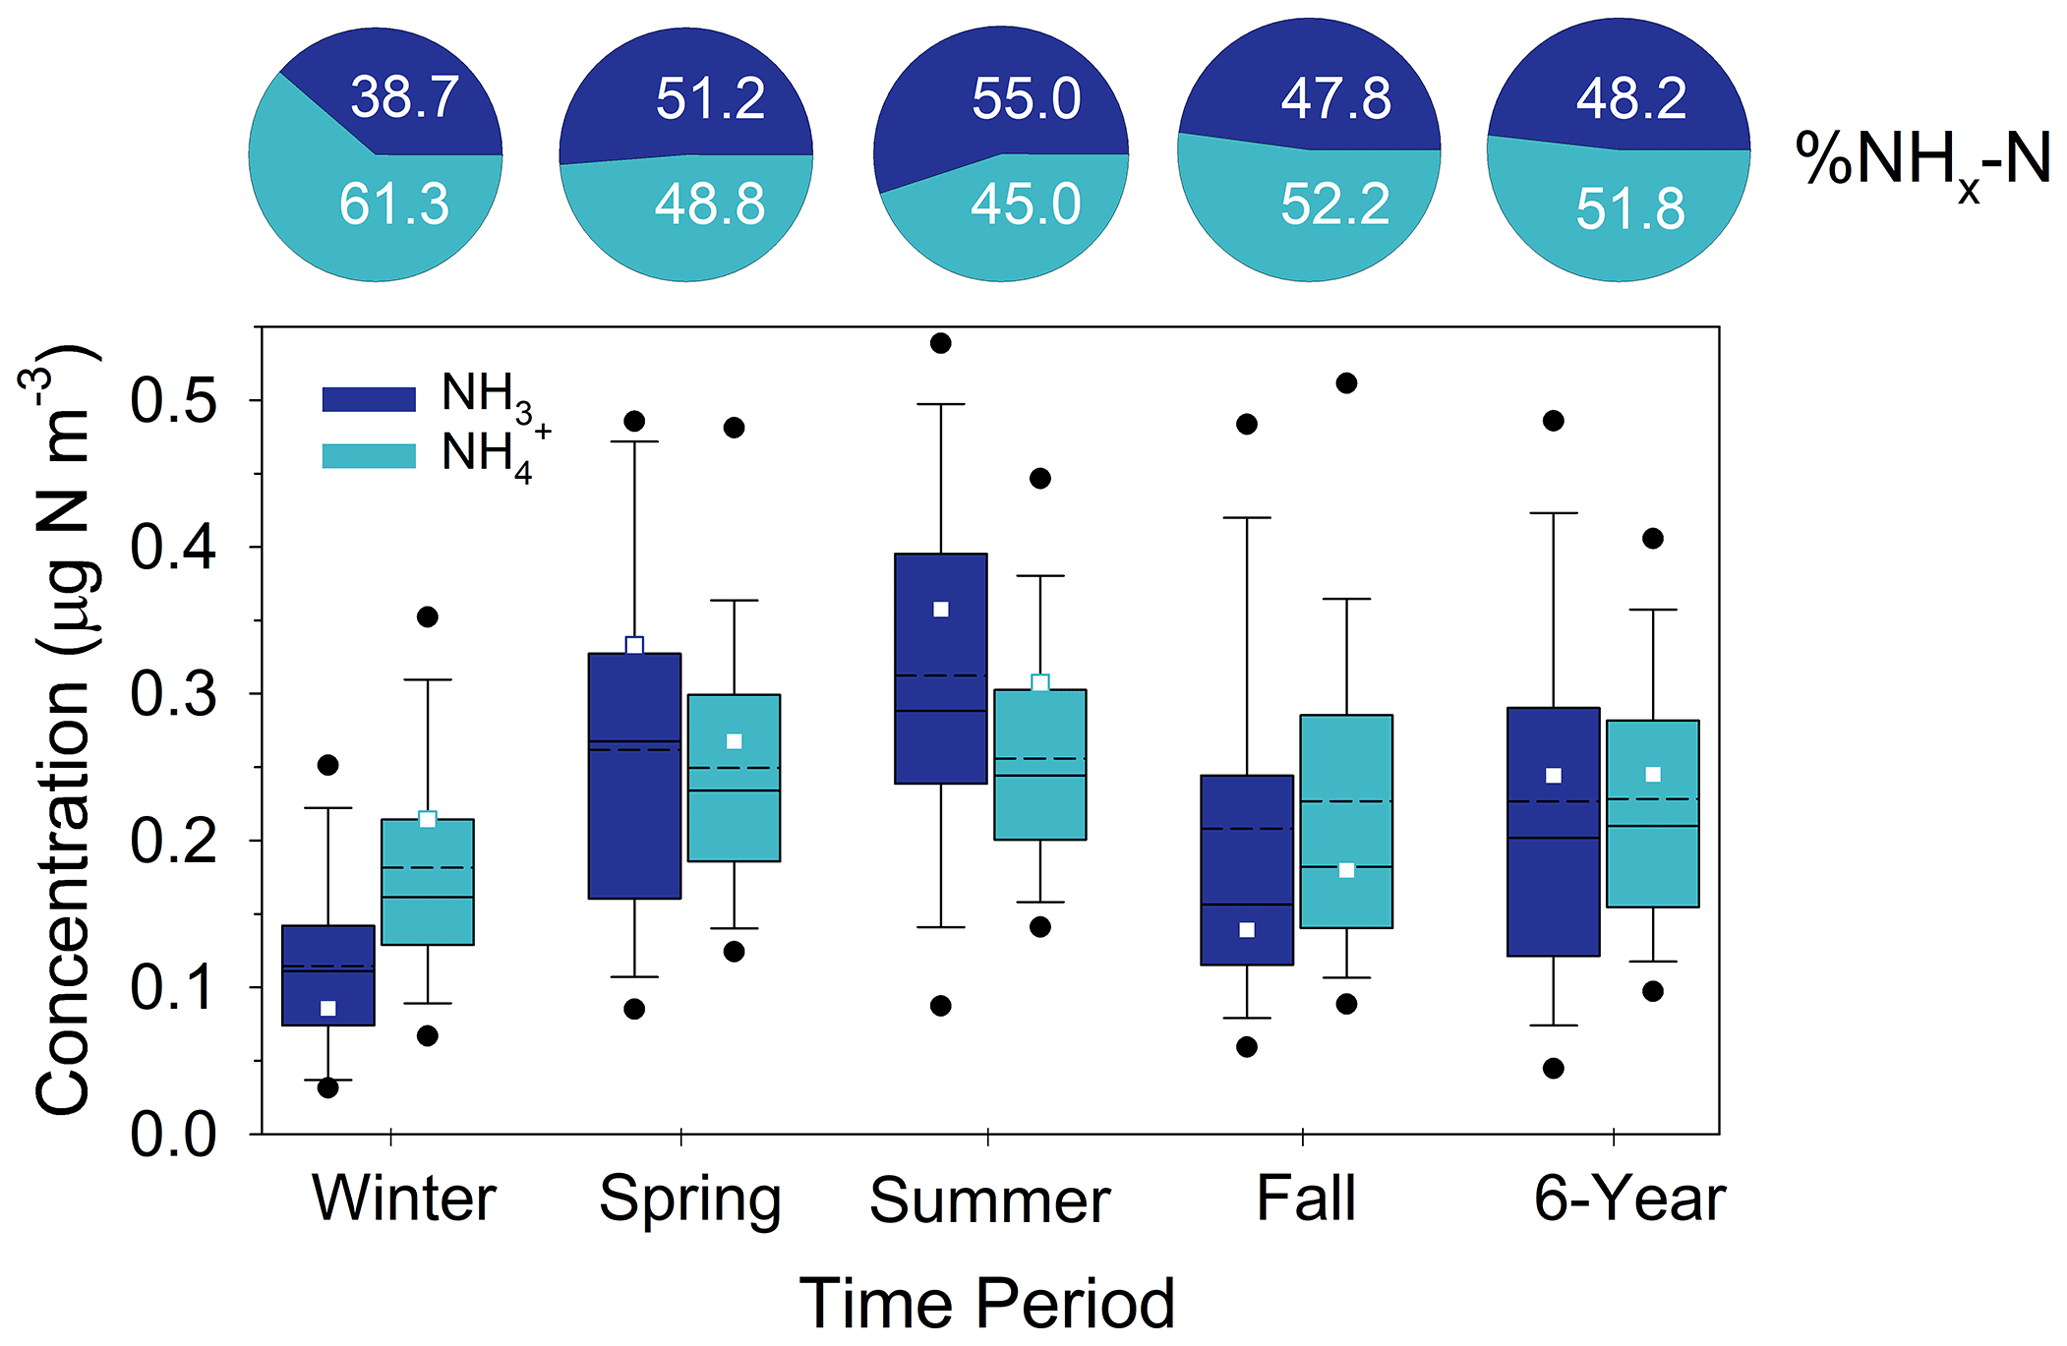
Figure 7Summary of AMoN NH3 and CASTNET NH concentrations (as N) from 2015–2020 during winter, spring, summer, and fall. Solid and dashed lines inside the box represent the median and mean, respectively. The top and bottom of the box represent 75th and 25th percentiles. Whiskers represent 10th and 90th percentiles, and dots represent 5th and 95th percentiles. “6-year” represents the statistics for the entire 6-year period. Squares represent the seasonal and annual mean concentration for the August 2015–August 2016 modeling period. Pie charts represent the average percent contribution of NH3 and NH to total NHx (NH3 + NH) expressed as nitrogen. AMoN concentrations were adjusted by subtracting the mean travel blank for the 6-year period.
3.5 Aerosol N composition
Ammonium was the most abundant inorganic species, contributing 86.8 % of WSTN (N=103) on average (Fig. 8, Table S7). Organic compounds (WSON) contributed 11.5 % of WSTN, which is very similar to precipitation. The contributions of NO and NO were minor. Our study-wide average of percent WSON is slightly lower than measurements at other North American forest sites, including Duke Forest, North Carolina (∼ 33 %, Lin et al., 2010), and Rocky Mountain National Park (14 %–21 %) (Benedict, 2012), but is within the global range of 10 %–39 % (Cape et al., 2011). Similar to precipitation chemistry, there was no seasonal pattern in the percent contribution of WSON to WSTN in PM2.5. Hi-Vol measurements of inorganic PM components compared well overall with collocated CASTNET measurements (Sect. S1, Fig. S4).
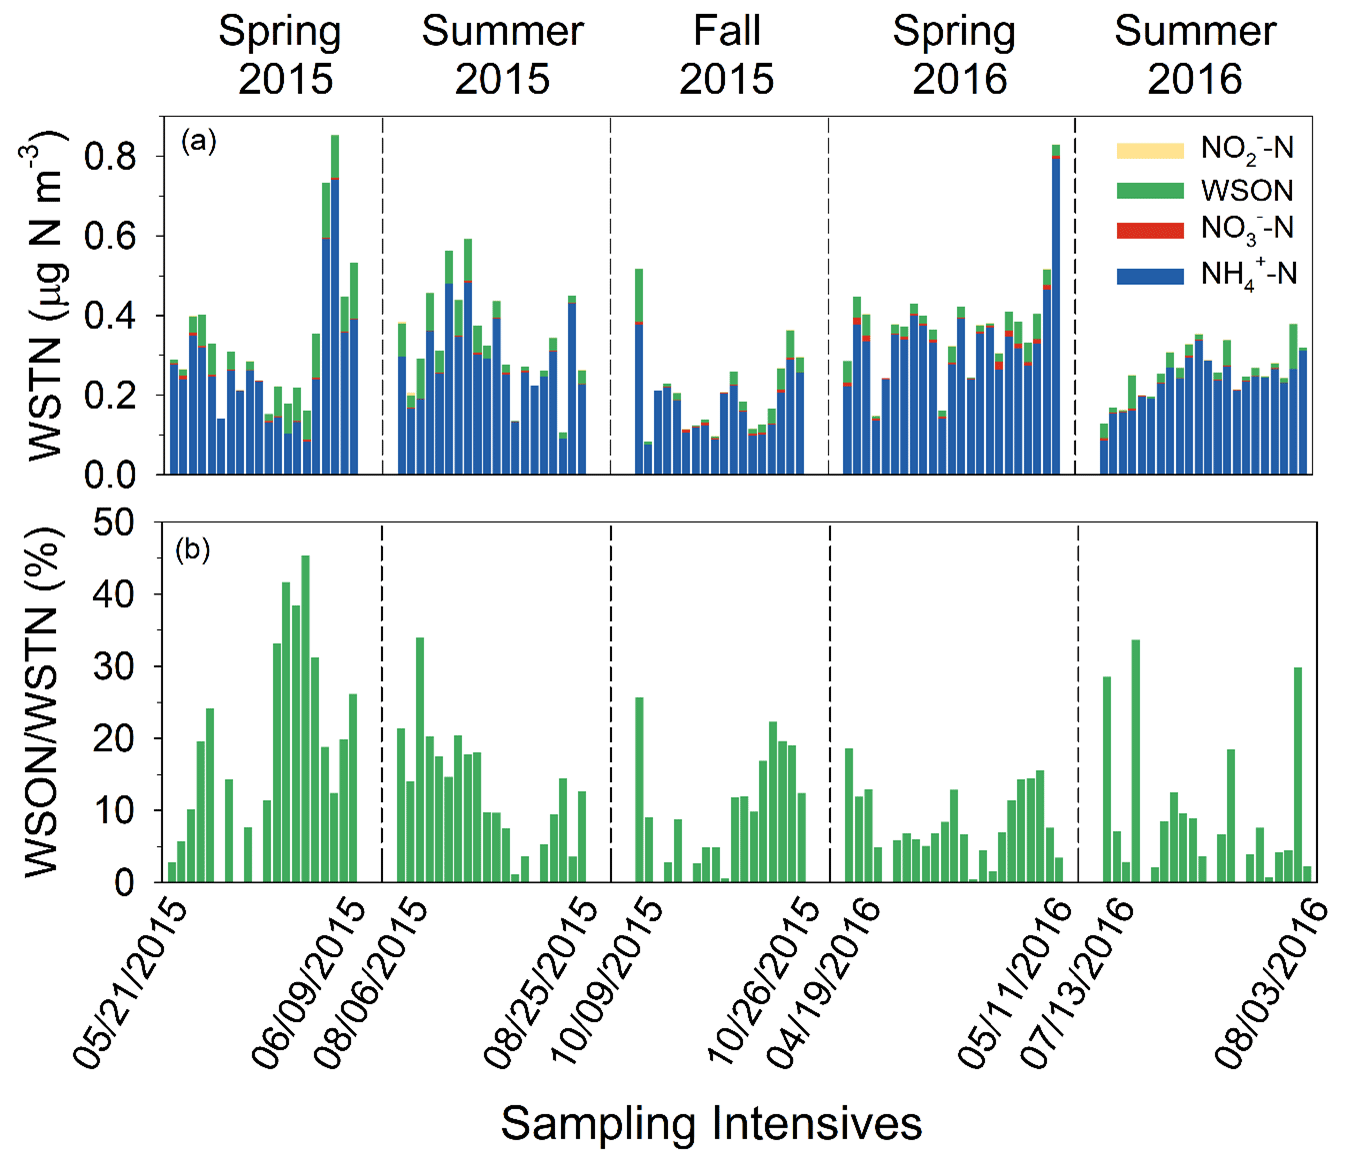
Figure 8Contributions of N aerosol species to WSTN in 24 h Hi-Vol PM2.5 samples during seasonal SANDS intensives (a) along with the percentage contribution of WSON to WSTN (b).
3.6 Biogeochemistry
Estimates of NH3 emission potentials (Γ) for the ground and vegetation are needed to calculate compensation points (χ) and fluxes in STAGE. Measurements of pH, NH, and corresponding Γ of the leaves (Γs) and litter (Γl) are summarized in Fig. 9 and Tables S8 and S9. Measurements of Γs are divided into green leaves collected during the growing season (spring and summer) and senescent leaves collected in October. NH3 emission potentials (Γ) for green leaves (Γs) ranged from zero to 4070 with a median value (35.8) (Table S8) corresponding to a compensation point of χs=0.25 µg NH3 m−3 at 25 ∘C. Large intra-species variability of tissue pH and NH was observed (Table S9), and separating by crown versus understory species did not reveal distinct differences between groups. Given the variability of the observations, the median Γs was used for STAGE simulations. Senescence marks the translocation of N in leaves to storage tissues (Schneider et al., 1996). Along with a decline in photosynthetic activity, degradation of chlorophyll, and other metabolic changes, glutamine synthetase (GS) activity also declines (Pearson et al., 2002). Glutamine synthetase catalyzes assimilation of NH into glutamine and is therefore important in regulating the pool of NH available for exchange as NH3 between the leaf and atmosphere as well as remobilizing organic N for storage during senescence. A decline in GS activity can thus result in increased leaf NH concentrations (Pearson et al., 2002; Wang et al., 2011). Senescent leaves were similar to green leaves with respect to median tissue pH but showed higher concentrations of tissue NH. Median Γs was correspondingly higher (113), equivalent to χs=0.8 µg NH3 m−3 at 25 ∘C. For STAGE modeling, the median Γ for senescent leaves was used for Γs during the fall.
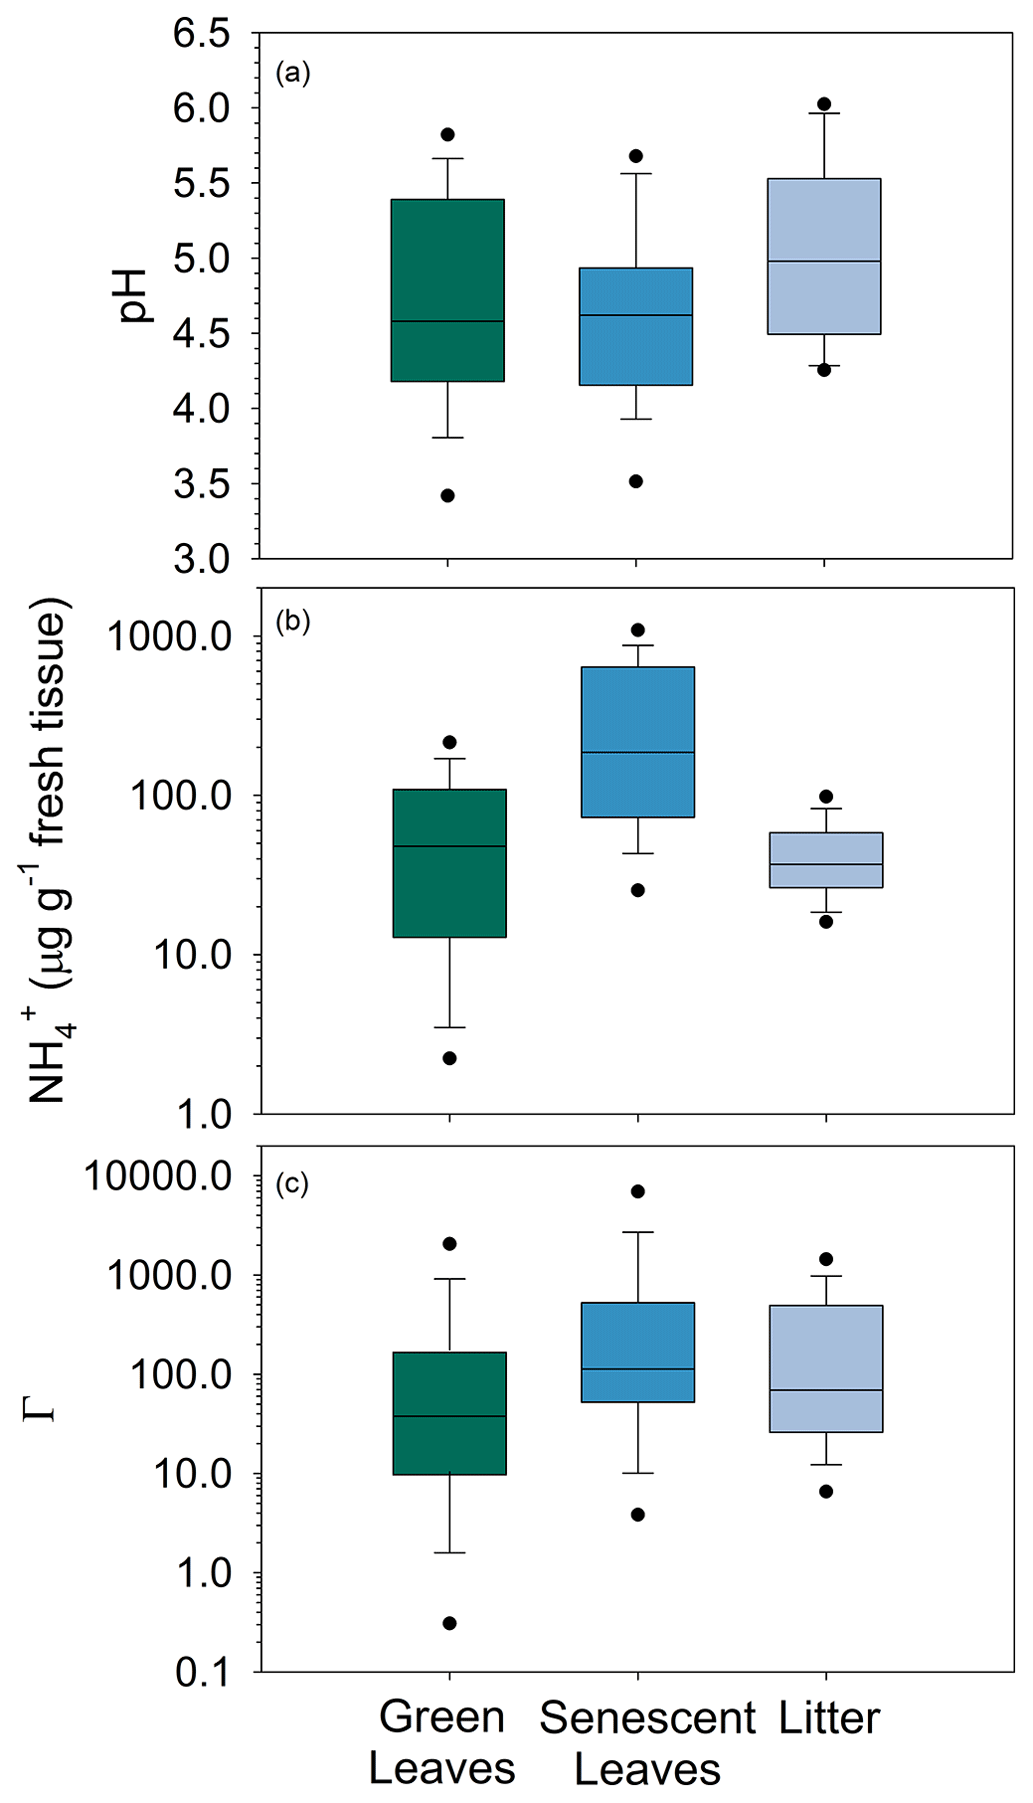
Figure 9Box plots of pH (a), NH (b) concentration (µg g−1 fresh tissue), and equivalent emission potential (Γ) (c) in tissue of green leaves, senescent leaves, and litter on the forest floor. The solid line inside the box represents the median. The top and bottom of the box represent 75th and 25th percentiles. Whiskers represent 10th and 90th percentiles, and dots represent 5th and 95th percentiles.
Regard our method for estimating Γs, the fundamental assumption is that the chemistry of the bulk leaf tissue is representative of the apoplast. While a number of studies have shown positive correlations between bulk tissue chemistry, apoplastic chemistry, and independently quantified compensation points (David et al., 2009; Hill et al., 2002; Massad et al., 2010; Mattsson and Schjoerring, 2002; Mattsson et al., 2009), absolute differences between Γs derived from bulk tissue versus apoplast measurements can be large. For example, Sutton et al. (2009) and Personne et al. (2015) both show that ratios derived from bulk tissue chemistry exceed those derived from apoplast chemistry. We did not perform experiments to validate the use of bulk tissue chemistry as a proxy for apoplast chemistry and acknowledge this source of uncertainty. However, our estimates of Γs appear reasonable in the context of the range of existing observations (cited above and summarized by Massad et al., 2010) and the general relationship between [NH]bulk and Γs put forth by Massad et al. (2010, Eq. 6). Measurements on bulk tissue are less labor-intensive and therefore more tempting than measurements on the apoplast. However, more studies comparing the two procedures are needed to extend the meta-analysis of Massad et al. (2010) to a wider range of natural ecosystems, particularly deciduous forests.
Leaf litter on the soil surface has been shown to be a source of NH3 to the atmosphere in both natural and agricultural ecosystems (Nemitz et al., 2000b; David et al., 2009; Hansen et al., 2013). As litter decomposes, mineralization of organic N is a source of NH, some of which is lost to the overlying air as NH3. Litter NH concentrations were similar to green leaves but lower than senescent leaves (Fig. 9). However, the pH was higher than both green and senescent leaves. The resulting median Γl (69.3) was larger than green leaves but smaller than senescent leaves, equivalent to χl=0.49 µg NH3 m−3 at 25 ∘C. Litter Γ was much larger than that of the underlying soil. Average (0–10 cm soil depth) soil pH (4.18) and NH (1.21 mg N kg−1) correspond to Γsoil∼10 at a soil mass wetness of 0.1 g g−1, equivalent to χsoil∼0.1 µg NH3 m−3 at 25 ∘C. This very low Γsoil results from the low pH of the shallow soil.
Vertical profiles of air concentrations within and above the canopy were measured to investigate patterns of air–surface exchange with specific ecosystem compartments (i.e., canopy crown, understory, and ground). A detailed analysis of bidirectional N fluxes is forthcoming; thus, we limit the discussion of these data to NH3 in the context of interpreting patterns observed in the biogeochemical emission potentials and their prescription in the STAGE model. Nitric acid, NH, and NO showed expected decreasing concentrations from above the canopy to the forest floor, indicative of deposition. While NH3 profiles showed patterns of deposition to the crown and understory, concentrations near the forest floor indicated both emissions and deposition (Fig. 10). Of the 76 daytime profiles measured, 40 % showed decreases down to the forest floor, and 60 % showed an increasing concentration from approximately the lower understory (∼ 5 m a.g.) to the forest floor. The former pattern is interpreted as deposition to the forest floor, and the latter is interpreted as emission. Thus, the mean profile suggests a source of NH3 at the ground. The very low Γsoil suggests that emission from the soil is unlikely given such a low pH. The leaf litter layer, which indicates a much higher emission potential (Γl) than the soil, is a more likely source of NH3. This hypothesis is consistent with Hansen et al. (2013, 2017), in which emissions of NH3 from a beech (Fagus sylvatica) forest after leaf fall were attributed to the decomposition of new litter. Similar to our site, the underlying soil also had low pH (4–5). Given our observations, we used Γl (median = 69.3, Table S8) rather than Γsoil as the ground emission potential (Γg) in STAGE.
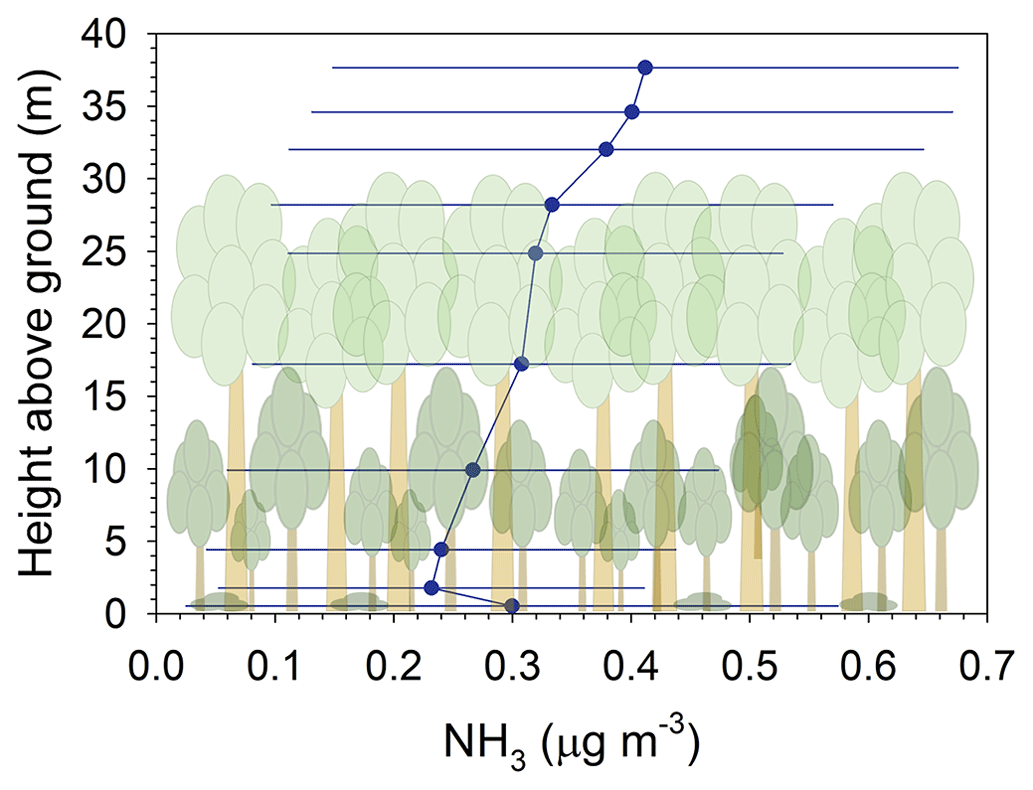
Figure 10Vertical concentration profiles of NH3. The mean (filled circle) and standard deviation (bars) of concentrations are shown for N=76 daytime profiles.
3.7 N deposition budget
Total annual N deposition for the period August 2015–August 2016 was 6.7 kg N ha−1, which is broken down by percent contribution of individual species to wet and dry deposition in Fig. 11. Over this period, wet deposition contributed 60.5 % of total N deposition, of which NH was the primary component (29.5 %). Wet deposition of organic N contributed 5.4 % of the total N deposition budget. Dry deposition accounted for 39.5 % of total deposition, of which NH3 was the primary contributor (20.5 %). Reduced forms of inorganic N were the largest contributor to the budget (51.1 %), with oxidized inorganic and organic N contributing 41.3 % and 7.6 % of total N deposition, respectively. Dry deposition of organic N made a small contribution (2.2 %) to the total deposition budget.
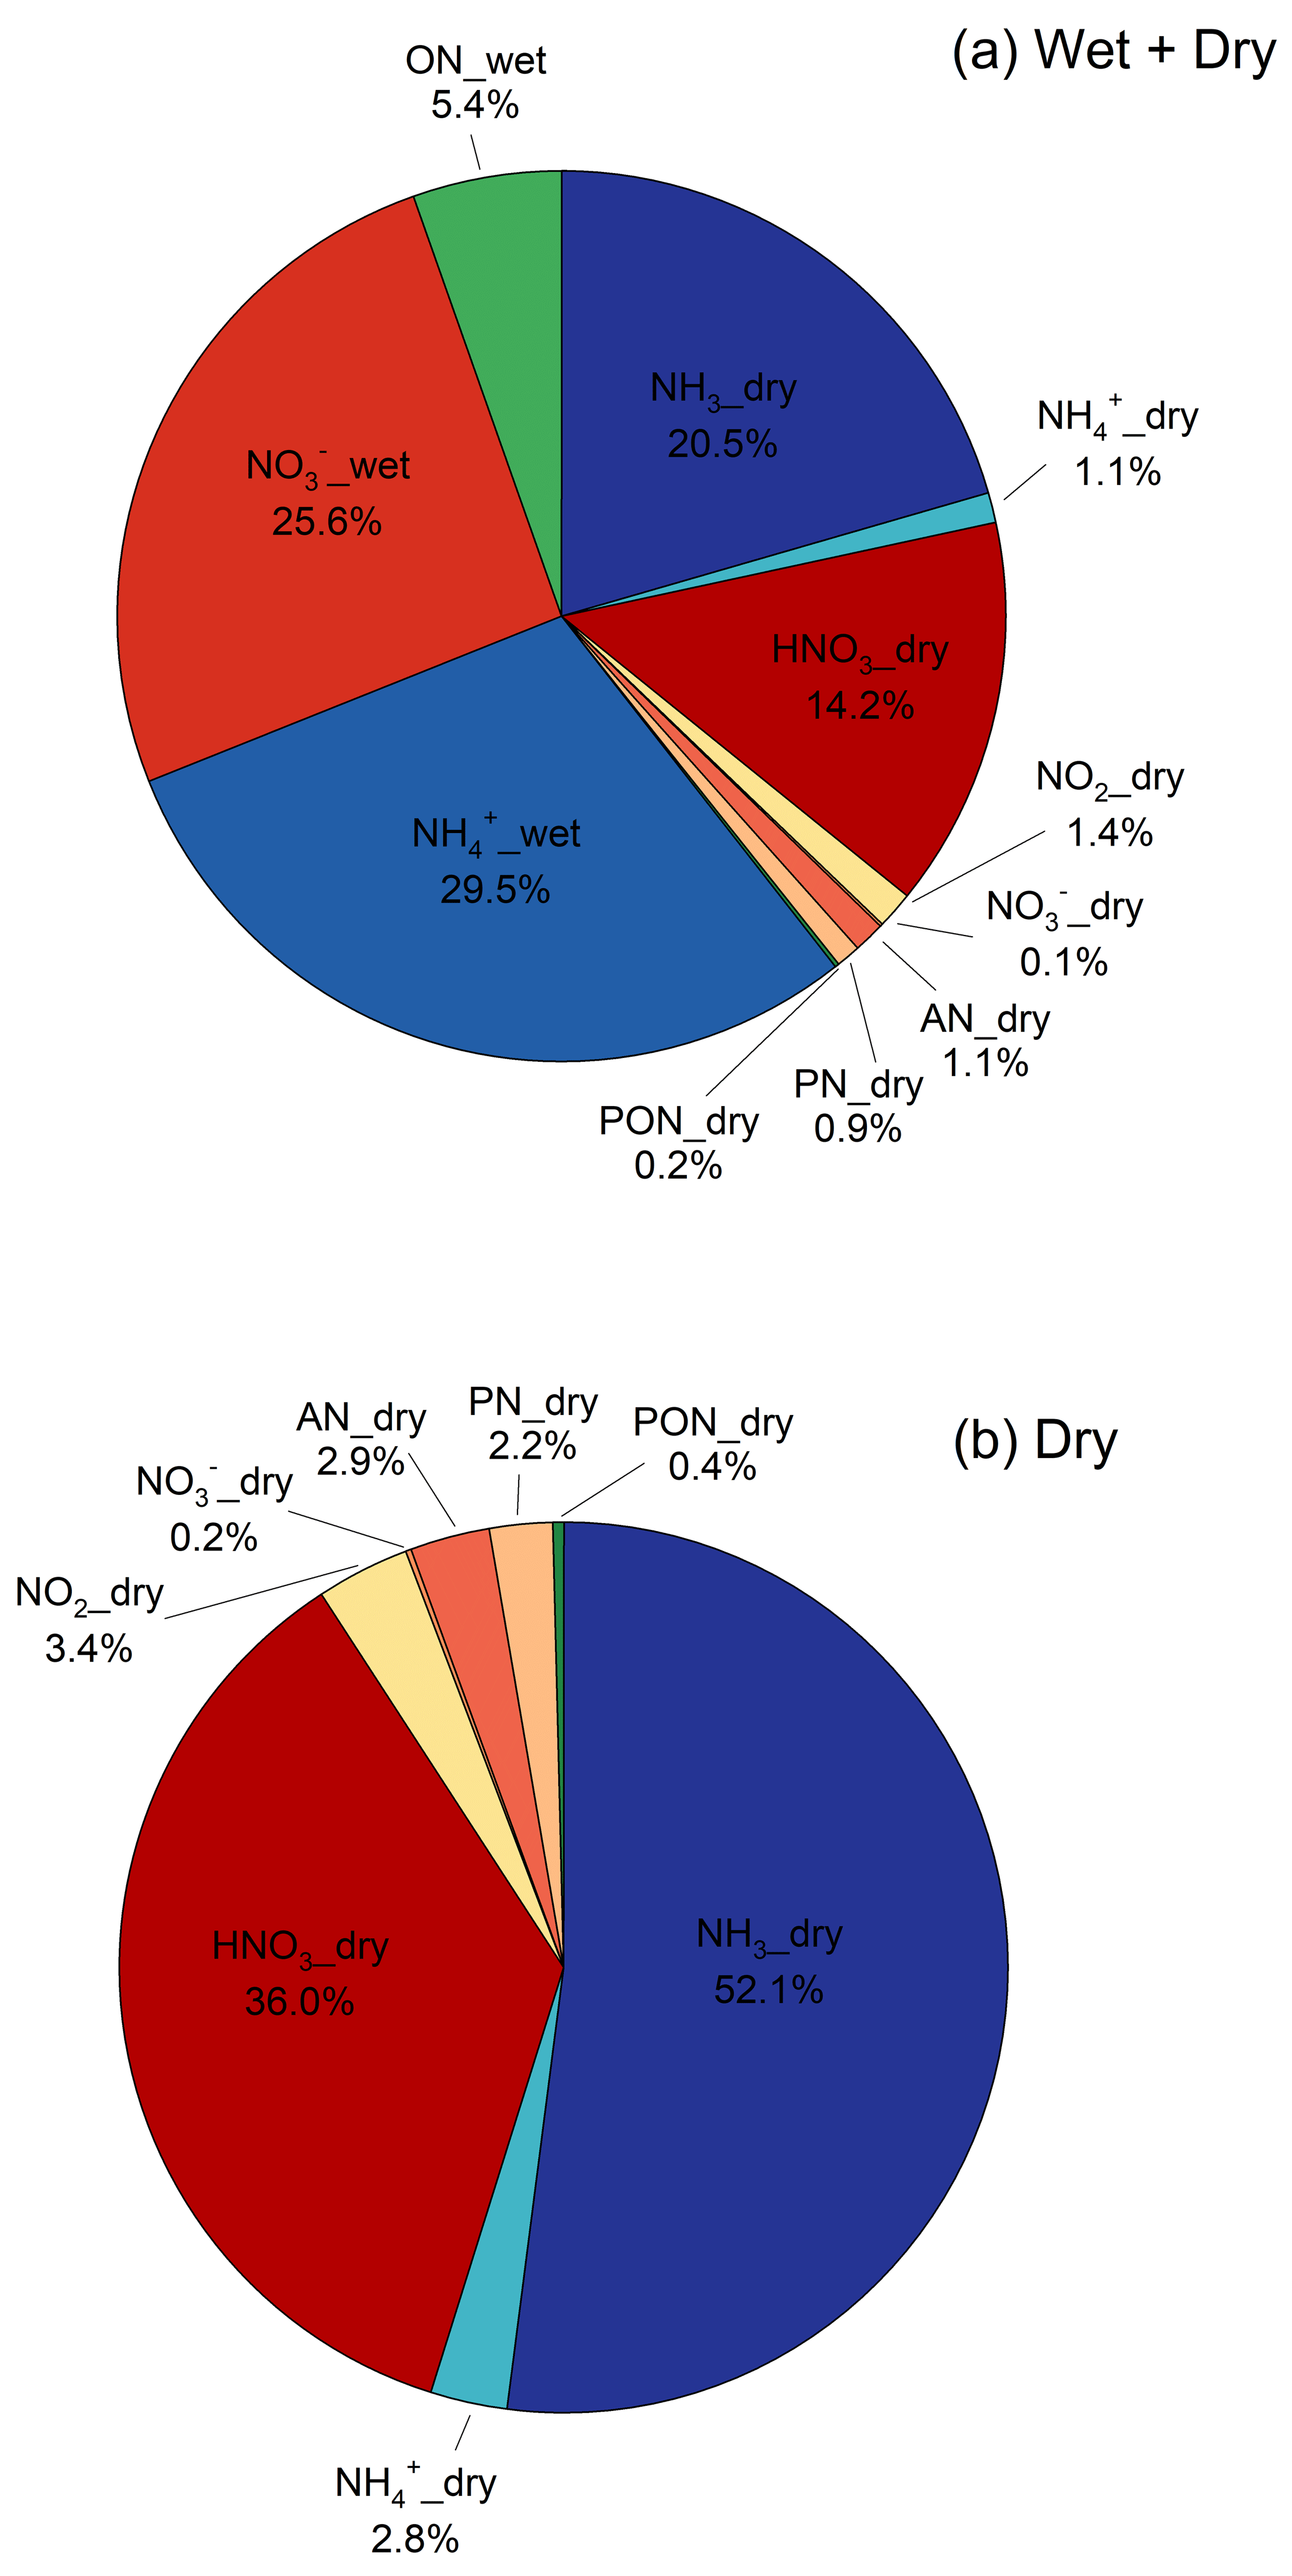
Figure 11Speciated annual total (wet and dry) (a) and dry (b) deposition showing the percent contribution of individual components.
Ammonia is the most important contributor to the dry deposition budget (52.1 %) and differs from the other species in that it is exchanged bidirectionally between the ground, canopy, and atmosphere.
Seasonal net canopy-scale and component fluxes are shown in Fig. S9. The mean net flux (Fnet) is downward (i.e., deposition) during all seasons, generally following the seasonal pattern of the atmospheric NH3 concentration. The cuticular flux (Fcut), which is unidirectional in STAGE, is the dominant deposition pathway and ranged from −97.7 ng N m−2 s−1 (deposition) to near zero. The contribution of Fcut to the total net flux ranged from 84.7 % in spring to ∼ 100 % during fall. The stomatal flux (Fs) is bidirectional, ranging from −4.5 ng N m−2 s−1 (deposition) to 2.3 ng N m−2 s−1 (emission), with the largest fluxes occurring during warmer periods of the growing season when the stomatal resistance is lowest. The stomatal flux is smaller than Fcut for several reasons. First, Rs is generally larger than Rcut. Also, in the current model formulation the cuticular compensation is Xcut=0. Thus, the NH3 concentration gradient between air above the leaf (Xleaf) and Xs is smaller than for Xcut. Finally, low LAI and large Rs in winter and fall as well as offsetting bidirectional fluxes in spring and summer result in a relatively small mean stomatal deposition flux (Fs) across seasons. Fg is also bidirectional, ranging from −3.9 ng N m−2 s−1 (deposition) to 2.5 ng N m−2 s−1 (emission). Fluxes are largest during spring as atmospheric NH3 begins to increase with warmer temperatures but before peak LAI is reached, after which the denser canopy increases the in-canopy aerodynamic (Rinc) and air-side ground boundary layer resistances (Rbg) (Table S2), thereby decreasing Fg. On an annual scale, Fg and Fs make similar contributions to (∼ 3.0 %) Fnet.
Nitric acid was the second-largest component of dry deposition, contributing 36.0 % of the total. While HNO3 deposits more rapidly than NH3 (Table S10), the overall importance to the dry N budget is constrained by relatively low air concentrations at this remote forest site. Particulate species made much smaller contributions to the budget due to much lower deposition velocities (Vd = flux–air concentration) relative to their gaseous counterparts (Table S10). For example, while NH and NH3 contributed approximately equally to the atmospheric NHx load (Fig. 7), the NHx flux budget was regulated by the much more rapid exchange of NH3 between the forest and atmosphere relative to NH. A similar example was observed for oxidized N. While NO2 represents an important fraction of the oxidized N concentration budget via its contribution to “other NOy”, NO2 deposits much less rapidly than HNO3 (Table S10), thereby contributing a relatively small fraction (3.4 %) of the dry N flux. Of the organic N species, AN contributed slightly more (2.9 %) to dry N deposition than PN (2.2 %) owing to a higher deposition velocity (Table S10). Similar to particulate NH and NO, PON made a small contribution to dry N deposition (0.4 %) due to its low Vd (Table S10). Reduced forms of N accounted for the majority of dry N deposition (54.9 %), with oxidized inorganic and organic forms of N contributing 39.6 % and 5.5 %, respectively.
Total N deposition peaked during the summer (2.5 kg N ha−1) and reached a minimum in the fall (1.0 kg N ha−1) (Fig. 12). Wet deposition exceeded dry deposition during all seasons. Seasonal variability in wet deposition was primarily driven by precipitation amount, whereas dry deposition was influenced by seasonality in air concentrations of the primary Nr species (Figs. 6 and 7), LAI (Fig. S6), turbulence, and other surface characteristics. Ammonia fluxes followed the seasonal pattern of air concentration, peaking in the summer and reaching a minimum in winter. Concentrations and fluxes of HNO3 peaked in the spring and reached a minimum in the fall. Deposition velocities, which can be thought of as the concentration-normalized flux, peaked during the summer and reached a minimum during winter for most N species. This pattern likely reflects the combined effect of seasonal cycles in LAI and turbulence characteristics. The seasonal pattern of Vd for HNO3 differed slightly from the other species, peaking in spring and reaching a minimum in fall. In contrast to other N species, HNO3 deposition is limited by turbulent transfer, with the canopy (surface) resistance assumed to be zero. The pattern of HNO3 Vd thus partially reflects seasonal patterns in wind speed and the degree of turbulent mixing above the canopy.
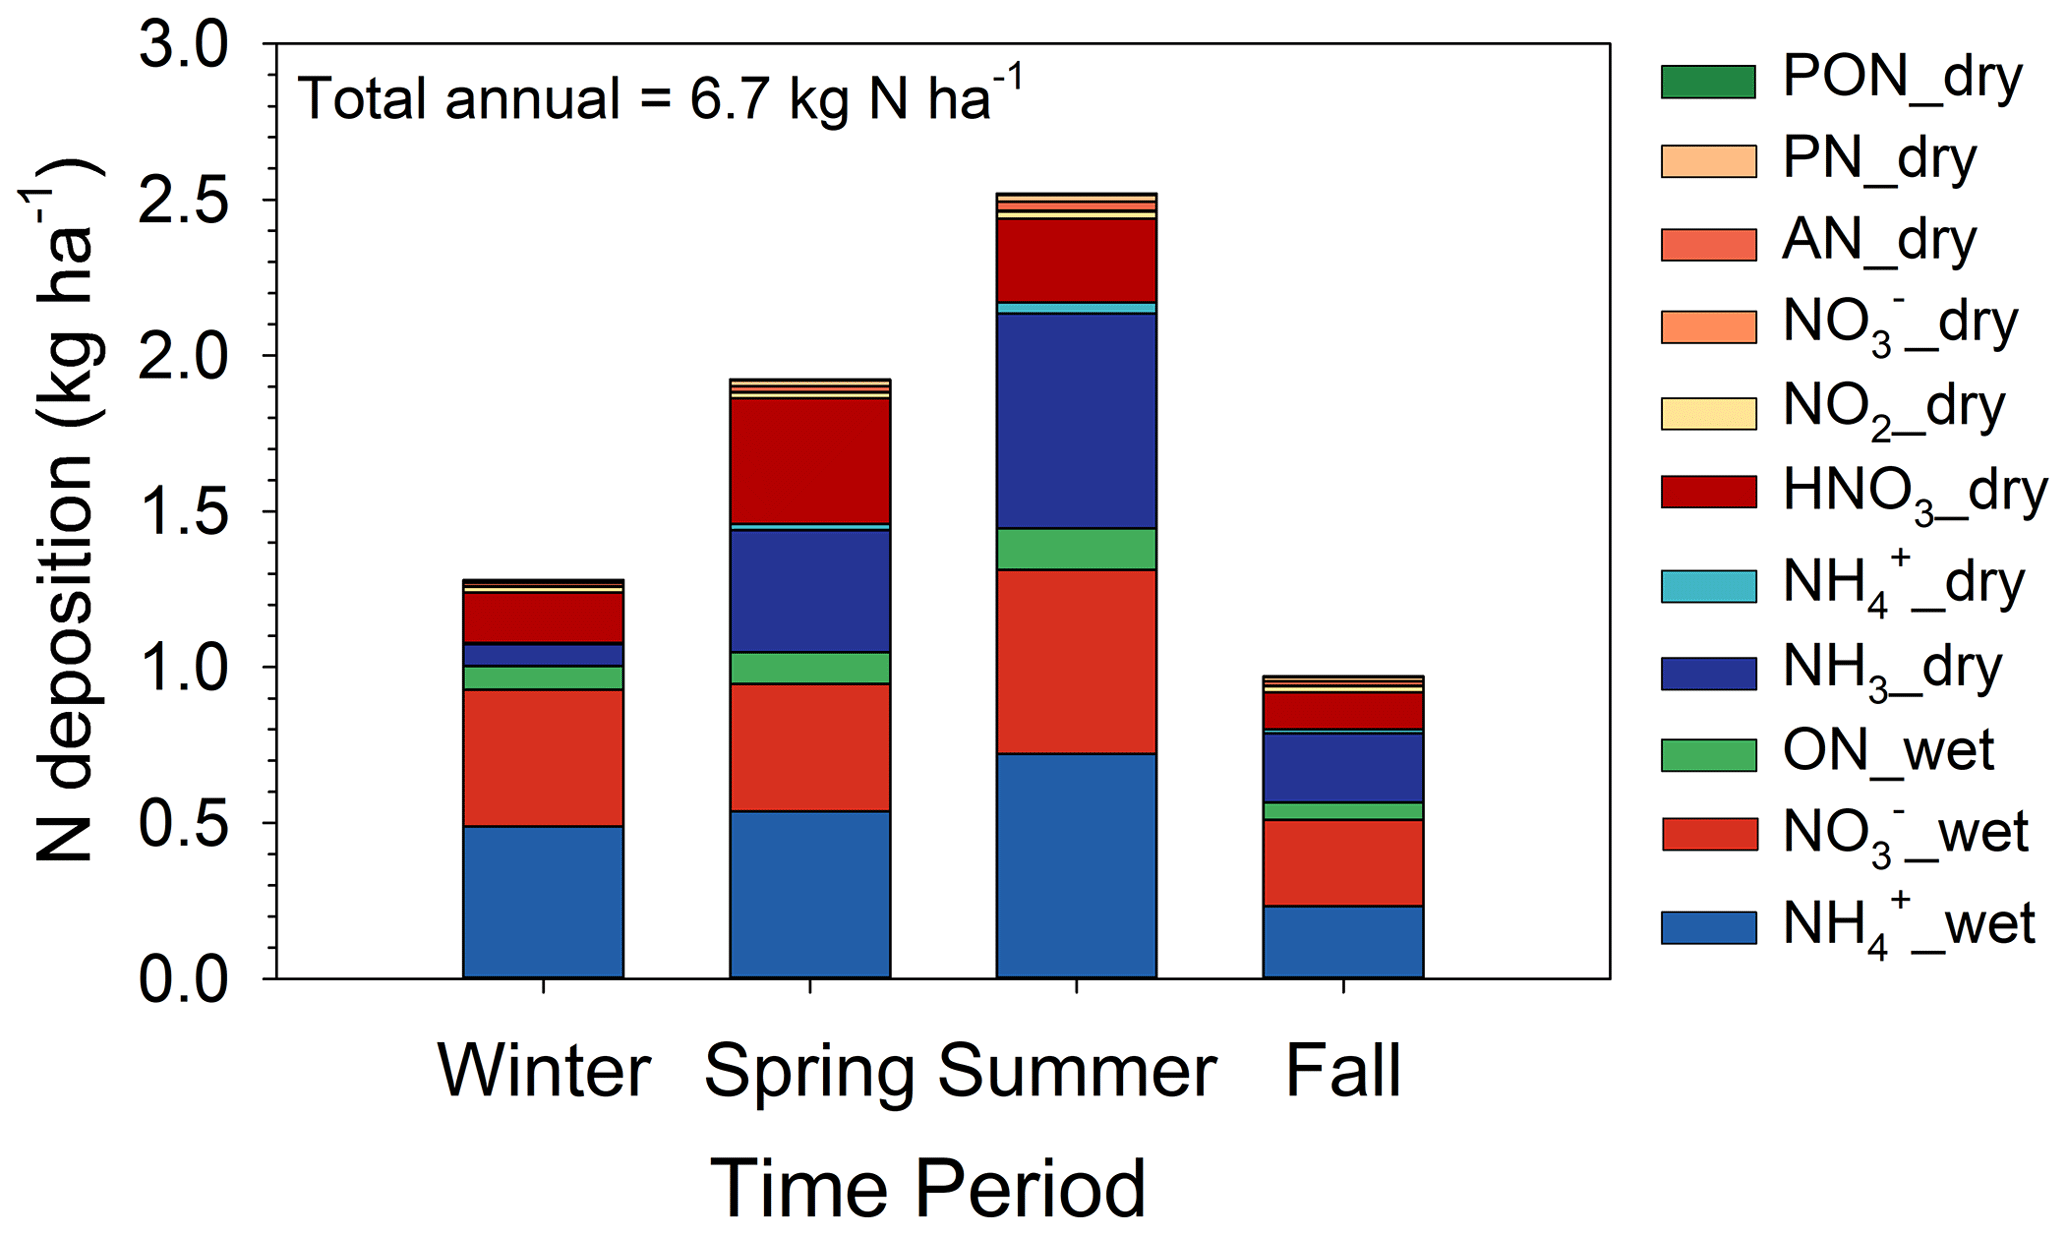
Figure 12Seasonal speciated deposition budget. Nr species are listed in the legend as defined in the text, along with indication of the deposition pathway (dry or wet).
3.8 Evaluation of the dry deposition model
While total uncertainty in the dry deposition budget cannot be rigorously quantified (Walker et al., 2019a), the sensitivity of the model to parameterizations and key inputs can elucidate important aspects of model uncertainty and inform a potential range of dry deposition estimates. Here we undertake such an exercise by evaluating several alternative modeling scenarios to assess the sensitivity of fluxes and total dry deposition to assumptions regarding LAI, NH3 emission potentials (Γs,l), NH3 cuticular resistance (Rcut,dry), and particle size distribution. We focus on NH3, as it is the most important component of the dry deposition budget and more complex with regard to air–surface exchange processes than the other species. Sensitivity tests are summarized in Sect. S5 and Table S11. Of the scenarios tested, increasing Γl and Γs within the range of observations and reducing Rcut,dry within the variability reported by Massad et al. (2010) exerted the largest control over the dry deposition flux, establishing a range of total dry deposition from 2.0 (increasing Γs,l) to 3.1 (decreasing Rcut,dry) kg N ha−1 around the base value of 2.6 kg N ha−1. The corresponding percent contribution of NH3 to total dry N deposition ranges from 36.6 % to 58.5 % (base 52 %), and the contribution of dry to total wet + dry deposition ranges from 33.0 % to 43.0 % (base 39.4 %). Our results point to the need for a better understanding of the processes of cuticular exchange and the importance of adequately characterizing the magnitude and variability of vegetation and litter emission potentials in forests.
Another method of evaluating model behavior is comparison with measured Vd. During the final summer intensive, a small dataset (N = 19 observations) of Vd was determined from daytime measurements of vertical concentration gradients above the canopy using the MBR method. Measured Vd was compared to Vd derived from the STAGE model for overlapping periods and the maximum possible Vdmax as . Of the 19 MBR measurements, four NH3 profiles exhibited emissions (6.8 to 22.4 ng NH3 m2 s−1), which were not reproduced by STAGE. Analysis of the meteorological conditions during the MBR measurements suggests that emissions tend to occur during the warmest periods with lowest relative humidity. This would correspond to periods when Rcut and Xs are high and may indicate that the model is underestimating Fs emissions during these periods. Excluding the four emission periods, Vd estimated from MBR and STAGE agree reasonably well (Fig. S11). As is the case for STAGE, resistance-based models typically assume that HNO3 deposits at the rate of Vdmax (i.e., Rc=0). As shown in Fig. S11, fluxes measured during summer 2016 showed MBR Vd for HNO3 larger than NH3, as expected, but lower than Vdmax. This apparent nonzero Rc could result from a real nonzero Rc caused, for example, by equilibrium of HNO3 and NO on leaf surfaces (Nemitz et al., 2004a). This pattern may also reflect the influence of flux divergence related to NH4NO3 evaporation in the canopy crown, which would reduce the magnitude of the downward vertical gradients, and therefore the measured Vd, of HNO3 and NH3 (Nemitz et al., 2004b). In this analysis, concentrations of NO (mean 0.08 µg m−3) were much lower than HNO3 (mean 0.47 µg m−3), and NO gradients were therefore difficult to resolve, precluding a definitive explanation of HNO3 Vd<Vdmax. Ignoring potentially significant uncertainties related to the measurement of chemical and temperature gradients within the roughness sublayer, our results suggest that periods of NH3 emission during the day, particularly at higher air temperature and lower humidity, may be underestimated. Our results also reinforce the need for temporally extensive measurements of concentrations and fluxes of HNO3, NH3, and NO to examine exchange processes and uncertainties related to chemical flux divergence.
3.9 Spatial and temporal representativeness of the deposition budget
The complexity of atmospheric flows in mountainous terrain influences the spatial variability of wet and dry deposition processes (Lehner and Rotach, 2018). As the deposition budget presented above is based on measurements from the lowest elevation portion of the Coweeta Basin, the degree to which the budget is spatially representative must be considered. Potential effects on dry deposition were assessed by characterizing the magnitude and spatial variability of HNO3 and NH3 concentrations along an elevation gradient (Fig. 1, Table 1) from the lower to upper portions of the Coweeta Basin. It should be noted that HNO3 concentrations at NC25 were measured by CASTNET, while HNO3 passive samplers were used at the other locations. Concentrations are summarized in Fig. 13, in which the sites are ordered left to right from lowest to highest elevation. Nitric acid and NH3 concentrations increase slightly with elevation, an explanation for which is not obvious. Nitric acid concentrations are highest at Screwdriver Knob, which is distinct from the other sites in that the measurement tower was situated on a relatively narrow exposed ridge. The measurements are therefore higher above the surrounding vegetation than at the other sites. Overall, variability of air concentrations across sites, even including SK, is sufficiently small such that spatial variability of dry deposition across the basin would likely be driven more by variability in meteorology than air concentrations.
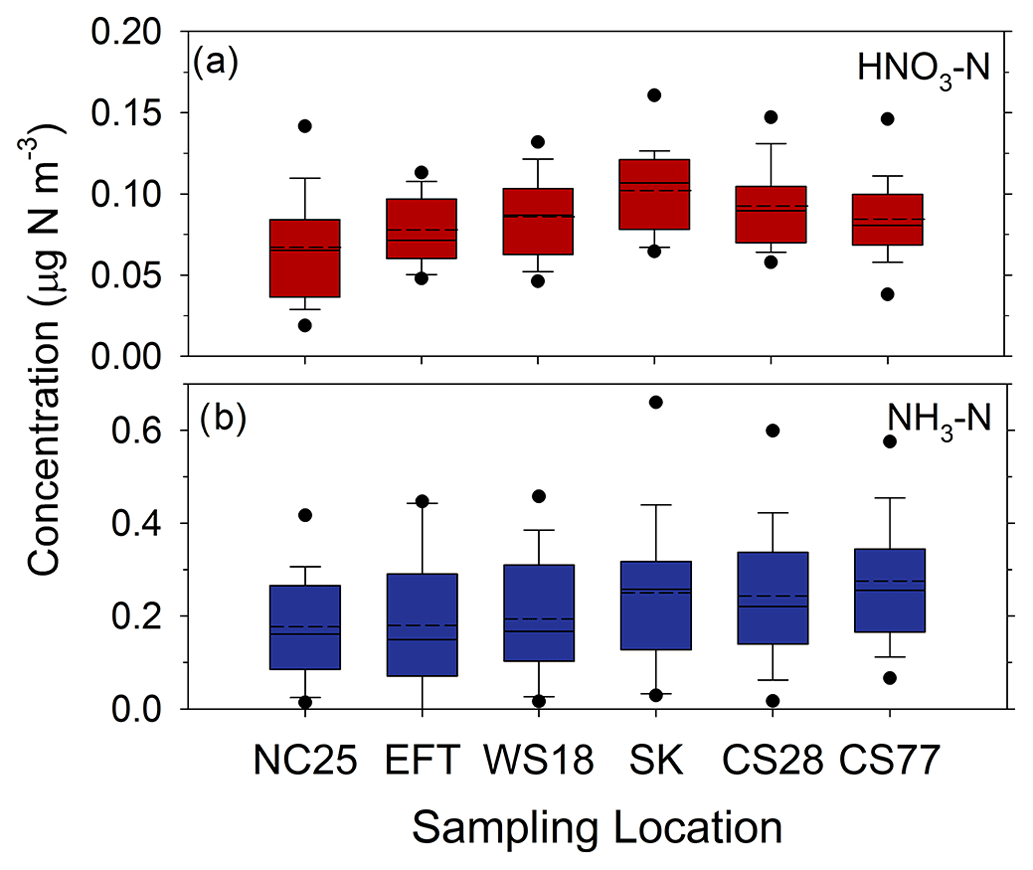
Figure 13Concentrations (as N) of HNO3 (a) and NH3 (b) measured at different elevations, increasing from left to right (see Fig. 1 and Table 1), across the Coweeta Basin. Solid and dashed lines inside the box represent the median and mean, respectively. The top and bottom of the box represent 75th and 25th percentiles. Whiskers represent 90th and 10th percentiles, and dots represent 95th and 5th percentiles.
A quantitative assessment of the effects of airflow on dry deposition across the basin is not possible, but the work of Hicks (2008) illustrates the relevant effects in the context of the resistance analogy for Vd. Over flat homogeneous terrain, flux to vegetation is driven by turbulent diffusion in the vertical direction above the canopy and horizontal advection is assumed to be zero. In the extreme case of airflow approaching a steep forested slope, horizontal flow penetrates the canopy and the transfer of material (deposition) to the canopy elements becomes dominated by horizontal advection and filtration rather than vertical diffusion. In the context of Vd, this situation is analogous to the aerodynamic resistance (Ra) approaching zero. Taking HNO3 as an example under the typical assumption that the canopy resistance is Rc = 0, Vd becomes limited by the quasi-laminar boundary layer resistance at the vegetation surfaces (Rb). Following the analysis of Hicks (2008), Vd for HNO3 could be enhanced by a factor of (Hicks, 2008). Using median values of Ra and Rb from our modeling period, this would increase Vd for HNO3 by a factor of ∼ 1.4. For gases that have a significant Rc, enhancements will be smaller. Topographical relief across the Coweeta Basin may be gentle enough such that the flow separation described in the previous example is limited to certain areas and meteorological scenarios. However, as Hicks (2008) points out, flow complexity in mountainous areas has the overall effect of increasing Vd, with areal weighted fluxes being highly dependent on the topographical characteristics specific to the study area. Other effects related to katabatic flows (Novick et al., 2016) and diel patterns of hillside shading that drive temperature-related processes such as NH3 compensation points introduce additional uncertainties.
The results of Knoepp et al. (2008) show that spatial patterns of wet deposition across the Coweeta Basin follow patterns of precipitation amount, which increase with elevation. In their study, bulk deposition of NH, NO, and total organic nitrogen was measured from 1994–1996 at sites ranging in elevation from 788 to 1389 m. Annual precipitation depth and bulk deposition increased by 25 % from the lowest to the highest elevation. This increase in precipitation with elevation is consistent with the 75-year analysis of Coweeta climatological data by Laseter et al. (2012), which showed that the annual precipitation amount at 1398 m was 32 % greater than at 686 m. In our study, wet deposition was measured at the NC25 site at 686 m and therefore represents a lower wet deposition rate than would occur in higher-elevation portions of the basin. An approximate 35 % enhancement in both wet and dry deposition for the highest elevations within the basin would correspond to a total N deposition rate of 9.0 kg N ha−1 yr−1 based on our estimate of 6.7 kg N ha−1 yr−1 for the lower basin.
Regarding the temporal representativeness of the deposition budget calculated here, wet deposition of inorganic N (NO + NH) during our 12-month model period (3.69 kg N ha−1) agrees well with the mean annual deposition rate measured at NTN site NC25 (3.72 kg N ha−1) over the period 2015–2020, with 2020 being the most recent full year of observations reported at the time of this analysis. Air concentrations of NO and HNO3 (Fig. 6) as well as NH3 and NH (Fig. 7) during our model period are also similar to the 6-year (2015–2020) mean concentrations measured by CASTNET and AMoN. In this context, our results are deemed temporally representative of the most recently available complete years of monitoring data.
Due to the success of the Clean Air Act, air concentrations and wet deposition of reactive N at Coweeta are the lowest observed since the beginning of routine monitoring in the late 1970s. However, even at historically low levels, our results show that Nr deposition remains highly ecologically relevant in the context of critical loads. Our estimate of total Nr deposition of 6.7 kg N ha−1 yr−1 is near the upper-end estimate of mass-balance-derived critical loads (2.8 to 7 kg N ha−1 yr−1) recently reported for spruce–fir, beech, and mixed deciduous forests by Pardo et al. (2018) in the nearby Great Smoky Mountains National Park. Our result also falls within the range of empirical critical loads of N for combined tree health and biogeochemical responses (3–8 kg N ha−1 yr−1) as well as changes in mycorrhizal fungi spore abundance, community structure, and community composition (5–12 kg N ha−1 yr−1) in eastern temperate forests (Pardo et al., 2011).
A key feature of the deposition budget derived for Coweeta is the predominance of reduced forms (NHx) of inorganic nitrogen (51.1 %) over oxidized inorganic N (41.3 %). Reductions in deposition of NHx will be needed to achieve the lower-end estimates of critical N loads (∼ 3 kg N ha−1 yr1) for southern Appalachian forests. This presents a challenge, as emissions and air concentrations of NH3 remain unregulated. Our results also show that organic forms of N make a nontrivial contribution (7.6 %) to total N deposition, primarily via wet deposition. It is noted, however, that the gas-phase dry component of deposition only considers oxidized forms as alkyl and peroxy nitrates, excluding contributions from reduced (i.e., NH) organic compounds. While our results represent an advancement in accounting for organic dry Nr deposition in total Nr deposition, the application of new measurement technologies (Walker et al., 2019b) for broader chemical speciation of organic forms of dry Nr deposition is needed.
Our results underscore the need for long-term measurements of reactive chemical fluxes, as well as the coupling of atmospheric and biogeochemical measurements, to improve air–surface exchange models. Novel measurements that more directly elucidate the role of cuticular exchange of NH3 and more temporally extensive measurements of leaf NH3 emission potentials are particularly needed. For forest ecosystems, a physically representative parameterization for resistance to NH3 diffusion through the leaf litter layer and more temporally extensive measurements of the litter NH3 emission potential combined with more thorough understanding of litter decay dynamics are also needed. For sensitive ecosystems located in mountainous and other topographically complex landscapes, which includes much of the Class I wilderness area in the US, identification of locations suitable for micrometeorological flux measurements will be challenging. Novel flux measurement methods and application of in situ models, including translation of measurements from more ideal to complex locations, will likely be needed. Furthermore, long-term flux datasets are needed to assess the interactive effects of changing air quality and climate on both atmosphere–biosphere exchange and ecosystem response to deposition (e.g., Van Houtven et al., 2019).
Code is available at https://doi.org/10.5281/zenodo.7667344 (Bash and Wu, 2023).
NADP, AMoN, and CASTNET data are available at the websites referenced herein (see Sect. 2.1 for more information). Other data appearing in figures and tables are available at https://catalog.data.gov/dataset/epa-sciencehub (EPA ScienceHub, 2023).
The supplement related to this article is available online at: https://doi.org/10.5194/bg-20-971-2023-supplement.
JTW: conceptualization, formal analysis, methodology, funding acquisition, project administration, validation, visualization, writing. XC: formal analysis, investigation, methodology, validation, writing. ZW: formal analysis, investigation, methodology, software validation, writing. DS: investigation, formal analysis. RD: investigation, formal analysis, validation. AD: data curation, investigation, methodology, resources. ACO: conceptualization, formal analysis, methodology, validation. EE: data curation, funding acquisition, formal analysis, methodology, validation, resources. JB: formal analysis, methodology, software. JK: data curation, investigation. MP: conceptualization, funding acquisition, resources. JI: formal analysis, investigation, writing. CFM: conceptualization, funding acquisition, resources, writing.
The contact author has declared that none of the authors has any competing interests.
The views expressed in this article are those of the authors and do not
necessarily represent the views or policies of the U.S. EPA. The findings and conclusions in this publication are
those of the authors and should not be construed to represent any official
USDA or U.S. Government determination or policy.
Publisher's note: Copernicus Publications remains neutral with regard to jurisdictional claims in published maps and institutional affiliations.
We gratefully acknowledge field and laboratory support from USDA Forest Service staff at the Coweeta Hydrologic Laboratory, including Christine Sobek, Patsy Clinton, Chuck Marshall, and Cindi Brown. David Kirchgessner (retired, U.S. EPA) tirelessly supported field and laboratory activities during SANDS intensives. Lee Nanny (former U.S. EPA) and Mark Barnes (U.S. EPA) supported field intensives and logistics. We also appreciate the support of Kevin Mishoe (Wood, Inc.) and Christopher Rogers (Wood, Inc.) for support of CASTNET field activities and data management, respectively.
This research has been supported by the U.S. Environmental Protection Agency (Intramural) and the USDA Forest Service, Southern Research Station, Coweeta Hydrologic Lab.
This paper was edited by Ivonne Trebs and reviewed by Chris Flechard and one anonymous referee.
Altieri, K. E., Hastings, M. G., Peters, A. J., and Sigman, D. M.: Molecular characterization of water soluble organic nitrogen in marine rainwater by ultra-high resolution electrospray ionization mass spectrometry, Atmos. Chem. Phys., 12, 3557–3571, https://doi.org/10.5194/acp-12-3557-2012, 2012.
Altieri, K. E., Turpin, B. J., and Seitzinger, S. P.: Composition of dissolved organic nitrogen in continental precipitation investigated by Ultra-High Resolution FT-ICR Mass Spectrometry, Environ. Sci. Technol., 43, 6950–6955, https://doi.org/10.1021/es9007849, 2018.
Appel, K. W., Bash, J. O., Fahey, K. M., Foley, K. M., Gilliam, R. C., Hogrefe, C., Hutzell, W. T., Kang, D., Mathur, R., Murphy, B. N., Napelenok, S. L., Nolte, C. G., Pleim, J. E., Pouliot, G. A., Pye, H. O. T., Ran, L., Roselle, S. J., Sarwar, G., Schwede, D. B., Sidi, F. I., Spero, T. L., and Wong, D. C.: The Community Multiscale Air Quality (CMAQ) model versions 5.3 and 5.3.1: system updates and evaluation, Geosci. Model Dev., 14, 2867–2897, https://doi.org/10.5194/gmd-14-2867-2021, 2021.
Asman, W. A. H.: Parameterization of below-cloud scavenging of highly soluble gases under convective conditions, Atmos. Environ., 29, 1359–1368, https://doi.org/10.1016/1352-2310(95)00065-7,1995.
Bash, J. O., Walker, J. T., Katul, G. G., Jones, M. R., Nemitz, E., and Robarge, W. P.: Estimation of in-canopy ammonia sources and sinks in a fertilized Zea mays field, Environ. Sci. Technol., 44, 1683–1689, https://doi.org/10.1021/es9037269, 2010.
Beem, K. B., Raja, S., Schwandner, F. M., Taylor, C., Lee, T., Sullivan, A. P., Carrico, C. M., McMeeking, G. R., Day, D., Levin, E., Hand, J., Kreidenweis, S. M., Malm, W. C., and Collett Jr., J. L.: Deposition of reactive nitrogen during the Rocky Mountain Airborne Nitrogen and Sulfur (RoMANS) Study, Environ. Pollut., 158, 862–872, 10.1016/j.envpol.2009.09.023, 2010.
Benedict, K. B.: Observations of atmospheric reactive nitrogen species and nitrogen deposition in the Rocky Mountains (Thesis), Colorado State University, Libraries, http://hdl.handle.net/10217/71545 (last access: 1 July 2020), 2012.
Benedict, K. B., Day, D., Schwandner, F. M., Kreidenweis, S. M., Schichtel, B., Malm, W. C., and Collett, J. L.: Observations of atmospheric reactive nitrogen species in Rocky Mountain National Park and across northern Colorado, Atmos. Environ., 64, 66–76, https://doi.org/10.1016/j.atmosenv.2012.08.066, 2013.
Blanchard, C. L. and Hidy, G. M.: Effects of SO2 and NOx emission reductions on PM2.5 mass concentrations in the Southeastern United States, J. Air Waste Manage., 55, 265–272, https://doi.org/10.1080/10473289.2005.10464624, 2005.
Bobbink, R., Hornung M., and Roelofs, J. M.: The effects of air-borne nitrogen pollutants on species diversity in natural and semi-natural European vegetation, J. Ecol., 86, 717–738, 1998.
Boonstra, R., Krebs, C. J., and Cowcill, K.: Responses of key understory plants in the boreal forests of western North America to natural versus anthropogenic nitrogen levels, Forest Ecol. Manag., 401, 45–54, https://doi.org/10.1016/j.foreco.2017.06.065, 2017.
Bragazza, L., Freeman, C., Jones, T., Rydin, H., Limpens, J., Fenner, N., Ellis, T., Gerdol, R., Hajek, M., Iacumin, P., Kutnar, L., Tahvanainen, T., and Toberman, H.: Atmospheric nitrogen deposition promotes carbon loss from peat bogs, P. Natl. Acad. Sci. USA, 103, 19386–19389, https://doi.org/10.1073/pnas.0606629104, 2006.
Browne, E. C. and Cohen, R. C.: Effects of biogenic nitrate chemistry on the NOx lifetime in remote continental regions, Atmos. Chem. Phys., 12, 11917–11932, https://doi.org/10.5194/acp-12-11917-2012, 2012.
Browne, E. C., Min, K.-E., Wooldridge, P. J., Apel, E., Blake, D. R., Brune, W. H., Cantrell, C. A., Cubison, M. J., Diskin, G. S., Jimenez, J. L., Weinheimer, A. J., Wennberg, P. O., Wisthaler, A., and Cohen, R. C.: Observations of total RONO2 over the boreal forest: NOx sinks and HNO3 sources, Atmos. Chem. Phys., 13, 4543–4562, https://doi.org/10.5194/acp-13-4543-2013, 2013.
Bash, J. and Wu, Z.: STAGE bidirectional air-surface exchange model (Version 1), Zenodo [code], https://doi.org/10.5281/zenodo.7667344, 2023.
Butler, T., Vermeylen, F., Lehmann, C. M., Likens, G. E., and Puchalski, M.: Increasing ammonia concentration trends in large regions of the USA derived from the NADP/AMoN network, Atmos. Environ., 146, 132–140, https://doi.org/10.1016/j.atmosenv.2016.06.033, 2016.
Bytnerowicz, A., Sanz, M. J., Arbaugh, M. J., Padgett, P. E., Jones, D. P., and Davila, A.: Passive sampler for monitoring ambient nitric acid (HNO3) and nitrous acid (HNO2) concentrations, Atmos. Environ., 39, 2655–2660, https://doi.org/10.1016/j.atmosenv.2005.01.018, 2005.
Caldwell, P., Muldoon, C., Ford Miniat, C., Cohen, E., Krieger, S., Sun, G., McNulty, S., and Bolstad, P. V.: Quantifying the role of National Forest System lands in providing surface drinking water supply for the Southern United States, Gen. Tech. Rep. SRS-197, Asheville, NC, U.S. Department of Agriculture Forest Service, Southern Research Station, 135 pp., https://www.srs.fs.usda.gov/pubs/gtr/gtr_srs197/gtr_srs197.pdf (last access: 1 July 2020), 2014.
Cape, J. N., Cornell, S. E., Jickells, T. D., and Nemitz, E.: Organic nitrogen in the atmosphere-Where does it come from? A review of sources and methods, Atmos. Res., 102, 30–48, https://doi.org/10.1016/j.atmosres.2011.07.009, 2011.
Chen, F. and Dudhia, J.: Coupling an advanced land surface-hydrology model with the Penn State-NCAR MM5 modeling system. Part I: Model implementation and sensitivity, Mon. Weather Rev., 129, 569–585, https://doi.org/10.1175/1520-0493(2001)129<0569:CAALSH>2.0.CO;2, 2001.
Chen, X., Walker, J. T., and Geron, C.: Chromatography related performance of the Monitor for AeRosols and GAses in ambient air (MARGA): laboratory and field-based evaluation, Atmos. Meas. Tech., 10, 3893–3908, https://doi.org/10.5194/amt-10-3893-2017, 2017.
Chen, X., Xie, M., Hays, M. D., Edgerton, E., Schwede, D., and Walker, J. T.: Characterization of organic nitrogen in aerosols at a forest site in the southern Appalachian Mountains, Atmos. Chem. Phys., 18, 6829–6846, https://doi.org/10.5194/acp-18-6829-2018, 2018.
Clark, C. M., Phelan, J., Doraiswamy, P., Buckley, J., Cajka, J. C., Dennis, R. L., Lynch, J., Nolte, C. G., and Spero, T. L.: Atmospheric deposition and exceedances of critical loads from 1800–2025 for the conterminous United States, Ecol. Appl., 28, 978–1002, https://doi.org/10.1002/eap.1703, 2018.
Cowan, N., Nemitz, E., Walker, J. T., Fowler, D., Finnigan, J. J., Webster, H. N., Levy, P., Twigg, M., Tang, S. Y., Bachiller-Jareno, N., Trembath, P., Kinnersley, R. P., and Braban, S. F.: Review of methods for assessing deposition of reactive nitrogen pollutants across complex terrain with focus on the UK (Critical Review), Environ. Sci.: Atmos., 2, 829–851, https://doi.org/10.1039/D2EA00012A, 2022.
Coweeta Hydrologic Laboratory: Procedures for chemical analysis, https://www.srs.fs.usda.gov/coweeta/tools-and-data/wetlab-cookbook_revised-2016-01-08.pdf (last access: 1 July 2020), 2016.
David, M., Loubet, B., Cellier, P., Mattsson, M., Schjoerring, J. K., Nemitz, E., Roche, R., Riedo, M., and Sutton, M. A.: Ammonia sources and sinks in an intensively managed grassland canopy, Biogeosciences, 6, 1903–1915, https://doi.org/10.5194/bg-6-1903-2009, 2009.
Day, D. A., Wooldridge, P. J., Dillon, M. B., Thornton, J. D., and Cohen, R. C.: A thermal dissociation laser-induced fluorescence instrument for in situ detection of NO2, peroxy nitrates, alkyl nitrates, and HNO3, J. Geophys. Res.-Atmos., 107, 4046–4059, https://doi.org/10.1029/2001JD000779, 2002.
Day, D. A., Dillon, M. B., Wooldridge, P. J., Thornton, J. A., Rosen, R. S., Wood, E. C., and Cohen, R. C.: On alkyl nitrates, O3, and the “missing NOy”, J. Geophys. Res.-Atmos., 108, 4501, https://doi.org/10.1029/2003JD003685, 2003.
Doney, S. C., Mahowald, N., Lima, I., Feely, R. A., Mackenzie, F. T., Lamarque, J.-F., and Rasch, P. J.: Impact of anthropogenic atmospheric nitrogen and sulfur deposition on ocean acidification and the inorganic carbon system, P. Natl. Acad. Sci. USA, 104, 14580–14585, https://doi.org/10.1073/pnas.0702218104, 2007.
Ellis, R. A., Jacob, D. J., Sulprizio, M. P., Zhang, L., Holmes, C. D., Schichtel, B. A., Blett, T., Porter, E., Pardo, L. H., and Lynch, J. A.: Present and future nitrogen deposition to national parks in the United States: critical load exceedances, Atmos. Chem. Phys., 13, 9083–9095, https://doi.org/10.5194/acp-13-9083-2013, 2013.
EPA ScienceHub: Data Catalog, EPA ScienceHub [data set], https://catalog.data.gov/dataset/epa-sciencehub, last access: 6 February 2023.
Fahey, K. M., Carlton, A. G., Pye, H. O. T., Baek, J., Hutzell, W. T., Stanier, C. O., Baker, K. R., Appel, K. W., Jaoui, M., and Offenberg, J. H.: A framework for expanding aqueous chemistry in the Community Multiscale Air Quality (CMAQ) model version 5.1, Geosci. Model Dev., 10, 1587–1605, https://doi.org/10.5194/gmd-10-1587-2017, 2017.
Farmer, D. K. and Cohen, R. C.: Observations of HNO3, ΣAN, ΣPN and NO2 fluxes: evidence for rapid HOx chemistry within a pine forest canopy, Atmos. Chem. Phys., 8, 3899–3917, https://doi.org/10.5194/acp-8-3899-2008, 2008.
Flechard, C. R., Nemitz, E., Smith, R. I., Fowler, D., Vermeulen, A. T., Bleeker, A., Erisman, J. W., Simpson, D., Zhang, L., Tang, Y. S., and Sutton, M. A.: Dry deposition of reactive nitrogen to European ecosystems: a comparison of inferential models across the NitroEurope network, Atmos. Chem. Phys., 11, 2703–2728, https://doi.org/10.5194/acp-11-2703-2011, 2011.
Galloway, J. N., Townsend, A. R., Erisman, J. W., Bekunda, M., Cai, Z., Freney, J. R., Martinelli, L. A., Seitzinger, S. P., and Sutton, M. A.:. Transformation of the nitrogen cycle: recent trends, questions and potential solutions, Science, 320, 889–892, https://doi.org/10.1126/science.1136674, 2008.
Giorgi, F.: A particle dry deposition parameterization scheme for use in tracer transport models, J. Geophys. Res.-Atmos., 91, 9794–9806, https://doi.org/10.1029/JD091iD09p09794, 1986.
Hansen, K., Sørensen, L. L., Hertel, O., Geels, C., Skjøth, C. A., Jensen, B., and Boegh, E.: Ammonia emissions from deciduous forest after leaf fall, Biogeosciences, 10, 4577–4589, https://doi.org/10.5194/bg-10-4577-2013, 2013.
Hansen, K., Personne, E., Skjoth, C. A., Loubet, B., Ibrom, A., Jensen, R., Sorenson, L. L., and Beogh, E.: Investigating sources of measured forest-atmospheric ammonia fluxes using tow-layer bi-directional modelling, Agr. Forest Meteorol., 237–238, 80–94, https://doi.org/10.1016/j.agrformet.2017.02.008, 2017.
Harman, I. N. and Finnigan, J. J.: A simple unified theory for flow in the canopy and roughness sublayer, Bound.-Lay. Meteorol., 123, 339–363, https://doi.org/10.1007/s10546-006-9145-6, 2007.
Hicks, B. B.: On estimating dry deposition rates in complex terrain, J. Appl. Meteorol. Clim., 47, 1651–1658, https://doi.org/10.1175/2006JAMC1412.1, 2008.
Hill, P. W., Raven, J. A., and Sutton, M. A.: Leaf age-related differences in apoplastic NH concentration, pH and the NH3 compensation point for a wild perennial, J. Exp. Bot., 53, 277–286, https://doi.org/10.1093/jexbot/53.367.277, 2002.
Holland, E. A., Dentener, F. J., Braswell, B. H., and Sulzman, J. M.: Contemporary and pre-industrial global reactive nitrogen budgets, Biogeochemistry, 46, 7–43, https://doi.org/10.1023/A:1006148011944, 1999.
Husted, S. and Schjoerring, J. K.: Apoplastic pH and ammonium concentration in leaves of Brassica napus L, Plant Physiol., 109, 1453–1460, https://doi.org/10.1104/pp.109.4.1453, 1995.
Jickells, T., Baker, A. R., Cape, J. N., Cornell, S. E., and Nemitz, E.: The cycling of organic nitrogen through the atmosphere, Philos. T. R. Soc. B, 368, 20130115, https://doi.org/10.1098/rstb.2013.0115, 2013.
Keene, W. C., Montag, J. A., Maben, J. R., Southwell, M., Leonard, J., Church, T. M., Moody, J. L., and Galloway, J. N.: Organic nitrogen in precipitation over Eastern North America, Atmos. Environ., 36, 4529–4540, 2002.
Kim, P. S., Jacob, D. J., Fisher, J. A., Travis, K., Yu, K., Zhu, L., Yantosca, R. M., Sulprizio, M. P., Jimenez, J. L., Campuzano-Jost, P., Froyd, K. D., Liao, J., Hair, J. W., Fenn, M. A., Butler, C. F., Wagner, N. L., Gordon, T. D., Welti, A., Wennberg, P. O., Crounse, J. D., St. Clair, J. M., Teng, A. P., Millet, D. B., Schwarz, J. P., Markovic, M. Z., and Perring, A. E.: Sources, seasonality, and trends of southeast US aerosol: an integrated analysis of surface, aircraft, and satellite observations with the GEOS-Chem chemical transport model, Atmos. Chem. Phys., 15, 10411–10433, https://doi.org/10.5194/acp-15-10411-2015, 2015.
Knoepp, J. D., Vose, J. M., and Swank, W. T.: Nitrogen deposition and cycling across an elevation and vegetation gradient in southern Appalachian forests, Int. J. Environ. Stud., 65, 389–408, https://doi.org/10.1080/00207230701862348, 2008.
Knoepp, J. D., See, C. R., Vose, J. M., Miniat, C. F., and Clark, J. S.: Total C and N pools and fluxes vary with time, soil temperature, and moisture along an elevation, precipitation, and vegetation gradient in southern Appalachian forests, Ecosystems, 21, https://doi.org/10.1007/s10021-018-0244-2, 1623–1638, 2018.
LaCount, M. D., Haeuber, R. A., Macy, T. R., and Murray, B. A.: Reducing power sector emissions under the 1990 Clean Air Act Amendments: A retrospective on 30 years of program development and implementation, Atmos. Environ., 245, 118012, https://doi.org/10.1016/j.atmosenv.2020.118012, 2021.
Laseter, S. H., Ford, C. R., Vose, J. M., and Swift, L. W. Jr.: Long-term temperature and precipitation trends at the Coweeta Hydrologic Laboratory, Otto, North Carolina, USA, Hydrol. Res., 43, 890–901, https://doi.org/10.2166/nh.2012.067, 2012.
Lavery, T. F., Rogers, C. M., Baumgardner, R., and Mishoe, K. P.: Intercomparison of Clean Air Status and Trends Network nitrate and nitric acid measurements with data from other monitoring programs, J. Air Waste Manage., 59, 214–226, https://doi.org/10.3155/1047-3289.59.2.214, 2009.
Lee, H.-M., Paulot, F., Henze, D. K., Travis, K., Jacob, D. J., Pardo, L. H., and Schichtel, B. A.: Sources of nitrogen deposition in Federal Class I areas in the US, Atmos. Chem. Phys., 16, 525–540, https://doi.org/10.5194/acp-16-525-2016, 2016.
Lehner, M., and Rotach, M. W.: Current challenges in understanding and predicting transport and exchange in the atmosphere over mountainous terrain, Atmosphere, 9, 276, https://doi.org/10.3390/atmos9070276, 2018.
Li, Y., Schichtel, B. A., Walker, J. T., Schwede, D. B., Chen, X., Lehmann, C. M. B., Puchalski, M. A., Gay, D. A., and Collett, J. L.: Increasing importance of deposition of reduced nitrogen in the United States, P. Natl. Acad. Sci. USA, 113, 5874–5879, https://doi.org/10.1073/pnas.1525736113, 2016.
Lin, M., Walker, J., Geron, C., and Khlystov, A.: Organic nitrogen in PM2.5 aerosol at a forest site in the Southeast US, Atmos. Chem. Phys., 10, 2145–2157, https://doi.org/10.5194/acp-10-2145-2010, 2010.
Lohse, K. A., Hope, D., Sponseller, R., Allen, J. O., and Grimm, N. B.: Atmospheric deposition of carbon and nutrients across an arid metropolitan area, Sci. Total Environ., 402, 95–105, https://doi.org/10.1016/j.scitotenv.2008.04.044, 2008.
Lynch, J. A., Phelan, J., Pardo L. H., McDonnell, T. C., and Clark, C. M.: Detailed Documentation of the National Critical Load Database (NCLD) for U.S. Critical Loads of Sulfur and Nitrogen, version 3.0. National Atmospheric Deposition Program, Illinois State Water Survey, Champaign, IL, https://nadp.slh.wisc.edu/filelib/claddb/DB_Version/Documentation/NCLD_Documentation_v3.2.pdf (last access: 10 September 2019), 2017.
Makar, P. A., Akingunola, A., Aherne, J., Cole, A. S., Aklilu, Y.-A., Zhang, J., Wong, I., Hayden, K., Li, S.-M., Kirk, J., Scott, K., Moran, M. D., Robichaud, A., Cathcart, H., Baratzedah, P., Pabla, B., Cheung, P., Zheng, Q., and Jeffries, D. S.: Estimates of exceedances of critical loads for acidifying deposition in Alberta and Saskatchewan, Atmos. Chem. Phys., 18, 9897–9927, https://doi.org/10.5194/acp-18-9897-2018, 2018.
Massad, R.-S., Nemitz, E., and Sutton, M. A.: Review and parameterisation of bi-directional ammonia exchange between vegetation and the atmosphere, Atmos. Chem. Phys., 10, 10359–10386, https://doi.org/10.5194/acp-10-10359-2010, 2010.
Mattsson, M. and Schjoerring, J. K.: Dynamic and steady-state responses of inorganic nitrogen pools and NH3 exchange in leaves of Lolium perenne and Bromus erectus to changes in root nitrogen supply, Plant Physiol., 128, 742–750, https://doi.org/10.1104/pp.010602, 2002.
Mattsson, M., Herrmann, B., Jones, S., Neftel, A., Sutton, M. A., and Schjoerring, J. K.: Contribution of different grass species to plant-atmosphere ammonia exchange in intensively managed grassland, Biogeosciences, 6, 59–66, https://doi.org/10.5194/bg-6-59-2009, 2009.
McDonnell, T. C., Reinds, G. J., Sullivan, T. J., Clark, C. M., Bonten, L. T. C., Mol-Dijkstra, J. P., Wamelink, G. W. W., and Dovciak, M.: Feasibility of coupled empirical and dynamic modeling to assess climate change and air pollution impacts on temperate forest vegetation of the eastern United States, Environ. Pollut., 234, 902–914, https://doi.org/10.1016/j.envpol.2017.12.002, 2018.
McNulty, S. G., Cohen, E. C., Myers, J. A. M., Sullivan, T. J., and Li, H.: Estimates of critical acid loads and exceedances for forest soils across the conterminous United States, Environ. Pollut., 149, 281–292, https://doi.org/10.1016/j.envpol.2007.05.025, 2007.
NPS: National Park Service, Clean Air Status and Trends Network, hourly trace gas data, https://www.epa.gov/castnet, last access: 6 November 2020.
Meyers, T. P., Hall, M. E., Lindberg, S. E., and Kim, K.: Use of the modified Bowen-ratio technique to measure fluxes of trace gases, Atmos. Environ., 30, 3321–3329, https://doi.org/10.1016/1352-2310(96)00082-9, 1996.
Neff, J. C., Holland, E. A., Dentener, F. J., Mcdowell, W. H., and Russell, K. M.: The origin, composition and rates of organic nitrogen deposition: A missing piece of the nitrogen cycle?, Biogeochemistry, 57/58, 99–136, https://doi.org/10.1023/A:1015791622742, 2002a.
Neff, J. C., Townsend, A. R., Gleixner, G., Lehman, S. J., Turnbull, J., and Bowman, W.: Variable effects of nitrogen additions on the stability and turnover of soil carbon, Nature, 419, 915–917, https://doi.org/10.1038/nature01136, 2002b.
Nemitz, E., Sutton, M., Gut, A., San Jose, R., Husted, S., and Schjoerring, J.: Sources and sinks of ammonia within an oilseed rape canopy, Agr. Forest Meteorol., 105, 385–404, https://doi.org/10.1016/S0168-1923(00)00205-7, 2000a.
Nemitz, E., Sutton, M. A., Schjoerring, J. K., Husted, S., and Wyers, G. P.: Resistance modelling of ammonia exchange over oilseed rape, Agr. Forest Meteorol., 10, 405–425, https://doi.org/10.1016/S0168-1923(00)00206-9, 2000b.
Nemitz, E., Milford, C., and Sutton, M. A.: A two-layer canopy compensation point model for describing bi-directional biosphere-atmosphere exchange of ammonia, Q. J. Roy. Meteor. Soc., 127, 815–833, https://doi.org/10.1002/qj.49712757306, 2001.
Nemitz, E., Sutton, M. A., Wyers, G. P., and Jongejan, P. A. C.: Gas-particle interactions above a Dutch heathland: I. Surface exchange fluxes of NH3, SO2, HNO3 and HCl, Atmos. Chem. Phys., 4, 989–1005, https://doi.org/10.5194/acp-4-989-2004, 2004a.
Nemitz, E., Sutton, M. A., Wyers, G. P., Otjes, R. P., Mennen, M. G., van Putten, E. M., and Gallagher, M. W.: Gas-particle interactions above a Dutch heathland: II. Concentrations and surface exchange fluxes of atmospheric particles, Atmos. Chem. Phys., 4, 1007–1024, https://doi.org/10.5194/acp-4-1007-2004, 2004b.
Nilsson, J. and Grennfelt, P.: Critical levels for sulphur and nitrogen, Miljørapport, Nordic Council of Ministers, Copenhagen, Denmark, 418 pp., 1988.
Nouaime, G., Bertman, S. B., Seaver, C., Elyea, D., Huang, H., Shepson, P. B., Starn, T. K., Riemer, D. D., Zika, R. G., and Olszyna, K.: Sequential oxidation products from tropospheric isoprene chemistry: MACR and MPAN at a NOx-rich forest environment in the southeastern United States, J. Geophys. Res.-Atmos., 103, 22463–22471, 1998.
Novick, K. A., Walker, J. T., Chan, W. S., Sobek, C., and Vose, J.: Eddy covariance measurements with a new fast-response, closed-path analyzer: spectral characteristics and cross-system comparisons, Agr. Forest Meteorol., 181, 17–32, https://doi.org/10.1016/j.agrformet.2013.06.020, 2013.
Novick, K., Brantley, S., Ford Miniat, C., Walker, J. T., and Vose, J.: Inferring the contribution of advection to total ecosystem scalar fluxes over a tall forest in complex terrain, Agr. Forest Meteorol., 185, 1–13, https://doi.org/10.1016/j.agrformet.2013.10.010, 2014.
Novick, K. A., Oishi, A. C., and Miniat, C. F.: Cold air drainage flows subsidize montane valley ecosystem productivity, Glob. Change Biol., 22, 4041–4027, https://doi.org/10.1111/gcb.13320, 2016.
Oishi, A. C., Miniat, C. F., Novick, K. A., Brantley, S. T., Vose, J. M., and Walker, J. T.: Warmer temperatures reduce net carbon uptake, but not water use in a mature southern Appalachian forest, Agr. Forest Meteorol., 252, 269–282, https://doi.org/10.1016/j.agrformet.2018.01.011, 2018.
Ollinger, S. V., Aber, J. D., Reich, P. B., and Freuder, R. J.: Interactive effects of nitrogen deposition, tropospheric ozone, elevated CO2 and land use history on the carbon dynamics of northern hardwood forests, Glob. Change Biol., 8, 545–562, https://doi.org/10.1046/j.1365-2486.2002.00482.x, 2002.
Pardo, L. H., Fenn, M. E., Goodale, C. L., Geiser, L. H., Driscoll, C. T., Allen, E. B., Baron, J. S., Bobbink, R., Bowman, W. D., Clark, C. M., Emmett, B., Gilliam, F. S., Greaver, T. L., Hall, S. J., Lilleskov, E. A., Liu, L., Lynch, J. A., Nadelhoffer, K. J., Perakis, S. S., Robin-Abbott, M. J., Stoddard, J. L., Weathers, K. C., and Dennis, R. L.: Effects of nitrogen deposition and empirical nitrogen critical loads for ecoregions of the United States, Ecol. Appl., 21, 3049–3082, https://doi.org/10.1890/10-2341.1, 2011.
Pardo, L. H., Duarte, N., Van Miegroet, H., Fisher, L. S., and Robin-Abbott, M. J.: Critical loads of sulfur and nitrogen and modeled effects of deposition reduction for forested ecosystems of Great Smoky Mountains National Park, Gen. Tech. Rep. NRS-180, Newtown Square, PA, U.S. Department of Agriculture, Forest Service, Northern Research Station, 26 pp., https://doi.org/10.2737/NRS-GTR-180, 2018.
Paulot, F. and Jacob, D. J.: Hidden cost of U.S. agricultural exports: particulate matter from ammonia emissions, Environ. Sci. Technol., 48, 903–908, https://doi.org/10.1021/es4034793, 2014.
Paulot, F., Henze, D. K., and Wennberg, P. O.: Impact of the isoprene photochemical cascade on tropical ozone, Atmos. Chem. Phys., 12, 1307–1325, https://doi.org/10.5194/acp-12-1307-2012, 2012.
Pearson, J., Woodall, J., Clough, E. C. M., Nielsen, K. H., and Schjoerring, J. K.: Production and consumption of NH3 in trees, in: Trace gas exchange in forest ecosystems, edited by: Gasche, R., Papen, H., and Rennenberg, H., Kluwer Academic, the Netherlands, 53–77, 2002.
Personne, E., Tardy, F., Genermont, S., Decuq, C., Gueudet, J.-C., Mascher, N., Durand, B., Masson, S., Lauransot, M., Flechard, C., Burkhardt, J., and Loubet, B.: Investigating sources and sinks for ammonia exchanges between the atmosphere and a wheat canopy following slurry application with trailing hose, Agr. Forest Meteorol., 207, 11–23, https://doi.org/10.1016/j.agrformet.2015.03.002, 2015.
Pleim, J. and Ran, L.: Surface flux modeling for air quality applications, Atmosphere, 2, 271–302, https://doi.org/10.3390/atmos2030271, 2011.
Pleim, J. E. and Xiu, A.: Development and testing of a surface flux and planetary boundary layer model for application in mesoscale models, J. Appl. Meteorol., 34, 16–32, https://doi.org/10.1175/1520-0450-34.1.16, 1995.
Poorter, H., Niinemets, Ü, Poorter, L., Wright, I. J., and Villar, R.: Causes and consequences of variation in leaf mass per area (LMA): a meta-analysis, New Phytol., 182, 565–588, https://doi.org/10.1111/j.1469-8137.2009.02830.x, 2009.
Nanus, L., McMurray, J. A., Clow, D. W., Saros, J. E., Blett, T., and Gurdak, J. J.: Spatial variation of atmospheric nitrogen deposition and critical loads for aquatic ecosystems in the Greater Yellowstone Area, Environ. Pollut., 223, 644–656, https://doi.org/10.1016/j.envpol.2017.01.077, 2017.
Root, H. T., Geiser, L. H., Jovan, S., and Neitlich, P.: Epiphytic macrolichen indication of air quality and climate in interior forested mountains of the Pacific Northwest, USA, Ecol. Indic., 53, 95–105, https://doi.org/10.1016/j.ecolind.2015.01.029, 2015.
Rumsey, I. C. and Walker, J. T.: Application of an online ion-chromatography-based instrument for gradient flux measurements of speciated nitrogen and sulfur, Atmos. Meas. Tech., 9, 2581–2592, https://doi.org/10.5194/amt-9-2581-2016, 2016.
Samy, S., Robinson, J., Rumsey, I. C., Walker, J. T., and Hays, M. D.: Speciation and trends of organic nitrogen in southeastern U.S. fine particulate matter (PM2.5), J. Geophys. Res.-Atmos., 118, 1996–2006, https://doi.org/10.1029/2012JD017868, 2013.
Schneider S., Geßler A., Weber, P., von Sengbusch, D., Hanemann, U., and Rennenberg, H.: Soluble N compounds in trees exposed to high loads of N: a comparison of spruce (Picea abis) and beech (Fagus sylvatica) grown under field conditions, New Phytol., 134, 103–114, https://doi.org/10.1111/j.1469-8137.1996.tb01150.x, 1996.
Schwede, D. B. and Lear, G. G.: A novel hybrid approach for estimating total deposition in the United States, Atmos. Environ., 92, 207–220, https://doi.org/10.1016/j.atmosenv.2014.04.008, 2014.
Scudlark, J. R., Russell, K. M., Galloway, J. N., Church, T. M., and Keene, W. C.: Organic nitrogen in precipitation at the mid-Atlantic US coast – Methods evaluation and preliminary measurements, Atmos. Environ., 32, 1719–1728, https://doi.org/10.1016/S1352-2310(97)00458-5, 1998.
Shu, Q., Murphy, B., Schwede, D., Henderson, B. H., Pye, H. O. T., Appel, K. W., Khan, T. R., and Perlinger, J. A.: Improving the particle dry deposition scheme in the CMAQ photochemical modeling system, Atmos. Environ., 289, 119343, https://doi.org/10.1016/j.atmosenv.2022.119343, 2022.
Shuttleworth, W. J. and Wallace, J. S.: Evaporation from sparse crops – an energy combination theory, Q. J. Roy. Meteor. Soc., 11, 839–855, https://doi.org/10.1002/qj.49711146910, 1985.
Sickles II, J. E. and Shadwick, D. S.: Air quality and atmospheric deposition in the eastern US: 20 years of change, Atmos. Chem. Phys., 15, 173–197, https://doi.org/10.5194/acp-15-173-2015, 2015.
Simkin, S. M., Allen, E. B., Bowman, W. D., Clark, C. M., Belnap, J., Brooks, M. L., Cade, B. S., Collins, S. L., Geiser, L. H., Gilliam, F. S., Jovan, S. E., Pardo, L. H., Schulz, B. K., Stevens, C. J., Suding, K. N., Throop, H. L., and Waller, D. M.: Conditional vulnerability of plant diversity to atmospheric nitrogen deposition across the United States, P. Natl. Acad. Sci. USA, 113, 4086–4091, https://doi.org/10.1073/pnas.1515241113, 2016.
Slinn, W. G. N.: Predictions for particle deposition to vegetative surfaces, Atmos. Environ., 16, 1785–1794, https://doi.org/10.1016/0004-6981(82)90271-2, 1982.
Sutton, M. A., Asman, W. A. H., Ellermann, T., Van Jaarsveld, J. A., Acker, K., Aneja, V., Duyzer, J., Horvath, L., Paramonov, S., Mitosinkova, M., Tang, Y. S., Achermann, B., Gauger, T., Bartniki, J., Neftel, A., and Erisman, J. W.: Establishing the link between ammonia emission control and measurements of reduced nitrogen concentrations and deposition, Environ. Monit. Assess., 82, 149–185, https://doi.org/10.1023/A:1021834132138, 2003.
Sutton, M. A., Nemitz, E., Milford, C., Campbell, C., Erisman, J. W., Hensen, A., Cellier, P., David, M., Loubet, B., Personne, E., Schjoerring, J. K., Mattsson, M., Dorsey, J. R., Gallagher, M. W., Horvath, L., Weidinger, T., Meszaros, R., Dämmgen, U., Neftel, A., Herrmann, B., Lehman, B. E., Flechard, C., and Burkhardt, J.: Dynamics of ammonia exchange with cut grassland: synthesis of results and conclusions of the GRAMINAE Integrated Experiment, Biogeosciences, 6, 2907–2934, https://doi.org/10.5194/bg-6-2907-2009, 2009.
Tang, Y. S., Cape, J. N., and Sutton, M. A.: Development and types of passive samplers for monitoring atmospheric NO2 and NH3 concentrations, Sci. World J., 1, 513–529, https://doi.org/10.1100/tsw.2001.82, 2001.
Toma, S., Bertman, S., Groff, C., Xiong, F., Shepson, P. B., Romer, P., Duffey, K., Wooldridge, P., Cohen, R., Baumann, K., Edgerton, E., Koss, A. R., de Gouw, J., Goldstein, A., Hu, W., and Jimenez, J. L.: Importance of biogenic volatile organic compounds to acyl peroxy nitrates (APN) production in the southeastern US during SOAS 2013, Atmos. Chem. Phys., 19, 1867–1880, https://doi.org/10.5194/acp-19-1867-2019, 2019.
Trainer, M., Parrish, D. D., Buhr, M. P., Norton, R. B., Fehsenfeld, F. C., Anlauf, K. G., Bottenheim, J. W., Tang, Y. Z., Wiebe, H. A., Roberts, J. M., Tanner, R. L., Newman, L., Bowersox, V. C., Meagher, J. F., Olszyna, K. J., Rodgers, M. O., Wang, T., Berresheim, H., Demerjian, K. L., and Roychowdhury, U. K.: Correlation of ozone with NOy in photochemically aged air, J. Geophys. Res.-Atmos., 98, 2917–2925, https://doi.org/10.1029/92JD01910, 1993.
U.S. EPA.: U.S. Environmental Protection Agency, 2014, Data from the 2014 National Emissions Inventory, Version 2, https://www.epa.gov/air-emissions-inventories/2014-national-emissions-inventory-nei-data (last access: 1 October 2018), 2014.
U.S. EPA.: U.S. Environmental Protection Agency Critical Loads Mapper Tool, https://www.epa.gov/air-research/critical-loads-mapper-tool, last access: 10 September 2019.
van Houtven, G., Phelan, J., Clark, C., Sabo, R. D., Buckley, J., Thomas, R. Q., Horn, K., and LeDuc, S. D.: Nitrogen deposition and climate change effects on tree species composition and ecosystem services for a forest cohort, Ecol. Monogr., 89, e01345, https://doi.org/10.1002/ecm.1345, 2019.
Walker, J. T., Dombek, T. L., Green, L. A., Gartman, N., and Lehmann, C. M. B.: Stability of organic nitrogen in NADP wet deposition samples, Atmos. Environ., 60, 573–582, https://doi.org/10.1016/j.atmosenv.2012.06.059, 2012.
Walker, J. T., Bell, M. D., Schwede, D., Cole, A., Beachley, G., Lear, G., and Wu, Z.: Aspects of uncertainty in total reactive nitrogen deposition estimates for North American critical load applications, Sci. Total Environ., 690, 1005–1018, https://doi.org/10.1016/j.scitotenv.2019.06.337, 2019a.
Walker, J. T., Beachley, G., Amos, H. M., Baron, J. S., Bash, J., Baumgardner, R., Bell, M. D., Benedict, K. B., Chen, X., Clow, D. W., Cole, A., Coughlin, J. G., Cruz, K., Daly, R. W., Decina, S. M., Elliott, E. M., Fenn, M. E., Ganzeveld, L., Gebhart, K., Isil, S. S., Kerschner, B. M., Larson, R. S., Lavery, T., Lear, G. G., Macy, T., Mast, M. A., Mishoe, K., Morris, K. H., Padgett, P. E., Pouyat, R. V., Puchalski, M., Pye, H., Rea, A. W., Rhodes, M. F., Rogers, C. M., Saylor, R., Scheffe, R., Schichtel, B. A., Schwede, D. B., Sexstone, G. A., Sive, B. C., Sosa, R., Templer, P. H., Thompson, T., Tong, D., Wetherbee, G. A., Whitlow, T. H., Wu, Z., Yu, Z., and Zhang, L.: Toward the improvement of total nitrogen deposition budgets in the United States, Sci. Total Environ., 691, 1328–1352, https://doi.org/10.1016/j.scitotenv.2019.07.058, 2019b.
Walker, J. T., Beachley, G., Zhang, L., Benedict, K. B., Sive, B. C., and Schwede, D. B.: A review of measurements of air-surface exchange of reactive nitrogen in natural ecosystems across North America, Sci. Total Environ., 698, 133975, https://doi.org/10.1016/j.scitotenv.2019.133975, 2020.
Wang, L., Xu, Y., and Schjoerring, J. K.: Seasonal variation in ammonia compensation point and nitrogen pools in beech leaves (Fagus sylvatica), Plant Soil, 343, 51–66, https://doi.org/10.1007/s11104-010-0693-7, 2011.
Weathers, K. C., Simkin, S. M., Lovett, G. M., and Lindberg, S. E.: Empirical modeling of atmospheric deposition in mountainous landscapes, Ecol. Appl., 16, 1590–1607, 2006.
Wentworth, G. R., Murphy, J. G., Benedict, K. B., Bangs, E. J., and Collett Jr., J. L.: The role of dew as a night-time reservoir and morning source for atmospheric ammonia, Atmos. Chem. Phys., 16, 7435–7449, https://doi.org/10.5194/acp-16-7435-2016, 2016.
Whitall, D. R. and Paerl, H. W.: Spatiotemporal variability of wet atmospheric nitrogen deposition to the Neuse River Estuary, North Carolina, J. Environ. Qual., 30, 1508–1515, https://doi.org/10.2134/jeq2001.3051508x, 2001.
Williams, E. J., Baumann, K., Roberts, J. M., Bertman, S. B., Norton, R. B., Fehsenfeld, F. C., Springston, S. R., Nunnermacker, L. G., Newman, L., Olszyna, K, Meagher, J., Hartsell, B., Edgerton, E., Perason, J. R., and Rodgers, M. O.: Intercomparison of ground-based NOy measurements techniques, J. Geophys. Res.-Atmos., 103, 22261–22280, https://doi.org/10.1029/98JD00074, 1998.
Wolfe, G. M., Thornton, J. A., Yatavelli, R. L. N., McKay, M., Goldstein, A. H., LaFranchi, B., Min, K.-E., and Cohen, R. C.: Eddy covariance fluxes of acyl peroxy nitrates (PAN, PPN and MPAN) above a Ponderosa pine forest, Atmos. Chem. Phys., 9, 615–634, https://doi.org/10.5194/acp-9-615-2009, 2009.
Xing, J., Pleim, J., Mathur, R., Pouliot, G., Hogrefe, C., Gan, C.-M., and Wei, C.: Historical gaseous and primary aerosol emissions in the United States from 1990 to 2010, Atmos. Chem. Phys., 13, 7531–7549, https://doi.org/10.5194/acp-13-7531-2013, 2013.
Yao, X. and Zhang, L.: Causes of large increases in atmospheric ammonia in the last ecade across North America, ACS Omega, 4, 22133–22142, https://doi.org/10.1021/acsomega.9b03284, 2019.
Yi, C.: Momentum transfer within canopies, J. Appl. Climat., 47, 262–275, https://doi.org/10.1175/2007JAMC1667.1, 2008.
Yu, F., Nair, A. A., and Luo, G.: Long-term trend of gaseous ammonia over the United States: Modeling and comparison with observations, J. Geophys. Res.-Atmos., 123, 8315–8325, https://doi.org/10.1029/2018JD028412, 2018.
Zhang, L., Vet, R., Wiebe, A., Mihele, C., Sukloff, B., Chan, E., Moran, M. D., and Iqbal, S.: Characterization of the size-segregated water-soluble inorganic ions at eight Canadian rural sites, Atmos. Chem. Phys., 8, 7133–7151, https://doi.org/10.5194/acp-8-7133-2008, 2008.
Zhang, R., Thompson, T. M., Barna, M. G., Hand, J. L., McMurray, J. A., Bell, M. D., Malm, W. C., and Schichtel, B. A.: Source regions contributing to excess reactive nitrogen deposition in the Greater Yellowstone Area (GYA) of the United States, Atmos. Chem. Phys., 18, 12991–13011, https://doi.org/10.5194/acp-18-12991-2018, 2018.