the Creative Commons Attribution 4.0 License.
the Creative Commons Attribution 4.0 License.
 | 20 Mar 2024
Above- and belowground plant mercury dynamics in a salt marsh estuary in Massachusetts, USA
Ting Wang
Buyun Du
Inke Forbrich
Joshua Polen
Elsie M. Sunderland
Prentiss H. Balcom
Celia Chen
Daniel Obrist
Estuaries are a conduit of mercury (Hg) from watersheds to the coastal ocean, and salt marshes play an important role in coastal Hg cycling. Hg cycling in upland terrestrial ecosystems has been well studied, but processes in densely vegetated salt marsh ecosystems are poorly characterized. We investigated Hg dynamics in vegetation and soils in the Plum Island Sound estuary in Massachusetts, USA, and specifically assessed the role of marsh vegetation for Hg deposition and turnover. Monthly quantitative harvesting of aboveground biomass showed strong linear seasonal increases in Hg associated with plants, with a 4-fold increase in Hg concentration and an 8-fold increase in standing Hg mass from June (3.9 ± 0.2 µg kg−1 and 0.7 ± 0.4 µg m−2, respectively) to November (16.2 ± 2.0 µg kg−1 and 5.7 ± 2.1 µg m−2, respectively). Hg did not increase further in aboveground biomass after plant senescence, indicating physiological controls of vegetation Hg uptake in salt marsh plants. Hg concentrations in live roots and live rhizomes were 11 and 2 times higher than concentrations in live aboveground biomass, respectively. Furthermore, live belowground biomass Hg pools (Hg in roots and rhizomes, 108.1 ± 83.4 µg m−2) were more than 10 times larger than peak standing aboveground Hg pools (9.0 ± 3.3 µg m−2).
A ternary mixing model of measured stable Hg isotopes suggests that Hg sources in marsh aboveground tissues originate from about equal contributions of root uptake (∼ 35 %), precipitation uptake (∼ 33 %), and atmospheric gaseous elemental mercury (GEM) uptake (∼ 32 %). These results suggest a more important role of Hg transport from belowground (i.e., roots) to aboveground tissues in salt marsh vegetation than upland vegetation, where GEM uptake is generally the dominant Hg source. Roots and soils showed similar isotopic signatures, suggesting that belowground tissue Hg mostly derived from soil uptake. Annual root turnover results in large internal Hg recycling between soils and plants, estimated at 58.6 µg m−2 yr−1. An initial mass balance of Hg indicates that the salt marsh presently serves as a small net Hg sink for environmental Hg of 5.2 µg m−2 yr−1.
- Article
(3070 KB) - Full-text XML
-
Supplement
(851 KB) - BibTeX
- EndNote


Coastal salt marshes are located at the interface between terrestrial and marine ecosystems and undergo diurnal saltwater inundation by tidal water. They provide important ecological services, have high socioeconomic benefits, and serve as sinks and sources of carbon, nutrients, and contaminants (Hopkinson et al., 2018; Morris et al., 2013). They are at the interface of rivers and oceans; rivers annually transport approximately 27 ± 13 Mmol yr−1 of mercury (Hg) to coastal oceans globally (mostly deposited to estuarine regions (Liu et al., 2021; Amos et al., 2014; Zhang et al., 2015). The location of salt marshes at this interface merits an understanding of their respective Hg sinks and sources and their role in coastal Hg cycling. The site of this study was within the Plum Island Sound salt marsh in Massachusetts, USA, the largest macrotidal marsh estuary in New England. The area has been considered a biological mercury (Hg) hotspot, with 62 % of salt marsh sparrows reportedly exceeding a blood Hg threshold that may reduce nesting success (Evers et al., 2007; Jackson et al., 2011; Lane et al., 2011, 2020), although reasons for high Hg exposure are not fully understood. A potentially important Hg source in marshes includes Hg uptake by plants. In terrestrial environments, plants assimilate substantial amounts of atmospheric Hg, which is subsequently transferred to soils via tissue senescence (e.g., litterfall) and wash-off (i.e., throughfall deposition) (Fisher and Wolfe, 2012; Iverfeldt, 1991; Rea et al., 1996; Zhou et al., 2021). This plant Hg uptake is considered to be dominated by assimilation of atmospheric gaseous elemental Hg (GEM), so that global vegetation acts as a large atmospheric GEM pump to soils (Fu et al., 2019; Jiskra et al., 2018; Obrist et al., 2018; Wang et al., 2019, 2022a; Zhou et al., 2021; Zhou and Obrist, 2021). In terrestrial ecosystems, Hg inputs derived from plants are the dominant Hg sources, accounting for 60 % to 90 % of the total Hg inputs to soils (Zhou and Obrist, 2021). Salt marshes are characterized by high plant net primary productivity (NPP) driven by vascular macrophytes, with plant NPP as high and even exceeding that of terrestrial ecosystems (Marques et al., 2011; Tobias and Neubauer, 2009; Visser et al., 2018). For example, salt marsh biomass production across Atlantic and Gulf sites in the USA. ranges from 228 to 1335 g C m−2 yr−1 with a median value of 537 g C m−2 yr−1 (Tobias and Neubauer, 2009). By comparison, NPP across 18 productive US forests ranging between 400 and 1000 g C m−2 yr−1 (He et al., 2012). As salt marshes are considered to be strong sinks of atmospheric carbon driven by plant CO2 assimilation (Forbrich et al., 2018), their high NPP also may lead to increased deposition of atmospheric Hg due to vegetation assimilation of atmospheric Hg and subsequent transfer to salt marsh ecosystems via litterfall and plant senescence.
We hypothesized that salt marsh plants in the Plum Island estuary salt marsh act as substantial sinks of atmospheric Hg via vegetative assimilation of GEM, and aimed to quantify Hg sources in salt marsh vegetation, accumulation rates, and turnover rates of Hg in salt marsh plants. We quantified Hg fluxes and pools associated with plant dynamics in the salt marsh and Hg associated with annual growth of aboveground tissues, estimated transfer of Hg associated with aboveground tissues to soils, and assessed Hg turnover in belowground biomass. In addition, we quantified specific sources of Hg in salt marsh biomass tissues using stable Hg isotope signatures, with isotope endmembers representing different sources such as plant uptake of atmospheric elemental, root uptake of soil Hg, and precipitation-derived deposition. Precipitation Hg may include direct deposition to leaves or uptake from soil water (Jiskra et al., 2018; Niu et al., 2011; Zheng et al., 2016).
2.1 Site description
Sampling sites were located in the Plum Island Sound on the northeastern coast of Massachusetts, USA (42°45′10′′, 70°56′46′′), between the Gulf of Maine and the city of Boston. The estuary is the largest marsh-dominated estuary in New England, with a total marsh area of 60 km2 and salt marsh area of 40 km2 (Hopkinson et al., 2018; Millette et al., 2010). Tides are semidiurnal with an amplitude averaging 2.7 m (NOAA Tide Predictions, 2020). We focused our study on high marsh platforms, with an approximate elevation of 1.4 m above the North American Vertical Datum 88, which dominate tidal marshes in New England and accounts for 75 % of the vegetated area in the Plum Island Sound estuary (Wilson et al., 2014; Millette et al., 2010). The high marsh exhibits poor water drainage (Wilson et al., 2014) and is generally inundated twice per month during spring tides and during major storms (Millette et al., 2010). The two dominant species on the high marsh are C4 species including Sporobolus pumilus (common name: marsh hay) and Sporobolus alterniflorus (common name: smooth cordgrass), with the latter mainly distributed along tidal channels and also dominant in low marsh platforms (Anjum et al., 2012; Cheng et al., 2006; Curtis et al., 1990; Maricle et al., 2009; Sun et al., 2020). Another C4 species, Distichlis spicata (coastal saltgrass), is often collocated within S. pumilus-dominated sites on high marsh platforms (Arp et al., 1993), whereas Juncus gerardii (saltmarsh rush) usually dominates the terrestrial boundary of the high marsh (Bertness, 1991).
Although the upland watershed of this salt marsh does not have any known point sources of Hg, previous studies pointed to the possibility of legacy anthropogenic sources present in this marsh estuary, possibly from ocean water import of Hg from nearby riverine sources, and other possible sources include regional atmospheric deposition directly to the marsh and its watershed (Evers et al., 2007; Lane et al., 2011, 2020; Wang and Obrist, 2022). A previous study by our group showed high Hg concentrations observed in marsh soils and evidence that the salt marsh soils currently serve as a source of Hg to tidal water and the nearby ocean-dominated lateral particulate-bound Hg transport (Wang and Obrist, 2022). However, a comprehensive mass balance of Hg inputs and outputs in this system is currently missing.
2.2 Sampling and processing of vegetation and soil
Aboveground biomass of the dominant species, S. alterniflorus and S. pumilus, were collected every 4 to 5 weeks between June and November in 2021, corresponding to the active growing season. Additional senesced biomass was sampled in the following year in April 2022, and two additional salt marsh species, D. spicata and J. gerardii, were sampled in September 2018. For each sampling date, eight 1 m2 square plots were selected in the footprint area of a micrometeorological flux tower (Forbrich et al., 2018), of which four squares were dominated by S. alterniflorus and four adjacent squares were dominated by S. pumilus. During vegetation sampling, all aboveground vegetation within the 1 m2 squares was clipped close to the ground and stored in plastic Ziploc bags in coolers over ice and subsequently in refrigerators until processing. In the laboratory, wet and dry vegetation mass was determined, and vegetation was carefully separated into live and senesced tissues. Note that in these ecosystems, significant amounts of senesced standing tissues from the previous year are present along with current year green tissues. We then prepared the samples for Hg analysis in both bulk samples and in individual species.
In four of the eight sampling sites, quantitative belowground sampling was performed in July 2021, with two plots dominated by S. alterniflorus and the other two plots dominated by S. pumilus. Soil cores with diameter of 10 cm to a depth of 40 cm were taken and separated into depth increments of 0–20 and 20–40 cm. Belowground components were separated into the following components by washing onto a fine mesh with pore size of 0.25 mm: live roots and rhizomes identified by turgidity and color (e.g., hard and white tissues versus soft and gray/discolored); senesced roots, rhizomes, and soil detritus (not recognizable organic matter); and sediments and fine organic matter that passed through the fine mesh (only analyzed in two subsamples). This process was based on visual separation of tissues (Elsey-Quirk et al., 2011; Valiela et al., 1976). We observed live roots and rhizomes only in the top 20 cm of the soils with no recognizable live roots and rhizomes at 20–40 cm depth. All plant tissues were rinsed with tap water until the water was clean, then thoroughly rinsed three times with Milli-Q water, while a selected number of live aboveground tissues were analyzed, both washed and unwashed, for estimation of washable Hg (see Sect. 4.1). All samples were dried at 65 °C to reach a constant weight and were milled and homogenized using stainless steel coffee grinders (for vegetation samples) and a 8530 ShatterBox (for soil samples) prior to analyses. The coffee grinders and ShatterBox were rinsed with Milli-Q water and dried with Kimwipes between samples.
2.3 Hg concentration and stable isotope analysis of vegetation and soil samples
Total Hg concentrations in all components were measured using a tri-cell Milestone DMA-80 direct mercury analyzer (Milestone Inc., Monroe, Connecticut, USA) through thermal decomposition, catalytic reduction, amalgamation, desorption, and atomic absorption spectroscopy following EPA method 7473 (U.S. EPA, 1998). The system was re-calibrated based on daily performance checks using five-point calibration curves. Standard reference materials, including NIST 1515 Apple Leaves (43.2 µg kg−1) and Canadian National Research Council certified reference material MESS-4 (marine sediment, 91 µg kg−1), were used as continuous calibration verifications after every 10 samples. Percent recoveries of total Hg for certified reference materials averaged 99.9 ± 5.5 % (range of 89.6 % to 111.4 %) and all blanks were below detection limits (0.001 ng). All samples were analyzed in triplicate and results were accepted when coefficients of variation were less than 10 %.
Hg stable isotopes were measured on select samples including live aboveground biomass, live root, live rhizomes, and surface (0–22.5 cm) and deeper soils (97.5 cm). Samples were pre-concentrated with a Nippon direct Hg analyzer (Nippon Instruments) as described in Enrico et al. (2021). A HGX-200 cold vapor generator (Teledyne Cetac Technologies) was used to introduce sample Hg to a Thermo Neptune plus MC-ICP-MS at Harvard University. An Apex-Q nebulizer (Elemental Scientific) was used to nebulize a Thallium (Tl) solution and inject TI aerosols in the HGX-200. NIST3133 (primary standard) and RM8610 (previously UM-Almaden, secondary standard) were used as Hg isotopic standard solutions, and NIST997 (thallium isotopic standard solution) was used as the reference material to correct instrument mass bias. NIST 1515 Apple Leaves and Canadian National Research Council certified reference material MESS-4 were used to verify isotope analysis, and standard recoveries were in the acceptable range (from 82 % to 93 %). For analysis on Neptune, all trapped samples and standards were diluted with trapping solution to either 1 or 2 ng mL−1, the concentrations of which could be matched with NIST 3133 bracketing standard and the UM-Almaden concentrations. Quality control results for MESS-4 and RM8610 were similar to previously published findings (Table S4, Blum and Johnson, 2017; Enrico et al., 2021). Small delta (δ) annotation is used for mass-dependent fractionation (MDF), which is reported as per mil (‰) values relative to NIST-3133 based on Eq. (1):
where xxxHg is the mass of each Hg isotope between 199 and 204. Capital delta (Δ) annotation is used for mass-independent fractionation (MIF), describing fractionation away from the expected MDF based on Eq. (2):
where xxxHg denotes mass of each Hg isotope 199, 200, 201, and 204, and βxxx is the constant mass-dependent correction factor (0.252, 0.502, 0.752, and 1.492, respectively; Blum and Bergquist, 2007). To determine Hg sources, a ternary isotope mixing model was used to estimate fractions of Hg in aboveground biomass. Endmember Hg sources used included signatures of salt marsh plants roots measured in this study, published signatures of upland foliage samples as a proxy for atmospheric GEM uptake and its fractionation during plant uptake, and published data of precipitation Hg (see Supplement for details). We estimated uncertainty in the mixing model using the variance in precision estimates using Monte Carlo simulations (10 000 trials), with details of the simulation provided in Supplement (Table S5).
2.4 Data analysis
Data were checked for normality (Shapiro–Wilk test) and homogeneity of variance assumptions of statistical tests. The non-normalized data were subjected to a natural logarithmic transformation to ensure a normal distribution. Unpaired Student t tests were used to assess significant differences between groups (e.g., species), and statistical differences between non-washed and washed aboveground vegetation samples were performed using paired Student t tests. Linear regression analyses were performed to determine the rate of aboveground biomass Hg uptake over time. Hg mass and turnover rates were calculated by multiplication of Hg concentrations by corresponding biomass or biomass growth and other mass components at the level of sampling plots. All statistical tests were performed with STATA (Version 16.0, Statacorps, College Station, Texas), the mixing model and its uncertainty calculation was performed using Python (Python 3.12.0), and all regressions and statistical tests presented in text, tables, and figures were based on statistical differences with p values < 0.05. The variability presented in the text and figures is 1 standard deviation of the means.
3.1 Hg concentrations in aboveground and belowground biomass
Hg concentrations in aboveground tissues showed substantial seasonal variations and species-specific differences, with lowest concentrations in live tissues of S. alterniflorus and D. spicata, followed by S. pumilus, and highest concentrations in J. gerardii (Fig. 1a). Despite species differences in Hg concentrations, concentrations in bulk vegetation of communities dominated by S. alterniflorus versus S. pumilus (Fig. 1b) were not statistically different. This likely occurred because both communities are composed of multiple species. For example, S. alterniflorus communities also have a presence of S. pumilus plants, while S. pumilus communities include large numbers of D. spicata plants. Similarly, Hg concentrations of senesced S. pumilus and S. alterniflorus bulk samples were not statistically significantly different from each other (Fig. S1).
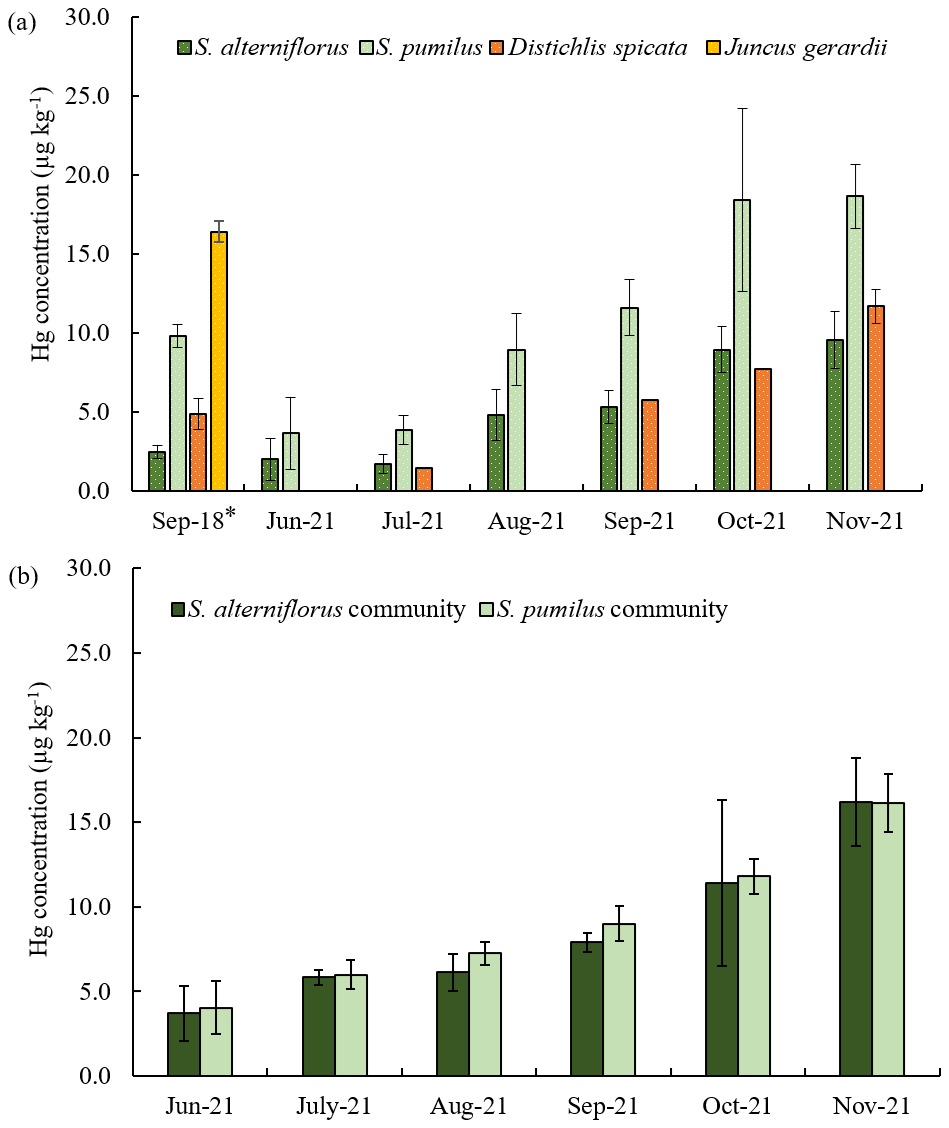
Figure 1Seasonal Hg concentrations of the four dominant salt marsh live plant species in 2018 and 2021 (a), and seasonal Hg concentrations of the S. alterniflorus and S. pumilus communities in 2021 (b). Different colors indicate different plant species. Standard errors indicate four replicates; *: standard errors indicate duplicates for a sample.
Hg concentrations in live aboveground biomass strongly increased throughout the growing season between June and November across all species. Figure 2 shows linear increases in Hg concentrations in live aboveground tissues in plots dominated by S. alterniflorus and S. pumilus over time (r2=0.84; p<0.01; n=50), with no significant difference in regressions between the two communities. Based on these linear regression slopes, we estimated daily uptake rates of Hg during the growing season of 0.08 ± 0.01 µg kg−1 d−1 for both Sporobolus communities. After senescence, Hg concentrations in senesced aboveground biomass measured in spring of the following year (April 2022) were not further enhanced compared to live biomass samples collected in fall (November 2021; p=0.19) (Figs. 2 and 4a), suggesting that no statistically significant Hg uptake (or loss) occurred in biomass after senescence.
Hg concentrations in live roots and rhizomes (upper 20 cm) were 2 to 3 times higher in S. pumilus plots (258.9 ± 70.3 and 46.6 ± 14.2 µg kg−1, respectively) compared to S. alterniflorus plots (84.5 ± 47.0 and 27.9 ± 1.1 µg kg−1 , respectively) (Fig. 3, Table S1). In belowground tissues, Hg concentrations were higher in senesced biomass, including dead roots, dead rhizomes, and detritus, compared to live tissues. Belowground tissues also showed higher Hg concentrations than separated soil mineral and humus fractions (although only measured in one S. pumilus sample) (Fig. 3, Table S1). Bulk soil Hg concentrations (i.e., composed of all fractions listed above) averaged 194.6 ± 28.3 µg kg−1 of S. alterniflorus community and 171.2 ± 72.1 µg kg−1 of S. pumilus community in the top 20 cm with no significant difference (p>0.05). Bulk soil Hg concentrations of the 20–40 cm soil in S. alterniflorus (279.1 ± 203.8 µg kg−1) were almost twice that of S. pumilus (159.1 ± 122.7 µg kg−1). Overall, Hg concentrations of live roots (171.7 ± 111.9 µg kg−1) were 11 times higher and live rhizomes (37.3 ± 13.6 µg kg−1) were double the concentrations of live aboveground biomass (16.2 ± 2.0 µg kg−1, Table S2).
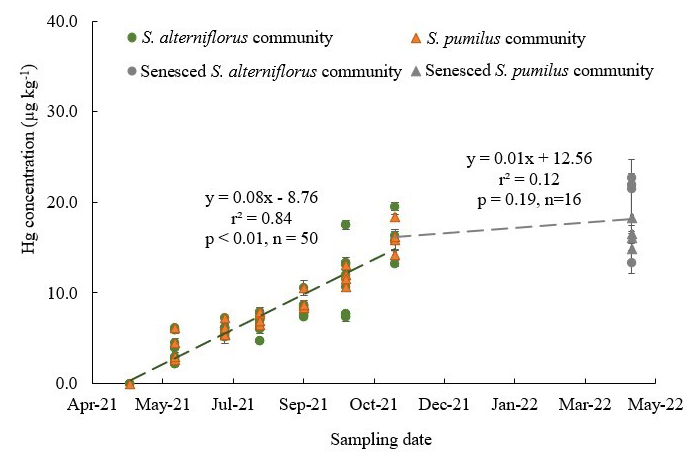
Figure 2Hg concentrations of live and senesced aboveground biomass of S. alterniflorus and S. pumilus communities corresponding with sampling dates in 2021. Green circles indicate live S. alterniflorus communities, orange triangles indicate live S. pumilus communities, gray circles indicate senesced S. alterniflorus communities, and gray triangles indicate senesced S. pumilus communities. Standard errors indicate four replicates. Note that data in April 2021 were extrapolated and set to zero based on phenological observations that showed no presence of live biomass at this time.
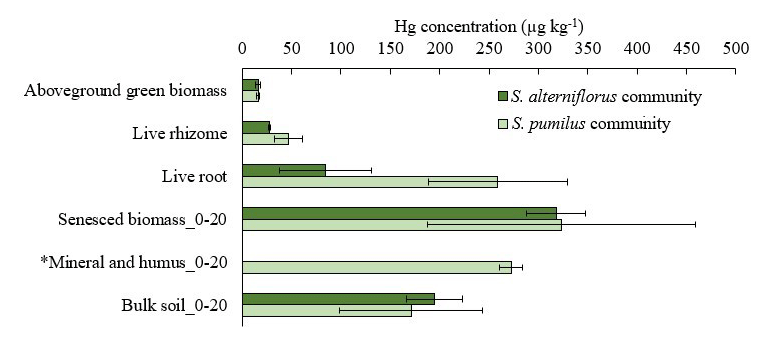
Figure 3Hg concentrations in live above- and belowground biomass of S. alterniflorus and S. pumilus communities, as well as Hg concentrations of minerals and humus and bulk soils up to depth of 20 cm covered by these two plant species. Dark green bars denote S. alterniflorus community; light green bars denote S. pumilus community. Standard errors indicate multiple sample analysis. *: Hg concentration in mineral and humus only shown for one site covered by S. pumilus, and standard errors are duplicates.
3.2 Hg pools sizes associated with aboveground and belowground biomass
Aboveground standing live biomass strongly increased from June through August, when it plateaued at a peak biomass in August (507 ± 208 g m−2) and September (498 ± 118 g m−2, a trend that was consistent among the investigated communities) (Fig. 4b). Hg mass contained in live aboveground biomass peaked later (in November) than standing biomass and showed an 8-fold and near-linear increase between June (0.7 ± 0.4 µg m−2) and November (5.7 ± 2.1 µ g m−2) (Fig. 4c). Peak Hg pools contained in aboveground biomass were 5.7 ± 2.1 µg m−2 for live tissue and 3.3 ± 1.7 µg m−2 for senesced tissue, for a total combined standing aboveground biomass Hg pool of 9.0 ± 3.3 µg m−2 in November (Figs. 4c and 5). This number represents our best estimate of total annual Hg assimilation by aboveground vegetation through the year. Standing aboveground biomass (live and senescent) in the spring of the following year (April 2022, 357 ± 148 g m−2) was 39 % lower than total aboveground biomass in November of 2021 (583 ± 208 g m−2) (Fig. 4b), and standing Hg pools were 32 % lower in the subsequent spring (6.1 ± 1.9 µg m−2) compared to peak fall levels (9.0 ± 3.3 µg m−2) (Fig. 4c), showing substantial losses of standing aboveground biomass and associated Hg pools over winter.
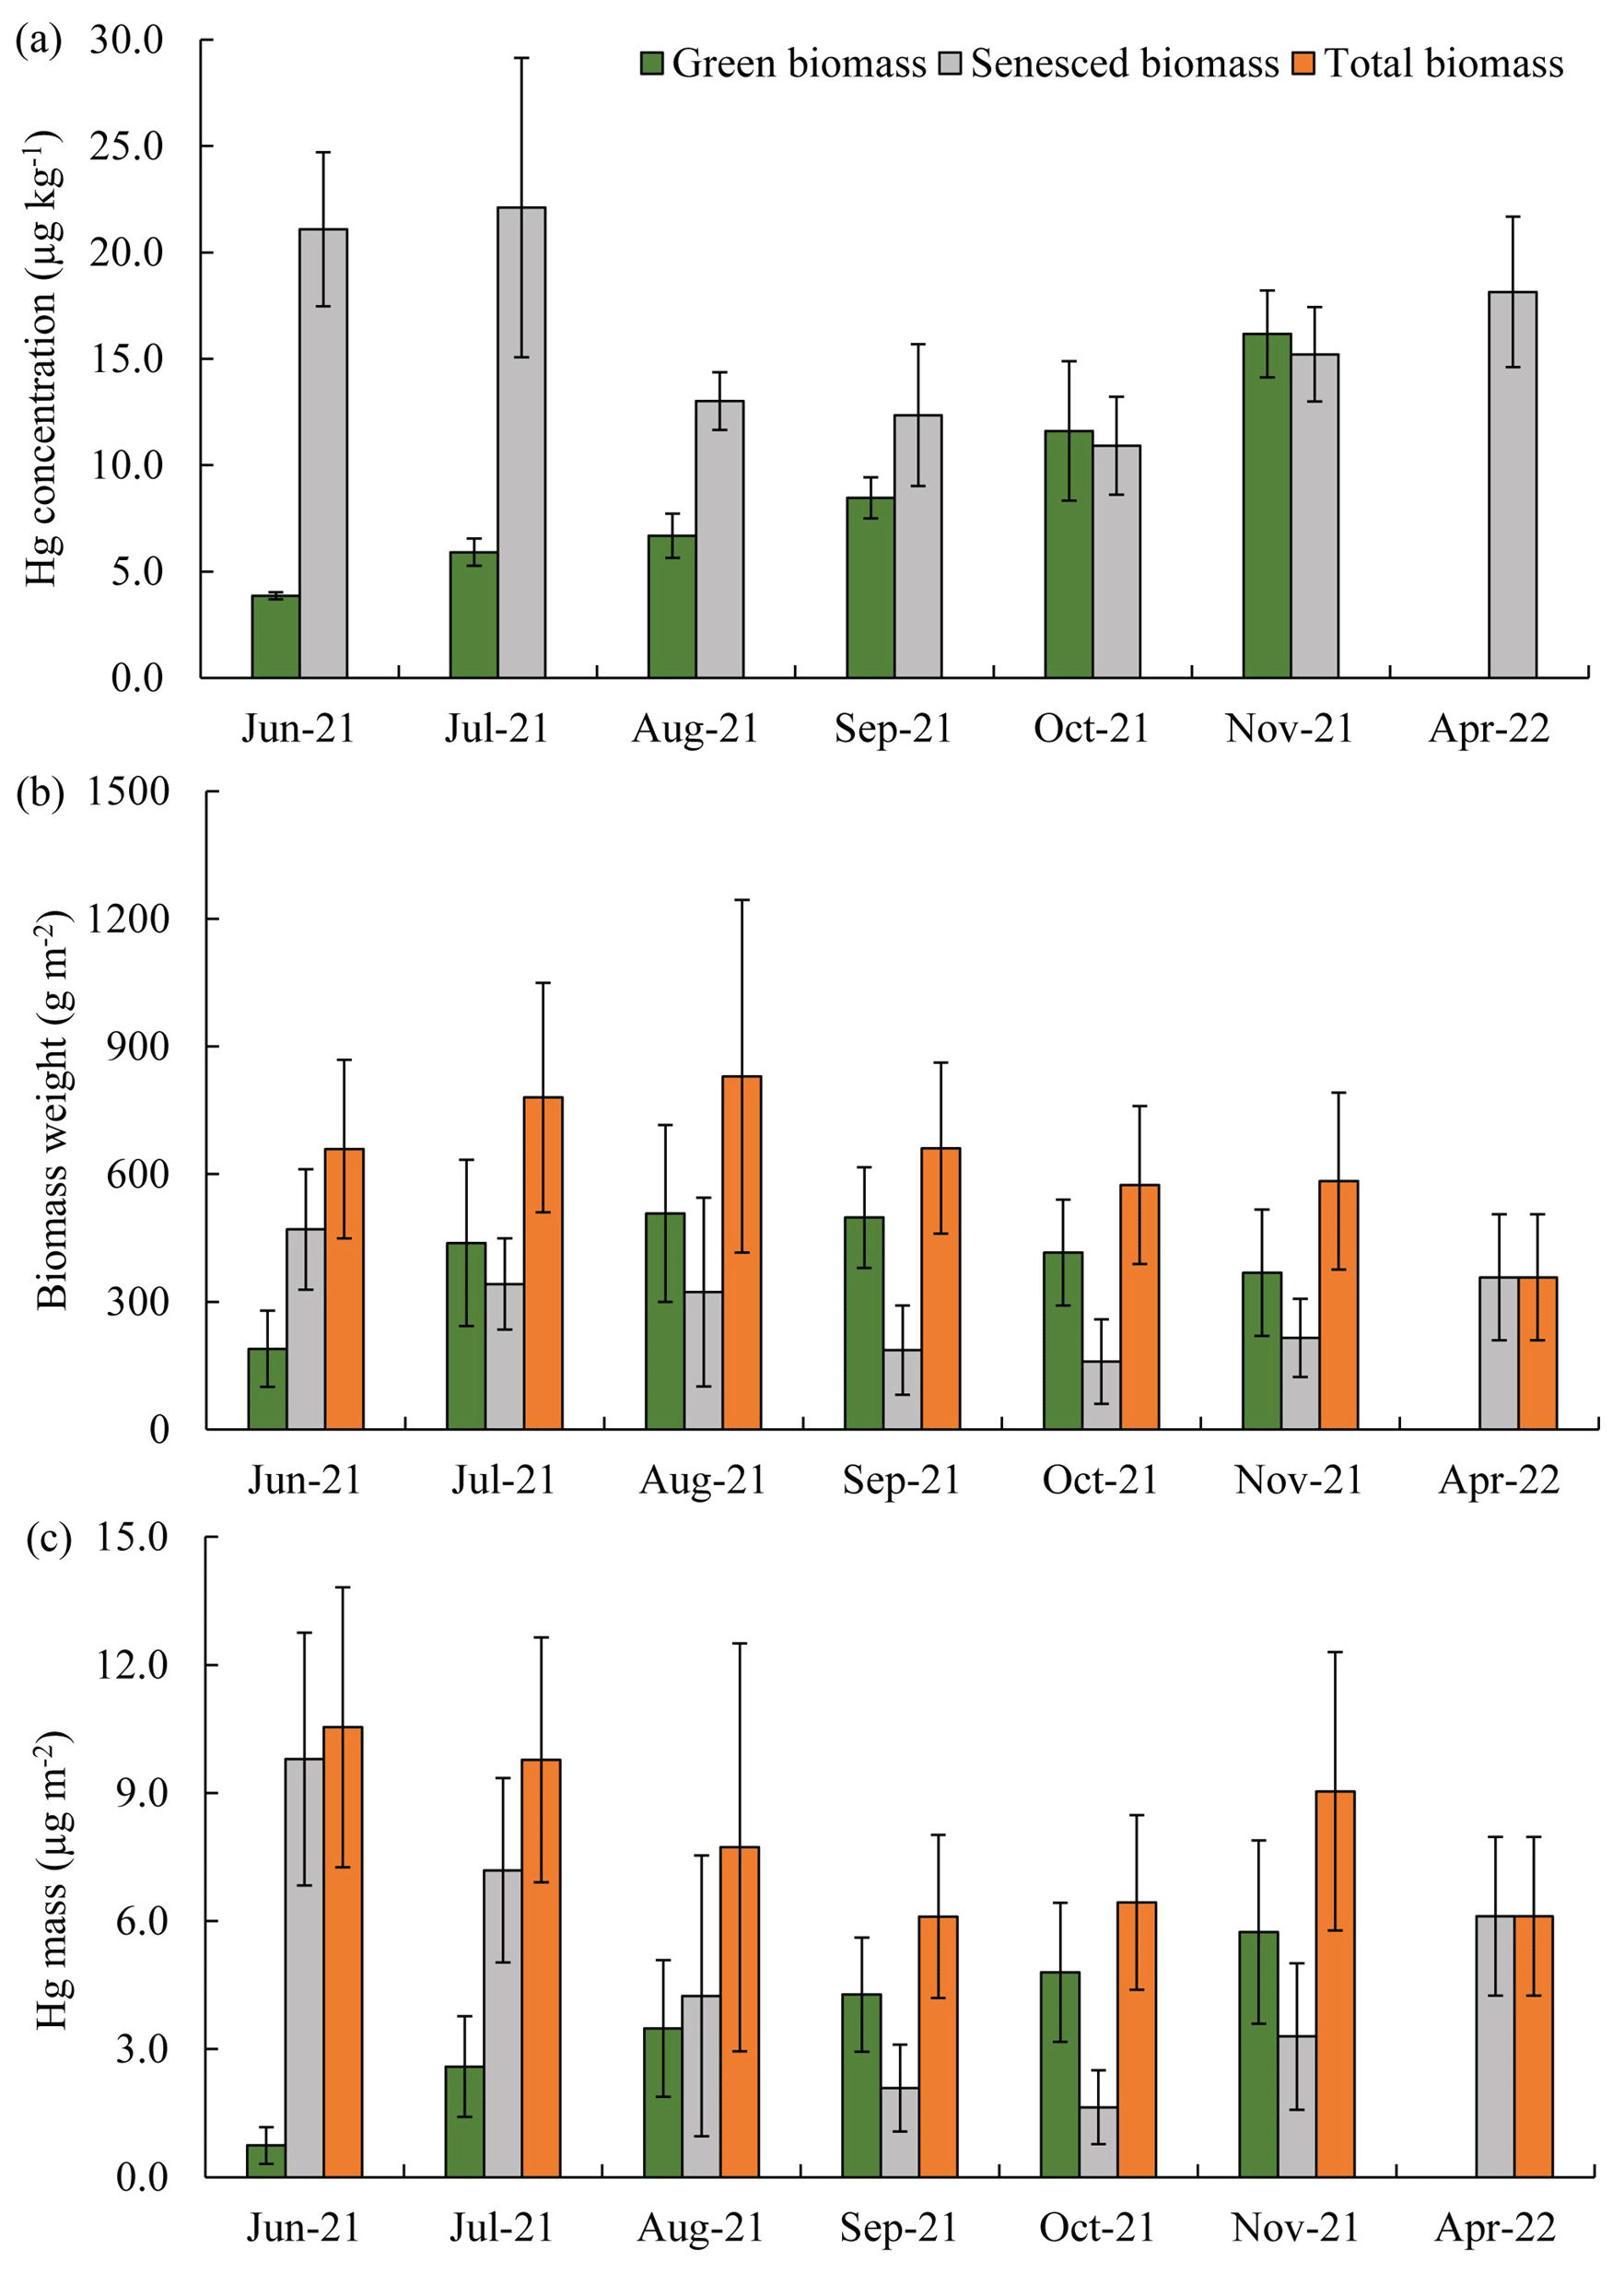
Figure 4Seasonal patterns of Hg concentrations (a), biomass dry weight (b), and Hg mass (c) in live aboveground and senesced biomass from June 2021 to April 2022. The green columns represent live biomass, gray columns represent senesced biomass, and orange columns represent total biomass weight and Hg mass of combined live and senesced biomass. Standard errors indicate four replicates. *: no live biomass was visible in April 2022 so that senesced biomass equals total biomass.
Live root biomass in surface soils (top 20 cm) averaged 361 ± 114 g m−2 and live rhizome biomass were approximately twice as large (792 ± 231 g m−2), for a combined live belowground biomass of 1,153 ± 321 g m−2 (Table S2). Belowground Hg pools associated with these live tissues averaged 70.0 ± 63.7 µg m−2 for roots, 38.1 ± 22.4 µg m−2 for rhizomes, and 108.1 ± 83.4 µg m−2 for the combined live belowground tissue, accounting for less than 0.5 % of the total bulk soil Hg pool (Fig. 5a, b, Table S2). We observed a much larger Hg pool associated with senesced biomass (roots, rhizomes, and detritus) averaging 4116 ± 1141 µg m−2, accounting for 16.1 % of the total bulk soil Hg pool. We estimated a total soil Hg pool in the top 40 cm using measured bulk densities (range of 0.22 and 0.37 g cm−3) exceeding 25 000 µg m−2, with most of this Hg associated with fine soil mineral and humus fraction (83.5 %), while much smaller pools were contained in live and senesced plant tissues as mentioned above.
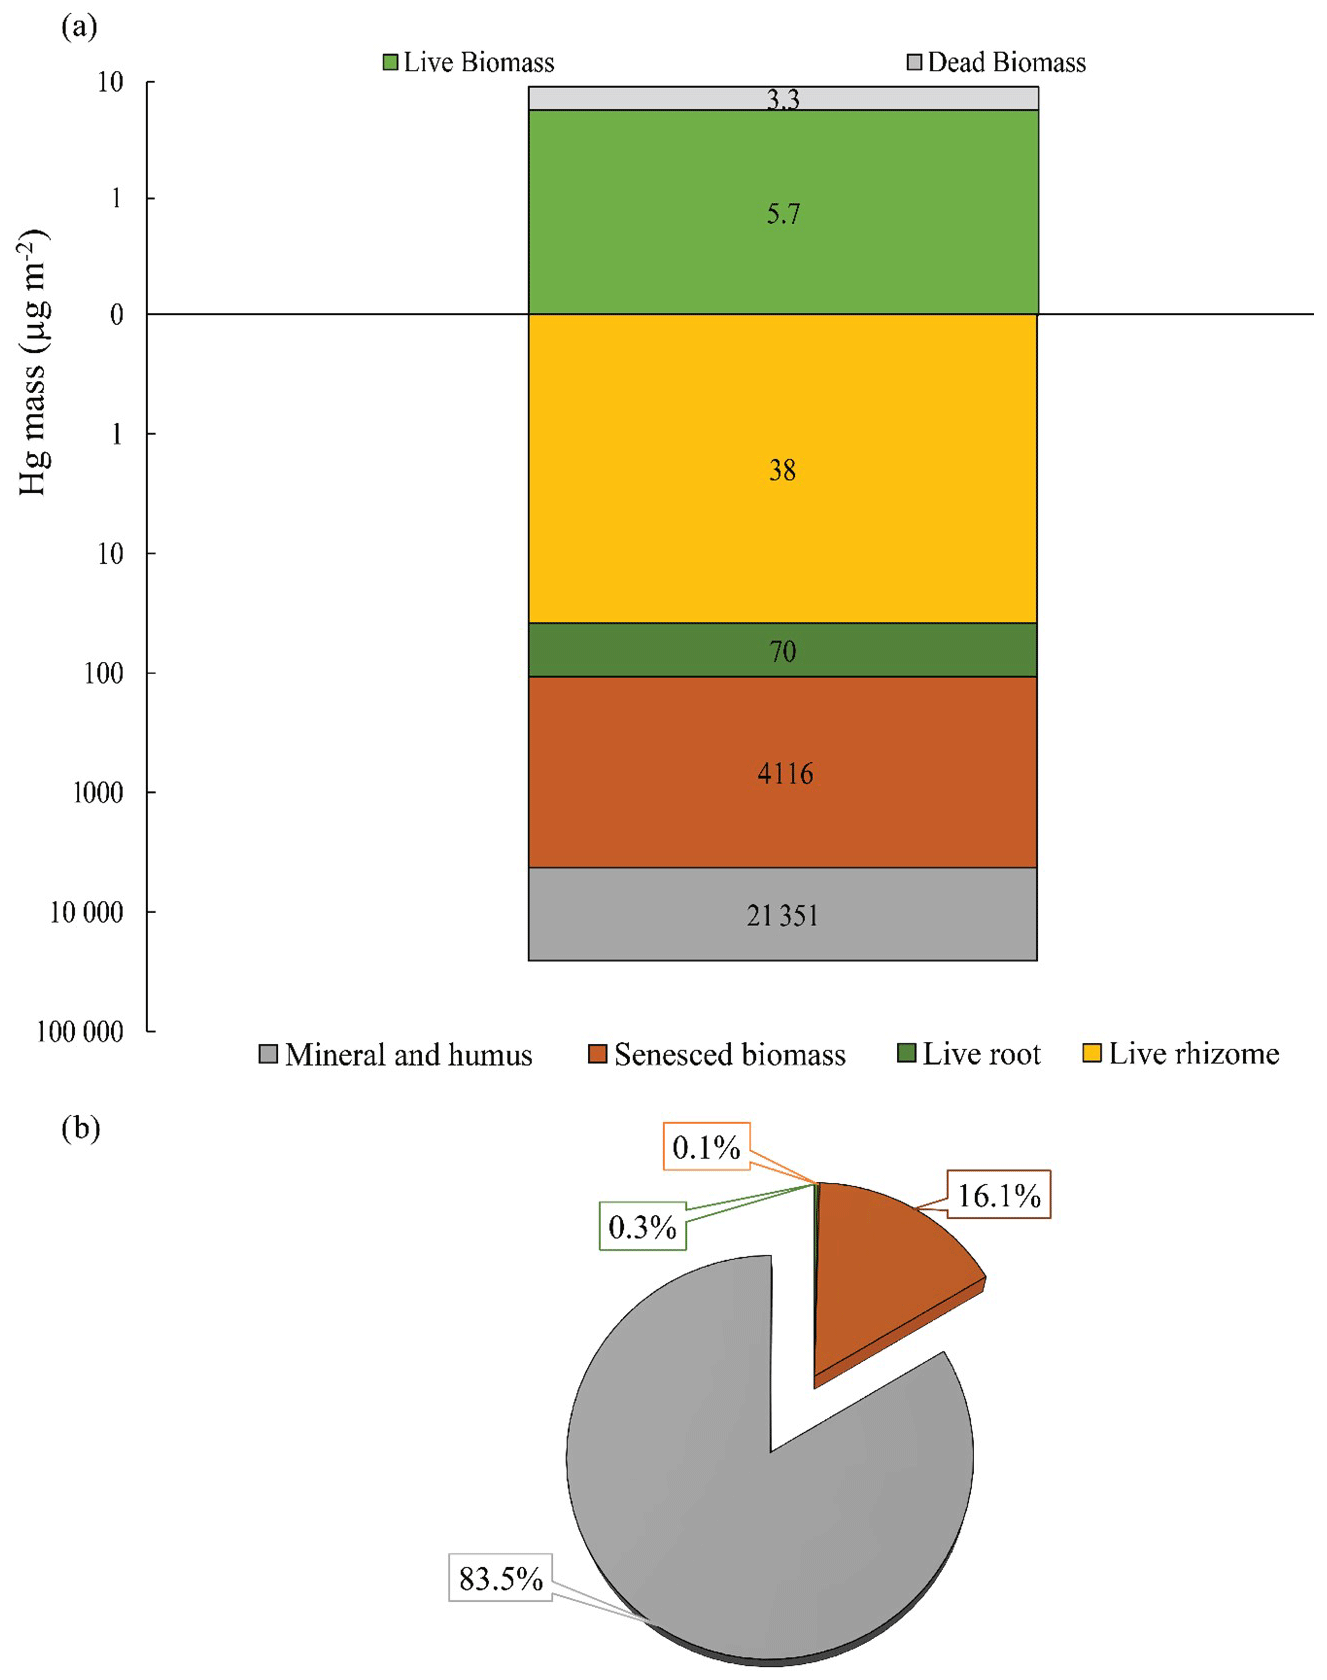
Figure 5Hg mass of above- and belowground biomass, including live and senesced biomass, and mineral and humus fractions at a soil depth of 40 cm (a). Percentages of Hg mass contribution from belowground sections to the Hg soil pool of a soil depth of 40 cm (b). Different colors indicate different sections of the marsh.
3.3 Hg stable isotope signatures for determining Hg sources
Live aboveground biomass showed negative mass-dependent fractionation (MDF) values for δ202Hg between −1.61 ‰ and −1.07 ‰, and mass-independent (MIF) values were consistently positive with Δ199Hg between 0.20 ‰ and 0.43 ‰ and Δ200Hg values between 0.04 ‰ and 0.11 ‰ (Fig. 6, Tables S3 and S6). These aboveground isotopic Hg signatures of salt marsh vegetation fell outside of the range commonly reported in foliar samples of terrestrial vegetation, both regarding mass-dependent and mass-independent signatures. Specifically, terrestrial vegetation Hg signatures are substantially more negative in δ202Hg values (ranging from −3.06 ‰ to −2.37 ‰ [inter-quartile range, IQR, n=120)] and both Δ199Hg and Δ200Hg values in terrestrial vegetation generally show negative values (Δ199Hg: −0.42 ‰ to −0.27 ‰ IQR, Δ200Hg: −0.05 ‰ to 0.01 ‰, IQR) (Fig. 6, Table S6) (review by Zhou et al., 2021).
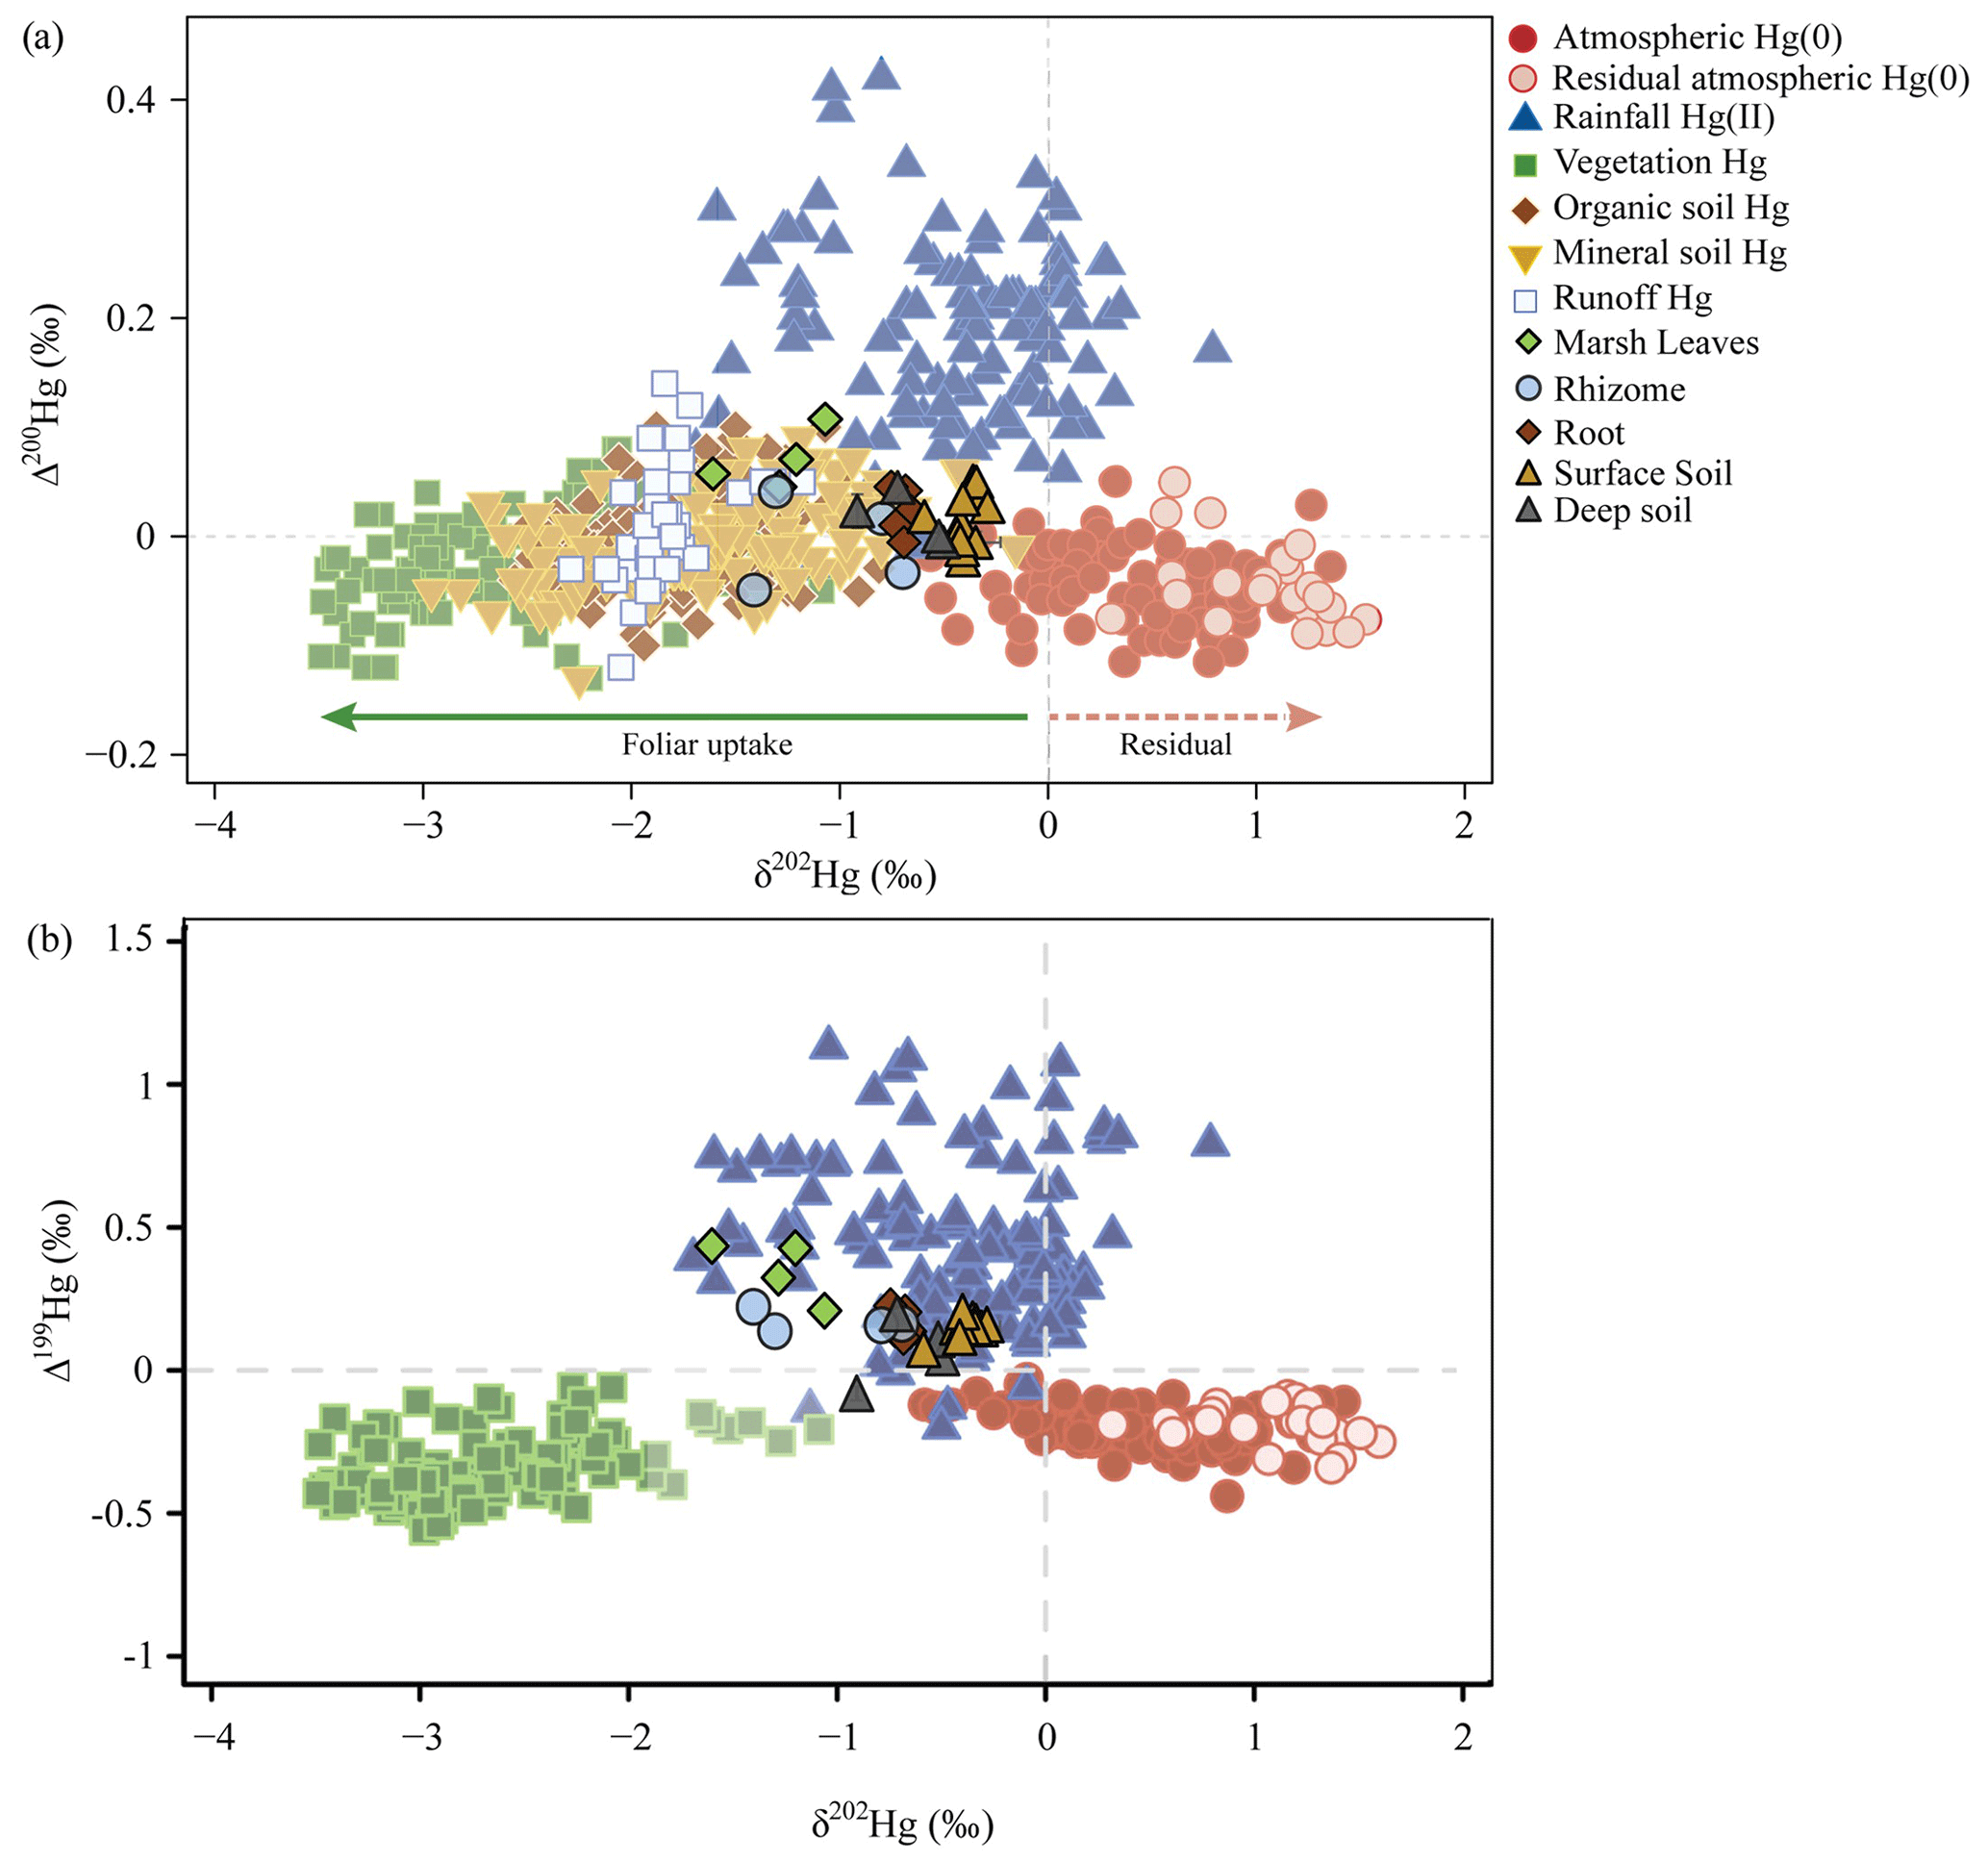
Figure 6Hg isotopes in salt marsh plants, soils, and foliage (a) of Δ200Hg and δ202Hg and (b) of Δ199Hg and δ202Hg. Composition of Hg sources in marsh vegetation and soils (surface and deep soil layers), all previously published and currently available isotope data of sources of Hg in vegetation and in terrestrial sinks, and atmospheric Hg(0) and Hg(II) sources (Zhou et al., 2021) plotted as (a) even-mass-independent (Δ200Hg) versus mass-dependent (δ202Hg) isotopes and (b) odd-mass-independent (Δ199Hg) versus mass-dependent (δ202Hg) isotopes.
Stable Hg isotope signatures of salt marsh plant roots were different from aboveground biomass, with less negative values for δ202Hg (−0.75 ‰ and −0.66 ‰), less positive values for Δ199Hg (0.11 ‰ and 0.22 ‰), and close to zero values (instead of positive values) for Δ200Hg (−0.01 ‰ and 0.04 ‰) (Fig. 6, Tables S3 and S6). The Hg isotope signatures of roots closely overlapped with signatures in surface marsh soils and deeper marsh soils (δ202Hg: −0.92 ‰ to −0.29 ‰, Δ199Hg: −0.09 ‰ to 0.20 ‰, and Δ200Hg: −0.02 ‰ to 0.05 ‰, Tables S3 and S6). Similar to aboveground tissues, salt marsh soil isotopic Hg signatures were largely outside the ranges reported for upland soils, particularly for δ202Hg values that are much more negative in upland soils (δ202Hg generally between −0.5 ‰ and −2.9 ‰; review by Zhou et al., 2021). Hg isotope signatures of salt marsh rhizomes were highly variable and in-between the values observed in foliage and soils. Specifically, rhizomes showed δ202Hg values between −1.41 ‰ and −0.70 ‰, Δ199Hg values between 0.13 ‰ and 0.22 ‰, and Δ200Hg values between −0.05 ‰ and 0.04 ‰ (Fig. 6, Tables S3 and S6).
4.1 Salt marsh vegetation and soil Hg concentrations
Strong seasonal Hg concentration increases in salt marsh aboveground tissues were consistent with patterns reported from upland ecosystems, such as in forest foliage (Wohlgemuth et al., 2020). In upland systems, foliar Hg increases are attributed in large part to atmospheric GEM uptake, which is taken up during the growing season by stomatal and non-stomatal (i.e., cuticular) leaf uptake (review by Zhou et al., 2021). Hg uptake is controlled by leaf physiological processes and related to photosynthetic capacity, leaf nitrogen concentrations, leaf mass area, and stomatal densities and conductance (Wohlgemuth et al., 2022). In support of a physiologically controlled Hg uptake process in salt marsh plants, we observed that Hg concentrations in senesced biomass in April of 2022 were not significantly enhanced compared to live biomass of the previous November (2021) (Fig. 2), indicating that no significant Hg assimilation occurred during wintertime in senesced biomass. However, some increases in Hg concentrations occurred through November even after peak biomass was reached in August and September, which we attribute to continued active plant physiology through late season, as active photosynthesis was measured at least through October at this site (Forbrich et al., 2018; no data are available for November). In contrast to upland plant foliage, however, stable Hg isotope signatures of marsh aboveground biomass show distinctly different Hg source profiles, indicating that Hg uptake was not dominated by atmospheric GEM uptake (see below).
Estimated daily Hg accumulation rates in Sporobolus-dominated aboveground biomass (0.08 µg kg−1 d−1, Fig. 2) were at the lower range of foliar accumulation rates reported in forest foliage (conifer needle: median of 0.07 µg kg−1 d−1, deciduous leaf: median of 0.23 µg kg−1 d−1; Wohlgemuth et al., 2022). This is consistent with the notion that low-statured grassland plants generally exhibit lower Hg concentrations (5 µg kg−1 [1–31 µg kg−1]) than trees (e.g., forest foliage (20 µg kg−1 [2–62 µg kg−1]) (review by Zhou et al., 2021), although it may also be due to different source origins of Hg (Sect. 4.2.1 below). Both dominant marsh species in this study are also C4 plants, which previous work shows have lower Hg concentrations compared to C3 species (e.g., 23 ± 9 µg kg−1 versus 53 ± 12 µg kg−1, Canário et al., 2017). In a laboratory study with upland plants, a suggested reason for this was catalase activity, which is related to leaf uptake of Hg vapor and is about 4 times lower in C4 plants than C3 plants (Du and Fang, 1983).
Highest Hg concentrations in S. alterniflorus and S. pumilus were observed in fall (11.7 and 24.0 µg kg−1, respectively). Hg concentrations fell within concentration ranges reported from other uncontaminated marsh halophytes (Table S8) but were much lower than those from contaminated marshes (up to 90 µg kg−1).
In contrast to upland plants, salt marsh plants (including both Sporobolus species) have salt glands which are used for selective and active excretion of sea salt (Kirschner and Zinnert, 2020; Maricle et al., 2009). Salt glands have been linked to excretion of metals (Weis and Weis, 2004), and previous studies reported correlations between leaf surface Hg and sodium (Na) release in S. alterniflorus, suggesting active Hg excretion by salt glands (Weis and Weis, 2004; Windham et al., 2001). Windham et al. (2001) proposed that in the Hackensack Meadowlands, a polluted salt marsh ecosystem, seasonal declines in Hg concentrations in S. alterniflorus leaves between May (90 µ g kg−1) and July (30 µg kg−1) were driven by strong leaf excretion of Hg. By washing leaves of a number of samples, we found that washing removed about 6 % of total leaf Hg in S. alterniflorus and 16 % in S. pumilus, respectively (Table S7, note that we use the average wash-off fraction of 11 % to estimate throughfall deposition in the mass balance estimation below). The relatively small loss of Hg associated with washing showed that most leaf Hg was structural and likely internal Hg, which along with observed seasonal Hg concentration increases does not support seasonal Hg losses nor seasonal concentration declines attributed to salt excretion by Windham et al. (2001).
Hg concentrations in live roots and rhizomes were much higher (11 and 2 times, respectively) than live aboveground biomass concentrations. This is consistent with previously reported data that reported high root Hg concentrations in salt marshes (Anjum et al., 2012; Cabrita et al., 2019; Canário et al., 2017; Garcia-Ordiales et al., 2020; Weis and Weis, 2004; Windham et al., 2003). We measured higher Hg concentrations in live roots of S. pumilus (258.9 ± 70.3 µg kg−1) than in S. alterniflorus (84.5 ± 47.0 µg kg−1) (Fig. 3, Table S1). A possible reason for this is the finer roots in S. pumilus (personal observation), and hence higher surface-to-volume ratios, which may facilitate soil Hg uptake. In upland ecosystems, fine root Hg concentrations were reported to be higher than in coarse roots as well (J. J. Wang et al., 2012; X. Wang et al., 2020). High root and rhizome Hg concentrations compared to aboveground tissues in marsh plants stand in contrast to upland studies, which generally report highest concentrations in foliage (20 µg kg kg−1 [2–62 µg kg−1]) and much lower concentrations in roots (7 µg kg−1 [2–70 µg kg−1]) (Zhou et al., 2021). An exception to this are grassland systems, which also show higher root Hg concentrations than in foliage, although the difference was much smaller (e.g., roots: 41 ± 31 µg kg−1; leaves: 20 ± 10 µg kg−1; Zhou and Obrist, 2021). Our data also showed generally much lower root Hg concentrations in this marsh compared to contaminated sites (Canário et al., 2017; Anjum et al., 2012; Garcia-Ordiales et al., 2020) (Wang et al., 2021) (Table S8). Overall, published studies suggest a large range of Hg concentrations in belowground salt marsh biomass, which likely is due to different soil Hg concentrations as dominant Hg sources to roots (see Sect. 4.2.1 below). The higher concentrations of roots and rhizomes in belowground tissues compared to aboveground biomass also suggest limited translocation between belowground and aboveground tissues (Cavallini et al., 1999; Clemens and Ma, 2016; Graydon et al., 2009; Wang et al., 2012).
4.2 Stable Hg isotope signatures and possible origins of Hg in salt marsh vegetation and soil
4.2.1 Salt marsh vegetation
One of the largest mass-dependent fractional (MDF) processes in the environmental systems is due to preferential uptake of light atmospheric GEM isotopes by vegetation foliage that leads to large negative δ202Hg signatures (generally below −2 ‰), while mass-independent signatures remain similar to that of atmospheric GEM (Demers et al., 2013; Enrico et al., 2016; Yu et al., 2016). However, a recent study also reported inconsistent MIF between foliage and the atmosphere (Wang et al., 2022b). In terrestrial ecosystems, studies have shown that the vegetation uptake of atmospheric GEM and subsequent litterfall, throughfall, and plant senescence serves as the primary source of Hg loading (Demers et al., 2013; Jiskra et al., 2015; Louis et al., 2001; Obrist et al., 2017; Wang et al., 2016; Zheng et al., 2016; Zhou et al., 2021). Aboveground tissues of salt marsh plants show a distinctly different signature than upland foliage: specifically, MDF values were much less negative and values of odd-MIF (Δ199Hg) and even-MIF (Δ200Hg) were more positive compared to upland foliage (Fig. 6, Table S6).
Hg signatures of salt marsh aboveground tissue were close to signatures of salt marsh soils, yet with slightly more negative δ202Hg values and more positive Δ199Hg and Δ200Hg values (Table S6). We used a ternary mixing model to identify potential Hg sources and further quantify their contributions for salt marsh plant leaves based on MDF (δ202Hg) and even-MIF (Δ200Hg) (Demers et al., 2013; Jiskra et al., 2017; Obrist et al., 2017; Jiskra et al., 2021). In our model, the dominant three endmember Hg sources include (1) direct uptake from marsh plant roots as represented by measured stable isotopes of roots; (2) atmospheric GEM uptake with typical upland MDF reported in the literature, implemented using published data of upland foliage isotope data; and (3) precipitation Hg(II) deposition obtained from published literature (see Supplement for details). Our best estimate shows that the Hg source in salt marsh vegetation consists of a mixture of about each from foliar uptake of atmospheric GEM uptake (about 32 %), root uptake (about 35 %), and precipitation deposition (about 33 %). Note that these estimates assume that marsh foliage shows the same isotopic GEM fractionation as upland foliage and further assumes that translocation of root Hg has the same isotope patterns as measured in root biomass. The percentage estimate derived from the tertiary mixing model shows substantial range of uncertainties (Fig. S2) due to a low number of samples and errors associated with analytical isotope determination. However, two different Monte Carlo methods used to estimate errors both suggest similar source contributions (i.e., about from each of the three endmembers).
Most notably, the biggest difference in marsh plants compared to upland plants is much less negative δ202Hg values, suggesting lower contributions from atmospheric GEM uptake, which normally induces strong negative MDF in upland plants. Still, the presence of atmospheric GEM uptake leads to δ202Hg values in aboveground tissues that are more negative than in roots and soils. Precipitation, which largely consists of oxidized Hg, shows a typical positive anomaly in Δ200Hg linked to upper atmosphere GEM oxidation processes (Enrico et al., 2016; Zhou et al., 2021; Jiskra et al., 2021). Our results also suggest a more important role of root Hg transport to aboveground tissues in salt marsh vegetation (about ) compared to upland ecosystems, which normally show root origins of less than 5 % (review by Zhou et al., 2021). Previous salt marsh studies suggested inconsistent Hg source patterns: for example, an Hg isotope tracer study suggested minor root-to-leaf transport with soils accounting for a small percentage of Hg in marsh plants (i.e., 2.2 %–2.7 % from Cabrita et al., 2019), while a study based on bioaccumulation factors suggested a wide and inconstant range of soil Hg contribution to leaves (from 1.7 %–9.6 % to as high as 46 %; Castro et al., 2009).
Roots of salt marsh plants show a Hg isotope signature that almost perfectly aligns with the signatures observed in soils, suggesting a dominant soil source. In terrestrial plants, Hg assimilated in belowground biomass also is considered to largely be of soil origin (Obrist et al., 2018; Millhollen et al., 2006; Zhou et al., 2021). This also has been proposed in aquatic plants (e.g., mangroves, sawgrass), where root Hg largely derives from surrounding soils (Huang et al., 2020; Mao et al., 2013; Yin et al., 2013). Finally, the few measured rhizome Hg isotope signatures indicate a mix of aboveground and belowground Hg sources, although rhizomes show a large variation in isotope signatures with some samples being closer to aboveground tissue and others being closer to root signatures. This observation would be consistent with the role of rhizomes as storage organs with a lifetime of over 1 year, where carbohydrates and nutrients are re-mobilized between rhizomes and above- and belowground organs based on plant allocation needs.
Table 1Hg mass balance of the study salt marsh ecosystem.
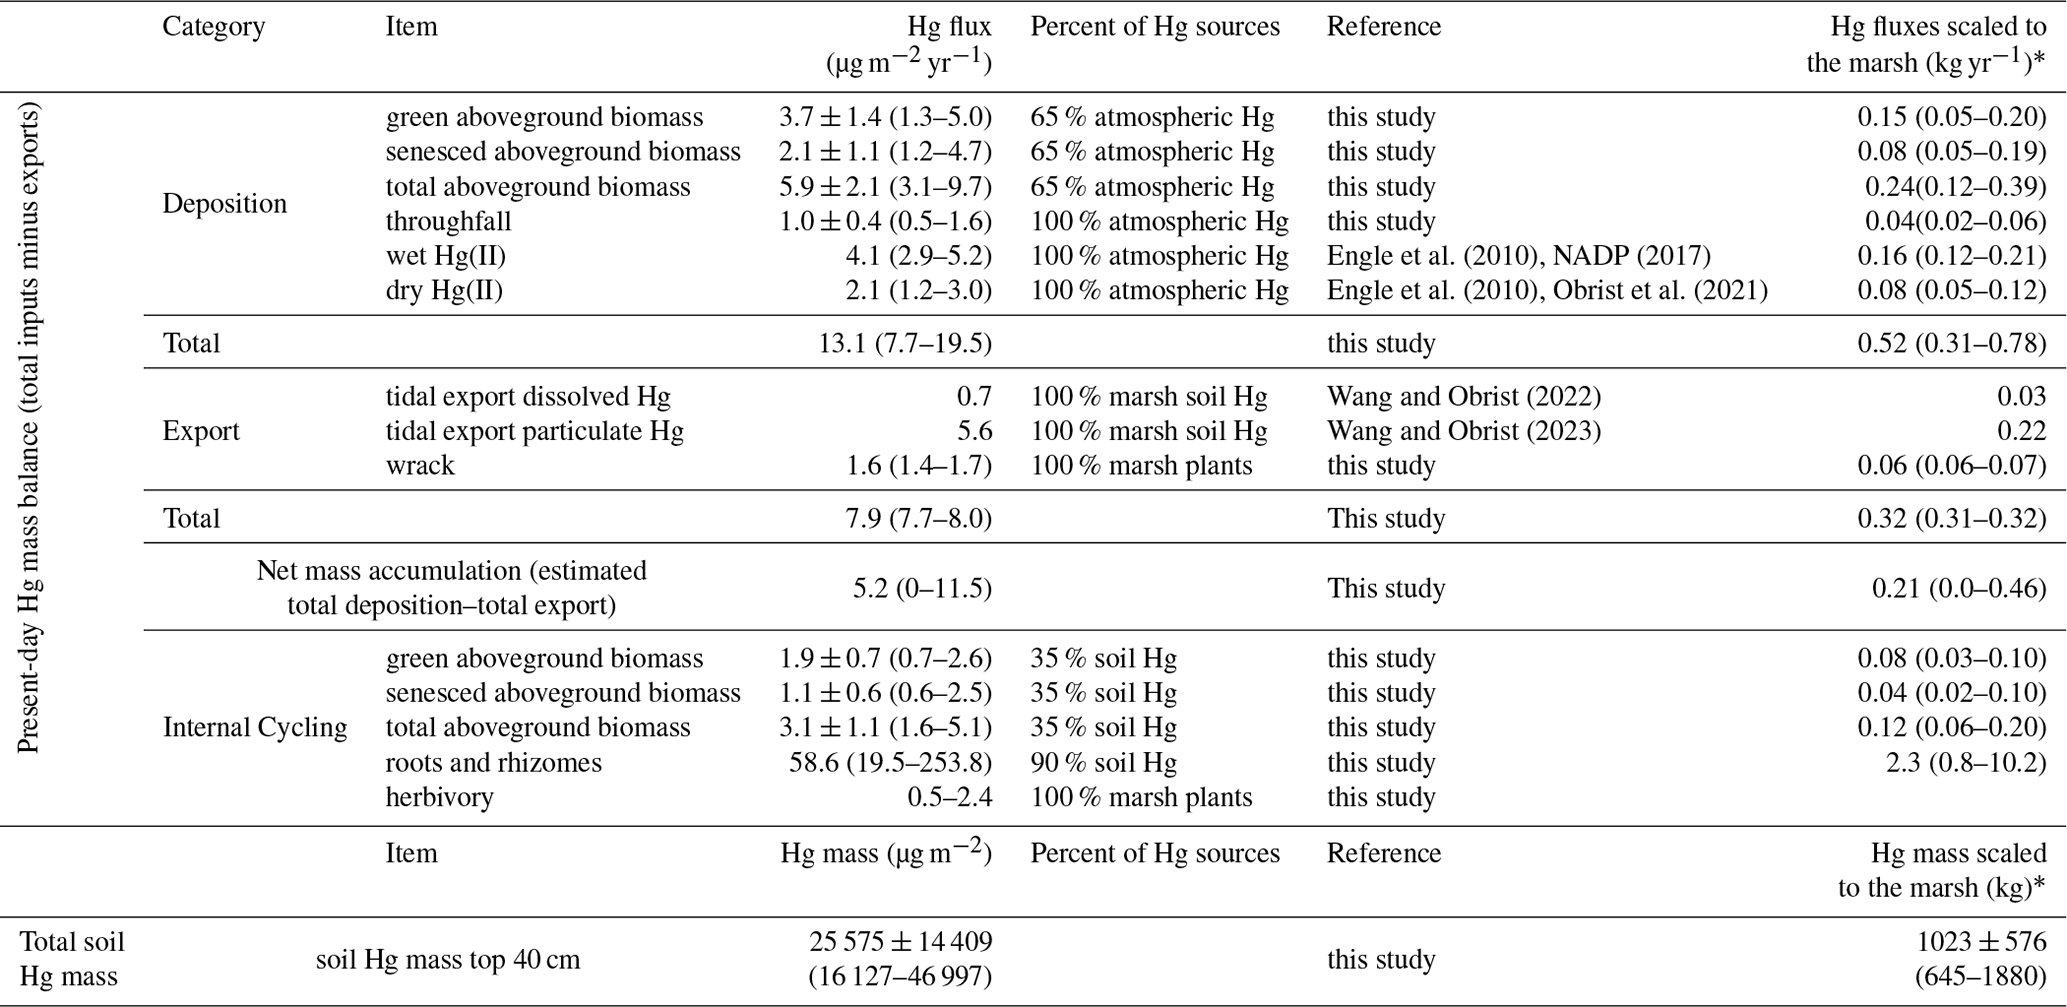
*: salt marsh area (vegetated): 40 km2.
4.2.2 Salt marsh soil
The salt marsh soil isotope signature fell largely outside the range of soil Hg signatures reported from upland studies. In terrestrial environments, the strong MDF during foliar GEM uptake imprints a similar and typical terrestrial fingerprint on soil Hg, resulting in soil signatures with strong negative δ202Hg and Δ200Hg values similar to that of vegetation. Mixing models suggest upland soil Hg sources are dominated by atmospheric GEM (accounting for 53 % to 92 % of the source), which previously originated from plant Hg uptake and subsequent deposition (e.g., plant senescence) of overlying vegetation (Jiskra et al., 2018; Obrist et al., 2018; Zhou et al., 2021; Zhou and Obrist, 2021). These upland soil Hg isotope signatures propagate in watershed runoff (Jiskra, et al., 2017; Woerndle et al., 2018). Soils of our salt marsh study notably lacked the strong δ202Hg depletion signal observed in uplands soils (e.g., δ202Hg of marsh soils between −0.92 ‰ and −0.29 ‰, versus −0.5 ‰ and −2.5 ‰ in other soils; review by Zhou et al., 2021). This further supports that sources of Hg in marsh vegetation, which ultimately deposits to soils, are distinctly different from that of upland ecosystems. The isotopic signature of soil samples in Fig. 6a also does not support that a simple two-way mixing of plant and precipitation Hg could explain salt marsh soils Hg signatures. Further terrestrial surface runoff, which generally shows typical terrestrial origin signatures (but was not measured in our study), also cannot explain marsh soil Hg isotope patterns.
Seawater regularly floods the salt marsh during spring tides and storms and provide sediments for salt marsh soils (Millette et al., 2010). Recently reported ocean water Hg isotopes by Jiskra et al. (2021) show a strong overlap with Hg isotope signatures in salt marsh soil, whereby both Δ200Hg and δ202Hg fall between the ranges reported for seawater and ocean sediments (Fig. S3). However, due to large variability in the data, we are unable to quantify potential source origins using a mixing model. However, the notion of potential ocean Hg sources would be consistent with a sediment mass balance study which showed that sediment loads in the Plum Island Sound estuary were dominated by imported ocean sediments (Hopkinson et al., 2018), with relatively minor import of sediments derived from the watershed. Finally, industrial and legacy contamination sources also may shape salt marsh soil Hg signatures. Generally, industrial Hg isotope signatures have been characterized by large ranges of negative δ202Hg values and near-zero to positive Δ199Hg and Δ200Hg values (Fig. S3, Table S6; see Supplement for details).
4.3 Hg mass balance and turnover fluxes associated with biomass dynamics
4.3.1 Aboveground
We here estimate a mass balance of Hg sources and sinks associated with aboveground vegetation dynamics and turnover and compare these with previously reported fluxes such as lateral tidal exchanges, published wet and gaseous oxidized Hg, and particulate Hg deposition. Hg inputs to this salt marsh include wet Hg deposition, which, based on interpolated data by the NADP program, is estimated at 5.2 µg m−2 yr−1 (National Atmospheric Deposition Program, Mercury Deposition Network, http://nadp.slh.wisc.edu/maplib/pdf/mdn/hg_Conc_2017.pdf, last access: 1 March 2023), while a lower estimate of 2.9 µg m−2 yr−1 has been measured at a nearby coastal site on Cape Cod, Massachusetts (Engle et al., 2010). Combining these two data sets, we estimate a mid-point wet deposition of 4.1 µg m−2 yr−1. Gaseous oxidized Hg (GOM) and particulate Hg (PHg) deposition in this area was estimated at 1.2 µg m−2 yr−1 based on measurements by Engle et al. (2010) and at 3.0 µg m−2 yr−1 at a deciduous forest (Harvard Forest) in Massachusetts (Obrist et al., 2021). Hence, a mid-point dry deposition of combined GOM and PHg is estimated at 2.1 µg m−2 yr−1 (Table 1, Fig. 7). Aboveground vegetation Hg dynamics yields a total turnover of 9.0 ± 3.3 µg m−2 yr−1 (combined live and senesced biomass at the end of the growing season), and isotope determination suggests that of this, about (representing an “external source” (5.9 ± 2.1 µg m−2 yr−1) derived from atmospheric GEM and precipitation uptake, while is from root uptake (3.1 ± 1.1 µg m−2 yr−1); this hence represents an internal plant–soil recycling within the ecosystem. Laboratory sample washing showed that in addition, on average about 11 % of foliar Hg concentrations was subject to wash-off. In the absence of field throughfall measurements, we used this fraction to estimate throughfall deposition of Hg of 1.0 ± 0.4 µg m−2 yr−1, based on aboveground vegetation Hg pools (noting that this estimate is very preliminary). Combined atmospheric Hg deposition attributable to aboveground vegetation hence is 6.9 µg m−2 yr−1 and is close to the combined wet, GOM, and PHg deposition of 6.2 µg m−2 yr−1. Combined atmospheric Hg sources in this system are estimated at 13.1 µg m−2 yr−1 (Table 1; range of 7.7 to 19.5 µg m−2 yr−1).
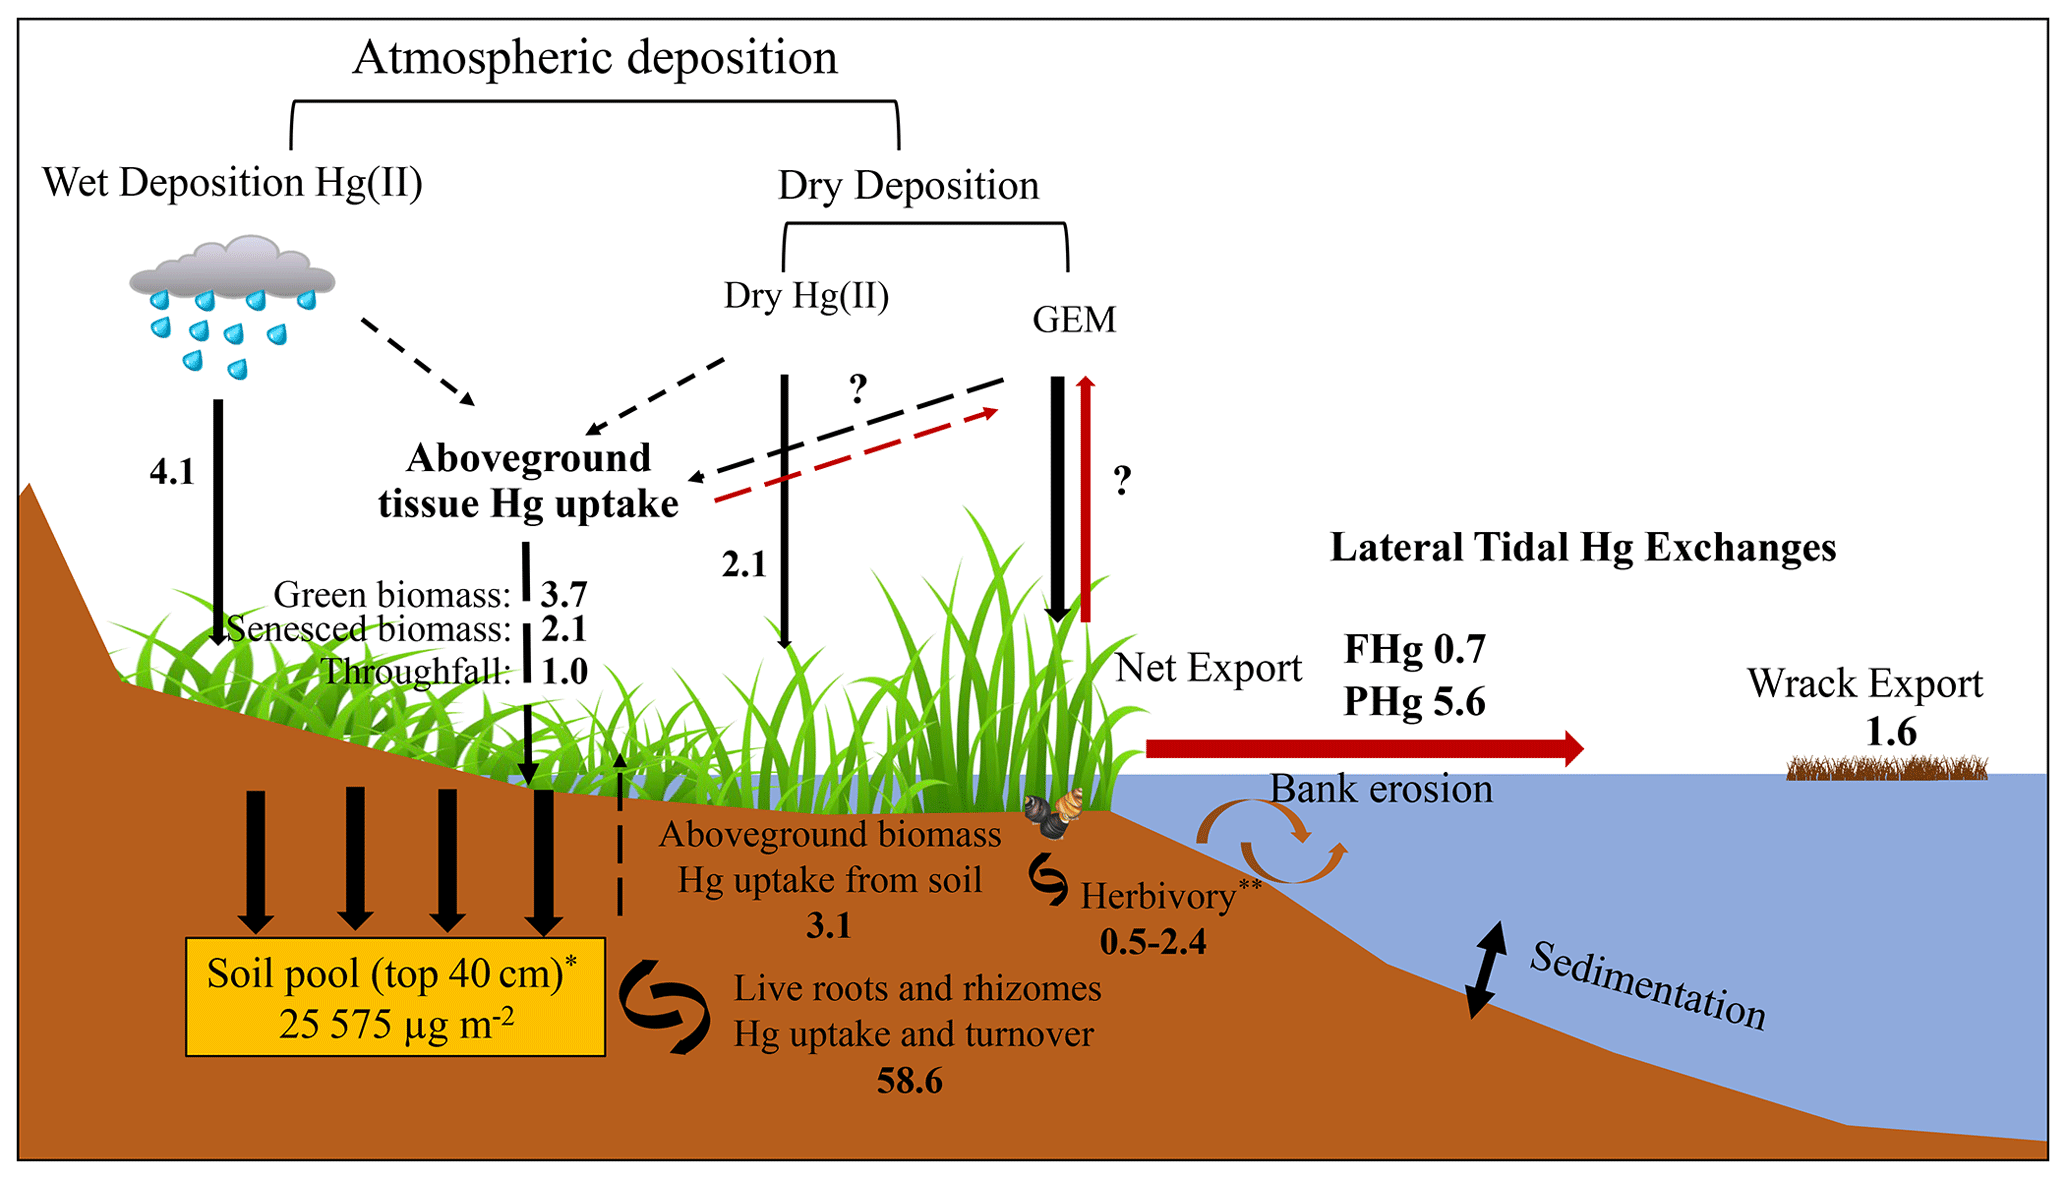
Figure 7Hg mass balance of the study salt marsh ecosystem. The values shown mostly represent the median Hg flux values with unit of µg m−2 yr−1, except for the soil pool (*), which represents an averaged value, and herbivory (), which indicates a range. The red arrows indicate the emission of Hg back to the atmosphere and its export out of the salt marsh. The dashed arrows represent Hg fluxes related to aboveground biomass.
Aboveground vegetation also results in lateral exchange of Hg between marsh and tidal water via wrack export, i.e., losses of plants and surface litter through tidal flushing. Although difficult to measure, wrack export in this area is composed primarily of S. alterniflorus plants (Hartman et al., 1983) and has been estimated to constitute 16 %–19 % (mid-point of 17.5 %) of accumulated biomass (Duarte, 2017; Duarte and Cebrián, 1996). Hence, we estimate that of the annual Hg uptake by aboveground biomass of 9.0 ± 3.3 µg m−2 yr−1, about 1.6 µg m−2 yr−1 (range of 1.4–1.7 µg Hg m−2 yr−1) may be subject to wrack export. Scaling to the whole salt marsh area (40 km2), the total wrack export from this marsh is estimated around 0.06 kg yr−1 (range of 0.06–0.07 kg yr−1). In a previous study, we quantified Hg exports from the salt marsh system via tidal exchanges of dissolved and particulate Hg (without plants), and estimated 0.7 µg m−2 yr−1 of dissolved Hg export and 5.6 µg m−2 yr−1 of particulate Hg export from the marsh to the tidal water (Wang and Obrist, 2022). Our estimated annual Hg export by wrack is higher than lateral export of dissolved Hg but much smaller than lateral export of particulate Hg. Duarte (2017) and Duarte and Cebrián (1996) estimated that about 27 % of NPP is subject to herbivory (e.g., by marsh periwinkle and mummichog), although another study estimated NPP loss due to herbivory at only 5 % (Mann, 1988). Hence, an estimated 5 % to 27 % of plant Hg pools, or 0.5–2.4 µg Hg m−2 yr−1, may be subject to herbivory. The largest fraction of NPP (57 % to 80 %), equivalent to 5.1–7.2 µg Hg m−2 yr−1) likely remains in the system and is subject to net accumulation and decomposition. Considering all these inputs and outputs, we estimate a net present-day Hg mass accumulation in this salt marsh ecosystem of 0–11.5 µg m−2 yr−1, with a mid-point of 5.2 µg m−2 yr−1, suggesting that this salt marsh currently represents a small net sink of environmental Hg. Absent in this estimate are gaseous exchange fluxes of GEM between soils/water surfaces and the atmosphere, which are currently being quantified using a tower-based measurement system (Edwards et al., 2005; Obrist et al., 2021).
4.3.2 Belowground
Many studies show that in salt marsh ecosystems, belowground productivity is generally equal to or greater than aboveground biomass production, and this particularly applies for northern marshes (Blum, 1993; Morris, 2007; Tobias and Neubauer, 2019; Windham, 2001). Roots of both dominant species can grow to lengths of 8 to 20 cm (Blum, 1993; Muench and Elsey-Quirk, 2019). S. alterniflorus normally has large and thick rhizomes (normally ranging from 2 to 4 mm in diameter) with aerenchyma tissues that transport oxygen to submerged belowground tissue for respiration, while S. pumilus has relatively dense and fine roots with limited aerenchyma tissue that cannot support aerobic respiration when completely flooded (Muench and Elsey-Quirk, 2019). We measured live root biomass (upper 40 cm) of 444 ± 87 g m−2 in S. pumilus and 278 ± 61 g m−2 in S. alterniflorus cores (Table S1), which is consistent with reported denser root biomass in S. pumilus compared to S. alterniflorus (Muench and Elsey-Quirk, 2019). Combined live roots and rhizome biomass averaged 1,153 ± 321 g m−2, and thereby exceeded peak standing aboveground biomass of 830 ± 415 g m−2 in August 2021.
Scaling up Hg pools using these belowground biomass data and measured Hg concentrations yields large belowground Hg pools. For example, the live belowground Hg pool (roots and rhizomes) is 108.1 ± 83.4 µg m−2, more than 10 times larger than peak standing aboveground Hg pools (9.0 ± 3.3 µg m−2) (Fig. 5a, Table S2). The Hg pool associated with senesced biomass (roots, rhizomes, and detritus) was over 1 order of magnitude larger (4116 ± 1141 µg m−2). Finally, the total pool of Hg in the top 40 cam of these marsh soils (all fractions) is estimated at > 25 000 µg m−2.
Turnover times of salt marsh macrophyte roots have been estimated at 0.6 yr−1 (0.2 to 1.9 yr−1 ) (Ouyang et al., 2017) and 0.5 yr−1 (Blum, 1993), although longer turnover times have been proposed for creek-side plants (2.6 yr−1, Blum, 1993). Assuming a belowground biomass turnover rate of 0.6 yr−1 (0.2 to 2.6 yr−1), estimated Hg mass turnover associated with belowground biomass (root and rhizome) would be 58.6 µg m−2 yr−1 (19.5 to 253.8 µg m−2 yr−1) (Table 1, Fig. 7). Hence, belowground Hg turnover via plant tissues exceeds that of aboveground tissue (9.0 ± 3.3 µg m−2 yr−1) by a factor of 5, although it is largely unclear what the implications of this turnover may be. Given that the source of belowground tissue Hg is largely from soil uptake, large Hg belowground turnover flux does not likely provide an external source and instead represents an internal recycling of Hg between soils and belowground tissues. This recycling of Hg may have various consequences, such as impacting mobility and bioavailability, phytostabilization by roots (Anjum et al., 2011), or remobilization of Hg associated with root decomposition.
The estimated small net sink of environmental Hg in the above Hg mass balance is difficult to reconcile with the presence of very large soil Hg pools exceeding > 25 000 µg m−2. It also is not consistent with the notion of this marsh as a hotspot of Hg pollution as reported from high blood Hg levels in predatory birds (Evers et al., 2007; Lane et al., 2020). It is possible that the current sink strength of Hg in this marsh is only a current snapshot in time and that soil Hg in this marsh Hg largely derives from historic legacy sources. Such potential sources may include imports of Hg or Hg-contaminated sediments from near-shore ocean into the Plum Island Sound, which in turn possibly may have originated from the nearby Merrimack River, a contaminated watershed from the long industrial history in New England.
Measurements of Hg concentrations, fluxes, and turnover associated with vegetation in a salt marsh ecosystem with high above- and belowground NPP showed an annual Hg uptake in aboveground tissues of 9.0 ± 3.3 µg m−2 yr−1. Using a stable Hg isotope mixing model, we estimate that 35 % of aboveground Hg originates from soil Hg uptake, 32 % is from atmospheric GEM uptake, and 33 % is from precipitation Hg(II) deposition. Estimated annual plant-derived atmospheric Hg deposition from plant senescence (i.e., litterfall) is estimated at 5.9 ± 2.1 µg m−2 yr−1, which is about of that in forests, where plant Hg assimilation of atmospheric GEM is the dominant Hg source. We estimate an additional atmospheric Hg deposition by throughfall of 1.0 ± 0.4 µg m−2 yr−1 for combined plant-derived Hg inputs of 6.9 µg m−2 yr−1. This deposition is similar to combined wet and dry deposition of other atmospheric Hg forms. Seasonal and temporal Hg concentration and mass balance dynamics show strong seasonal increases during active growing season and a lack of concentration changes after senescence over winter, suggesting physiologically controlled uptake pathways. The presence of Hg within the aboveground tissues of salt marshes results in its direct release into tidal waters and oceans through the process of wrack deposition (tidal flushing of vegetation), contributing to an annual export of approximately 1.6 µg m−2 yr−1). It also leads to herbivory uptake of Hg over the range of 0.5 to 2.4 µg Hg m−2 yr−1, which may represent internal recycling within the marsh system or which is possibly subject to export (Table 1, Fig. 7). The remainder of vegetation Hg is slowly incorporated into soils over winter and during the subsequent year. Overall, we estimate this marsh to presently serve as a small net Hg sink for environmental Hg of 5.2 µg m−2 yr−1.
Belowground Hg pools associated with live tissues (108.1 ± 83.4 µg m−2) were over 10 times larger than peak aboveground Hg pools and resulted in a substantial annual Hg turnover flux of 58.6 µg m−2 yr−1. The source of root Hg is likely from soil uptake, while belowground rhizomes show variable sources both from aboveground and root tissues. Turnover of Hg associated with belowground tissues largely reflects internal recycling between soils and plants, with poorly understood impacts on Hg partitioning, bioavailability, and mobility. Hg associated with roots and rhizomes only accounted for about 0.4 % of total belowground Hg pools, with the largest soil Hg pools associated with fine soil mineral and humus fractions (83.5 %).
Upon request, the original data supporting the conclusions of this study can be provided.
The supplement related to this article is available online at: https://doi.org/10.5194/bg-21-1461-2024-supplement.
DO and TW designed and carried out the study; TW, BD, JZ, and JP contributed to sample collection; TW, BD, JP, PHB conducted sample analysis; TW, BD, IF, EMS, PHB, and DO contributed to interpreting the data and figures; TW, IF, JZ, EMS, PHB, CC, and DO contributed to writing and editing the article. All authors contributed to the review of the article. DO and IF secured funding for the project.
The contact author has declared that none of the authors has any competing interests.
Publisher’s note: Copernicus Publications remains neutral with regard to jurisdictional claims made in the text, published maps, institutional affiliations, or any other geographical representation in this paper. While Copernicus Publications makes every effort to include appropriate place names, the final responsibility lies with the authors.
We thank Keely O'Beirne, Madison Sachs, and Silas Bollen for help with vegetation sampling and laboratory analysis of initial plant and soil mercury samples. We thank Nancy Pau and the Parker River National Wildlife Refuge for sampling permits and access. We thank Samuel Kelsey, Anne Giblin, and other researchers from the Plum Island Ecosystem Long-Term Ecological Research project for their support and for providing information about the estuary.
This research has been supported by the U.S. National Science Foundation Division of Environmental Biology (grant no. 2027038).
This paper was edited by Cindy De Jonge and reviewed by Lena Wohlgemuth and one anonymous referee.
Amos, H. M., Jacob, D. J., Kocman, D., Horowitz, H. M., Zhang, Y., Dutkiewicz, S., Horvat, M., Corbitt, E. S., Krabbenhoft, D. P., and Sunderland, E. M.: Global biogeochemical implications of mercury discharges from rivers and sediment burial, Environ. Sci. Technol., 48, 9514–9522, https://doi.org/10.1021/es502134t, 2014.
Anjum, N. A., Ahmad, I., Válega, M., Pacheco, M., Figueira, E., Duarte, A. C., and Pereira, E.: Impact of seasonal fluctuations on the sediment-mercury, its accumulation and partitioning in Halimione portulacoides and Juncus maritimus collected from Ria de Aveiro coastal lagoon (Portugal), Water. Air. Soil Pollut., 222, 1–15, https://doi.org/10.1007/s11270-011-0799-4, 2011.
Anjum, N. A., Ahmad, I., Válega, M., Pacheco, M., Figueira, E., Duarte, A. C., Pereira, E., Anjum, N. A., Ahmad, I., Válega, : M, Duarte, A. C., Pereira, E., Pacheco, M., and Figueira, E.: Salt marsh macrophyte Phragmites australis strategies assessment for its dominance in mercury-contaminated coastal lagoon (Ria de Aveiro, Portugal), Env. Sci. Pollut. Res., 19, 2879–2888, https://doi.org/10.1007/s11356-012-0794-3, 2012.
Arp, W. J., Drake, B. G., Pockman, W. T., Curtis, P. S., and Whigham, D. F.: Manual of the Vascular Flora of the Carolinas, Vegetatio, 104, 133–143, 1993.
Bertness, M. D.: Zonation of Spartina patens and Spartina alterniflora in a New England salt marsh, Ecology, 72, 138–148, https://doi.org/10.2307/1938909, 1991.
Blum, J. D. and Bergquist, B. A.: Reporting of variations in the natural isotopic composition of mercury, Anal. Bioanal. Chem., 388, 353–359, https://doi.org/10.1007/s00216-007-1236-9, 2007.
Blum, J. D. and Johnson, M. W.: Recent developments in mercury stable isotope analysis, Rev. Mineral. Geochemistry, 82, 733–757, https://doi.org/10.2138/rmg.2017.82.17, 2017.
Blum, L. K.: Spartina alterniflora root dynamics in a Virginia marsh, Mar. Ecol. Prog. Ser., 102, 169–178, 1993.
Cabrita, M. T., Duarte, B., Cesário, R., Mendes, R., Hintelmann, H., Eckey, K., Dimock, B., Caçador, I., and Canário, J.: Mercury mobility and effects in the salt-marsh plant Halimione portulacoides: Uptake, transport, and toxicity and tolerance mechanisms, Sci. Total Environ., 650, 111–120, https://doi.org/10.1016/j.scitotenv.2018.08.335, 2019.
Canário, J., Poissant, L., Pilote, M., Caetano, M., Hintelmann, H., and O'Driscoll, N. J.: Salt-marsh plants as potential sources of Hg0 into the atmosphere, Atmos. Environ., 152, 458–464, https://doi.org/10.1016/j.atmosenv.2017.01.011, 2017.
Castro, R., Pereira, S., Lima, A., Corticeiro, S., Válega, M., Pereira, E., Duarte, A., and Figueira, E.: Accumulation, distribution and cellular partitioning of mercury in several halophytes of a contaminated salt marsh, Chemosphere, 76, 1348–1355, https://doi.org/10.1016/j.chemosphere.2009.06.033, 2009.
Cavallini, A., Natali, L., Durante, M., and Maserti, B.: Mercury uptake, distribution and DNA affinity in durum wheat (Triticum durum Desf.) plants, Sci. Total Environ., 243/244, 119–127, https://doi.org/10.1016/S0048-9697(99)00367-8, 1999.
Cheng, X., Luo, Y., Chen, J., Lin, G., Chen, J., and Li, B.: Short-term C4 plant Spartina alterniflora invasions change the soil carbon in C3 plant-dominated tidal wetlands on a growing estuarine Island, Soil Biol. Biochem., 38, 3380–3386, https://doi.org/10.1016/j.soilbio.2006.05.016, 2006.
Clemens, S. and Ma, J. F.: Toxic Heavy Metal and Metalloid Accumulation in Crop Plants and Foods, Annu. Rev. Plant Biol., 67, 489–512, https://doi.org/10.1146/annurev-arplant-043015-112301, 2016.
Curtis, P. S., Balduman, L. M., Drake, B. G., and Whigham, D. F.: Elevated Atmospheric CO2 Effects on Belowground Processes in C3 and C4 Estuarine Marsh Communities, Source Ecol., 71, 2001–2006, 1990.
Demers, J. D., Blum, J. D., and Zak, D. R.: Mercury isotopes in a forested ecosystem: Implications for air-surface exchange dynamics and the global mercury cycle, Global Biogeochem. Cy., 27, 222–238, https://doi.org/10.1002/gbc.20021, 2013.
Du, S. and Fang, S. C.: Catalase activity of C3 and C4 species and its relationship to mercury vapor uptake, Environ. Exp. Bot., 23, 347–353, https://doi.org/10.1016/0098-8472(83)90009-6, 1983.
Duarte, C. M.: Reviews and syntheses: Hidden forests, the role of vegetated coastal habitats in the ocean carbon budget, Biogeosciences, 14, 301–310, https://doi.org/10.5194/bg-14-301-2017, 2017.
Duarte, C. M. and Cebrián, J.: The fate of marine autotrophic production, Limnol. Oceanogr., 41, 1758–1766, https://doi.org/10.4319/LO.1996.41.8.1758, 1996.
Edwards, G. C., Rasmussen, P. E., Schroeder, W. H., Wallace, D. M., Halfpenny-Mitchell, L., Dias, G. M., Kemp, R. J., and Ausma, S.: Development and evaluation of a sampling system to determine gaseous Mercury fluxes using an aerodynamic micrometeorological gradient method, J. Geophys. Res.-Atmos., 110, 1–11, https://doi.org/10.1029/2004JD005187, 2005.
Elsey-Quirk, T., Seliskar, D. M., and Gallagher, J. L.: Nitrogen Pools of Macrophyte Species in a Coastal Lagoon Salt Marsh: Implications for Seasonal Storage and Dispersal, Estuar. Coast., 34, 470–482, https://doi.org/10.1007/s12237-011-9379-5, 2011.
Engle, M. A., Tate, M. T., Krabbenhoft, D. P., Schauer, J. J., Kolker, A., Shanley, J. B., and Bothner, M. H.: Comparison of atmospheric mercury speciation and deposition at nine sites across central and eastern North America, J. Geophys. Res.-Atmos., 115, D18306, https://doi.org/10.1029/2010JD014064, 2010.
Enrico, M., Roux, G. Le, Marusczak, N., Heimbürger, L. E., Claustres, A., Fu, X., Sun, R., and Sonke, J. E.: Atmospheric Mercury Transfer to Peat Bogs Dominated by Gaseous Elemental Mercury Dry Deposition, Environ. Sci. Technol., 50, 2405–2412, https://doi.org/10.1021/acs.est.5b06058, 2016.
Enrico, M., Balcom, P., Johnston, D. T., Foriel, J., and Sunderland, E. M.: Simultaneous combustion preparation for mercury isotope analysis and detection of total mercury using a direct mercury analyzer, Anal. Chim. Acta, 1154, 338327, https://doi.org/10.1016/j.aca.2021.338327, 2021.
Evers, D. C., Han, Y.-J., Driscoll, C. T., Kamman, N. C., Goodale, M. W., Lambert, K. F., Holsen, T. M., Chen, C. Y., Clair, T. A., and Butler, T.: Biological Mercury Hotspots in the Northeastern United States and Southeastern Canada, Bioscience, 57, 29–43, https://doi.org/10.1641/b570107, 2007.
Fisher, L. S. and Wolfe, M. H.: Examination of mercury inputs by throughfall and litterfall in the Great Smoky Mountains National Park, Atmos. Environ., 47, 554–559, https://doi.org/10.1016/j.atmosenv.2011.10.017, 2012.
Forbrich, I., Giblin, A. E., and Hopkinson, C. S.: Constraining Marsh Carbon Budgets Using Long-Term C Burial and Contemporary Atmospheric CO2 Fluxes, J. Geophys. Res.-Biogeo., 123, 867–878, https://doi.org/10.1002/2017JG004336, 2018.
Fu, X., Zhang, H., Liu, C., Zhang, H., Lin, C. J., and Feng, X.: Significant Seasonal Variations in Isotopic Composition of Atmospheric Total Gaseous Mercury at Forest Sites in China Caused by Vegetation and Mercury Sources, Environ. Sci. Technol., 53, 13748–13756, https://doi.org/10.1021/acs.est.9b05016, 2019.
Garcia-Ordiales, E., Roqueñí, N., and Loredo, J.: Mercury bioaccumulation by Juncus maritimus grown in a Hg contaminated salt marsh (northern Spain), Mar. Chem., 226, 103859, https://doi.org/10.1016/j.marchem.2020.103859, 2020.
Graydon, J. A., St. Louis, V. L., Hintelmann, H., Lindberg, S. E., Sandilands, K. A., Rudd, J. W. M., Kelly, C. A., Tate, M. T., Krabbenhoft, D. P., and Lehnherr, I.: Investigation of uptake and retention of atmospheric Hg(II) by boreal forest plants using stable Hg isotopes, Environ. Sci. Technol., 43, 4960–4966, https://doi.org/10.1021/es900357s, 2009.
Hartman, J., Caswell, H., and Valiela, I.: Effects of wrack accumulation on salt marsh vegetation, Oceanol. Acta, 17, 99–102, 1983.
He, L., Chen, J. M., Pan, Y., Birdsey, R., and Kattge, J.: Relationships between net primary productivity and forest stand age in U.S. forests, Global Biogeochem. Cy., 26, GB3009, https://doi.org/10.1029/2010GB003942, 2012.
Hopkinson, C. S., Morris, J. T., Fagherazzi, S., Wollheim, W. M., and Raymond, P. A.: Lateral Marsh Edge Erosion as a Source of Sediments for Vertical Marsh Accretion, J. Geophys. Res.-Biogeo., 123, 2444–2465, https://doi.org/10.1029/2017JG004358, 2018.
Huang, S., Jiang, R., Song, Q., Zhang, Y., Huang, Q., Su, B., Chen, Y., Huo, Y., and Lin, H.: Study of mercury transport and transformation in mangrove forests using stable mercury isotopes, Sci. Total Environ., 704, 135928, https://doi.org/10.1016/j.scitotenv.2019.135928, 2020.
Iverfeldt, Å.: Mercury in forest canopy throughfall water and its relation to atmospheric deposition, Water Air Soil Pollut., 56, 553–564, https://doi.org/10.1007/BF00342299, 1991.
Jackson, A. K., Evers, D. C., Etterson, M. A., Condon, A. M., Folsom, S. B., Detweiler, J., Schmerfeld, J., and Cristol, D. A.: Mercury Exposure Affects The Reproductive Success of a Free-living Terrestrial Songbird, the Carolina Wren (Thryothorus Ludovicianus), The Auk, 128, 759–769, https://doi.org/10.1525/auk.2011.11106, 2011.
Jiskra, M., Wiederhold, J. G., Skyllberg, U., Kronberg, R. M., Hajdas, I., and Kretzschmar, R.: Mercury Deposition and Re-emission Pathways in Boreal Forest Soils Investigated with Hg Isotope Signatures, Environ. Sci. Technol., 49, 7188–7196, https://doi.org/10.1021/acs.est.5b00742, 2015.
Jiskra, M., Wiederhold, J. G., Skyllberg, U., Kronberg, R. M., and Kretzschmar, R.: Source tracing of natural organic matter bound mercury in boreal forest runoff with mercury stable isotopes, Environ. Sci. Process. Impact., 19, 1235–1248, https://doi.org/10.1039/c7em00245a, 2017.
Jiskra, M., Sonke, J. E., Obrist, D., Bieser, J., Ebinghaus, R., Myhre, C. L., Pfaffhuber, K. A., Wängberg, I., Kyllönen, K., Worthy, D., Martin, L. G., Labuschagne, C., Mkololo, T., Ramonet, M., Magand, O., and Dommergue, A.: A vegetation control on seasonal variations in global atmospheric mercury concentrations, Nat. Geosci., 11, 244–250, https://doi.org/10.1038/s41561-018-0078-8, 2018.
Jiskra, M., Heimbürger-Boavida, L.-E., Desgranges, M.-M., Petrova, M. V., Dufour, A., Ferreira-Araujo, B., Masbou, J., Chmeleff, J., Thyssen, M., Point, D., and Sonke, J. E.: Mercury stable isotopes constrain atmospheric sources to the ocean, Nature, 597, 678–682, https://doi.org/10.1038/s41586-021-03859-8, 2021.
Kirschner, A. S. and Zinnert, J. C.: Two low-lying coastal grassland species differ in mechanistic response to saline flooding stress, Plant Ecol., 221, 475–485, https://doi.org/10.1007/s11258-020-01026-z, 2020.
Lane, O., Adams, E. M., Pau, N., O'Brien, K. M., Regan, K., Farina, M., Schneider-Moran, T., and Zarudsky, J.: Long-term monitoring of mercury in adult saltmarsh sparrows breeding in Maine, Massachusetts and New York, USA 2000–2017, Ecotoxicology, Springer US, 1148–1160, https://doi.org/10.1007/s10646-020-02180-w, 2020.
Lane, O. P., O'Brien, K. M., Evers, D. C., Hodgman, T. P., Major, A., Pau, N., Ducey, M. J., Taylor, R., and Perry, D.: Mercury in breeding saltmarsh sparrows (Ammodramus caudacutus caudacutus), Ecotoxicology, 20, 1984–1991, https://doi.org/10.1007/s10646-011-0740-z, 2011.
Liu, M., Zhang, Q., Maavara, T., Liu, S., Wang, X., and Raymond, P. A.: Rivers as the largest source of mercury to coastal oceans worldwide, Nat. Geosci., 14, 672–677, https://doi.org/10.1038/s41561-021-00793-2, 2021.
Louis, V. L. S. T., Rudd, J. W. M., Kelly, C. A., Hall, B. D., Rolfhus, K. R., Scott, K. J., Lindberg, S. E., and Dong, W.: Importance of the forest canopy to fluxes of methyl mercury and total mercury to boreal ecosystems, Environ. Sci. Technol., 35, 3089–3098, https://doi.org/10.1021/es001924p, 2001.
Mann, K. H.: Production and use of detritus in various freshwater, estuarine, and coastal marine ecosystems, Limnol. Oceanogr., 33, 910–930, https://doi.org/10.4319/LO.1988.33.4PART2.0910, 1988.
Mao, Y., Li, Y., Richards, J., and Cai, Y.: Investigating uptake and translocation of mercury species by sawgrass (Cladium jamaicense) using a stable isotope tracer technique, Environ. Sci. Technol., 47, 9678–9684, https://doi.org/10.1021/es400546s, 2013.
Maricle, B. R., Koteyeva, N. K., Voznesenskaya, E. V., Thomasson, J. R., and Edwards, G. E.: Diversity in leaf anatomy, and stomatal distribution and conductance, between salt marsh and freshwater species in the C4 genus Spartina (Poaceae), New Phytol., 184, 216–233, https://doi.org/10.1111/J.1469-8137.2009.02903.X, 2009.
Marques, B., Lillebø, A. I., Pereira, E., and Duarte, A. C.: Mercury cycling and sequestration in salt marshes sediments: An ecosystem service provided by Juncus maritimus and Scirpus maritimus, Environ. Pollut., 159, 1869–1876, https://doi.org/10.1016/j.envpol.2011.03.036, 2011.
Millette, T. L., Argow, B. A., Marcano, E., Hayward, C., Hopkinson, C. S., and Valentine, V.: Salt Marsh Geomorphological Analyses via Integration of Multitemporal Multispectral Remote Sensing with LIDAR and GIS , J. Coast. Res., 265, 809–816, https://doi.org/10.2112/jcoastres-d-09-00101.1, 2010.
Millhollen, A. G., Gustin, M. S., and Obrist, D.: Foliar Mercury Accumulation and Exchange for Three Tree Species, Environ. Sci. Technol., 40, 6001–6006, https://doi.org/10.1021/es0609194, 2006.
Morris, J. T.: Estimating Net Primary Production of Salt Marsh Macrophytes, in: Principles and Standards for Measuring Primary Production, Vol. 15, Oxford University Press, 106–119, https://doi.org/10.1093/acprof:oso/9780195168662.003.0007, 2007.
Morris, J. T., Sundberg, K., and Hopkinson, C. S.: Salt marsh primary production and its responses to relative sea level and nutrientsin estuaries at plum island, Massachusetts, and North Inlet, South Carolina, USA, Oceanography, 26, 78–84, https://doi.org/10.5670/oceanog.2013.48, 2013.
Muench, A. and Elsey-Quirk, T.: Competitive reversal between plant species is driven by species-specific tolerance to flooding stress and nutrient acquisition during early marsh succession, J. Appl. Ecol., 56, 2236–2247, https://doi.org/10.1111/1365-2664.13458, 2019.
Niu, Z., Zhang, X., Wang, Z., and Ci, Z.: Field controlled experiments of mercury accumulation in crops from air and soil, Environ. Pollut., 159, 2684–2689, https://doi.org/10.1016/j.envpol.2011.05.029, 2011.
NOAA Tide Predictions: National Oceanic and Atmospheric Administration Tide Predictions, https://www.tidesandcurrents.noaa.gov/noaatidepredictions.html?id=8441241 (last access: 1 March 2023), 2020.
Obrist, D., Agnan, Y., Jiskra, M., Olson, C. L., Colegrove, D. P., Hueber, J., Moore, C. W., Sonke, J. E., and Helmig, D.: Tundra uptake of atmospheric elemental mercury drives Arctic mercury pollution, Nature, 547, 201–204, https://doi.org/10.1038/nature22997, 2017.
Obrist, D., Kirk, J. L., Zhang, L., Sunderland, E. M., Jiskra, M., and Selin, N. E.: A review of global environmental mercury processes in response to human and natural perturbations: Changes of emissions, climate, and land use, Ambio, 47, 116–140, https://doi.org/10.1007/s13280-017-1004-9, 2018.
Obrist, D., Roy, E. M., Harrison, J. L., Kwong, C. F., William Munger, J., Moosmüller, H., Romero, C. D., Sun, S., Zhou, J., and Commane, R.: Previously unaccounted atmospheric mercury deposition in a midlatitude deciduous forest, P. Natl. Acad. Sci. USA, 118, e2105477118, https://doi.org/10.1073/pnas.2105477118, 2021.
Ouyang, X., Lee, S. Y., and Connolly, R. M.: The role of root decomposition in global mangrove and saltmarsh carbon budgets, Earth-Sci. Rev., 166, 53–63, https://doi.org/10.1016/j.earscirev.2017.01.004, 2017.
Raymond, P. A. and Hopkinson, C. S.: Ecosystem Modulation of Dissolved Carbon Age in a Temperate Marsh-Dominated Estuary, Ecosystems, 6, 694–705, https://doi.org/10.1007/s10021-002-0213-6, 2003.
Rea, A. W., Keeler, G. J., and Scherbatskoy, T.: The deposition of mercury in throughfall and litterfall in the Lake Champlain watershed: A short-term study, Atmos. Environ., 30, 3257–3263, https://doi.org/10.1016/1352-2310(96)00087-8, 1996.
Sun, L., Shao, D., Xie, T., Gao, W., Ma, X., Ning, Z., and Cui, B.: How does Spartina alterniflora invade in salt marsh in relation to tidal channel networks? Patterns and processes, Remote Sens., 12, 2983, https://doi.org/10.3390/RS12182983, 2020.
Tobias, C. and Neubauer, S.: Salt Marsh Biogeochemistry – An Overview, in: Coastal Wetlands: An Integrated Ecosystem Approach, edited by: Perillo, G. M. E., Wolanski, E., Cahoon, D. R., and Brinson, M. M., Elsevier, Amsterdam, the Netherlands, 1–57, Elsevier, https://doi.org/10.1016/B978-0-444-63893-9.00016-2, 2009.
Tobias, C. and Neubauer, S. C.: Salt Marsh Biogeochemistry – An Overview, Coast. Wetl. An Integr. Ecosyst. Appr., 2019, 539–596, https://doi.org/10.1016/B978-0-444-63893-9.00016-2, 2019.
U.S. EPA: Method 7473, Mercury in solids and solutions by thermal decomposition, amalgamation, and atomic absorption spectrophotometry, Revision 0. Washington, DC, 1998.
Valiela, I., Teal, J. M., and Persson, N. Y.: Production and dynamics of experimentally enriched salt marsh vegetation: Belowground biomass, Limnol. Oceanogr., 21, 245–252, https://doi.org/10.4319/lo.1976.21.2.0245, 1976.
Visser, J. M., Midway, S., Baltz, D. M., and Sasser, C. E.: Ecosystem structure of tidal saline marshes, in: Coastal Wetlands: An Integrated Ecosystem Approach, Elsevier, 519–538, https://doi.org/10.1016/B978-0-444-63893-9.00015-0, 2018.
Wang, J. J., Guo, Y. Y., Guo, D. L., Yin, S. L., Kong, D. L., Liu, Y. S., and Zeng, H.: Fine root mercury heterogeneity: Metabolism of lower-order roots as an effective route for mercury removal, Environ. Sci. Technol., 46, 769–777, https://doi.org/10.1021/es2018708, 2012.
Wang, T. and Obrist, D.: Inorganic and methylated mercury dynamics in estuarine water of a salt marsh in Massachusetts, USA, Environ. Pollut., 294, 118657, https://doi.org/10.1016/j.envpol.2021.118657, 2022.
Wang, X., Bao, Z., Lin, C. J., Yuan, W., and Feng, X.: Assessment of Global Mercury Deposition through Litterfall, Environ. Sci. Technol., 50, 8548–8557, https://doi.org/10.1021/acs.est.5b06351, 2016.
Wang, X., Yuan, W., Lin, C.-J., Zhang, L., Zhang, H., and Feng, X.: Climate and Vegetation As Primary Drivers for Global Mercury Storage in Surface Soil, Environ. Sci. Technol., 53, 10665–10675, https://doi.org/10.1021/acs.est.9b02386, 2019.
Wang, X., Yuan, W., Lin, C. J., Luo, J., Wang, F., Feng, X., Fu, X., and Liu, C.: Underestimated Sink of Atmospheric Mercury in a Deglaciated Forest Chronosequence, Environ. Sci. Technol., 54, 8083–8093, https://doi.org/10.1021/acs.est.0c01667, 2020.
Wang, X., Yuan, W., Lin, C.-J., and Feng, X.: Mercury cycling and isotopic fractionation in global forests, Crit. Rev. Environ. Sci. Technol., 52, 3763–3786, https://doi.org/10.1080/10643389.2021.1961505, 2022a.
Wang, X., Yuan, W., Lin, C. J., Wang, D., Luo, J., Xia, J., Zhang, W., Wang, F., and Feng, X.: Root uptake dominates mercury accumulation in permafrost plants of Qinghai-Tibet Plateau, Commun. Earth Environ., 3, 1–10, https://doi.org/10.1038/s43247-022-00619-y, 2022b.
Wang, Y., Wang, Z., Zheng, X., and Zhou, L.: Influence of Spartina alterniflora invasion on mercury storage and methylation in the sediments of Yangtze River estuarine wetlands, Estuar. Coast. Shelf Sci., 265, 107717, https://doi.org/10.1016/j.ecss.2021.107717, 2021.
Weis, J. S. and Weis, P.: Metal uptake, transport and release by wetland plants: implications for phytoremediation and restoration, Environ. Int., 30, 685–700, https://doi.org/10.1016/j.envint.2003.11.002, 2004.
Wilson, C. A., Hughes, Z. J., FitzGerald, D. M., Hopkinson, C. S., Valentine, V., and Kolker, A. S.: Saltmarsh pool and tidal creek morphodynamics: Dynamic equilibrium of northern latitude saltmarshes?, Geomorphology, 213, 99–115, https://doi.org/10.1016/j.geomorph.2014.01.002, 2014.
Windham, L.: Comparison of biomass production and decomposition between Phragmites australis (common reed) and spartina patens (salt hay grass) in brackish tidal marshes of New Jersey, USA, Wetlands, 21, 179–188, https://doi.org/10.1672/0277-5212(2001)021[0179:COBPAD]2.0.CO;2, 2001.
Windham, L., Weis, J. S., Weis, P., Wei, J. S., Weis, P., Weis, J. S., and Weis, P.: Patterns and Processes of Mercury Release from Leaves of Two Dominant Salt Marsh Macrophytes, Phragmites australis and Spartina alterniflora, Estuaries, 24, 787–795, https://doi.org/https://doi.org/10.2307/1353170, 2001.
Windham, L., Weis, J., and Weis, P.: Uptake and distribution of metals in two dominant salt marsh macrophytes, Spartina alterniflora (cordgrass) and Phragmites australis (common reed), Estuar. Coast. Shelf Sci., 56, 63–72, https://doi.org/10.1016/S0272-7714(02)00121-X, 2003.
Woerndle, G. E., Tsz-Ki Tsui, M., Sebestyen, S. D., Blum, J. D., Nie, X., and Kolka, R. K.: New Insights on Ecosystem Mercury Cycling Revealed by Stable Isotopes of Mercury in Water Flowing from a Headwater Peatland Catchment, Environ. Sci. Technol., 52, 1854–1861, https://doi.org/10.1021/acs.est.7b04449, 2018.
Wohlgemuth, L., Osterwalder, S., Joseph, C., Kahmen, A., Hoch, G., Alewell, C., and Jiskra, M.: A bottom-up quantification of foliar mercury uptake fluxes across Europe, Biogeosciences, 17, 6441–6456, https://doi.org/10.5194/bg-17-6441-2020, 2020.
Wohlgemuth, L., Rautio, P., Ahrends, B., Russ, A., Vesterdal, L., Waldner, P., Timmermann, V., Eickenscheidt, N., Fürst, A., Greve, M., Roskams, P., Thimonier, A., Nicolas, M., Kowalska, A., Ingerslev, M., Merilä, P., Benham, S., Iacoban, C., Hoch, G., Alewell, C., and Jiskra, M.: Physiological and climate controls on foliar mercury uptake by European tree species, Biogeosciences, 19, 1335–1353, https://doi.org/10.5194/bg-19-1335-2022, 2022.
Yin, R., Feng, X., and Meng, B.: Stable mercury isotope variation in rice plants (Oryza sativa L.) from the Wanshan mercury Mining District, SW China, Environ. Sci. Technol., 47, 2238–2245, https://doi.org/10.1021/es304302a, 2013.
Yu, B., Fu, X., Yin, R., Zhang, H., Wang, X., Lin, C. J., Wu, C., Zhang, Y., He, N., Fu, P., Wang, Z., Shang, L., Sommar, J., Sonke, J. E., Maurice, L., Guinot, B., and Feng, X.: Isotopic composition of atmospheric mercury in China: New evidence for sources and transformation processes in air and in vegetation, Environ. Sci. Technol., 50, 9362–9369, https://doi.org/10.1021/acs.est.6b01782, 2016.
Zhang, Y., Jacob, D. J., Dutkiewicz, S., Amos, H. M., Long, M. S., and Sunderland, E. M.: Biogeochemical drivers of the fate of riverine mercury discharged to the global and Arctic oceans, Global Biogeochem. Cy., 29, 854–864, https://doi.org/10.1002/2015GB005124, 2015.
Zheng, W., Obrist, D., Weis, D., and Bergquist, B. A.: Mercury isotope compositions across North American forests, Global Biogeochem. Cy., 30, 1475–1492, https://doi.org/10.1002/2015GB005323, 2016.
Zhou, J. and Obrist, D.: Global Mercury Assimilation by Vegetation, Environ. Sci. Technol., 55, 14245–14257, https://doi.org/10.1021/acs.est.1c03530, 2021.
Zhou, J., Obrist, D., Dastoor, A., Jiskra, M., and Ryjkov, A.: Vegetation uptake of mercury and impacts on global cycling, Nat. Rev. Earth Environ., 2, 269–284, https://doi.org/10.1038/s43017-021-00146-y, 2021.