the Creative Commons Attribution 4.0 License.
the Creative Commons Attribution 4.0 License.
 | 22 Mar 2024
Relevance of near-surface soil moisture vs. terrestrial water storage for global vegetation functioning
Prajwal Khanal
Anne J. Hoek Van Dijke
Timo Schaffhauser
Wantong Li
Sinikka J. Paulus
Chunhui Zhan
René Orth
Soil water availability is an essential prerequisite for vegetation functioning. Vegetation takes up water from varying soil depths depending on the characteristics of its rooting system and soil moisture availability across depth. The depth of vegetation water uptake is largely unknown across large spatial scales as a consequence of sparse ground measurements. At the same time, emerging satellite-derived observations of vegetation functioning, surface soil moisture, and terrestrial water storage present an opportunity to assess the depth of vegetation water uptake globally. In this study, we characterize vegetation functioning through the near-infrared reflectance of vegetation (NIRv) and compare its relation to (i) near-surface soil moisture from the ESA's Climate Change Initiative (CCI) and (ii) total water storage from the Gravity Recovery and Climate Experiment (GRACE) mission at a monthly timescale during the growing season. The relationships are quantified through partial correlations to mitigate the influence of confounding factors such as energy- and other water-related variables. We find that vegetation functioning is generally more strongly related to near-surface soil moisture, particularly in semi-arid regions and areas with low tree cover. In contrast, in regions with high tree cover and in arid regions, the correlation with terrestrial water storage is comparable to or even higher than that of near-surface soil moisture, indicating that trees can and do make use of their deeper rooting systems to access deeper soil moisture, similar to vegetation in arid regions. At the same time, we note that this comparison is hampered by different noise levels in these satellite data streams. In line with this, an attribution analysis that examines the relative importance of soil water storage for vegetation reveals that they are controlled by (i) water availability influenced by the climate and (ii) vegetation type reflecting adaptation of the ecosystems to local water resources. Next to variations in space, the vegetation water uptake depth also varies in time. During dry periods, the relative importance of terrestrial water storage increases, highlighting the relevance of deeper water resources during rain-scarce periods. Overall, the synergistic exploitation of state-of-the-art satellite data products to disentangle the relevance of near-surface vs. terrestrial water storage for vegetation functioning can inform the representation of vegetation–water interactions in land surface models to support more accurate climate change projections.
- Article
(4882 KB) - Full-text XML
-
Supplement
(2349 KB) - BibTeX
- EndNote


The regulation of water, energy, and biogeochemical cycling between land and atmosphere is primarily dependent on vegetation. In addition, global vegetation provides essential ecosystem services such as food production and uptake of some of the anthropogenic carbon dioxide emissions (Keenan and Williams, 2018). Vegetation growth depends on nutrient, water, and energy availability. As a result, at a global scale, there are regions with energy- or water-limited vegetation functioning (Orth, 2021). In energy-limited regions, the functioning of vegetation is controlled by radiation and temperature, as it often lacks sunny and warm conditions but has ample soil moisture. In contrast, soil moisture becomes critical for vegetation growth in water-limited regions. Plant photosynthesis involves opening the stomata for the uptake of CO2, while at the same time water is lost through transpiration. However, in water-limited conditions, plants can reduce the stomatal opening to avoid water loss, leading to a decrease in photosynthesis. Hence, variations in soil moisture are likely to affect vegetation functioning in water-limited conditions. Moreover, climate change has led to an expanded water limitation on vegetation (Denissen et al., 2022) and increased vegetation sensitivity to soil moisture (Li et al., 2022). For these reasons, it is essential to better understand the dependence of vegetation functioning on soil moisture to comprehend its coping mechanisms during drought to predict the future of global water, energy, and carbon cycles.
Plants extract water from varying soil depths based on the positioning of their roots and the availability of soil moisture and nutrients. In general, the plant water uptake depth further differs spatially across different climate regimes and vegetation types and temporally between seasons. Vegetation in arid regions is more susceptible to fluctuations in near-surface soil moisture compared to vegetation in humid regions (Xie et al., 2019). Grasses, which generally have shorter roots than trees and shrubs, are more reliant on near-surface moisture than deeper moisture (Schenk and Jackson, 2002). Further, root water uptake profiles vary within individual plant types according to above-ground biomass and age, with larger and older trees having deeper roots capable of extracting water from deeper soil layers (Schenk and Jackson, 2002; Tao et al., 2021). Additionally, within similar climate regimes, plant water uptake varies across topographic positions. Upland and lowland roots tend to be shallower, making vegetation more reliant on near-surface soil moisture, while roots go deeper in steep terrain between these landscapes to access both surface and deep moisture (Fan et al., 2017).
Although spatial variations in plant water uptake depths across vegetation types and climate regimes and temporal shift during dry months are widely studied at the point scale, inadequate deep-soil moisture records pose a major obstacle to the study of vegetation root water uptake at a global scale. Microwave remote sensing allows us to infer near-surface soil moisture dynamics globally. While microwaves penetrate only the top few centimeters and do not cover the entire soil moisture profile, they represent larger depths of moisture variation, providing valuable insights into at least some of the root zone soil moisture (Feldman et al., 2023). Land surface models provide an alternative source of global soil moisture data across depths, but they are subject to uncertainties arising from meteorological data; inaccurate knowledge of soil and vegetation characteristics; and the representation of complex processes such as photosynthesis, infiltration, and evaporation (Koster et al., 2009; Seneviratne et al., 2010). Hence, some studies have employed reanalysis-based soil moisture estimates to investigate the relationship between vegetation and soil moisture at the global scale (Li et al., 2021; Miguez-Macho and Fan, 2021), but those are likely to be impacted by model assumptions affecting soil moisture dynamics, particularly for deeper layers where fewer observational constraints are available. Thus, studying vegetation interactions with the entire water column, including near-surface and deep-soil moisture, at a global scale using an exclusively observation-based dataset is imperative to enhance the understanding of the relevance of near-surface and deep-soil moisture for vegetation functioning.
The Gravity Recovery and Climate Experiment (GRACE) satellite mission, launched in 2002, provides total water storage (TWS) anomaly observations at the global scale. The TWS captures not only soil water but also snow and ice, canopy water, surface water, and groundwater. Its depth of representation is therefore difficult to physically quantify, and that is why we study TWS anomalies. Nevertheless, they seem to be related to variations in overall water availability (near-surface and deep-soil moisture) for vegetation (Yang et al., 2014). The interannual carbon dioxide growth rate in the atmosphere, for example, has been found to be well correlated with the TWS anomalies at a global scale, indicating the relevance of the total water column for vegetation functioning (Humphrey et al., 2018). In this study, we assume that TWS anomalies can be used to estimate the variation in overall water availability (near-surface and deep-soil moisture) for vegetation under (i) snow-free conditions and assuming that (ii) water storage variations in lakes or groundwater are negligible at the monthly timescale and (iii) canopy water storage is much smaller than soil water storage and hence also negligible (Zheng and Jia, 2020; Stocker et al., 2023). While soil moisture fluctuations represent the largest variation in TWS (Rodell and Famiglietti, 2001), it is essential to note that certain regions exhibit notable short-term fluctuations in lake water and groundwater due to human management (Strassberg et al., 2007; Cooley et al., 2021).
This study focuses on understanding the relevance of near-surface soil moisture vs. total water storage for vegetation functioning at a global scale using observation-based datasets, thereby inferring vegetation's large-scale water uptake depth from observation-based datasets. For this purpose, we utilize TWS and near-surface soil moisture and correlate them with vegetation functioning, represented by the near-infrared reflectance of vegetation (NIRv). In particular, we analyze the following questions: (1) what is the relevance of near-surface soil moisture vs. terrestrial water storage for vegetation functioning? (2) How does the importance of near-surface soil moisture vs. terrestrial water storage change during dry months? (3) How do climatic, vegetation, and topographic characteristics explain the variability in the relevance of near-surface vs. terrestrial water storage for vegetation functioning?
2.1 Data
2.1.1 Vegetation functioning
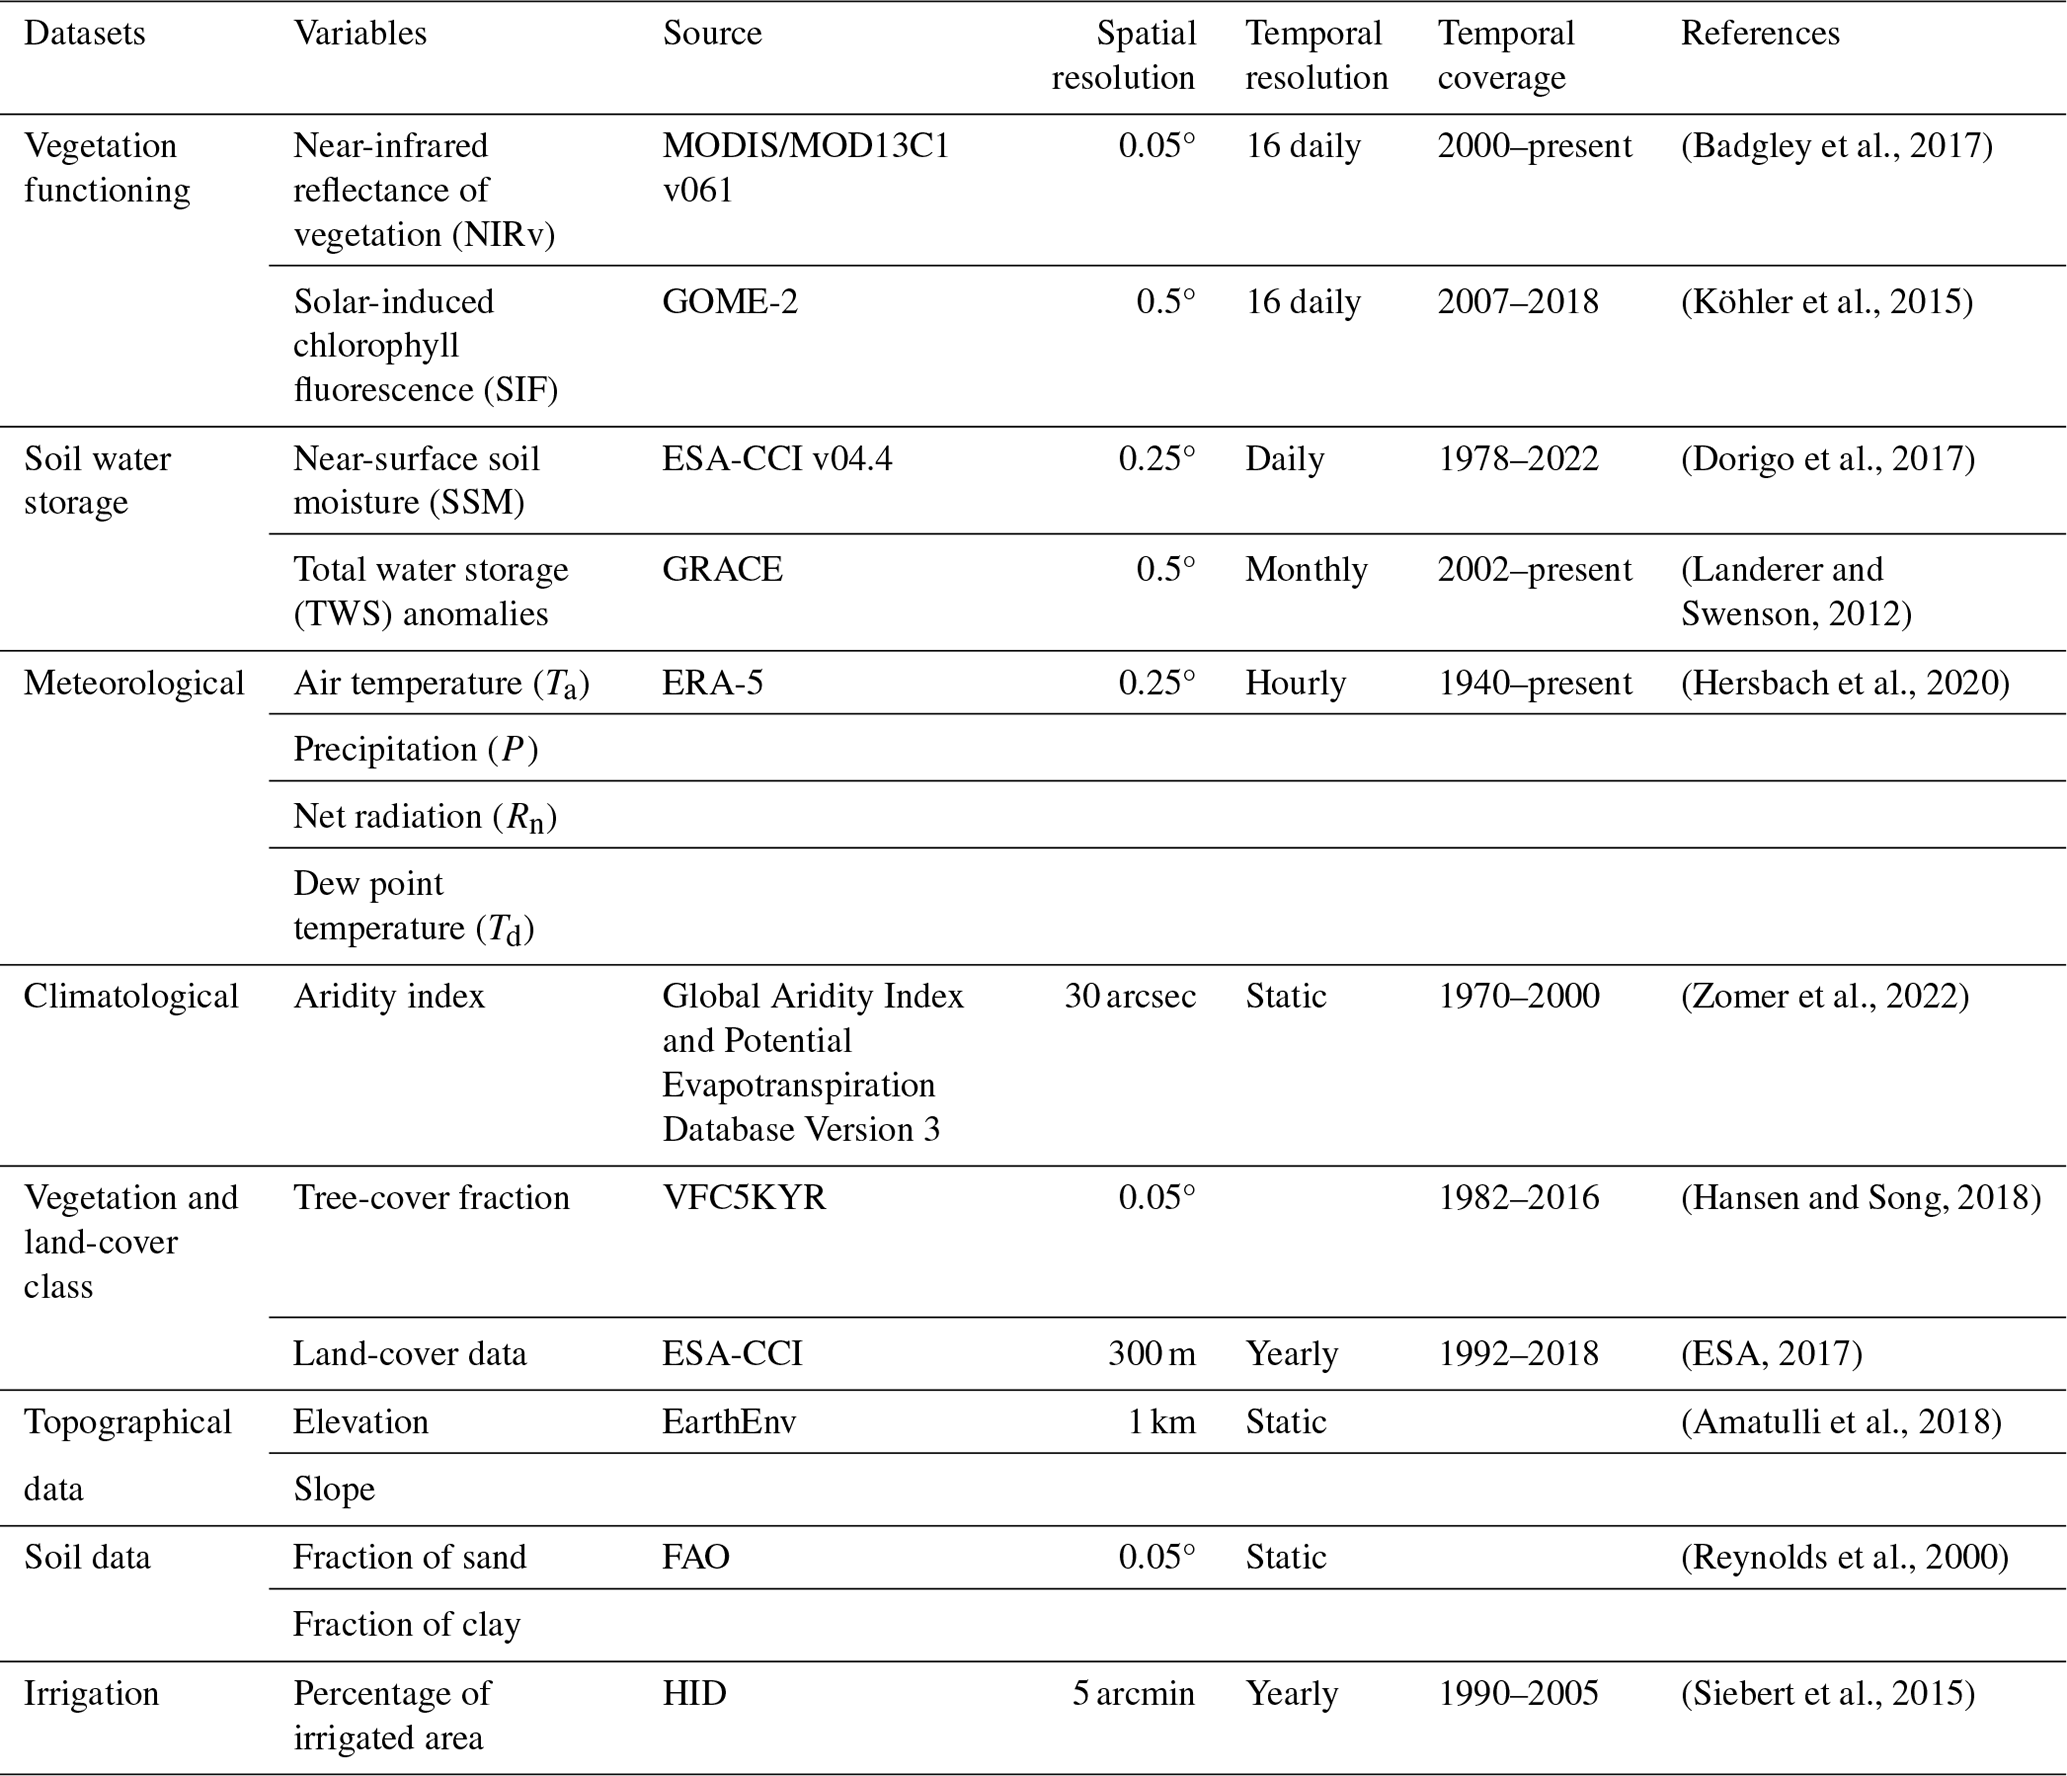
In our study, vegetation functioning is characterized by satellite measurements of near-infrared reflectance of vegetation (NIRv) and solar-induced fluorescence (SIF) (Table 1). NIRv is the product of near-infrared reflectance and the normalized difference vegetation index (NDVI) and represents the vegetation structure and vegetation greenness (Badgley et al., 2017). The NIRv data are available at a high spatial resolution of 0.05°, and the original 16 d data were aggregated to the monthly NIRv data. SIF is directly related to the photosynthetic activity of plants because the excess energy from sunlight, which triggers the light reaction during photosynthesis, is dissipated by leaf as chlorophyll fluorescence (Mohammed et al., 2019). SIF data are derived from the Global Ozone Monitoring Experiment (GOME-2), because GOME-2 provides relatively reliable data over a long period (2007–2018). The 0.5° spatial and 16 d temporal resolution SIF data are processed into monthly data as described by Köhler et al. (2015).
The high spatial resolution of NIRv allows for a detailed study of the correlation of vegetation functioning with soil water availability. Therefore, we performed the main analyses using NIRv data. However, SIF is more sensitive to drought stress than NIRv (Qiu et al., 2022). Therefore, we perform additional analyses with SIF to show that the relationships hold for a different and more direct indicator of vegetation functioning.
2.1.2 Soil water storage
This study includes two different measures of soil water availability. Near-surface soil moisture (SSM) provides an estimate of water availability in the top layer of the soil, while the terrestrial water storage (TWS) anomaly provides an estimate of the overall water column of the soil. The SSM data are derived from the ESA Climate Change Initiative (CCI), which combines active and passive satellite microwave measurements to provide reliable estimates of SSM (Dorigo et al., 2017). The ESA CCI soil moisture data, at a daily temporal resolution, were aggregated to a monthly temporal resolution. The TWS anomaly data are derived from the GRACE mission, which measures changes in the Earth's gravity field (Landerer and Swenson, 2012). Here, we use the NASA Jet Propulsion Laboratory (JPL) Mascon product of TWS anomalies which is available at a 0.5° spatial resolution and monthly temporal resolution (Watkins et al., 2015).
2.1.3 Meteorological data
Climate variables employed include monthly air temperature (Ta), 2 m dew point temperature (Td), precipitation (P), and net radiation (Rn) from the ERA5 reanalysis products at a 0.25° spatial resolution. The vapor pressure deficit (VPD) is calculated from Ta and Td. Further, the aridity index is calculated from the ratio between the long-term mean Rn (mm yr−1) ( mm d−1) and P (mm yr−1) for each grid cell (Budyko, 1974). We opted for this formulation as it offers a direct estimation of aridity and water (energy) constraints on vegetation. This eliminates the necessity of navigating through various formulations utilized for calculating potential evapotranspiration. However, we conducted additional validations of our results using the Global Aridity Index dataset (Zomer et al., 2022) based on the FAO Penman–Monteith Reference Evapotranspiration equation. The use of the Global Aridity Index did not change the results of our study (Sect. 3.4). In addition, the mean and standard deviation of the climate variables are calculated and incorporated into the attribution analysis (Sect. 2.2.3).
2.1.4 Vegetation, soil, and topography data
To evaluate the resulting correlation of vegetation functioning and water storage with respect to vegetation characteristics, we employ the tree-cover fraction data from the Advanced Very High Resolution Radiometer (AVHRR) Vegetation Continuous Fields product (VCF5KYR, https://lpdaac.usgs.gov/products/vcf5kyrv001/, last access: 11 March 2024) (Hansen and Song, 2018). For this purpose, the mean tree-cover fraction for the years between 2007 and 2016 is calculated.
Topographical variables such as elevation and slope are incorporated along with other meteorological variables to determine the relative contribution of different variables to the correlation between vegetation functioning and water storage. Topographic data at a 5 km resolution were downloaded from the EarthEnv project. These data are calculated based on the 250 m Global Multi-resolution Terrain Elevation Data (GMTED2010) and compared against the 90 m Shuttle Radar Topography Mission (SRTM4.1dev) dataset. The data were resampled to a coarser resolution of 5 km using various aggregation techniques, details of which are in Amatulli et al. (2018). Furthermore, for each grid cell, the fraction of sand and clay in the soil (Reynolds et al., 2000) along with the percentage of irrigated area (Siebert et al., 2015) were considered in the attribution analysis.
2.2 Methodology
2.2.1 Data pre-processing
A flowchart of the data pre-processing and analyses is presented in Fig. S1 in the Supplement. The time period of the analysis is from 2007 to 2018, constrained by the concurrent availability of all involved datasets. All the analyses were performed at a monthly temporal resolution and at a 0.05° spatial resolution (for NIRv) and at a 0.5° spatial resolution (for SIF). The SSM and TWS data were initially available at a 0.25 and 0.5° resolution but were disaggregated or aggregated to 0.05 or 0.5° depending on the spatial resolution of the analysis performed, based on the assumption that the soil water storage anomalies are representative over larger areas. Also, the meteorological data and vegetation, soil, and topographic data were resampled into the same resolution. After aggregating all the datasets to a 0.05° resolution, the monthly anomalies were calculated by subtracting the long-term mean monthly cycle and by removing linear trends. A SIF threshold was applied in each grid cell to filter out non-growing-season data. For this purpose, we filtered out all the months from 2007–2018 when the mean monthly SIF value was below the threshold of 0.2 . We apply an additional temperature threshold (Ta>5 °C) to remove the months with frozen soil and snow cover, similar to the method in Li et al. (2021). Last, all months with missing soil water storage or vegetation functioning records were excluded.
2.2.2 Calculating the relevance of near-surface soil moisture (SSM) and terrestrial water storage (TWS) for vegetation functioning
We calculated the Spearman correlation between vegetation functioning (NIRv) and soil water storage (SSM and TWS) for each grid cell during growing-season months when observations for at least 40 months were available. To derive partial correlation estimates between NIRv and water storage, we employed a bootstrapping approach (resampling with replacement from the original data) within each grid cell, with 1000 repetitions to compute bootstrap means and confidence intervals. The cutoff of 40 months was implemented to guarantee a substantial number of observations for growing-season months in each grid cell. This consideration assumes that the minimum number of growing-season months varies from 3 to 4 months per year globally. In addition to soil moisture, air temperature (Ta) and net radiation (Rn) also affect vegetation functioning. Moreover, SSM (soil moisture) and TWS (total water storage) demonstrate a notable correlation, as illustrated in Fig. S2 in the Supplement, signifying the presence of mutual information. To exclusively examine the individual impact of each water storage variable on vegetation functioning and disentangle mutual information from other water variables, we accounted for confounding effects. This entailed computing the partial correlation between NIRv and water storage (SSM or TWS), while controlling for Ta, Rn, and the other water storage variable (TWS or SSM). Since we focus on understanding the role of soil moisture in vegetation functioning, which is primarily critical in water-limited conditions, we removed the grid cells with negative partial correlations from our analysis. Such negative partial correlations may hint at vegetation's converse effect on soil moisture (when increasing vegetation activity depletes the soil moisture), and a negative correlation could occur in the grid cells where water limits vegetation productivity through oxygen limitation (Ohta et al., 2014). Also, note that the predominant energy limitation of the vegetation prevents the evaluation of the relevance of soil moisture vs. terrestrial water storage, as partial correlations will become insignificant when temperature or radiation mainly controls vegetation functioning.
It is important to note that we chose not to apply a significance criterion in analyzing the partial correlation between NIRv and water storage. When controlling for both water storage (TWS or SSM) and energy variables (Ta and Rn) in the partial correlation (NIRv ∼ SSM or TWS), a limited number of grid cells demonstrate significant correlation globally, given the high correlation between SSM and TWS (Fig. S2). This poses challenges in drawing global inferences about vegetation water uptake. However, our overarching goal is to discern variations in the partial correlation of NIRv with water storage across differing climate–vegetation gradients and to discern how it changes from the growing season to dry months, rather than to confirm specific statistical thresholds. For this, we want to maintain a sufficient number of grid cells necessary to make global inferences. However, to ensure that our results are not affected by the significance criterion, we conducted additional analyses considering only grid cells with a significant partial correlation (although a very small number compared to the total number of grid cells available for each aridity index–tree cover fraction, AI-TC, class globally), as described in Sect. 3.4.
The impact of all the pre-processing steps on the number of grid cells included in this study is illustrated in Fig. S3 in the Supplement. Generally, our filtering procedures enable us to concentrate primarily on water-limited regions, as they effectively remove a substantial number of grid cells from wet regions globally.
To analyze how the importance of SSM and TWS changes during dry months, we specifically selected the months characterized by the lowest 10 % of SSM for each grid cell, representing the driest conditions within the growing-season months. The partial correlations between NIRv and water storage, r(NIRv ∼ SSM) and r(NIRv ∼ TWS), were calculated separately for dry months. To focus on the vegetation response to a similar extent of dryness spatially, only grid cells with more than 100 monthly observations were considered for the dry-month analysis. In addition, only the grid cells which had positive partial correlation in growing-season months were included in the dry-month analysis.
After computing the partial correlations, we grouped the grid cells by aridity and tree-cover classes, which allowed us to analyze the evolution of correlations and the difference between the partial correlation across aridity–tree-cover classes. Afterwards, we again employed a full bootstrapping methodology with 1000 repetitions to compute the bootstrap means and confidence interval for each aridity–tree-cover class with a sufficient number of observations for both growing-season and dry months. Moreover, to test the robustness of the results, we did additional partial correlation analyses, in which we correlated SIF (instead of NIRv) with SSM and TWS. The analyses with SIF were performed at a spatial resolution of 0.5°, the resolution at which SIF data were available.
2.2.3 Attribution analysis
We used a random forest model to understand the spatial variability in the relevance of SSM vs. TWS for NIRv. A random forest is a nonparametric-based regression algorithm that does not require any statistical assumptions regarding the predictor and target variables, which makes it particularly useful for detecting nonlinear relationships (Breiman, 2001). Given the potential nonlinear impact of various factors (climate, soil types, and vegetation) on the relationship between moisture storage and vegetation functioning, this study employed the random forest method to assess the relative contributions of these variables.
In our study, 15 predictors were included in the random forest model based on their potential physical relevance to the target variable, which is the difference in correlation between SSM and TWS with NIRv in growing-season months. These predictors included the mean and standard deviation of climate variables (Ta, Rn, P, and VPD), the aridity index, topographical variables (elevation and slope), a vegetation variable (tree cover), soil-related variables (fraction of clay and sand), and the percentage of irrigated areas for each grid cell. We calculated the mean and standard deviation of the climate variables only during the growing-season months, as determined in the subsequent partial correlation analysis. Furthermore, only the grid cells exhibiting positive partial correlation between NIRv and SSM and NIRv and TWS during growing-season months were included in the random forest analysis. To train the random forest model, we used the xgboost package in R (Chen and Guestrin, 2016).
We further incorporate SHapley Additive exPlanations (SHAP) values to interpret the predictions of the random forest model (Lundberg et al., 2020). The SHAP value for a feature is the average difference in prediction of the model when that feature is included compared to when it is excluded, over all possible combinations of features. By calculating SHAP values for each feature in the model, we identified which features were most important in explaining the spatial variability in the relevance of SSM vs. TWS. To calculate the SHAP values, we employed the SHAPforxgboost package in R.
3.1 Coupling of vegetation functioning with surface soil moisture and total water storage in the growing season
The partial correlation of NIRv with near-surface soil moisture varies globally during growing-season months (Fig. 1a). NIRv demonstrates stronger correlation with near-surface soil moisture within semi-arid climates, such as central North America, South America, regions in southern Africa, and Australia. The correlation is stronger in southern Europe and the Mediterranean region compared to central and northern Europe. The correlation gradient from the hot-and-dry Mediterranean region to wet-and-cold northern Europe corresponds to the gradient from water-limited ecosystems to energy-limited ecosystems obtained in other studies (Denissen et al., 2022; Teuling et al., 2009).
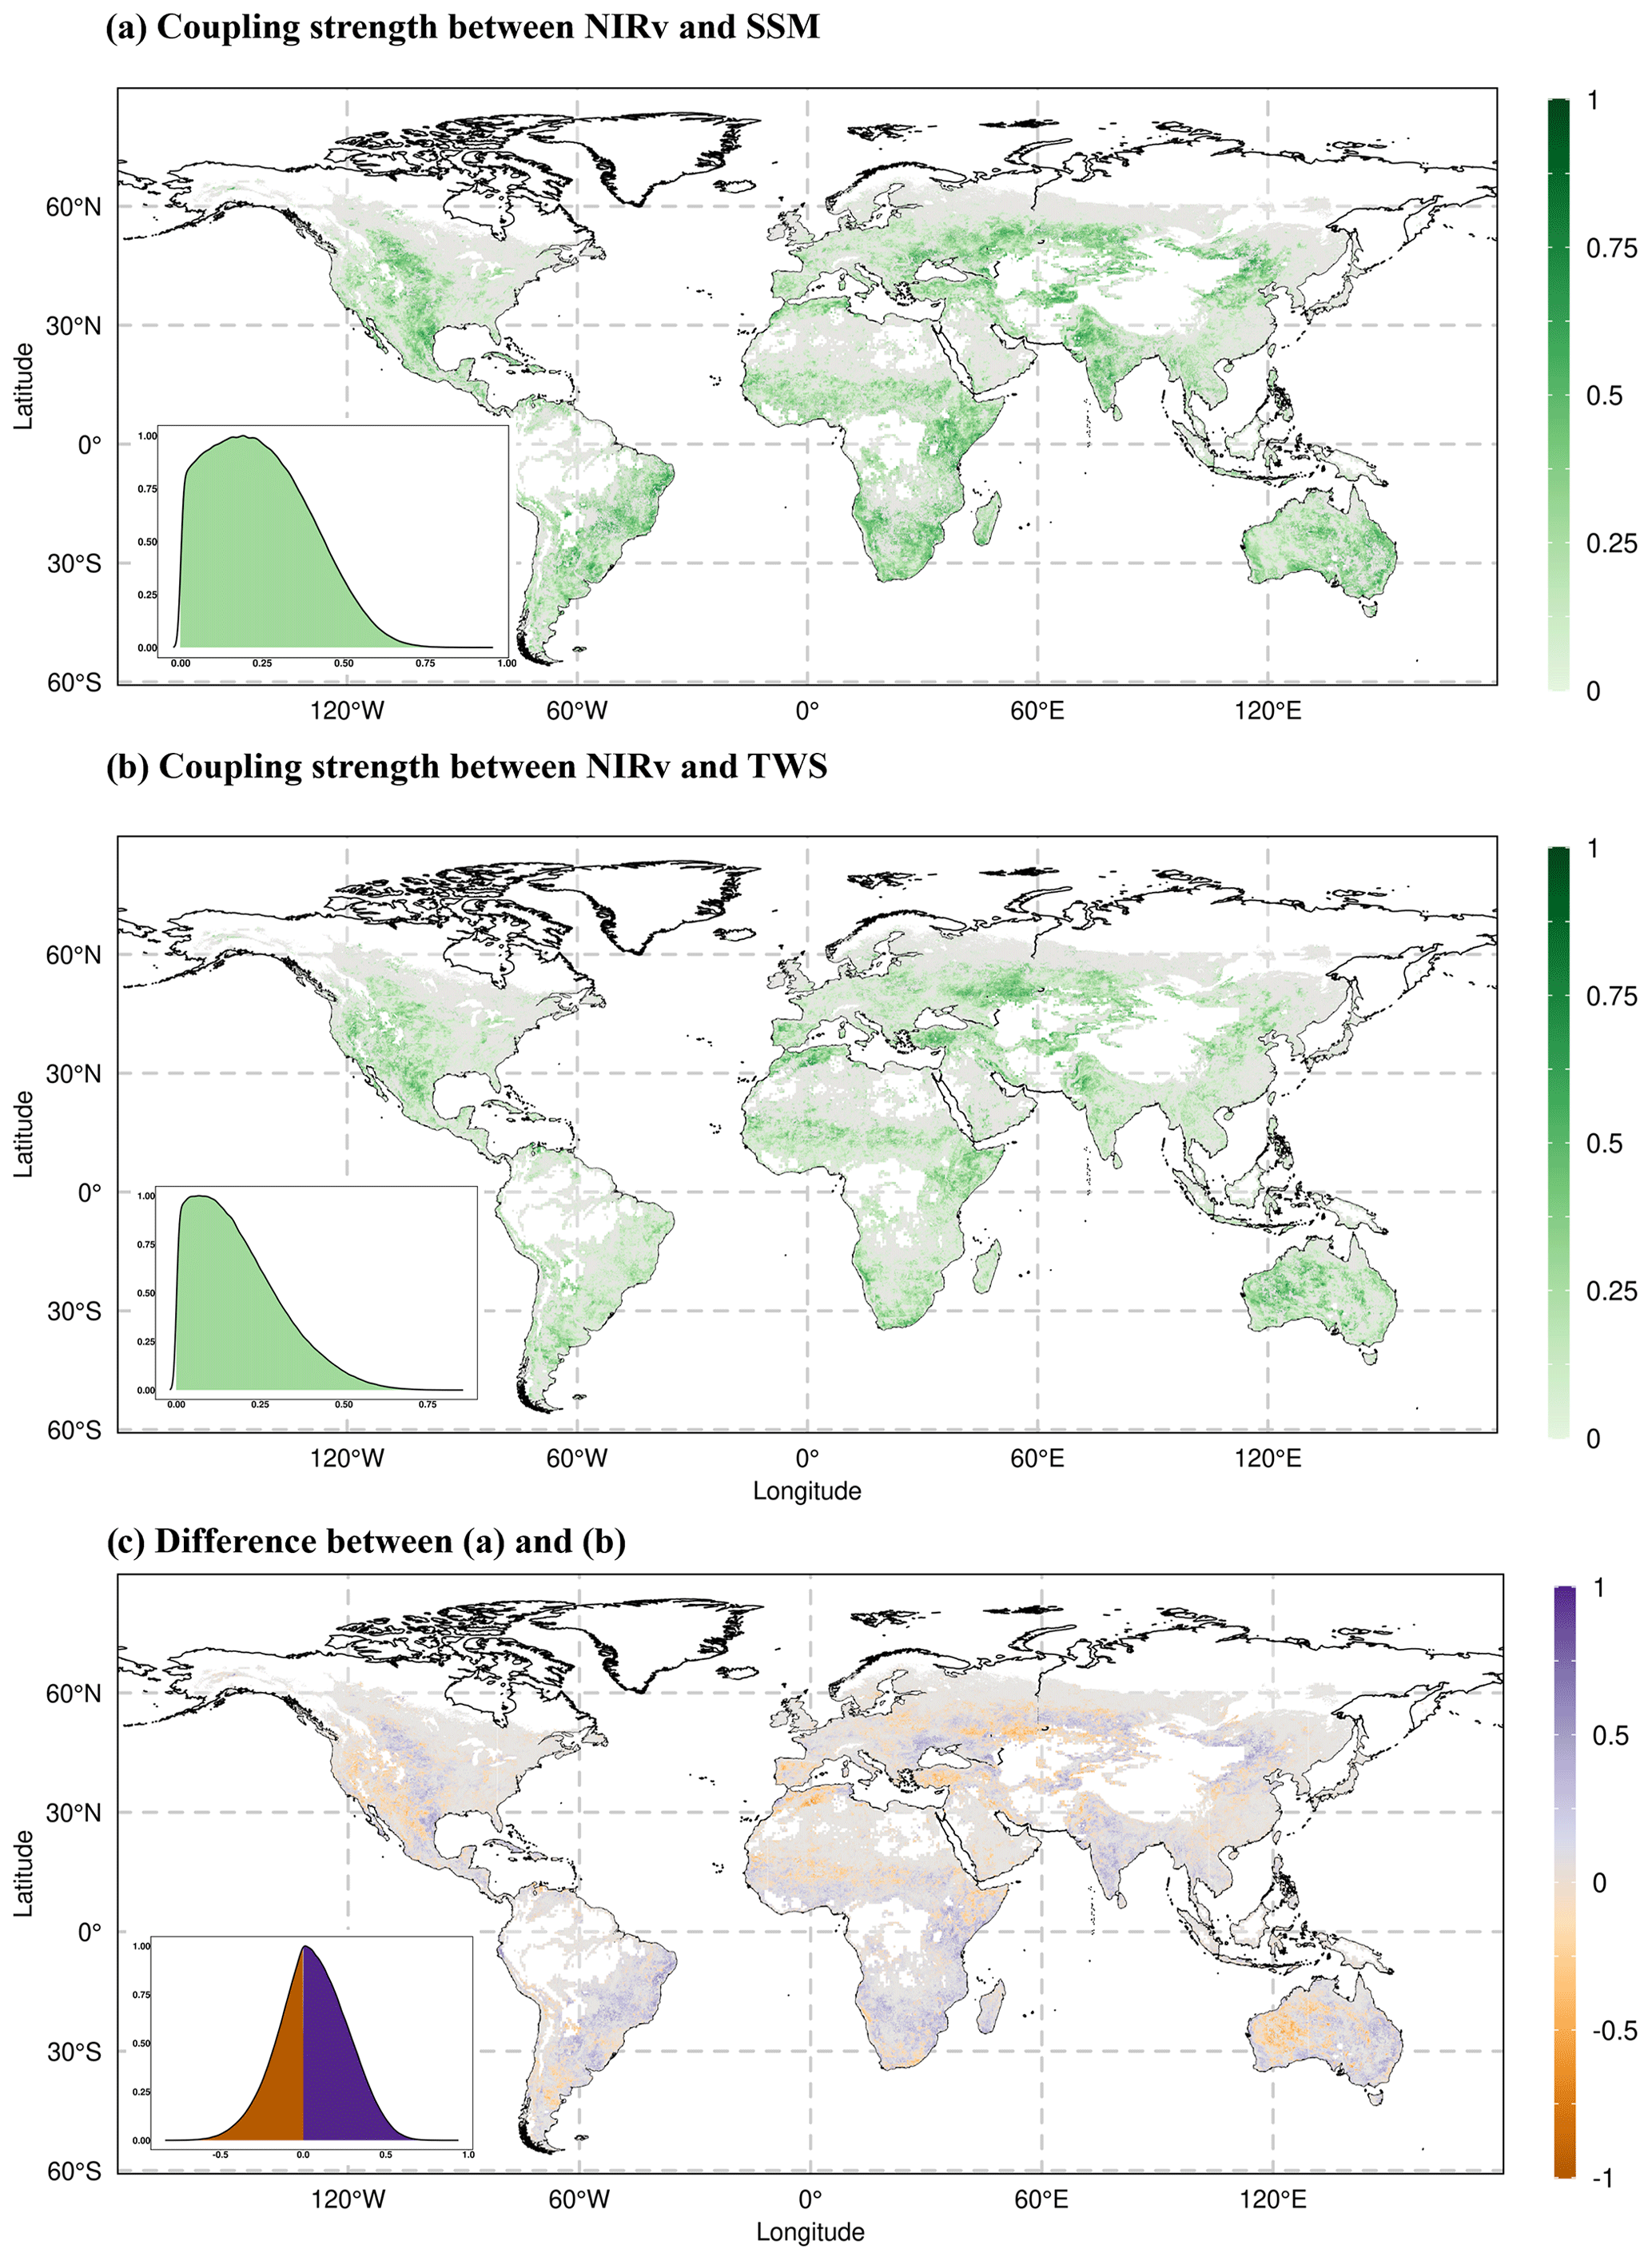
Figure 1Coupling strength between vegetation functioning (NIRv) and (a) near-surface soil moisture (SSM) and (b) total water storage (TWS) during the growing-season months. The color bar denotes the mean partial correlation for each grid cell, computed from the partial correlations across individual bootstrapping samples. Monthly anomalies of all variables are used to calculate the partial correlation. (c) Difference between (a) and (b). The purple color in (c) indicates the greater partial correlation of NIRv with SSM compared to the partial correlation of NIRv with TWS, while the orange color indicates the opposite. Grid cells with positive relationships for both correlations in (a) and (b) are shown in (c) with blueish and orange colors. Light grey color indicates negative partial correlations between NIRv and water storage. The absence of color within the land boundaries signifies inadequate observational data for precise computation of the partial correlation. Each inset in the respective map illustrates the probability distribution function (pdf) of the correlations.
The global correlation of NIRv with TWS follows a similar pattern as with SSM (Fig. 1b) in growing-season months. The correlation of NIRv with TWS is higher in drier central North America and Australia compared to other regions. The similarities in the correlation of NIRv with SSM and TWS are expected because the monthly anomalies of SSM and TWS are highly correlated during growing-season months in most of our study area (Fig. S2).
The differences between the partial correlation of NIRv with SSM and TWS (Fig. 1c) indicate that NIRv correlates more strongly with TWS in western North America, southern Europe, and arid regions of Australia compared to other regions globally during growing-season months. In South America and southern Africa, however, NIRv shows a stronger correlation with SSM. To ensure that the observed patterns of difference in partial correlation between SSM and TWS are not artifacts arising from the computation of differences based on mean partial correlation, we compared the 95 % confidence intervals obtained through bootstrapping. Our results indicate that, for the majority of the considered grid cells, the entire confidence interval of the correlation NIRv ∼ TWS falls outside the bounds of the correlation NIRv ∼ SSM, which indicates that the correlation differences are significant, thus enhancing the robustness of and confidence in our findings (Fig. S4 in the Supplement). Furthermore, even if we control for the effect of soil water storage (SSM or TWS) when computing partial correlation to discern the relative importance for vegetation, it should be noted that the varying noise levels inherent in these datasets might impact our results.
Next, we analyze the partial correlation between NIRv and soil water storage across different aridity and tree-cover-fraction classes during growing-season months. For this, we group the grid cells into different aridity and tree-cover-fraction classes and then apply bootstrapping to compute mean partial correlation and the 95 % confidence interval for each class with more than 1000 grid cells. We find that the partial correlation of NIRv with SSM (Fig. 2a) increases with increasing aridity, for aridity index values 0–4. This can be attributed to the intensification of water stress on vegetation under increasingly arid conditions, resulting in a stronger correlation between NIRv and SSM. However, for a further increase in AI values (4–8), the strength of the correlation between NIRv and SSM declines. This is due to low soil moisture availability and low temporal variability under extremely arid conditions (Fig. S5 in the Supplement). The pattern of increasing correlation along the aridity index is also observed in the partial correlation between NIRv and TWS (Fig. 2b).
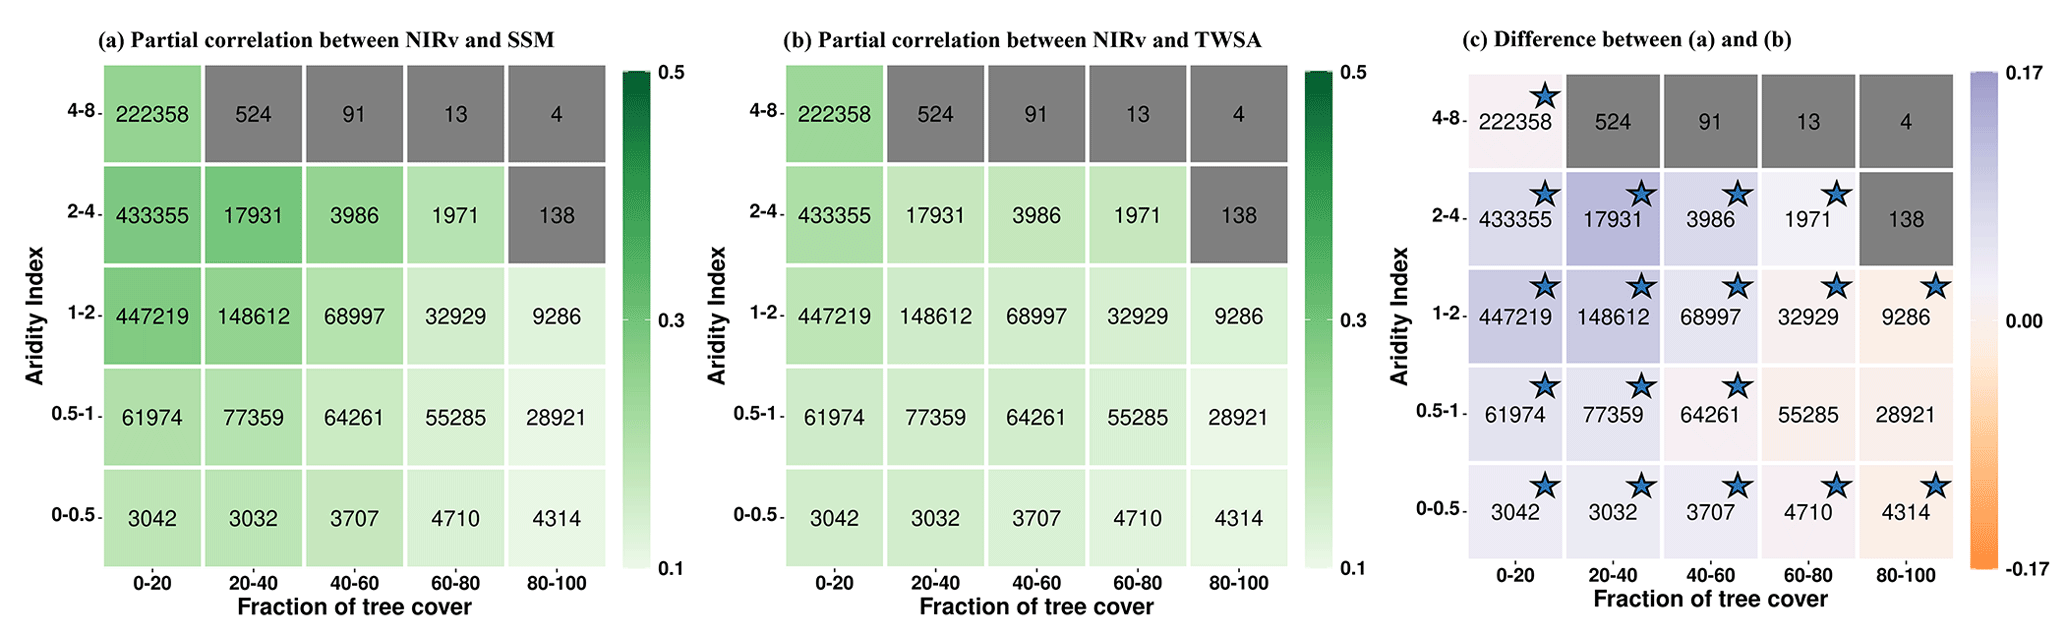
Figure 2Summarizing the coupling strengths of vegetation functioning (NIRv) with (a) near-surface soil moisture (SSM) and (b) terrestrial water storage (TWS) in the growing-season months across climate (aridity index) and vegetation regimes (fraction of tree cover). Panel (c) shows the difference between (a) and (b). Numbers within the boxes denote the number of grid cells for each aridity–tree-cover class. Aridity–tree-cover classes containing fewer than 1000 grid cells are shown in grey. The color bar denotes the mean partial correlation for each class, computed using bootstrapping. The stars in figure (c) signify that the 95 % confidence interval (lower and upper) shares a consistent sign () in the difference in partial correlation. Only grid cells with positive partial correlation are considered.
Furthermore, the correlation of NIRv with SSM decreases for higher tree-cover fractions (Fig. 2a). However, such a gradient along the tree-cover fraction is less pronounced in the partial correlation of NIRv with TWS (Fig. 2b). Overall, this shows that the coupling of vegetation functioning with SSM is generally higher for non-forested areas compared to forested areas, while this gradient is less pronounced in the case of TWS.
Although the difference in inherent noise levels associated with SSM and TWS impacts partial correlation analysis, we can compare the evolution of the gradient along tree cover or aridity index and assert how the relevance of SSM and TWS changes with varying tree cover or aridity index, assuming that the noise levels are similar across varying AI-TC classes. Taking this into account, we find that NIRv correlates more strongly with near-surface soil moisture than with terrestrial water storage in semi-arid regions with low tree cover (Fig. 2c), suggesting that vegetation preferentially takes up water from SSM whenever available to meet its transpiration demand. This might be due to lower energy expenditure of root water uptake, abundant nutrients, and reduced chance of root waterlogging in the near-surface soil moisture (Feldman et al., 2023; Schenk and Jackson, 2002; Tao et al., 2021). Conversely, the correlation between NIRv and TWS in arid areas (AI 4–8) and in regions with a high fraction of tree cover is equivalent to or greater than that of SSM, suggesting that trees can utilize their extensive root systems to access deeper soil moisture, as was also observed in arid vegetation. This is consistent with previous studies reporting that vegetation dependence on sub-surface soil moisture is higher in arid and seasonal-arid climates (Miguez-Macho and Fan, 2021). However, in certain regions with higher tree cover in humid areas, specifically with an AI of 0.5–1, such conclusions cannot be confidently drawn statistically. The reason is that the confidence intervals for the difference in partial correlation of NIRv with SSM and TWS fluctuate between positive values (indicating greater relevance of SSM) and negative values (indicating greater relevance of TWS) (Fig. 2c).
Note that while our analysis focuses on regions with water-controlled vegetation as denoted by positive correlations between NIRv and the soil water storage considered, some of these grid cells are located in comparatively wet climate regimes with aridity index values between 0 and 1 (Fig. 2). This highlights the relevance of non-climatic factors such as soil and vegetation type or topography in determining vegetation–water relationships, in addition to the climate regime. Next to this, in Fig. 2c it seems that the relevance of terrestrial water storage is comparatively higher in wet-climate (aridity 0.5–1) than in transitional-climate regimes (aridity 1–2) as shown by the smaller correlation differences. This, however, is probably not the case and might simply be a reflection of the reduced variability in surface soil moisture (Fig. S5).
3.2 Coupling of vegetation functioning with surface soil moisture and total water storage in dry months
The correlation between NIRv and soil water storage increases during dry months (Fig. 3a and b) compared to growing-season months (Fig. 2a and b). This increase is consistent for both SSM and TWS and across all tree-cover fractions and aridity classes. This is because the water limitation on vegetation increases in dry months and so does the vegetation's sensitivity to moisture. During the dry months, the correlation with near-surface soil moisture tends to rise, but the correlation with terrestrial water storage increases even more significantly (Fig. 3c). This indicates the relevance of deeper water resources during periods of scarce rainfall. The partial correlation maps (Fig. S6 in the Supplement) also reveal that NIRv's correlation with TWS increases more than its correlation with SSM for most grid cells.
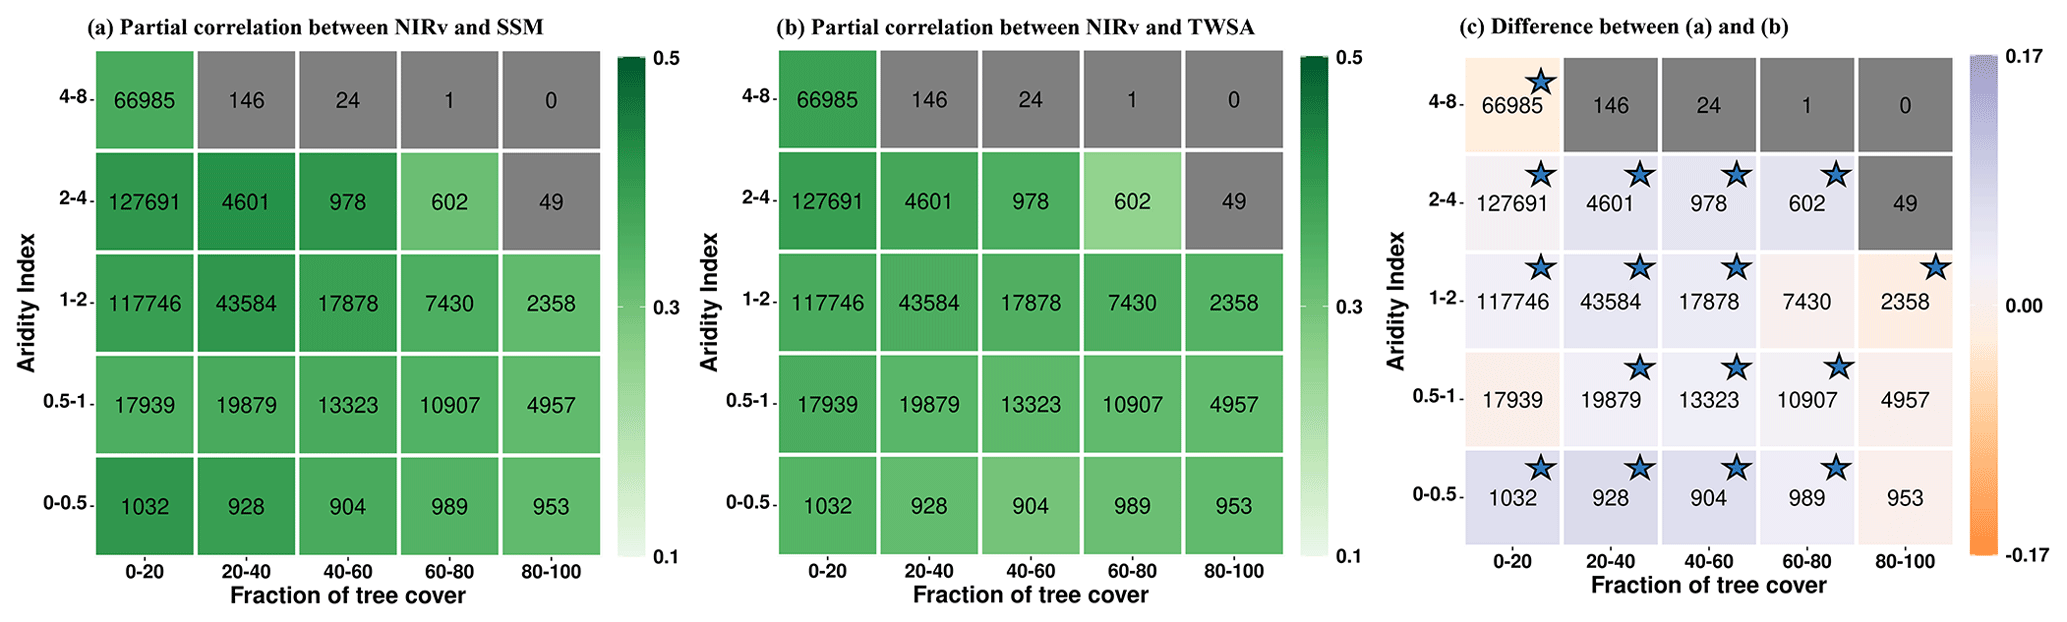
Figure 3Summarizing the coupling strengths of vegetation functioning (NIRv) with (a) near-surface soil moisture (SSM) and (b) terrestrial water storage (TWS) in the driest 10 % of months in each grid cell across climate (aridity index) and vegetation regimes (fraction of tree cover). Panel (c) shows the difference between (a) and (b). Numbers within the boxes denote the number of grid cells for each aridity–tree-cover class. Aridity–tree-cover classes containing fewer than 500 grid cells are shown in grey. The color bar denotes the mean partial correlation for each class, computed using bootstrapping. The stars in figure (c) signify that the 95 % confidence interval (lower and upper) shares a consistent sign () in the difference in partial correlation. Only grid cells with positive partial correlation are considered.
During dry months, the number of analyzed grid cells (Fig. 3) is lower compared to all growing-season months (Fig. 2). We performed a reanalysis of the correlation patterns within aridity–tree-cover classes by selecting only those grid cells that displayed a positive partial correlation between NIRv and soil water storage during both the dry months and the growing-season months. The results demonstrate that the previously observed patterns remain valid, thereby eliminating the impact of the differing numbers of grid cells analyzed (Fig. S7 in the Supplement).
3.3 Climate, vegetation, and topographic controls on the relevance of surface soil moisture vs. total water storage on vegetation
We use a random forest model to understand the spatial variability in the relevance of SSM versus TWS for NIRv. The model was trained with 15 climatic, vegetation, and topographic predictors against the target variable, which is the difference in the partial correlations of NIRv with SSM and TWS during growing-season months (R2=0.59; see methods Sect. 2.2.3). The mean absolute SHAP value plot shows that the tree-cover and the climate variables (mean and standard deviation of Ta) are the most important variables to explain the spatial variability in the relative importance of SSM vs. TWS for vegetation functioning (Fig. 4a). This overall highlights that the relative importance of SSM vs. TWS for vegetation is broadly controlled by vegetation type, reflecting the local adaptation of ecosystem and climate influencing water availability (Stocker et al., 2023).
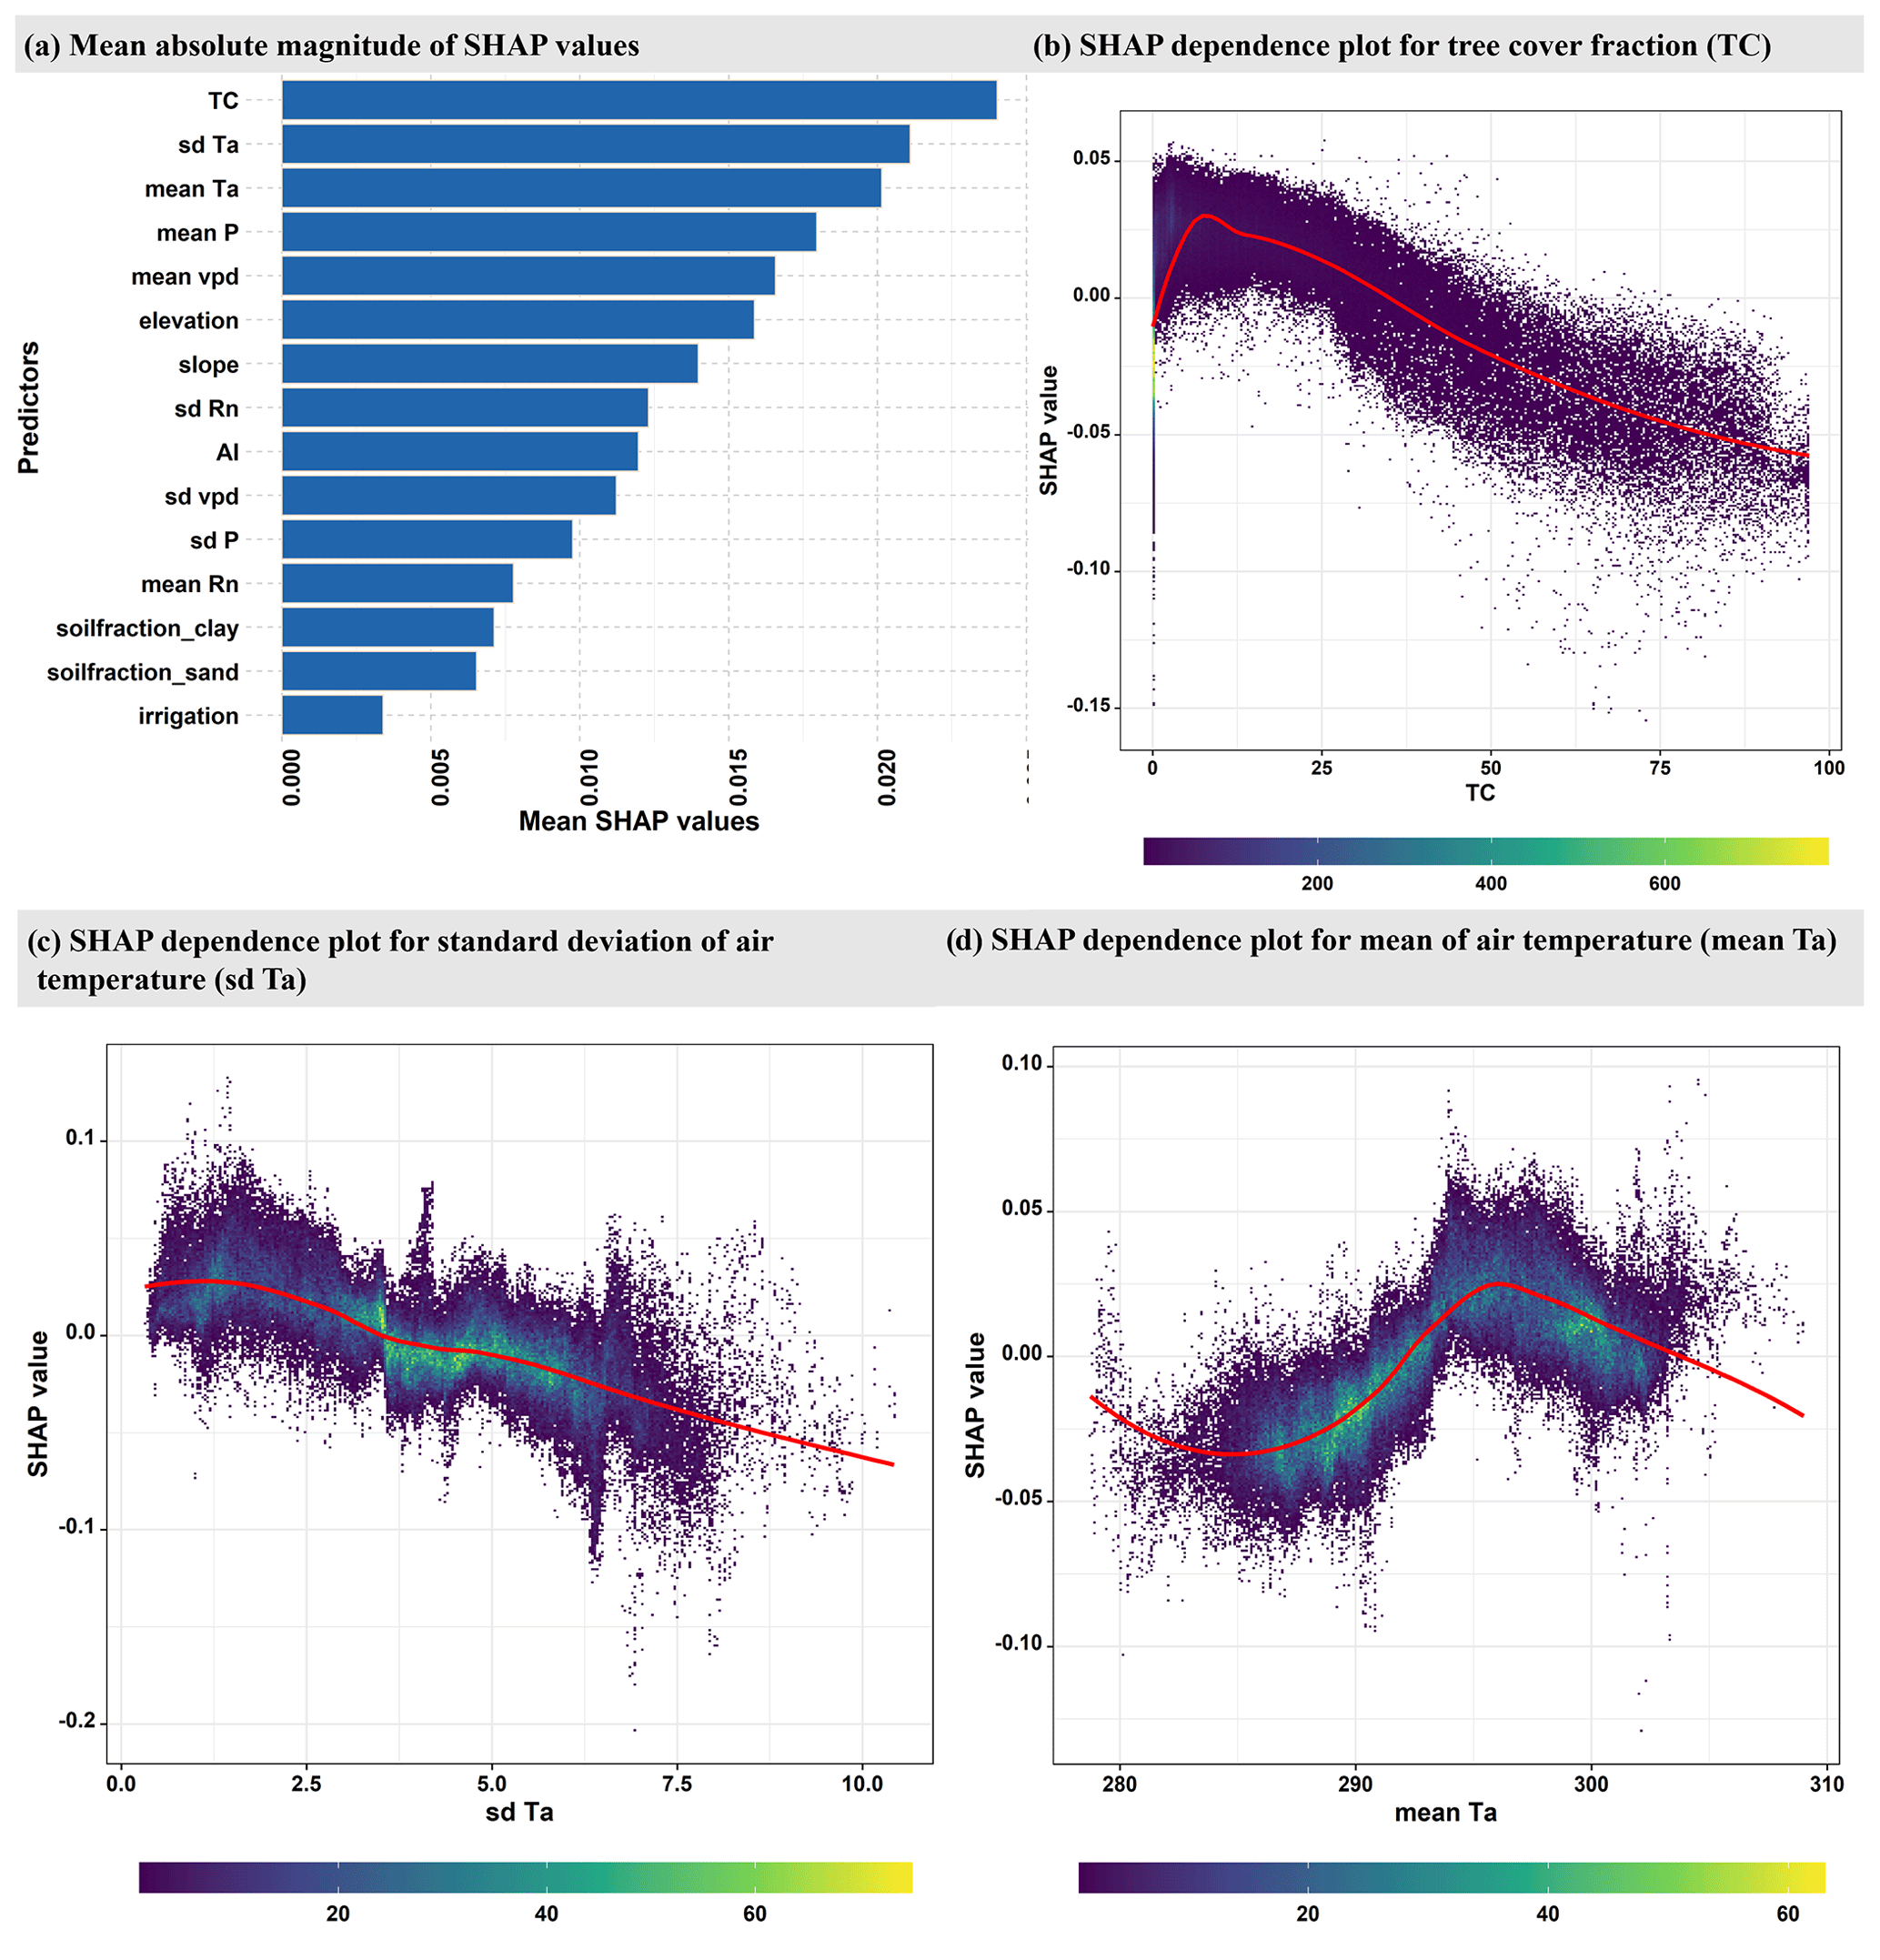
Figure 4(a) Global feature importance based on the mean absolute magnitude of the SHAP values. The higher the mean SHAP values, the greater the predictor's relevance. (b–d) Evaluation of SHAP values (contributions to the correlation difference illustrated in Fig. 1c) against predictor values for the three most relevant predictors: tree-cover fraction (TC), variability in temperature (sd Ta), and mean temperature (mean Ta) during the growing-season months. The color indicates the density of data points. For plotting (b), (c), and (d), only a random 10 % sample of the whole dataset is utilized.
Tree-cover fraction is an important factor in determining the relevance of SSM and TWS for vegetation functioning (Fig. 4b). Regions with high tree cover are more dependent on TWS, as trees generally have deeper root systems that allow them to adjust water uptake between different depths (Tao et al., 2021). Grasslands, on the other hand, have shallow roots that are more susceptible to surface soil moisture variations (Yang et al., 2014).
Similarly, the relative importance of SSM and TWS varies nonlinearly with the mean growing-season temperature (Fig. 4d). TWS tends to be more important for vegetation functioning in areas with low (below approximately 20 °C) or high (above 27 °C) growing-season temperatures, while SSM has greater importance in regions with moderate growing-season air temperatures. One possible explanation for this trend is that high temperatures induce a strong atmospheric water demand that dries near-surface soil layers, which leads vegetation to increase water extraction from deep soil. This observation is further underscored by the analogous pattern observed in the SHAP dependence plot for VPD, which accentuates atmospheric water demand (Fig. S8b in the Supplement). In contrast, SSM is more available during growing-season months in regions characterized by moderate temperatures. We hypothesize that the regions that experience relatively cold growing-season temperatures exhibit stronger temperature and weather variability that may contribute to longer dry periods and, thus, emphasize the importance of deeper soil moisture for vegetation functioning. However, it should be noted that our findings regarding the relevance of TWS at high temperatures must be interpreted with caution due to the exclusion of most tropical forest regions from our analysis (Fig. S9 in the Supplement). As a result, most warm regions are dry, and there are only a few hot and wet regions included in our training data.
Not only the mean of the growing-season temperature, but also its variability is crucial for explaining the significance of SSM and TWS for vegetation functioning (Fig. 4c). Higher temporal variability in temperature increases the importance of TWS for vegetation. This is because atmospheric water demand scales with temperature. Hence, higher variability in temperature implies more peaks in related atmospheric water demand, which is a stronger incentive for plants to access deeper water storage that is more often available to meet the vegetation's transpiration demand.
Figure S8 illustrates the effect of the other six important predictors on the model output. Apart from the climatological parameters (mean P, mean VPD, variability in Rn, and aridity index), elevation and slope explain part of the variability in the relevance of SSM vs. TWS for NIRv. Although the reasons for the increasing relevance of TWS for vegetation functioning at higher elevations remain unclear, they may be due to the strong correlation of elevation with other climatic variables such as Ta and P.
Several local studies identified other relevant factors that determine root water uptake depth, such as forest stand age and tree height, competition, root hydraulic architecture, and tree species (Zhu et al., 2023; Quijano et al., 2012; Stahl et al., 2013; Gessler et al., 2022; Liu et al., 2021). For example, young trees more easily increase their root activity in the shallow or deep soil dependent on soil moisture compared to mature trees (Zhu et al., 2023; Drake et al., 2011). These variables were not included in our attribution analysis because they are not available at a global scale.
3.4 Robustness tests
In the aforementioned analysis, we included grid cells exhibiting both positive partial correlations, whether significant or non-significant. Upon further examination, we specifically assessed the evolution of partial correlation between NIRv and water storage, considering only grid cells with significant partial correlation (p<0.05). The observed patterns along the aridity–tree-cover gradient remained similar during growing-season months. This suggests the robustness of our results to the choice of the statistical significance criterion, albeit with a substantial reduction in the number of globally available grid cells when considering only significant partial correlation (Fig. S10 in the Supplement).
Furthermore, to ensure that our results are robust to variations in the threshold for solar-induced fluorescence (SIF) used to define growing-season months, we conducted additional analyses with a different SIF threshold. Instead of filtering out all months from 2007–2018 when the mean monthly SIF value was below the threshold of 0.2 , we utilized a threshold of 0.5 . Elevating the SIF threshold implies the exclusion of additional months characterized by lower vegetation activity for the partial correlation analysis. However, it is essential to note that this threshold does not seem to affect the number of globally available grid cells during growing-season months, and hence patterns along AI-TC classes are similar. Instead, it specifically influences the selection of dry months and hence the number of grid cells available for the analysis during dry months. Nevertheless, even with the elevated SIF threshold for defining growing-season months, the observed patterns along aridity–tree-cover (AI-TC) classes remain largely consistent with the results obtained in our main analyses (Fig. S11 in the Supplement).
Although NIRv can largely reflect vegetation functioning (Badgley et al., 2017), we repeat our analysis with SIF, which is an alternative, independent indicator for vegetation functioning and shows a near-linear relationship with gross primary productivity at the ecosystem level (Guanter et al., 2012). However, SIF is only available at a coarse resolution of 0.5°. The partial correlations, r(SIF ∼ SSM) and r(SIF ∼ TWS), largely agree with the pattern of r(NIRv ∼ SSM) and r(NIRv ∼ TWS) across varying aridity indices and tree-cover classes (Fig. S12 in the Supplement). This suggests that our overall conclusion as to the relevance of SSM or TWS for vegetation functioning is robust across different indicators of vegetation productivity.
Additionally, we tested whether our results are robust when the aridity index is calculated based on the FAO Penman–Monteith Reference Evapotranspiration equation, for which we applied aridity classification based on Zomer et al. (2007, 2008) guidelines. Our results confirm the findings of Sect. 3.1 and Fig. 2, that as aridity increases, the correlation of NIRv with near-surface soil moisture (SSM) and total water storage (TWS) intensifies. Moreover, in hyper-arid regions (AI<0.03) the correlation with TWS surpasses that with SSM (Fig. S13 in the Supplement). They also confirm that regions with higher tree-cover (TC) fractions correlate more strongly with TWS compared to with SSM. Thus, the choice of aridity index formulation does not alter our main conclusions.
When analyzing partial correlations between total water storage (TWS) and vegetation metrics (NIRv or SIF) at finer resolutions (0.05° for NIRv or 0.5° for SIF), it is crucial to acknowledge the potential emergence of significant spatial autocorrelation. This is attributed to the fact that the actual spatial resolution of the satellite signal underlying the TWS data is 2–3°.
In this study we compare the relevance of near-surface soil moisture and of terrestrial water storage to vegetation functioning across the globe. We find that vegetation preferentially utilizes the water from shallow soil in semi-arid regions and in regions with low tree cover, which is related to the continuous availability of near-surface water and a lack of deep rooting systems, respectively. The stronger correlation of NIRv with SSM than with TWS is supported by site-level studies that find higher root water uptake of surface soil moisture (Brinkmann et al., 2019; Gessler et al., 2022; Deseano Diaz et al., 2023; Kulmatiski and Beard, 2013) when deeper water is also available. Some local studies however find a higher root water uptake from deeper layers (Zhu et al., 2023).
In contrast, in mostly forested regions and in relatively dry climate regimes, the correlation with terrestrial water storage is comparable or higher than with near-surface soil moisture, indicating that trees and vegetation in arid regions use their deep root systems to access deeper soil moisture. Point-scale studies also found a different water uptake depth for trees and grasses, for example, in savanna ecosystems (Kulmatiski et al., 2010), and a different water uptake depth for tree species (Kahmen et al., 2022). Liu et al. (2021) showed, for example, that in a karst forest in southwest China, evergreen species rely mostly on water sources from the 0–30 cm layer, while deciduous species extract most water from the 30–70 cm layer.
We also find that vegetation's preferential water uptake depth changes over time. During particularly dry months, the relative importance of terrestrial water storage is higher, highlighting the importance of deep water resources during periods of low soil water availability. This is in line with previous studies showing changes in vegetation's water uptake depth during drought periods at small spatial scales, where accessing water in deeper soil layers helps plants to alleviate water stress and maintain transpiration (Migliavacca et al., 2009; Tao et al., 2021).
Our global results are supported by site-scale studies that find that during drought the deeper roots play a more active role in water extraction (Stahl et al., 2013; Volkmann et al., 2016; Tao et al., 2021). In some studies, however, the increase in deep water uptake is only relative: the absolute uptake of deep water does not increase, but the uptake of shallow water decreases (Brinkmann et al., 2019; Gessler et al., 2022; Rasmussen et al., 2020; Kühnhammer et al., 2023). This means that the uptake of deeper soil layers cannot compensate for the loss of water uptake from the dry topsoil. Contrary to trees, grasses do not shift their uptake depth (Deseano Diaz et al., 2023) or even extract water from the most shallow soils (Prechsl et al., 2015; Kulmatiski and Beard, 2013).
Furthermore, we show that the spatial variability in the importance of near-surface soil moisture vs. terrestrial water storage for vegetation functioning is influenced by the fraction of tree cover and mean and standard deviation of air temperature. This emphasizes the role of climate in determining shallow- vs. deep-soil water resources and the role of vegetation in adapting to different soil water availability patterns.
Vegetation functioning and soil water storage are generally coupled in both directions; i.e., while soil moisture availability affects vegetation functioning (positive coupling), this in turn also affects soil moisture through transpiration (negative coupling). As our study focuses on water-controlled vegetation, we only consider positive couplings and filter out grid cells with negative correlations. Future research may consider the relevance of soil moisture across depths for the negative coupling regions.
Overall, our analysis illustrates that satellite-based data can be used for belowground analysis at large spatial scales, thanks to the fact that satellite retrievals can assess soil water storage dynamics across depths and because vegetation in water-controlled areas can be used as an indicator of soil water dynamics. Such novel ways to improve our understanding of belowground water dynamics are necessary and valuable, as in situ observations are scarce and of limited representativeness for larger areas, particularly given the typical spatial heterogeneity of soils and vegetation. Our results can further inform a better representation of belowground processes in global models in order to support more accurate projections of future changes in climate, water resources, and ecosystem services.
Monthly SIF data are available from https://www.gfz-potsdam.de/sektion/fernerkundung-und-geoinformatik/projekte/global-monitoring-of-vegetation-fluorescence-globfluo/daten (Köhler et al., 2015). NIRv was calculated from the red and near-infrared reflectance obtained from the MOD13C1 v006 product (https://doi.org/10.5067/MODIS/MOD13C1.061, Didan, 2021). ESA-CCI soil moisture data can be accessed at http://catalogue.ceda.ac.uk/uuid/ff890589c21f4033803aa550f52c980c (Dorigo et al., 2023), and Terrestrial Water Storage Anomaly data can be accessed at https://doi.org/10.5067/TEMSC-3MJC6 (Wiese et al., 2018). The ERA5 climate variables are available at https://doi.org/10.24381/cds.e2161bac (Muñoz Sabater, 2019). Tree-cover fraction data are available from the AVHRR vegetation continuous fields products at https://doi.org/10.5067/MEaSUREs/VCF/VCF5KYR.001 (Hansen and Song, 2018), land-cover data are available at https://www.esa-landcover-cci.org/ (ESA, 2017), and topographic data are available at https://www.earthenv.org/topography (Amatulli et al., 2018). Similarly, the irrigation fraction data can be accessed at https://doi.org/10.13019/M20599 (Siebert et al., 2015).
The supplement related to this article is available online at: https://doi.org/10.5194/bg-21-1533-2024-supplement.
RO initialized the study. PK carried out the analyses and created the figures in close consultation with RO, TS, and AJHVD, and PK wrote the manuscript. All authors contributed to the discussion and writing of the final version of the paper.
The contact author has declared that none of the authors has any competing interests.
Publisher's note: Copernicus Publications remains neutral with regard to jurisdictional claims made in the text, published maps, institutional affiliations, or any other geographical representation in this paper. While Copernicus Publications makes every effort to include appropriate place names, the final responsibility lies with the authors.
The authors thank Ulrich Weber for help obtaining and processing the data, Sujan Koirala for valuable scientific and technical support, and the Hydrology–Biosphere–Climate Interactions group at the Max Planck Institute for Biogeochemistry for fruitful discussions.
Prajwal Khanal, Anne J. Hoek Van Dijke, and Rene Orth received funding by the German Research Foundation (Emmy Noether grant no. 391059971).
The article processing charges for this open-access publication were covered by the Max Planck Society.
This paper was edited by Paul Stoy and reviewed by Andrew Feldman and one anonymous referee.
Amatulli, G., Domisch, S., Tuanmu, M.-N., Parmentier, B., Ranipeta, A., Malczyk, J., and Jetz, W.: A suite of global, cross-scale topographic variables for environmental and biodiversity modeling, Sci. Data, 5, 180040, https://doi.org/10.1038/sdata.2018.40, 2018 (data available at: https://www.earthenv.org/topography, last access: 18 March 2024).
Badgley, G., Field, C. B., and Berry, J. A.: Canopy near-infrared reflectance and terrestrial photosynthesis, Sci. Adv., 3, e1602244, https://doi.org/10.1126/sciadv.1602244, 2017.
Breiman, L.: Random Forests, Mach. Learn., 45, 5–32, https://doi.org/10.1023/A:1010933404324, 2001.
Brinkmann, N., Eugster, W., Buchmann, N., and Kahmen, A.: Species-specific differences in water uptake depth of mature temperate trees vary with water availability in the soil, Plant Biol. J., 21, 71–81, https://doi.org/10.1111/plb.12907, 2019.
Budyko, M. I.: Climate and life, Academic press, ISBN 0121394506, 1974.
Chen, T. and Guestrin, C.: XGBoost: A Scalable Tree Boosting System, in: Proceedings of the 22nd ACM SIGKDD International Conference on Knowledge Discovery and Data Mining, KDD '16: The 22nd ACM SIGKDD International Conference on Knowledge Discovery and Data Mining, San Francisco, California, USA, 13 August 2016, 785–794, https://doi.org/10.1145/2939672.2939785, 2016.
Cooley, S. W., Ryan, J. C., and Smith, L. C.: Human alteration of global surface water storage variability, Nature, 591, 78–81, https://doi.org/10.1038/s41586-021-03262-3, 2021.
Denissen, J. M. C., Teuling, A. J., Pitman, A. J., Koirala, S., Migliavacca, M., Li, W., Reichstein, M., Winkler, A. J., Zhan, C., and Orth, R.: Widespread shift from ecosystem energy to water limitation with climate change, Nat. Clim. Change, 12, 677–684, https://doi.org/10.1038/s41558-022-01403-8, 2022.
Deseano Diaz, P. A., van Dusschoten, D., Kübert, A., Javaux, M., Merz, S., Vanderborght, J., Vereecken, H., Dubbert, M., and Rothfuss, Y.: Response of a grassland species to dry environmental conditions from water stable isotopic monitoring: no evident shift in root water uptake to wetter soil layers, Plant Soil, 482, 491–512, https://doi.org/10.1007/s11104-022-05703-y, 2023.
Didan, K.: MODIS/Terra Vegetation Indices 16-Day L3 Global 0.05Deg CMG V061, NASA EOSDIS Land Processes Distributed Active Archive Center [data set], https://doi.org/10.5067/MODIS/MOD13C1.061, 2021.
Dorigo, W., Wagner, W., Albergel, C., Albrecht, F., Balsamo, G., Brocca, L., Chung, D., Ertl, M., Forkel, M., Gruber, A., Haas, E., Hamer, P. D., Hirschi, M., Ikonen, J., de Jeu, R., Kidd, R., Lahoz, W., Liu, Y. Y., Miralles, D., Mistelbauer, T., Nicolai-Shaw, N., Parinussa, R., Pratola, C., Reimer, C., van der Schalie, R., Seneviratne, S. I., Smolander, T., and Lecomte, P.: ESA CCI Soil Moisture for improved Earth system understanding: State-of-the art and future directions, Remote Sens. Environ., 203, 185–215, 2017.
Dorigo, W., Preimesberger, W., Hahn, S., Van der Schalie, R., De Jeu, R., Kidd, R., Rodriguez-Fernandez, N., Hirschi, M., Stradiotti, P., Frederikse, T., Gruber, A., and Madelon, R.: ESA Soil Moisture Climate Change Initiative (Soil_Moisture_cci): Version 08.1 data collection, NERC EDS Centre for Environmental Data Analysis [data set], http://catalogue.ceda.ac.uk/uuid/ff890589c21f4033803aa550f52c980c (last access: 11 March 2024), 2023.
Drake, P. L., Froend, R. H., and Franks, P. J.: Linking hydraulic conductivity and photosynthesis to water-source partitioning in trees versus seedlings, Tree Physiol., 31, 763–773, https://doi.org/10.1093/treephys/tpr068, 2011.
ESA: Land Cover CCI Product User Guide Version 2, Tech. Rep., https://maps.elie.ucl.ac.be/CCI/viewer/download/ESACCI-LC-Ph2-PUGv2_2.0.pdf (last access: 15 March 2024), 2017 (data available at: https://www.esa-landcover-cci.org/, last access: 18 March 2024).
Fan, Y., Miguez-Macho, G., Jobbágy, E. G., Jackson, R. B., and Otero-Casal, C.: Hydrologic regulation of plant rooting depth, P. Natl. Acad. Sci. USA, 114, 10572–10577, https://doi.org/10.1073/pnas.1712381114, 2017.
Feldman, A. F., Short Gianotti, D. J., Dong, J., Akbar, R., Crow, W. T., McColl, K. A., Konings, A. G., Nippert, J. B., Tumber-Dávila, S. J., Holbrook, N. M., Rockwell, F. E., Scott, R. L., Reichle, R. H., Chatterjee, A., Joiner, J., Poulter, B., and Entekhabi, D.: Remotely Sensed Soil Moisture Can Capture Dynamics Relevant to Plant Water Uptake, Water Resour. Res., 59, e2022WR033814, https://doi.org/10.1029/2022WR033814, 2023.
Gessler, A., Bächli, L., Rouholahnejad Freund, E., Treydte, K., Schaub, M., Haeni, M., Weiler, M., Seeger, S., Marshall, J., Hug, C., Zweifel, R., Hagedorn, F., Rigling, A., Saurer, M., and Meusburger, K.: Drought reduces water uptake in beech from the drying topsoil, but no compensatory uptake occurs from deeper soil layers, New Phytol., 233, 194–206, https://doi.org/10.1111/nph.17767, 2022.
Guanter, L., Frankenberg, C., Dudhia, A., Lewis, P. E., Gómez-Dans, J., Kuze, A., Suto, H., and Grainger, R. G.: Retrieval and global assessment of terrestrial chlorophyll fluorescence from GOSAT space measurements, Remote Sens. Environ., 121, 236–251, https://doi.org/10.1016/j.rse.2012.02.006, 2012.
Hansen, M. and Song, X.: Vegetation Continuous Fields (VCF) Yearly Global 0.05 Deg, NASA EOSDIS Land Processes Distributed Active Archive Center [data set], https://doi.org/10.5067/MEaSUREs/VCF/VCF5KYR.001, 2018.
Hersbach, H., Bell, B., Berrisford, P., Hirahara, S., Horányi, A., Muñoz-Sabater, J., Nicolas, J., Peubey, C., Radu, R., Schepers, D., Simmons, A., Soci, C., Abdalla, S., Abellan, X., Balsamo, G., Bechtold, P., Biavati, G., Bidlot, J., Bonavita, M., De Chiara, G., Dahlgren, P., Dee, D., Diamantakis, M., Dragani, R., Flemming, J., Forbes, R., Fuentes, M., Geer, A., Haimberger, L., Healy, S., Hogan, R. J., Hólm, E., Janisková, M., Keeley, S., Laloyaux, P., Lopez, P., Lupu, C., Radnoti, G., de Rosnay, P., Rozum, I., Vamborg, F., Villaume, S., and Thépaut, J.-N.: The ERA5 global reanalysis, Q. J. Roy. Meteor. Soc., 146, 1999–2049, https://doi.org/10.1002/qj.3803, 2020.
Humphrey, V., Zscheischler, J., Ciais, P., Gudmundsson, L., Sitch, S., and Seneviratne, S. I.: Sensitivity of atmospheric CO2 growth rate to observed changes in terrestrial water storage, Nature, 560, 628–631, https://doi.org/10.1038/s41586-018-0424-4, 2018.
Kahmen, A., Basler, D., Hoch, G., Link, R. M., Schuldt, B., Zahnd, C., and Arend, M.: Root water uptake depth determines the hydraulic vulnerability of temperate European tree species during the extreme 2018 drought, Plant Biol. J., 24, 1224–1239, https://doi.org/10.1111/plb.13476, 2022.
Keenan, T. F. and Williams, C. A.: The Terrestrial Carbon Sink, Annu. Rev. Env. Resour., 43, 219–243, https://doi.org/10.1146/annurev-environ-102017-030204, 2018.
Köhler, P., Guanter, L., and Joiner, J.: A linear method for the retrieval of sun-induced chlorophyll fluorescence from GOME-2 and SCIAMACHY data, Atmos. Meas. Tech., 8, 2589–2608, https://doi.org/10.5194/amt-8-2589-2015, 2015 (data available at: https://www.gfz-potsdam.de/sektion/fernerkundung-und-geoinformatik/projekte/global-monitoring-of-vegetation-fluorescence-globfluo/daten, last access: 15 March 2024).
Koster, R. D., Guo, Z., Yang, R., Dirmeyer, P. A., Mitchell, K., and Puma, M. J.: On the nature of soil moisture in land surface models, J. Climate, 22, 4322–4335, https://doi.org/10.1175/2009JCLI2832.1, 2009.
Kühnhammer, K., Van Haren, J., Kübert, A., Bailey, K., Dubbert, M., Hu, J., Ladd, S. N., Meredith, L. K., Werner, C., and Beyer, M.: Deep roots mitigate drought impacts on tropical trees despite limited quantitative contribution to transpiration, Sci. Total Environ., 893, 164763, https://doi.org/10.1016/j.scitotenv.2023.164763, 2023.
Kulmatiski, A. and Beard, K. H.: Root niche partitioning among grasses, saplings, and trees measured using a tracer technique, Oecologia, 171, 25–37, https://doi.org/10.1007/s00442-012-2390-0, 2013.
Kulmatiski, A., Beard, K. H., Verweij, R. J. T., and February, E. C.: A depth-controlled tracer technique measures vertical, horizontal and temporal patterns of water use by trees and grasses in a subtropical savanna, New Phytol., 188, 199–209, https://doi.org/10.1111/j.1469-8137.2010.03338.x, 2010.
Landerer, F. W. and Swenson, S. C.: Accuracy of scaled GRACE terrestrial water storage estimates, Water Resour. Res., 48, W04531, https://doi.org/10.1029/2011WR011453, 2012.
Li, W., Migliavacca, M., Forkel, M., Walther, S., Reichstein, M., and Orth, R.: Revisiting Global Vegetation Controls Using Multi-Layer Soil Moisture, Geophys. Res. Lett., 48, e2021GL092856, https://doi.org/10.1029/2021GL092856, 2021.
Li, W., Migliavacca, M., Forkel, M., Denissen, J. M. C., Reichstein, M., Yang, H., Duveiller, G., Weber, U., and Orth, R.: Widespread increasing vegetation sensitivity to soil moisture, Nat. Commun., 13, 3959, https://doi.org/10.1038/s41467-022-31667-9, 2022.
Liu, W., Chen, H., Zou, Q., and Nie, Y.: Divergent root water uptake depth and coordinated hydraulic traits among typical karst plantations of subtropical China: Implication for plant water adaptation under precipitation changes, Agr. Water Manage., 249, 106798, https://doi.org/10.1016/j.agwat.2021.106798, 2021.
Lundberg, S. M., Erion, G., Chen, H., DeGrave, A., Prutkin, J. M., Nair, B., Katz, R., Himmelfarb, J., Bansal, N., and Lee, S.-I.: From local explanations to global understanding with explainable AI for trees, Nat. Mach. Intell., 2, 56–67, https://doi.org/10.1038/s42256-019-0138-9, 2020.
Migliavacca, M., Meroni, M., Manca, G., Matteucci, G., Montagnani, L., Grassi, G., Zenone, T., Teobaldelli, M., Goded, I., Colombo, R., and Seufert, G.: Seasonal and interannual patterns of carbon and water fluxes of a poplar plantation under peculiar eco-climatic conditions, Agr. Forest Meteorol., 149, 1460–1476, https://doi.org/10.1016/j.agrformet.2009.04.003, 2009.
Miguez-Macho, G. and Fan, Y.: Spatiotemporal origin of soil water taken up by vegetation, Nature, 598, 624–628, https://doi.org/10.1038/s41586-021-03958-6, 2021.
Mohammed, G. H., Colombo, R., Middleton, E. M., Rascher, U., van der Tol, C., Nedbal, L., Goulas, Y., Pérez-Priego, O., Damm, A., Meroni, M., Joiner, J., Cogliati, S., Verhoef, W., Malenovský, Z., Gastellu-Etchegorry, J.-P., Miller, J. R., Guanter, L., Moreno, J., Moya, I., Berry, J. A., Frankenberg, C., and Zarco-Tejada, P. J.: Remote sensing of solar-induced chlorophyll fluorescence (SIF) in vegetation: 50 years of progress, Remote Sens. Environ., 231, 111177, https://doi.org/10.1016/j.rse.2019.04.030, 2019.
Ohta, T., Kotani, A., Iijima, Y., Maximov, T. C., Ito, S., Hanamura, M., Kononov, A. V., and Maximov, A. P.: Effects of waterlogging on water and carbon dioxide fluxes and environmental variables in a Siberian larch forest, 1998–2011, Agr. Forest Meteorol., 188, 64–75, https://doi.org/10.1016/j.agrformet.2013.12.012, 2014.
Muñoz Sabater, J.: ERA5-Land hourly data from 1950 to present, Copernicus Climate Change Service (C3S) Climate Data Store (CDS) [data set], https://doi.org/10.24381/cds.e2161bac, 2019.
Orth, R.: When the Land Surface Shifts Gears, AGU Advances, 2, e2021AV000414, https://doi.org/10.1029/2021AV000414, 2021.
Prechsl, U. E., Burri, S., Gilgen, A. K., Kahmen, A., and Buchmann, N.: No shift to a deeper water uptake depth in response to summer drought of two lowland and sub-alpine C3-grasslands in Switzerland, Oecologia, 177, 97–111, https://doi.org/10.1007/s00442-014-3092-6, 2015.
Quijano, J. C., Kumar, P., Drewry, D. T., Goldstein, A., and Misson, L.: Competitive and mutualistic dependencies in multispecies vegetation dynamics enabled by hydraulic redistribution, Water Resour. Res., 48, 2011WR011416, https://doi.org/10.1029/2011WR011416, 2012.
Qiu, R., Li, X., Han, G., Xiao, J., Ma, X., and Gong, W.: Monitoring drought impacts on crop productivity of the U. S. Midwest with solar-induced fluorescence: GOSIF outperforms GOME-2 SIF and MODIS NDVI, EVI, and NIRv, Agr. Forest Meteorol., 323, 109038, https://doi.org/10.1016/j.agrformet.2022.109038, 2022.
Rasmussen, C. R., Thorup-Kristensen, K., and Dresbøll, D. B.: Uptake of subsoil water below 2 m fails to alleviate drought response in deep-rooted Chicory (Cichorium intybus L.), Plant Soil, 446, 275–290 https://doi.org/10.1007/s11104-019-04349-7, 2020.
Reynolds, C. A., Jackson, T. J., and Rawls, W. J.: Estimating soil water-holding capacities by linking the Food and Agriculture Organization Soil map of the world with global pedon databases and continuous pedotransfer functions, Water Resour. Res., 36, 3653–3662, https://doi.org/10.1029/2000WR900130, 2000.
Rodell, M. and Famiglietti, J. S.: An analysis of terrestrial water storage variations in Illinois with implications for the Gravity Recovery and Climate Experiment (GRACE), Water Resour. Res., 37, 1327–1339, https://doi.org/10.1029/2000WR900306, 2001.
Schenk, H. J. and Jackson, R. B.: Rooting depths, lateral root spreads and below-ground/above-ground allometries of plants in water-limited ecosystems, J. Ecol., 90, 480–494, https://doi.org/10.1046/j.1365-2745.2002.00682.x, 2002.
Seneviratne, S. I., Corti, T., Davin, E. L., Hirschi, M., Jaeger, E. B., Lehner, I., Orlowsky, B., and Teuling, A. J.: Investigating soil moisture-climate interactions in a changing climate: A review, Earth-Sci. Rev., 99, 125–161, https://doi.org/10.1016/j.earscirev.2010.02.004, 2010.
Siebert, S., Kummu, M., Porkka, M., Döll, P., Ramankutty, N., and Scanlon, B. R.: Historical Irrigation Dataset (HID), MyGeoHUB [data set], https://doi.org/10.13019/M20599, 2015.
Stahl, C., Hérault, B., Rossi, V., Burban, B., Bréchet, C., and Bonal, D.: Depth of soil water uptake by tropical rainforest trees during dry periods: does tree dimension matter?, Oecologia, 173, 1191–1201, https://doi.org/10.1007/s00442-013-2724-6, 2013.
Stocker, B. D., Tumber-Dávila, S. J., Konings, A. G., Anderson, M. C., Hain, C., and Jackson, R. B.: Global patterns of water storage in the rooting zones of vegetation, Nat. Geosci., 16, 250–256, https://doi.org/10.1038/s41561-023-01125-2, 2023.
Strassberg, G., Scanlon, B. R., and Rodell, M.: Comparison of seasonal terrestrial water storage variations from GRACE with groundwater-level measurements from the High Plains Aquifer (USA), Geophys. Res. Lett., 34, 2007GL030139, https://doi.org/10.1029/2007GL030139, 2007.
Tao, Z., Neil, E., and Si, B.: Determining deep root water uptake patterns with tree age in the Chinese loess area, Agr. Water Manage., 249, 106810, https://doi.org/10.1016/j.agwat.2021.106810, 2021.
Teuling, A. J., Hirschi, M., Ohmura, A., Wild, M., Reichstein, M., Ciais, P., Buchmann, N., Ammann, C., Montagnani, L., Richardson, A. D., Wohlfahrt, G., and Seneviratne, S. I.: A regional perspective on trends in continental evaporation, Geophys. Res. Lett., 36, L02404, https://doi.org/10.1029/2008GL036584, 2009.
Volkmann, T. H. M., Haberer, K., Gessler, A., and Weiler, M.: High-resolution isotope measurements resolve rapid ecohydrological dynamics at the soil–plant interface, New Phytol., 210, 839–849, https://doi.org/10.1111/nph.13868, 2016.
Watkins, M. M., Wiese, D. N., Yuan, D., Boening, C., and Landerer, F. W.: Improved methods for observing Earth's time variable mass distribution with GRACE using spherical cap mascons, J. Geophys. Res.-Sol. Ea., 120, 2648–2671, https://doi.org/10.1002/2014JB011547, 2015.
Wiese, D. N., Yuan, D.-N., Boening, C., Landerer, F. W., and Watkins, M. M.: JPL GRACE Mascon Ocean, Ice, and Hydrology Equivalent Water Height Release 06 Coastal Resolution Improvement (CRI) Filtered Version 1.0. Ver. 1.0, PO.DAAC, CA, USA [data set], https://doi.org/10.5067/TEMSC-3MJC6, 2018.
Xie, X., He, B., Guo, L., Miao, C., and Zhang, Y.: Detecting hotspots of interactions between vegetation greenness and terrestrial water storage using satellite observations, Remote Sens. Environ., 231, 111259, https://doi.org/10.1016/j.rse.2019.111259, 2019.
Yang, Y., Long, D., Guan, H., Scanlon, B. R., Simmons, C. T., Jiang, L., and Xu, X.: GRACE satellite observed hydrological controls on interannual and seasonal variability in surface greenness over mainland Australia, J. Geophys. Res.-Biogeo., 119, 2245–2260, https://doi.org/10.1002/2014JG002670, 2014.
Zheng, C. and Jia, L.: Global canopy rainfall interception loss derived from satellite earth observations, Ecohydrology, 13, e2186, https://doi.org/10.1002/eco.2186, 2020.
Zhu, W., Zhou, O., Sun, Y., Li, X., Di, N., Li, D., Yilihamu, G., Wang, Y., Fu, J., Xi, B., and Jia, L.: Effects of stand age and structure on root distribution and root water uptake in fast-growing poplar plantations, J. Hydrol., 616, 128831, https://doi.org/10.1016/j.jhydrol.2022.128831, 2023.
Zomer, R. J., Bossio, D. A., Trabucco, A., Yuanjie, L., Gupta, D. C., and Singh, V. P.: Trees and Water: Smallholder Agroforestry on Irrigated Lands in Northern India, IWMI Research Report 122, International Water Management Institute, Colombo, Sri Lanka, 45 pp., http://data.sasscal.org/metadata/view.php?view=geodata&id=308 (last access: 15 March 2024), 2007.
Zomer, R. J., Trabucco, A., Bossio, D. A., van Straaten, O., and Verchot, L. V.: Climate Change Mitigation: A Spatial Analysis of Global Land Suitability for Clean Development Mechanism Afforestation and Reforestation. Agric. Ecosystems and Envir. 126, 67–80, 2008.
Zomer, R. J., Xu, J., and Trabucco, A.: Version 3 of the Global Aridity Index and Potential Evapotranspiration Database, Sci. Data, 9, 409, https://doi.org/10.1038/s41597-022-01493-1, 2022.