the Creative Commons Attribution 4.0 License.
the Creative Commons Attribution 4.0 License.
 | 08 Apr 2024
The calcitic test growth rate of Spirillina vivipara (Foraminifera)
Katsuyuki Uematsu
Briony Mamo
Takashi Toyofuku
Foraminifera encompass vastly differing morphologies, ecological preferences, and elemental/isotopic test compositions. The calcification mechanism is completely unknown for some wall-type taxa and might be different from that of well-studied groups. This study aims to understand the test growth and determine the calcification rate of Spirillina vivipara Ehrenberg, 1843 (order Spirillinida) and to compare them to other foraminiferal species. Spirillinids have a closely coiled spiral chamber like a tube, yet their calcitic microstructure is unique amongst foraminifera. Calcification observations in S. vivipara facilitate the estimation of carbonate precipitation rates during active test growth, which are revealed to be independent of the individual's size. Spirillina vivipara grows its test in response to food availability, suggesting that calcification directly corresponds to cell growth. Time-lapse observations of S. vivipara indicate continuous growth, suggesting active growth phases interspersed with resting periods, hinting at potential biological rhythms in the growth and calcification process. We also implemented a 24 h observation period using calcein staining, showing calcite precipitation rates of 8.08 µm h−1, which corresponds to approximately 364 nmol cm−2 min−1 (i.e., 36.4 mg cm−2 min−1). These rates are higher than those of other foraminiferal species and those in most inorganic precipitation experiments. Such high rates in spirillinid foraminifera may explain their distinctive morphology, elemental composition, unusual reproduction, and ecological distribution.
- Article
(3095 KB) - Full-text XML
-
Supplement
(582 KB) - BibTeX
- EndNote


Foraminifera are one of the major carbonate producers in the ocean, and the impact of climate change on their test (i.e., shell) production may have important consequences for marine carbon cycling and thereby atmospheric pCO2 levels (Langer et al., 1997; Langer, 2008; Narayan et al., 2021). In estimating the fluxes of carbon and calcium, as well as comparing carbonate synthesis capabilities with other organisms, the growth rate of foraminiferal tests is indispensable. Despite this, research focusing on the measurement of test growth rates is still limited.
In previous studies, attempts have been made to estimate the rate of calcium carbonate production per unit time in foraminiferal species such as Archaias angulatus (Fichtel and Moll, 1798; Duguay and Taylor, 1978), Trilobatus sacculifer (Brady, 1877) (Erez and Luz, 1982; Anderson and Faber, 1984), Amphistegina lobifera Larsen 1976 (ter Kuile and Erez, 1984), and Ammonia tepida (Cushman, 1926) (Glas et al., 2012; Geerken et al., 2022). However, the sporadic and intermittent nature of test growth, coupled with the difficulties in observing test formation, has resulted in a fragmented picture of calcification rates. Moreover, studies that analyze precipitation rate as a function of environmental parameters (e.g., temperature or pH) are lacking.
Spirillina is a group of benthic foraminifera distinguished by a unique mode of test growth, characterized by a singular, continuous, enrolled, and elongate tube rather than spiralling chambered whorl forms found in rotaliid foraminifera (Loeblich and Tappan, 1987). Molecular phylogenetic studies indicate that S. vivipara, along with genera such as Ammodiscus, branches basally within the Tubothalamea, which is reflective of this species' lack of complex chamber arrangements (Ertan et al., 2004; Pawlowski et al., 2013). Compared to other benthic foraminifera with life cycles ranging from 2 months to several years (Lee and Anderson, 1991; Goldstein, 2003), Spirillina can reproduce rapidly, often within just 7–10 d, which is notably short, if nutritional conditions are favorable (Myers, 1936). While many foraminifera release gametes during sexual reproduction, S. vivipara forms a zygote through the fusion of two or three individuals. Consequently, the geographical dispersion of this species is anticipated to occur not through the gametes radiation but rather in an already juvenile state. This suggests that the species primarily disperses through propagules (Alve and Goldstein, 2010; Murray, 2013). Additionally, Hoechst 33342 fluorescent dye has been used for nuclear staining in S. vivipara, reaffirming its multinucleated nature (Frontalini et al., 2019; Myers, 1936). In this study, we leveraged these characteristics of S. vivipara to document test growth and measure the test extension rate through laboratory culture experiments. Based on these results, we have been able to estimate the calcitic precipitation rates of the species. Furthermore, to understand the degree by which the presence or absence of food impacts test growth, we also ran an experiment under a 72 h fasting scenario.
2.1 Sample collection and lab culture
Samples of living S. vivipara specimens were collected amongst flourishing algae from the eelgrass tank of the New Enoshima Aquarium in July 2017 and December 2018 for culture experiments. The algae were brought to the Japan Agency for Marine-Earth Science and Technology (JAMSTEC) headquarters in Yokosuka (Japan), where specimens of S. vivipara (JAMSTEC-Spirillina2021_EnoshimaYN) were handpicked using an eyelash and cultured in Petri dishes. Living specimens were identified by the circulation of cytoplasm and the presence of pseudopodia. Any extraneous sediment or debris was removed under a stereoscopic microscope (SteREO Discovery.V12, Zeiss Co. Ltd.) and transferred into filtered natural seawater with a salinity of 35 ± 0.1. Specimens were cultured in glass Petri dishes of 45 mm diameter, maintained at 23 ± 0.5 °C, and small amounts of live microalgae (Dunaliella tertiolecta, NIES-2258) were added twice a week.
2.2 Test formation observation
Two measurement methodologies were applied in this study to monitor the test growth of S. vivipara. One involved capturing continuous time-lapse images to measure the test extension per unit time using an inverted differential interference contrast (DIC) microscope. The other involved introducing the fluorescent reagent calcein (bis[N,N-bis(carboxymethyl)aminomethyl]fluorescein), a dye known for its selective staining of calcium, at the start of the experiment to mark the test and then measuring the length of the test after a prescribed period.
2.2.1 Test formation observation by a differential interference contrast microscope
Test growth (n=7) was observed using an inverted DIC microscope (Axio Observer Z1, Zeiss, Germany). Time-lapse images were automatically captured by the digital microscope software Zen (version 2.0). Observations were conducted using a 100× objective lens (Plan Achromat). The start and end frames of the time-lapse photography were overlaid using Adobe Photoshop. The length of the newly grown section of test was then measured using ImageJ/Fiji (Schindelin et al., 2012).
2.2.2 Fluorescent observation
Two groups of S. vivipara were subjected to calcein staining to examine test growth during a 24 h incubation. The calcein staining technique was applied for marking and distinguishing test formation under laboratory conditions (Bernhard et al., 2004). A 100 µM calcein seawater solution was prepared by dissolving calcein (molecular weight = 622.55, C0875, Sigma-Aldrich Inc.) in filtered seawater, in which the foraminifera were grown. When the foraminifera calcify a test in this solution, the incorporated calcein fluoresces, indicating growth.
The living S. vivipara samples were divided into two groups to examine differences in growth rate with and without food resources. One group was fed as usual (n=7), and the other was starved for 3 d (n=7). Following this, both groups were incubated with the 100 µM calcein seawater solution for calcium carbonate fluorescent staining. During this 24 h incubation, the foraminifera in the starved group were not fed, while the with-food condition had food present.
After staining, tap water was rapidly added to the Petri dishes to fix the samples, which were then immediately decanted and air-dried. Observations were then made using a fluorescence microscope (Axio Observer Z1, Zeiss, Germany) equipped with a green fluorescent protein (GFP) filter (filter wavelengths of 450–490 nm for excitation and 500–550 nm for emission; 38 HE, Zeiss, Germany), and photographs were taken. The length of the newly grown section of test was then measured using ImageJ/Fiji.
2.3 Test cross-section and ultrastructure observation
We further measured test thickness and modeled the test as an elliptical cylinder, which allowed us to estimate volume of calcification from the measured extension and amount. By extrapolating the density of calcium carbonate (2.7 g cm−3), we were able to estimate and approximate the amount of calcification. Samples for ultrastructural analysis were fixed using a fixative solution (3 % paraformaldehyde, 0.3 % glutaraldehyde, 2 % NaCl in PBS buffer; pH 7.8) and then stored in 2 % glutaraldehyde at 4 °C to prevent cellular morphological changes due to dehydration. Following the fixation, the samples were washed in filtered seawater and post-fixed for 2 h at 4 °C in 2 % osmium tetroxide in filtered seawater. After the osmium fixation, the samples were washed with distilled water and then conductively stained by incubating in a 0.2 % tannic acid solution (pH 6.8) for 30 min. They were subsequently washed again in distilled water and further incubated in a 1 % osmium tetroxide solution for 30 min. Following the staining process, the samples were washed in distilled water and then subjected to an ethanol ascending series for dehydration. This was followed by substitution with isoamyl acetate and then critical point drying. The samples were coated with osmium using the OPC80 osmium coater (Filgen Inc., Japan). Microsectioning and SEM observation were performed using the Helios G4 UX focused-ion-beam scanning electron microscope (FIB-SEM; Thermo Fisher Scientific, USA) at JAMSTEC Yokosuka headquarters, following the guidelines set by Nagai et al. (2018). Microsectioning was carried out on two individuals (n=2), yielding a total of six transverse sections with a gallium FIB (30 kV). Subsequently, detailed microscopic observations were conducted in SEM mode (1 kV). Specifically, two transverse sections were obtained from one individual, while four planes were sectioned from the other individual. Test thickness was measured using ImageJ/Fiji on these SEM images (Schindelin et al., 2012).
2.4 Statistical analysis
Spearman's rank correlation coefficient was applied to assess the relationships between several parameters. Statistical analyses were performed using Python 3 (version 3.9.6) on a Macintosh computer. Spearman's rank correlation coefficient was calculated using the “scipy.stats.spearmanr” function from the SciPy library (version 1.3.3) (the Supplement, Script S1). First, we examined the relationship between the calcification rate derived from the length grown in 20 min, and the pre-growth maximum test diameter was explored. Secondly, we then analyzed the correlation between the pre-dyeing maximum test diameter with calcein and the calcification rate derived from calcein staining in 24 h.
3.1 Short-term growth observation: 20 min study using DIC microscopy
Differential interference contrast microscopy was utilized to observe S. vivipara over a 20 min period (Fig. 1) (see Sect. “Video supplement”). The observation demonstrated the progressive elongation of the apical portion of the S. vivipara test. The time-lapse observations revealed that S. vivipara extends its pseudopodia from the test in a foliated manner (compare Fig. 1a with b, enclosed by a yellow line). The cell appears to elongate uniformly as a tube-like protrusion from the test (Fig. 1b). Additionally, the formation of pores during test growth was also confirmed on the dorsal side of the test (Fig. 1b “P”). By overlaying images from the beginning and end of the observations and measuring the length of the elongated difference, it was found that the test extended by an average of 2.69 µm (SD = 0.90 µm) (Fig. 1c and Table 1). The fastest growth was 4.13 µm over 20 min, while the slowest growth still resulted in an extension of 1.53 µm.
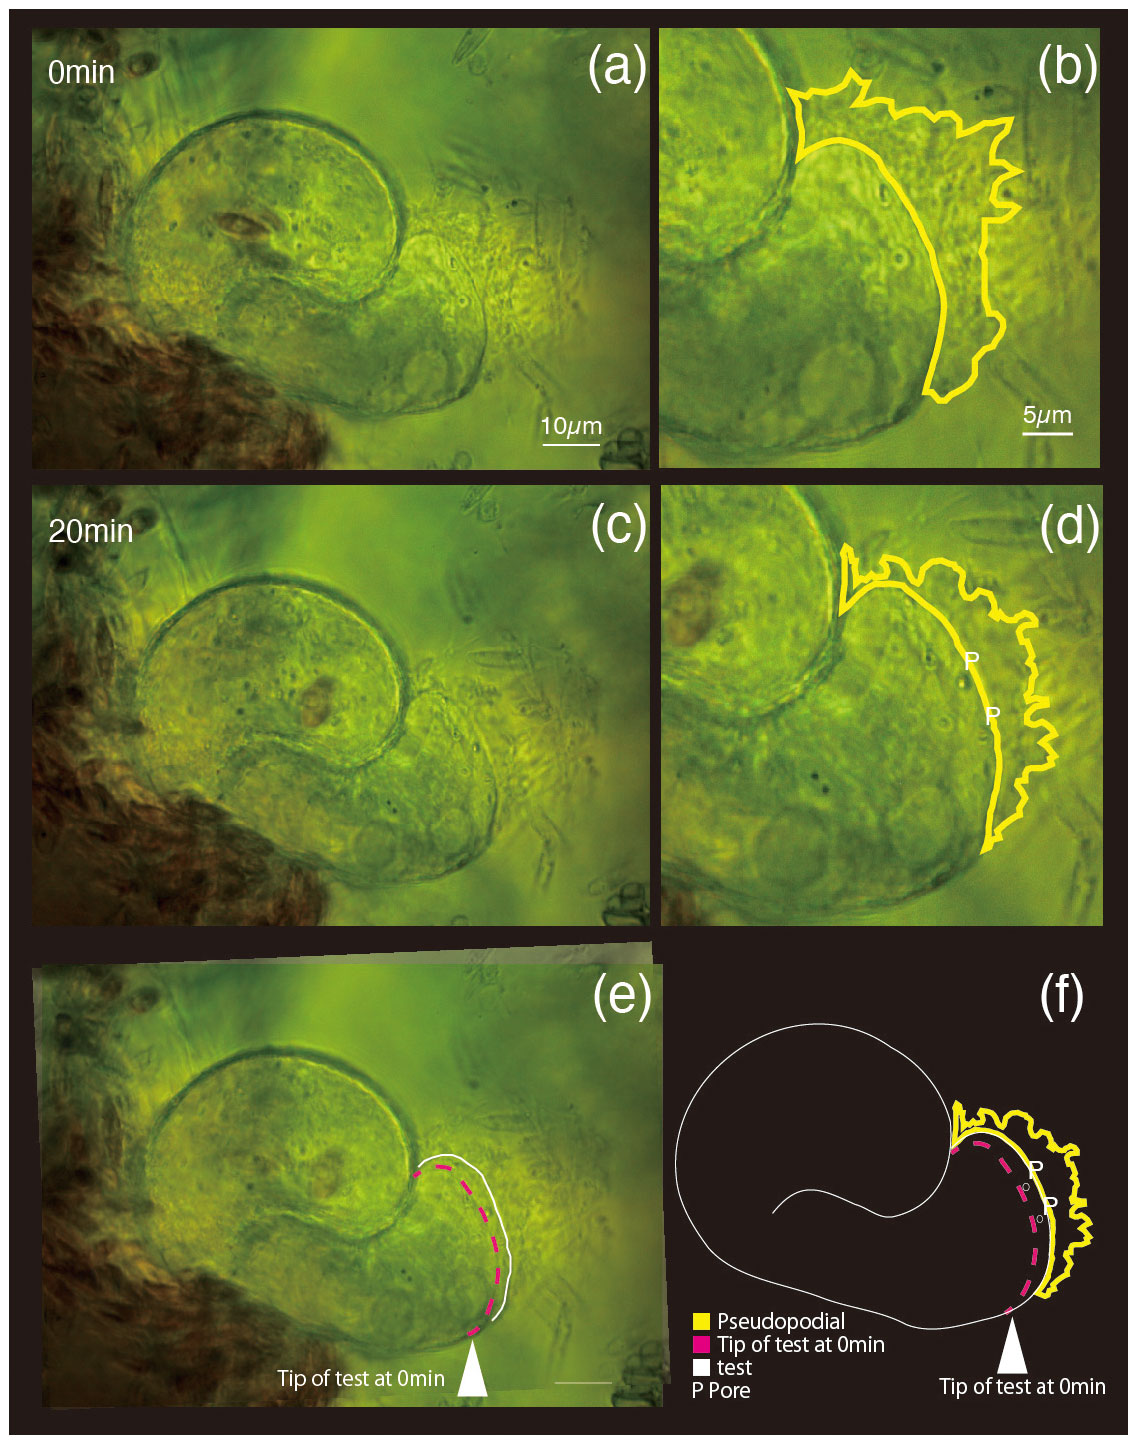
Figure 1Superimposed images of two micrographs taken at different time points. (a) 0 min, (b) pores and pseudopodial distribution are illustrated in the magnified image at 0 min; (c) 20 min; (d) newly constructed pores (P) and pseudopodial distributions; (e) overlapping image of (a) (0 min) and (c) (20 min); (f) sketch made by overlaying the images taken at 0 and 20 min. In panels (e) and (f), the white arrowhead and dotted magenta line show the test front at 0 min, and the solid white line shows the test front at 20 min.
Table 1Average S. vivipara test growth over 20 min.
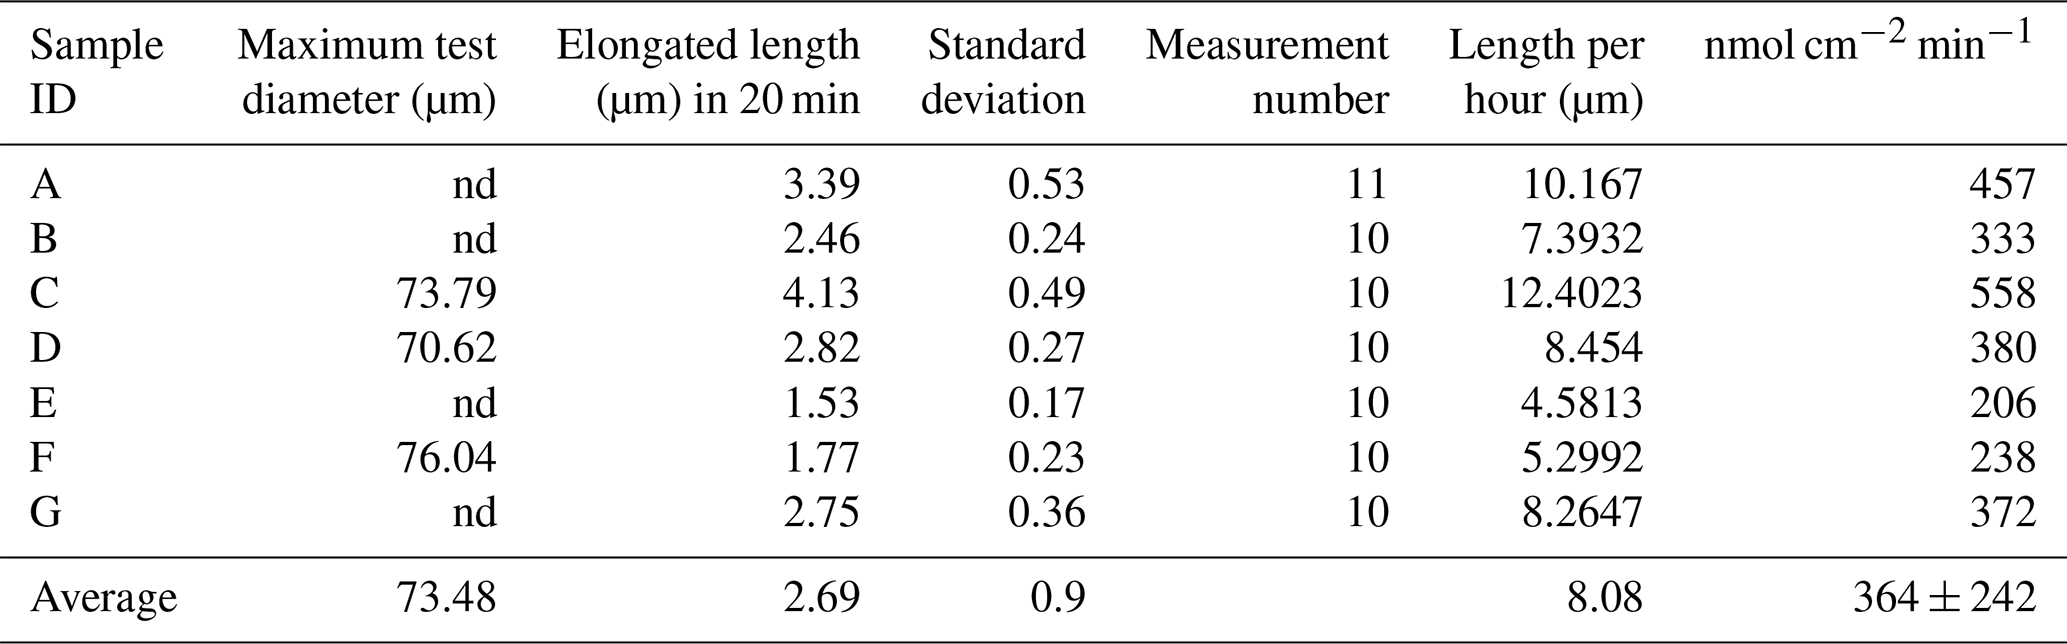
nd: not determined.
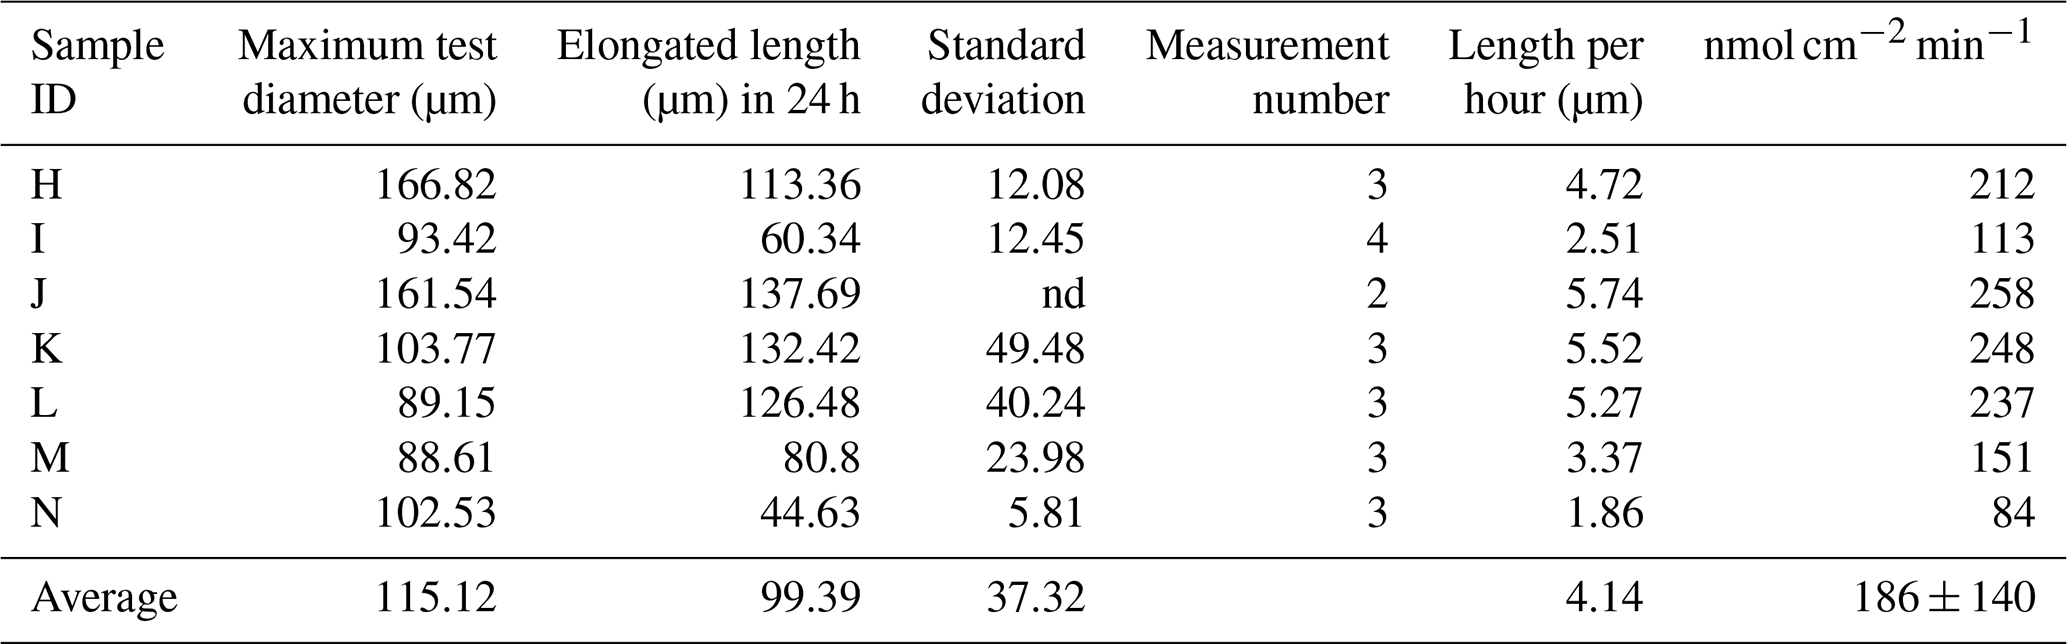
3.2 Long-term growth evaluation: 24 h analysis with calcein staining
The newly formed S. vivipara test in the fed group labeled with calcein shows evidence of calcification (i.e., fluorescence) (Fig. 2). The newly formed test section exhibited an average growth of 100 µm over the 24 h incubation period (Table 2). The fastest growth over 24 h was 137.69 µm, while the slowest growth was 44.63 µm.
In a separate group, the S. vivipara organisms that were starved for 3 d did not yield any fluorescent signals from the test (the Supplement, Fig. S1).
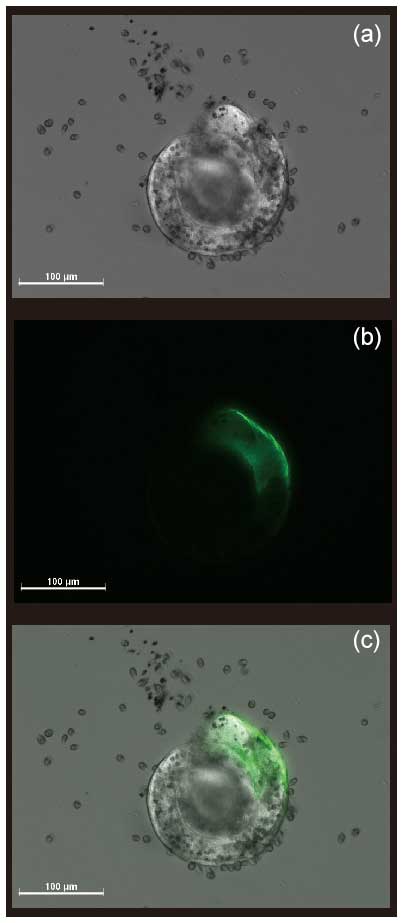
Figure 2Sites stained by calcein (a green fluorescent calcium indicator) during the 24 h observation period. (a) Differential interference contrast (DIC) image; (b) fluorescence image; (c) overlay of images (a) and (b). The scale bar represents 100 µm.
3.3 Analysis of test thickness, dimensions, and calcification
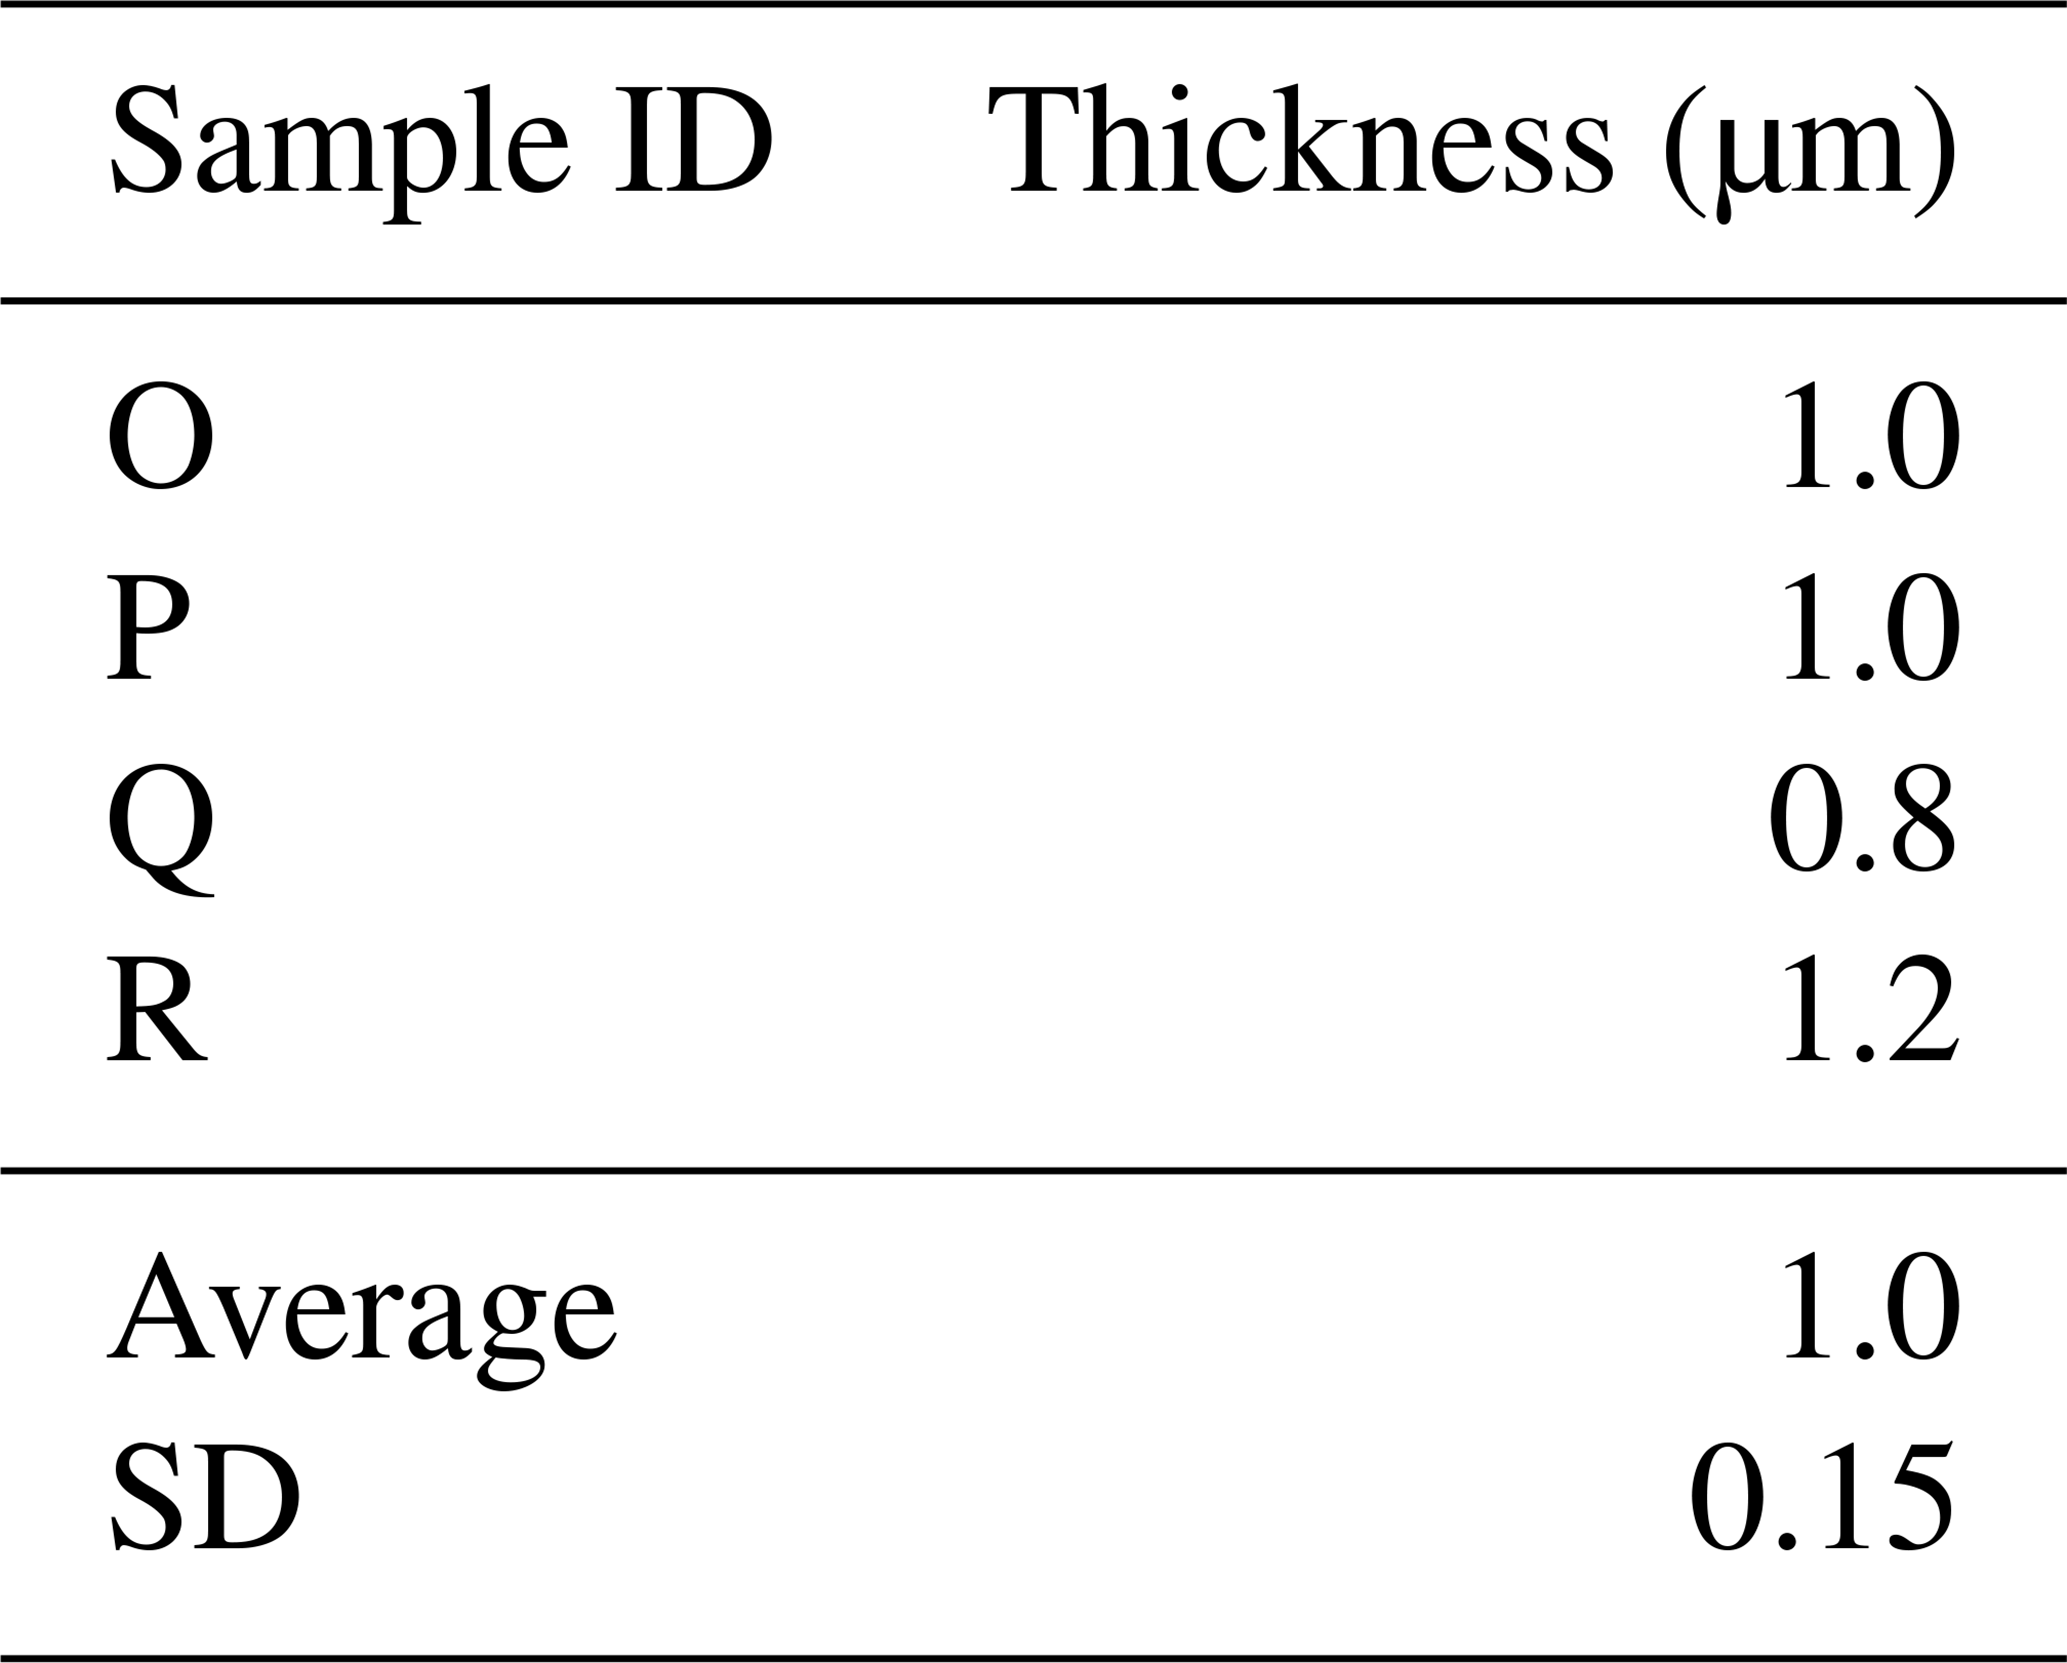
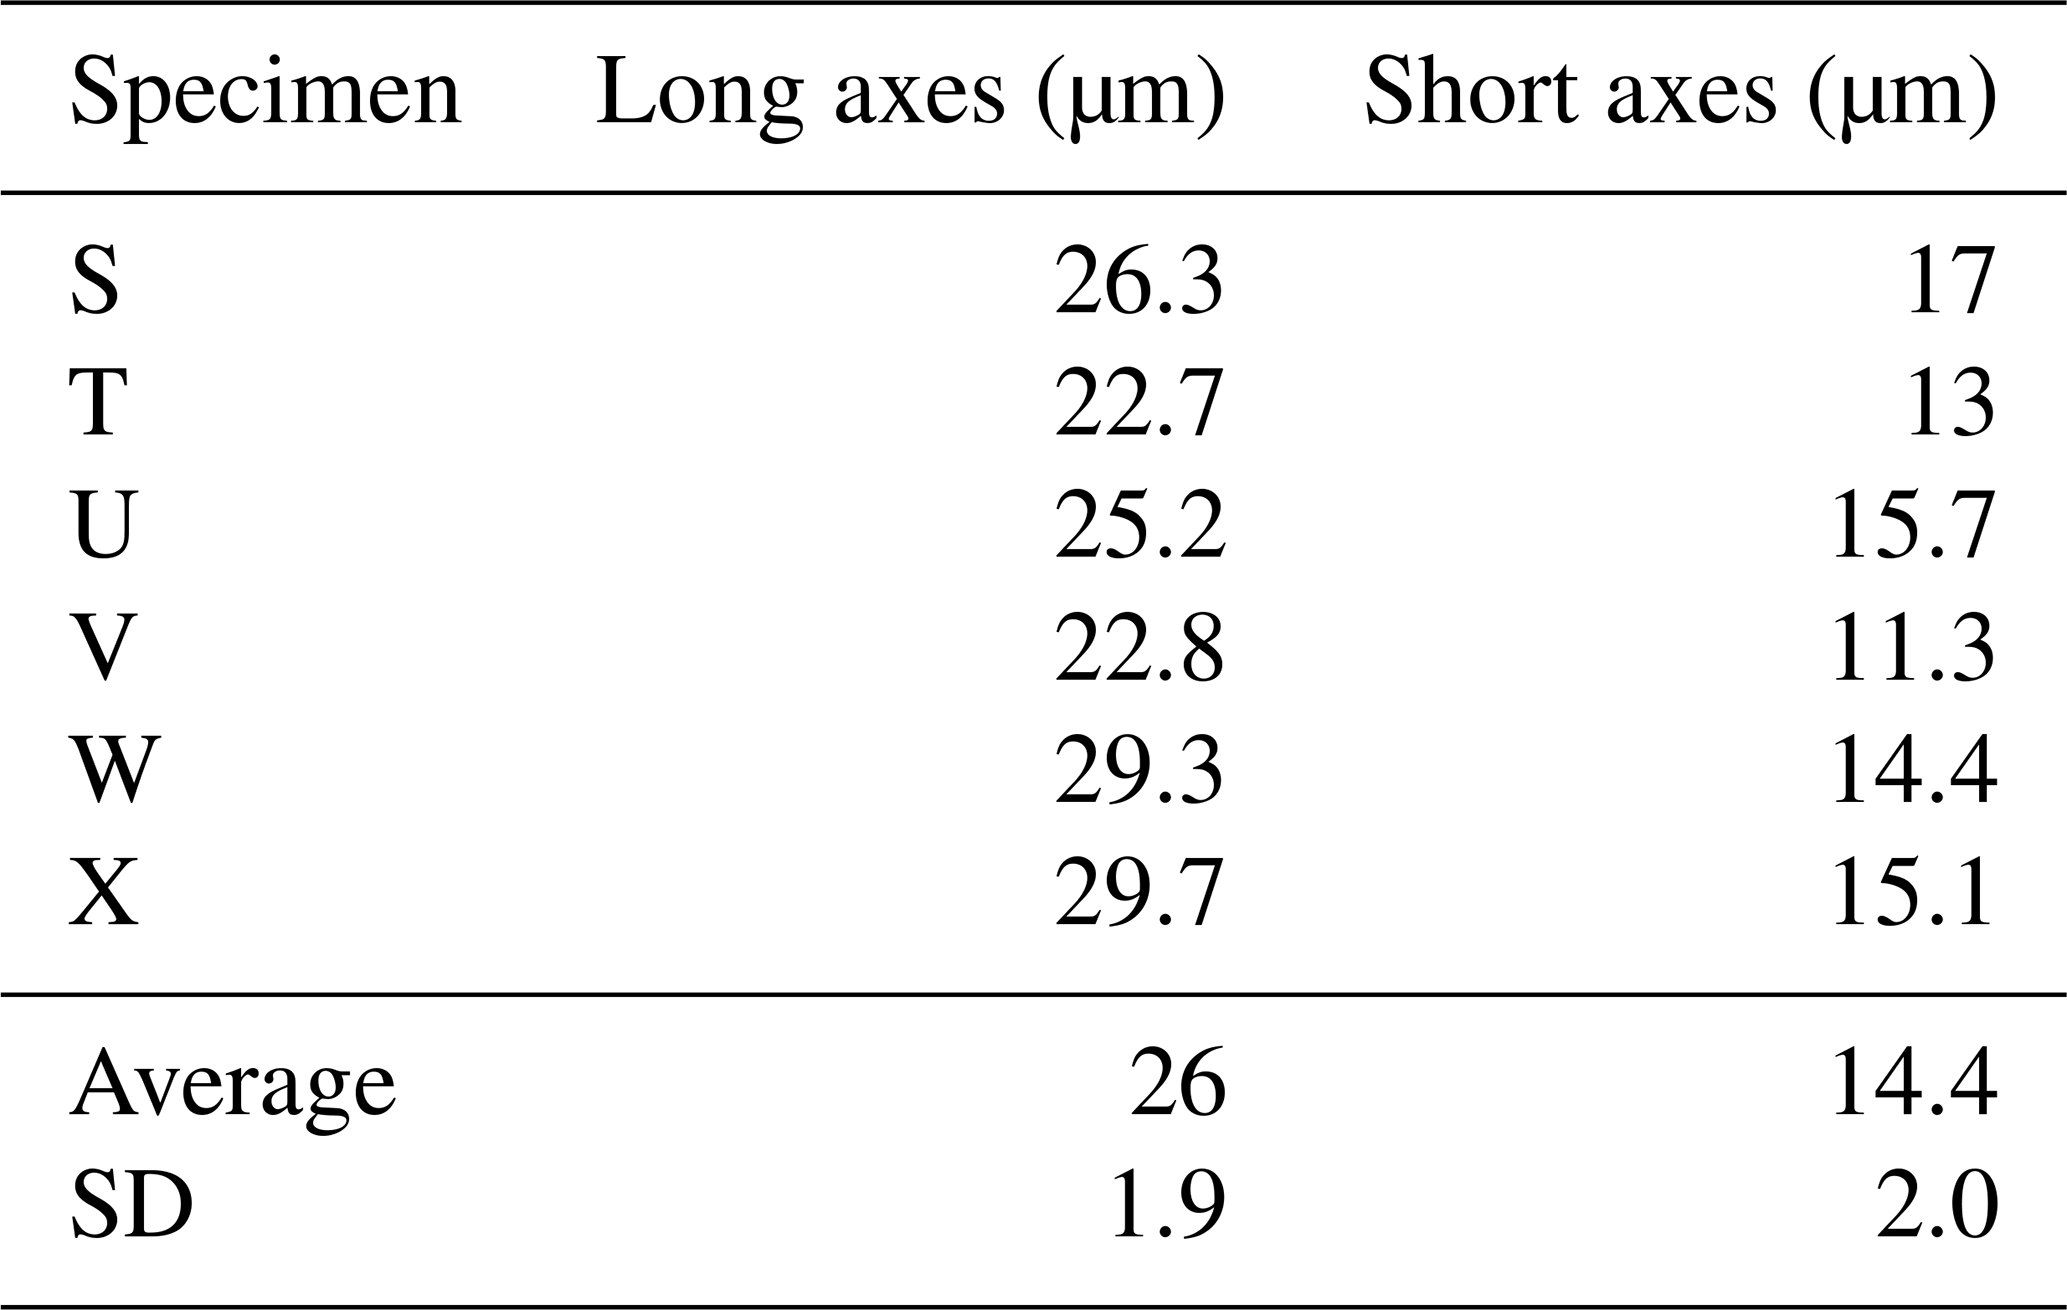
Here we present a transverse section of S. vivipara tests micromachined using focused-ion-beam scanning electron microscopy (FIB-SEM) (Fig. 3). Measurements were taken for both the thickness of the tests and the long and short diameters of the tubular test by scanning electron microscopy (SEM) micrographs (Tables 3, 4). The average test thickness was determined to be 1.008 µm (SD 0.145 µm), with observations indicating that the test was thicker on the ventral side compared to the dorsal side. The average dimensions for the major and minor axes of the test cross-sections were calculated to be 26.0 and 14.4 µm, respectively (Table 4). Using these dimensions and the average growth of 99.39 µm in 24 h, we calculated the volume of the test grown per day as 3081 µm3. Considering the density of calcium carbonate (calcite) is 2.7 g cm−3, we estimate that S. vivipara deposits 8.31 ng of calcium carbonate per day. During a 20 min period, the average growth is 2.69 µm, corresponding to a volume increase of 83.39 µm3 and the estimated precipitation of 0.23 ng of calcium carbonate.
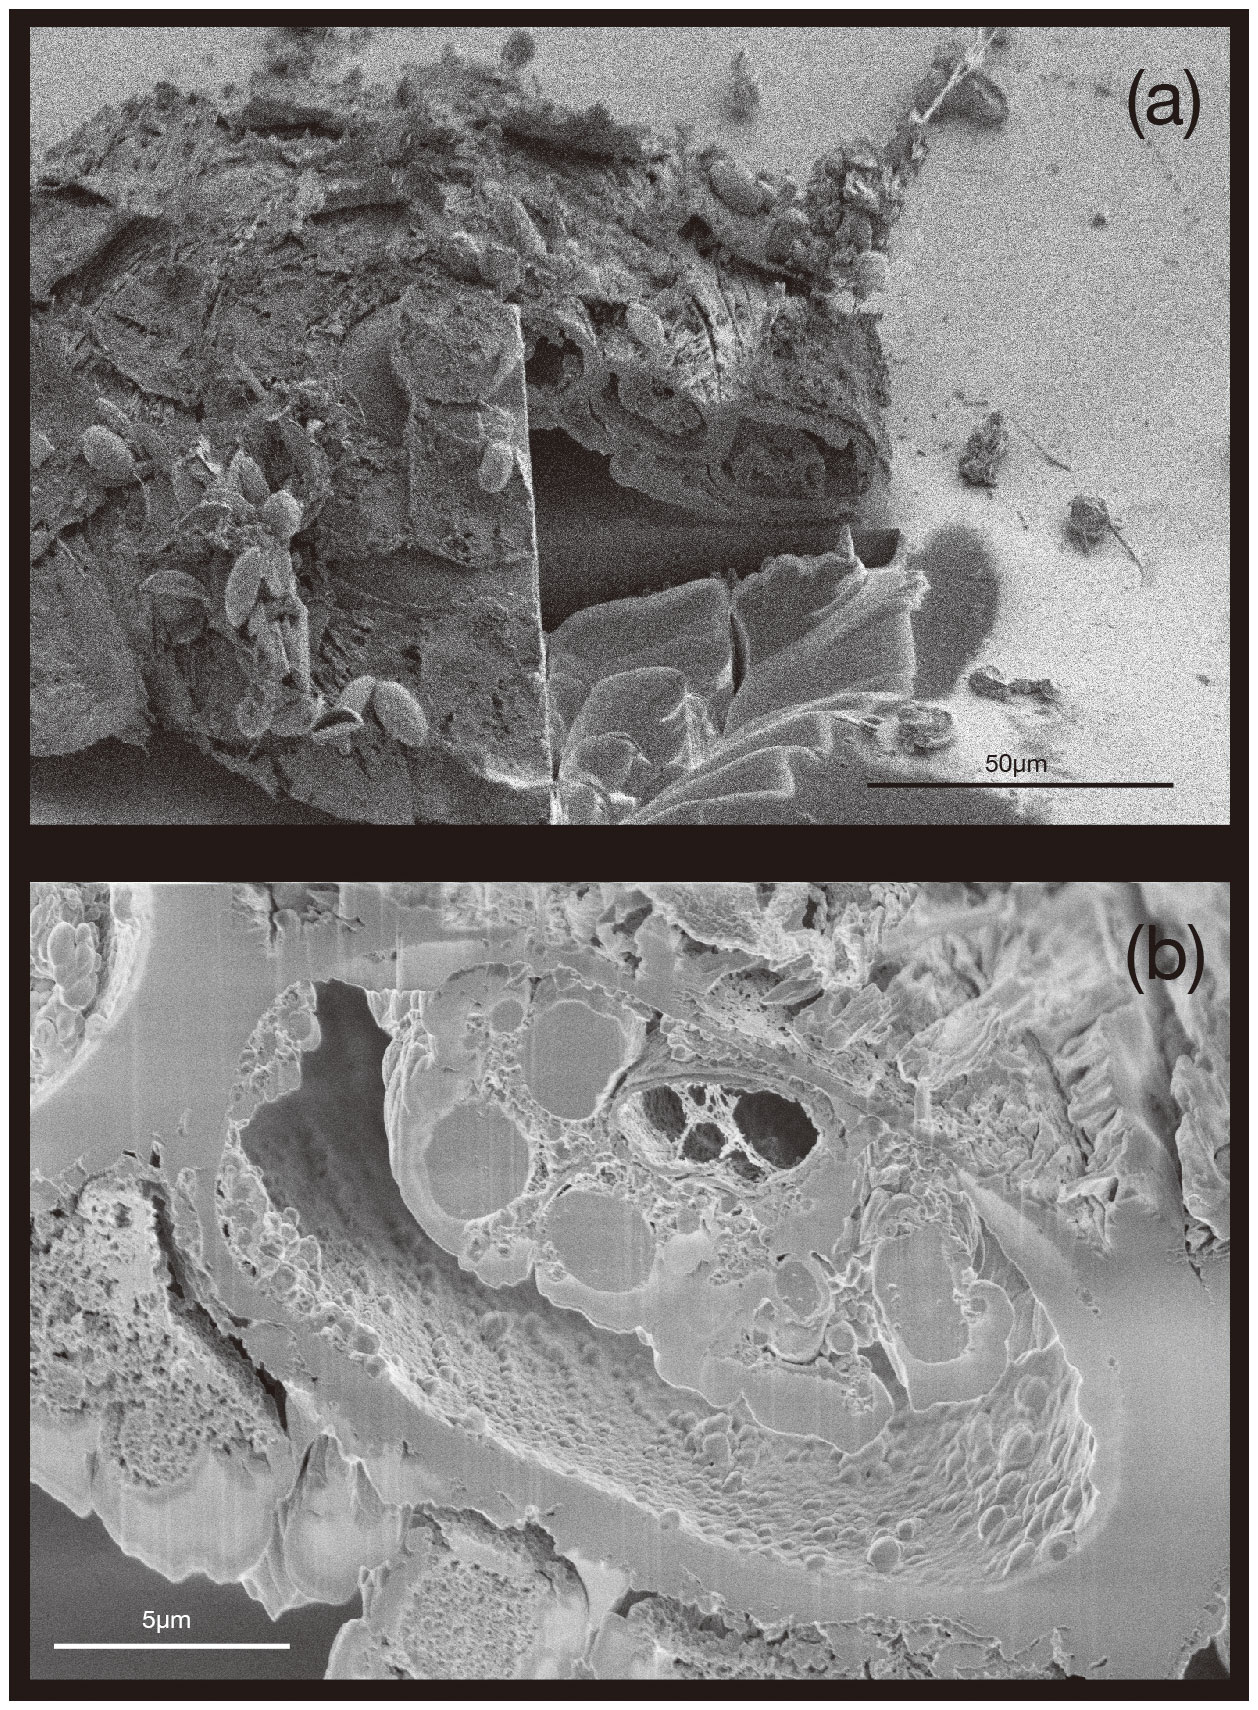
Figure 3Transverse section of S. vivipara tests micromachined by FIB. The cross-section of the test is nearly elliptical and tubular.
Table 3Average S. vivipara test thickness from cross-sectional measurements.
3.4 Individual size and test growth
A Spearman's rank correlation coefficient was observed between the calcification rate calculated from growth length over 20 min and the maximum test diameter before formation, suggesting a weak negative correlation. The Spearman's significance test yielded a p value of 0.667, indicating that this correlation is not statistically significant (Fig. 4a). Additionally, a correlation coefficient rs=0.39 was found between the rate of calcification determined by calcein staining and the growth length after 24 h, indicating a weak correlation. Spearman's rank correlation analysis provided a p value of 0.387, further indicating that the correlation is not statistically significant (Fig. 4b). These results indicate a generally weak correlation between individual size, test growth, and calcification rate, with no statistically significant relationships found.
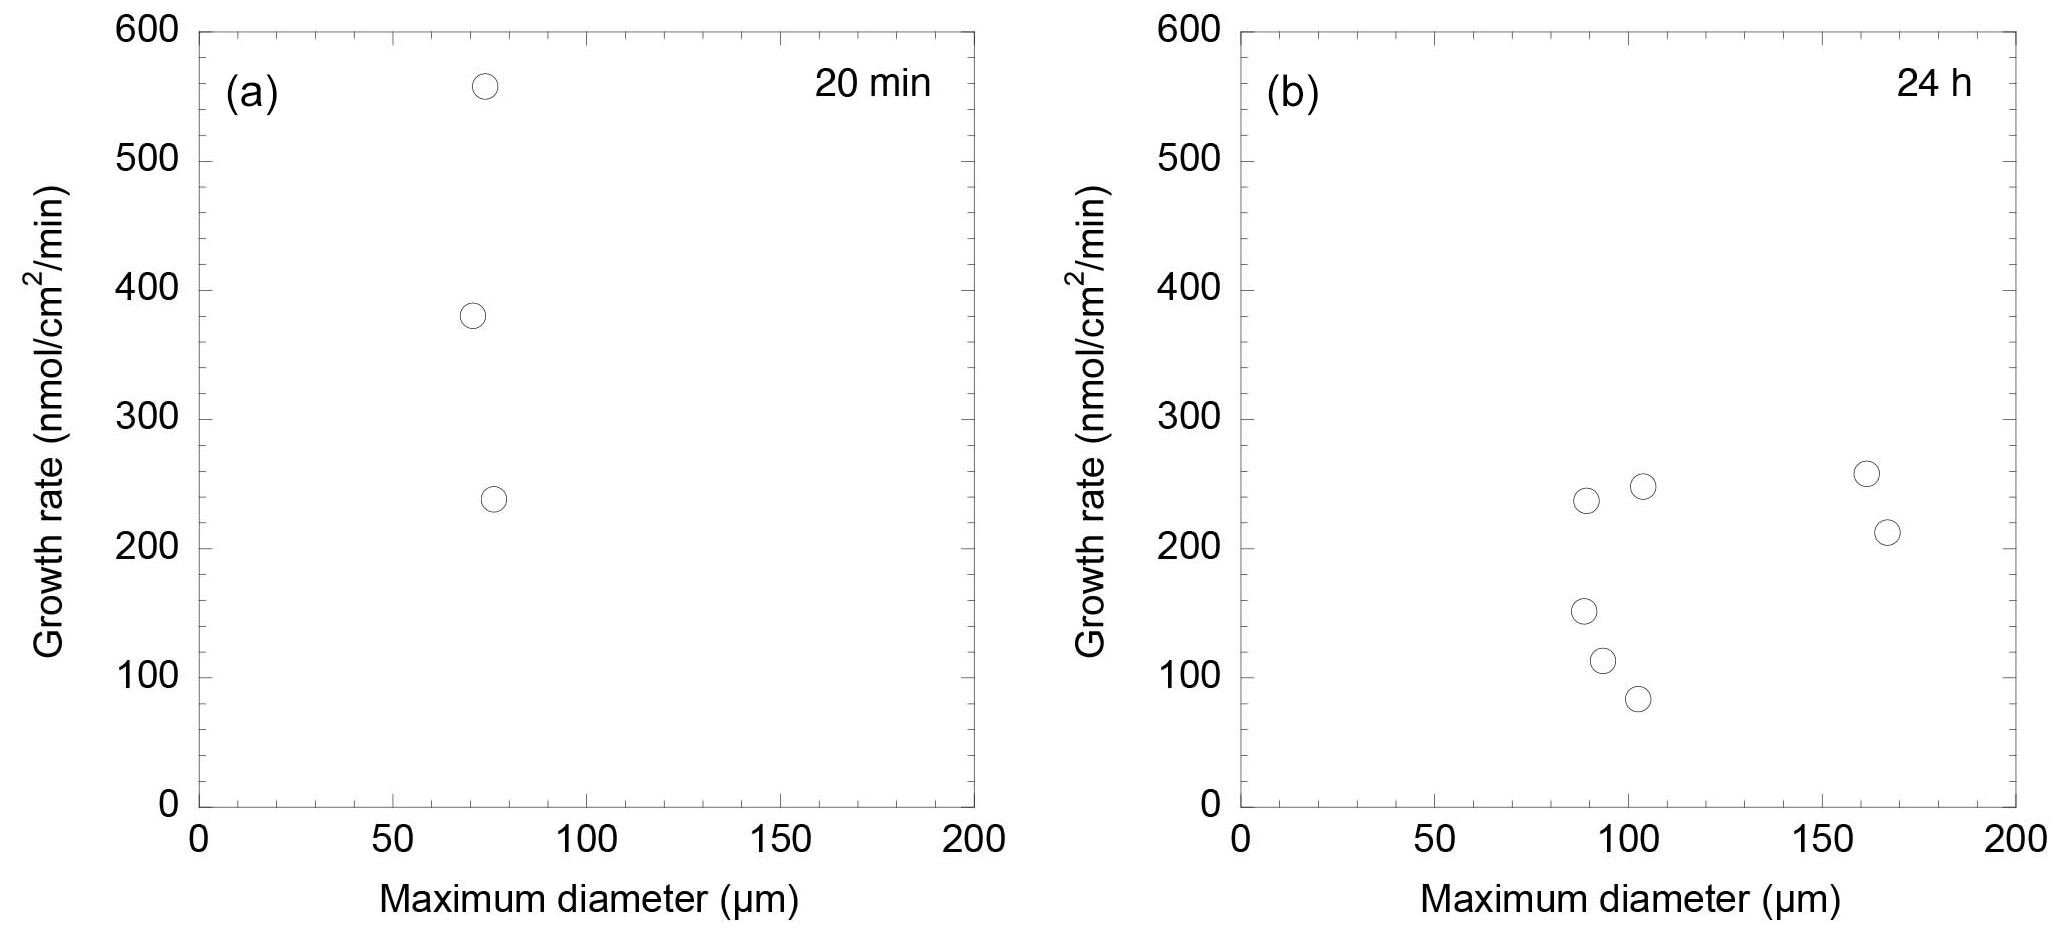
Figure 4The comparison between the size of the individuals and the growth rate: (a) in 20 min; (b) in 24 h. Note that for some individuals only the growth area was recorded during the microscope observation instead of capturing the entire individual.
4.1 Comparison of calcification rates
Calcification rates over a short time span (20 min) were found to vary between 206 and 558 nmol cm−2 min−1 (Table 1). This was higher than the rates observed over a 24 h time period (80–250 nmol cm−2 min−1; Table 2). This discrepancy suggests that the addition of calcite by S. vivipara is episodical, and that within a day there are periods with and without chamber elongation. The relatively continuous calcite addition over the 20 min observations likely provides the maximum deposition rates during test growth.
We also observed that calcification rates were not correlated to individual test sizes (Tables 1 and 2 and Fig. 4). The absence of test elongation when no food is present suggests that calcification is linked to the growth of the foraminiferal cell. Hohenegger (2018) speculated that the timing of chamber construction is correlated with the cell's growth patterns and showed that in linearly growing cell volumes the chamber building rate aligns consistently with the growth rate. This consideration aligns with the growth pattern of S. vivipara in our study which, despite its curved nature, essentially follows a pattern of increasing tube length. The calcification might be a response to the cell's increased volume increasing beyond that of the spirillinid's tubular chamber.
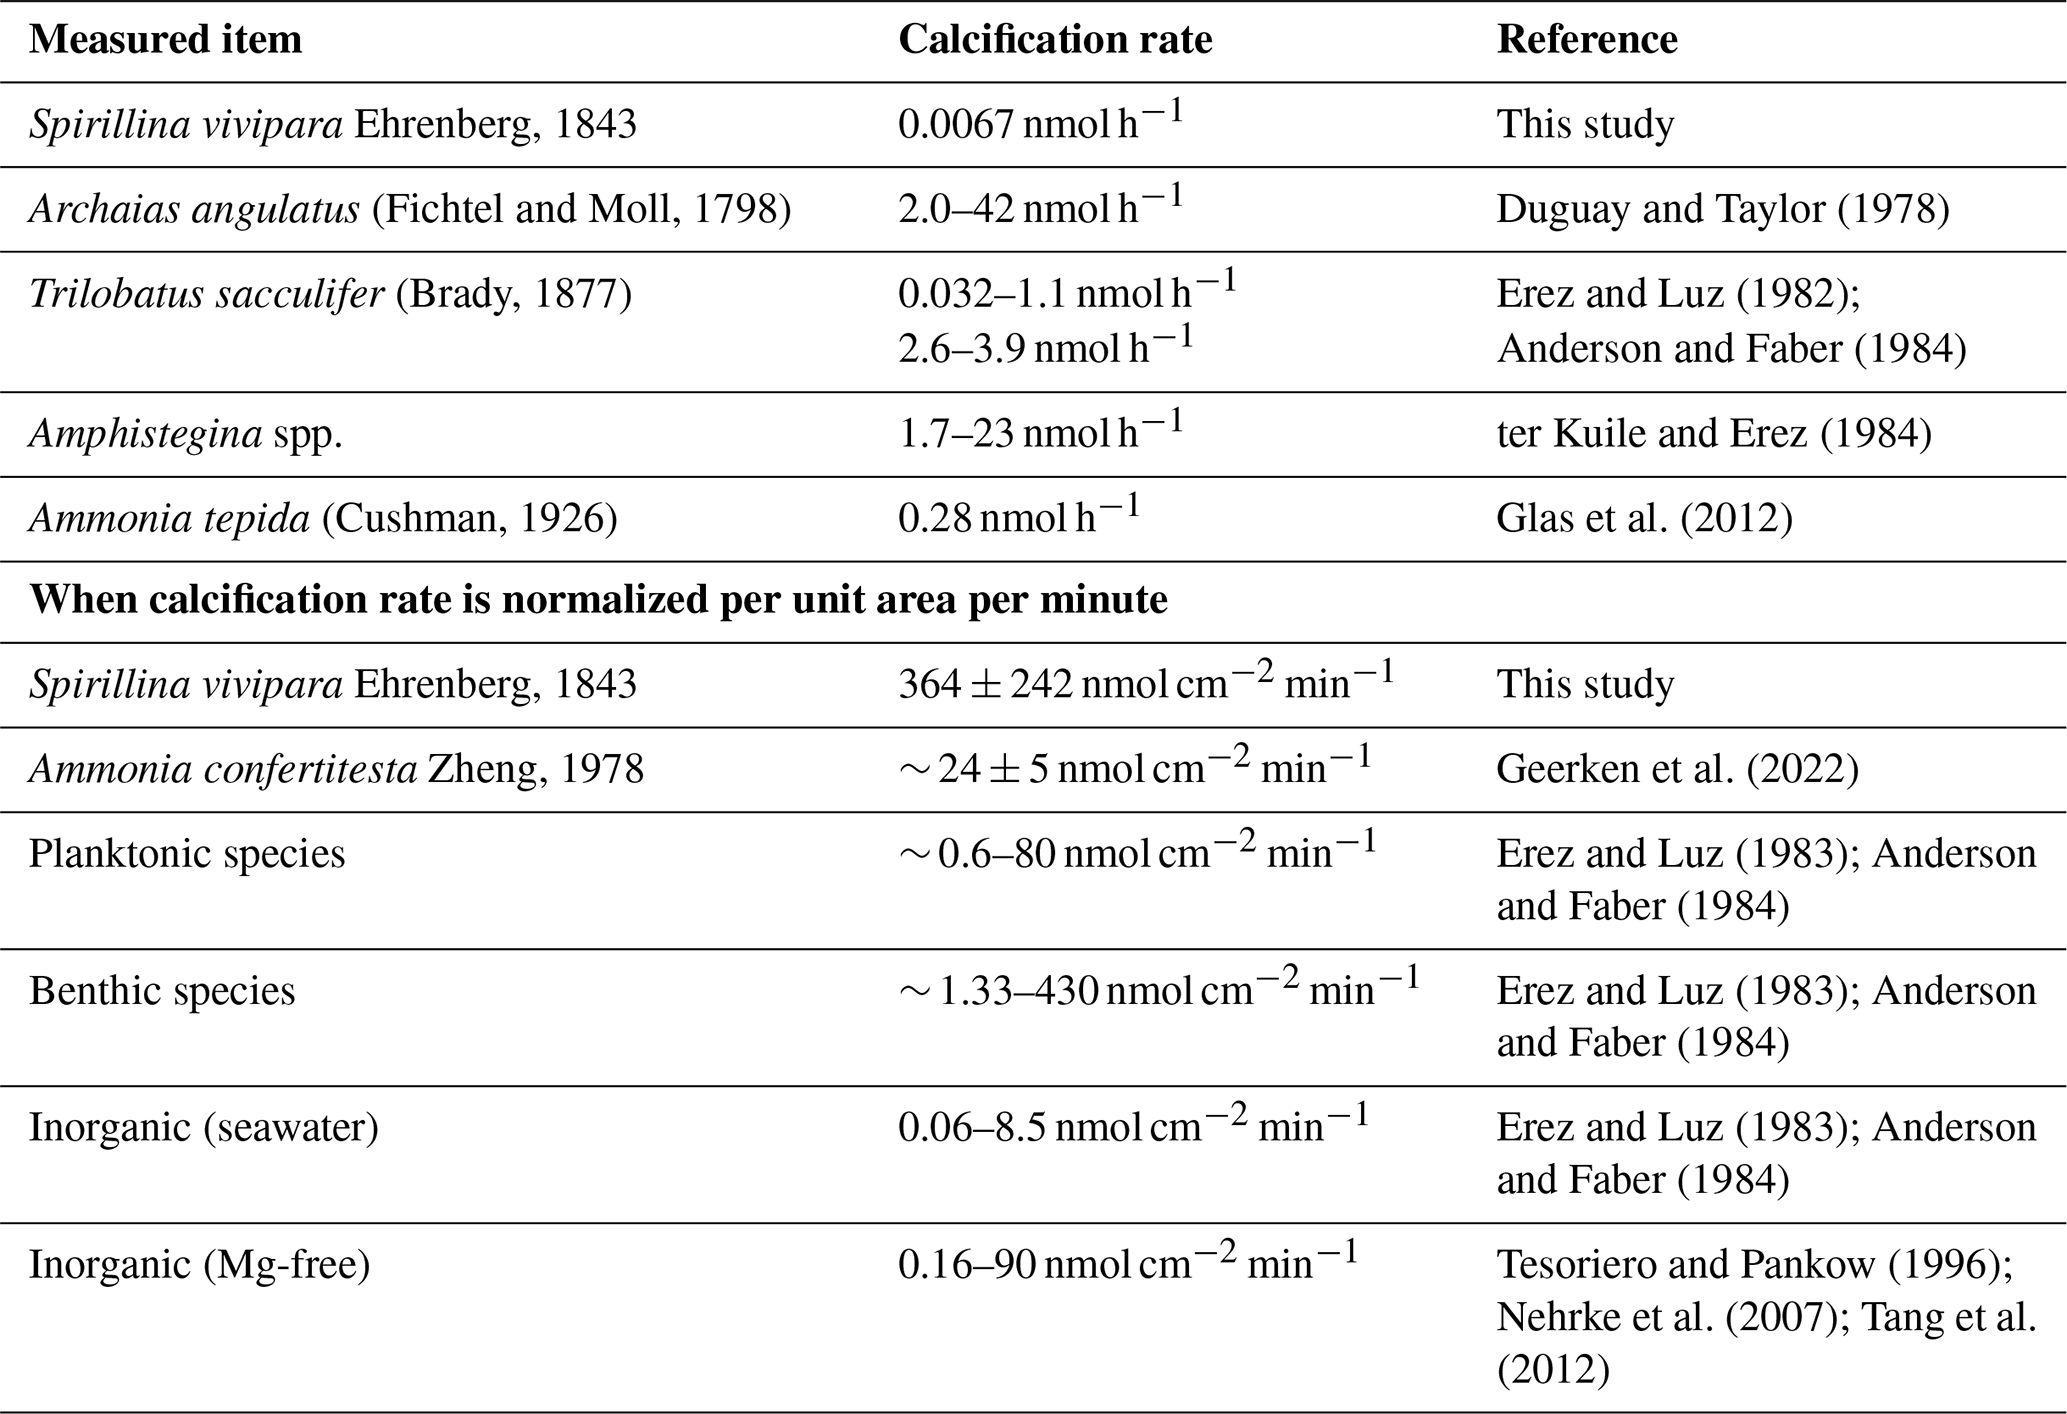
The maximum calcification rates for S. vivipara were higher than those of other foraminiferal species or inorganic precipitation experiments (Table 5). Due to their overall small size, the high rates of precipitation/calcification in this taxon do not necessarily result in much calcium carbonate production per individual. By normalizing the calcium carbonate formation rate per unit area, S. vivipara shows the highest calcium carbonate precipitation rates amongst all studied species, as well as compared to rates found in most inorganic precipitation experiments. To further clarify these results, we compared the calcification rate of S. vivipara with those reported in various other taxa (Table 5).
Table 5Comparison of calcification rate of S. vivipara with previously reported growth rates of foraminifera and inorganic precipitation experiments.
The notably fast carbonate deposition rate per unit area observed in S. vivipara is believed to be intrinsically linked to its test formation strategy. During the biomineralization process, i.e., foraminiferal chamber formation, an organic mold is formed and acts as a substrate which the new chamber's hard material (calcium carbonate) is transported to and built upon, ensuring the desired chamber morphology. While calcification typically occurs across the entirety of a newly forming chamber, S. vivipara initiates crystalline growth solely at the test aperture's tip. As a result, the calcification site is restricted, leading to a straightforward transportation path for the chamber's materials from seawater. This could explain the swift carbonate deposition rates. The minimized calcification amount per individual may also play a role. Essentially, with the calcification site being small, it is possible that the energy and material resources result in faster calcification rates. While there are no studies specifically addressing the effect of the size of calcification sites on the rate of carbonate deposition, there is a related example regarding planktonic foraminiferal spines with apical growth rates ranging from ∼ 0.7 µm min−1 to a maximum of ∼ 8 µm min−1 (Izumida et al., 2022). The precise mechanisms and reasons why a smaller calcification site might promote faster precipitation remain unclear based on current knowledge. Hence, a deeper understanding of foraminiferal biomineralization, particularly in how calcium and other calcareous test materials are transported and deposited, is imperative for future research.
Building on this, according to Blackmon and Todd (1959), the S. vivipara test contains a high magnesium concentration of 17 mol %, equivalent to a ratio of 170 mmol mol−1. While many planktonic foraminifera and benthic foraminifera like Cibicidoides and Ammonia exhibit ratios in the range of 1–4 mmol mol−1, species such as Miliolid, Calcarinidae, and Planoglabratella exceed 100 mmol mol−1, classifying them as high-Mg calcite species. Notably, S. vivipara can be included within this high-Mg group (Toyofuku et al., 2000; James and Austin, 2008; Toyofuku et al., 2011; de Bar et al., 2019). When applied to the trans-membrane transportation and passive transportation (TMT-PT) model that explains calcium transport in foraminiferal calcification, such a high magnesium concentration can be attributed more to passive transportation (deriving seawater as the source of calcium carbonate) than trans-membrane transportation, which selectively absorbs calcium (Nehrke et al., 2013). To clarify these points in the future, approaches like pH and Ca imaging, microscopic observations of the growing test front, and detailed multi-element chemical composition analyses are essential.
4.2 Implications for the species' life cycle and ecology
Considering our findings, it becomes evident that the unique test formation of S. vivipara is deeply rooted in its ecological behaviors/strategies and evolutionary advancements. The distinct continuous coiled chamber design, setting it apart from other chambered whorl tests of rotaliid foraminifera, combined with its notably short-life span, suggests a specialized survival mechanism (Myers, 1936; Lee and Anderson, 1991; Goldstein, 2003). Such a mechanism not only traces the evolutionary path of S. vivipara but also reveals its capability to adapt its cell volume swiftly by precipitating tests at an unparalleled rate.
The swift growth may present additional ecological advantages by enabling this species to colonize diverse environments and secure ecological niches. Documented mainly as epifauna on continental shelves (Murray, 2006), S. vivipara's rapid growth rate and propagule-based dispersal mechanism likely provide a strategic advantage for swift maturation and life cycle completion (Murray, 2013). Spirillina vivipara is distributed along the western side of both the North and South Pacific Ocean, its marginal seas, the coasts of the North Atlantic Ocean on both the eastern and western sides (including the Gulf of Mexico), the coastal regions of the Mediterranean Sea, and the Indian Ocean (Hayward et al., 2023; OBIS, 2023). In all these locations, consistent with Murray (2013), the ecological behavior of rapid growth, even when individual specimen size is small, seems to provide an advantage in ensuring ecological space. The unique reproduction process of S. vivipara, including the timing of sexual and asexual reproduction, greatly influences its growth rate. The minimum time required to complete both the sexual and asexual reproductive stages in S. vivipara is approximately 18 d (Myers, 1936). Our research reveals the shortest period for these stages within our study sample to be 7–10 d, resulting in an overall life cycle of approximately 14–20 d (Yukiko Nagai, unpublished data). As cell volume increases, the number of progeny produced during gametogenesis correspondingly escalates, leading to a larger dispersal of offspring. In fact, the cosmopolitan distribution of this taxon indicates the success of this type of dispersal strategy in expanding distribution, and the rapid growth rate may be a factor facilitating this.
Our investigation into the calcification and growth rates of the benthic foraminifera Spirillina vivipara has provided distinctive insights into its test growth characteristics. Through time-lapse imaging and the use of calcein to confirm calcium incorporation into the test, this study has laid the groundwork for potential further investigations into the other elemental uptakes within foraminiferal calcite. Future research into the nature of this elemental uptake holds the potential to shed light on elemental distribution in cases of rapid calcification. Such studies could enhance our understanding of the ecology of foraminifera and their implications for paleoclimate reconstructions. Therefore, further attention to the elemental composition of S. vivipara is warranted. The crystalline properties of such rapid test formation are also of great interest. Comprehensive crystallographic analysis of S. vivipara in future research could help reveal its unique calcification mechanisms. Advanced techniques, such as electron backscatter diffraction (EBSD) and transmission electron microscopy (TEM), to determine crystal orientation, might uncover more detailed features of the test's structure and composition. In conclusion, this study emphasizes the significance of understanding the growth and calcification of foraminiferal tests on a species-specific basis. Such insights can influence not only our knowledge of foraminiferal ecology but also the wide-ranging roles of foraminifera in marine carbon cycling and paleoclimate research, thereby with extensive implications.
The Python code for deriving Spearman's rank correlation coefficient, used in Fig. 4, is available in the Supplement, utilizing the scipy.stats module from SciPy (Virtanen et al., 2020). The code is available in the Supplement.
All data included in this study are available upon request via contact with the corresponding author.
Time-lapse videos show S. vivipara forming a test within 20 min. Video Supplement 1: S. vivipara forming a test within 20 min observed from the dorsal side. The formation of pores at the apical portion can also be observed. The video can be accessed at https://doi.org/10.5446/63152 (Nagai and Toyofuku, 2023a). Video Supplement 2: S. vivipara forming a test within 20 min observed from the ventral side. The video can be accessed at https://doi.org/10.5446/63153 (Nagai and Toyofuku, 2023b).
The supplement related to this article is available online at: https://doi.org/10.5194/bg-21-1675-2024-supplement.
YN and TT both equally contributed as co-first authors; conceiving and designing the study; conducting animal husbandry, observations, and data analysis; and playing a major role in writing and constructing the manuscript. BM was responsible for identifying the species, validating the discussion, and contributing to the writing process. KU handled preprocessing and observations using the electron microscope. All authors reviewed and approved the final paper.
The contact author has declared that none of the authors has any competing interests.
Publisher’s note: Copernicus Publications remains neutral with regard to jurisdictional claims made in the text, published maps, institutional affiliations, or any other geographical representation in this paper. While Copernicus Publications makes every effort to include appropriate place names, the final responsibility lies with the authors.
We thank Nanami Kishigami, Yuki Iwadate, and Sunao Kubo for their help in stock culturing foraminifera, and we thank Remi Tsubaki, Jelle Bijma, and Lennart de Nooijer for their scientific advice. We would like to thank Makoto Sugimura, Yuka Toyoda-Koyano, and Ayuta Shinozaki of New Enoshima Aquarium for their cooperation in collecting foraminifera. We would like to express our gratitude to Tina Treude, co-editor-in-chief, for the valuable editorial guidance. We also thank one anonymous reviewer for their insightful comments and Delphine Dissard for her constructive suggestions, both of which significantly enhanced the quality of this paper.
This research has been supported by the Japan Society for the Promotion of Science (grant nos. 19K21197, 21K14035, 23H00339, and 23K03568) and the Japan Science and Technology Agency (grant no. JPMJPF2104).
This paper was edited by Tina Treude and reviewed by Delphine Dissard and one anonymous referee.
Alve, E. and Goldstein, S. T.: Dispersal, survival and delayed growth of benthic foraminiferal propagules, J. Sea Res., 63, 36–51, https://doi.org/10.1016/j.seares.2009.09.003, 2010.
Anderson, O. R. and Faber, W. W.: An estimation of calcium carbonate deposition rate in a planktonic foraminifer Globigerinoides sacculifer using 45 Ca as a tracer; a recommended procedure for improved accuracy, J. Foramin. Res., 14, 303–308, https://doi.org/10.2113/gsjfr.14.4.303, 1984.
Bernhard, J., Blanks, J. K., Hintz, C. J., and Chandler, G. T.: Use of the fluorescent calcite marker calcein to label foraminiferal tests, J. Foramin. Res., 34, 96–101, 2004.
Blackmon, P. D. and Todd, R.: Mineralogy of some foraminifera as related to their classification and ecology, J. Paleontol., 33, 1–15, 1959.
Brady, H. B.: Supplementary note on the foraminifera of the Chalk of the New Britain group, Geol. Mag., London, 4, 534–536, https://doi.org/10.1017/S0016756800150137 1877.
Cushman, J. A.: Foraminifera of the typical Monterey of California, Contributions from the Cushman Laboratory for Foraminiferal Research, 2, 53–69, 1926.
de Bar, M. W., de Nooijer, L. J., Schouten, S., Ziegler, M., Sluijs, A., and Reichart, G.-J.: Comparing Seawater Temperature Proxy Records for the Past 90 Myrs From the Shallow Shelf Record Bass River, New Jersey, Paleoceanography and Paleoclimatology, 34, 455–475, https://doi.org/10.1029/2018PA003453, 2019.
Duguay, L. E. and Taylor, D. L.: Primary Production and Calcification by the Soritid Foraminifer Archais angulatus (Fichtel & Moll)*, J. Protozool., 25, 356–361, https://doi.org/10.1111/j.1550-7408.1978.tb03903.x, 1978.
Ehrenberg, C. G.: Verbreitung und Einfluss des Mikroskopischen Lebens in Süd-und Nord Amerika, Physikalische Abhandlungen der Königlichen Akademie der Wissenschaften zu Berlin, 1841 Theil 1, 291–446, 1843.
Erez, J. and Luz, B.: Temperature control of oxygen-isotope fractionation of cultured planktonic foraminifera, Nature, 297, 220–222, https://doi.org/10.1038/297220a0, 1982.
Ertan, K. T., Hemleben, V., and Hemleben, C.: Molecular evolution of some selected benthic foraminifera as inferred from sequences of the small subunit ribosomal DNA, Mar. Micropaleontol., 53, 367–388, 2004.
Fichtel, L. and Moll, J. P. C.: Testacea microscopica aliaque minuta ex generibus Argonauta et Nautilis ad naturam picta et descripta, Camesina, Vienna, https://doi.org/10.5962/bhl.title.10295, 1798.
Frontalini, F., Losada, M. T., Toyofuku, T., Tyszka, J., Goleń, J., de Nooijer, L., Canonico, B., Cesarini, E., Nagai, Y., Bickmeyer, U., Ikuta, T., Tsubaki, R., Besteiro Rodriguez, C., AI-Enezi, E., Papa, S., Coccioni, R., Bijma, J., and Bernhard, J. M.: Foraminiferal ultrastructure: a perspective from fluorescent and fluorogenic probes, J. Geophys. Res.-Biogeo., 124, 2823–2850, 2019.
Geerken, E., de Nooijer, L., Toyofuku, T., Roepert, A., Middelburg, J. J., Kienhuis, M. V. M., Nagai, Y., Polerecky, L., and Reichart, G.-J.: High precipitation rates characterize biomineralization in the benthic foraminifer Ammonia beccarii, Geochim. Cosmochim. Ac., 318, 70–82, https://doi.org/10.1016/j.gca.2021.11.026, 2022.
Glas, M. S., Langer, G., and Keul, N.: Calcification acidifies the microenvironment of a benthic foraminifer (Ammonia sp.), J. Exp. Mar. Biol. Ecol., 424–425, 53–58, https://doi.org/10.1016/j.jembe.2012.05.006, 2012.
Goldstein, S. T.: Foraminifera: A biological overview, in: Modern Foraminifera, edited by: Sen Gupta, B. K., Springer Netherlands, Dordrecht, 37–55, https://doi.org/10.1007/0-306-48104-9_3, 2003.
Hayward, B. W., Le Coze, F., Vachard, D., and Gross, O.: World Foraminifera Database, WoRMS, https://doi.org/10.14284/305, 2023.
Hohenegger, J.: Foraminiferal growth and test development, Earth-Sci. Rev., 185, 140–162, https://doi.org/10.1016/j.earscirev.2018.06.001, 2018.
Izumida, K., Takasaki, M., Fujimaki, R., Nagai, Y., Oaki, Y., Naito, K., Tanaka, Y., Shimode, S., Toyofuku, T., and Imai, H.: Characterization of calcite spines of planktonic foraminifers (Globigerinidae), CrystEngComm, 24, 2446–2450, https://doi.org/10.1039/D2CE00110A, 2022.
James, R. H. and Austin, W. E. N.: Biogeochemical controls on palaeoceanographic environmental proxies: a review, Geol. Soc. Lond. Spec. Publ., 303, 3–32, https://doi.org/10.1144/SP303.2, 2008.
Langer, M. R.: Assessing the Contribution of Foraminiferan Protists to Global Ocean Carbonate Production1, J. Eukaryot. Microbiol., 55, 163–169, https://doi.org/10.1111/j.1550-7408.2008.00321.x, 2008.
Langer, M. R., Silk, M. T., and Lipps, J. H.: Global ocean carbonate and carbon dioxide production; the role of reef Foraminifera, J. Foramin. Res., 27, 271–277, https://doi.org/10.2113/gsjfr.27.4.271, 1997.
Lee, J. J. and Anderson, O. R.: Biology of the foraminifera, Academic Press, London, UK, 368 pp., 1991.
Loeblich, A. R. and Tappan, H. N. (Eds.): Foraminiferal genera and their classification, Van Nostrand Reinhold Co., New York USA, 1728 pp., 1987.
Murray, J. W. (Ed.): Ecology and applications of benthic foraminifera, Cambridge University Press, Cambridge UK, 426 pp., https://doi.org/10.1017/CBO9780511535529, 2006.
Murray, J. W.: Living benthic foraminifera: biogeographical distributions and the significance of rare morphospecies, J. Micropalaeontol., 32, 1–58, https://doi.org/10.1144/jmpaleo2012-010, 2013.
Myers, E. H.: The life-cycle of Spirillina vivipara Ehrenberg, with notes on morphogenesis, systematics and distribution of the Foraminifera, J. R. Microsc. Soc., 56, 120–146, https://doi.org/10.1111/j.1365-2818.1936.tb01509.x, 1936.
Nagai, Y. and Toyofuku, T.: Supplementary Movie 1: S. vivipara forming a test within 20 minutes observed from the dorsal side, TIB [video], https://doi.org/10.5446/63152, 2023a.
Nagai, Y. and Toyofuku, T.: Supplementary Movie 2: S. vivipara forming a test within 20 minutes observed from the ventral side, TIB [video], https://doi.org/10.5446/63153, 2023b.
Nagai, Y., Uematsu, K., Wani, R., and Toyofuku, T.: Reading the Fine Print: Ultra-Microstructures of Foraminiferal Calcification Revealed Using Focused Ion Beam Microscopy, Front. Mar. Sci., 5, 67, https://doi.org/10.3389/fmars.2018.00067, 2018.
Narayan, G. R., Reymond, C. E., Stuhr, M., Doo, S., Schmidt, C., Mann, T., Westphal, H., and Mateu-Vicens, G.: Response of large benthic foraminifera to climate and local changes: Implications for future carbonate production, Sedimentology, 69, 121–161, https://doi.org/10.1111/sed.12858, 2021.
Nehrke, G., Reichart, G. J., Van Cappellen, P., Meile, C., and Bijma, J.: Dependence of calcite growth rate and Sr partitioning on solution stoichiometry: Non-Kossel crystal growth, Geochim. Cosmochim. Ac., 71, 2240–2249, https://doi.org/10.1016/j.gca.2007.02.002, 2007.
Nehrke, G., Keul, N., Langer, G., de Nooijer, L. J., Bijma, J., and Meibom, A.: A new model for biomineralization and trace-element signatures of Foraminifera tests, Biogeosciences, 10, 6759–6767, https://doi.org/10.5194/bg-10-6759-2013, 2013.
OBIS: Ocean Biodiversity Information System, https://obis.org/taxon/113737, last access: 1 September 2023.
Pawlowski, J., Holzmann, M., and Tyszka, J.: New supraordinal classification of Foraminifera: Molecules meet morphology, Mar. Micropaleontol., 100, 1–10, 2013.
Schindelin, J., Arganda-Carreras, I., Frise, E., Kaynig, V., Longair, M., Pietzsch, T., Preibisch, S., Rueden, C., Saalfeld, S., Schmid, B., Tinevez, J.-Y., White, D. J., Hartenstein, V., Eliceiri, K., Tomancak, P., and Cardona, A.: Fiji: an open-source platform for biological-image analysis, Nat. Methods, 9, 676–682, https://doi.org/10.1038/nmeth.2019, 2012.
Tang, J., Niedermayr, A., Köhler, S. J., Böhm, F., Kısakürek, B., Eisenhauer, A., and Dietzel, M.: Sr2+/Ca2+ and 44Ca/40Ca fractionation during inorganic calcite formation: III. Impact of salinity/ionic strength, Geochim. Cosmochim. Ac., 77, 432–443, https://doi.org/10.1016/j.gca.2011.10.039, 2012.
ter Kuile, B. and Erez, J.: In situ growth rate experiments on the symbiont-bearing foraminifera Amphistegina lobifera and Amphisorus hemprichii, J. Foramin. Res., 14, 262–276, https://doi.org/10.2113/gsjfr.14.4.262, 1984.
Tesoriero, A. J. and Pankow, J. F.: Solid solution partitioning of Sr2+, Ba2+, and Cd2+ to calcite, Geochim. Cosmochim. Ac., 60, 1053–1063, https://doi.org/10.1016/0016-7037(95)00449-1, 1996.
Toyofuku, T., Kitazato, H., Kawahata, H., Tsuchiya, M., and Nohara, M.: Evaluation of Mg/Ca thermometry in foraminifera: Comparison of experimental results and measurements in nature, Paleoceanography, 15, 456–464, https://doi.org/10.1029/1999PA000460, 2000.
Toyofuku, T., Suzuki, M., Suga, H., Sakai, S., Suzuki, A., Ishikawa, T., de Nooijer, L. J., Schiebel, R., Kawahata, H., and Kitazato, H.: Mg/Ca and δ18O in the brackish shallow-water benthic foraminifer Ammonia “beccarii”, Mar. Micropaleontol., 78, 113–120, https://doi.org/10.1016/j.marmicro.2010.11.003, 2011.
Virtanen, P., Gommers, R., Oliphant, T. E., Haberland, M., Reddy, T., Cournapeau, D., Burovski, E., Peterson, P., Weckesser, W., Bright, J., van der Walt, S. J., Brett, M., Wilson, J., Millman, K. J., Mayorov, N., Nelson, A. R. J., Jones, E., Kern, R., Larson, E., Carey, C. J., Polat, İ., Feng, Y., Moore, E. W., VanderPlas, J., Laxalde, D., Perktold, J., Cimrman, R., Henriksen, I., Quintero, E. A., Harris, C. R., Archibald, A. M., Ribeiro, A. H., Pedregosa, F., van Mulbregt, P., and SciPy 1.0 Contributors: SciPy 1.0: fundamental algorithms for scientific computing in Python, Nat Methods., 17, 261–272, https://doi.org/10.1038/s41592-019-0686-2, 2020.
Zheng, S. Y., Cheng, T. C., Wang, X. T., and Fu, Z. X.: The Quaternary foraminifera of the Dayuzhang irrigation area, Shandong Province, and a preliminary attempt at an interpretation of its depositioal environment, Studia Marina Sinica, 13, 16–78, 1978.