the Creative Commons Attribution 4.0 License.
the Creative Commons Attribution 4.0 License.
 | 07 May 2024
Elevated atmospheric CO2 concentration and vegetation structural changes contributed to gross primary productivity increase more than climate and forest cover changes in subtropical forests of China
Félicien Meunier
Marc Peaucelle
Guoping Tang
Ye Yuan
Hans Verbeeck
The subtropical forests of China play a pivotal role in the global carbon cycle and in regulating the global climate. Quantifying the individual and combined effects of forest cover change (FCC), vegetation structural change (e.g. leaf area index (LAI)), CO2 fertilisation, and climate change (CC) on the annual gross primary productivity (GPP) dynamics of different subtropical forest types are essential for mitigating carbon emissions and predicting future climate changes, but these impacts remain unclear. In this study, we used a processed-based model to comprehensively investigate the impacts of these factors on GPP variations with a series of model experiments in China's subtropical forests from 2001 to 2018. Simulated GPP showed a significant increasing trend (20.67 , p<0.001) under the interaction effects of FCC, LAI change, rising CO2, and CC. The CO2 fertilisation (6.84 , p<0.001) and LAI change (3.79 , p=0.004) were the two dominant drivers of total subtropical forest GPP increase, followed by the effects of FCC (0.52 , p<0.001) and CC (0.92 , p=0.080). We observed different responses to drivers depending on forest types. The evergreen broad-leaved forests showed the maximum carbon sequestration rate due to the positive effects of all drivers. Both the FCC (0.19 , p<0.05) and CC (1.22 , p<0.05) significantly decreased evergreen needle-leaved forest GPP, while their negative effects were almost offset by the positive impact of LAI changes. Our results indicated that LAI outweighed FCC in promoting GPP, which is an essential driver that needs to be accounted for in studies and ecological and management programmes. Overall, our study offers a novel perspective on different drivers of subtropical forest GPP changes and provides valuable information for policy makers to better manage subtropical forests to mitigate climate change risks.
- Article
(14389 KB) - Full-text XML
-
Supplement
(8984 KB) - BibTeX
- EndNote


Terrestrial ecosystems can capture carbon dioxide (CO2) from the atmosphere through photosynthesis, which is regarded as a potential solution for slowing down the increase in global CO2 concentrations (Keenan et al., 2016) and mitigating global warming (Fang et al., 2018; Shevliakova et al., 2013). Forest ecosystems, which cover about 30 % of the global land area (Forzieri et al., 2022), are one of the main terrestrial carbon sinks (Mathias and Trugman, 2022; Pan et al., 2011) through photosynthesis (Beer et al., 2010). China's forest ecosystems, with an area of approximately 1.95×10⁶ km2 (Li et al., 2014), are mainly distributed in the subtropical regions, which are an important component of the global forest ecosystem and crucial to the global and regional climate system (Fang et al., 2010; Yu et al., 2014). However, China is still one of the world's top emitters of greenhouse gases that directly contribute to global warming (Friedlingstein et al., 2022; Yu et al., 2014). Gross primary productivity (GPP) is an important indicator reflecting ecosystem carbon sequestration capacity, which drives terrestrial carbon sequestration and partially offsets anthropogenic CO2 emissions. Therefore, precise quantification of China's subtropical forest GPP and understanding of its driving mechanisms are of great importance for scientists and policy makers to mitigate climate change and carbon emissions with the carbon sink potential of Chinese subtropical forests (Fang et al., 2010; Yu et al., 2014).
Several key national ecological restoration programmes have been implemented in China to reverse land and environmental degradation (Lu et al., 2018). As a result, China's natural and planted forest area increased by 2.3×10⁷ and 2.6×10⁷ ha during the past 2 decades, respectively (Y. Chen et al., 2021). Remote sensing observations have also identified hotspots of forest gains and greening in southern China resulting from these programmes' implementation (C. Chen et al., 2019; Tong et al., 2018). However, the subtropical regions are the most developed in China and have a very high density with more than 10 % (approximately 0.82 billion) of the world population. Intense land cover/use changes have become prominent in this region due to rapid industrialisation and urbanisation, leading to serious changes to forest ecosystems (e.g. leaf area index, LAI, and GPP) (J. M. Chen et al., 2019; Tong et al., 2018; Zhang et al., 2014). Previous studies reported that LAI was an important biotic driver of carbon sink increase in China's forest ecosystems (C. Chen et al., 2019; J. M. Chen et al., 2019). Moreover, LAI is a critical parameter for depicting vegetation canopy structure, which can influence some important photosynthetic parameters (e.g. quantum yield (α) and diurnal ecosystem respiration rate (Rd)); in particular, it can determine the amount of photosynthetically active sunlight that is absorbed by vegetation and thus influence the photosynthetic assimilation rate (Piao et al., 2020). In addition, LAI can influence the annual productivity of vegetation by determining the length of the growing season (i.e. phenology). Meanwhile, the annual mean atmospheric CO2 concentration in China has reached new highs due to large anthropogenic emissions (e.g. 407 ppm in 2017) (CMA, 2018). Elevated CO2 concentrations may enrich intercellular CO2 content in leaves and thus enhance photosynthetic rates and plant productivity (i.e. GPP) at the ecosystem scale, which is known as the CO2 fertilisation effect (Piao et al., 2020). CO2 fertilisation was also identified as the pivotal driver for enhancing carbon sink in terrestrial ecosystems, and some studies even reported that the southern region of China was more affected by the CO2 fertilisation effect than other Chinese regions (J. M. Chen et al., 2019; Zhu et al., 2016).
In addition to these drivers, annual mean temperature in the Chinese subtropical monsoon region has increased by more than 1.0 °C over the past 30 years (Fang et al., 2018), which was higher than the global surface temperature increase (Sun et al., 2019) and also influenced the China's forest carbon uptake (Gao et al., 2017; Yuan et al., 2016). Recently, several studies investigated the roles of climate factors in regulating forest GPP changes at the site or global scale (Barman et al., 2014; Ma et al., 2015), as well as in some regions of China (Ma et al., 2019; Yao et al., 2018b). For instance, previous studies showed that temperature was the major factor influencing GPP variations in the Yangtze River basin of southern China (Nie et al., 2023), as well as in other southern parts of China (Ma et al., 2019). Generally, a proper increasing temperature can promote enzyme activity and CO2 fixation (Siddik et al., 2019; Moore et al., 2021). However, when the temperature increases exceed the optimal temperature, the activity of enzymes in plants will decrease, thereby affecting their photosynthesis rates and carbon sequestration. Climate warming can also increase the vapour pressure deficit (VPD), leading to more drought stress on plants (Yuan et al., 2019). When atmospheric moisture is insufficient, plants tend to inhibit photosynthesis by reducing stomatal conductance, thereby significantly reducing GPP (Yuan et al., 2019; Grossiord et al., 2020). Furthermore, Li et al. (2022) highlighted that precipitation dominated the interannual changes in forest GPP in southwestern China, while vegetation productivity response to precipitation variations shows large spatial heterogeneity (Camberlin et al., 2007), which largely depends on topographic attributes, vegetation types, and even soil texture. However, a previous study also indicated that the GPP changes were more affected by solar radiation than by precipitation and temperature in humid regions of China (S. Chen et al., 2021). Therefore, the dominant factors affecting forest GPP varied depending on regions and timescales, and thus these studies in identifying the drivers of changes in GPP resulted in divergent conclusions. Moreover, some of recent studies mainly considered different forests as a single forest type and attempted to untangle the individual and combined impact of different factors on forest GPP changes (S. Chen et al., 2021; Zhang et al., 2022). However, the relative contributions of these factors to China's subtropical forest GPP variations of specific forest types are still not clear.
Over the past decades, different methods have been used to estimate vegetation GPP. Process-based models, especially in combination with remote sensing data (J. M. Chen et al., 2019; Liu et al., 1997), are by far one of the most important tools for studying different forests by explicitly representing processes and their interactions with the environment and for disentangling the drivers of GPP variations over multiple spatiotemporal scales. The Boreal Ecosystem Productivity Simulator (BEPS) was developed based on the FOREST-BGC model (Running and Coughlan, 1988), which is a process-based diagnostic model and has the advantage of incorporating remote sensing data (e.g. LAI and land cover type) to represent the solid biophysical processes. Recently, the BEPS model has been widely used to simulate carbon fluxes at the regional and global scales (J. M. Chen et al., 2019, 2012; Liu et al., 1997; Luo et al., 2019; M. Wang et al., 2021). Although it has been well evaluated and validated in China (Feng et al., 2007; Liu et al., 2018; Peng et al., 2021; Wang et al., 2018), it has not been used to unravel the drivers of different forest changes.
Therefore, in this study, we focus on the subtropical forest ecosystems of China. The BEPS model is used to simulate the GPP of different subtropical forests. The specific objective of this study is to (1) test the performance of the BEPS model in simulating the GPP of China's subtropical forest ecosystems, (2) quantify the spatiotemporal trends in the GPP of different forest types across the subtropics, and (3) disentangle the relative effects of forest cover change, climate change, LAI change, and CO2 fertilisation on different forest GPP variations in the study area. The results of this study can provide forest managers with a basic reference on the carbon sequestration potential of different Chinese subtropical forests. Moreover, investigating the dynamics of GPP and their dominant driving factors in the study area is crucial for decision-makers to adjust and optimise forest management policies promptly, so as to ensure that forests can provide the best ecological services for humans.
2.1 Study area description
In this study, we focused on China's subtropical forests, which account for approximately 64 % (∼ 1.25×10⁶ km2) of the total forested area in China. The boundary of the subtropical region was derived from the Resource and Environment Science and Data Center of China (H. He et al., 2021, 2019). It covers a latitudinal range of 21.33–33.91° N and a longitudinal range of 91.39–122.49° E and has a typical subtropical monsoon climate. The mean annual temperature was between 10.8 and 22.9 °C normally increasing from the northwest toward the southeast. The mean annual precipitation ranged from 800 mm in the north to more than 2000 mm in the south, with 80 % of precipitation concentrated in the growing season. The main forest types in the subtropical region of China include the evergreen broad-leaved forest (EBF), evergreen needle-leaved forest (ENF), deciduous broad-leaved forest (DBF), and mixed forest (MXF) (Fig. 1). There are three operating flux towers in the study area: Qianyanzhou (QYZ), Dinghushan (DHS), and Ailaoshan (ALS). A more detailed description of these flux tower sites can be found in Table S1 in the Supplement.
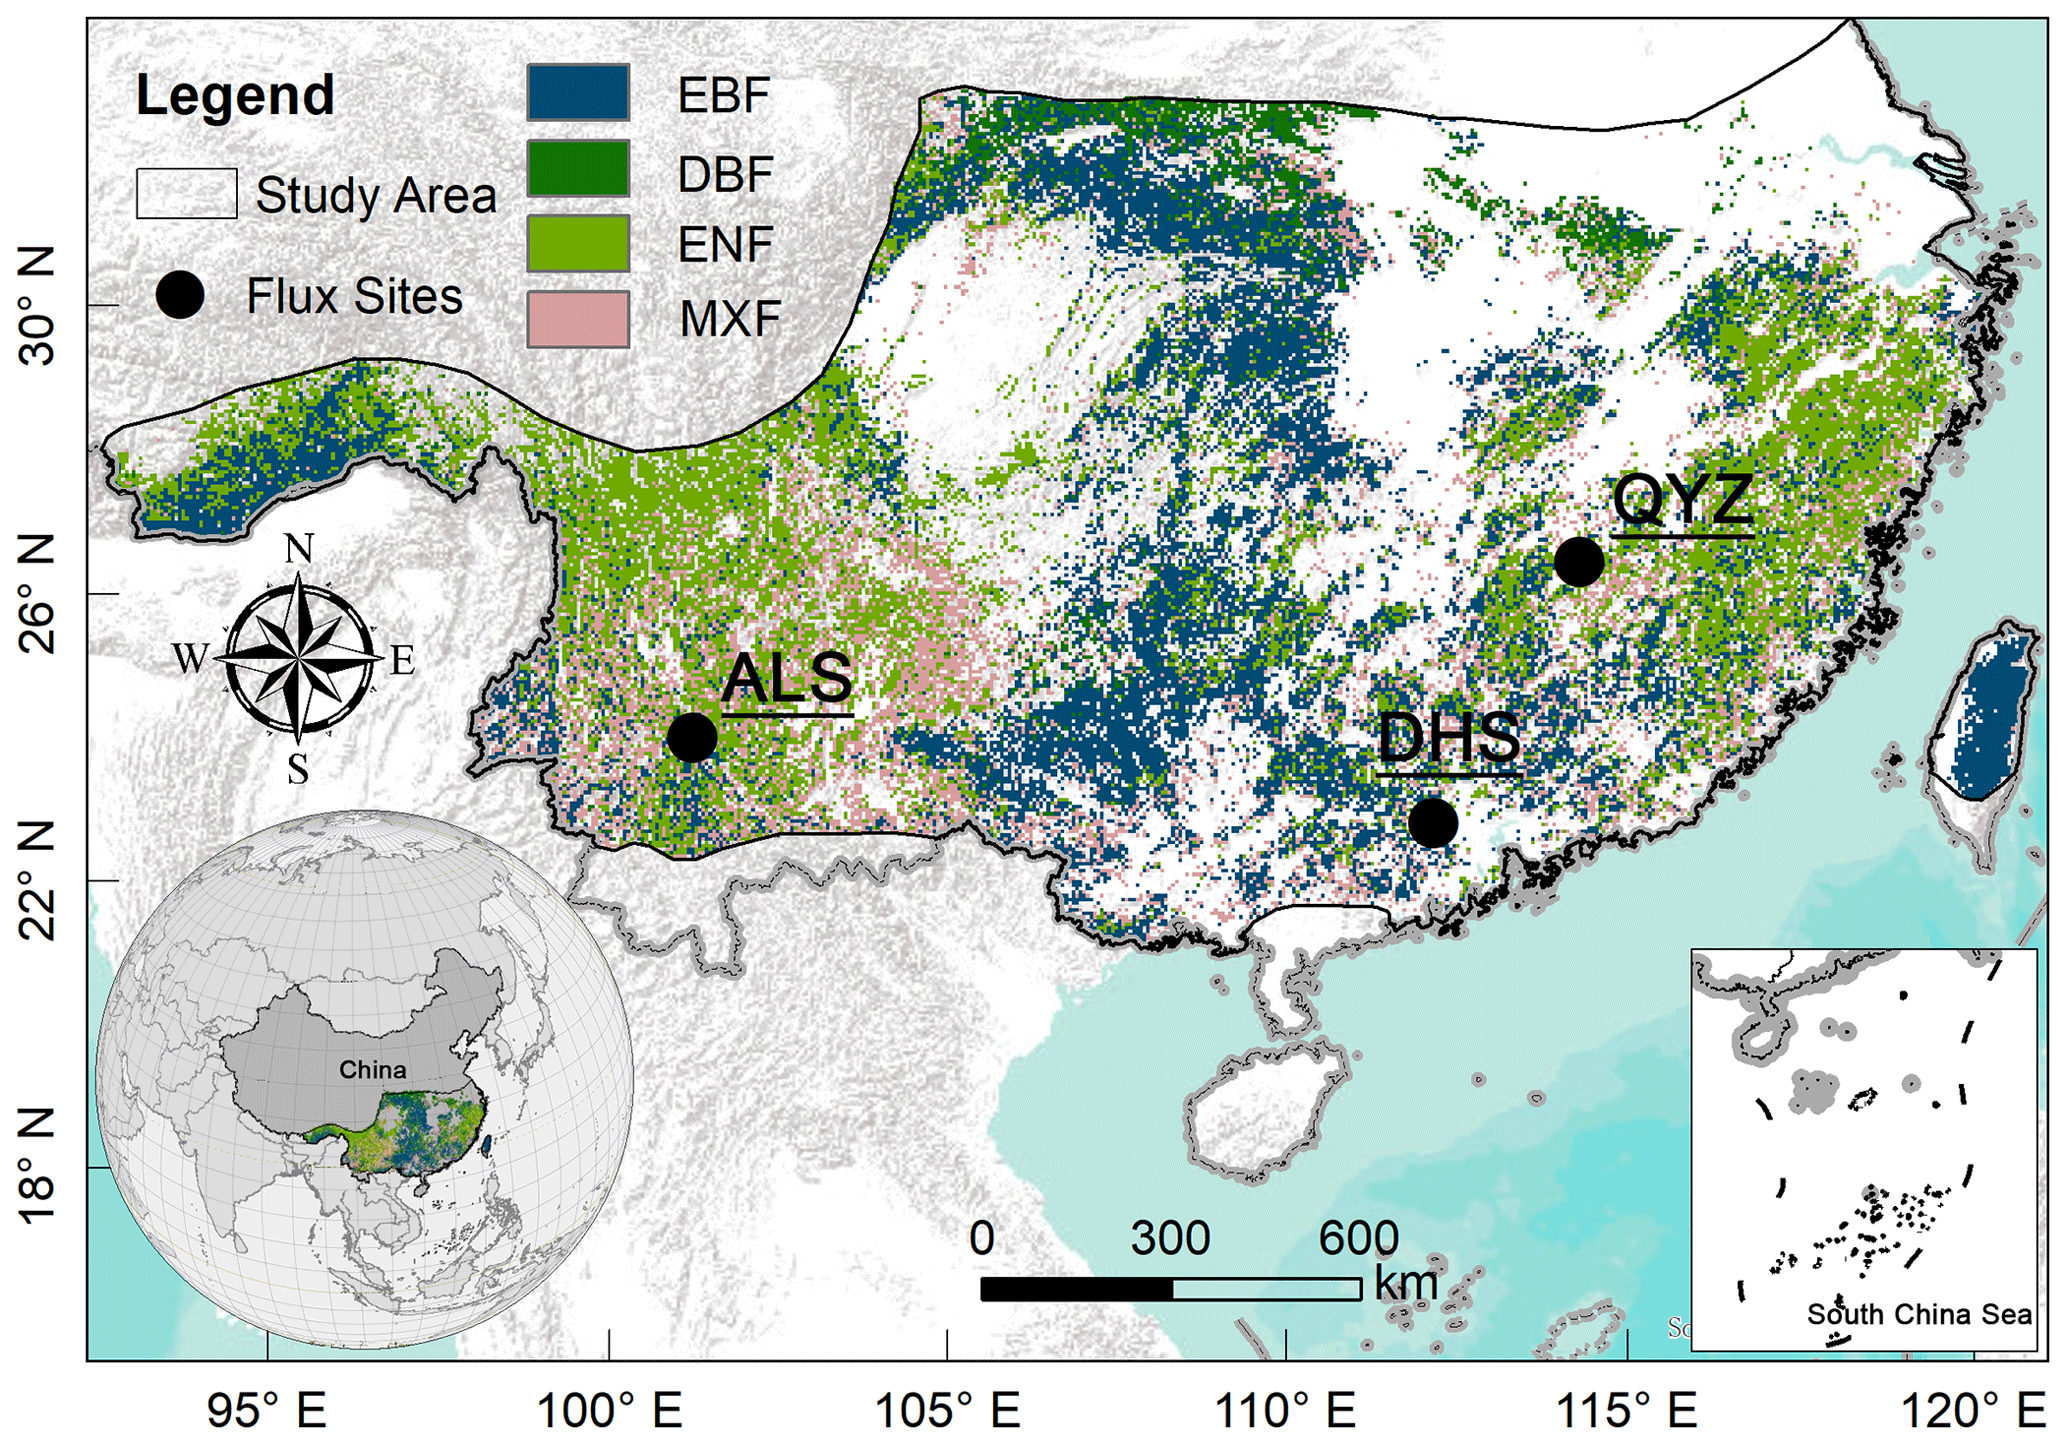
Figure 1Location of the study area and three flux sites. The forest cover map (2018) shown here was derived from the European Space Agency land cover data (ESA CCI-LC). The forest types of ALS and DHS are EBF, and the forest type of QYZ is ENF.
2.2 Model description
In this study, we used the BEPS model to simulate the subtropical forest GPP and net ecosystem productivity (NEP) with a resolution of 0.05°. The BEPS is a process-based model driven by the remotely sensed leaf area index (LAI), land cover type, soil, and meteorological data. Recently, it was used to simulate the terrestrial ecosystem carbon and water fluxes over different regions, such as the globe (J. M. Chen et al., 2019, 2012), North America (Sprintsin et al., 2012; Xie et al., 2018), Europe (Wang et al., 2003), and East Asia (Matsushita and Tamura, 2002), as well as the whole of or southern China (Liu et al., 2018, 2014; Peng et al., 2021). A more detailed description of the original BEPS can be found in Text S1 in the Supplement and previous studies (J. M. Chen et al., 2019, 1999; Ju et al., 2006; Liu et al., 1999, 1997). In BEPS, daily GPP () is calculated as (Chen et al., 1999)
where GPPsun () and GPPshade () denote the GPP per unit area of sunlit and shaded leaves; LAIsun (m2 m−2) and LAIshade (m2 m−2) respectively represent the LAI of sunlit and shaded leaves. LAIsun and LAIshade depend on the mean solar zenith angle (θ, unitless):
where LAI is the total canopy leaf area index (m2 m−2) and Ω is the clumping index (unitless).
In the BEPS model, maximum carboxylation rate Vcmax (µmol m−2 s−1) is one of the most important and sensitive parameters for influencing the photosynthetic rate of plants and estimating carbon fluxes (Croft et al., 2017; Luo et al., 2019). Vcmax mainly depends on Vcmax25 and air temperature (Ta, °C) in BEPS (see Text S1 (Eq. S4)). Generally, Vcmax25 is a commonly defined constant among different plant functional types (PFTs) in the model. However, Vcmax25 actually has large spatial variations (Table S2) due to changes in species composition, soil properties, and climate within the same PFT; even observations showed a 2–3 fold variation in Vcmax25 for the same PFT (J. M. Chen et al., 2022). As a result, using a PFT with fixed Vcmax25 in the model may distort the spatial distribution of the GPP simulation (J. M. Chen et al., 2022). Therefore, in this study, we introduced a spatial variation of Vcmax25 derived from remote sensing data to replace the constant Vcmax25 in the original BEPS model. The other parameters, including the clumping index, maximum stomatal conductance, specific leaf area, respiration coefficient for leaves, stems, coarse and fine roots, Q10 for leaves, stems, and roots, used in the BEPS model for each plant functional type can be found in Liu et al. (2018), which were specially parameterised for simulating the carbon fluxes of terrestrial ecosystems in China based on flux tower observations (Liu et al., 2013a, b, 2016) and the published literature (Feng et al., 2007; Liu et al., 2015; Zhang et al., 2012).
2.3 Data and processing
2.3.1 Flux tower data
To evaluate the models' performance, we acquired daily eddy covariance (EC)-derived GPP and NEP (net ecosystem productivity) from three flux tower sites over the study area (Fig. 1), which was available from the ChinaFLUX network (Yu et al., 2006). ChinaFLUX has undergone strict data quality control, including coordinate rotation, Webb–Pearman–Leuning (WPL) correction, and nighttime flux correction. For instance, the nighttime CO2 flux correction mainly included removing outliers when there was precipitation, CO2 concentration exceeded the instrument's measurement range, and there were fewer than 15 000 valid samples. Additionally, the u∗ threshold was also used to judge low flux values. For the QYZ and ALS stations, when the threshold of u∗ was below 0.2 m s−1, the flux data were considered unreliable and was removed. However, the threshold of m s−1 was used for DHS station, and when u∗ was below 0.05 m s−1, the flux data were rejected and removed. The net ecosystem exchange (NEE) was also partitioned into gross ecosystem productivity (GEP) and ER with the method of Reichstein et al. (2005).
2.3.2 Remote sensing data
LAI
The Global Land Surface Satellite (GLASS) LAI product from 2001 to 2018 was obtained from the University of Maryland. It was generated using the general regression neural networks (GRNNs) with a spatiotemporal resolution of 0.05° and 8 d (Xiao et al., 2016). The daily LAI at 0.05° resolution was obtained by linear interpolation of the 8 d GLASS LAI, which was used to drive the BEPS model (Wang et al., 2022). The GLASS LAI was used in this study because of its higher accuracy in China's forests compared to other satellite LAI products (Liu et al., 2018; Xie et al., 2019). For example, Liu et al. (2018) estimated the accuracy of different satellite-derived LAI products for the simulation of carbon and water fluxes in China's forests based on the BEPS model and proved that GLASS LAI showed higher accuracy in simulating forest GPP than other LAI products (e.g. FSGOM LAI and MODIS LAI). These conclusions also have been reported consistently in other studies (S. Chen et al., 2021; Jiang et al., 2017; Xie et al., 2019). Therefore, it was reasonable to use GLASS LAI as an input to model subtropical forest GPP in this study.
Satellite-derived Vcmax25 products
We obtained the spatial variation of satellite-derived Vcmax25 products from the National Ecosystem Science Data Center, National Science & Technology Infrastructure of China, from 2001 to 2018, with a spatiotemporal resolution of 500 m and 8 d. We used the annual mean Vcmax25 for each pixel that varied from 2001 to 2018, and it was further resampled to 0.05°×0.05° for driving the model. Vcmax25 product was produced by satellite-derived leaf chlorophyll content (LCC) (Xu et al., 2022) and a semi-mechanistic model (Lu et al., 2022). It has been shown that this can effectively reduce the uncertainty in the simulations of the BEPS model (Lu et al., 2022, 2020; S. Wang et al., 2020). More mechanisms for deriving Vcmax25 from remote sensing data are available in Lu et al. (2022), Luo et al. (2018), and Xu et al. (2022).
Published GPP products
To better estimate the model performance of the BEPS model, we also used five global GPP products generated by different methods to compare with our simulated GPP, which were further aggregated into 0.05°×0.05° for comparison. The five published GPP products include (a) MODIS GPP (MOD17A2H Version 6) (Running et al., 2015), (b) EC-LUE GPP generated by a revised light use efficiency model (Zheng et al., 2020), (c) NIRv GPP produced by near-infrared reflectance (NIRV) and machine learning (S. Wang et al., 2021), (d) VPM GPP produced by the vegetation photosynthesis model (VPM) (Zhang et al., 2017), and (e) another published BEPS GPP product (hereinafter referred to as BEPSg GPP), which was also generated by the BEPS model but with independently driven data and globally calibrated parameters (J. M. Chen et al., 2019; Q. He et al., 2021). See Table S3 for more details on the five GPP products.
2.3.3 Climate data
We obtained daily meteorological data including the temperature, precipitation, relative humidity, and downward solar radiation from the Climate Meteorological Forcing Dataset (CMFD) (He et al., 2020) and used them to drive the BEPS model. The CMFD is a high spatial (about 0.1°) and temporal (e.g. hourly and daily) resolution reanalysis product and covers the period of 1979–2018, which has been evaluated against the in situ meteorological data (He et al., 2020) and was widely used in previous studies (Huang et al., 2021; B. Wang et al., 2020; Yang et al., 2017). To ensure consistency with the resolution of other driving data, the CMFD was also resampled to 0.05° based on the bilinear interpolation method.
2.3.4 Land cover data
The annual land cover data sets from the European Space Agency (ESA) were used for simulations (ESA, 2017). ESA CCI land cover data have a resolution of 300 m, spanning the 1992–present period. The overall global accuracy of CCI land cover (LC) data is 75.4 %, with higher accuracy for forests (ESA, 2017). In this study, the original CCI land cover data were first aggregated into 0.05°×0.05° by using the CCI LC user tool. Considering the CCI land cover data comprised of 37 original vegetation classes, we referred to Tagesson et al. (2020) to reclassify the CCI land cover data into nine classes, including the evergreen broad-leaved forest (EBF), evergreen need-leaved forest (ENF), deciduous broad-leaved forest (DBF), mixed forest (MF), cropland (CRO), grassland (GRA), shrubland (SHR), urban (URB), and barren land (BAR).
2.3.5 Soil and atmospheric CO2 data
The available water capacity (AWC) data with a spatial resolution of 0.05° were extracted from the re-gridded Harmonized World Soil Database (RHWSD) v1.2 (FAO, 2012; Wieder et al., 2014) and were used to drive the model in this study. We also obtained the annual mean atmospheric CO2 concentration data (2001–2018) from the Hawaiian Mauna Loa observatory.
2.4 Experiment design
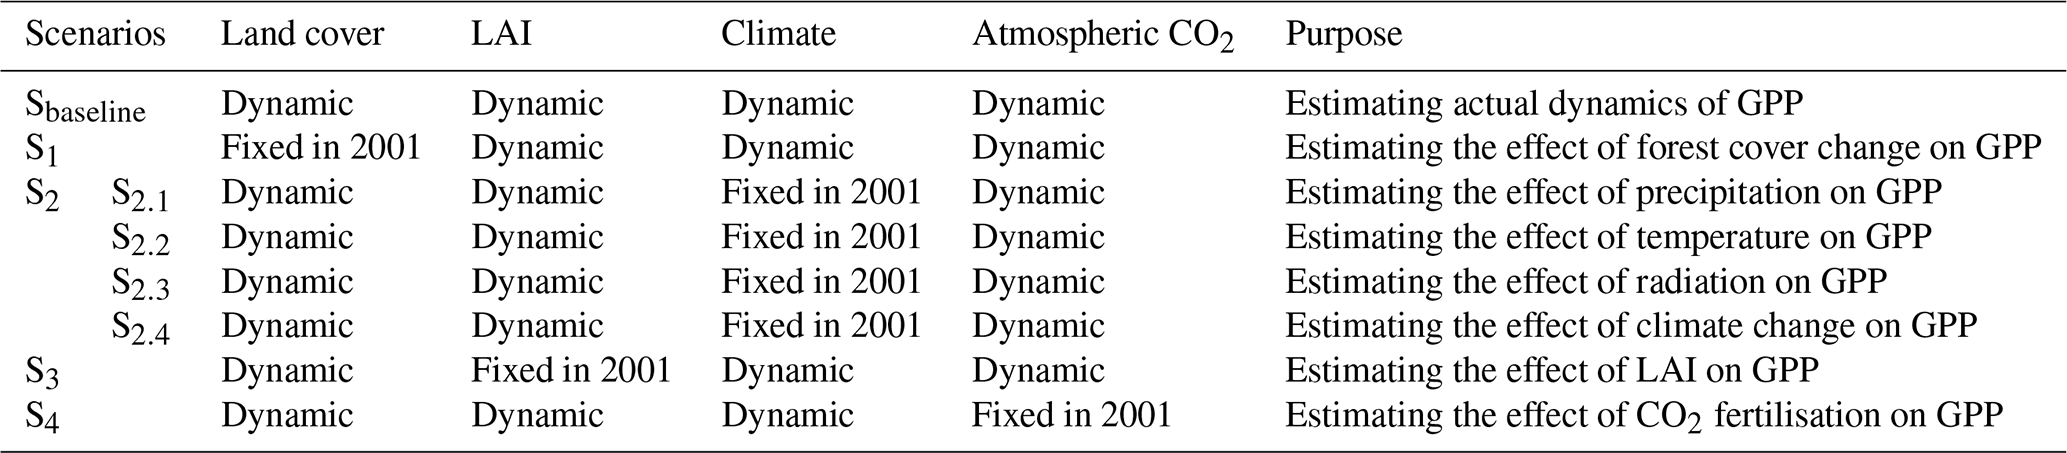
To understand the individual and combined effects of forest cover change, LAI change, CO2 fertilisation, and climate change on annual subtropical forest GPP variations from 2001 to 2018, we designed five groups of simulations in this study (Table 1). First, in scenario Sbaseline, the model was run based on all the dynamic inputs during 2001–2018, including the dynamic land cover, LAI, CO2, and all climate variables. In scenario S1, we fixed the land cover in 2001 and allowed all other driven data to vary from 2001 to 2018. In scenario S2, we conducted four different simulations to investigate how the key climatic factors (S2.1: precipitation; S2.2: temperature; S2.3: solar radiation) and all forms of climate change (S2.4) influenced the subtropical forest GPP. We individually fixed the precipitation, temperature, solar radiation, and all climatic factors to the year 2001 while allowing all other factors (i.e. land cover, LAI, and CO2) to change over time. In scenario S3, the LAI was fixed at the level of 2001, and other factors were changed over time. In scenario S4, we fixed CO2 concentration (371.31 ppm) to 2001, with other drivers being dynamic. Finally, the differences between Sbaseline and the different scenarios were calculated for estimating the effect of different drivers on subtropical forest GPP changes.
Table 1Design of the scenarios for unravelling the effect of forest cover change, LAI change, CO2 fertilisation, and climate change on subtropical forest GPP variations.
2.5 Statistical analysis
Three statistical metrics were used to assess the performance of the BEPS model in the simulation of GPP, NEP, etc. They were the coefficient of determination (R2), the root mean square error (RMSE), and the mean bias error (MBE).
The average values of 3×3 pixels centred around the flux sites (provided that these grid pixels had the same land cover type) were used to validate the predicted GPP and NEP (Peng et al., 2021; Wang et al., 2022). In addition, linear regression analysis was used to detect the long-term trend of the differences between the real and control experiments, which were considered as the impact of the controlled variables on the GPP changes.
Moreover, spatial correlation was adopted in this study to compare the spatial consistency of our simulated GPP with other GPP products. The spatial correlation was calculated pixel by pixel at the annual scale. First, two GPP time series for a certain pixel were obtained in the same period, and then the correlation between the two GPPs was calculated. Eventually, the spatial distribution of the correlation coefficients could be achieved.
3.1 Model performance
We first compared the simulated daily GPP with the flux-site GPP (Fig. 2). The overall accuracy of GPP simulated by the BEPS model agreed well with measurements from the three flux sites (ALS: R2=0.58, RMSE=1.57 and MBE=0.03 ; DHS: R2=0.44, RMSE=1.17 and MBE=0.25 ; QYZ: R2=0.77, RMSE=1.36 and MBE=0.05 ) (Fig. 2a–c). The BEPS model also showed good performance in simulating daily GPP each year (Table S4 and Figs. S1–S3 in the Supplement). For example, the R2 ranged between 0.50 and 0.72 for ALS (2009–2013), between 0.43 and 0.65 for DHS (2003–2010), and between 0.70 and 0.85 for QYZ (2003–2010). Simulated GPP also captured both the absolute values and the inter-annual variability of observed annual GPP in the three flux sites (Fig. 2d–f). Compared with the annual measured GPP, the overall accuracy (R2) of GPP simulated by the BEPS model was 0.89 (ALS), 0.53 (DHS), and 0.73 (QYZ), respectively (Fig. 2d–f). We further found that the BEPS model agreed reasonably well with measured daily NEP (Table S5 and Figs. S4–S6). The overall accuracy (R2) of simulated daily NEP was 0.25 (ALS), 0.35 (DHS), and 0.42 (QYZ), respectively (Table S5). In this study, we used the NEP for testing the model performance, because NEP (i.e. -NEE (net ecosystem exchange)) is a direct measurement of carbon fluxes between the atmosphere and ecosystems. Therefore, we used not only the observed GPP from the flux sites to validate our model, but also NEP. The validation of model performance based on measured NEP was relatively lower than that of GPP. One cause is that the simulation of NEP in the model was influenced not only by the accuracy of simulated GPP, but also by the accuracy of simulated heterotrophic respiration (Rh) and autotrophic respiration (Ra). We also compared the modelled annual NEP with the annual terrestrial sink from global carbon budget (GCB) 2023 (outputs from multi process-based models) (Friedlingstein et al., 2023). The modelled NEP and GCB showed good consistency over the 2001–2018 period in terms of the trends (0.09 Pg C yr−1 vs. 0.07 Pg C yr−1) (Fig. S7a) and Pearson's coefficient (R2=0.46, p<0.05) (Fig. S7b). Furthermore, we simulated the annual net primary productivity (NPP) based on our model and obtained 33 measured subtropical forest NPP values from the published literature to validate the simulated NPP (Table S6 and Fig. S8). The results also confirmed that our model performed well in simulating NPP (R2=0.62, p<0.001) (Fig. S8).
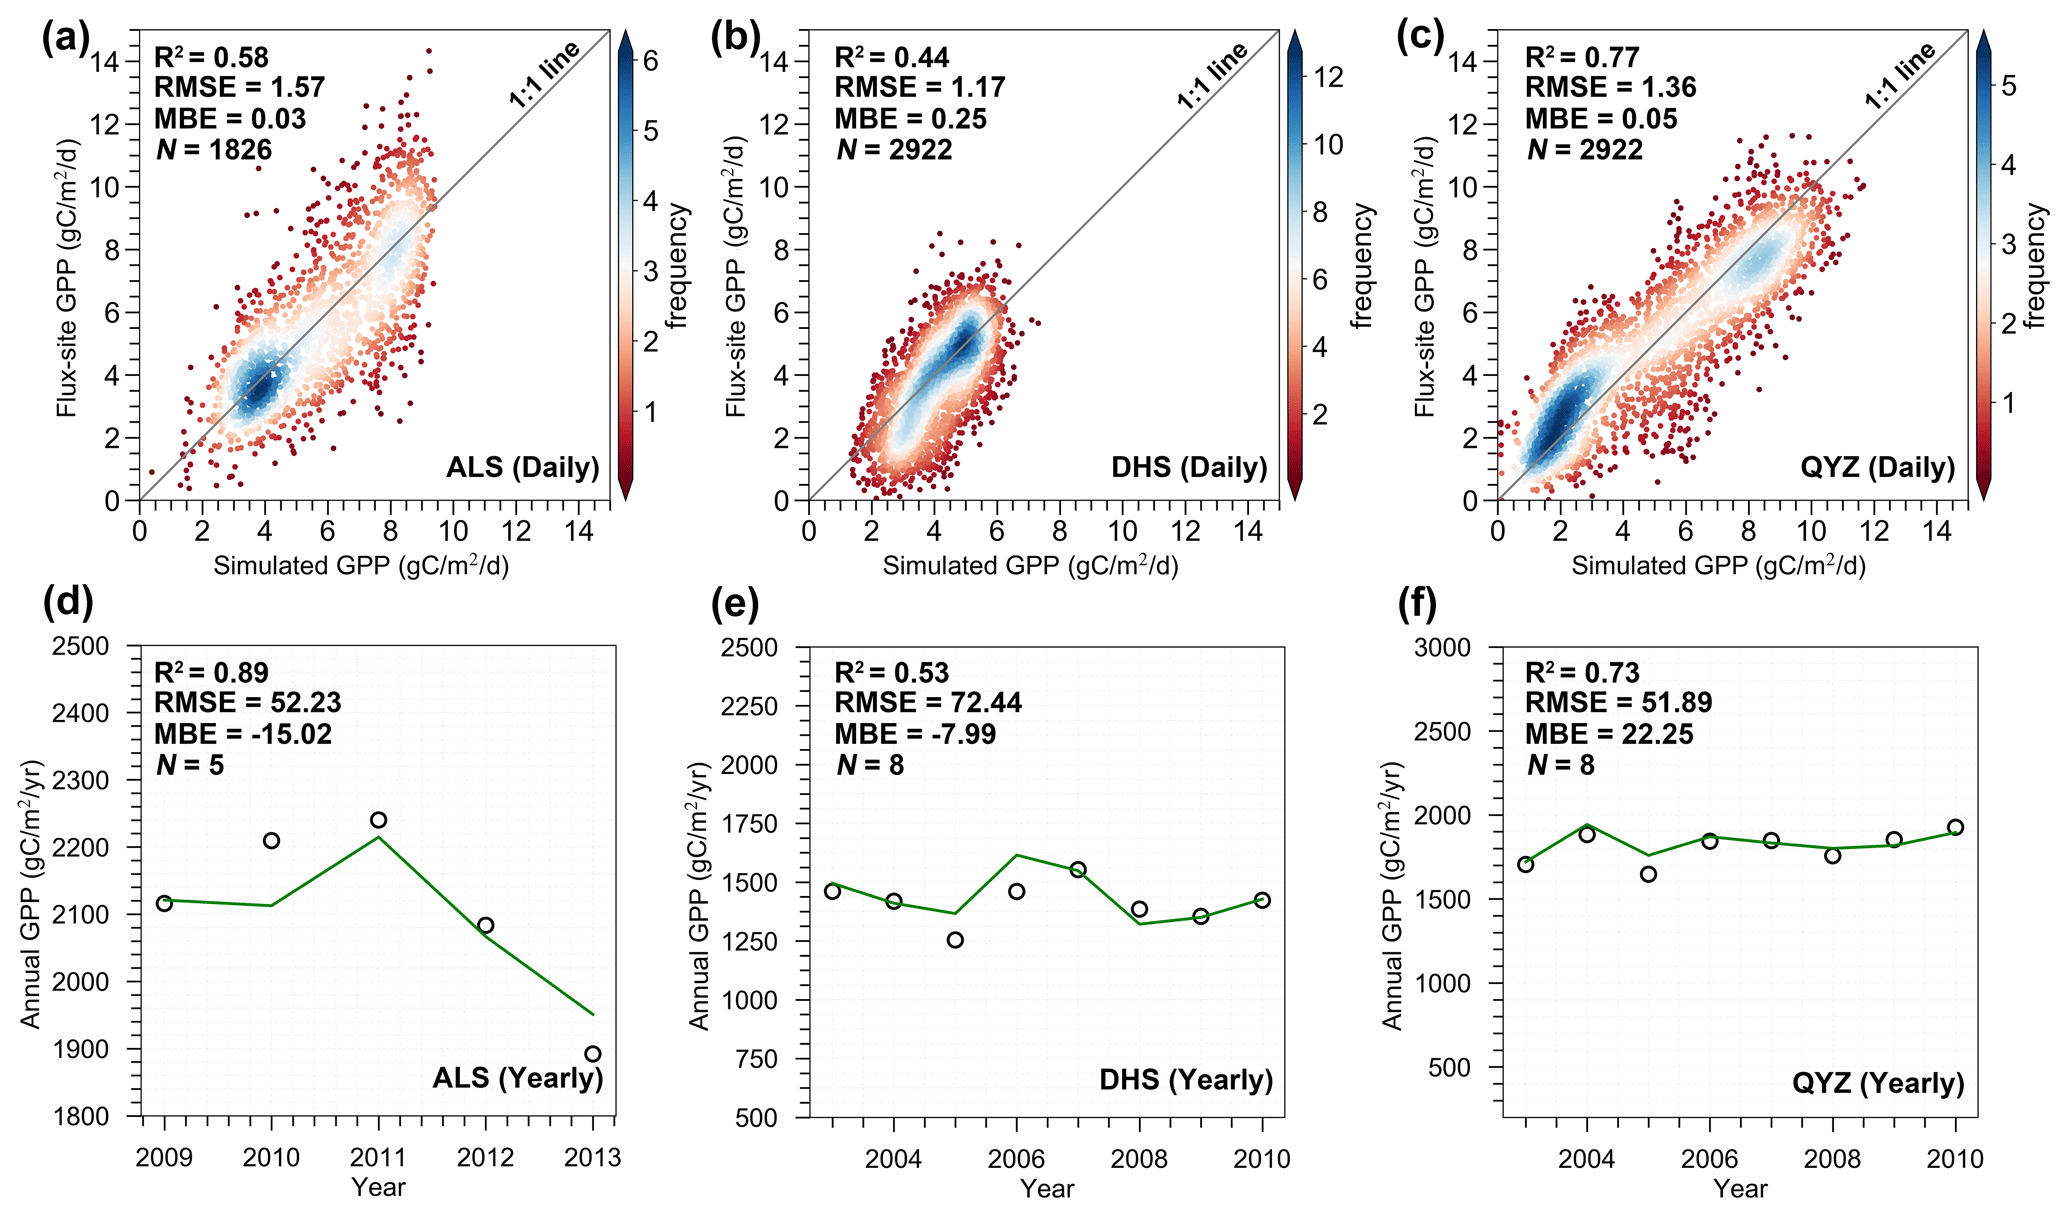
Figure 2Comparison of simulated GPP with measured GPP from three flux tower stations at daily (a–c) and annual (d–f) scales. The green lines and dark circles represent the simulated GPP and observed GPP, respectively. There may be relatively low-quality issues with observed flux data from DHS, which may affect our validation results. For example, as reported by Wang et al. (2006), the low observed values of CO2 flux are mainly caused by a CO2 leak during the nighttime at the DHS station. In addition, the effect of topography also led to generally low fluxes in the southerly direction at DHS site (Y. Li et al., 2021).
At the regional level, our BEPS model captured the spatial gradient in GPP well when compared with the other GPP products (Fig. S9). The mean R2 values between our simulated GPP and NIRv GPP, EC-LUE GPP, MODIS GPP, BEPSg GPP, and VPM GPP were 0.52, 0.67, 0.41, 0.54, and 0.41, respectively (Fig. S10f). The simulated GPP was specially consistent with the spatial pattern of the EC-LUE GPP (Fig. S10). In nearly 67 % and 34 % of forest areas, the R2 was higher than 0.6 and 0.8, respectively. Additionally, we compared the multi-year mean of annual total GPP in our study with that of other GPP products throughout the entire forest and different forest types (Fig. S11). The multi-year mean of annual total GPP for the entire forest area in our study was 2.23 ± 0.14 Pg C yr−1, close to the magnitudes of the three GPP products (i.e. BEPSg GPP product: 2.54 ± 0.16 Pg C yr−1; MODIS GPP: 2.10 ± 0.07 Pg C yr−1; VPM GPP: 2.05 ± 0.10 Pg C yr−1) and the mean of the five GPP products (2.07 ± 0.11 Pg C yr−1), respectively (Fig. S11). Meanwhile, for the entire and different forests, the annual GPP of this study and other GPP products also showed a similar increasing trend (Fig. S11f–j). For example, the trend of DBF and MXF in this study was close to the VPM GPP and the EC-LUE GPP (Fig. S11h and j). Although our simulated GPP is slightly higher for the entirety of subtropical forests, EBF and ENF as compared to other GPP products, it is very close to other GPP products for specific forest types such as DBF and MXF (Fig. S11). Similarly, these commonly used GPP products also have large differences when compared to each other (Fig. S11). These results indicate there is still a large discrepancy in modelling GPP to date, due to many differences in model structure, parameterisation, and driving data. For example, the MODIS GPP, EC-LUE GPP, and VPM GPP were simulated by different light use efficiency (LUE) models. However, most current LUE-based models do not completely integrate some key environmental regulations into vegetation productivity, such as the effect of atmospheric CO2 concentration, which may result in underestimation. In this study, GPP was simulated by a process-based model (i.e. BEPS) that considered the CO2 fertilisation effect, which may lead to a higher GPP compared to other GPP products.
3.2 Spatiotemporal variations of the subtropical forest GPP
Based on the scenario Sbaseline (Table 1), the simulated forest GPP showed a significant increasing trend (20.67 , p=0.000) during 2001–2018 over the entirety of subtropical forests due to the interactive effect of different drivers (Fig. 3a). Among the four forest types, EBF showed the largest significant increasing trend (28.24 , p=0.000), followed by DBF (20.68 , p=0.000), MXF (16.12 , p=0.000), and ENF (15.20 , p=0.000). Spatially, 90.4 % of forested land in the study area showed an increasing trend in GPP, while 9.6 % of forested land exhibited a decreasing trend in GPP (Fig. 3b). The areas with significantly increased and decreased GPP accounted for 70.1 % and 2.6 % of the entire subtropical forest area, respectively (Fig. 3b).
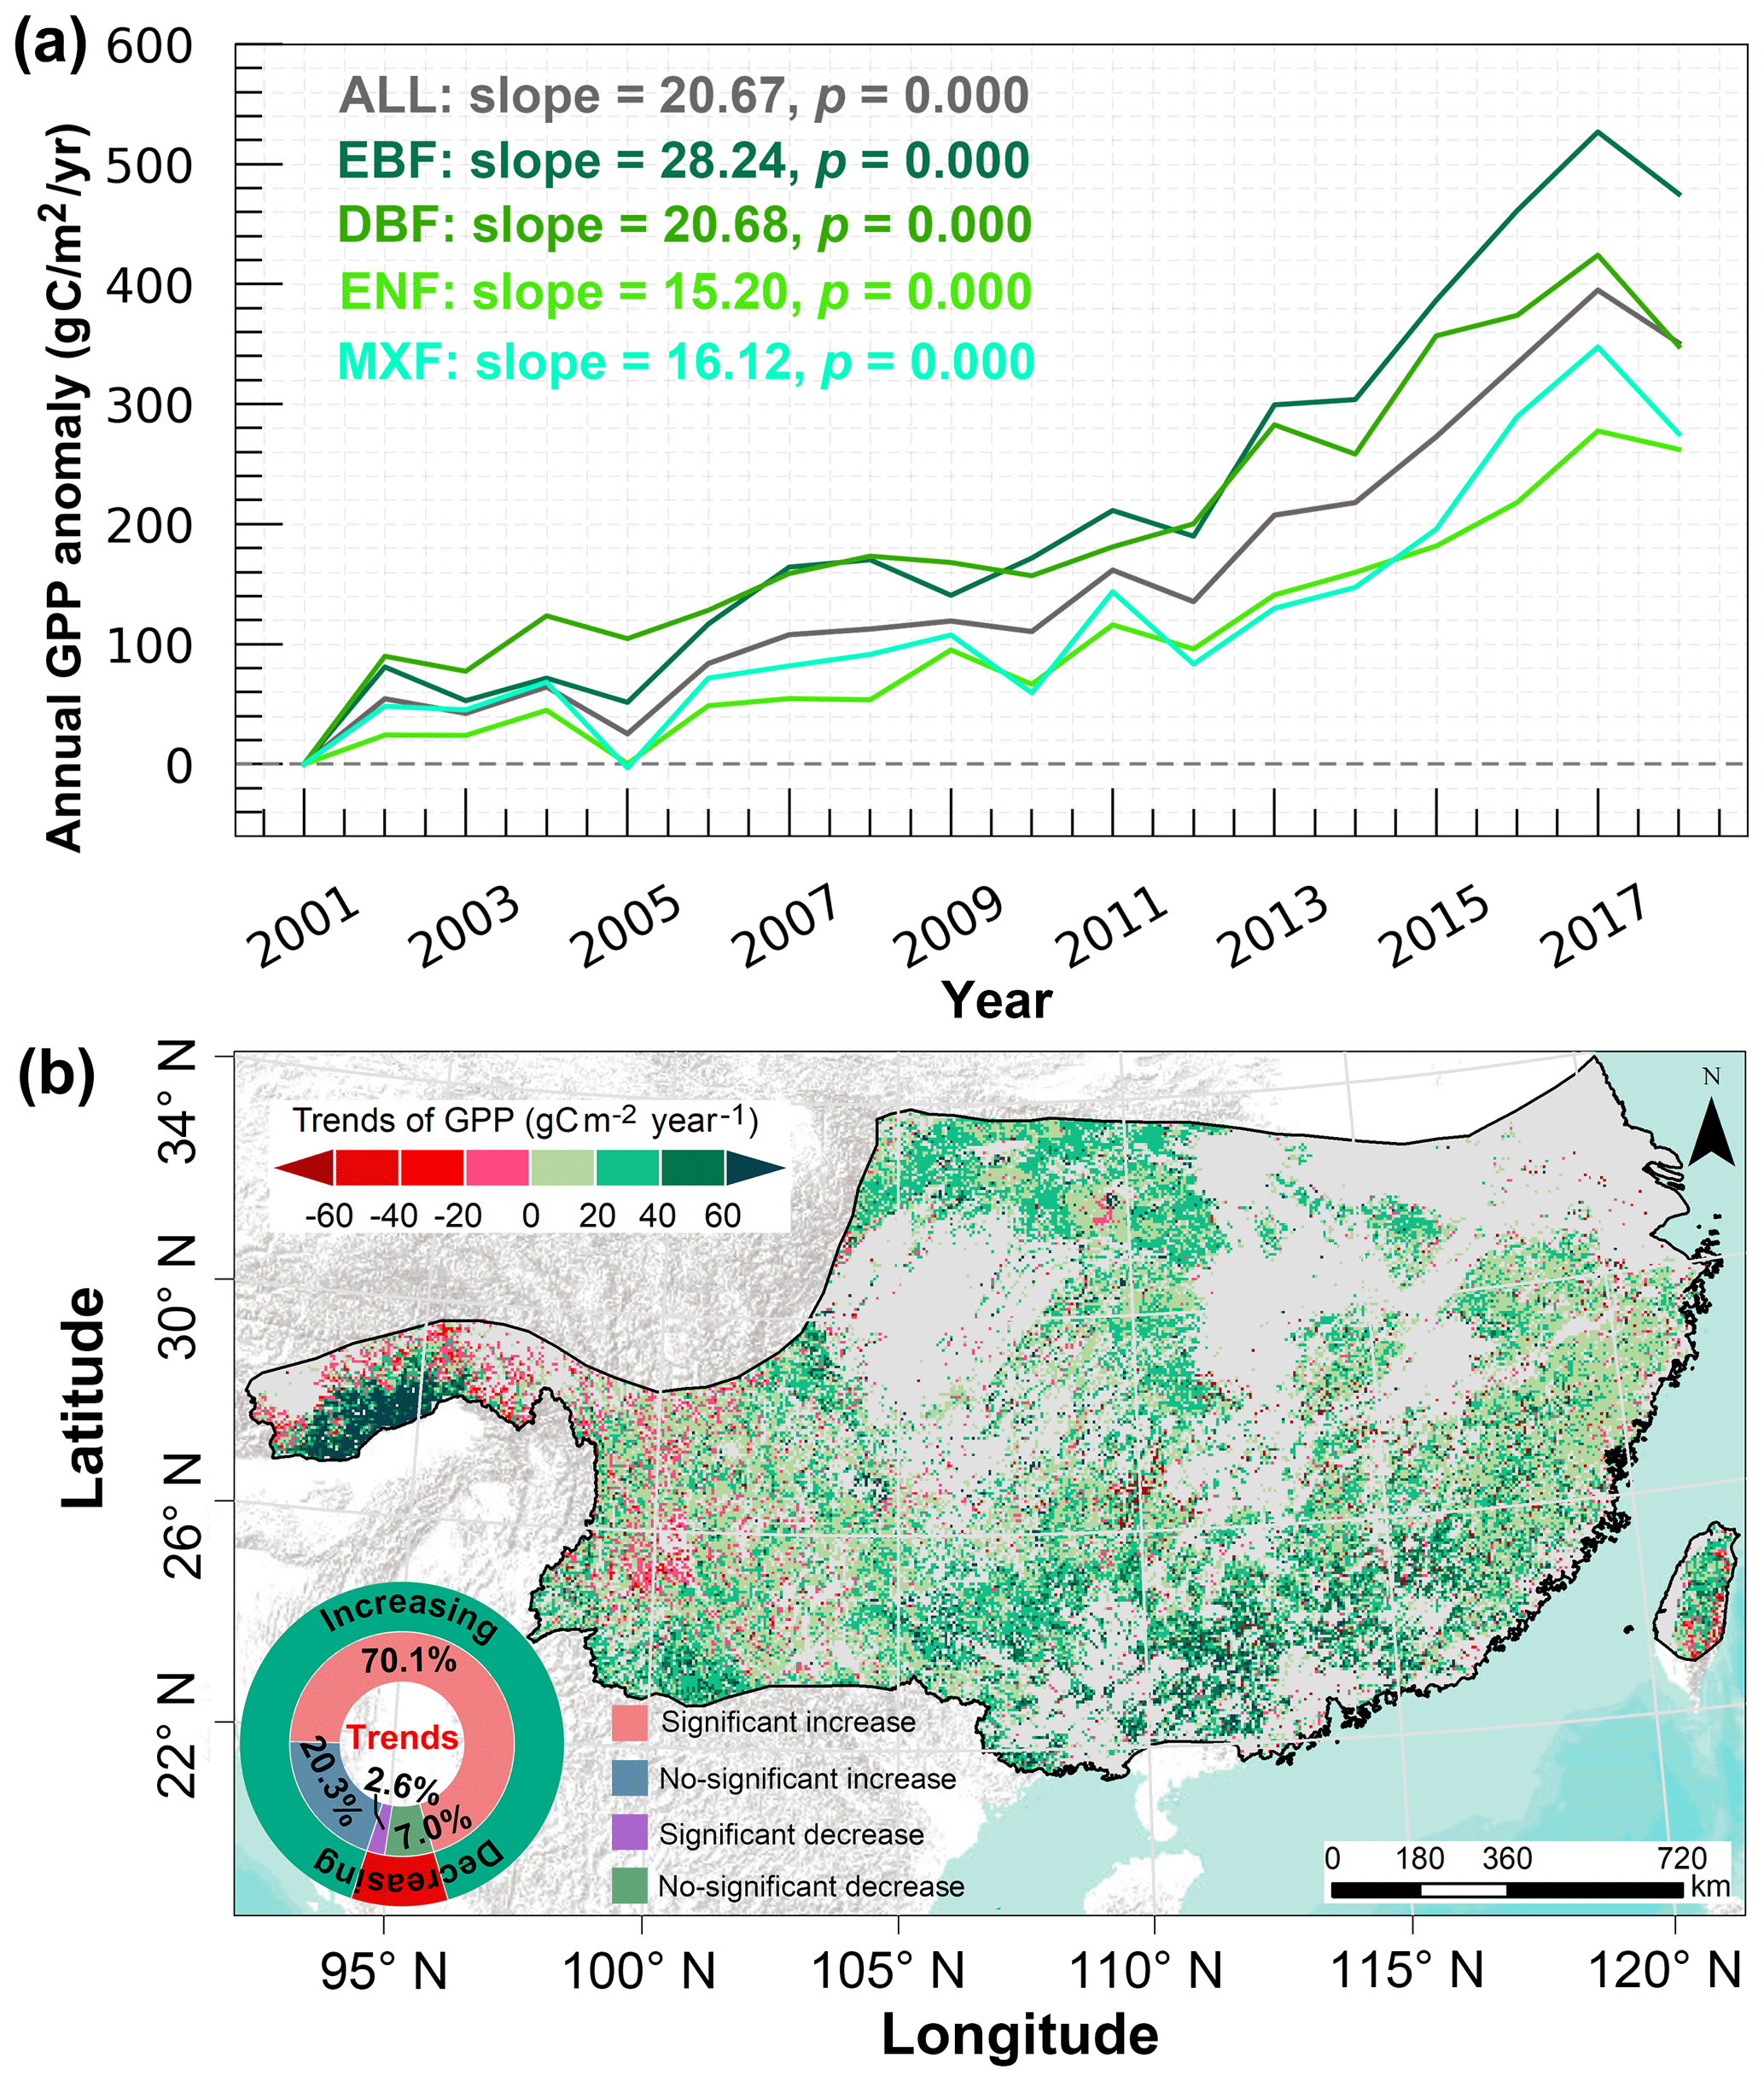
Figure 3(a) Temporal variations of the annual subtropical forest GPP anomaly during 2001–2018. The annual GPP anomaly is calculated relative to the base year of 2001. (b) Spatial distribution of the annual trends in actual GPP. Light grey within the study area indicates non-forested areas.
3.3 Disentangling the effects of driving factors on subtropical forest GPP changes
3.3.1 Impacts of different driving factors on subtropical forest GPP changes
We investigated the area of gains or losses for different subtropical forest types between 2001 and 2018 using the ESA CCI land cover data (Fig. S12). We found that forest cover change (FCC) increased the entire subtropical forest GPP at a rate of 0.52 (p=0.000) (Fig. 4a), and the increase was mainly driven by EBF GPP (0.39 , p=0.011) and MXF GPP (1.14 , p=0.000). However, FCC had a negative effect on the DBF GPP and ENF GPP variations at the rate of −0.06 (p=0.632) and −0.19 (p=0.002), respectively. Spatially, 92.2 % of the total GPP was relatively stable, and only 7.8 % of GPP exhibited an increase or decrease under the effect of FCC (Fig. 4b). Among it, 3.9 % of the GPP increased significantly and the increases were mainly located in the southwest and northern regions (e.g. the south slope of the Qinling, the southwest karst region), while 2.6 % of GPP was significantly reduced in the eastern regions where the ENF is dominated (Fig. 4b).
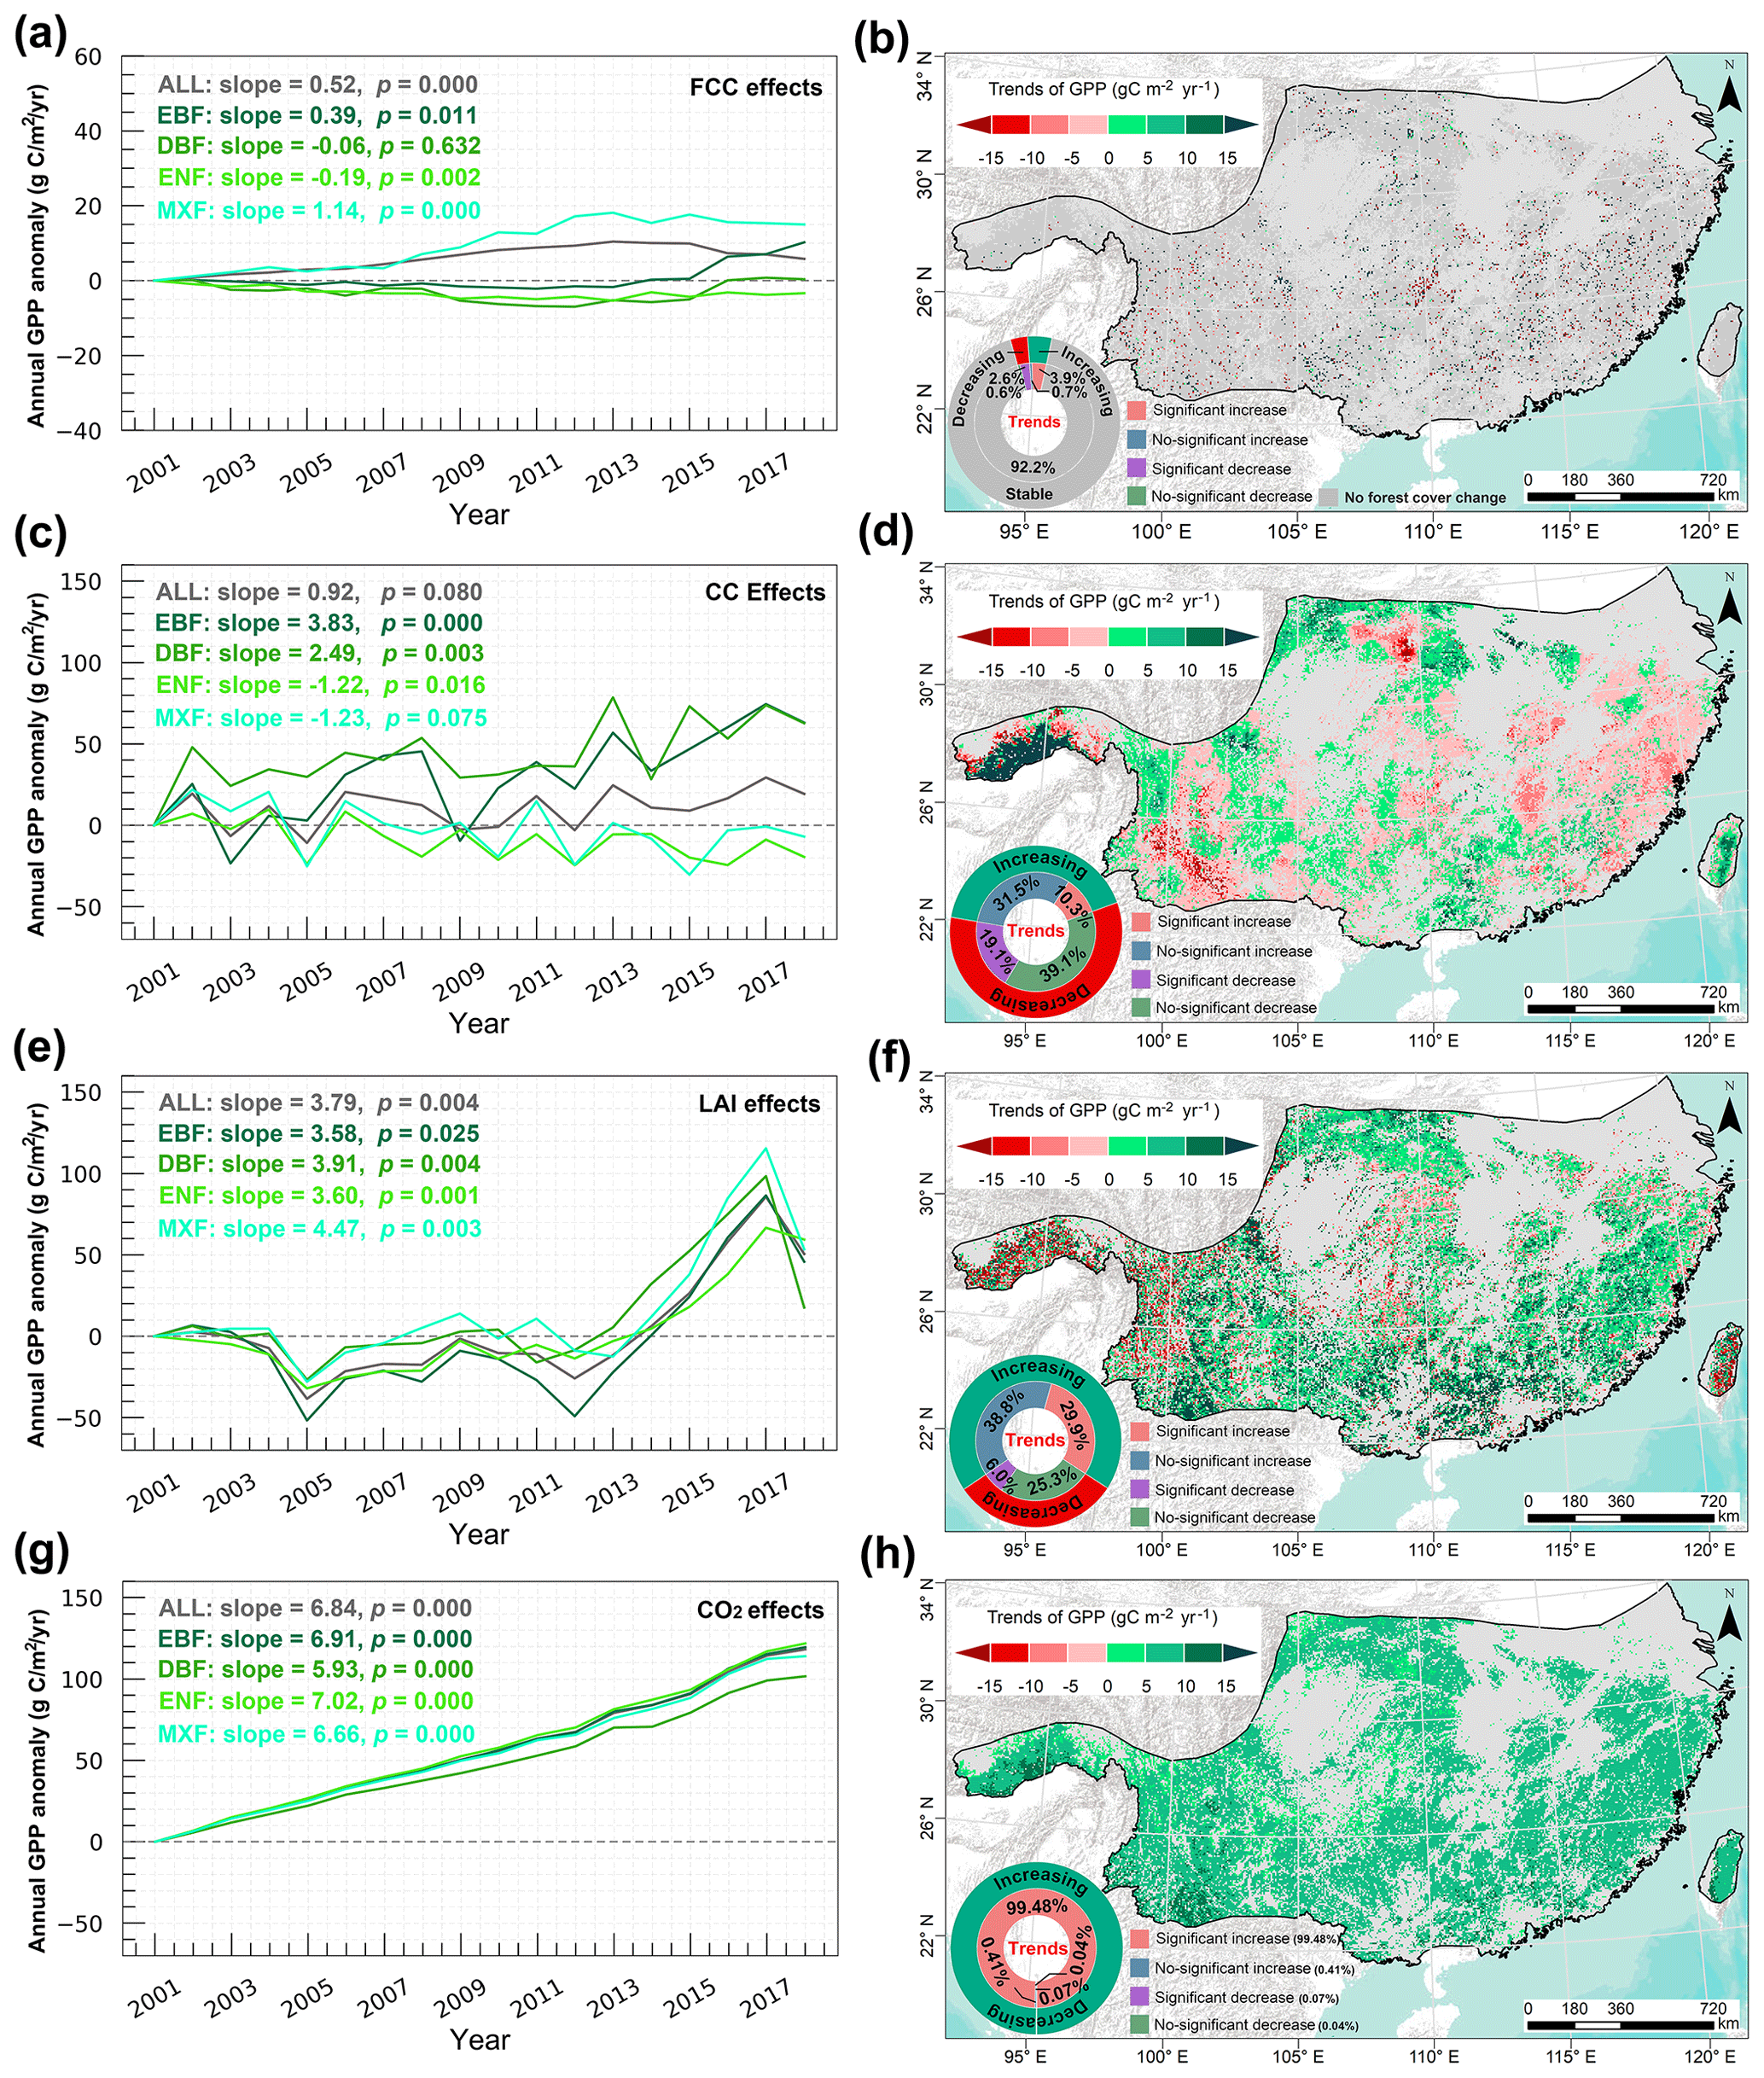
Figure 4Temporal variation of the effects of FCC (a), CC (c), LAI (e), and rising CO2 concentration (g) on annual subtropical forest GPP trends. Spatial distribution of the impacts of FCC (b), CC (d), LAI (f), and rising CO2 concentration (h) on subtropical forest GPP. Light grey in the study area indicates non-forested areas.
The annual total precipitation and annual mean temperature over the entire forest region and different forest areas showed an increasing trend, while the annual total radiation displayed a decreasing trend for the entire forest region and different forest areas (Fig. S13). The individual effects of precipitation, temperature, and solar radiation on subtropical forest GPP were first investigated in Fig. S14, and their combined effects on GPP changes were shown in Fig. 4c and d. The results showed that climate change increased GPP across the entire forest area (0.92 , p=0.080), with a significant increase in the GPP of EBF (3.83 , p=0.000) and DBF (2.49 , p=0.003), while climate change decreased the GPP of ENF (−1.22 , p=0.016) and MXF (−1.23 , p=0.075) (Fig. 4c). Spatially, 10.3 % and 19.1 % of the study area exhibited a significant upward trend and downward trend (Fig. 4d), respectively, due to the effect of climate change.
The LAI of entire and different forests showed significant upward trends during the study period (Fig. S15). The simulations showed that LAI exerted a significant positive effect of 3.79 (p=0.004) in the entire forest region (Fig. 4e), confirming the positive role of LAI in subtropical forest GPP variations. There was significant spatial heterogeneity in the effect of LAI on GPP changes (Fig. 4f). A significant (p<0.05) positive effect of LAI on GPP was observed over 29.9 % of the study area, mainly located in the south and north (Fig. 4f). The areas with a significant decreasing trend (p<0.05) accounted for 6.0 % and are mainly distributed in the western and central parts of the study area (Fig. 4f). There are more positive changes in GPP due to the effect of LAI that heavily offsets the negative changes in GPP, ultimately making LAI the second dominant factor in GPP increases throughout China's subtropical forests.
The annual mean CO2 concentration increased from 371.3 to 408.7 ppm during 2001–2018 (Fig. S16), which led to a significant increase of all subtropical forest GPP at the rate of 6.84 (p=0.000) (Fig. 4g). The significantly positive effects of CO2 fertilisation on EBF GPP (6.91 , p=0.000) and ENF GPP (7.02 , p=0.000) were higher than those of DBF GPP (5.93 , p=0.000) and MXF GPP (6.66 , p=0.000). CO2 fertilisation showed significantly positive effects on GPP in almost all of China's subtropical forests (nearly accounting for 99.48 % of the total forest area) (Fig. 4h), suggesting the high sensitivity of forests in this area to elevated CO2 concentrations.
3.3.2 Comparison of the effects among FCC, CC, LAI, and CO2 fertilisation and the dominant drivers
We compared how different drivers contribute to annual trends in GPP of different subtropical forests (Fig. 5). For all forests together, the enhanced CO2 concentration made the largest contribution to the overall GPP enhancement, followed by LAI, CC, and FCC (Fig. 5a). In addition to the CO2 fertilisation effect, LAI was another dominant contributor to subtropical forest GPP increase across the entire and different forest types (Fig. 5); especially the positive effect of LAI almost counteracts the negative effect of forest cover change and climate change on ENF GPP (Fig. 5d). The forest cover change mainly contributed to MXF GPP increase (Fig. 5e), but it also resulted in an ENF GPP decrease (Fig. 5d). Climate change increased the GPP (EBF and DBF) of broad-leaved forests (Fig. 5b and c), but it decreased ENF GPP and MXF GPP (Fig. 5d and e). Overall, the GPP of EBF in the subtropical regions of China experienced the largest annual growth rate (Fig. 5b) when compared with other forest types, and changes in GPP responses to different drivers depend on forest types.
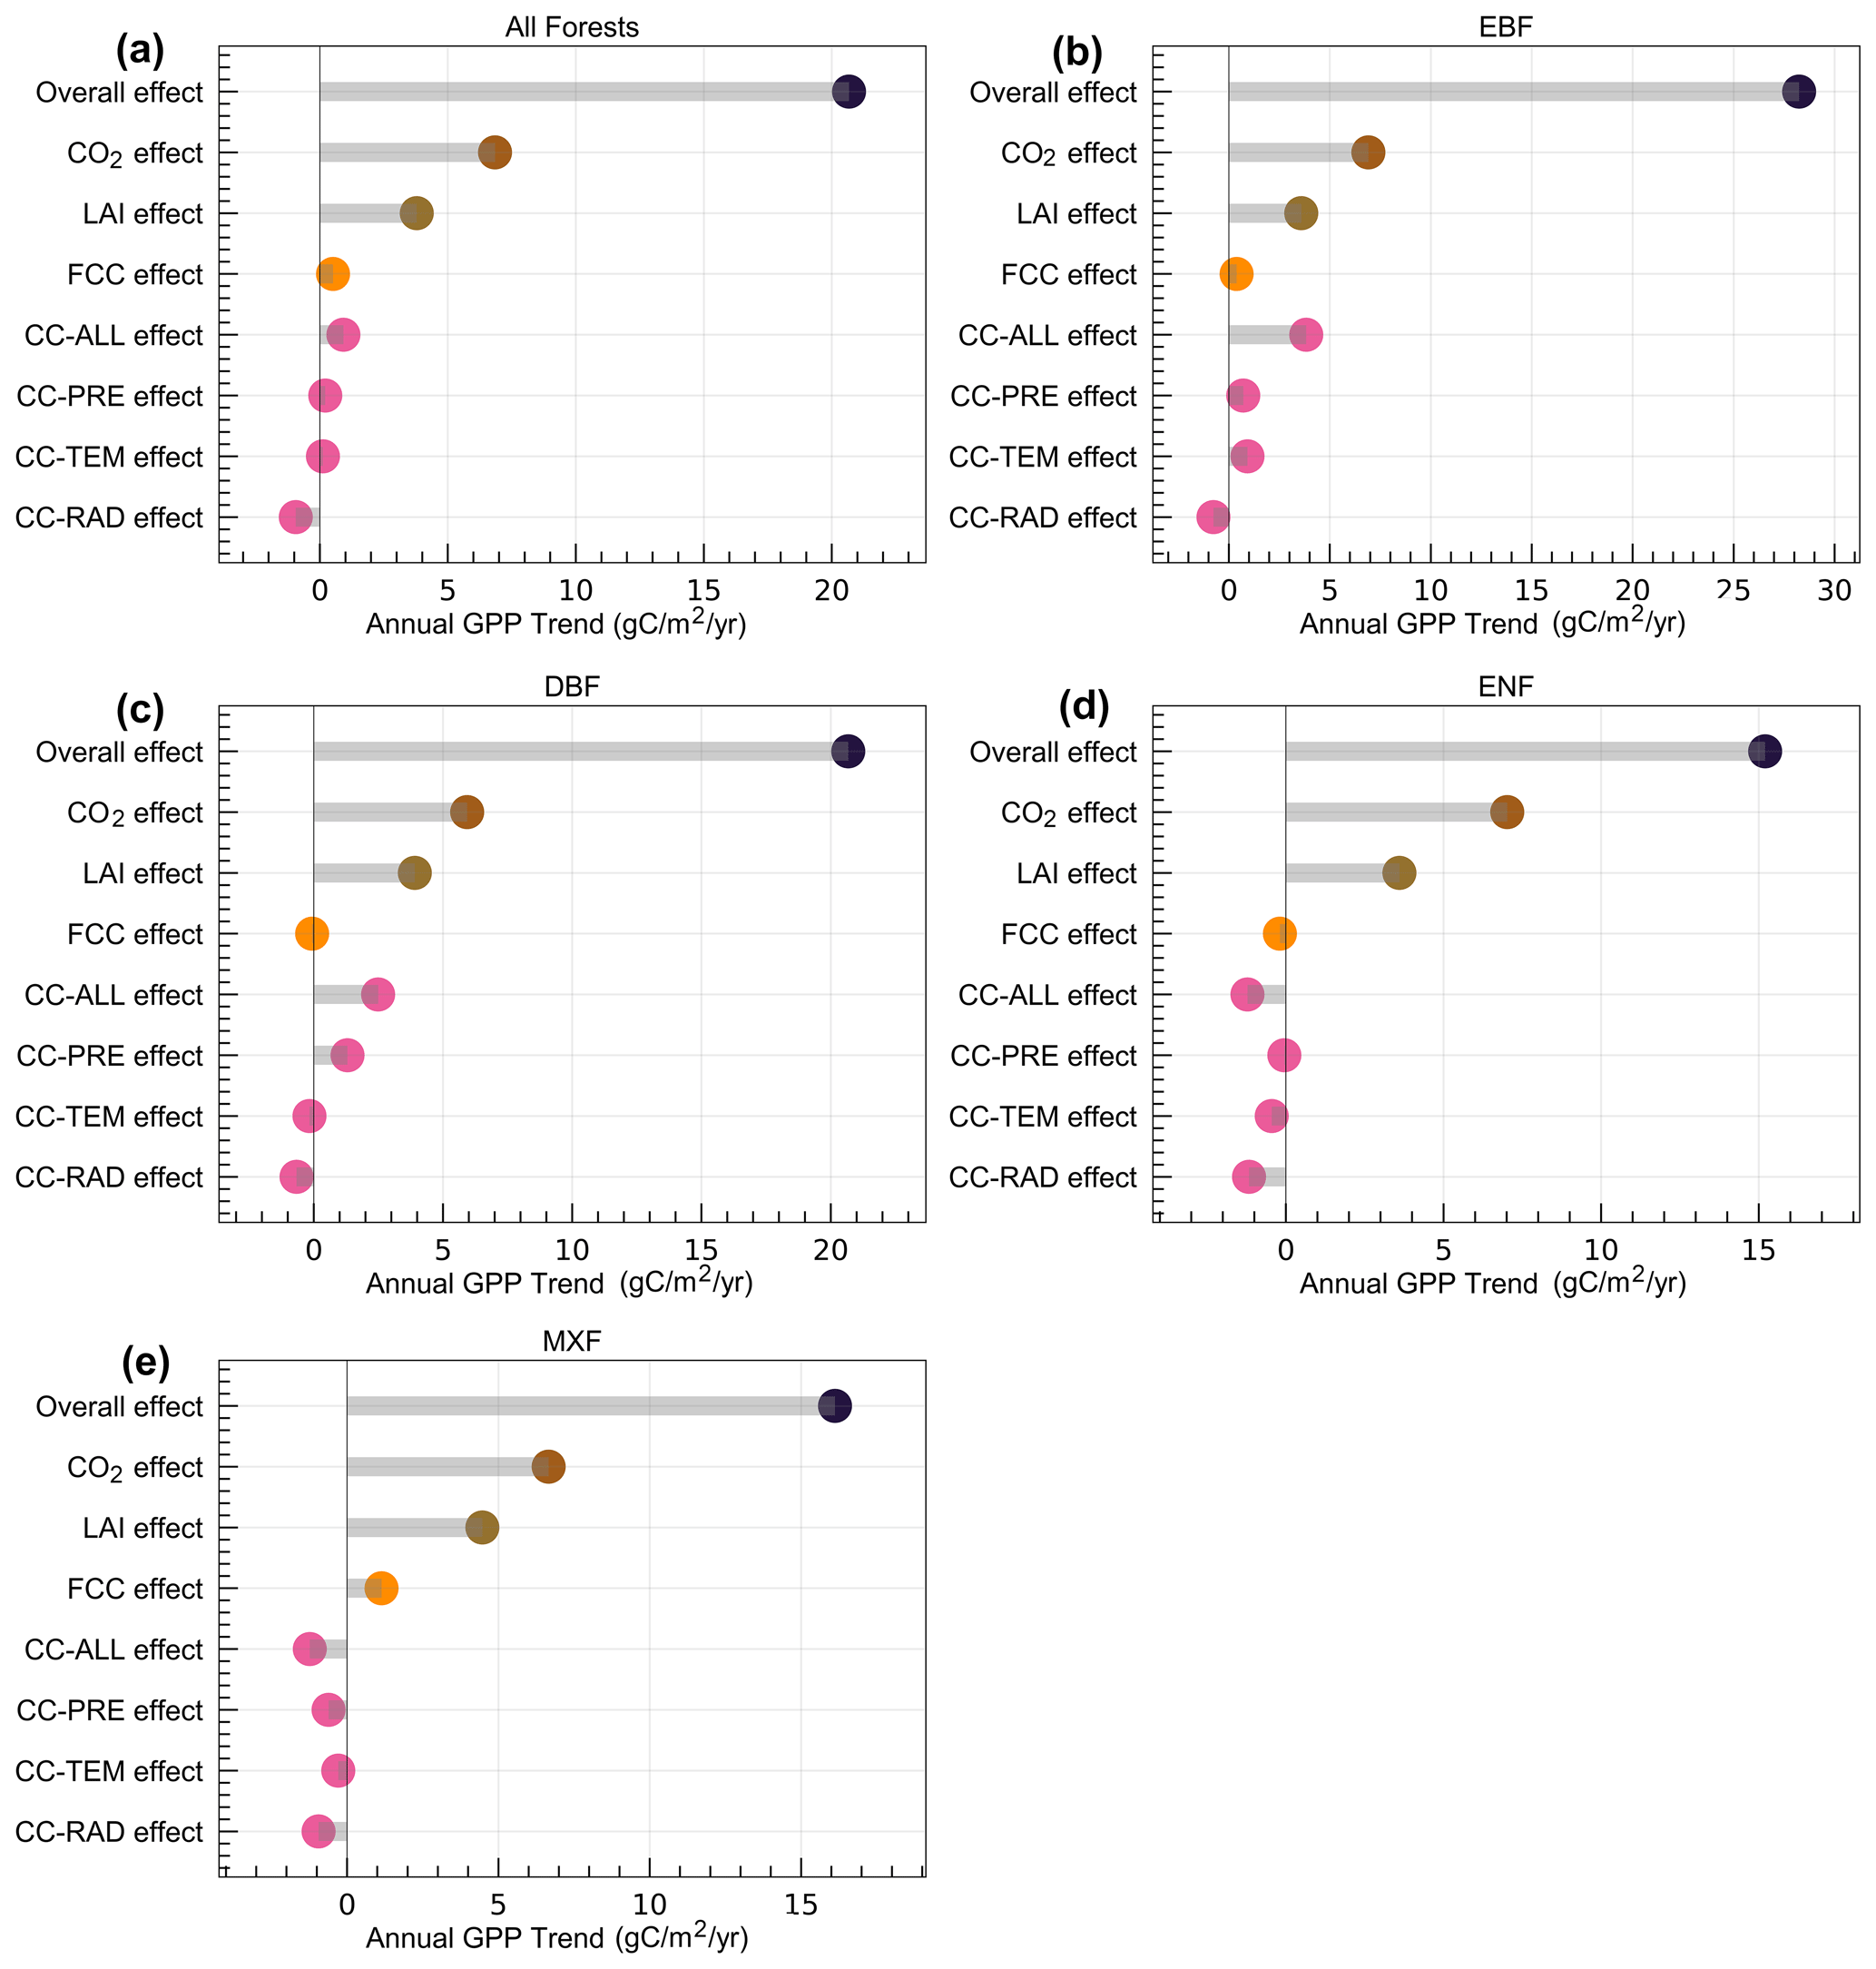
Figure 5Comparison of different trend drivers in GPP for entire (a) and different forests (b–e). The overall effect denotes the combined effect of all driving factors; the LAI effect indicates the impact of LAI change on subtropical forest GPP. FCC effect indicates the effect of forest cover change on GPP; CC-ALL, CC-PRE, CC-TEM, and CC-RAD represent the impacts of all climatic factors including, precipitation, temperature, and solar radiation on subtropical forest GPP variations.
We also investigated the spatial distribution of the effects of dominant factors on subtropical forest GPP changes at each grid cell level (Fig. 6). The results showed that the dominant factors affecting the subtropical forest GPP varied greatly in space (Fig. 6). The CO2 fertilisation (41.7 %) and LAI change (35.7 %) were the two dominant factors of subtropical forest GPP changes in most regions (Fig. 6). However, CC (8.9 %) was the dominant factor driving subtropical forest GPP to increase in the western and northern mountainous areas, and FCC (4.6 %) was the dominant driver of subtropical forest GPP decrease in the east.
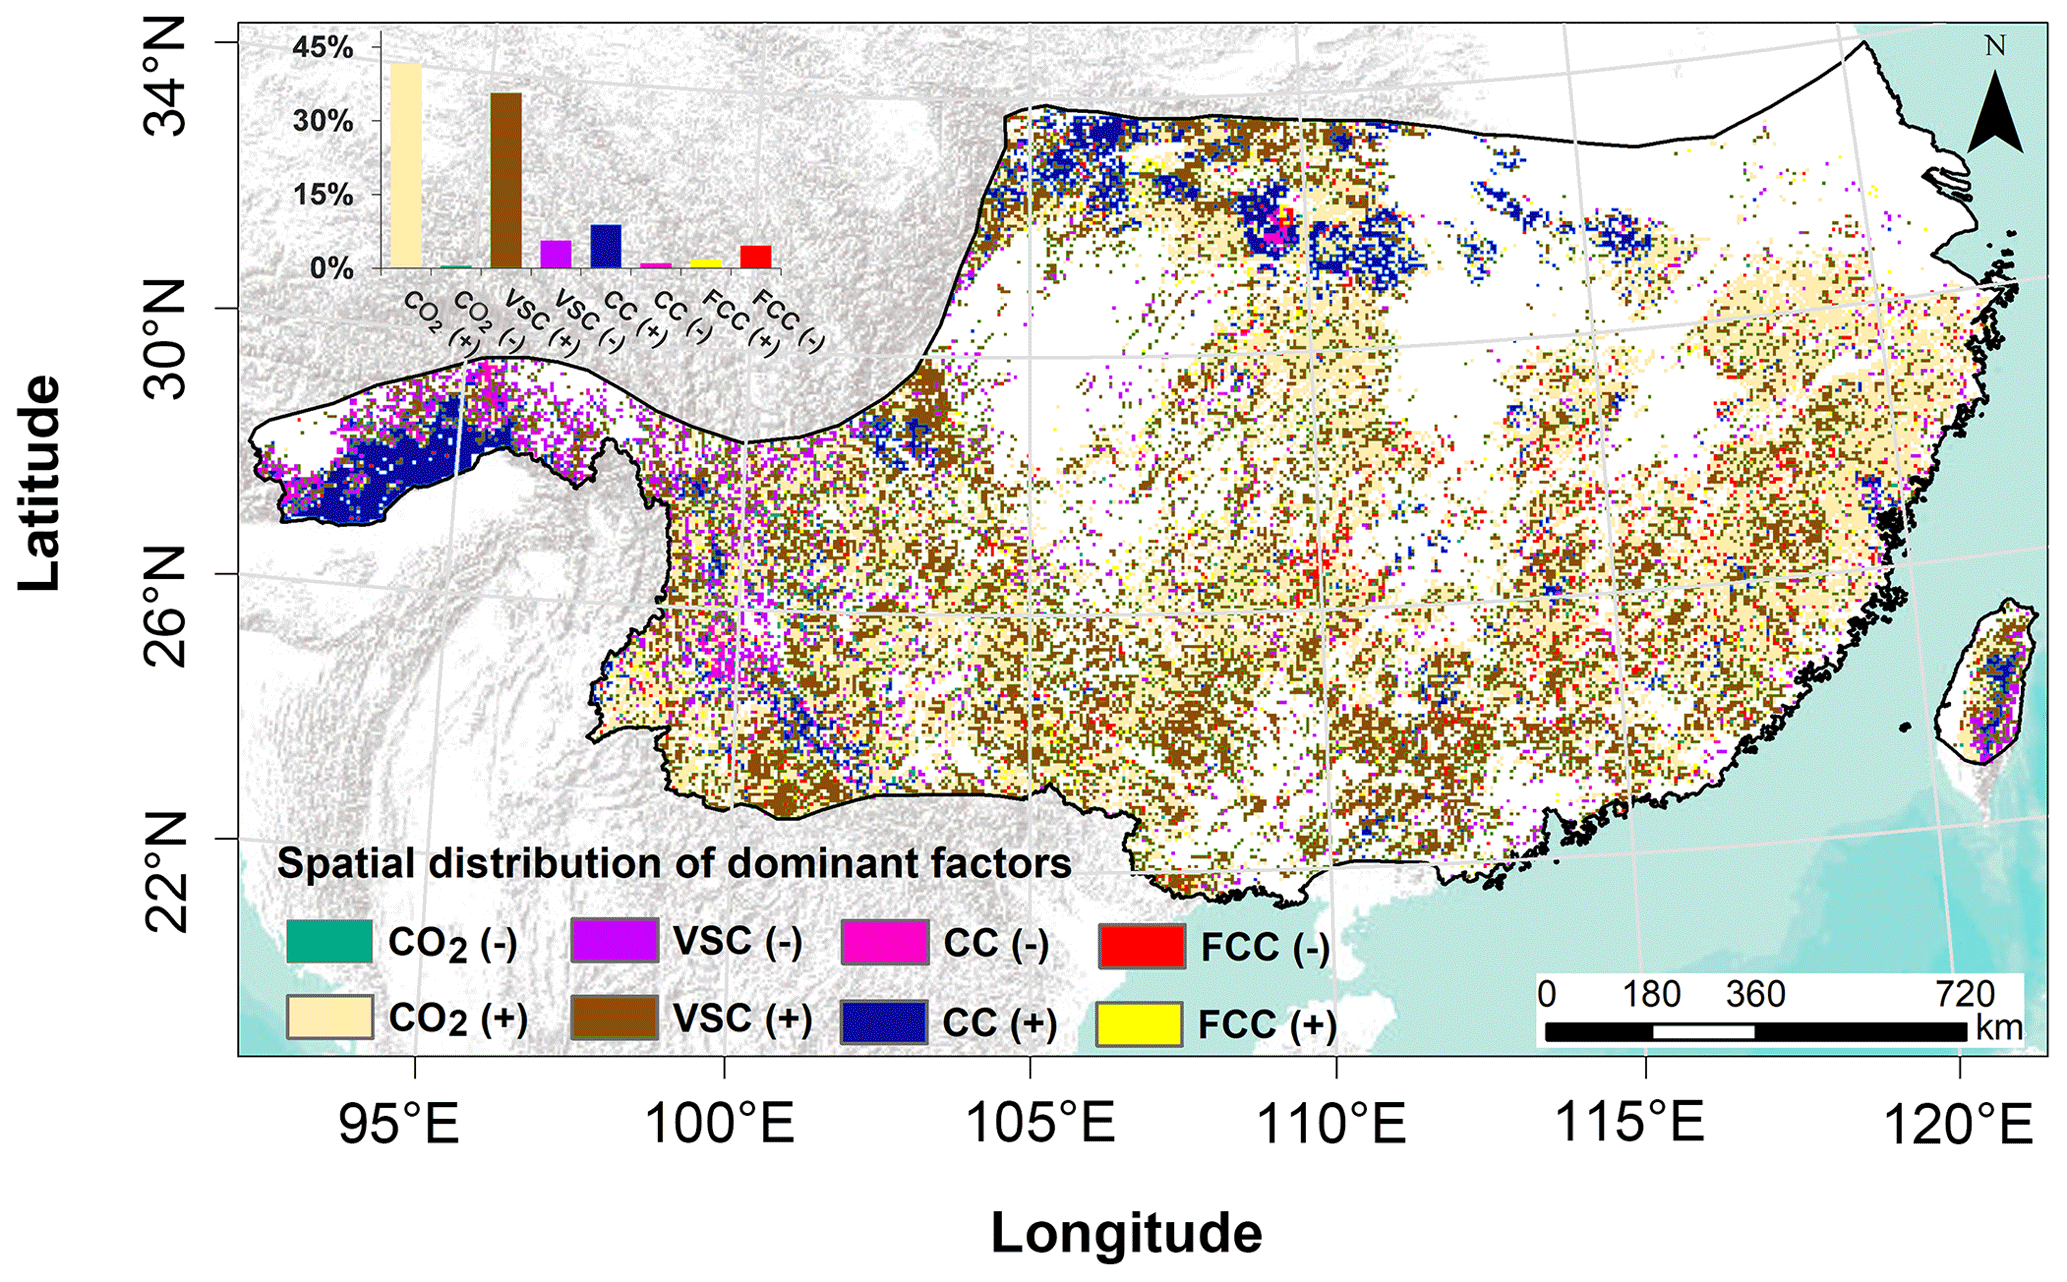
Figure 6Spatial distribution of the effects of dominant factors on subtropical forest GPP changes. The symbols (+) and (−) denote the positive and negative effects of these factors on GPP trends, respectively.
4.1 The effects of the FCC, CC, LAI, and CO2 fertilisation on subtropical forest GPP variation
Overall, the GPP in both the entire forest region and different forest types displayed an increasing trend over the past 2 decades (Fig. 3), which is in line with many previous findings (Y. Chen et al., 2021; He et al., 2019; Li et al., 2022; Tong et al., 2018). However, there were obvious differences among these factors that contribute to the increase in GPP among subtropical forests. The CO2 fertilisation effect (6.84 , p<0.001) and LAI change (3.79 , p=0.004) were the two dominant drivers of total subtropical forest GPP increase, followed by the effect of FCC (0.52 , p<0.001) and CC (0.92 , p=0.080). We also calculated the contributions of different factors to the total GPP of the study area and also found that the CO2 fertilisation effect (8.23 Tg C yr−1, p<0.001) and LAI (4.55 Tg C yr−1, p=0.005) contributed more to the increase in the total GPP of subtropical forests than that of FCC (1.35 Tg C yr−1, p<0.001) and CC (1.11 Tg C yr−1, p=0.08).
4.1.1 The effect of FCC on subtropical forest GPP
In the past 2 decades, the Chinese government has made an enormous investment to implement some key ecological restoration programmes to improve the forest areas, such as the Grain for Green (GGP, initiated in 2000) programme and the Yangtze and Pearl river basin shelterbelt programmes (Viña et al., 2016; Zhang et al., 2022). Nationwide field samplings confirmed the increase of vegetation cover and carbon sink via these ecological projects since the end of the 20th century (Lu et al., 2018). Especially, the forest restoration hotspots were observed on the south slope of the Qinling (Y. Chen et al., 2021) and the southwest karst region (Tong et al., 2018) of China. In similar regions, we also observed the positive effect of FCC on GPP (Fig. 4a and b). This is due to the increase in the total area of EBF and MXF (Fig. 4a), which is mainly converted from cropland (Table S7). For example, our statistics showed that, before conversion, the regional average GPP of cropland in 2001 was 1732.40 , whereas after the cropland was converted to EBF, the regional average GPP was 1935.69 in 2018, an increase of 203.29 .
Previous studies (S. Chen et al., 2021; Y. Chen et al., 2021; Zhang et al., 2022) usually considered different forests in China as a single forest type, which may ignore the different effects of a specific forest type on forest GPP variations. In this study, we identified the positive effect (0.52 ) of FCC on GPP for all subtropical forest types together. However, contradictions with previous results were also found. The total area of ENF was reduced obviously during the study period in eastern and southern regions, and most of it was converted to MXF (19 040 km2) and cropland (13 100 km2) (Table S7). Here, we further counted the changes in GPP caused by conversion between ENF and MXF and cropland and found that the decrease in ENF GPP of 268.65 due to the conversion between ENF and cropland (i.e. ENF=2120.51 in 2001; ENF=1851.86 in 2018) was greater than the increase in the ENF GPP of 141.24 due to the conversion between ENF and MXF (i.e. ENF=1436.65 in 2001; ENF=1577.89 in 2018), ultimately resulting in a slight decrease in ENF GPP (Fig. 4a). This side effect may be overlooked if different forest types are not considered. For example, the reduction in ENF GPP (−0.19 ) mainly located in the eastern and southern regions was offset by the GPP of EBF and MXF (total: 1.53 ) in most regions (Fig. 4a and b). Therefore, under the influence of FCC, the entire subtropical forest GPP showed an increasing trend (0.52 ) (Fig. 4a).
4.1.2 The effect of CC on subtropical forest GPP
Under the combined effect of all climatic factors, an overall increase (0.92 ) in subtropical forest GPP was observed in the study area (Fig. 4c). However, different climatic factors play different roles in regulating subtropical forest GPP changes (Fig. S14). Precipitation increased the whole subtropical forest GPP (0.21 ) (Fig. S14a), especially in the northern and western mountains (Fig. S14b). This is because the slight increase in precipitation in these areas, without exceeding a certain threshold, can increase soil water availability and alleviate drought stress on forest growth, thereby facilitating forest photosynthesis and enhancing GPP (He et al., 2019; Li et al., 2022). Temperature is another complex driver of forest GPP variation. Many studies suggested that an increase in temperature can benefit vegetation productivity (Myneni et al., 1997; Nemani et al., 2003; Song et al., 2022) or could reduce vegetation productivity due to increased VPD as a result of a high temperature increase (Yuan et al., 2019; Lopez et al., 2021). Our findings also proved that the effect of temperature on subtropical forest GPP varied spatially (Fig. S14d). Most of the region (59.7 %) experienced a decline in subtropical forest GPP due to the effects of climate warming, while 40.3 % of subtropical forest GPP mainly located in the western mountains displayed a significant upward trend (Fig. S14d). This is because the increase in temperature in mountainous areas can extend the growing season and enhance photosynthesis (Nemani et al., 2003; Piao et al., 2005; Zhang et al., 2014), thereby improving subtropical forest GPP. The magnitude of GPP increase in these small areas is significantly higher than in other regions, because temperature, precipitation, and radiation all contribute to an increase in GPP in these areas (Fig. S14). Although the area of GPP reduction due to temperature is relatively large, the magnitude of the impact is relatively small, resulting in smaller areas with higher magnitude offsetting the larger areas of GPP decrease. On the contrary, solar radiation in this study showed a downward trend (Fig. S13e and f). As a direct limiting factor of vegetation growth, the reduction of solar radiation can directly affect forest photosynthesis, thus reducing subtropical forest GPP. As expected, solar radiation in this study declined GPP over 67.2 % of the total area (Fig. S14f), which may be associated with the recent increase in air pollution in China (S. Chen et al., 2021; Zhang et al., 2014). The combined effects of these climatic factors caused a positive effect (0.92 ) on the entirety of studied subtropical forest GPP, while different forest types showed different responses to climate change (Fig. 4c). For example, climate change has a positive effect on the GPP of EBF but a negative effect on the GPP of ENF. The main reason is that ENF is predominantly located in the eastern and western parts of the subtropics (Fig. 1). In these areas, individual climatic factors (e.g. temperature, precipitation, and solar radiation) or their interactions caused the GPP of ENF to decrease (Fig. 4c and d). In particular, solar radiation declined significantly in the eastern region, which led to a decrease in GPP. EBF is primarily distributed in the central and western regions (Fig. 1) where climate change mainly contributes to the increase of EBF GPP (Fig. 4c and d). Overall, future measures to combat climate change should consider different forest types and their geographical locations.
4.1.3 The effect of LAI on subtropical forest GPP
As the most important proxy of growth and structural change in vegetation (J. M. Chen et al., 2019; S. Chen et al., 2021), LAI can significantly influence the carbon cycle. Since the 2000s, some key forest protection programmes, including the Natural Forest Protection Project (NFPP, initiated in 1998), have been carried out in the subtropical region of China (Chen et al., 2020). Due to forest protection and reasonable forest use and management with the support of ecological engineering, forest natural growth has increased the LAI (Chen et al., 2020) and further contributed to the GPP increase in China (Tong et al., 2018). A recent study showed that land-use management in China, especially forest management, has contributed significantly to earth greening, accounting for 25 % of the increase in global LAI (C. Chen et al., 2019). J. M. Chen et al. (2019) estimated the effect of structural change in vegetation using LAI on the global terrestrial carbon sink since the 1980s and confirmed that LAI significantly improved global carbon uptake. Especially, the LAI also promoted the forest carbon sink in China's subtropical region, but the contribution of different changes in forest LAI to GPP was not revealed. Evidence from our study demonstrated that LAI is the second dominant contributor (3.79 ) to the increase in GPP of the entirety of subtropical forests (Fig. 4e) and also identified the MXF as the main contributor to the positive effect of LAI on GPP changes. Recently, although some studies have demonstrated the positive effects of LAI on forest carbon sequestration in China (J. M. Chen et al., 2019; Chen et al., 2020; Zhang et al., 2022), these studies did not isolate the independent effects of LAI on different forest GPP. Currently, some ecological projects in China are aimed at protecting forests; others are aimed at increasing forest area. It has been long debated how different ecological projects impact ecosystem services in carbon sequestration (Chen et al., 2020; Yin and Yin, 2010; Yu et al., 2011). In this study, we designed an experiment to examine the individual impact of LAI (i.e. mainly reflecting forest structure change) on subtropical forest GPP changes. The results showed that forest LAI change positively impacted GPP increases in the study area more than forest cover change (Figs. 4 and 5), indicating that forest protection projects in the subtropical region of China may have greater carbon uptake potential. Consistent with our study period (2001–2018), Y. Chen et al. (2021) also reported an increase in vegetation carbon sequestration in China based on the two indicators of GPP and NPP, especially with an accelerated increase in carbon sequestration potential after 2010. They showed that GPP and NPP in China increased obviously at the rate of 49.1–53.1 and 22.4–24.9 Tg C yr−2, respectively. The significant increase of subtropical forest GPP and NPP was highly attributed to human activities (e.g. ecological restoration projects) in southern and eastern China. Human-induced NPP gains can especially offset climate-induced NPP losses in southern China.
4.1.4 The effect of CO2 fertilisation on subtropical forest GPP
Our results also suggested that CO2 fertilisation was the major contributor to overall forest GPP increase in China's subtropical region (6.84 ) (Figs. 4g and 5). Elevated CO2 concentrations can enrich intercellular CO2 and stimulate vegetation photosynthetic rates, thereby enhancing vegetation productivity. Recent studies suggested that the CO2 fertilisation effect was the main driver in promoting global or regional vegetation productivity (Y. Chen et al., 2022; J. M. Chen et al., 2019; Schimel et al., 2014; Xie et al., 2020). This was also confirmed by the results of free-air CO2 enrichment (FACE) experiments (Norby et al., 2010) and a previous study using terrestrial biosphere models, remote sensing-based methods, ecological optimality theory, and an emergent constraint based on global carbon budget estimates (Keenan et al., 2023). Due to the inherent differences in the driving factors, it should be noted that the contribution of the CO2 fertilisation effect to subtropical forest GPP changes mostly originates from the long-term trend of CO2. However, the trend of climatic factors during the study period is not significant (Fig. S9). The temporal attribution of climate to GPP is mainly due to its variability.
Moreover, how much the net terrestrial carbon uptake increases in response to a rise in atmospheric CO2 is not just dependent on GPP but also on the processes like respiration, mortality, and longevity. For example, the increase in forest GPP due to CO2 fertilisation leads to increased tree growth, and the final decomposition of the increased plant matter improves litter and soil organic matter pools, thereby enhancing heterotrophic respiration (Rh) (Quetin et al., 2023). Therefore, the CO2 fertilisation effect can be counteracted by respiration. To date, there is no consensus on the response of photosynthesis and respiration to long-term increases in CO2, due to the magnitude of such an impact, and associated mechanisms still remaining uncertain (Sun et al., 2023). While several studies found the simultaneous reduction of respiration at elevated CO2 (Sun et al., 2023; Hamilton et al., 2001), the opposite conclusion has also been reported (Y. Chen et al., 2022; Crous et al., 2012). Additionally, the effect of elevated atmospheric CO2 on GPP is also related to tree mortality. For example, elevated atmospheric CO2 concentrations can lead to faster tree growth and decreasing the carbon turnover time. Consequently, the acceleration of the tree's life cycle and death will reduce carbon sequestration (Needham et al., 2020). Besides, the CO2 fertilisation effect on forest carbon sinks can be limited by longevity. For example, Jiang et al. (2020) examined the responses of mature forests to atmospheric CO2 enrichment. They found that elevated CO2 led to a 12 % increase in carbon uptake through GPP, but the carbon sequestration had not increased, and most of the carbon was returned to the atmosphere through respiration (Jiang et al., 2020). Currently, the forests in China are characterised by relatively young stand age (< 40 years old) due to a large number of new plantations, and thus China's forest carbon sequestration potential may continue to increase in the near future due to rising CO2 concentrations (Yao et al., 2018a). However, as the trend of increasing atmospheric CO2 concentration may slow down, the carbon sink potential of China's forests may be further reduced in the future due to the weakening of the CO2 fertilisation effect.
4.2 Model and uncertainties
In the BEPS model, LAI is separated into two parts including the LAI of sunlit and shaded leaves, which are adopted to calculate photosynthesis at the leaf level based on the FvCB photosynthesis model (Farquhar et al., 1980) and further use those results to compute GPP at the canopy level by adding the photosynthesis rates of sunlit and shaded leaves. Moreover, the Ball–Berry equation (Ball et al., 1987) was used in the model to calculate the stomatal conductance of sunlit and shaded leaves, which influence intercellular CO2, photosynthesis rates, and evapotranspiration (ET). Therefore, LAI directly determined the allocation of light and water availability and influenced the gross photosynthesis rate of sunlit and shaded leaves. The accuracy of LAI may impact its contribution to GPP variations through these processes. Atmospheric CO2 concentrations affect intercellular CO2 through stomatal conductance, which, together with temperature and maximum carboxylation rate (Vcmax), determine the Rubisco-limited (Ac) and RuBP-limited (Aj) gross photosynthesis rate in the model. Over the past few decades, CO2 concentrations continuously have increased and reached the current level of over 400 ppm. Elevated atmospheric CO2 concentrations can increase photosynthesis by accelerating the rate of carboxylation, thereby influencing the GPP changes. Additionally, solar radiation variability would directly influence the potential electron transport rate and thus regulate the RuBP-limited (Aj) gross photosynthesis rate. Temperature in the model directly impacts the Vcmax and the CO2 compensation point without dark respiration (Γ), thereby determining the gross photosynthesis rate. Temperature positively affects the Vcmax when it is below optimal. However, when temperature exceeds its optimum, Vcmax will not continue to increase with the temperature. Therefore, temperature changes in the model may have a positive or negative impact on GPP.
It should be noted that changes in LAI could be influenced by both climatic factors and elevated atmospheric CO2 concentrations (C. Chen et al., 2019; S. Chen et al., 2021; Sun et al., 2022). Previous studies reported that elevated atmospheric CO2 concentrations were the dominant driver of global LAI increase, and there are also regional differences in the impact mechanism of climate factors on LAI changes (Zhu et al., 2016, 2017), thereby influencing GPP dynamics. Moreover, the interactions between these driving factors can further influence LAI, and even the interactive impacts of these factors on LAI may offset each other. For instance, rising CO2 concentrations and solar radiation can affect temperature and VPD (S. Chen et al., 2021). High VPD leads plants to close their stomata, resulting in lower intercellular CO2 concentrations in the leaves, which reduces the rate of photosynthesis (Yuan et al., 2019). Additionally, changes in LAI can feed back to the climate through biogeochemical and biogeophysical processes (Li et al., 2023). There is a bidirectional interaction between vegetation and the atmosphere, and the relationship between vegetation dynamics and driving factors is complex. The current methods used in this study cannot elucidate the complex interactions of climate factors and elevated CO2 concentrations on LAI changes, which may bring some uncertainties to our results.
We first used the Vcmax25 product retrieved from remote sensing data (i.e. leaf chlorophyll content) to replace the constant value of the Vcmax25 in the model. Wang et al. (2019), Luo et al. (2018), and Croft et al. (2017) indicated that the use of remotely sensed leaf chlorophyll content to invert Vcmax25 can improve the accuracy of GPP simulation in evergreen conifer forests and a temperate deciduous forest. Our results suggested that the BEPS model with spatial varying Vcmax25 values can also reach a reasonable simulation of subtropical forest GPP over spatiotemporal scales (Figs. 2 and S1–S6). Incorporating the spatial variation of the Vcmax25 inverted by remotely sensed data into the process-based model does not require its pre-calibration (J. M. Chen et al., 2022); thus it has great potential to be applied to areas with few flux sites, such as China's subtropical forest area. However, the Vcmax25 retrieved from remote sensing data is still in the early developing stage (J. M. Chen et al., 2022; Luo et al., 2019). For example, the Vcmax25 product used in this study was mainly generated by MODIS surface reflectance, and thus the data quality of the surface reflectance may cause uncertainty in the Vcmax25 product. The uncertainties in MODIS reflectance data sets can arise from sensor calibration issues, cloud contamination, atmospheric correction errors, etc. Changes in the reflectance could also result in large changes in the modelled chlorophyll values, thereby affecting the Vcmax25 product. Additionally, the Vcmax25 was produced by a semi-mechanistic model (Friend., 1995), and the key parameter (i.e. the Rubisco turnover rate at 25 °C) in the model would bring uncertainties in modelling Vcmax25, because current ground-based data are still rarely used for calibration of this parameter and validation of the Vcmax25 products (Lu et al., 2022; J. M. Chen et al., 2022).
In this study, the BEPS model was used to simulate the subtropical forest GPP, and the performance of the BEPS model in simulating subtropical forest GPP was examined. A significant increasing trend (20.67 , p<0.001) was detected in the subtropical forest GPP over the past 2 decades, indicating that there is sustained increase in the carbon sink potential of subtropical forests under the background of global change, with evergreen broad-leaved forests (EBF) being the biggest contributor (28.24 , p<0.001) to total GPP enhancement of the entire subtropical forests. We designed different groups of simulations to examine the individual and combined impacts of forest cover change (FCC), climate change (CC), leaf area index (LAI), and CO2 fertilisation on inter-annual trends in subtropical forest GPP. There are obvious differences in drivers of different subtropical forest GPP variations.
Although the CO2 fertilisation effect was the largest contributor to the overall subtropical forest GPP increase, LAI was another most important and not negligible contributor to subtropical forest GPP growth in China. FCC contributed to the mixed forest (MXF) GPP (1.14 , p<0.001) and EBF GPP (0.39 , p<0.001) increase but induced the evergreen needle-leaved forest (ENF) GPP to decrease (−0.19 , p<0.001). CC increased the EBF and deciduous broad-leaved forest (DBF) GPP but decreased ENF and MXF GPP. Especially, the EBF and DBF GPP in this region are very sensitive (p<0.05) to CC. Therefore, we emphasised that the mitigation of climate change and carbon emissions through forests should consider their different types. Furthermore, our results highlighted that the LAI effect, which was greater than that of FCC, was the most important driver of subtropical forest GPP enhancement, suggesting that forest use and management have a more significant positive impact on GPP increase than forest cover change in the study area. It may be attributed to the implementation of China's forest protection and restoration programmes.
| BEPS | the Boreal Ecosystem Productivity Simulator |
| GPP | Gross primary productivity |
| FCC | Forest cover change |
| LAI | Leaf area index |
| CC | Climate change |
| CO2 | Carbon dioxide |
| EBF | Evergreen broad-leaved forest |
| ENF | Evergreen needle-leaved forest |
| DBF | Deciduous broad-leaved forest |
| MXF | Mixed forest |
| QYZ | Qianyanzhou station |
| DHS | Dinghushan station |
| ALS | Ailaoshan station |
| Vcmax | Maximum carboxylation rate |
| NEP | Net ecosystem productivity |
| ER | Ecosystem respiration |
We obtained the flux tower data from the ChinaFLUX network (http://www.nesdc.org.cn/systemMenu/findOtherProjectList?menuId=station&projectSearch=, ChinaFlux network, 2021), the GLASS LAI from the University of Maryland (http://www.glass.umd.edu/Download.html, University of Maryland, 2022), the Vcmax25 products from the National Ecosystem Science Data Center, National Science & Technology Infrastructure of China (http://www.nesdc.org.cn/sdo/detail?id=612f42ee7e28172cbed3d80f, NESDC, 2022), the meteorological data sets from the National Tibetan Plateau Third Pole Environment Data Center (https://data.tpdc.ac.cn/en/, He et al., 2020), the annual land use/cover data sets and the CCI LC user tool from the European Space Agency (ESA) (http://maps.elie.ucl.ac.be/CCI/viewer/download.php, ESA, 2021), the soil data from the FAO (https://doi.org/10.3334/ORNLDAAC/1247, Wieder et al., 2014), and the atmospheric CO2 data from the National Oceanic and Atmospheric Administration's Earth System Research Laboratories (https://gml.noaa.gov/aftp/data/greenhouse_gases/co2/in-situ/surface/, NOAA, 2022).
The supplement related to this article is available online at: https://doi.org/10.5194/bg-21-2253-2024-supplement.
Conceptualisation, methodology, data analysis, writing – original draft, writing – review and editing: TC. Conceptualisation, methodology, writing – original draft, writing – review and editing: FM. Model, writing – original draft, writing – review and editing: MP. Conceptualisation, funding acquisition, project administration, writing – review and editing: GT. Visualisation, writing – review and editing: YY. Conceptualisation, data analysis, funding acquisition, project administration, writing – original draft, writing – review and editing: HV. All authors have read and agreed to the published version of the manuscript.
The contact author has declared that none of the authors has any competing interests.
Publisher's note: Copernicus Publications remains neutral with regard to jurisdictional claims made in the text, published maps, institutional affiliations, or any other geographical representation in this paper. While Copernicus Publications makes every effort to include appropriate place names, the final responsibility lies with the authors.
We sincerely thank the editor and two reviewers for their helpful comments and suggestions which improved the paper.
This work is jointly supported by the National Natural Science Foundation of China (grant no. 42171025), the Fonds Wetenschappelijk Onderzoek (FWO grant no. G018319N), and the programme of the China Scholarships Council (grant no. 202106380124).
This paper was edited by Anja Rammig and reviewed by two anonymous referees.
Ball, J. T., Woodrow, L. E., and Berry, J. A.: A model predicting stomatal conductance and its contribution to the control of photosynthesis under different environmental conditions, in: Progress in Photosynthesis Research, vol. 4, edited by: Biggins, J., Proceedings of the VIIth International Congress On Photosynthesis, Providence, Rhode Island, USA, 10–15 August 1986, Springer Netherlands, Dordrecht, 221–224, https://doi.org/10.1007/978-94-017-0519-6_48, 1987.
Barman, R., Jain, A. K., and Liang, M.: Climate-driven uncertainties in modeling terrestrial gross primary production: a site level to global-scale analysis, Global Change Biol., 20, 1394–1411, https://doi.org/10.1111/gcb.12474, 2014.
Beer, C., Reichstein, M., Tomelleri, E., Ciais, P., Jung, M., Carvalhais, N., Rödenbeck, C., Arain, M. A., Baldocchi, D., Bonan, G., Bondeau, A., Cescatti, A., Lasslop, G., Lindroth, A., Lomas, M., Luyssaert, S., Margolis, H., Oleson, K., Roupsard, O., Veenendaal, E., Viovy, N., Christopher, W., Woodward, F., and Papale, D.: Terrestrial Gross Carbon Dioxide Uptake: Global Distribution and Covariation with Climate, Science, 329, 834–838, https://doi.org/10.1126/science.1184984, 2010.
Camberlin, P., Martiny, N., Philippon, N., and Richard, Y.: Determinants of the interannual relationships between remote sensed photosynthetic activity and rainfall in tropical Africa, Remote Sens. Environ., 106, 199–216, https://doi.org/10.1016/j.rse.2006.08.009, 2007.
Chen, C., Park, T., Wang, X., Piao, S., Xu, B., Chaturvedi, R., Fuchs, R., Brovkin, V., Ciais, P., Fensholt, R., Tømmervik, H., Bala, G., Zhu, Z., Nemani, R., and Myneni, R.: China and India lead in greening of the world through land-use management, Nat. Sustain., 2, 122–129, https://doi.org/10.1038/s41893-019-0220-7, 2019.
Chen, J. M., Liu, J., Cihlar, J., and Goulden, M. L.: Daily canopy photosynthesis model through temporal and spatial scaling for remote sensing applications, Ecol. Model., 124, 99–119, https://doi.org/10.1016/S0304-3800(99)00156-8, 1999.
Chen, J. M., Mo, G., Pisek, J., Liu, J., Deng, F., Ishizawa, M., and Chan, D.: Effects of foliage clumping on the estimation of global terrestrial gross primary productivity, Global Biogeochem. Cy., 26, GB1019, https://doi.org/10.1029/2010GB003996, 2012.
Chen, J. M., Ju, W., Ciais, P., Viovy, N., Liu, R., Liu, Y., and Lu, X.: Vegetation structural change since 1981 significantly enhanced the terrestrial carbon sink, Nat. Commun., 10, 4259, https://doi.org/10.1038/s41467-019-12257-8, 2019.
Chen, J. M., Wang, R., Liu, Y., He, L., Croft, H., Luo, X., Wang, H., Smith, N. G., Keenan, T. F., Prentice, I. C., Zhang, Y., Ju, W., and Dong, N.: Global datasets of leaf photosynthetic capacity for ecological and earth system research, Earth Syst. Sci. Data, 14, 4077–4093, https://doi.org/10.5194/essd-14-4077-2022, 2022.
Chen, S., Zhang, Y., Wu, Q., Liu, S., Song, C., Xiao, J., Band, L. E., and Vose, J. M.: Vegetation structural change and CO2 fertilization more than offset gross primary production decline caused by reduced solar radiation in China, Agr. Forest Meteorol., 296, 108207, https://doi.org/10.1016/j.agrformet.2020.108207, 2021.
Chen, Y., Chen, L., Cheng, Y., Ju, W., Chen, H. Y. H., and Duan, H.: Afforestation promotes the enhancement of forest LAI and NPP in China, Forest Ecol. Manag., 462, 117990, https://doi.org/10.1016/j.foreco.2020.117990, 2020.
Chen, Y., Feng, X., Tian, H., Wu, X., Gao, Z., Feng, Y., Piao, S., Lv, N., Pan, N., and Fu, B.: Accelerated increase in vegetation carbon sequestration in China after 2010: A turning point resulting from climate and human interaction, Global Change Biol., 27, 5848–5864, https://doi.org/10.1111/gcb.15854, 2021.
Chen, Y., Zhang, Y., Bai, E., Piao, S., Chen, N., Zhao, G., Zheng, Z., and Zhu, Y.: The stimulatory effect of elevated CO2 on soil respiration is unaffected by N addition, Sci. Total Environ., 813, 151907, https://doi.org/10.1016/j.scitotenv.2021.151907, 2022.
ChinaFlux network: Flux tower data, ChinaFlux network [data set], http://www.nesdc.org.cn/systemMenu/findOtherProjectList?menuId=station&projectSearch=, last access: 31 May 2021.
CMA: China Greenhouse Gas Bulletin: The State of Greenhouse Gases in the Atmosphere Based on Chinese and Global Observations before 2017, http://www.cma.gov.cn/en2014/news/News/201901/P020190122575481732415.pdf (last access: 20 December 2022), 2018.
Croft, H., Chen, J. M., Luo, X., Barlett, P., Chen, B., and Staebler, R. F.: Leaf chlorophyll content as a proxy for leaf photosynthetic capacity, Global Change Biol., 23, 3513–3524, https://doi.org/10.1111/gcb.13599, 2017.
Crous, K., Zaragoza-Castells, J., Ellsworth, D., Duursma, R., Löw, M., Tissue, D., and Atkin, O.: Light inhibition of leaf respiration in field-grown Eucalyptus saligna in whole-tree chambers under elevated atmospheric CO2 and summer drought, Plant Cell Environ., 35, 966–981, https://doi.org/10.1111/j.1365-3040.2011.02465.x, 2012.
ESA: Land Cover CCI: Product User Guide Version 2.0, https://maps.elie.ucl.ac.be/CCI/viewer/download/ESACCI-LC-Ph2-PUGv2_2.0.pdf (last access: 15 January 2022), 2017.
ESA: ESA CCI Land Cover project, ESA [data set], http://maps.elie.ucl.ac.be/CCI/viewer/download.php, last access: 15 January 2021.
Fang, J., Tang, Y., and Son, Y.: Why are East Asian ecosystems important for carbon cycle research?, Sci. China Life Sci., 53, 753–756, https://doi.org/10.1007/s11427-010-4032-2, 2010.
Fang, J., Yu, G., Liu, L., Hu, S., and Chapin, F. S.: Climate change, human impacts, and carbon sequestration in China, P. Natl. Acad. Sci. USA, 115, 4015–4020, https://doi.org/10.1073/pnas.1700304115, 2018.
FAO: Harmonized World Soil Database (version 1.2). Food Agriculture Organization, Rome, Italy and IIASA, Laxenburg, Austria, http://webarchive.iiasa.ac.at/Research/LUC/External-World-soil-database/HTML/ (last access: 20 December 2022), 2012.
Farquhar, G. D., von Caemmerer, S., and Berry, J. A.: A biochemical model of photosynthetic CO2 assimilation in leaves of C3 species, Planta, 149, 78–90, https://doi.org/10.1007/BF00386231, 1980.
Feng, X., Liu, G., Chen, J. M., Chen, M., Liu, J., Ju, W. M., Sun, R., and Zhou, W.: Net primary productivity of China's terrestrial ecosystems from a process model driven by remote sensing, J. Environ. Manage., 85, 563–573, https://doi.org/10.1016/j.jenvman.2006.09.021, 2007.
Forzieri, G., Dakos, V., McDowell, N. G., Ramdane, A., and Cescatti, A.: Emerging signals of declining forest resilience under climate change, Nature, 608, 534–539, https://doi.org/10.1038/s41586-022-04959-9, 2022.
Friedlingstein, P., Jones, M. W., O'Sullivan, M., Andrew, R. M., Bakker, D. C. E., Hauck, J., Le Quéré, C., Peters, G. P., Peters, W., Pongratz, J., Sitch, S., Canadell, J. G., Ciais, P., Jackson, R. B., Alin, S. R., Anthoni, P., Bates, N. R., Becker, M., Bellouin, N., Bopp, L., Chau, T. T. T., Chevallier, F., Chini, L. P., Cronin, M., Currie, K. I., Decharme, B., Djeutchouang, L. M., Dou, X., Evans, W., Feely, R. A., Feng, L., Gasser, T., Gilfillan, D., Gkritzalis, T., Grassi, G., Gregor, L., Gruber, N., Gürses, Ö., Harris, I., Houghton, R. A., Hurtt, G. C., Iida, Y., Ilyina, T., Luijkx, I. T., Jain, A., Jones, S. D., Kato, E., Kennedy, D., Klein Goldewijk, K., Knauer, J., Korsbakken, J. I., Körtzinger, A., Landschützer, P., Lauvset, S. K., Lefèvre, N., Lienert, S., Liu, J., Marland, G., McGuire, P. C., Melton, J. R., Munro, D. R., Nabel, J. E. M. S., Nakaoka, S.-I., Niwa, Y., Ono, T., Pierrot, D., Poulter, B., Rehder, G., Resplandy, L., Robertson, E., Rödenbeck, C., Rosan, T. M., Schwinger, J., Schwingshackl, C., Séférian, R., Sutton, A. J., Sweeney, C., Tanhua, T., Tans, P. P., Tian, H., Tilbrook, B., Tubiello, F., van der Werf, G. R., Vuichard, N., Wada, C., Wanninkhof, R., Watson, A. J., Willis, D., Wiltshire, A. J., Yuan, W., Yue, C., Yue, X., Zaehle, S., and Zeng, J.: Global Carbon Budget 2021, Earth Syst. Sci. Data, 14, 1917–2005, https://doi.org/10.5194/essd-14-1917-2022, 2022.
Friedlingstein, P., O'Sullivan, M., Jones, M. W., Andrew, R. M., Bakker, D. C. E., Hauck, J., Landschützer, P., Le Quéré, C., Luijkx, I. T., Peters, G. P., Peters, W., Pongratz, J., Schwingshackl, C., Sitch, S., Canadell, J. G., Ciais, P., Jackson, R. B., Alin, S. R., Anthoni, P., Barbero, L., Bates, N. R., Becker, M., Bellouin, N., Decharme, B., Bopp, L., Brasika, I. B. M., Cadule, P., Chamberlain, M. A., Chandra, N., Chau, T.-T.-T., Chevallier, F., Chini, L. P., Cronin, M., Dou, X., Enyo, K., Evans, W., Falk, S., Feely, R. A., Feng, L., Ford, D. J., Gasser, T., Ghattas, J., Gkritzalis, T., Grassi, G., Gregor, L., Gruber, N., Gürses, Ö., Harris, I., Hefner, M., Heinke, J., Houghton, R. A., Hurtt, G. C., Iida, Y., Ilyina, T., Jacobson, A. R., Jain, A., Jarníková, T., Jersild, A., Jiang, F., Jin, Z., Joos, F., Kato, E., Keeling, R. F., Kennedy, D., Klein Goldewijk, K., Knauer, J., Korsbakken, J. I., Körtzinger, A., Lan, X., Lefèvre, N., Li, H., Liu, J., Liu, Z., Ma, L., Marland, G., Mayot, N., McGuire, P. C., McKinley, G. A., Meyer, G., Morgan, E. J., Munro, D. R., Nakaoka, S.-I., Niwa, Y., O'Brien, K. M., Olsen, A., Omar, A. M., Ono, T., Paulsen, M., Pierrot, D., Pocock, K., Poulter, B., Powis, C. M., Rehder, G., Resplandy, L., Robertson, E., Rödenbeck, C., Rosan, T. M., Schwinger, J., Séférian, R., Smallman, T. L., Smith, S. M., Sospedra-Alfonso, R., Sun, Q., Sutton, A. J., Sweeney, C., Takao, S., Tans, P. P., Tian, H., Tilbrook, B., Tsujino, H., Tubiello, F., van der Werf, G. R., van Ooijen, E., Wanninkhof, R., Watanabe, M., Wimart-Rousseau, C., Yang, D., Yang, X., Yuan, W., Yue, X., Zaehle, S., Zeng, J., and Zheng, B.: Global Carbon Budget 2023, Earth Syst. Sci. Data, 15, 5301–5369, https://doi.org/10.5194/essd-15-5301-2023, 2023.
Friend, A. D.: PGEN: an integrated model of leaf photosynthesis, transpiration, and conductance, Ecol. Model., 77, 233–255, https://doi.org/10.1016/0304-3800(93)E0082-E,1995.
Gao, T., Wang, H. J., and Zhou, T.: Changes of extreme precipitation and nonlinear influence of climate variables over monsoon region in China, Atmos. Res., 197, 379–389, https://doi.org/10.1016/j.atmosres.2017.07.017, 2017.
Grossiord, C., Buckley, T. N., Cernusak, L. A., Novick, K. A., Poulter, B., Siegwolf, R. T. W., Sperry, J. S., and McDowell, N. G.: Plant responses to rising vapor pressure deficit, New Phytol., 226, 1550–1566, https://doi.org/10.1111/nph.16485, 2020.
Hamilton, J., Thomas, R., and DeLucia, E.: Direct and indirect effects of elevated CO2 on leaf respiration in a forest ecosystem, Plant Cell Environ., 24, 975–982, https://doi.org/10.1046/j.0016-8025.2001.00730.x, 2001.
He, H., Wang, S., Zhang, L., Wang, J., Ren, X., Zhou, L., Piao, S., Yan, H., Ju, W., Gu, F., Yu, S., Yang, Y., Wang, M., Niu, Z., Ge, R., Yan, H., Huang, M., Zhou, G., Bai, Y., Xie, Z., Tang, Z., Wu, B., Zhang, L., He, N., Wang, Q., and Yu, G.: Altered trends in carbon uptake in China's terrestrial ecosystems under the enhanced summer monsoon and warming hiatus, Natl. Sci. Rev., 6, 505–514, https://doi.org/10.1093/nsr/nwz021, 2019.
He, H., Ge, R., Ren, X., Zhang, L., Chang, Q., Xu, Q., Zhou, G., Xie, Z., Wang, S., Wang, H., Zhang, Q., Wang, A., Fan, Z., Zhang, Y., Shen, W., Yin, H., Lin, L., Williams, M., and Yu, G.: Reference carbon cycle dataset for typical Chinese forests via colocated observations and data assimilation, Sci. Data, 8, 42, https://doi.org/10.1038/s41597-021-00826-w, 2021.
He, J., Yang, K., Tang, W., Lu, H., Qin, J., Chen, Y., and Li, X.: The first high-resolution meteorological forcing dataset for land process studies over China, Sci. Data, 7, 25, https://doi.org/10.1038/s41597-020-0369-y, 2020 (data available at: https://data.tpdc.ac.cn/en/, last access: 21 December 2021).
He, Q., Ju, W., Dai, S., He, W., Song, L., Wang, S., and Li, X.: Drought Risk of Global Terrestrial Gross Primary Productivity Over the Last 40 Years Detected by a Remote Sensing-Driven Process Model, J. Geophys. Res.-Biogeo., 126, e2020JG005944, https://doi.org/10.1029/2020JG005944, 2021.
Huang, J., Zhang, Y., Bing, H., Peng, J., Dong, F., Gao, J., and Arhonditsis, G. B.: Characterizing the river water quality in China: Recent progress and on-going challenges, Water Res., 201, 117309, https://doi.org/10.1016/j.watres.2021.117309, 2021.
Jiang, C., Ryu, Y., Fang, H., Myneni, R., Claverie, M., and Zhu, Z.: Inconsistencies of interannual variability and trends in long-term satellite leaf area index products, Global Change Biol., 23, 4133–4146, https://doi.org/10.1111/gcb.13787, 2017.
Jiang, M., Medlyn, B., Drake, J., Duursma, R., Anderson, I., Barton, C., Boer, M., Carrillo, Y., Castañeda-Gómez, L., Collins, L., Crous, K., De Kauwe, M. D., dos Santos, B. M., Emmerson, K., Facey, S. L., Gherlenda, A. N., Gimeno, T., Hasegawa, S., Johnson, S., Kännaste, A., Macdonald, C., Mahmud, K., Moore, B., Nazaries, L., Neilson, E. H. J., Nielsen, U., Niinemets, Ü., Noh, N., Ochoa-Hueso, R., Pathare, V., Pendall, E., Pihlblad, J., Piñeiro, J., Powell, J., Power, S., Reich, P., Renchon, A., Riegler, M., Rinnan, R., Rymer, P., Salomón, R., Singh, B., Smith, B., Tjoelker, M., Walker, J. K. M., Wujeska-Klause, A., Yang, J., Zaehle, S., and Ellsworth, D.: The fate of carbon in a mature forest under carbon dioxide enrichment, Nature, 580, 227–231, https://doi.org/10.1038/s41586-020-2128-9, 2020.
Ju, W., Chen, J. M., Black, T. A., Barr, A. G., Liu, J., and Chen, B.: Modelling multi-year coupled carbon and water fluxes in a boreal aspen forest, Agr. Forest Meteorol., 140, 136–151, https://doi.org/10.1016/j.agrformet.2006.08.008, 2006.
Keenan, T. F., Prentice, I., Canadell, J., Williams, C. A., Wang, H., Raupach, M., and Collatz, G. J.: Recent pause in the growth rate of atmospheric CO2 due to enhanced terrestrial carbon uptake, Nat. Commun., 7, 13428, https://doi.org/10.1038/ncomms13428, 2016.
Keenan, T. F., Luo, X., Stocker, B. D., De Kauwe, M. G., Medlyn, B. E., Prentice, I. C., Smith, N. G., Terrer, C., Wang, H., Zhang, Y., and Zhou, S.: A constraint on historic growth in global photosynthesis due to rising CO2, Nat. Clim. Change, 13, 1376–1381, https://doi.org/10.1038/s41558-023-01867-2, 2023.
Li, C., Wang, J., Hu, L., Ye, L., Clinton, K., Huang, H., Yang, J., and Gong, P.: A Circa 2010 Thirty Meter Resolution Forest Map for China, Remote Sens.-Basel, 6, 5325–5343, https://doi.org/10.3390/rs6065325, 2014.
Li, Y., Yan, J., Meng, Z., Huang, J., Zhang, L., Chen, Z., Liu, S., Chu, G., Zhang, Q., and Zhang, D.: An observation dataset of carbon and water fluxes in a mixed coniferous broad-leaved forest at Dinghushan, Southern China (2003–2010), China Sci. Data, 6, 1–11, https://doi.org/10.11922/csdata.2020.0046.zh, 2021.
Li, Y., Zhang, Y., and Lv, J.: Interannual variations in GPP in forest ecosystems in Southwest China and regional differences in the climatic contributions, Ecol. Inform., 69, 101591, https://doi.org/10.1016/j.ecoinf.2022.101591, 2022.
Li, Y., Li, Z., Wu, H., Zhou, C., Liu, X., Leng, P., Yang, P., Wu, W., Tang, R., Shang, G. F., and Ma, L.: Biophysical impacts of earth greening can substantially mitigate regional land surface temperature warming, Nat. Commun., 14, 121, https://doi.org/10.1038/s41467-023-35799-4, 2023.
Liu, J., Chen, J. M., Cihlar, J., and Park, W. M.: A process-based boreal ecosystem productivity simulator using remote sensing inputs, Remote Sens. Environ., 62, 158–175, https://doi.org/10.1016/S0034-4257(97)00089-8, 1997.
Liu, J., Chen, J. M., Cihlar, J., and Chen, W.: Net primary productivity distribution in the BOREAS region from a process model using satellite and surface data, J. Geophys. Res.-Atmos., 104, 27735–27754, https://doi.org/10.1029/1999JD900768, 1999.
Liu, Y., Ju, W., He, H., Wang, S., Sun, R., and Zhang, Y.: Changes of net primary productivity in China during recent 11 years detected using an ecological model driven by MODIS data, Front. Earth Sci., 7, 112–127, https://doi.org/10.1007/s11707-012-0348-5, 2013a.
Liu, Y., Zhou, Y., Ju, W., Chen, J., Wang, S., He, H., Wang, H., Guan, D., Zhao, F., Li, Y., and Hao, Y.: Evapotranspiration and water yield over China's landmass from 2000 to 2010, Hydrol. Earth Syst. Sci., 17, 4957–4980, https://doi.org/10.5194/hess-17-4957-2013, 2013b.
Liu, Y., Zhou, Y., Ju, W., Wang, S., Wu, X., He, M., and Zhu, G.: Impacts of droughts on carbon sequestration by China's terrestrial ecosystems from 2000 to 2011, Biogeosciences, 11, 2583–2599, https://doi.org/10.5194/bg-11-2583-2014, 2014.
Liu, Y., Xiao, J., Ju, W., Zhou, Y., Wang, S., and Wu, X.: Water use efficiency of China's terrestrial ecosystems and responses to drought, Sci. Rep.-UK, 5, 13799, https://doi.org/10.1038/srep13799, 2015.
Liu, Y., Xiao, J., Ju, W., Xu, K., Zhou, Y., and Zhao, Y.: Recent trends in vegetation greenness in China significantly altered annual evapotranspiration and water yield, Environ. Res. Lett., 11, 094010, https://doi.org/10.1088/1748-9326/11/9/094010, 2016.
Liu, Y. Xiao, J., Ju, W., Zhu, G., Wu, X., Fan, W., Li, D., and Zhou, Y.: Satellite-derived LAI products exhibit large discrepancies and can lead to substantial uncertainty in simulated carbon and water fluxes, Remote Sens. Environ., 206, 174–188, https://doi.org/10.1016/j.rse.2017.12.024, 2018.
Lopez, J., Way, D. A., and Sadok, W.: Systemic effects of rising atmospheric vapor pressure deficit on plant physiology and productivity, Global Change Biol., 27, 1704–1720, https://doi.org/10.1111/gcb.15548, 2021.
Lu, F., Hu, H., Sun, W., Zhu, J., Liu, G., Zhou, W., Zhang, Q., Shi, P., Liu, X., Wu, X., Zhang, L., Wei, X., Dai, L., Zhang, K., Sun, Y., Xue, S., Zhang, W., Xiong, D., Deng, L., Liu, B., Zhou, L., Zhang, C., Zheng, X., Cao, J., Huang, Y., He, N., Zhou, G., Bai, Y., Xie, Z., Tang, Z., Wu, B., Fang, J., Liu, G., and Yu, G.: Effects of national ecological restoration projects on carbon sequestration in China from 2001 to 2010, P. Natl. Acad. Sci. USA, 115, 4039–4044, https://doi.org/10.1073/pnas.1700294115, 2018.
Lu, X., Ju, W., Li, J., Croft, H., Chen, J. M., Luo, Y., Yu, H., and Hu, H.: Maximum Carboxylation Rate Estimation With Chlorophyll Content as a Proxy of Rubisco Content, J. Geophys. Res.-Biogeo., 125, e2020JG005748, https://doi.org/10.1029/2020JG005748, 2020.
Lu, X., Croft, H., Chen, J. M., Luo, Y., and Ju, W.: Estimating photosynthetic capacity from optimized Rubisco–chlorophyll relationships among vegetation types and under global change, Environ. Res. Lett., 17, 014028, https://doi.org/10.1088/1748-9326/ac444d, 2022.
Luo, X., Croft, H., Chen, J. M., Bartlett, P., Staebler, R., and Froelich, N.: Incorporating leaf chlorophyll content into a two-leaf terrestrial biosphere model for estimating carbon and water fluxes at a forest site, Agr. Forest Meteorol., 248, 156–168, https://doi.org/10.1016/j.agrformet.2017.09.012, 2018.
Luo, X., Croft, H., Chen, J. M., He, L., and Keenan, T. F.: Improved estimates of global terrestrial photosynthesis using information on leaf chlorophyll content, Glob. Change Biol., 25, 2499–2514, https://doi.org/10.1111/gcb.14624, 2019.
Ma, J., Yan, X., Dong, W., and Chou, J.: Gross primary production of global forest ecosystems has been overestimated, Sci. Rep.-UK, 5, 10820, https://doi.org/10.1038/srep10820, 2015.
Ma, J., Xiao, X., Miao, R., Li, Y., Chen, B., Zhang, Y., and Zhao, B.: Trends and controls of terrestrial gross primary productivity of China during 2000–2016, Environ. Res. Lett., 14, 084032, https://doi.org/10.1088/1748-9326/ab31e4, 2019.
Mathias, J. M. and Trugman, A. T.: Climate change impacts plant carbon balance, increasing mean future carbon use efficiency but decreasing total forest extent at dry range edges, Ecol. Lett., 25, 498–508, https://doi.org/10.1111/ele.13945, 2022.
Matsushita, B. and Tamura, M.: Integrating remotely sensed data with an ecosystem model to estimate net primary productivity in East Asia, Remote Sens. Environ., 81, 58–66, https://doi.org/10.1016/S0034-4257(01)00331-5, 2002.
Moore, C. E., Meacham-Hensold, K., Lemonnier, P., Slattery, R. A., Benjamin, C., Bernacchi, C. J., Lawson, T., and Cavanagh, A. P.: The effect of increasing temperature on crop photosynthesis: from enzymes to ecosystems, J. Exp. Bot., 72, 2822–2844, https://doi.org/10.1093/jxb/erab090, 2021.
Myneni, R., Keeling, C., Tucker, C., Asrar, G., and Nemani, R. R.: Increased plant growth in the northern high latitudes from 1981 to 1991, Nature, 386, 698–702, https://doi.org/10.1038/386698a0, 1997.
Needham, J. F., Chambers, J., Fisher, R., Knox, R., and Koven, C. D.: Forest responses to simulated elevated CO2 under alternate hypotheses of size- and age-dependent mortality, Glob. Change Biol., 26, 5734–5753, https://doi.org/10.1111/gcb.15254, 2020.
Nemani, R. R., Keeling, C. D., Hashimoto, H., Jolly, W., Piper, S., Tucker, C., Myneni, R., and Running, S.: Climate-Driven Increases in Global Terrestrial Net Primary Production from 1982 to 1999, Science, 300, 1560–1563, https://doi.org/10.1126/science.1082750, 2003.
NESDC: Vcmax25 products, NESDC [data set], http://www.nesdc.org.cn/sdo/detail?id=612f42ee7e28172cbed3d80f, last access: 15 May 2022.
Nie, C., Chen, X., Xu, R., Zhu, Y., Deng, C., and Yang, Q.: The Spatio-Temporal Variations of GPP and Its Climatic Driving Factors in the Yangtze River Basin during 2000–2018, Forests, 14, 1898, https://doi.org/10.3390/f14091898, 2023.
NOAA: Atmospheric CO2 data, NOAA [data set], https://gml.noaa.gov/aftp/data/greenhouse_gases/co2/in-situ/surface/, last access: 22 December 2022.
Norby, R., Warren, J., Iversen, C., Medlyn, B., and McMurtrie, R.: CO2 enhancement of forest productivity constrained by limited nitrogen availability, P. Natl. Acad. Sci. USA, 107, 19368–19373, https://doi.org/10.1073/pnas.1006463107, 2010.
Pan, Y., Birdsey, R., Fang, J., Houghton, R., Kauppi, P., Kurz, W., Phillips, O., Shvidenko, A., Lewis, S., Canadell, J., Ciais, P., Jackson, R. B., Pacala, S., McGuire, A., Piao, S., Rautiainen, A., Sitch, S., and Hayes, D.: A large and persistent carbon sink in the world's forests, Science, 333, 988–993, https://doi.org/10.1126/science.1201609, 2011.
Peng, J., Wu, C., Zhang, X., Ju, W., Wang, X., Lu, L., and Liu, Y.: Incorporating water availability into autumn phenological model improved China's terrestrial gross primary productivity (GPP) simulation, Environ. Res. Lett., 16, 094012, https://doi.org/10.1088/1748-9326/ac1a3b, 2021.
Piao, S., Fang, J., Zhou, L., Zhu, B., Tan, K., and Tao, S.: Changes in vegetation net primary productivity from 1982 to 1999 in China, Global Biogeochem. Cy., 19, GB2027, https://doi.org/10.1029/2004GB002274, 2005.
Piao, S., Wang, X., Park, T., Chen, C., Lian, X., He, Y., Bjerke, J. W., Chen, A., Ciais, P., Tømmervik, H., Nemani, R. R., and Myneni, R. B.: Characteristics, drivers and feedbacks of global greening, Nat. Rev. Earth Environ., 1, 14–27, https://doi.org/10.1038/s43017-019-0001-x, 2020.
Quetin, G. R., Famiglietti, C. A., Dadap, N. C., Bloom, A. A., Bowman, K. W., Diffenbaugh, N. S., Liu, J., Trugman, A. T., and Konings, A. G.: Attributing Past Carbon Fluxes to CO2 and Climate Change: Respiration Response to CO2 Fertilization Shifts Regional Distribution of the Carbon Sink, Global Biogeochem. Cy., 37, e2022GB007478, https://doi.org/10.1029/2022GB007478, 2023.
Reichstein, M., Falge, E., Baldocchi, D., Papale, D., Aubinet, M., Berbigier, P., Bernhofer, C., Buchmann, N., Gilmanov, T., Granier, A., Grünwald, T., Havránková, K., Ilvesniemi, H., Janous, D., Knohl, A., Laurila, T., Lohila, A., Loustau, D., Matteucci, G., Meyers, T., Miglietta, F., Ourcival, J., Pumpanen, J., Rambal, S., Rotenberg, E., Sanz, M., Tenhunen, J., Seufert, G., Vaccari, F., Vesala, T., Yakir, D., and Valentini, R.: On the separation of net ecosystem exchange into assimilation and ecosystem respiration: review and improved algorithm, Global Change Biol., 11, 1424–1439, https://doi.org/10.1111/j.1365-2486.2005.001002.x, 2005.
Running, S. W. and Coughlan, J. C.: A general model of forest ecosystem processes for regional applications I. Hydrologic balance, canopy gas exchange and primary production processes, Ecol. Model., 42, 125–154, 1988.
Running, S. W., Mu, Q., and Zhao, M.: MOD17A2H MODIS/Terra Gross Primary Productivity 8-Day L4 Global 500 m SIN Grid, NASA LP DAAC, https://doi.org/10.5067/MODIS/MOD17A2H.006, 2015.
Schimel, D., Stephens, B. B., and Fisher, J. B.: Effect of increasing CO2 on the terrestrial carbon cycle, P. Natl. Acad. Sci. USA, 112, 436–441, https://doi.org/10.1073/pnas.1407302112, 2014.
Shevliakova, E., Stouffer, R. J., Malyshev, S., Krasting, J. P., Hurtt, G. C., and Pacala, S. W.: Historical warming reduced due to enhanced land carbon uptake, P. Natl. Acad. Sci. USA, 110, 16730–16735, https://doi.org/10.1073/pnas.1314047110, 2013.
Siddik, M. A., Zhang, J., Chen, J., Qian, H., Jiang, Y., Raheem, A., Deng, A., Song, Z., Zheng, C., and Zhang, W.: Responses of indica rice yield and quality to extreme high and low temperatures during the reproductive period, Eur. J. Agron., 106, 30–38, https://doi.org/10.1016/j.eja.2019.03.004, 2019.
Song, Y., Jiao, W., Wang, J., and Wang, L.: Increased global vegetation productivity despite rising atmospheric dryness over the last two decades, Earths Future, 10, e2021EF002634, https://doi.org/10.1029/2021EF002634, 2022.
Sprintsin, M., Chen, J. M., Desai, A., and Gough, C. M.: Evaluation of leaf-to-canopy upscaling methodologies against carbon flux data in North America, J. Geophys. Res.-Biogeo., 117, G01023, https://doi.org/10.1029/2010JG001407, 2012.
Sun, C., Jiang, Z., Li, W., Hou, Q., and Li, L.: Changes in extreme temperature over China when global warming stabilized at 1.5 °C and 2.0 °C, Sci. Rep.-UK, 9, 14982, https://doi.org/10.1038/s41598-019-50036-z, 2019.
Sun, S., Liu, Y., Chen, H., Ju, W., Xu, C., Liu, Y., Zhou, B., Zhou, Y., Zhou, Y., and Yu, M.: Causes for the increases in both evapotranspiration and water yield over vegetated mainland China during the last two decades, Agr. Forest Meteorol., 324, 109118, https://doi.org/10.1016/j.agrformet.2022.109118, 2022.
Sun, Y. R., Ma, W. T., Xu, Y. N., Wang, X., Li, L., Tcherkez, G., and Gong, X. Y.: Short- and long-term responses of leaf day respiration to elevated atmospheric CO2, Plant Physiol., 191, 2204–2217, https://doi.org/10.1093/plphys/kiac582, 2023.
Tagesson, T., Schurgers, G., Horion, S., Ciais, P., Tian, F., Brandt, M., Ahlström, A., Wigneron, J., Ardö, J., Olin, S., Fan, L., Wu, Z., and Fensholt, R.: Recent divergence in the contributions of tropical and boreal forests to the terrestrial carbon sink, Nat. Ecol. Evol., 4, 202–209, https://doi.org/10.1038/s41559-019-1090-0, 2020.
Tong, X., Brandt, M., Yue, Y., Horion, S., Wang, K., De Keersmaecker, W., Tian, F., Schurgers, G., Xiao, X., Luo, Y., Chen, C., Myneni, R., Shi, Z., Chen, H., and Fensholt, R.: Increased vegetation growth and carbon stock in China karst via ecological engineering, Nat. Sustain., 1, 44–50, https://doi.org/10.1038/s41893-017-0004-x, 2018.
University of Maryland: GLASS LAI, University of Maryland [data set], http://www.glass.umd.edu/Download.html, last access: 15 December 2022.
Viña, A., McConnell, W. J., Yang, H., Xu, Z., and Liu, J.: Effects of conservation policy on China's forest recovery, Sci. Adv., 2, e1500965, https://doi.org/10.1126/sciadv.1500965, 2016.
Wang, B., Ma, Y., Su, Z., Wang, Y., and Ma, W.: Quantifying the evaporation amounts of 75 highelevation large dimictic lakes on the Tibetan Plateau, Sci. Adv., 6, eaay8558, https://doi.org/10.1126/sciadv.aay8558, 2020.
Wang, C., Yu, G., Zhou, G., Yan, J., Zhang, L., Wang, X., Tang, X., and Sun, X.: CO2 flux evaluation over the evergreen coniferous and broad-leaved mixed forest in Dinghushan, China, Sci. China Earth Sci., 49, 127–138, https://doi.org/10.1007/s11430-006-8127-3, 2006.
Wang, M., Wang, S., Wang, J., Yan, H., Mickler, R. A., Shi, H., He, H., Huang, M., and Zhou, L.: Detection of Positive Gross Primary Production Extremes in Terrestrial Ecosystems of China During 1982–2015 and Analysis of Climate Contribution, J. Geophys. Res.-Biogeo., 123, 2807–2823, https://doi.org/10.1029/2018JG004489, 2018.
Wang, M., Wang, S., Zhao, J., Ju, W., and Hao, Z.: Global positive gross primary productivity extremes and climate contributions during 1982–2016, Sci. Total Environ., 774, 145703, https://doi.org/10.1016/j.scitotenv.2021.145703, 2021.
Wang, Q., Tenhunen, J., Falge, E., Bernhofer, C., Granier, A., and Vesala, T.: Simulation and scaling of temporal variation in gross primary production for coniferous and deciduous temperate forests, Global Change Biol., 10, 37–51, https://doi.org/10.1111/j.1365-2486.2003.00716.x, 2003.
Wang, R., Chen, J. M., Luo, X., Black, A., and Arain, A.: Seasonality of leaf area index and photosynthetic capacity for better estimation of carbon and water fluxes in evergreen conifer forests, Agr. Forest Meteorol., 279, 107708, https://doi.org/10.1016/j.agrformet.2019.107708, 2019.
Wang, S., Li, Y., Ju, W., Chen, B., Chen, J., Croft, H., Mickler, R. A., and Yang, F.: Estimation of Leaf Photosynthetic Capacity From Leaf Chlorophyll Content and Leaf Age in a Subtropical Evergreen Coniferous Plantation, J. Geophys. Res.-Biogeo., 125, e2019JG005020, https://doi.org/10.1029/2019JG005020, 2020.
Wang, S., Zhang, Y., Ju, W., Qiu, B., and Zhang, Z.: Tracking the seasonal and inter-annual variations of global gross primary production during last four decades using satellite near-infrared reflectance data, Sci. Total Environ., 755, 142569, https://doi.org/10.1016/j.scitotenv.2020.142569, 2021.
Wang, X., Chen, J. M., Ju, W., and Zhang, Y.: Seasonal Variations in Leaf Maximum Photosynthetic Capacity and Its Dependence on Climate Factors Across Global FLUXNET Sites, J. Geophys. Res.-Biogeo., 127, e2021JG006709, https://doi.org/10.1029/2021JG006709, 2022.
Wieder, W. R., Boehnert, J., Bonan, G. B., and Langseth, M.: Regridded Harmonized World Soil Database v1.2, ORNL DAAC, Oak Ridge, Tennessee, USA [data set], https://doi.org/10.3334/ORNLDAAC/1247, 2014.
Xiao, Z., Liang, S., Wang, J., Xiang, Y., Zhao, X., and Song, J.: Long-Time-Series Global Land Surface Satellite Leaf Area Index Product Derived From MODIS and AVHRR Surface Reflectance, IEEE T. Geosci. Elect., 54, 5301–5318, https://doi.org/10.1109/TGRS.2016.2560522, 2016.
Xie, S., Mo, X., Hu, S., and Liu, S.: Contributions of climate change, elevated atmospheric CO2 and human activities to ET and GPP trends in the Three-North Region of China, Agr. Forest Meteorol., 295, 108183, https://doi.org/10.1016/j.agrformet.2020.108183, 2020.
Xie, X., Li, A., Jin, H., Yin, G., and Nan, X.: Derivation of temporally continuous leaf maximum carboxylation rate (V-cmax) from the sunlit leaf gross photosynthesis productivity through combining BEPS model with light response curve at tower flux sites, Agr. Forest Meteorol., 259, 82–94, https://doi.org/10.1016/j.agrformet.2018.04.017, 2018.
Xie, X., Li, A., Jin, H., Tan, J., Wang, C., Lei, G., Zhang, Z., Bian, J., and Nan, X.: Assessment of five satellite-derived LAI datasets for GPP estimations through ecosystem models, Sci. Total Environ., 690, 1120–1130, https://doi.org/10.1016/j.scitotenv.2019.06.516, 2019.
Xu, M., Liu, R., Chen, J. M., Liu, Y., Wolanin, A., Croft, H., He, L., Shang, R., Ju, W., Zhang, Y., He, Y., and Wang, R.: A 21-Year Time Series of Global Leaf Chlorophyll Content Maps From MODIS Imagery, IEEE T. Geosci. Elect., 60, 1–13, https://doi.org/10.1109/TGRS.2022.3204185, 2022.
Yang, F., Lu, H., Yang, K., He, J., Wang, W., Wright, J. S., Li, C., Han, M., and Li, Y.: Evaluation of multiple forcing data sets for precipitation and shortwave radiation over major land areas of China, Hydrol. Earth Syst. Sci., 21, 5805–5821, https://doi.org/10.5194/hess-21-5805-2017, 2017.
Yao, Y., Piao, S., and Wang, T.: Future biomass carbon sequestration capacity of Chinese forests, Sci. Bull., 63, 1108–1117, https://doi.org/10.1016/j.scib.2018.07.015, 2018a.
Yao, Y., Wang, H., Li, Y., Wang, T., Shen, M., Du, M., He, H., Li, Y., Luo, W., Ma, M., Ma, Y., Tang, Y., Wang, H., Zhang, X., Zhang, Y., Zhao, L., Zhou, G., and Piao, S.: Spatiotemporal pattern of gross primary productivity and its covariation with climate in China over the last thirty years, Global Change Biol., 24, 184–196, https://doi.org/10.1111/gcb.13830, 2018b.
Yin, R. and Yin, G.: China's Primary Programs of Terrestrial Ecosystem Restoration: Initiation, Implementation, and Challenges, Environ. Manage., 45, 429–441, https://doi.org/10.1007/s00267-009-9373-x, 2010.
Yu, D. Y., Shi, P. J., Han, G. Y., Zhu, W. Q., Du, S. Q., and Xun, B.: Forest ecosystem restoration due to a national conservation plan in China, Ecol. Eng., 37, 1387–1397, https://doi.org/10.1016/j.ecoleng.2011.03.011, 2011.
Yu, G., Wen, X., Sun, X., Tanner, B. D., Lee, X., and Chen, J.: Overview of ChinaFLUX and evaluation of its eddy covariance measurement, Agr. Forest Meteorol., 137, 125–137, https://doi.org/10.1016/j.agrformet.2006.02.011, 2006.
Yu, G., Chen, Z., Piao, S., Peng, C., Ciais, P., Wang, Q., Li, X., and Zhu, X.: High carbon dioxide uptake by subtropical forest ecosystems in the East Asian monsoon region, P. Natl. Acad. Sci. USA, 111, 4910–4915, https://doi.org/10.1073/pnas.1317065111, 2014.
Yuan, W., Cai, W., Chen, Y., Liu S., Dong, W., Zhang, H., Yu, G., Chen, Z., He, H., Guo, W., Liu, D., Liu, S., Xiang, W., Xie, Z., Zhao, Z., and Zhou, G.: Severe summer heatwave and drought strongly reduced carbon uptake in Southern China, Sci. Rep.-UK, 6, 18813, https://doi.org/10.1038/srep18813, 2016.
Yuan, W., Zheng, Y., Piao, S., Ciais, P., Lombardozzi, D., Wang, Y., Ryu, Y., Chen, G., Dong, W., Hu, Z., Jain, A. K., Jiang, C., Kato, E., Li, S., Lienert, S., Liu, S., Nabel, J., Qin, Z., Quine, T., Sitch, S., Smith, W. K., Wang, F., Wu, C., Xiao, Z., and Yang, S.: Increased atmospheric vapor pressure deficit reduces global vegetation growth, Sci. Adv., 5, eaax1396, https://doi.org/10.1126/sciadv.aax1396, 2019.
Zhang, F., Ju, M., Shen, S., Wang, S., Yu, G., and Han, S.: Variations of Terrestrial Net Primary Productivity in East Asia, Terr. Atmos. Ocean. Sci., 23, 425–437, https://doi.org/10.3319/TAO.2012.03.28.01(A), 2012.
Zhang, X., Zhou, Y., He, W., Ju, W., Liu, Y., Bi, W., Cheng, N., and Wei, X.: Land cover change instead of solar radiation change dominates the forest GPP increase during the recent phase of the Shelterbelt Program for Pearl River, Ecol. Indic., 136, 108664, https://doi.org/10.1016/j.ecolind.2022.108664, 2022.
Zhang, Y., Song, C., Zhang, K., Cheng, X., Band, L. E., and Zhang, Q.: Effects of land use/land cover and climate changes on terrestrial net primary productivity in the Yangtze River Basin, China, from 2001 to 2010, J. Geophys. Res.-Biogeo., 119, 1092–1109, https://doi.org/10.1002/2014JG002616, 2014.
Zhang, Y., Xiao, X., Wu, X., Zhou, S., Zhang, G., Qin, Y., and Dong, J.: A global moderate resolution dataset of gross primary production of vegetation for 2000–2016, Sci. Data, 4, 170165, https://doi.org/10.1038/sdata.2017.165, 2017.
Zheng, Y., Shen, R., Wang, Y., Li, X., Liu, S., Liang, S., Chen, J. M., Ju, W., Zhang, L., and Yuan, W.: Improved estimate of global gross primary production for reproducing its long-term variation, 1982–2017, Earth Syst. Sci. Data, 12, 2725–2746, https://doi.org/10.5194/essd-12-2725-2020, 2020.
Zhu, Z., Piao, S., Myneni, R. B., Huang, M., Zeng, Z.,Canadell, J. G., Ciais, P., Sitch, S., Friedlingstein, P., Arneth, A., Cao, C., Cheng, L., Kato, E., Koven, C., Li, Y., Lian, X., Liu, Y., Liu, R., Mao, J., Pan, Y., Peng, S., Peñuelas, J., Poulter, B., Pugh, T. A. M., Stocker, B. D., Viovy, N., Wang, X., Wang, Y., Xiao, Z., Yang, H., Zaehle, S., and Zeng, N.: Greening of the Earth and its drivers, Nat. Clim. Change, 6, 791–795, https://doi.org/10.1038/nclimate3004, 2016.
Zhu, Z., Piao, S., Lian, X., Myneni, R. B., Peng, S., and Yang, H.: Attribution of seasonal leaf area index trends in the northern latitudes with “optimally” integrated ecosystem models, Glob. Change Biol., 23, 4798–4813, https://doi.org/10.1111/gcb.13723, 2017.