the Creative Commons Attribution 4.0 License.
the Creative Commons Attribution 4.0 License.
 | 16 Jan 2024
The additionality problem of ocean alkalinity enhancement
Lennart Thomas Bach
Ocean alkalinity enhancement (OAE) is an emerging approach for atmospheric carbon dioxide removal (CDR). The net climatic benefit of OAE depends on how much it can increase CO2 sequestration relative to a baseline state without OAE. This so-called “additionality” can be calculated as follows:
So far, feasibility studies on OAE have mainly focussed on enhancing alkalinity in the oceans to stimulate CO2 sequestration (COAE); however, the primary focus has not been on how such anthropogenic alkalinity would modify the natural alkalinity cycle and associated baseline CO2 sequestration (ΔCbaseline). Here, I present incubation experiments in which materials considered for OAE (sodium hydroxide, steel slag, and olivine) are exposed to beach sand to investigate the influence of anthropogenic alkalinity on natural alkalinity sources and sinks. The experiments show that anthropogenic alkalinity can strongly reduce the generation of natural alkalinity, thereby reducing additionality. This is because the anthropogenic alkalinity increases the calcium carbonate saturation state, which reduces the dissolution of calcium carbonate from sand, a natural alkalinity source. I argue that this “additionality problem” of OAE is potentially widespread and applies to many marine systems where OAE implementation is considered – far beyond the beach scenario investigated in this study. However, the problem can potentially be mitigated by dilute dosing of anthropogenic alkalinity into the ocean environment and the avoidance of OAE in natural alkalinity cycling hotspots, such as in marine sediments. Understanding a potential slowdown of the natural alkalinity cycle through the introduction of an anthropogenic alkalinity cycle will be crucial for the assessment of OAE.
- Article
(3567 KB) - Full-text XML
-
Supplement
(729 KB) - BibTeX
- EndNote


Keeping global warming between 1.5 and 2 ∘C requires a rapid reduction in the greenhouse gas emissions and gigatonne-scale atmospheric carbon dioxide removal (CDR), using a portfolio of terrestrial and marine CDR methods (Nemet et al., 2018). Ocean alkalinity enhancement (OAE) is considered to be an important CDR method in the marine portfolio (Hartmann et al., 2013). OAE can be achieved through a variety of geochemical and electrochemical processes (Renforth and Henderson, 2017). All of these processes enhance surface ocean alkalinity to reduce the hydrogen ion (H+) concentration in seawater (i.e. increase pH). This reduction in [H+] causes a shift in the carbonate chemistry equilibrium from CO2 on the left towards bicarbonate (HCO and carbonate ion (CO on the right:
The associated reduction in the CO2 partial pressure in seawater (pCO2) enables atmospheric CO2 influx into the oceans (or reduces CO2 outflux if pCO2 > atmospheric pCO2). This transfer (retention) of atmospheric CO2 into the ocean leads to an increase in the dissolved inorganic carbon (DIC) concentration in seawater, with DIC defined as follows:
Among the widely discussed OAE approaches are coastal enhanced weathering and electrodialytic acid removal (Eisaman et al., 2023). Coastal enhanced weathering achieves an alkalinity increase via the addition of pulverized alkaline rocks like limestone, olivine, or alkaline industrial products such as steel slag to coastal environments (Meysman and Montserrat, 2017; Feng et al., 2017; Harvey, 2008; Schuiling and Krijgsman, 2006; Renforth, 2019).
Electrodialytic OAE is somewhat different from coastal enhanced weathering because no materials are added to seawater. Instead, water dissociation into H+ and OH− is catalysed in bipolar membranes, and these ions are then separated using electrical energy and ion-selective membranes (de Lannoy et al., 2018). H+ is captured as hydrochloric acid, whilst OH− is captured as sodium hydroxide (NaOH). The hydrochloric acid needs to be utilized, neutralized in deep ocean sediments, or stored in save reservoirs outside the ocean (Eisaman et al., 2018; Tyka et al., 2022). NaOH is enriched in the processed seawater, which is released back into the surface to convert CO2 into HCO (Eisaman et al., 2018; Tyka et al., 2022).
A critical side-effect of OAE is the associated increase in the CO concentration, which occurs due to the shift in the marine carbonate equilibrium via H+ absorption (see above). This increase elevates the saturation state for calcium carbonate (, the metric which determines the solubility of CaCO3 in seawater. is defined as follows:
where [Ca2+]SW and [CO]SW are the calcium ion (Ca2+) and CO concentration in seawater, respectively, and Ksp is the empirically determined solubility product (Mucci, 1983). Ksp differs for different crystal forms of CaCO3: it is higher for aragonite than for calcite, meaning that aragonite is more soluble (Mucci, 1983). Aragonite (Arg) and calcite (Cal) precipitation is thermodynamically favoured when ΩArg and ΩCal are ≥1 (Adkins et al., 2020). CaCO3 precipitation is of high relevance for the assessment of OAE as the drawdown of CO through precipitation reduces alkalinity, shifts the carbonate chemistry equilibrium (Eq. 1) towards CO2, and thus counters the CDR efficiency of OAE (Moras et al., 2022; Fuhr et al., 2022; Hartmann et al., 2023).
Logistical constraints suggest that OAE would at least initially be more likely to be conducted in coastal environments (Renforth and Henderson, 2017; Lezaun, 2021; He and Tyka, 2023). Here, alkalinity-enhanced seawater would likely be in contact with marine sediments (Meysman and Montserrat, 2017; Feng et al., 2017; Harvey, 2008). The highly abundant particles in marine sediments can serve as nuclei for CaCO3 precipitation, thereby catalysing alkalinity loss when is ≥1 (Zhong and Mucci, 1989; Morse et al., 2003; Adkins et al., 2020). This constitutes a problem for OAE because alkalinity-enhanced seawater with its high is then exposed to particles that catalyse precipitation. Indeed, recent studies have demonstrated that this particle-catalysed precipitation can rapidly reduce alkalinity, with the degree and rate of alkalinity reduction depending on the amount of alkalinity added and the particle concentrations (Moras et al., 2022; Fuhr et al., 2022; Hartmann et al., 2023).
Particle-catalysed CaCO3 precipitation has received significant consideration as a loss term for OAE efficiency (Renforth and Henderson, 2017; Moras et al., 2022; Fuhr et al., 2022; Hartmann et al., 2013, 2023). However, there is another complication affecting OAE efficiency near sediments that has received no attention and will be in focus of this study. Sediments can not only provide precipitation nuclei but also constitute natural alkalinity sources, for example via the dissolution of CaCO3 or other carbonates (Torres et al., 2020; Wallmann et al., 2022; Krumins et al., 2013; Aller, 1982; Middelburg et al., 2020). Sandy beaches can be rich in biogenic carbonates and organic matter, thereby creating environments of high respiratory CO2. Accordingly, is low close to the sediments or within pore waters, and CaCO3 dissolution is favoured (Liu et al., 2021; Perkins et al., 2022; Reckhardt et al., 2015). This form of natural alkalinity formation via CaCO3 dissolution can sequester CO2 which may have otherwise been released into the atmosphere (Saderne et al., 2021; Krumins et al., 2013; Aller, 1982; Fakhraee et al., 2023; Archer et al., 1998). OAE within these naturally low environments could have two effects. First, it would have the desired effect of consuming H+ and increasing CO2 sequestration via the generation of anthropogenic alkalinity. Second, the consumption of H+ would increase , which could reduce the dissolution of CaCO3 and, thus, reduce natural CO2 sequestration because less natural alkalinity is produced. Due to this second effect, the first (desired) effect of CO2 sequestration may be significantly reduced. Accordingly, the net gain in CO2 sequestration would be lower than one would have hoped for.
The concept of “additionality” describes the net gain in CO2 sequestration achieved through the implementation of a CDR method relative to a hypothetical baseline (or “business-as-usual”) scenario (Michaelowa et al., 2019). Per definition, “additional” is all of the CO2 sequestration achieved through the implementation of a CDR method (here OAE) that goes beyond the natural and anthropogenic CO2 sequestration that already occurs in the baseline scenario without the implementation of the CDR method. Additionality is a central concept in climate policy that has been utilized for carbon accounting in the Clean Development Mechanism established under the 1997 Kyoto Protocol (Havukainen et al., 2022). It can be defined in simple terms as follows:
where COAE is the CO2 sequestration achieved through OAE and ΔCbaseline is the change in the baseline CO2 sequestration through the implementation of OAE.
This study aims to reveal and describe how anthropogenic alkalinity affects natural alkalinity release to better understand the CO2 sequestration potential of OAE in the context of additionality. I present observational data and three experiments in which three types of anthropogenic alkalinity sources (NaOH, steel slag, and olivine) are exposed to a natural alkalinity source and sink (beach sand) to investigate their interactions. Afterwards, I examine these interactions (termed the “additionality problem”), discuss their relevance, and assess how the additionality problem could be managed.
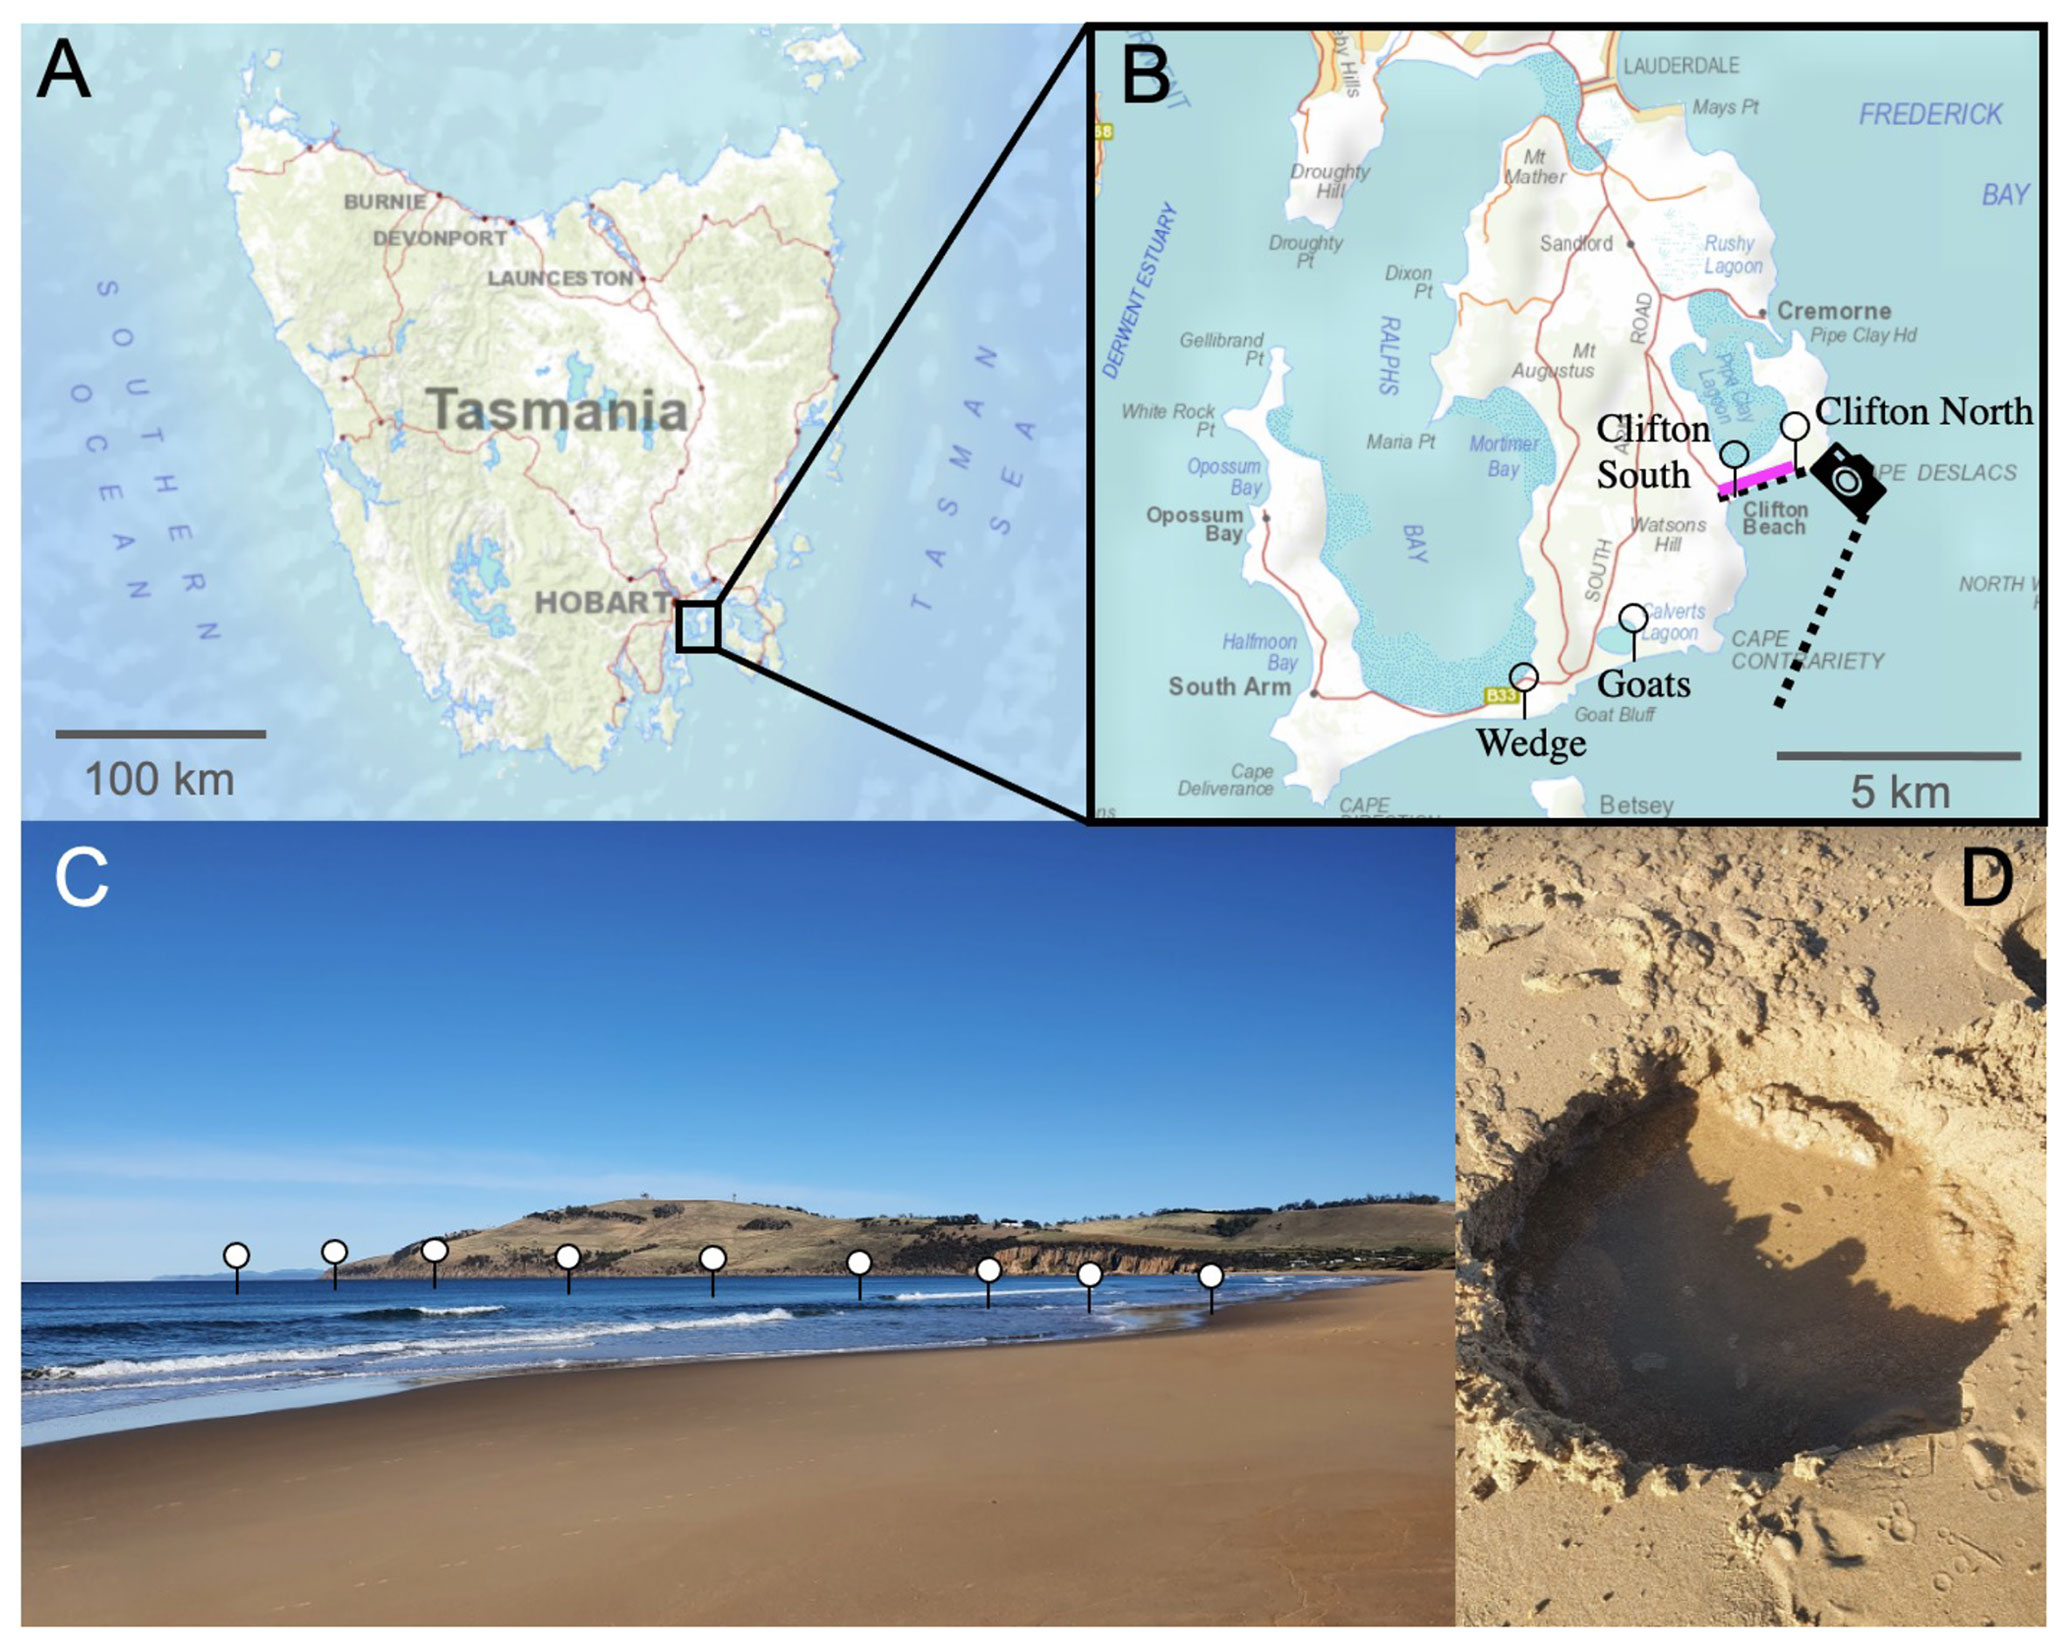
Figure 1Locations of the beach transects and beach sand sampling sites in Tasmania. Panel (a) presents a map of Tasmania; panel (b) provides an enlarged map of the South Arm region, south of Hobart. Needles show the locations of the beach transects and the pink line along Clifton Beach shows where sand samples (Sand 1–5) were collected for incubation experiments. The camera symbol illustrates the position from which the picture shown in panel (c) was taken. Panel (c) illustrates the approximate location of one of the beach transects. Panel (d) shows a hole that was dug to sample seawater just above the swash zone, i.e. the first sample location along the transects from the beach towards 150–200 m offshore. The maps were reproduced with the permission of the Environment Heritage and Land Division, Department of Natural Resources and Environment Tasmania, © State of Tasmania.
2.1 Carbonate chemistry and dissolved silicate transects along Southern Tasmanian beaches
The project was initialized with near-shore alkalinity, pH, and dissolved silicate (Si(OH)4) transects on four Tasmanian beaches to determine whether these beaches are potential alkalinity sinks or sources. The investigated beaches were Clifton South, Clifton North, Goats, and Wedge on the South Arm near Hobart, Tasmania (Fig. 1, Table S1 in the Supplement).
Samples for alkalinity and Si(OH)4 were taken by filling 200 mL of seawater from 0.2 m depth into a polyethylene (PE) bottle. Samples for pH were collected in 60 mL polystyrene (PS) jars that were filled and closed at 0.2 m depth. Both the PE bottles and the PS jars were prerinsed with sample. The sample closest to shore was taken in the swash zone (where wave bores run up and down the beach) at the highest point reached by a wave bore within ∼5 min of observation. A ∼0.2 m deep hole was dug (Fig. 1) and water was collected from the groundwater with a 60 mL syringe. The second sample was from the upper part of the swash zone where waves pushed water up the beach. Samples further out were taken from within the surf zone to about 50–100 m beyond the surf zone. Samples were taken by walking into the water to the point at which it became too deep and a surfboard had to be used as the sampling vehicle to reach deeper water.
The samples were transported back to the beach where pH was measured within 15 min of sampling, as described in Sect. 2.4. Alkalinity and Si(OH)4 samples were filtered after pH measurements with a 0.22 syringe filter (nylon membrane) into a 125 mL PE bottle (alkalinity) or 60 mL PS plastic jar (Si(OH)4). Both containers, the syringe, and the syringe filter were prerinsed with sample.
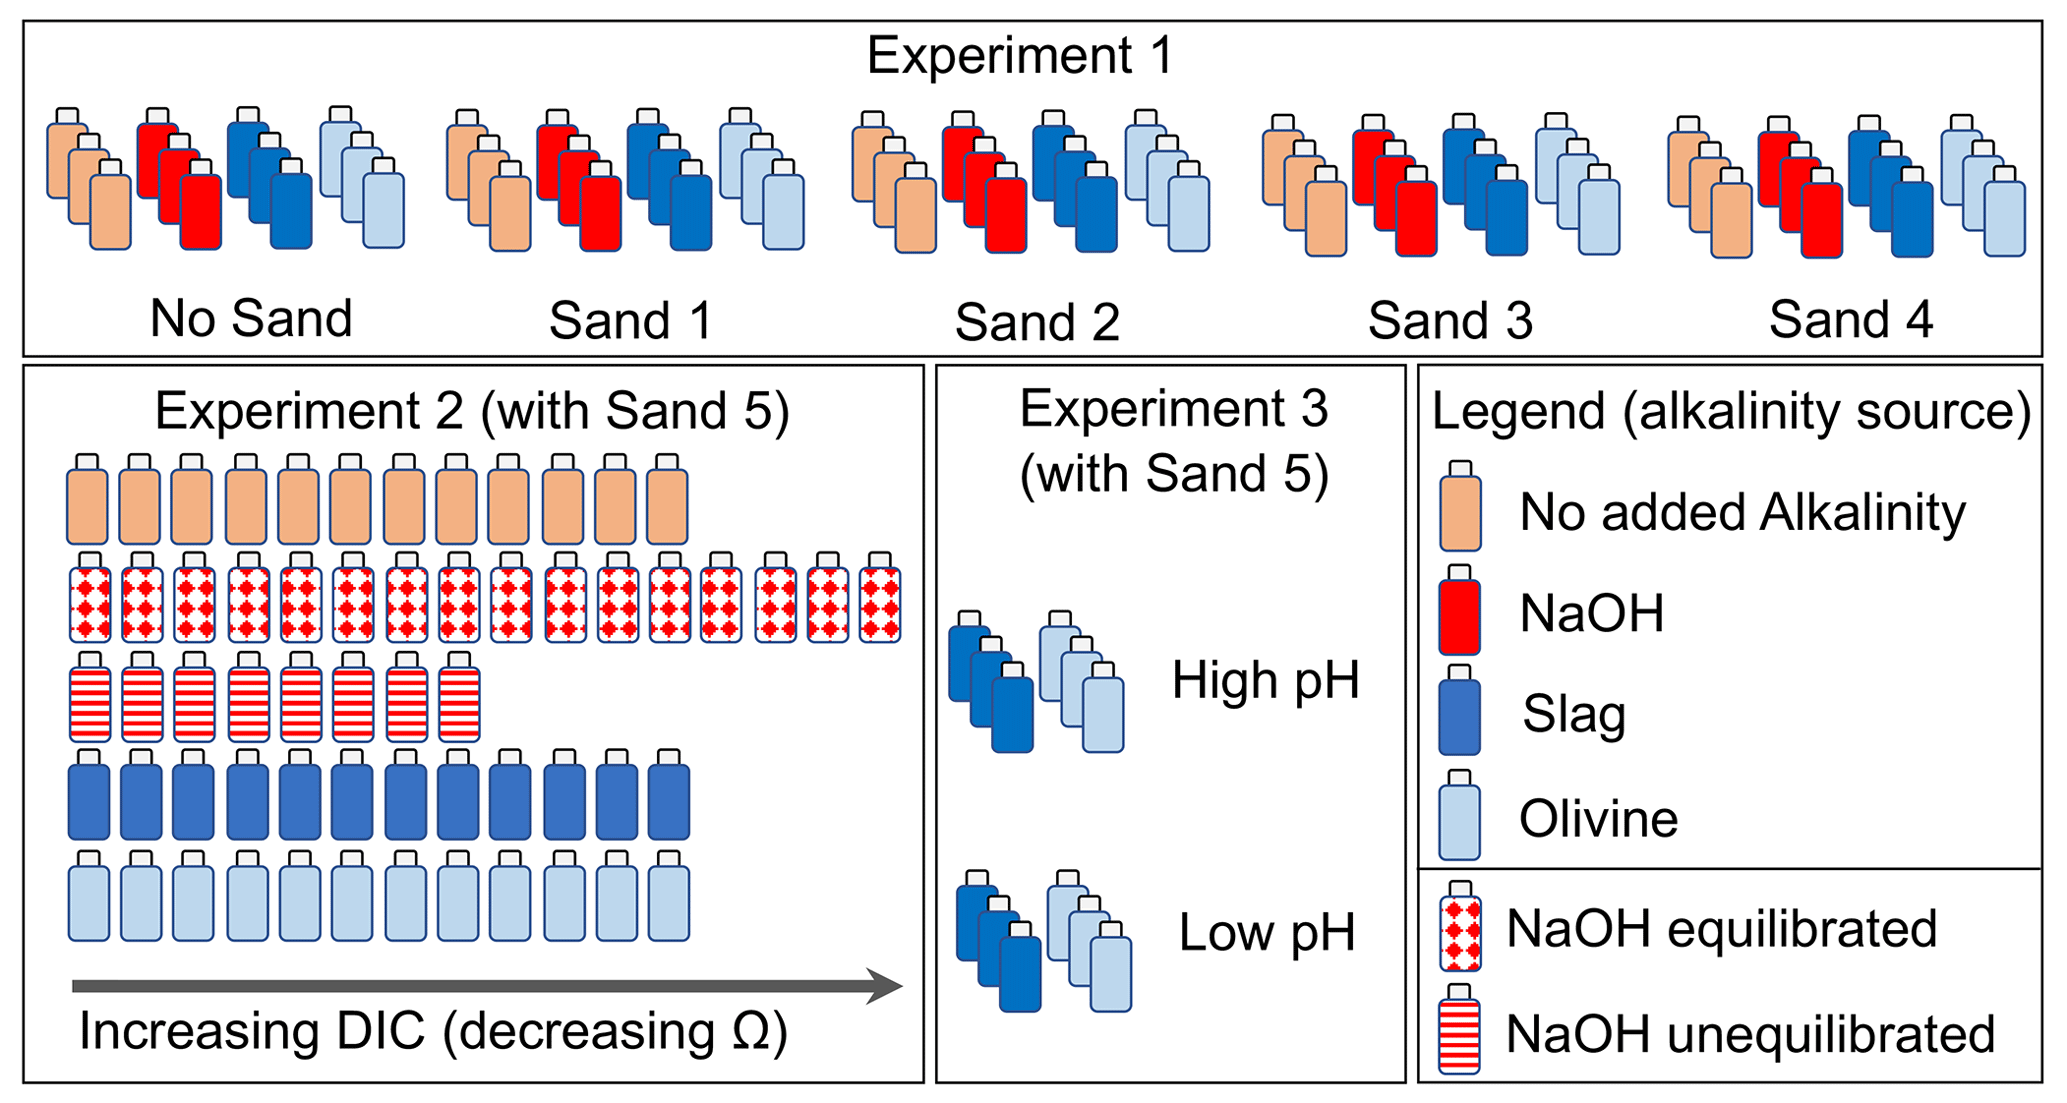
Figure 2Design of experiments 1, 2, and 3. Bottles represent treatments with the incubation of seawater, sand, and alkalinity sources (colour code represents alkalinity source). In Experiment 2, NaOH was used as the alkalinity source in two explicit scenarios, as described in Sect. 2.2.2.
2.2 Laboratory experiments
2.2.1 Experiment 1: replicated dissolution assays to monitor interaction between beach sand and alkaline materials
Experiment 1 was designed to investigate the interaction between four different beach sands and alkaline materials during their incubation in seawater. The experiment required 60 high-density poly ethylene (HDPE) bottles, each with a volume of 125 mL. These 60 bottles were thoroughly cleaned with double-deionized water and dried at 60 ∘C. A total of 12 bottles were filled with sand from one of the four sampling locations (Sect. 2.3), respectively (totalling 48 bottles). Another set of 12 bottles were not filled with sand. This yielded five sets of 12 bottles (Fig. 2). Of each set, three bottles remained without further addition, three received 51.3 µL of 1 M NaOH (targeted alkalinity increase was 428 µmol kg−1), three received 0.0065 g of ground steel slag, and three received 1 g of ground olivine (Fig. 2; sand, steel slag, and olivine properties were determined as described in Sect. 2.3). The 48 bottles that contained sand were filled with 10 g of sand if slag or NaOH was added or 9 g of sand if olivine was added. This was done so that the combined weight of the added sand and alkalinity feedstock was always ∼10 g.
Once the solid components were added, each bottle was filled with 120 (±4) g of seawater (salinity = 35 ± 0.2, alkalinity = 2259.7 µmol kg−1) collected in July 2022 in the Derwent Estuary near Taroona. The salinity and pH of the seawater were determined a few minutes before transfer into the incubation bottles with a Metrohm 914 pH/Conductometer, as described in Sect. 2.4. The transfer of the seawater into the incubation bottles took 30 min in total (in the case of NaOH additions, seawater was added to the bottles before 51.3 µL of 1 M NaOH was added). The incubation bottles were immediately mounted on a plankton wheel (1.06 m diameter, two rounds per minute) that was placed in a temperature-controlled room set to 15 ∘C (Fig. S1 in the Supplement). The plankton wheel kept the various mixtures of sand, alkalinity source, and seawater moving inside the bottles. The experiment commenced at 16:00 AET (Australian Eastern Time) on the 17 August 2022.
After ∼6.8 d (24 August), bottles were consecutively removed from the plankton wheel in random order between 08:00 and 15:30 AET. pH was measured inside the bottle with a pH electrode directly after the bottle was taken off the plankton wheel. Afterwards, the alkalinity sample was filtered with a syringe through a 0.2 µm nylon filter into a dry and clean 125 mL HDPE bottle and stored in the dark at 7 ∘C.
2.2.2 Experiment 2: alkalinity formation at Ω gradients
Experiment 2 was designed to investigate whether a decline in enhances the formation of natural alkalinity via CaCO3 dissolution and how anthropogenic alkalinity sources (olivine, slag, and NaOH) influence this process. The experiment required 60 HDPE bottles (125 mL) cleaned with acid (acid was used in Experiment 2 to make sure all remnants from Experiment 1 were washed out of the bottles) and double-deionized water. All 60 incubation bottles were filled with sand from Clifton Beach (Sect. 2.3). The treatments were then set up as follows: 12 bottles were filled only with 10 g of sand, 12 were filled with 10 g of sand and 0.006515 (±0.00007) g of steel slag, 12 were filled with 9 g of sand and 1 (±0.002) g of olivine, 8 were filled with 10 g of sand at “un-equilibrated” NaOH addition, and 16 were filled with 10 g of sand at “equilibrated” NaOH addition (Fig. 2).
For each treatment, a gradient of seawater CO2 concentrations was established from bottle 1 (lowest CO2) to bottle 8–16 (highest CO2). This was achieved with the following approach: a batch of seawater (salinity = 35±0.2, alkalinity = 2266.8 µmol kg−1) was collected in November 2022 in the Derwent Estuary near Taroona. About 0.3 L of the batch was bubbled with pure CO2 gas for about 5 min to generate highly CO2-enriched seawater. Another ∼7 L of the batch was used as source water to fill the incubation bottles. pH and temperature were measured in this batch prior to filling the incubation bottles. The low-CO2 incubation bottles (bottle 1 in the sequence from e.g. 1 to 12; Fig. 2) were then filled first. Afterwards, about 20 mL of the CO2-enriched seawater was added to the ∼7 L batch. The batch was shaken thoroughly to mix the seawater with the CO2-enriched seawater, and the pH and temperature were measured again. Once a stable pH and temperature reading was achieved, bottle 2 was filled. This procedure was repeated until all bottles in a treatment were filled and a CO2 (and DIC) gradient was established across the incubation bottles. For the equilibrated and un-equilibrated NaOH treatments, I followed the same procedure, but separate 0.3 and 7 L batches were used for the CO2 enrichment that had previously been amended with NaOH to elevate the alkalinity from 2266.8 to 2757.4 µmol kg−1 prior to filling the incubation bottles. All 60 bottles were filled with 120 ±4 g of seawater and immediately mounted on the plankton wheel (17:00 AET on 2 December 2022) under the same conditions as those used in Experiment 1 (i.e. 15 ∘C, two rounds per minute; Fig. S1).
After ∼6.8 d (9 December), bottles were removed from the plankton wheel between 09:00 and 16:00 AET. pH and alkalinity were sampled as described in Sect. 2.2.1.
2.2.3 Experiment 3: pH dependency of alkalinity formation from slag and olivine
Experiment 3 was designed to investigate whether a lower seawater pH would promote alkalinity formation from steel slag and olivine.
The experiment required 12 new HDPE bottles (125 mL) cleaned with double-deionized water and dried thereafter. A total of 6 of the 12 bottles were filled with 0.00644 (±0.00007) g of steel slag, whereas the other 6 were filled with 1.0003 (±0.002) g of olivine. Three slag and three olivine bottles were filled with seawater from the same seawater source as that used in Experiment 2 (salinity = 35 ± 0.2, alkalinity = 2263.2 µmol kg−1, pH (total scale) = 7.82). pH and temperature were measured prior to filling the bottles with seawater (Sect. 2.4). Afterwards, the ∼2 L seawater batch was amended with about 80 mL of CO2-enriched seawater, as explained in Sect. 2.2.2. This enrichment lowered the pHT (total scale) from 7.82 to 6.85. This low-pHT (high-CO2) seawater was used to fill the other three slag and olivine incubation bottles. The 12 bottles with 122.8 (±0.15) g of seawater were immediately mounted on the plankton wheel (Fig. S1) after filling (16:40 AET on 16 December 2022) under the same conditions as those used in experiments 1 and 2 (i.e. 15 ∘C, two rounds per minute).
After ∼6.8 d (23 December), the 12 bottles were randomly removed from the plankton wheel between 09:00 and 11:00 AET. pH and alkalinity were sampled as described in Sect. 2.2.1.
2.3 Preparation and characterization of alkaline materials and beach sand
In total, five sand samples (0.5–1 kg) were collected for experiments 1 and 2 at Clifton Beach, Tasmania (Fig. 1, Table S2). Sampling permission was granted by the Department of Natural Resources and Environment (authority no. ES 22314). Wet sand was sampled on the upper end of the swash zone and stored in ziplock bags at 15 ∘C. Samples 1–4 were used for Experiment 1 (∼24 h after sampling), while sample 5 was used for Experiment 2 (∼72 h after sampling).
Olivine rocks were sourced from the Mount Shadwell Quarry in Mortlake (Australia; Table S2). Basic oxygen slag (hereafter just called slag) was sourced from the Liberty Primary Steel – Whyalla Steelworks (Australia; Table S2). Olivine rocks and slag (Fig. S2) were crushed with a hydraulic crusher into smaller pieces of about 10 mm and then milled with a ring mill in a chrome milling pot to yield particle size distributions (as shown in Fig. S3).
The wet and dry weights of the sand used for laboratory experiments were determined via the weight difference between a wet and a dry sample. The wet sample (∼80 g) was put into a clean plastic jar and dried for 24–72 h at 60 ∘C. The particle size spectra of the five dried sand samples as well as the slag and olivine mineral were determined with a Sympatec QICPIC particle imager.
For total particulate carbon (TPC) and particulate organic carbon (POC) analyses, dried sand samples were milled for 12 min in a Retsch MM200 ball mill. Between 4 and 10 mg of each of the pulverized sand samples was weighed into 10 tin cups for TPC or 10 silver cups for POC (two TPC and POC replicates for each sample). The POC samples were moisturized with 50 µL of Milli-Q water, placed for 18 h in a dessicator that contained 36 % HCl to remove all carbonates, and then dried. TPC and POC samples were analysed for carbon content using a Thermo Finnigan FlashEA 1112 Series elemental analyser. The particulate inorganic carbon (PIC) content of the samples was then calculated as the difference between the TPC and POC. The carbonate content (as a %) was estimated by multiplying the PIC content (as a %) by the molecular weight of CaCO3 (100 g mol−1) and MgCO3 (84.3 g mol−1) for the respective upper and lower estimates.
2.4 Carbonate chemistry, salinity, and Si(OH)4 measurements
The pH was determined potentiometrically using a Metrohm 914 pH/Conductometer following Standard Operation Procedure 6a described in Dickson et al. (2007) but omitting the test for ideal Nernst response of the electrode (ideal Nernst response was assumed). A new pH electrode (Metrohm Aquatrode Plus) was calibrated on the total pH scale (pHT) with Certified Reference Material (CRM) Tris buffer (batch no. 37), provided by Andrew Dickson's laboratory, Scripps Institution of Oceanography. The calibration procedure for the relevant temperature range (∼8–18 ∘C) followed the exact workflow described by Ferderer et al. (2022). The precision of the pH measurement was assumed to be ±0.015 based on experience with the probe.
Alkalinity was determined with an open-cell titration following Dickson et al. (2003). Samples were measured in duplicate (each ∼60 g) with a Metrohm 811 titration unit equipped with a Metrohm Aquatrode Plus. Alkalinity was calculated from titration curves using the Calkulate function of PyCO2SYS (Humphreys et al., 2020). The difference in alkalinity between duplicate titrations of the sample was on average 1.95 µmol kg−1, and >75 % of duplicates were within 4 µmol kg−1 (N=185), which was assumed to be the precision of the measurement (±2 µmol kg−1). Accuracy was controlled by correcting alkalinity values with CRM provided by Andrew Dickson's laboratory. Alkalinity was measured within 20 d of sampling.
Salinity was measured with a Metrohm conductivity probe with a PT1000 temperature sensor connected to a 914 pH/Conductometer. The probe was calibrated with DIC and alkalinity CRM from Andrew Dickson's laboratory for which a salinity of 33.464 has been reported (CRM batch no. 200). Conductivity was measured (in mS cm−2), and salinity was subsequently calculated on the practical salinity scale following Lewis and Perkin (1978) and using the workflow described by Moras et al. (2022). A relatively low precision of ±0.2 was determined from repeat measurements, although precision was likely lower under field conditions where there was no temperature control.
Si concentrations for beach transects were measured 18 h after sampling following Hansen and Koroleff (1999). No Si measurements were conducted for experiments 1–3.
2.5 Carbonate chemistry calculations
Carbonate chemistry conditions were calculated with the “carb” function in seacarb (Gattuso et al., 2021), with pHT, alkalinity, salinity, temperature, phosphate, and Si(OH)4 concentrations as input variables; stoichiometric equilibrium constants from Lueker et al. (2000); and default settings for the other equilibrium constants. Si was not measured due to volume limitations, so I assumed a value of 50 µmol kg−1 at the end of the experiments when sand, olivine, or slag was incubated. Likewise, phosphate was not measured, so I assumed 2 µmol kg−1 at the end of the experiments when slag was incubated. These Si and phosphate releases were based upon previous trials. Note, however, that concentrations of Si and phosphate within these ranges have a negligible impact on calculated carbonate chemistry parameters (e.g. pCO2 changes by ∼1 µatm when Si is assumed to be 0 instead of 50 µmol kg−1).
Propagated errors in derived carbonate chemistry parameters (e.g. DIC) were calculated with the “errors” function in seacarb using the measurement precisions described in Sect. 2.4 for pHT (±0.015), alkalinity (±2 µmol kg−1), and salinity (±0.2); default uncertainties for equilibrium constants and temperature; and, when applicable (see above), ±50 µmol kg−1 for Si(OH)4 and ±2 µmol kg−1 for phosphate.
2.6 Calculations of the CO2 uptake ratio ( for carbonate and non-carbonate alkalinity sources
The atmospheric CO2 uptake ratio for OAE ( was defined as the number of moles of DIC (ΔDIC) absorbed per number of moles of alkalinity added (ΔAlkalinity) (Tyka et al., 2022).
was shown to range roughly between 0.75 and 0.9 mol:mol in the surface ocean (Schulz et al., 2023; Tyka et al., 2022). However, this range only applies to alkalinity source materials that exclusively increase alkalinity without a concomitant increase in DIC when they are added to seawater (Alknon-carbonate). Such sources comprise, for example, NaOH, slag, and olivine. The estimated range does not apply when all or fractions of the added alkalinity come from carbonates (Alkcarbonate), as CaCO3 contributes 2 mol of alkalinity and 1 mol of (non-atmospheric) DIC when it dissolves. In the following three paragraphs, I describe how was calculated when considering varying contributions of Alknon-carbonate and Alkcarbonate for a hypothetical or observed increase in ΔAlkalinity. Please note that the sum of Alkcarbonate and Alknon-carbonate always equals ΔAlkalinity. Please also note that was calculated in different ways for a hypothetical case and Experiment 1 (i.e. still has the same theoretical meaning as defined in Eq. 5 but was estimated in different ways).
The dependency of on the relative contribution of Alkcarbonate and Alknon-carbonate was calculated as follows:
where DICinitial and Alkinitial are the respective DIC and alkalinity in seawater before alkalinity was increased, assuming a seawater pCO2 in equilibration with the atmosphere, and DICequilibrated is the amount of DIC from the environment (e.g. from the atmosphere) that can be stored in seawater after the increase in Alkcarbonate and Alknon-carbonate, assuming seawater pCO2 in equilibrium with the atmosphere. was first calculated for a hypothetical case in which Alkinitial was 2350 µmol kg−1 and DICinitial was calculated for the surface ocean (15 ∘C, salinity = 35, carbonate chemistry constants as in Sect. 2.5), assuming a pCO2 of 420 µatm. Alkcarbonate and Alknon-carbonate were then varied in a range of scenarios (from 0 to 100% Alkcarbonate) to increase their sum by 1 µmol kg−1. was calculated for each scenario.
Next, ηCO2 was calculated specifically for Experiment 1 as follows: ΔAlkalinity was higher in the NaOH and slag treatments when no sand was present compared with incubations with sand (Sect. 3.2). ΔAlkalinity was very likely Alknon-carbonate in all incubations, while the reduced ΔAlkalinity in the incubations with sand was likely due to secondary precipitation of carbonates (Sect. 4.2.1). Based on these conclusions, was estimated for Experiment 1 as follows:
where ΔAlkalinityno-sand and ΔAlkalinitysand are the changes in alkalinity measured in incubations without sand and with sand, respectively; 0.5 is the when Alknon-carbonate is lost via the precipitation of carbonates where 2 mol of alkalinity and 1 mol of DIC are sequestered; and 0.86 is the when all ΔAlkalinity is Alknon-carbonate under the conditions set up in the experiments (i.e. 15 ∘C, salinity = 35; see above). Please note that ΔAlkalinity was higher in the olivine incubations when sand was present, which is the inverse of the NaOH and slag incubations for the reasons discussed in Sect. 4.2.1. Therefore, was calculated assuming that all ΔAlkalinity was Alknon-carbonate for the olivine incubations (i.e. ). For the incubations without an added alkalinity source, all ΔAlkalinity was assumed to be Alkcarbonate so that was 0.36. This assumption is justified with a 2 mol : 1 mol ΔAlkalinity : ΔDIC release ratio as observed in Experiment 2 (see next paragraph).
was also specifically calculated for Experiment 2. This required knowledge of how much of the measured ΔAlkalinity was contributed by Alkcarbonate and Alknon-carbonate. In the treatments where only sand was incubated, alkalinity and DIC increased roughly in a 2:1 molar ratio over the course of the experiment (i.e. ΔAlkalinity : ΔDIC = 2 mol: 1 mol). Thus, it can be assumed that most of the measured alkalinity increase is Alkcarbonate. In contrast, when sand was incubated with alkaline materials, alkalinity and DIC generally increased with a molar ratio that was because alkaline materials release alkalinity without a concomitant increase in DIC. Based on these constraints, we can roughly approximate the contribution of Alkcarbonate and Alknon-carbonate to the measured alkalinity increase (ΔAlkalinity) as follows:
where % Alkcarbonate is the percentage contribution of Alkcarbonate to ΔAlkalinity. Based on Eq. (8), a ΔAlkalinity : ΔDIC of, for example, 8 mol: 1 mol would suggest that 25 % of the ΔAlkalinity is Alkcarbonate and the other 75% is Alknon-carbonate. Alkcarbonate and Alknon-carbonate were calculated with Eq. (8) for all incubations in Experiment 2, and this information was then used to calculate with Eq. (6). Finally, for Experiment 2, the amount of DIC that can be stored in seawater due to an increase in Alkcarbonate and Alknon-carbonate (DICOAE) was calculated as follows:
2.7 Statistical analysis
Experiment 1 and 3 were analysed with a two-way analysis of variance (ANOVA) in which either “sand” and “alkalinity source material” (Experiment 1) or “carbonate chemistry” and “alkalinity source material” (Experiment 3) were defined as independent variables. The dependent variables were the changes in carbonate chemistry (e.g. ΔAlkalinity) over the course of the incubations. Homogeneity of variance was assessed by visually inspecting if plotted model residuals vs. fitted values were scattering similarly around zero. Normality of the residuals was assessed by inspecting quantile–quantile plots: theoretical quantiles plotted against standardized residuals should ideally resemble a straight line in these plots. Such a straight-line appearance (i.e. ideal normality) was not always given, so some datasets were rank-transformed. However, transformation did not substantially improve normality, so non-transformed data were used for all analyses. Statistical differences between individual treatments were assessed with a Tukey post hoc test. Significant differences were assumed when p<0.05.
Experiment 2 was analysed by plotting ΔAlkalinity for each alkalinity source material and sand against the increase in DIC that was established via additions of CO2-saturated seawater (Sect. 2.2.2). The data were fitted with the polynomial equation , where x is the amount of DIC added to each treatment and a, b, and c are fit parameters. To estimate the additionality of ΔAlkalinity and DICOAE, the curve fitted to the sand-only data was compared to the curves fitted to the treatments.
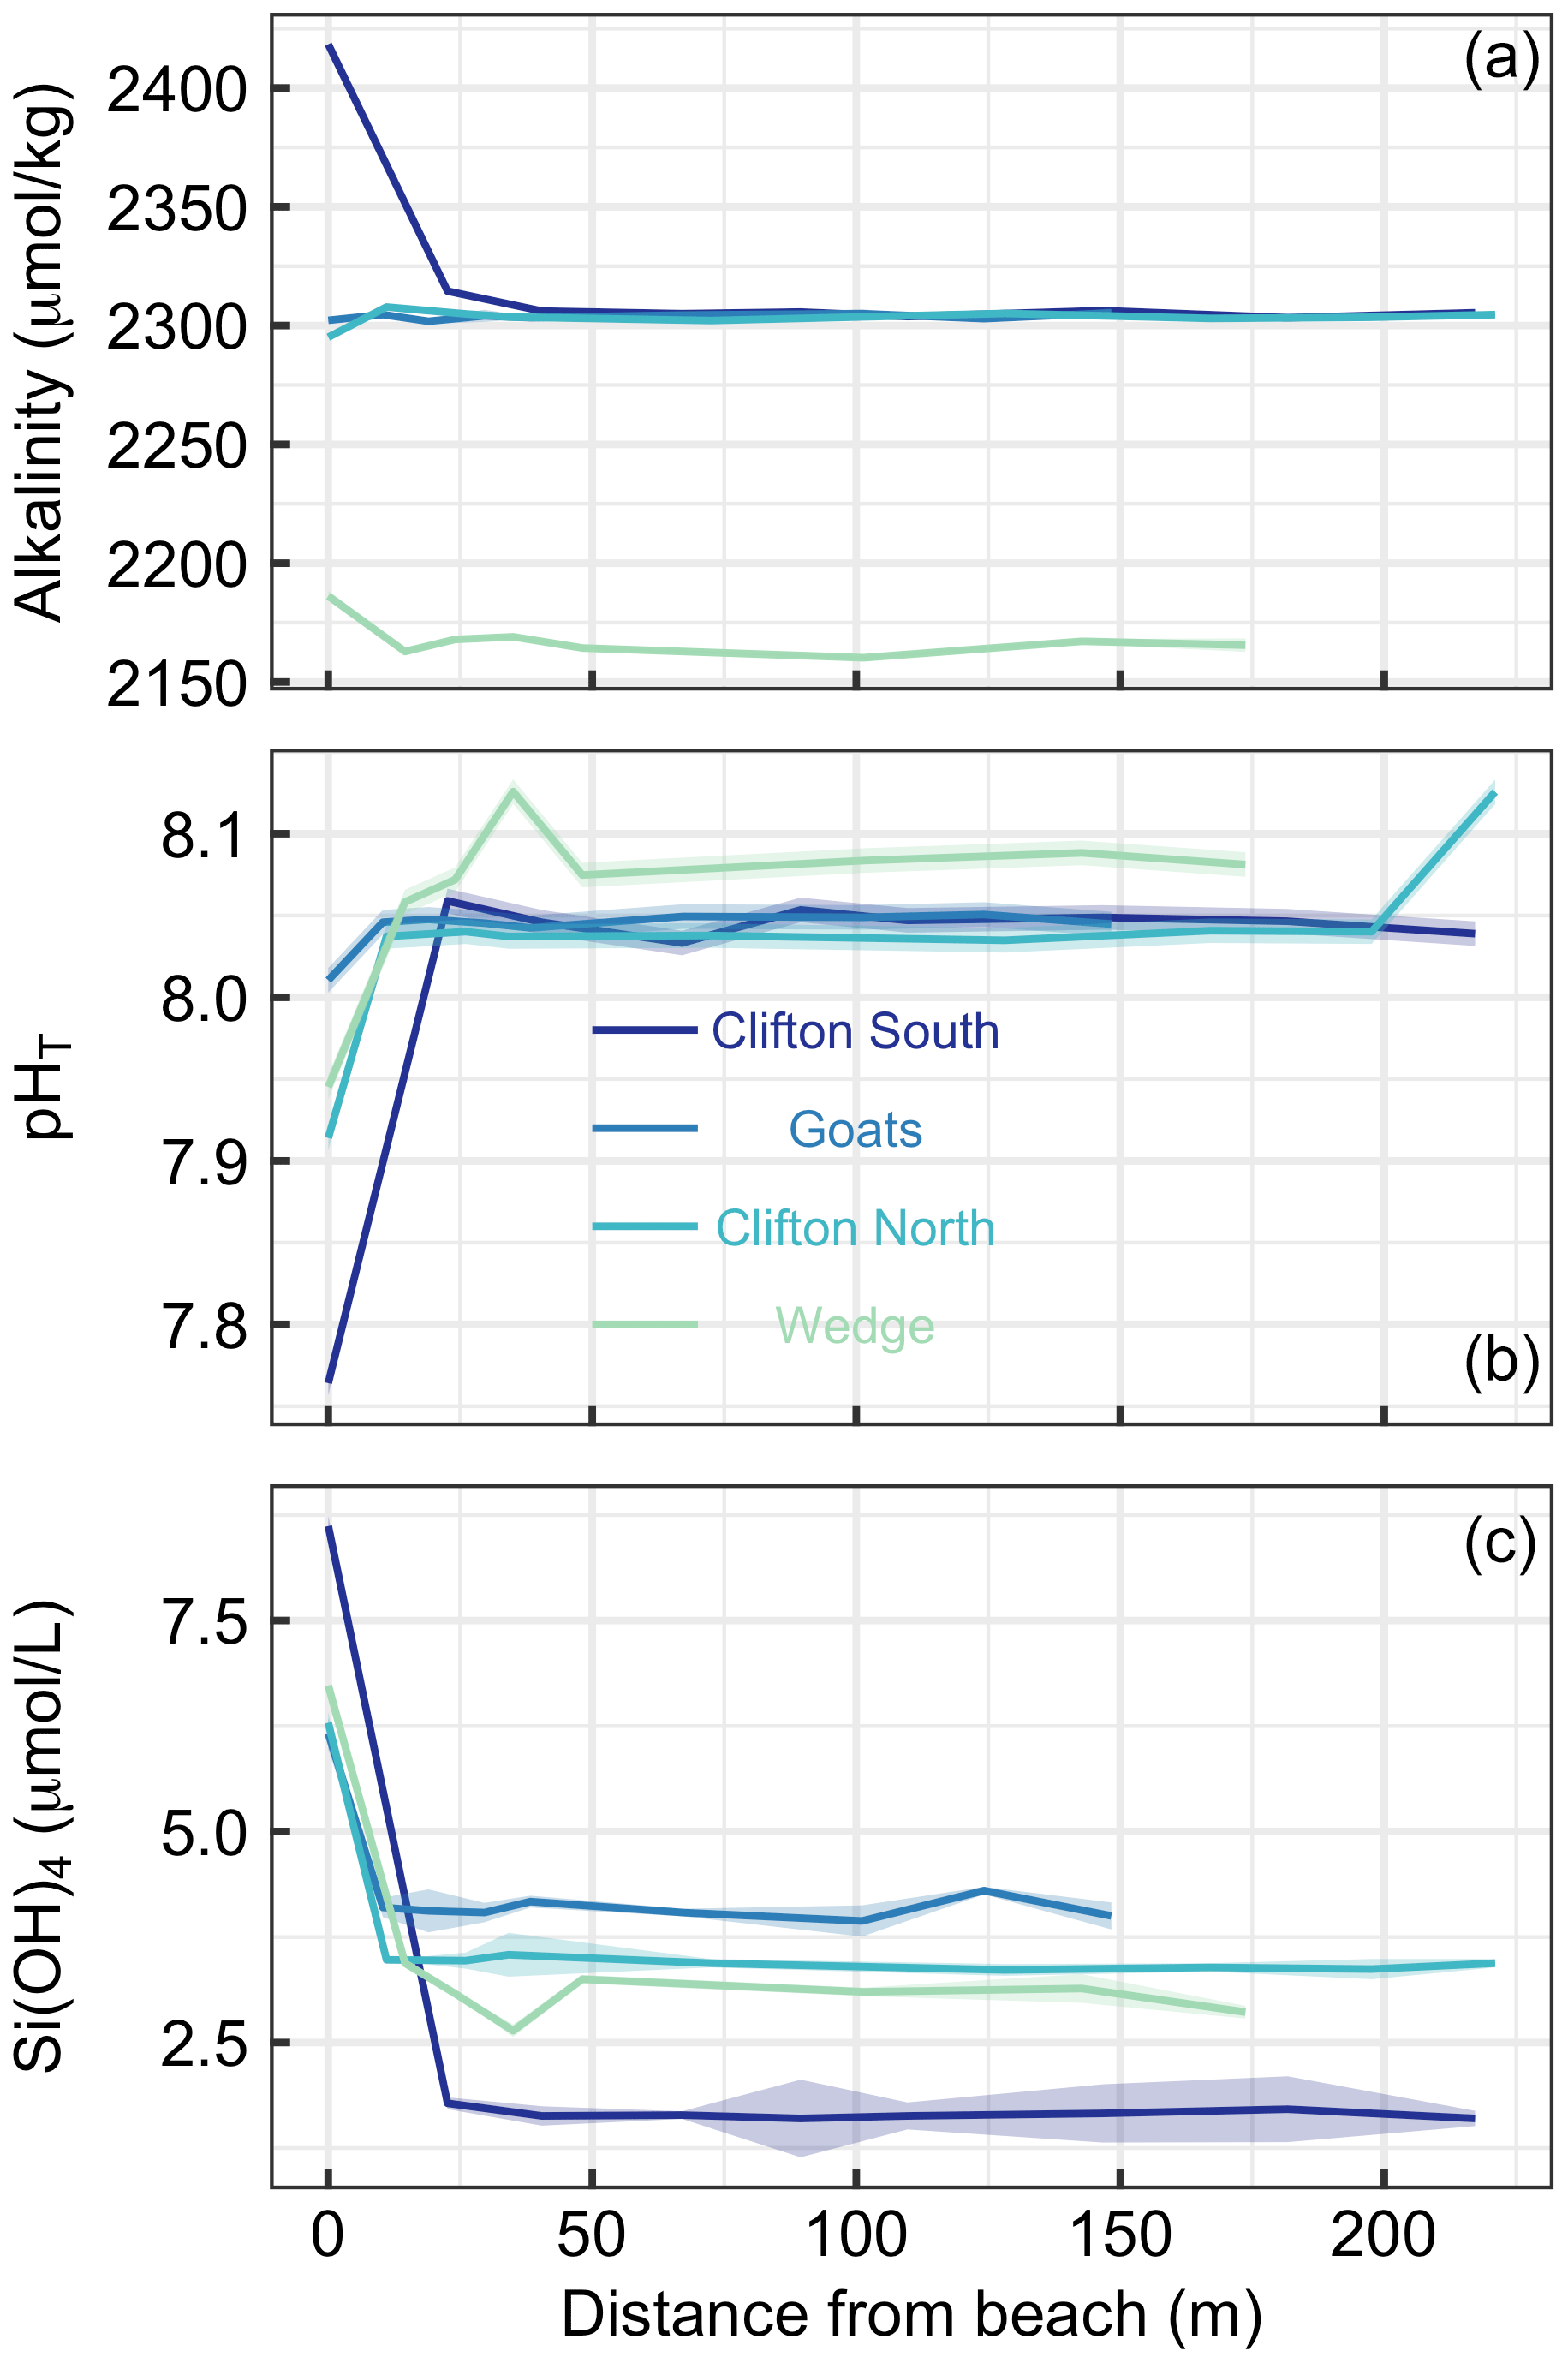
Figure 3Transects of (a) alkalinity, (b) pHT, and (c) SiOH4 at four different beach locations in southern Tasmania (see Table S1 and Fig. 1 for locations). The first sampling site was at the upper end of the swash zone; 7–8 more samples were then taken until 150–200 m offshore. Lines and shaded areas show the averages and uncertainties, respectively.
3.1 Beach transects
Beach transects consisted of eight to nine sampling points from just above the swash zone to 150–220 m offshore at four locations (Table S1, Fig. 1). Alkalinity showed distinct patterns across the locations. At Clifton South and Wedge, alkalinity was higher in the swash zone than in the open water. This was particularly pronounced at Clifton South with a value of 2418 µmol kg−1 relative to open-water values of about 2300 µmol kg−1 (Fig. 3a). At Goats Beach, no such alkalinity gradient was observed across the transect, while alkalinity was lower in the swash zone at Clifton North (Fig. 3a). Wedge differed from the other locations in that alkalinity was generally lower (∼2160 compared with ∼2300 µmol kg−1 in open water).
pHT was lowest in samples just above the swash zone at all four locations (Fig. 3b). The difference relative to open water was most pronounced at Clifton South, with a pHT of 7.76 just above the swash zone compared with approximately 8.05 in the open water, while it was least pronounced at Goats. Gradients at Clifton North and Wedge were in between these two extremes. pHT at Wedge was on average higher in the open water than at the other locations, i.e. 8.08 compared with 8.05 (Fig. 3b).
Si(OH)4 concentrations were highest in samples from just above the swash zone at all four locations (Fig. 3c). The most pronounced gradient was observed at Clifton South, with a Si(OH)4 of 8.6 µmol L−1 just above the swash zone and ∼1.6 µmol L−1 in open water. The least pronounced gradient was observed at Goats, and intermediate gradients were found at Clifton North and Wedge (Fig. 3c).
Overall, the data show consistency across the three parameters measured in that Clifton South showed most pronounced trends, Goats displayed the least pronounced trends, and Clifton North and Wedge were in between (Fig. 3).
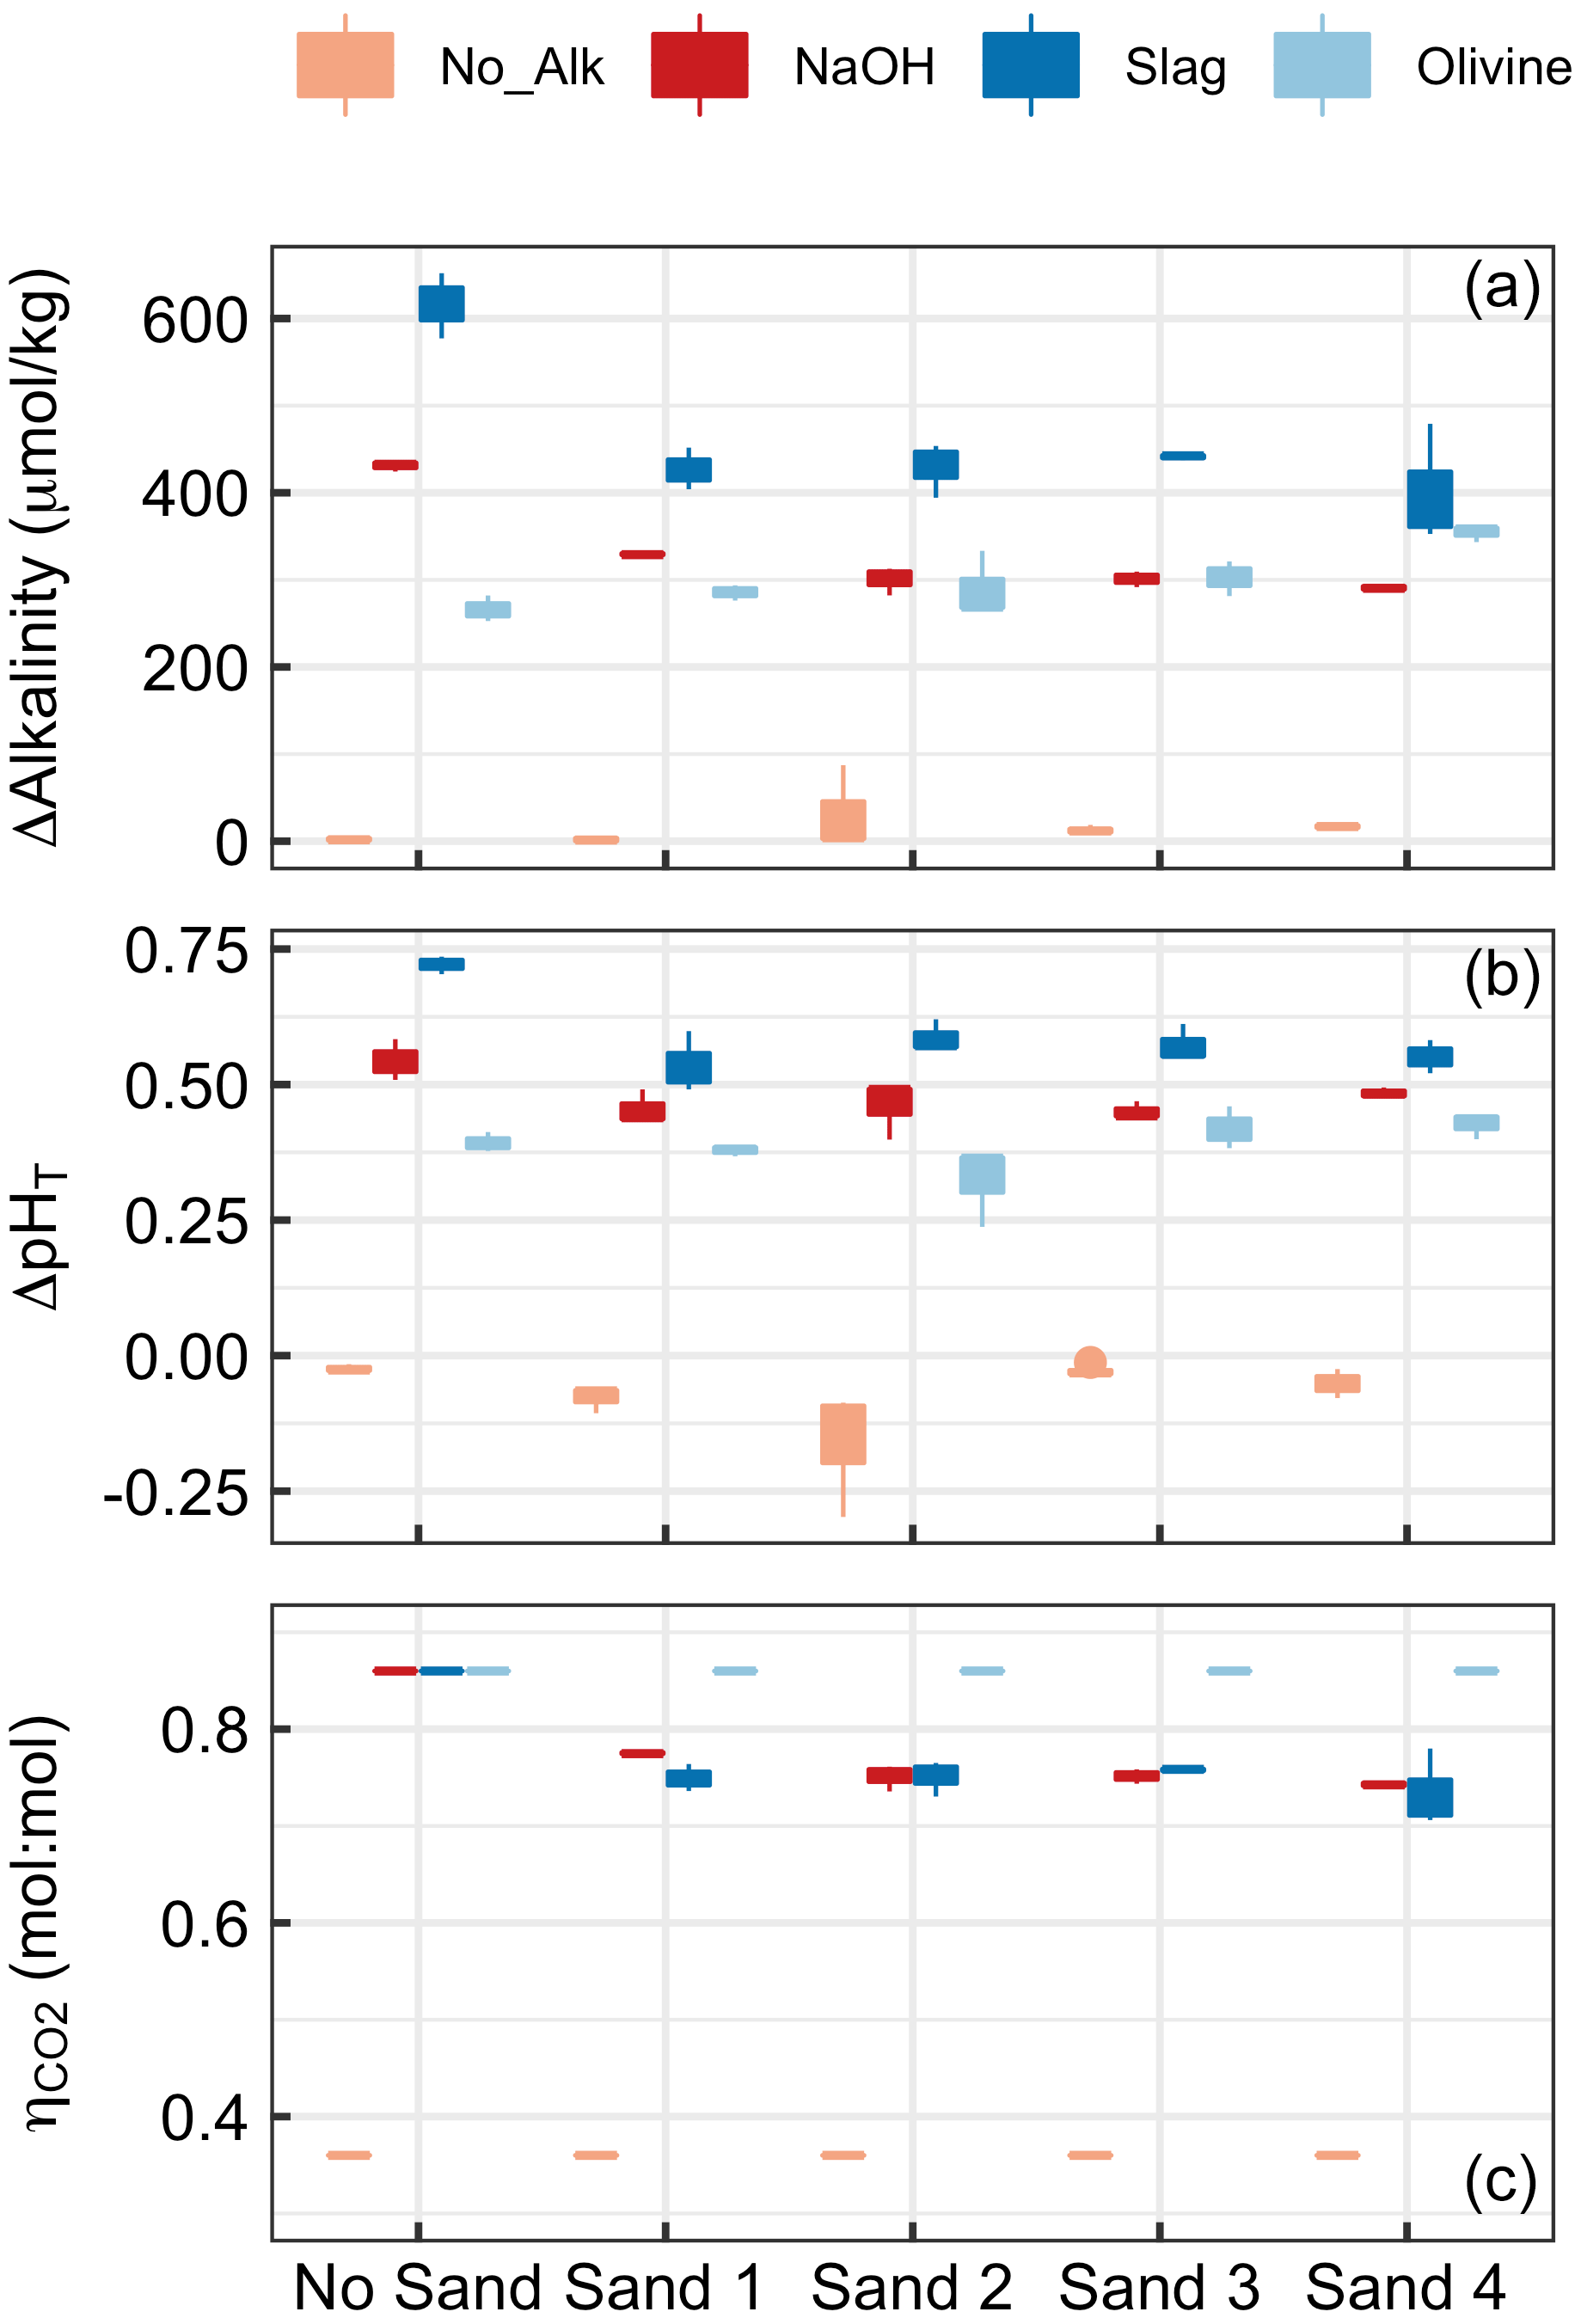
Figure 4Results of Experiment 1. Changes in (a) alkalinity and (b) pHT from the beginning to the end of the 6.8 d experiment. Panel (c) shows at the end of the experiment. Box plots are based on three replicates per treatment. Colours refer to the added alkalinity source (No_Alk means no alkalinity source was added). The alignment on the x axis indicates if a (or which) sand sample was present in the incubation bottles (“No Sand” means that no Sand was added).
3.2 Experiment 1
Alkalinity increased over the course of the 6.8 d in all treatments in which alkaline materials were added (Fig. 4). Changes in alkalinity (ΔAlkalinity) were between ∼610 and 400 µmol kg−1 for the slag, between ∼420 and 290 µmol kg−1 for the NaOH, and between 280 and 370 µmol kg−1 for the olivine treatment. In contrast, ΔAlkalinity changed very little (i.e. ΔAkalinity ≤6 µmol kg−1) when no alkaline materials were added. (Please note that an important outlier was observed in Sand 2 – ΔAlkalinity was 87.3 µmol kg−1 – which will be discussed in Sect. 4.2.2.) The two-way ANOVA revealed significant effects of (1) the type of sand, (2) the type of alkalinity source, and (3) the interaction of these two on ΔAlkalinity (p<0.05). For the slag and the NaOH treatment, ΔAlkalinity was significantly higher when these were incubated without sand, but only small differences were observed across the four sand samples. In contrast, ΔAlkalinity was slightly lower in the olivine treatment when no sand was present during incubations, although the difference was only significant relative to olivine incubated in Sand 4 (Fig. 4a).
Changes in pHT (ΔpHT) reflected the patterns described for ΔAlkalinity (Fig. 4b). ΔpHT was highest in the slag and the NaOH treatment when no sand was added, whereas this difference between the presence and absence of sand was not observed for olivine. ΔpHT was slightly negative in treatments where no alkalinity source was added to the incubated sand samples. The two-way ANOVA revealed significant effects of sand, alkalinity source, and their interaction on ΔpHT (p<0.05).
was prescribed to be 0.36 when sand without an anthropogenic alkalinity source was incubated and 0.86 for olivine incubations (see Sect. 2.6). Calculated values for NaOH and slag treatments were slightly lower due to relatively lower ΔAlkalinity in the presence of sand compared with in the absence of sand (Fig. 4c). Statistics are not provided for data because the assumptions of the ANOVA model were heavily violated.
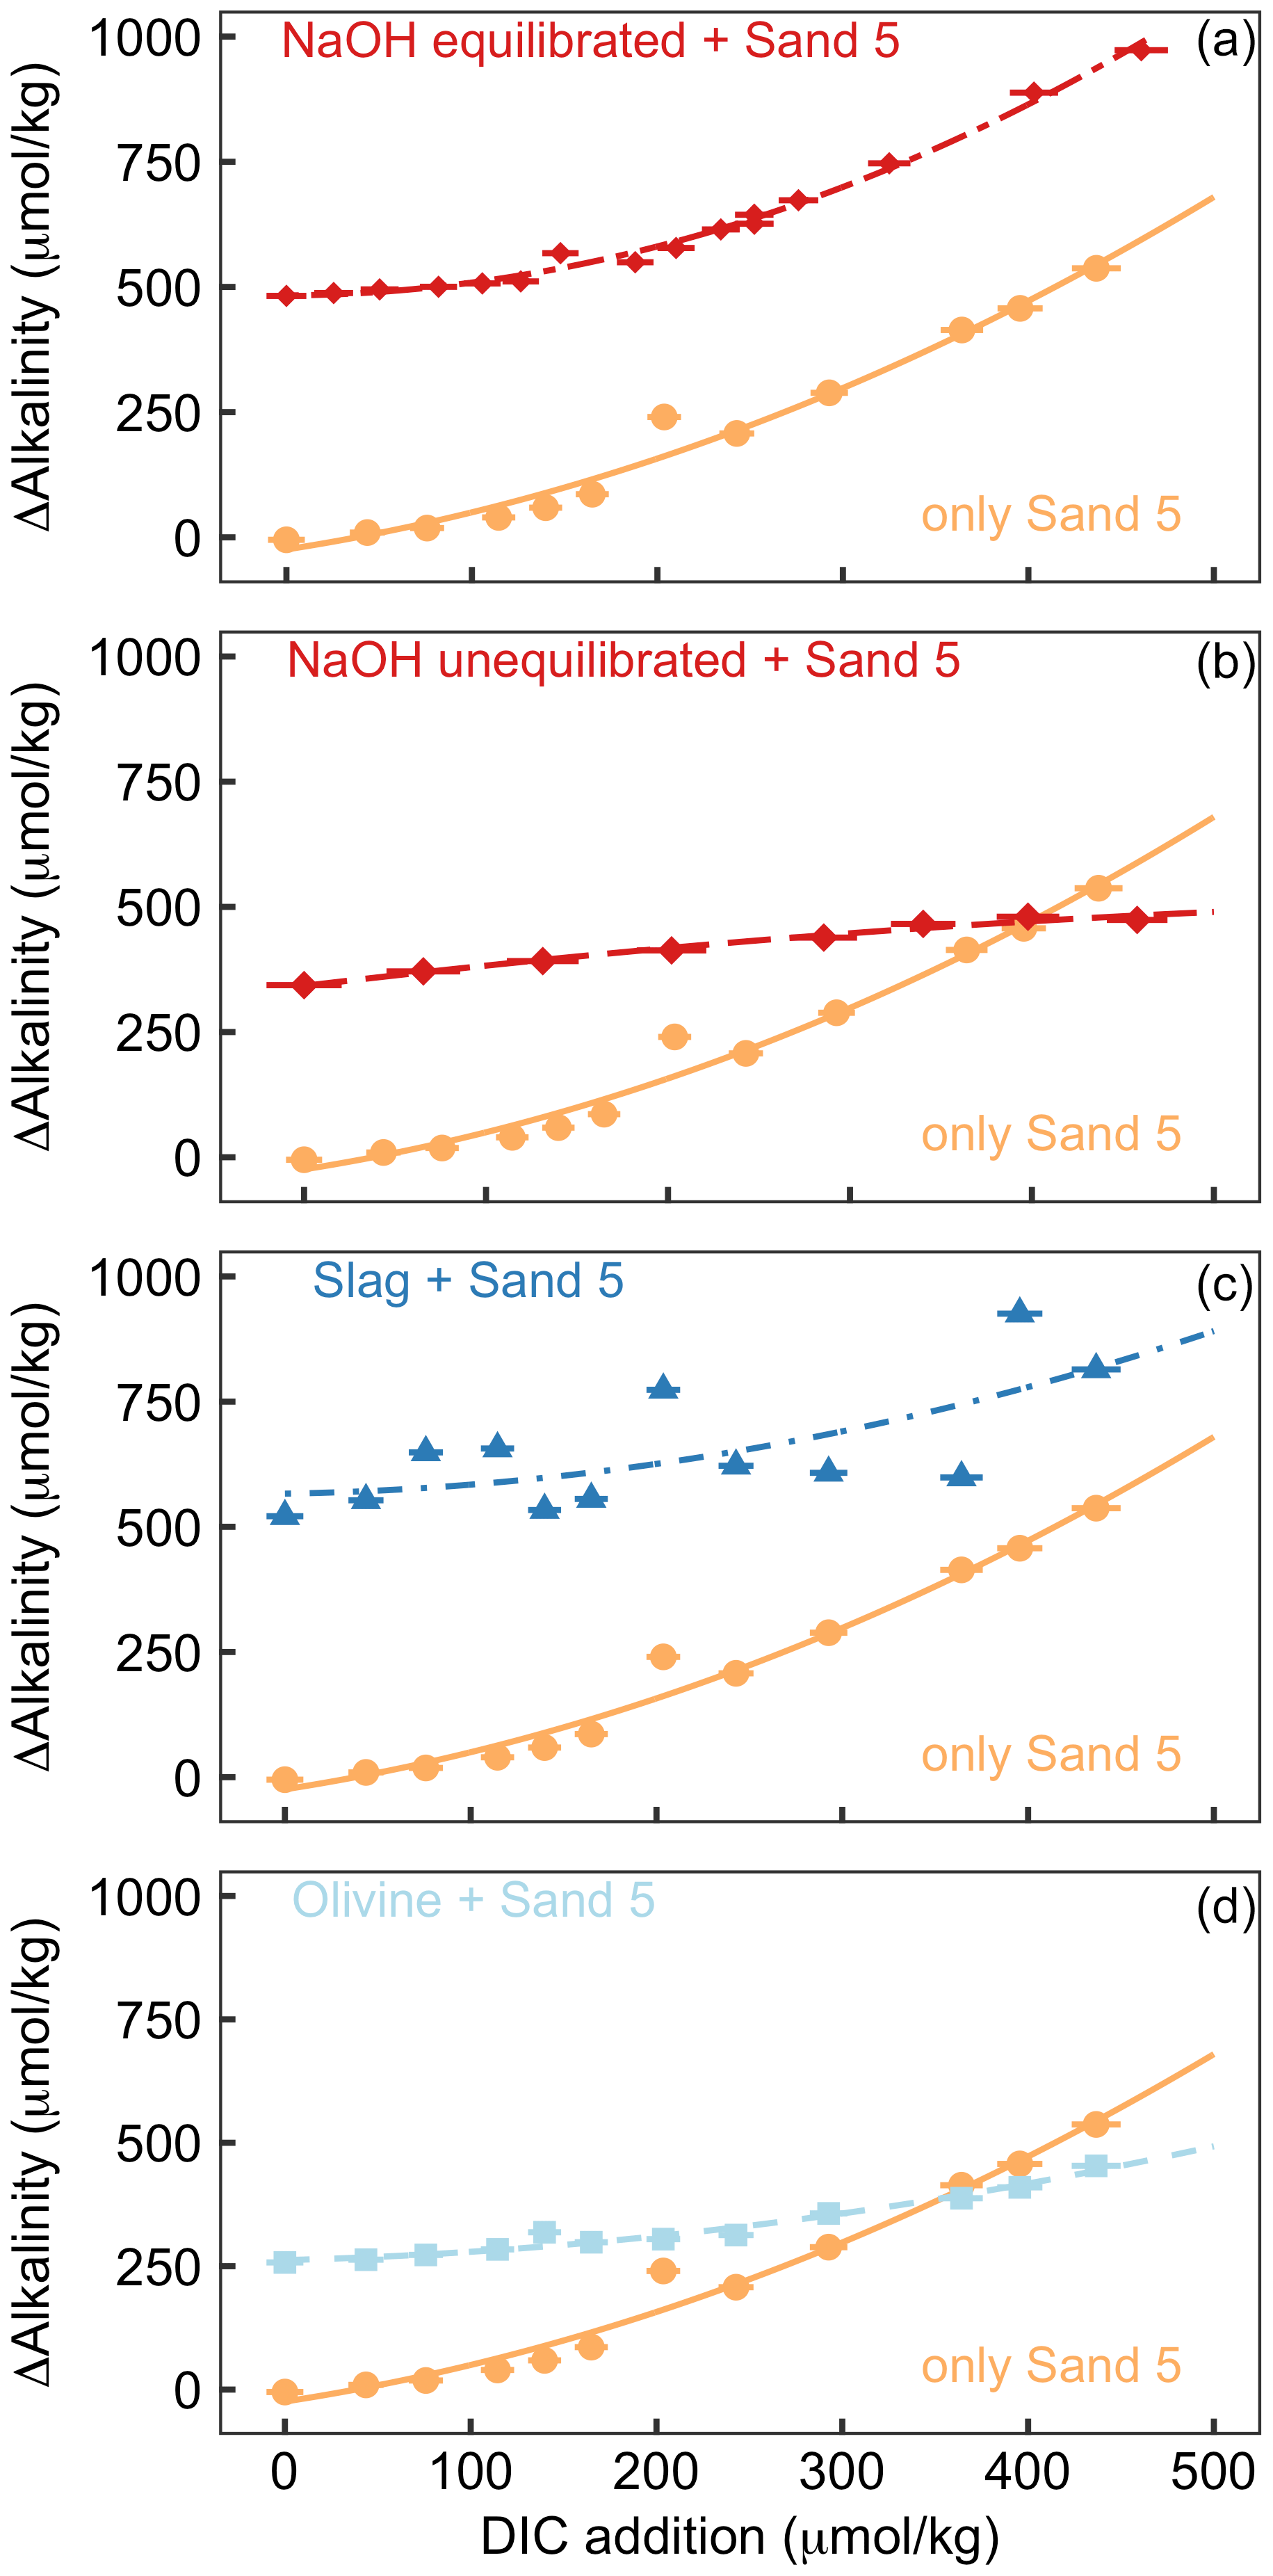
Figure 5Results of Experiment 2. All panels show the change in alkalinity from the beginning to the end of the 6.8 d experiment along a gradient of DIC added to the incubation bottles (DIC values shown here refer to the values calculated from alkalinity and pH at the start of the experiment). The orange data points displayed in all panels show ΔAlkalinity for incubations where only sand was incubated. The other data points in each panel show ΔAlkalinity when sand was incubated with an external alkalinity source or addition scenario. Corresponding ΩArg and pHT values for all scenarios are provided in Table S3. Panel (a) shows sand and NaOH equilibrated with atmospheric CO2 upon addition, panel (b) presents sand and NaOH that was not equilibrated with atmospheric CO2 upon addition, panel (c) shows sand and slag, and panel (d) presents sand and olivine.
3.3 Experiment 2
The addition of CO2-enriched seawater established a gradient of increasing DIC and, accordingly, a decline in pHT and ΩArg (Table S3). The rationale for this set-up was that beach sediments can contain high amounts of respiratory CO2; thus, anthropogenic alkalinity added to beaches has a high likelihood of being exposed to such high-CO2 conditions (Liu et al., 2021; Perkins et al., 2022; Reckhardt et al., 2015). Figure 5 shows ΔAlkalinity along the DIC gradient for different alkalinity source materials (NaOH, slag, and olivine) and compares this to ΔAlkalinity along the same DIC gradient where only sand from a beach was present. The “sand-only” data are identical in all four plots (orange lines in Fig. 5). This shows that ΔAlkalinity is close to zero in the sand-only incubations when no DIC is added but increases exponentially with increasing DIC additions up to 537 µmol kg−1.
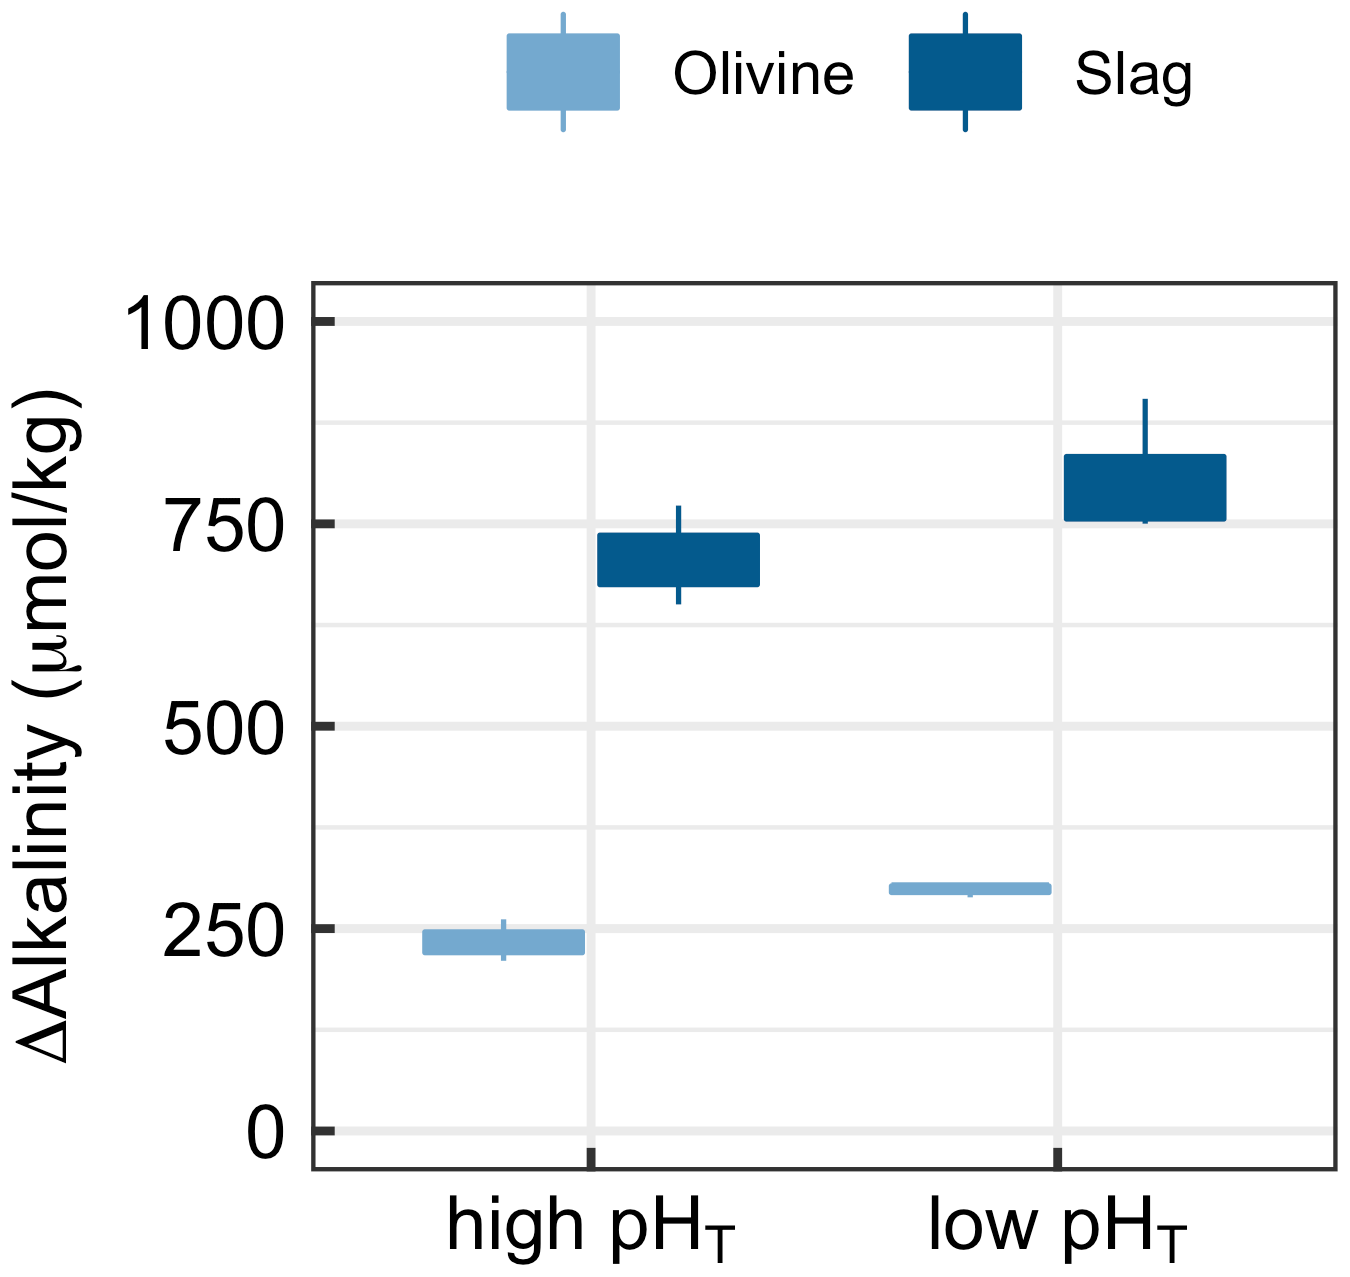
Figure 6Results of Experiment 3. Changes in alkalinity from the beginning to the end of the 6.8 d experiment when olivine or slag was incubated (without sand) under high (initially 7.82) or low pHT (initially 6.85). ΔAlkalinity was significantly higher under low pHT (p<0.05).
OAE via NaOH addition was set up in two different scenarios (Fig. 5a, b). In the first scenario, the carbonate system was equilibrated with atmospheric CO2 after the NaOH deployment and before exposure to the sand (Fig. 5a). Such a scenario could occur when NaOH is added to the ocean but subsequent air–sea CO2 influx fully equilibrates the NaOH-induced seawater CO2 deficit before any interactions with sediments occur. Likewise, equilibration of CO2-deficient seawater could be established within the electrochemical OAE facility and, thus, before the alkalinity-enhanced seawater is discharged back into the ocean. The equilibrated set-up leads to a gradient in ΩArg from 2.1 to 0.2 at the beginning of the 6.8 d incubations (highest ΩArg at the lowest DIC addition). In the second scenario, the carbonate system was not equilibrated, thereby assuming that a NaOH-enriched patch of seawater would be exposed to sand sediments before it had taken up atmospheric CO2 (Fig. 5b). Here, initial ΩArg ranges from 7.1 to 2.3 along the DIC gradient. In the equilibrated scenario, ΔAlkalinity was 482 µmol kg−1 when no DIC was added and increased exponentially to 973 µmol kg−1 at the highest DIC addition (Fig. 5a). In the un-equilibrated scenario, ΔAlkalinity was 344 µmol kg−1 when no DIC was added and increased to 474 µmol kg−1 at the highest DIC addition. However, in contrast to the equilibrated treatment, the ΔAlkalinity increase in the un-equilibrated treatment weakened along the DIC gradient, and ΔAlkalinity was lower than in the sand-only treatment when the DIC addition was >400 µmol kg−1 (Fig. 5b).
In the slag treatment, ΔAlkalinity was 521 µmol kg−1 when no DIC was added. ΔAlkalinity increased exponentially along the DIC gradient to 814 µmol kg−1. The increase in ΔAlkalinity was less pronounced than in the sand-only treatment. Overall, the slag data showed more scatter relative to the other alkalinity source materials and sand-only treatments (Fig. 5c).
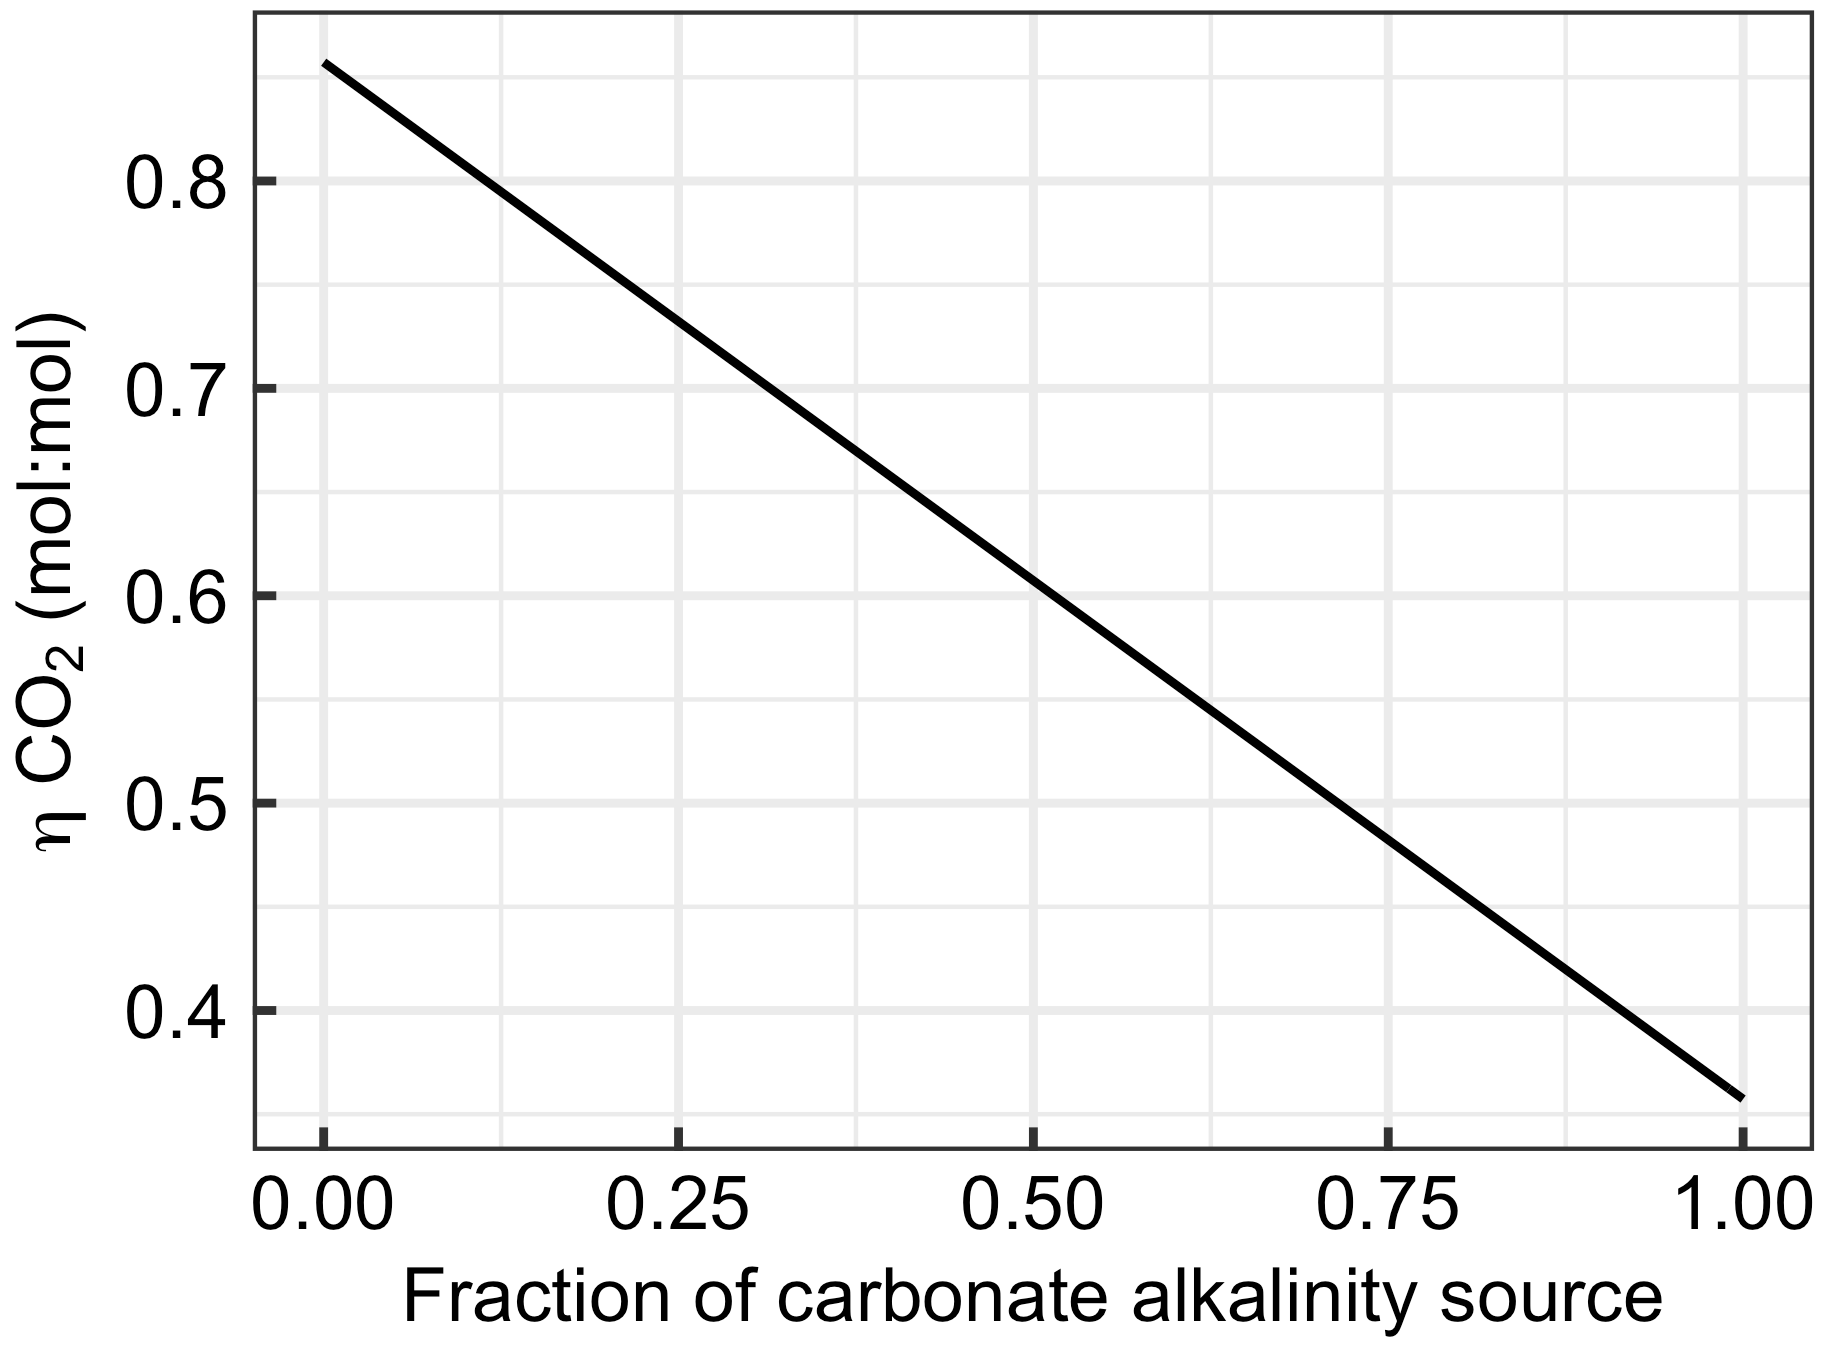
Figure 7Changes in with the fraction of alkalinity originating from carbonates (e.g. CaCO3 dissolution). The x axis ranges from zero (all ΔAlkalinity originates from non-carbonate sources such as NaOH, slag, or olivine) to one (all ΔAlkalinity originates from carbonate sources such as CaCO3 or MgCO3).
In the olivine treatment, ΔAlkalinity was 258 µmol kg−1 when no DIC was added. ΔAlkalinity increased exponentially with increasing DIC additions to 453 µmol kg−1, although this was much less pronounced than in the sand-only treatment. ΔAlkalinity was lower in the olivine than in the sand-only treatment when DIC additions were >350 µmol kg−1 (Fig. 5c).
3.4 Experiment 3
Experiment 3 tested if alkalinity release by olivine and slag is dependent on carbonate chemistry (Fig. 6). The two-way ANOVA revealed a significant influence of pHT on the release of alkalinity from olivine and slag (Fig. 6). (Please note that pHT was used to analyse the data, but other carbonate chemistry parameters could also have been the driver of the response.) Slag released 707±61 µmol kg−1 alkalinity when incubated within a pHT range from an initial value of 7.82 to 8.67 at the end of the 6.8 d incubation. Within the lower pHT range from 6.86 to 8.39, slag released 805±86 µmol kg−1. Olivine released 234±36 µmol kg−1 when incubated within a pHT range from an initial value of 7.82 to 8.20 at the end of the 6.8 d incubation. Within the lower low-pHT range from 6.86 to 7.63, olivine released 298±8 µmol kg−1 (Fig. 5).
4.1 Carbonate-derived alkalinity is less efficient for CDR than non-carbonate-derived alkalinity
Section 2.6 introduced equations which show that alkalinity originating from carbonates (Alkcarbonate) has a considerably lower capacity to absorb CO2 than alkalinity originating from non-carbonate sources such as olivine, slag, or NaOH (Alknon-carbonate). The large influence of this chemical constraint on OAE is exemplified in Fig. 7. Here, the uptake potential for atmospheric CO2 per mole of alkalinity added to the ocean ( is shown as a function of the carbonate contribution to the alkalinity source. When all ΔAlkalinity delivered via OAE originates from non-carbonate sources (e.g. NaOH, slag, and olivine), equals 0.86. declines linearly with an increasing contribution of Alkcarbonate to ΔAlkalinity to the lowest theoretical value for of 0.36, which is reached when OAE provides all alkalinity as Alkcarbonate (Fig. 7).
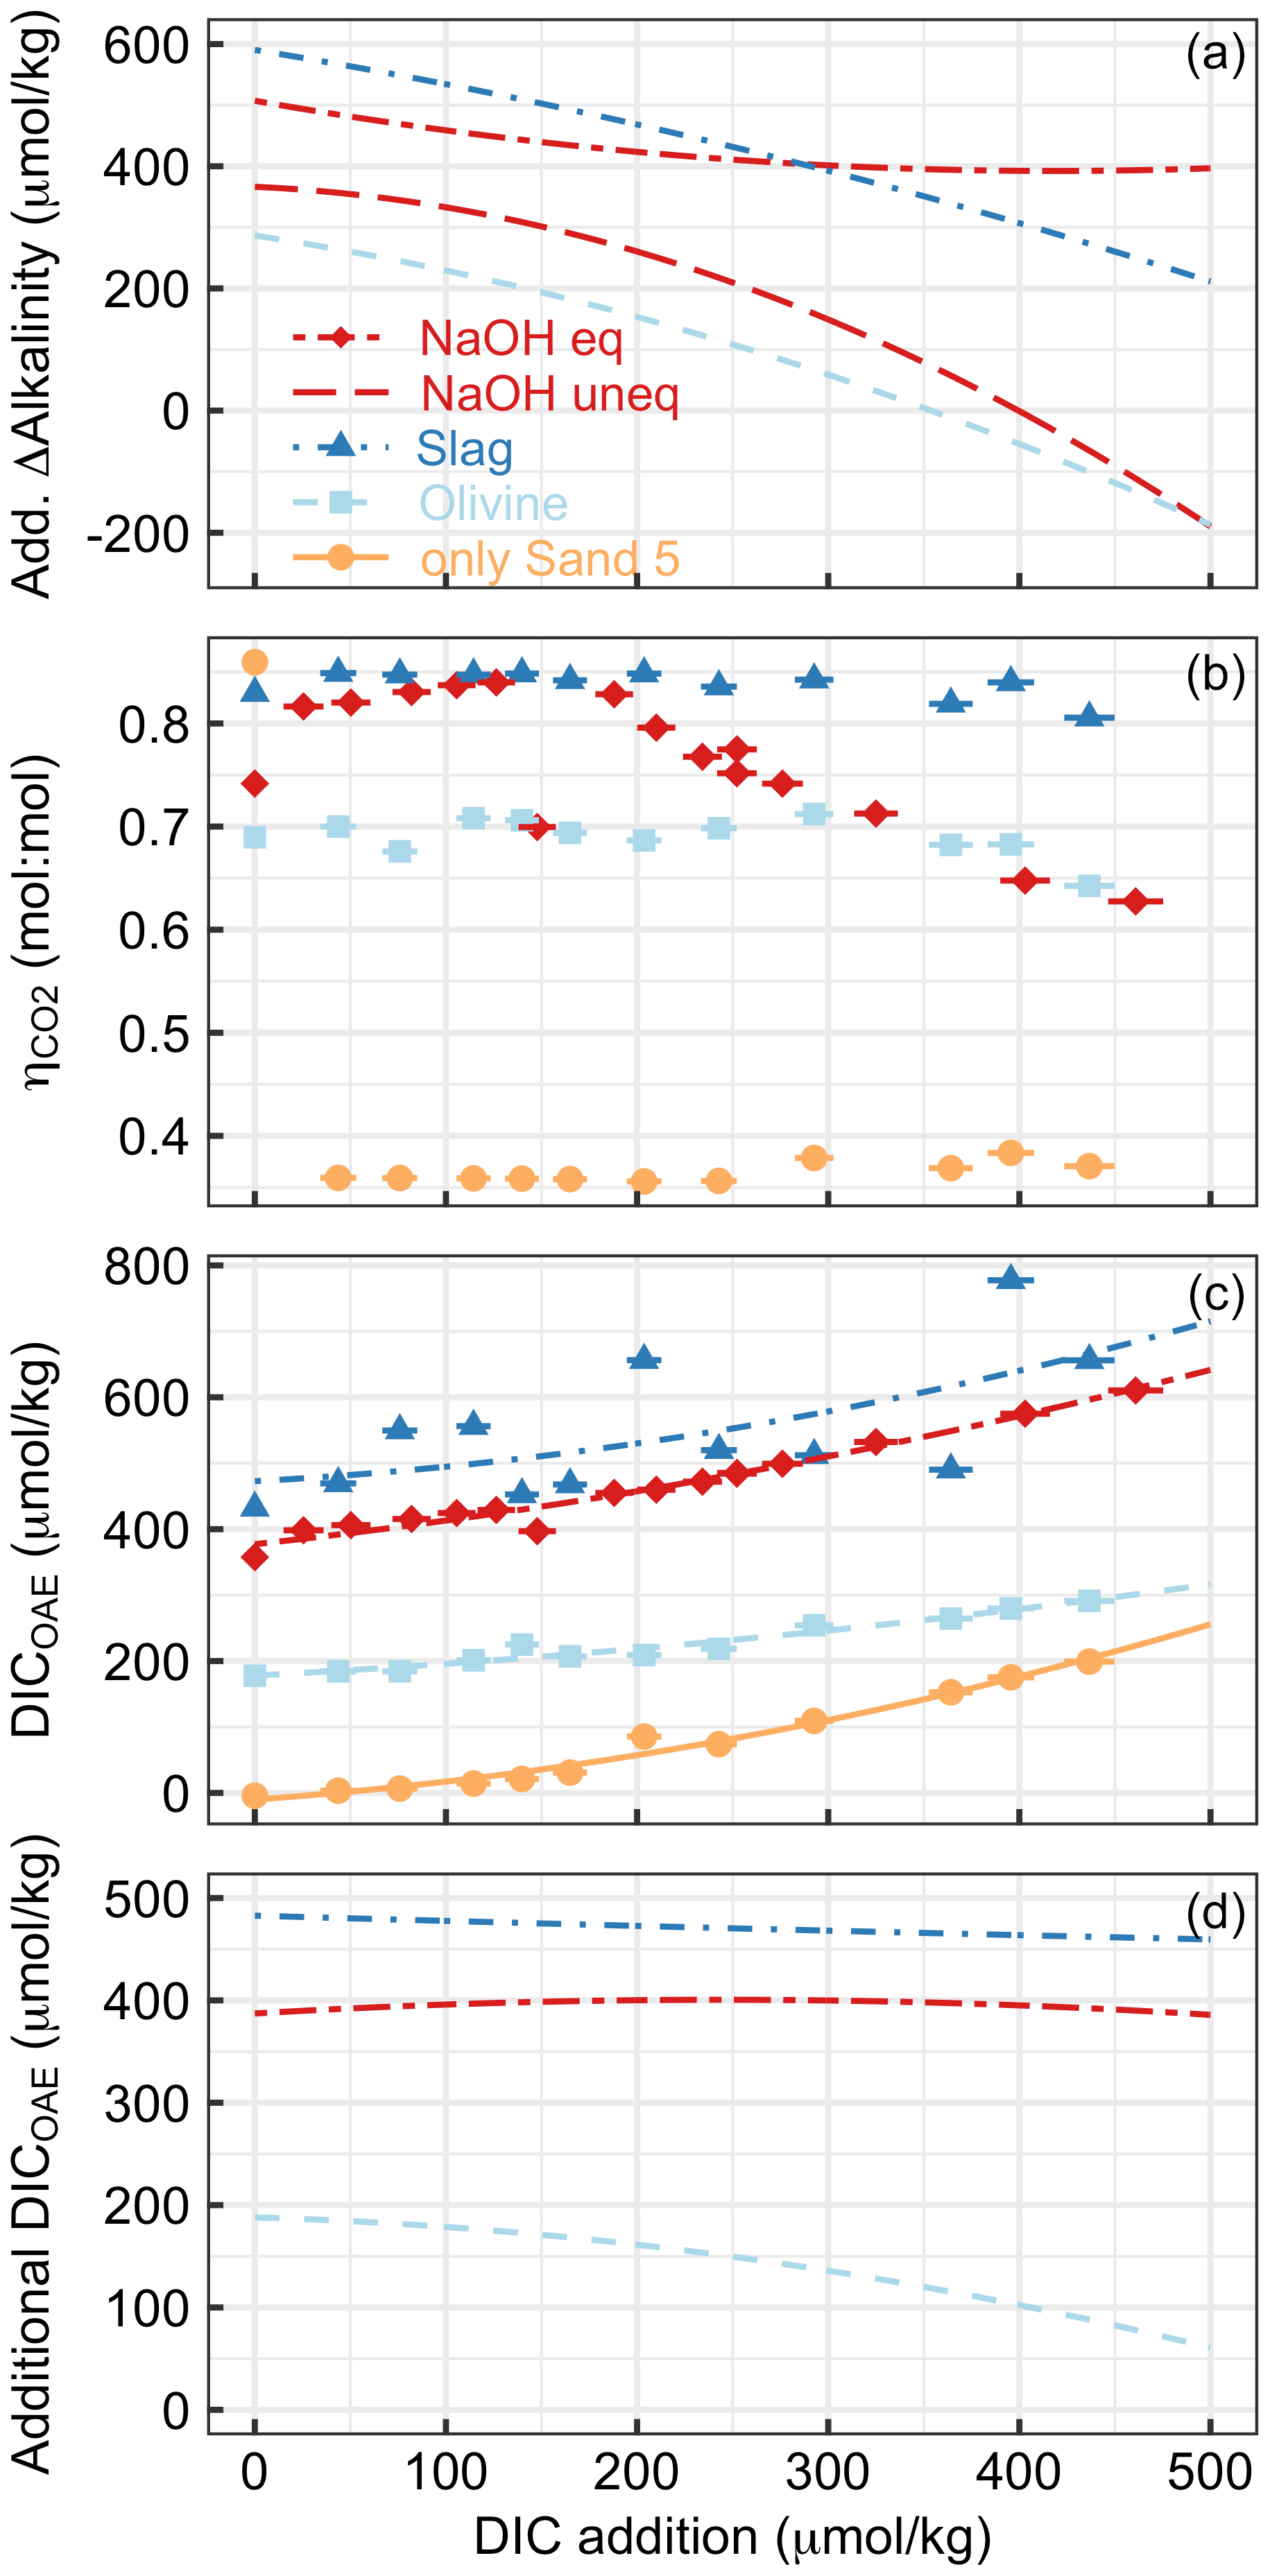
Figure 8Various measures of OAE efficiency under increasing additions of DIC (e.g. CO2 from the respiration of organic material in sediments) in Experiment 2. Panel (a) presents the additionality of ΔAlkalinity. Panel (b) shows at the end of the experiment. Please note that the extreme outlier at the lowest DIC addition in the sand-only treatment was likely due to measurement uncertainty. Panel (c) presents DICOAE, i.e. how much seawater CO2 could have potentially been absorbed with the amount of ΔAlkalinity provided by the various alkalinity sources. Panel (d) shows the additionality of DICOAE. Please note that panels (b)–(d) only show data for the equilibrated NaOH scenario. The un-equilibrated scenario was omitted for logical reasons, i.e. because the core assumption in this scenario (no CO2 equilibration with the atmosphere after OAE) is at odds with the necessary assumption of CO2 equilibration to calculate (Sect. 2.6).
The dependency of on the alkalinity source material (Fig. 7) has important implications for OAE methods that aim to utilize CaCO3 as the alkalinity source (Renforth et al., 2022; Wallmann et al., 2022; Harvey, 2008; Rau and Caldeira, 1999). The molar efficiency for atmospheric CO2 sequestration of OAE is >50 % lower when using carbonates (e.g. CaCO3). Put differently, OAE approaches utilizing CaCO3 as the alkalinity source would have to increase alkalinity by more than twice as much to generate a similar CDR compared with methods that use non-carbonates (e.g. NaOH, slag, or olivine). Importantly, while this disadvantage of carbonate sources of alkalinity appears to be substantial, it is not the only important factor determining the potential of such OAE approaches. It is possible that the use of carbonates still holds higher potential – for example, because limestone is relatively abundant (Caserini et al., 2022), can dissolve quickly (Renforth et al., 2022), or contains fewer components that could potentially affect marine organisms (Bach et al., 2019). Nevertheless, the dependency of on the alkalinity source (Fig. 7) needs to be considered when assessing the efficiency of different OAE methods, as will become apparent in Sect. 4.2.
4.2 The additionality problem of OAE
The experiments considered here investigate coastal applications of OAE – for example, when ground materials or NaOH are exposed to beaches or sandy sediments. In the experiments, the treatments in which only sand was incubated constitute the baseline system, whereas incubations of sand and an alkalinity source constitute the OAE deployments. Both the baseline system and the OAE deployment were run in parallel under identical conditions. To assess the additionality of OAE, CO2 sequestration achieved through an OAE deployment must be compared to the baseline state in which no such deployment occurred (see Eq. 4). As such, additionality can be affected through processes that affect the OAE deployment directly (Sect. 4.2.1) or when the OAE deployment alters the baseline state of the system (Sect. 4.2.2).
4.2.1 Change in additionality through the interaction of alkalinity sources with sand
The ΔAlkalinity values determined in Experiment 1 were lower in NaOH and slag incubations with sand than in incubations without sand. This reduction in the presence of sand was likely due to the secondary precipitation of carbonates, which is promoted when is elevated and/or there are particles present (here sand) that provide nucleation sites for CaCO3 precipitation (Moras et al., 2022; Fuhr et al., 2022; Zhong and Mucci, 1989).
In contrast to the NaOH and slag incubations, the olivine incubations generated more ΔAlkalinity when sand was present, even though the enhancement was small and only statistically significant in one case (i.e. No Sand vs. Sand 4; Fig. 4a). This contrasting observation can be explained as follows. First, ΔAlkalinity was generally lower in the olivine incubations than in the NaOH and slag incubations when no sand was present (266 ± 14.8 µmol kg−1 for olivine vs. >420 µmol kg−1 for NaOH and slag). Moras et al. (2022) has shown that the onset of secondary precipitation depends on ΔAlkalinity, and they observed no secondary precipitation over a 40 d experimental incubation when ΔAlkalinity was ∼250 µmol kg−1 (). This suggests that the 266 ± 14.8 µmol kg−1 ΔAlkalinity generated by olivine did not elevate ΩArg to high enough levels to induce noticeable secondary precipitation within 6.8 d. However, the absence of such secondary precipitation cannot explain why ΔAlkalinity increased in the presence of sand. It is possible that the sand itself released alkalinity via carbonate dissolution, as a very small increase in ΔAlkalinity was also observed in some sand-only incubations (e.g. 17.4 ± 2.6 µmol kg−1 in Sand 4; Fig. 4a). However, ΩArg was higher in the olivine incubations than in the sand-only treatment; thus, a release of carbonate alkalinity seems unlikely. It is also unlikely that the pH differences between olivine-only and olivine–sand incubations drove this trend. While Experiment 3 underscores that lower pH promotes the release of alkalinity from olivine (Fig. 6), pHT was higher in the olivine–sand treatment and significantly more alkalinity was released (see Sand 4 in Fig. 5a). What appears as a plausible explanation is that the sand caused the physical destruction of coatings that develop on the olivine particles during dissolution and are known to reduce dissolution rates (Oelkers et al., 2018). Indeed, the dissolution-enhancing role of physical abrasion has been hypothesized to increase OAE efficiency when using olivine (Schuiling and de Boer, 2010), as has recently been confirmed by Flipkens et al. (2023).
is reduced when the presence of sand catalyses secondary precipitation (Fig. 5c). Consequently, the amount of DIC that can be sequestered via OAE declines. Among other factors, the degree of alkalinity loss due to secondary precipitation depends on the duration for which carbonate supersaturated water is exposed to the sand. The experiments presented here lasted for 6.8 d, and it is likely that secondary precipitation would have proceeded (and would have further declined) if the experiments had lasted for longer. Indeed, Moras et al. (2022) observed that secondary precipitation catalysed by particles only slowed down once ΩArg reached ∼2. In the experiments presented here, ΩArg was generally >5 at the end of the study. A back-of-the-envelope carbonate chemistry calculation with seacarb suggests that a decline until ΩArg reached 2 via carbonate precipitation (i.e. alkalinity and DIC decline with a 2:1 molar ratio) would have reduced alkalinity by ∼560 µmol kg−1 for the NaOH incubation and by 840 µmol kg−1 for the slag incubation. In both cases, the alkalinity after the OAE perturbation would be lower than before, but atmospheric CO2 uptake would still occur ( for NaOH and 0.37 for slag) because the pCO2 is still slightly lower than before the perturbation (Moras et al., 2022).
4.2.2 Reduction in the additionality through modification of baseline alkalinity formation
One interesting observation was made during a sand-only incubation in Experiment 1 (i.e. “No_Alk in Fig. 4). For Sand 2, ΔAlkalinity was about 85 µmol kg−1 higher in one replicate bottle than in the other two. This difference was due to a small arthropod (likely a sand flea) that was unintentionally added to the incubation bottle where the high ΔAlkalinity was observed. The arthropod was still alive at the end of the 6.8 incubation period. During the 6.8 d, the organism respired, thereby reducing ΩArg and causing alkalinity release from the sand via CaCO3 dissolution. This observation pointed out that the baseline system can release substantial amounts of alkalinity before OAE is implemented, given sufficient respiration. Indeed, the in situ observations at Clifton South suggest that alkalinity release occurs in the baseline system used here (Sect. 3.1). Furthermore, there is widespread evidence from the literature that beaches release alkalinity via CaCO3 dissolution (Liu et al., 2021; Perkins et al., 2022; Reckhardt et al., 2015). These insights collectively inspired Experiment 2, in which a DIC gradient (high to low ΩArg) was set up to test if natural alkalinity release via CaCO3 dissolution would be influenced by anthropogenic alkalinity release via OAE.
Experiment 2 demonstrated that the release of natural alkalinity can be disturbed by the addition of anthropogenic alkalinity sources (Fig. 8). Figure 8a illustrates the additionality of alkalinity release, calculated by subtracting ΔAlkalinity from sand-only incubations (represented by the orange lines in Fig. 5a–d) from ΔAlkalinity in combined sand and alkalinity incubations (represented by the red and blue lines). Figure 8a reveals that the additionality of ΔAlkalinity declines with an increase in the amount of DIC added. The reason for this trend is that the alkalinity sources added to the incubation bottles buffered the DIC-induced pH decline. This buffering elevated ΩArg during the incubations, resulting in a reduced release of natural alkalinity through CaCO3 dissolution. In simpler terms, by adding a new buffer system via OAE (NaOH, slag, or olivine), a natural buffer system (CaCO3 dissolution) is partially replaced. In cases where olivine or non-equilibrated NaOH was tested, the additionality of ΔAlkalinity even became negative when DIC additions were >350 and >400 µmol kg−1, respectively (Fig. 8a).
Alkalinity release is generally seen as a good indicator of the amount of CO2 that can be removed per mole of alkalinity enhancement (. However, as discussed in Sect. 4.1, also critically depends on whether the released alkalinity is Alkcarbonate or Alknon-carbonate. In Experiment 2, varies greatly depending on the alkalinity source and the amount of DIC added to the incubation (Fig. 8b). is low for sand-only incubations because basically all ΔAlkalinity is Alkcarbonate, whereas it is substantially higher in treatments with an anthropogenic Alknon-carbonate source. For olivine, was around 0.7 until the highest DIC additions, where it then declined slightly. This is lower than for slag, where remains close to the theoretical maximum of 0.86. The difference between slag and olivine could be due to the faster dissolution of slag, which elevates ΩArg before substantial CaCO3 dissolution occurs. In contrast, olivine dissolves more slowly (Fuhr et al., 2022; Montserrat et al., 2017; Hangx and Spiers, 2009), so that some CaCO3 dissolution may occur before olivine dissolution elevates ΩArg enough to limit further CaCO3 dissolution. (Please note, however, that this explanation does not explain why is also lower than in slag incubations at low DIC additions, where ΩArg was high enough to limit CaCO3 dissolution from the start.) The reason for the decreasing in the equilibrated NaOH scenario (Fig. 8b) is an increasing contribution of Alkcarbonate to ΔAlkalinity. It is important to note that, for the same added DIC, ΩArg is much lower in the equilibrated NaOH scenario than in the un-equilibrated NaOH scenario (e.g. 0.28 vs. 2.9 at ∼400 µmol kg−1 of added DIC for the equilibrated and un-equilibrated NaOH scenarios, respectively). This lower ΩArg is because the equilibrated scenario simulates that atmospheric CO2 has already been absorbed by the alkalinity-enhanced seawater. Accordingly, alkalinity-enhanced seawater that has been equilibrated with atmospheric CO2 interacts with beach sediments at a lower ΩArg than if the alkalinity-enhanced seawater was un-equilibrated. As such, the equilibrated OAE scenario causes a lower reduction in the natural alkalinity release from sediments via CaCO3 dissolution.
Measurements and estimates of ΔAlkalinity and enabled the calculation of how much DIC could be maximally stored by the generated alkalinity (i.e. DICOAE as calculated in Eq. 9 is shown in Fig. 8c). DICOAE increases with higher DIC additions due to the release of alkalinity via CaCO3 dissolution. However, the increase is less pronounced, as observed for ΔAlkalinity (Fig. 8a), because Alkcarbonate from CaCO3 dissolution is less efficient in sequestering environmental CO2 than Alknon-carbonate from NaOH, slag, or olivine (Sect. 4.1).
To calculate the additionality of DICOAE, I subtracted the DICOAE of the sand-only incubations (baseline) from the DICOAE of the OAE scenarios (Fig. 8d). The additionality of DICOAE is arguably the most important parameter to assess whether an OAE deployment has led to the net sequestration of CO2. In the case of the equilibrated NaOH and slag scenarios, the additionality of DICOAE was constant over the applied gradient, suggesting that the release of Alkcarbonate via CaCO3 dissolution led to a similar DICOAE potential in the sand-only scenario and these two OAE scenarios. In contrast, the additionality of DICOAE declined in the olivine scenario because there was relatively more Alkcarbonate release in the sand-only scenario than in the olivine scenario (Fig. 8d). Importantly, however, the additionality of DICOAE remained positive up until the highest DIC addition, which is in stark contrast to the additionality of ΔAlkalinity (cf. Fig. 8a and d). This means that the addition of olivine maintained a positive CO2 sequestration potential, even though less alkalinity was generated in the olivine treatment than in the sand-only treatment (Fig. 8c). The reason for this counterintuitive observation is simply that the Alknon-carbonate released by olivine has more potential to sequester CO2 than the Alkcarbonate released via CaCO3 dissolution.
4.3 Relevance of the additionality problem
Modifications of additionality can occur when OAE triggers subsequent alkalinity loss through biotic and abiotic carbonate precipitation (Sect. 4.2.1). This feedback has been widely discussed and is already a predominant topic in OAE research (Hartmann et al., 2013, 2023; Bach et al., 2019; Moras et al., 2022; Fuhr et al., 2022). Not yet discussed is the modification of additionality that may occur when anthropogenic alkalinity sources (via OAE) modify the release of natural alkalinity (Sect. 4.2.2). Thus, I will focus on the relevance of this second pathway of additionality modification in the following paragraphs.
The experiments conducted here tested how anthropogenic alkalinity sources can interact with beach sand in a setting that assumes constant mixing, inspired by conditions observed in a high-energy wave impact zone. This setting was chosen based on the widely discussed OAE implementation strategy of adding olivine powder to beaches. The results suggest that the additionality problem needs to be considered for this specific OAE approach. However, the wave impact zone comprises a tiny fraction of the coastal ocean, and this poses a question regarding the extent to which the additionality problem also applies to the vast shelf, bank, embayment, and reef areas where OAE could also be implemented (Feng et al., 2017; Meysman and Montserrat, 2017; Mongin et al., 2021).
The coastal ocean is a net sink of ∼36 Tmol yr−1 alkalinity via CaCO3 burial (Middelburg et al., 2020), but considerable amounts of alkalinity are also generated in the various coastal sediments via CaCO3 dissolution (one estimate suggests ∼13 Tmol yr−1; Krumins et al., 2013). The dissolution depends on the solubility of CaCO3 present in the sediments and pore water (Middelburg et al., 2020). Conditions for dissolution are generally favourable in coastal ocean sediments because soluble forms of CaCO3 occur more frequently and a relatively high supply of organic matter lowers (Krumins et al., 2013; Lunstrum and Berelson, 2022; Morse et al., 1985). Thus, the introduction of an anthropogenic buffer via OAE (which increases is likely to cause a reduction in the alkalinity release from the seafloor.
Indeed, more soluble forms of CaCO3 have been shown to protect less soluble forms of CaCO3 from dissolution at the seafloor (Sulpis et al., 2022). Furthermore, an experiment exposed a coral reef to moderate levels of increased alkalinity (ΔAlkalinity = ∼50 µmol kg−1) and found a net increase in reef calcification, with some evidence suggesting that the measured effect was due to reduced reef dissolution (Albright et al., 2016). Anthropogenic alkalinity sources (e.g. NaOH, slag, and olivine) introduced via OAE can be considered to have a similar effect and reduce natural alkalinity release via CaCO3 dissolution. It is worth noting that the negative effect of anthropogenic alkalinity on natural alkalinity release may also occur in the open surface ocean. Here, part of the alkalinity bound in particulate form via biotic calcification redissolves, for example in corrosive microenvironments such as zooplankton or marine snow (Subhas et al., 2022; Milliman et al., 1999; Sulpis et al., 2021). If anthropogenic alkalinity introduced via OAE reduces this natural dissolution of CaCO3 in the surface ocean, less alkalinity would remain in the surface ocean and the additionality of OAE would be reduced (Bach et al., 2019). Thus, the additionality problem of OAE could be widespread and not restricted to the specific environment studied experimentally in this paper.
Another interesting aspect to consider is the time and scale dependency of the additionality problem. A detectable slowdown of natural alkalinity formation may occur in the environment in which anthropogenic alkalinity was added (as observed in the experiments presented here). Such an “acute” additionality problem may be comparatively easy to associate with the responsible OAE deployment, and there may be straightforward ways to mitigate it (see Sect. 4.4 and Box 1). However, the problem could turn from acute to “chronic” over much longer timescales should OAE be upscaled to climate relevance and could cause a significant increase in Ω throughout the ocean. In the chronic scenario, anthropogenic alkalinity may partially replace the “natural” alkalinity release enforced by fossil fuel CO2 neutralization via carbonate dissolution (Archer et al., 1998). A chronic additionality problem would unlikely be attributable to individual OAE deployments, and suggested mitigation measures described in Sect. 4.4 and Box 1 would not work. Indeed, similar chronic problems for CDR imposed by Earth system feedbacks have already been described, such as the possible weakening of natural terrestrial and marine CO2 sinks due to CDR implementation (Keller et al., 2018). However, assessing whether the hypothesis of a chronic additionality problem is valid remains to be seen and will require more targeted follow-up research.
4.4 Possible ways to manage the additionality problem
This section discusses potential pathways to manage an acute additionality problem. The discussion is accompanied by Box 1, which translates the thoughts raised here into suggestions regarding how practitioners (e.g. OAE start-ups) could deal with acute additionality problems.
To manage the additionality problem, it is important to monitor the natural alkalinity release at a designated OAE deployment site before OAE is implemented. Natural alkalinity release occurs in all coastal habitats (Krumins et al., 2013; Aller, 1982; Perkins et al., 2022; Liu et al., 2021), and recent evidence suggests that even a low CaCO3 content in sediments is sufficient to yield high alkalinity release rates (Lunstrum and Berelson, 2022). As such, dissolution is not restricted to CaCO3-rich sediments; therefore, avoiding these sediments may not mitigate the additionality problem. More crucial than the CaCO3 content appears to be the supply of organic matter to the seafloor, which provides the respiratory CO2 needed for CaCO3 dissolution and associated alkalinity release; it should be noted that the organic matter supply also drives organic or other inorganic alkalinity release (Krumins et al., 2013; Aller, 1982; Lunstrum and Berelson, 2022; Perkins et al., 2022; Liu et al., 2021). Therefore, it may be useful to avoid OAE near sediments exposed to a high organic matter load to reduce the interference of anthropogenic alkalinity with natural alkalinity release.
Another mitigation pathway for the additionality problem is dilution. When anthropogenic alkalinity is diluted quickly, there is less chance for the new buffer system to generate oversaturated Ω in seawater, sediment pore waters, or other microenvironments. Indeed, the data from the beach transects show that alkalinity (and Si(OH)4) deviations in the upper end of the swash zone were quickly lost upon moving offshore (Fig. 3). The experiments presented here do not allow for such dilution, as they are performed in enclosed volumes. Therefore, they can be considered a more extreme case that does not correctly represent the vastness of the ocean nor its volume. Indeed, previous experiments investigating the risk of alkalinity loss after OAE due to secondary precipitation have found that dilution effectively mitigates the secondary precipitation problem (Moras et al., 2022). It is very likely that dilution is similarly effective with respect to mitigating the additionality problem.
Finally, the data presented here clearly show that the additionality problem scales with the degree of CaCO3 oversaturation introduced through the anthropogenic alkalinity source. This is most obvious when comparing the equilibrated with the un-equilibrated NaOH OAE scenario. The increase in is much more pronounced in the un-equilibrated scenario because atmospheric CO2 has not yet entered the seawater and brought the down to the levels it was at before the OAE perturbation. As such, the additionality problem will be much more pronounced when an alkalinity source interacts with naturally alkalinity-releasing sediments before the OAE-perturbed seawater has been equilibrated with atmospheric CO2. Nevertheless, a close look at Fig. 4a (equilibrated NaOH) shows that even the relatively small increase in that coincides with OAE fully equilibrated with atmospheric CO2 can reduce natural alkalinity release. Thus, atmospheric CO2 equilibration following OAE mitigates the additionality problem but cannot fully avoid it.
4.4.1 Box 1: suggestions for OAE practitioners
Research much beyond the present study is needed to better constrain the magnitude of the additionality problem and evaluate its relevance for OAE. However, real-world OAE assessments and ambitions for implementation are already underway so that some initial guidance on the additionality problem may already be important, even if based on limited evidence. The following translates the thoughts discussed in Sect. 4 into suggestions directed to those working on the implementation of OAE. Importantly, practitioners should remain critical about these suggestions (they may change with further knowledge gain) and apply them at their own risk. This advice is as follows:
-
With the currently limited understanding of the additionality problem, it may be best to avoid it as much as possible.
-
Choose a field site with high dilution. Interaction of anthropogenic alkalinity with the natural alkalinity cycle is less likely to occur when alkalinity-enhanced seawater is quickly mixed with unperturbed seawater. As such, volumes with restricted exchange (e.g. bays, lagoons, and fjords) may be more problematic.
-
Enable fast equilibration of the alkalinity-enhanced seawater with atmospheric CO2. The influx of atmospheric CO2 returns the of alkalinity-enhanced seawater to values closer to unperturbed seawater and, thus, has a lower potential to affect CaCO3 dissolution or precipitation.
-
When possible, restrict the contact of anthropogenic alkalinity with sediments to reduce interactions in natural alkalinity-cycling hotspots. This suggestion is not feasible for OAE implementation via coastal enhanced weathering in which alkaline minerals are added to sediments (Eisaman et al., 2023). For this OAE strategy, it is suggested to prefer sediments depleted in organic matter, as less “fuel” is available for respiration and associated carbonate dissolution (i.e. natural alkalinity release).
-
Frameworks to monitor, report, and verify the success of OAE should include sediment interactions and account for the additionality problem.
The additionality problem described herein could influence the effectiveness of OAE. This suggests that the interference of anthropogenic alkalinity with the natural alkalinity cycle must be assessed as a factor that can modify the OAE efficiency. The arguments provided in Sect. 4 suggest that the additionality problem is potentially widespread, even though the dataset presented here only considers OAE near or on wave-exposed beaches. Future research should aim to confirm or dismiss these arguments and to better understand the extent of the problem.
The additionality problem adds a layer of complexity to monitoring, reporting, and verifying CO2 removal with OAE. Strictly speaking, it is not sufficient to monitor the generation (e.g. via NaOH, slag, or olivine dissolution) and potential loss (e.g. via biotic and abiotic precipitation) of anthropogenic alkalinity after its generation. The extent to which anthropogenic alkalinity alters the baseline removal or delivery of natural alkalinity also needs to be assessed. It will be crucial to understand whether the anthropogenic acceleration of the alkalinity cycle in the oceans via OAE could slow down the natural alkalinity cycle.
All data and evaluation scripts (for R) generated herein are available for download from Zenodo: https://doi.org/10.5281/zenodo.8191516 (Bach, 2023).
The supplement related to this article is available online at: https://doi.org/10.5194/bg-21-261-2024-supplement.
The author has declared that there are no competing interests.
Publisher's note: Copernicus Publications remains neutral with regard to jurisdictional claims made in the text, published maps, institutional affiliations, or any other geographical representation in this paper. While Copernicus Publications makes every effort to include appropriate place names, the final responsibility lies with the authors.
I thank Jiaying Guo and Bec Lenc for providing particle size spectra, the Moyne Shire Council for providing olivine samples, Bradley Mansell from Liberty Primary Steel for providing steel slag aggregates, and the Central Science Laboratory at the University of Tasmania for particulate carbon analyses. I am also grateful to Jack Middelburg for editing a draft of the manuscript and to Matt Eisaman, Adam Subhas, and two anonymous reviewers for their constructive review.
This research has been supported by the Australian Research Council (grant no. FT200100846) and the Carbon-to-Sea Initiative, a non-profit initiative dedicated to evaluating ocean alkalinity enhancement.
This paper was edited by Jack Middelburg and reviewed by Matthew Eisaman, Adam Subhas, and two anonymous referees.
Adkins, J. F., Naviaux, J. D., Subhas, A. V, Dong, S., and Berelson, W. M.: The Dissolution Rate of CaCO_3 in the Ocean, Annu. Rev. Mar. Sci., 13, 57–80, https://doi.org/10.1146/annurev-marine-041720, 2020.
Albright, R., Caldeira, L., Hosfelt, J., Kwiatkowski, L., Maclaren, J. K., Mason, B. M., Nebuchina, Y., Ninokawa, A., Pongratz, J., Ricke, K. L., Rivlin, T., Schneider, K., Sesboüé, M., Shamberger, K., Silverman, J., Wolfe, K., Zhu, K., and Caldeira, K.: Reversal of ocean acidification enhances net coral reef calcification, Nature, 531, 362–365, https://doi.org/10.1038/nature17155, 2016.
Aller, R. C.: Carbonate Dissolution in Nearshore Terrigenous Muds: The Role of Physical and Biological Reworking, J. Geol., 90, 79–95, https://doi.org/10.1086/628652, 1982.
Archer, D., Kheshgi, H., and Maier-Reimer, E.: Dynamics of fossil fuel CO2 neutralization by marine CaCO_3, Global Biogeochem. Cy., 12, 259–276, https://doi.org/10.1029/98GB00744, 1998.
Bach, L. T.: The additionality problem of Ocean Alkalinity Enhancement: Underlying experimental and observational data, Zenodo [data set], https://doi.org/10.5281/zenodo.8191516, 2023.
Bach, L. T., Gill, S. J., Rickaby, R. E. M., Gore, S., and Renforth, P.: CO2 Removal With Enhanced Weathering and Ocean Alkalinity Enhancement: Potential Risks and Co-benefits for Marine Pelagic Ecosystems, Front. Clim., 1, 1–21, https://doi.org/10.3389/fclim.2019.00007, 2019.
Caserini, S., Storni, N., and Grosso, M.: The Availability of Limestone and Other Raw Materials for Ocean Alkalinity Enhancement, Global Biogeochem. Cy., 36, e2021GB007246, https://doi.org/10.1029/2021GB007246, 2022.
Dickson, A. G., Afghan, J. D., and Anderson, G. C.: Reference materials for oceanic CO2 analysis: a method for the certification of total alkalinity, Mar. Chem., 80, 185–197, https://doi.org/10.1016/S0304-4203(02)00133-0, 2003.
Dickson, A. G., Sabine, C. L., and Christian, J. R.: Guide to Best Practices for Ocean CO2 Measurements, PICES Spec., PICES, Sidney, ISBN 1-897176-07-4, 2007.
Eisaman, M. D., Rivest, J. L. B., Karnitz, S. D., Lannoy, C. De, Jose, A., Devaul, R. W., and Hannun, K.: International Journal of Greenhouse Gas Control Indirect ocean capture of atmospheric CO2: Part II, Understanding the cost of negative emissions, Int. J. Greenh. Gas Con., 70, 254–261, https://doi.org/10.1016/j.ijggc.2018.02.020, 2018.
Eisaman, M. D., Geilert, S., Renforth, P., Bastianini, L., Campbell, J., Dale, A. W., Foteinis, S., Grasse, P., Hawrot, O., Löscher, C. R., Rau, G. H., and Rønning, J.: Assessing the technical aspects of ocean-alkalinity-enhancement approaches, in: Guide to Best Practices in Ocean Alkalinity Enhancement Research, edited by: Oschlies, A., Stevenson, A., Bach, L. T., Fennel, K., Rickaby, R. E. M., Satterfield, T., Webb, R., and Gattuso, J.-P., Copernicus Publications, State Planet, 2-oae2023, 3, https://doi.org/10.5194/sp-2-oae2023-3-2023, 2023.
Fakhraee, M., Planavsky, N. J., and Reinhard, C. T.: Ocean alkalinity enhancement through restoration of blue carbon ecosystems, Nat. Sustain., 6, 1087–1094, https://doi.org/10.1038/s41893-023-01128-2, 2023.
Feng, E. Y., Koeve, W., Keller, D. P., and Oschlies, A.: Model-Based Assessment of the CO2 Sequestration Potential of Coastal Ocean Alkalinization, Earths Future, 5, 1252–1266, https://doi.org/10.1002/eft2.273, 2017.
Ferderer, A., Chase, Z., Kennedy, F., Schulz, K. G., and Bach, L. T.: Assessing the influence of ocean alkalinity enhancement on a coastal phytoplankton community, Biogeosciences, 19, 5375–5399, https://doi.org/10.5194/bg-19-5375-2022, 2022.
Flipkens, G., Fuhr, M., Meysman, F. J. R., Town, R. M., and Blust, R.: Enhanced olivine dissolution in seawater through continuous grain collisions, Geochim. Cosmochim. Ac., 359, 84–99, https://doi.org/10.1016/j.gca.2023.09.002, 2023.
Fuhr, M., Geilert, S., Schmidt, M., Liebetrau, V., Vogt, C., Ledwig, B., and Wallmann, K.: Kinetics of Olivine Weathering in Seawater: An Experimental Study, Front. Clim., 4, 1–20, https://doi.org/10.3389/fclim.2022.831587, 2022.
Gattuso, J.-P., Epitalon, J.-M., Lavigne, H., and Orr, J.: Seacarb: seawater carbonate chemistry with R. R package version 3.0, https://cran.r-project.org/web/packages/seacarb/index.html (last access: 17 October 2023), 2021.
Hangx, S. J. T. and Spiers, C. J.: Coastal spreading of olivine to control atmospheric CO2 concentrations: A critical analysis of viability, Int. J. Greenh. Gas Con., 3, 757–767, https://doi.org/10.1016/j.ijggc.2009.07.001, 2009.
Hansen, H. P. and Koroleff, F.: Determination of nutrients, in: Methods of Seawater Analysis, edited by: Grasshoff, K., Kremling, K., and Ehrhardt, M., Wiley-VCH, Weinheim, 159–226, https://doi.org/10.1002/9783527613984 1999.
Hartmann, J., West, A. J., Renforth, P., Köhler, P., de la Rocha, C., Wolf-Gladrow, D., Dürr, H. H., and Scheffran, J.: Enhanced chemical weathering as a geoengineering strategy to reduce atmospheric carbon dioxide, supply nutrients, and mitigate ocean acidification, Rev. Geophys., 51, 113–149, https://doi.org/10.1002/rog.20004.1.Institute, 2013.
Hartmann, J., Suitner, N., Lim, C., Schneider, J., Marín-Samper, L., Arístegui, J., Renforth, P., Taucher, J., and Riebesell, U.: Stability of alkalinity in ocean alkalinity enhancement (OAE) approaches – consequences for durability of CO2 storage, Biogeosciences, 20, 781–802, https://doi.org/10.5194/bg-20-781-2023, 2023.
Harvey, L. D. D.: Mitigating the atmospheric CO2 increase and ocean acidification by adding limestone powder to upwelling regions, J. Geophys. Res.-Oceans, 113, 1–21, https://doi.org/10.1029/2007JC004373, 2008.
Havukainen, M., Waldén, P., and Kahiluoto, H.: Clean Development Mechanism, in: Encyclopedia of Sustainable Management, edited by: Idowu, S. O., Springer Nature Switzerland, 1–5, https://doi.org/10.1016/B978-0-12-375067-9.00127-3, 2022.
He, J. and Tyka, M. D.: Limits and CO2 equilibration of near-coast alkalinity enhancement, Biogeosciences, 20, 27–43, https://doi.org/10.5194/bg-20-27-2023, 2023.
Humphreys, M. P., Gregor, L., Pierrot, D., van Heuven, S. M. A. C., Lewis, E. R., and Wallace, D. W. R.: PyCO2SYS: marine carbonate system calculations in Python, Zenodo, https://doi.org/10.5281/zenodo.3744275, 2020.
Keller, D. P., Lenton, A., Littleton, E. W., Oschlies, A., Scott, V., and Vaughan, N. E.: The Effects of Carbon Dioxide Removal on the Carbon Cycle, Curr. Clim. Change Rep., 4, 250–265, https://doi.org/10.1007/s40641-018-0104-3, 2018.
Krumins, V., Gehlen, M., Arndt, S., Van Cappellen, P., and Regnier, P.: Dissolved inorganic carbon and alkalinity fluxes from coastal marine sediments: model estimates for different shelf environments and sensitivity to global change, Biogeosciences, 10, 371–398, https://doi.org/10.5194/bg-10-371-2013, 2013.
de Lannoy, C. F., Eisaman, M. D., Jose, A., Karnitz, S. D., DeVaul, R. W., Hannun, K., and Rivest, J. L. B.: Indirect ocean capture of atmospheric CO2: Part I, Prototype of a negative emissions technology, Int. J. Greenh. Gas Con., 70, 243–253, https://doi.org/10.1016/j.ijggc.2017.10.007, 2018.
Lewis, E. L. and Perkin, R. G.: Salinity: Its definition and calculation, J. Geophys. Res.-Oceans, 83, 466–478, https://doi.org/10.1029/jc083ic01p00466, 1978.
Lezaun, J.: Hugging the Shore: Tackling Marine Carbon Dioxide Removal as a Local Governance Problem, Front. Clim., 3, 1–6, https://doi.org/10.3389/fclim.2021.684063, 2021.
Liu, Y., Jiao, J. J., Liang, W., Santos, I. R., Kuang, X., and Robinson, C. E.: Inorganic carbon and alkalinity biogeochemistry and fluxes in an intertidal beach aquifer: Implications for ocean acidification, J. Hydrol., 595, 126036, https://doi.org/10.1016/j.jhydrol.2021.126036, 2021.
Lueker, T. J., Dickson, A. G., and Keeling, C. D.: Ocean pCO2 calculated from dissolved inorganic carbon, alkalinity, and equations for K1 and K2: Validation based on laboratory measurements of CO2 in gas and seawater at equilibrium, Mar. Chem., 70, 105–119, https://doi.org/10.1016/S0304-4203(00)00022-0, 2000.
Lunstrum, A. and Berelson, W.: CaCO_3 dissolution in carbonate-poor shelf sands increases with ocean acidification and porewater residence time, Geochim. Cosmochim. Ac., 329, 168–184, https://doi.org/10.1016/j.gca.2022.04.031, 2022.
Meysman, F. J. R. and Montserrat, F.: Negative CO2 emissions via enhanced silicate weathering in coastal environments, Biol. Lett., 13, 20160905, https://doi.org/10.1098/rsbl.2016.0905, 2017.
Michaelowa, A., Hermwille, L., Obergassel, W., and Butzengeiger, S.: Additionality revisited: guarding the integrity of market mechanisms under the Paris Agreement, Clim. Pol., 19, 1211–1224, https://doi.org/10.1080/14693062.2019.1628695, 2019.
Middelburg, J. J., Soetaert, K., and Hagens, M.: Ocean Alkalinity, Buffering and Biogeochemical Processes, Rev. Geophys., 58, e2019RG000681, https://doi.org/10.1029/2019RG000681, 2020.
Milliman, J. D., Troy, P. J., Balch, W. M., Adams, A. K., Li, Y.-H., and Mackenzie, F. T.: Biologically mediated dissolution of calcium carbonate above the chemical lysocline?, Deep Sea Res. Pt. I, 46, 1653–1669, https://doi.org/10.1016/S0967-0637(99)00034-5, 1999.
Mongin, M., Baird, M. E., Lenton, A., Neill, C., and Akl, J.: Reversing ocean acidification along the Great Barrier Reef using alkalinity injection, Environ. Res. Lett., 16, 064068, https://doi.org/10.1088/1748-9326/ac002d, 2021.
Montserrat, F., Renforth, P., Hartmann, J., Leermakers, M., Knops, P., and Meysman, F. J. R.: Olivine Dissolution in Seawater: Implications for CO2 Sequestration through Enhanced Weathering in Coastal Environments, Environ. Sci. Technol., 51, 3960–3972, https://doi.org/10.1021/acs.est.6b05942, 2017.
Moras, C. A., Bach, L. T., Cyronak, T., Joannes-Boyau, R., and Schulz, K. G.: Ocean alkalinity enhancement – avoiding runaway CaCO3 precipitation during quick and hydrated lime dissolution, Biogeosciences, 19, 3537–3557, https://doi.org/10.5194/bg-19-3537-2022, 2022.
Morse, J. W., Zullig, J. J., Bernstein, L. D., Millero, F. J., Milne, P., Mucci, A., and Choppin, G. R.: Chemistry of calcium carbonate-rich shallow water sediments in the Bahamas, Am. J. Sci., 285, 147–185, https://doi.org/10.2475/ajs.285.2.147, 1985.
Morse, J. W., Gledhill, D. K., and Millero, F. J.: CaCO_3 precipitation kinetics in waters from the great Bahama bank: Implications for the relationship between bank hydrochemistry and whitings, Geochim. Cosmochim. Ac., 67, 2819–2826, https://doi.org/10.1016/S0016-7037(03)00103-0, 2003.
Mucci, A.: The solubility of calcite and aragonite in seawater at various salinities, temperatures, and one atmosphere total pressure, Am. J. Sci., 283, 780–799, 1983.
Nemet, G. F., Callaghan, M. W., Creutzig, F., Fuss, S., Hartmann, J., Hilaire, J., Lamb, W. F., Minx, J. C., Rogers, S., and Smith, P.: Negative emissions – Part 3: Innovation and upscaling, Environ. Res. Lett., 13, 06300, https://doi.org/10.1088/1748-9326/aabff4, 2018.
Oelkers, E. H., Declercq, J., Saldi, G. D., Gislason, S. R., and Schott, J.: Olivine dissolution rates: A critical review, Chem. Geol., 500, 1–19, https://doi.org/10.1016/j.chemgeo.2018.10.008, 2018.
Perkins, A. K., Santos, I. R., Rose, A. L., Schulz, K. G., Grossart, H. P., Eyre, B. D., Kelaher, B. P., and Oakes, J. M.: Production of dissolved carbon and alkalinity during macroalgal wrack degradation on beaches: a mesocosm experiment with implications for blue carbon, Biogeochemistry, 160, 159–175, https://doi.org/10.1007/s10533-022-00946-4, 2022.
Rau, G. H. and Caldeira, K.: Enhanced carbonate dissolution: A means of sequestering waste CO2 as ocean bicarbonate, Energ. Conver. Manag., 40, 1803–1813, https://doi.org/10.1016/S0196-8904(99)00071-0, 1999.
Reckhardt, A., Beck, M., Seidel, M., Riedel, T., Wehrmann, A., Bartholomä, A., Schnetger, B., Dittmar, T., and Brumsack, H. J.: Carbon, nutrient and trace metal cycling in sandy sediments: Acomparison of high-energy beaches and backbarrier tidal flats, Estuar. Coast. Shelf S., 159, 1–14, https://doi.org/10.1016/j.ecss.2015.03.025, 2015.
Renforth, P.: The negative emission potential of alkaline materials, Nat. Commun., 10, 1401, https://doi.org/10.1038/s41467-019-09475-5, 2019.
Renforth, P. and Henderson, G.: Assessing ocean alkalinity for carbon sequestration, Rev. Geophys., 55, 636–674, https://doi.org/10.1002/2016RG000533, 2017.
Renforth, P., Baltruschat, S., Peterson, K., Mihailova, B. D., and Hartmann, J.: Using ikaite and other hydrated carbonate minerals to increase ocean alkalinity for carbon dioxide removal and environmental remediation, Joule, 6, 2674–2679, https://doi.org/10.1016/j.joule.2022.11.001, 2022.
Saderne, V., Fusi, M., Thomson, T., Dunne, A., Mahmud, F., Roth, F., Carvalho, S., and Duarte, C. M.: Total alkalinity production in a mangrove ecosystem reveals an overlooked Blue Carbon component, Limnol. Oceanogr. Lett., 6, 61–67, https://doi.org/10.1002/lol2.10170, 2021.
Schuiling, R. D. and de Boer, P. L.: Coastal spreading of olivine to control atmospheric CO2 concentrations: A critical analysis of viability, Comment: Nature and laboratory models are different, Int. J. Greenh. Gas Con., 4, 855–856, https://doi.org/10.1016/j.ijggc.2010.04.012, 2010.
Schuiling, R. D. and Krijgsman, P.: Enhanced weathering: An effective and cheap tool to sequester CO2, Clim. Change, 74, 349–354, https://doi.org/10.1007/s10584-005-3485-y, 2006.
Schulz, K. G., Bach, L. T., and Dickson, A. G.: Seawater carbonate chemistry considerations for ocean alkalinity enhancement research: theory, measurements, and calculations, in: Guide to Best Practices in Ocean Alkalinity Enhancement Research, edited by: Oschlies, A., Stevenson, A., Bach, L. T., Fennel, K., Rickaby, R. E. M., Satterfield, T., Webb, R., and Gattuso, J.-P., Copernicus Publications, State Planet, 2-oae2023, 2, https://doi.org/10.5194/sp-2-oae2023-2-2023, 2023.
Subhas, A. V., Dong, S., Naviaux, J. D., Rollins, N. E., Ziveri, P., Gray, W., Rae, J. W. B., Liu, X., Byrne, R. H., Chen, S., Moore, C., Martell-Bonet, L., Steiner, Z., Antler, G., Hu, H., Lunstrum, A., Hou, Y., Kemnitz, N., Stutsman, J., Pallacks, S., Dugenne, M., Quay, P. D., Berelson, W. M., and Adkins, J. F.: Shallow Calcium Carbonate Cycling in the North Pacific Ocean, Global Biogeochem. Cy., 36, 1–22, https://doi.org/10.1029/2022GB007388, 2022.
Sulpis, O., Jeansson, E., Dinauer, A., Lauvset, S. K., and Middelburg, J. J.: Calcium carbonate dissolution patterns in the ocean, Nat. Geosci., 14, 423–428, https://doi.org/10.1038/s41561-021-00743-y, 2021.
Sulpis, O., Agrawal, P., Wolthers, M., Munhoven, G., Walker, M., and Middelburg, J. J.: Aragonite dissolution protects calcite at the seafloor, Nat. Commun., 13, 1–8, https://doi.org/10.1038/s41467-022-28711-z, 2022.
Torres, M. E., Hong, W. L., Solomon, E. A., Milliken, K., Kim, J. H., Sample, J. C., Teichert, B. M. A., and Wallmann, K.: Silicate weathering in anoxic marine sediment as a requirement for authigenic carbonate burial, Earth. Sci. Rev., 200, 102960, https://doi.org/10.1016/j.earscirev.2019.102960, 2020.
Tyka, M. D., Van Arsdale, C., and Platt, J. C.: CO2 capture by pumping surface acidity to the deep ocean, Energ. Environ. Sci., 15, 786–798, https://doi.org/10.1039/d1ee01532j, 2022.
Wallmann, K., Diesing, M., Scholz, F., Rehder, G., Dale, A. W., Fuhr, M., and Suess, E.: Erosion of carbonate-bearing sedimentary rocks may close the alkalinity budget of the Baltic Sea and support atmospheric CO2 uptake in coastal seas, Front. Mar. Sci., 9, 1–15, https://doi.org/10.3389/fmars.2022.968069, 2022.
Zhong, S. and Mucci, A.: Calcite and aragonite precipitation from seawater solutions of various salinities: Precipitation rates and overgrowth compositions, Chem. Geol., 78, 283–299, https://doi.org/10.1016/0009-2541(89)90064-8, 1989.